
Assessment of the Spatiotemporal Impact of Water Conservation on the Qinghai–Tibet Plateau

Abstract
:1. Introduction
2. Materials and Methods
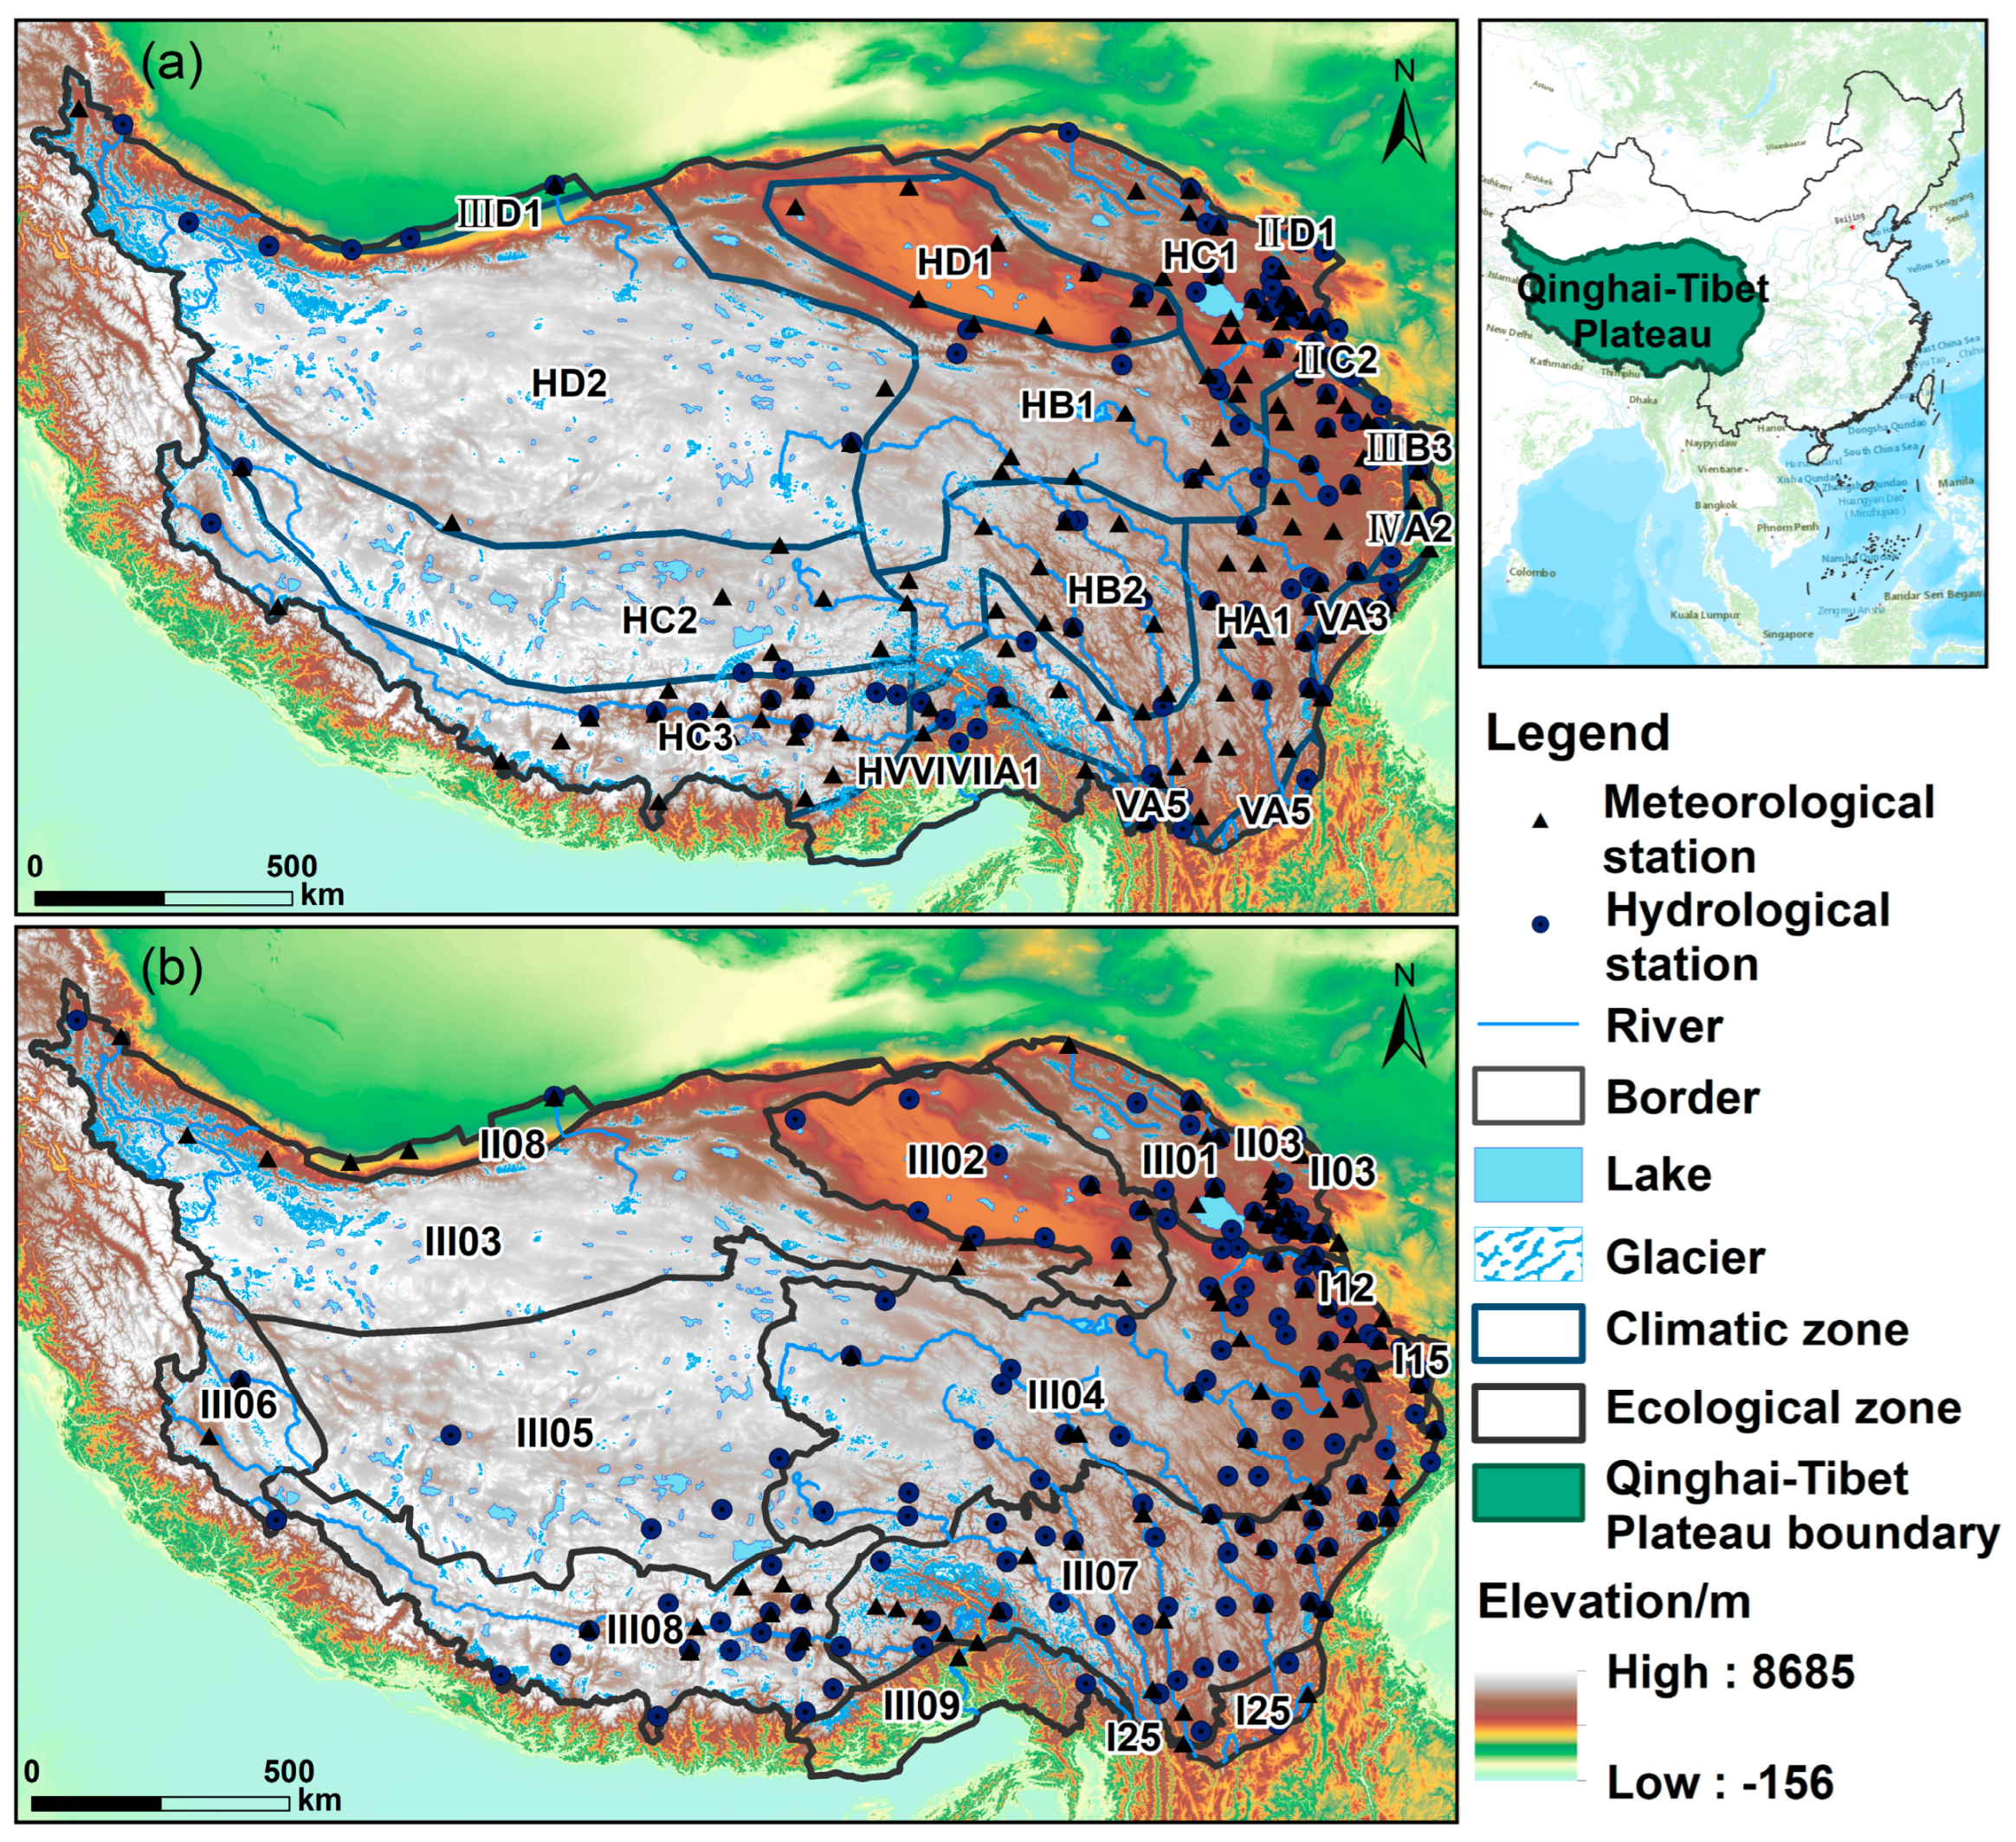
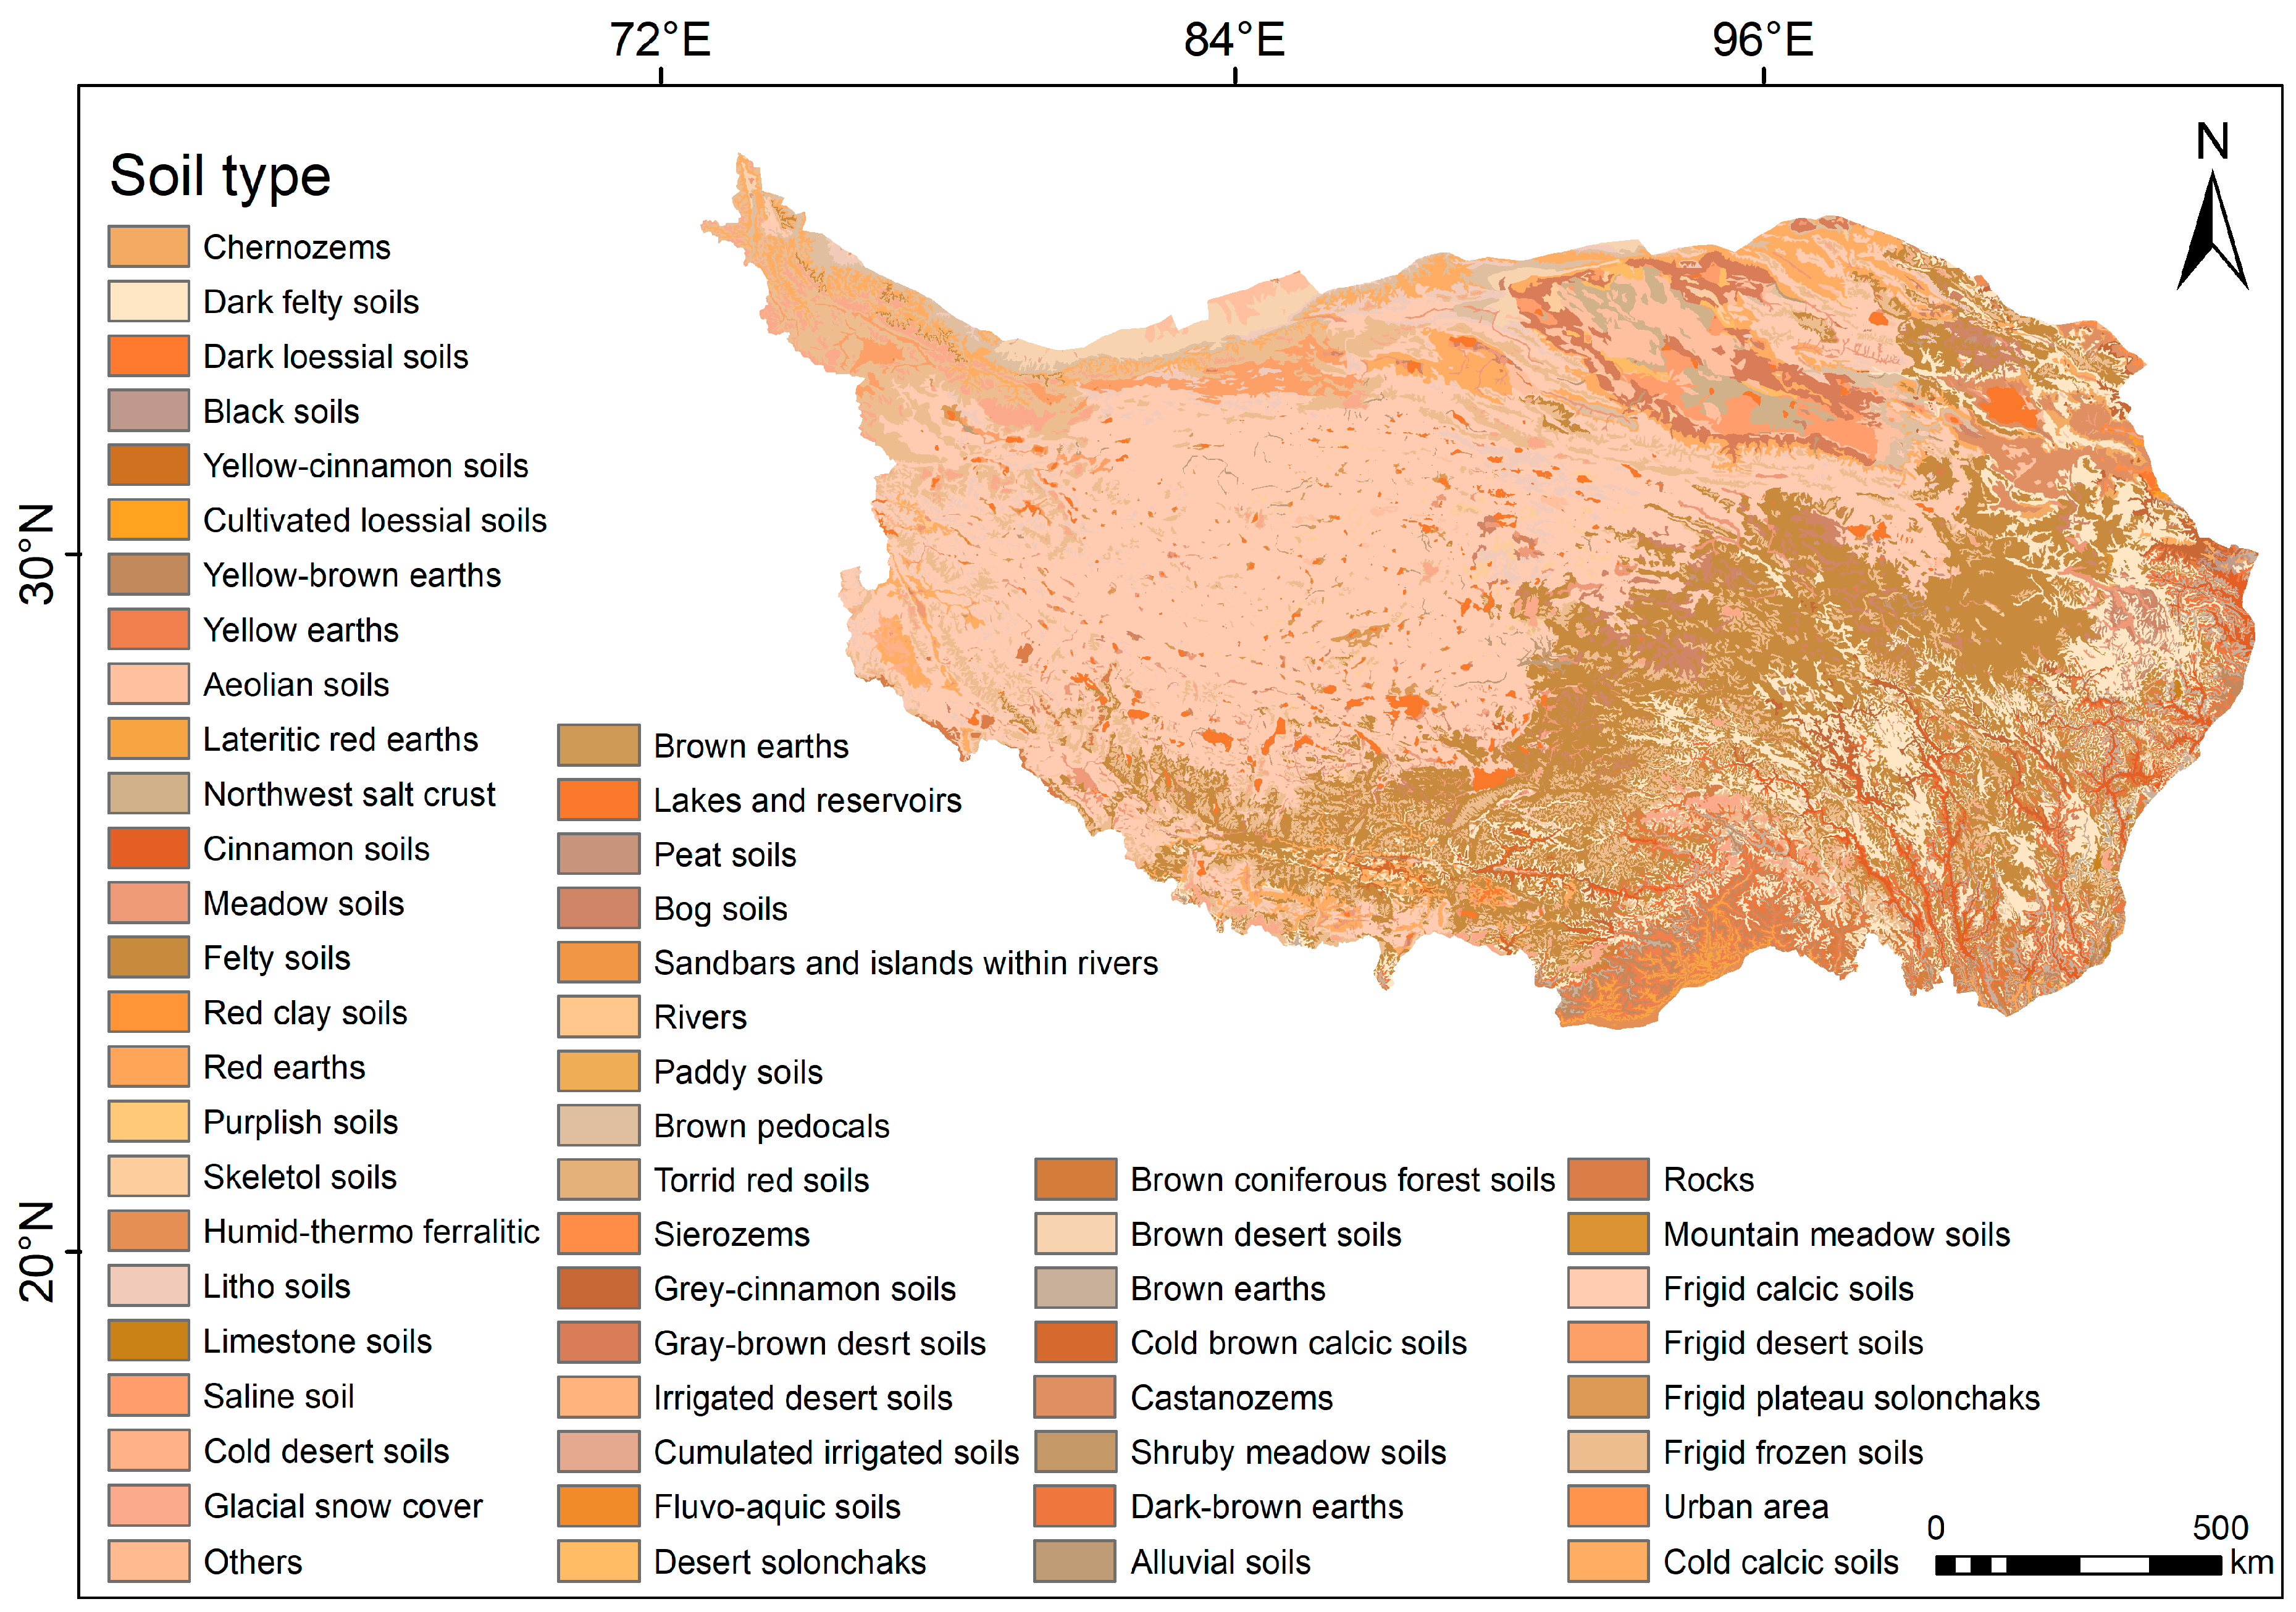
2.1. Study Area
2.2. Materials
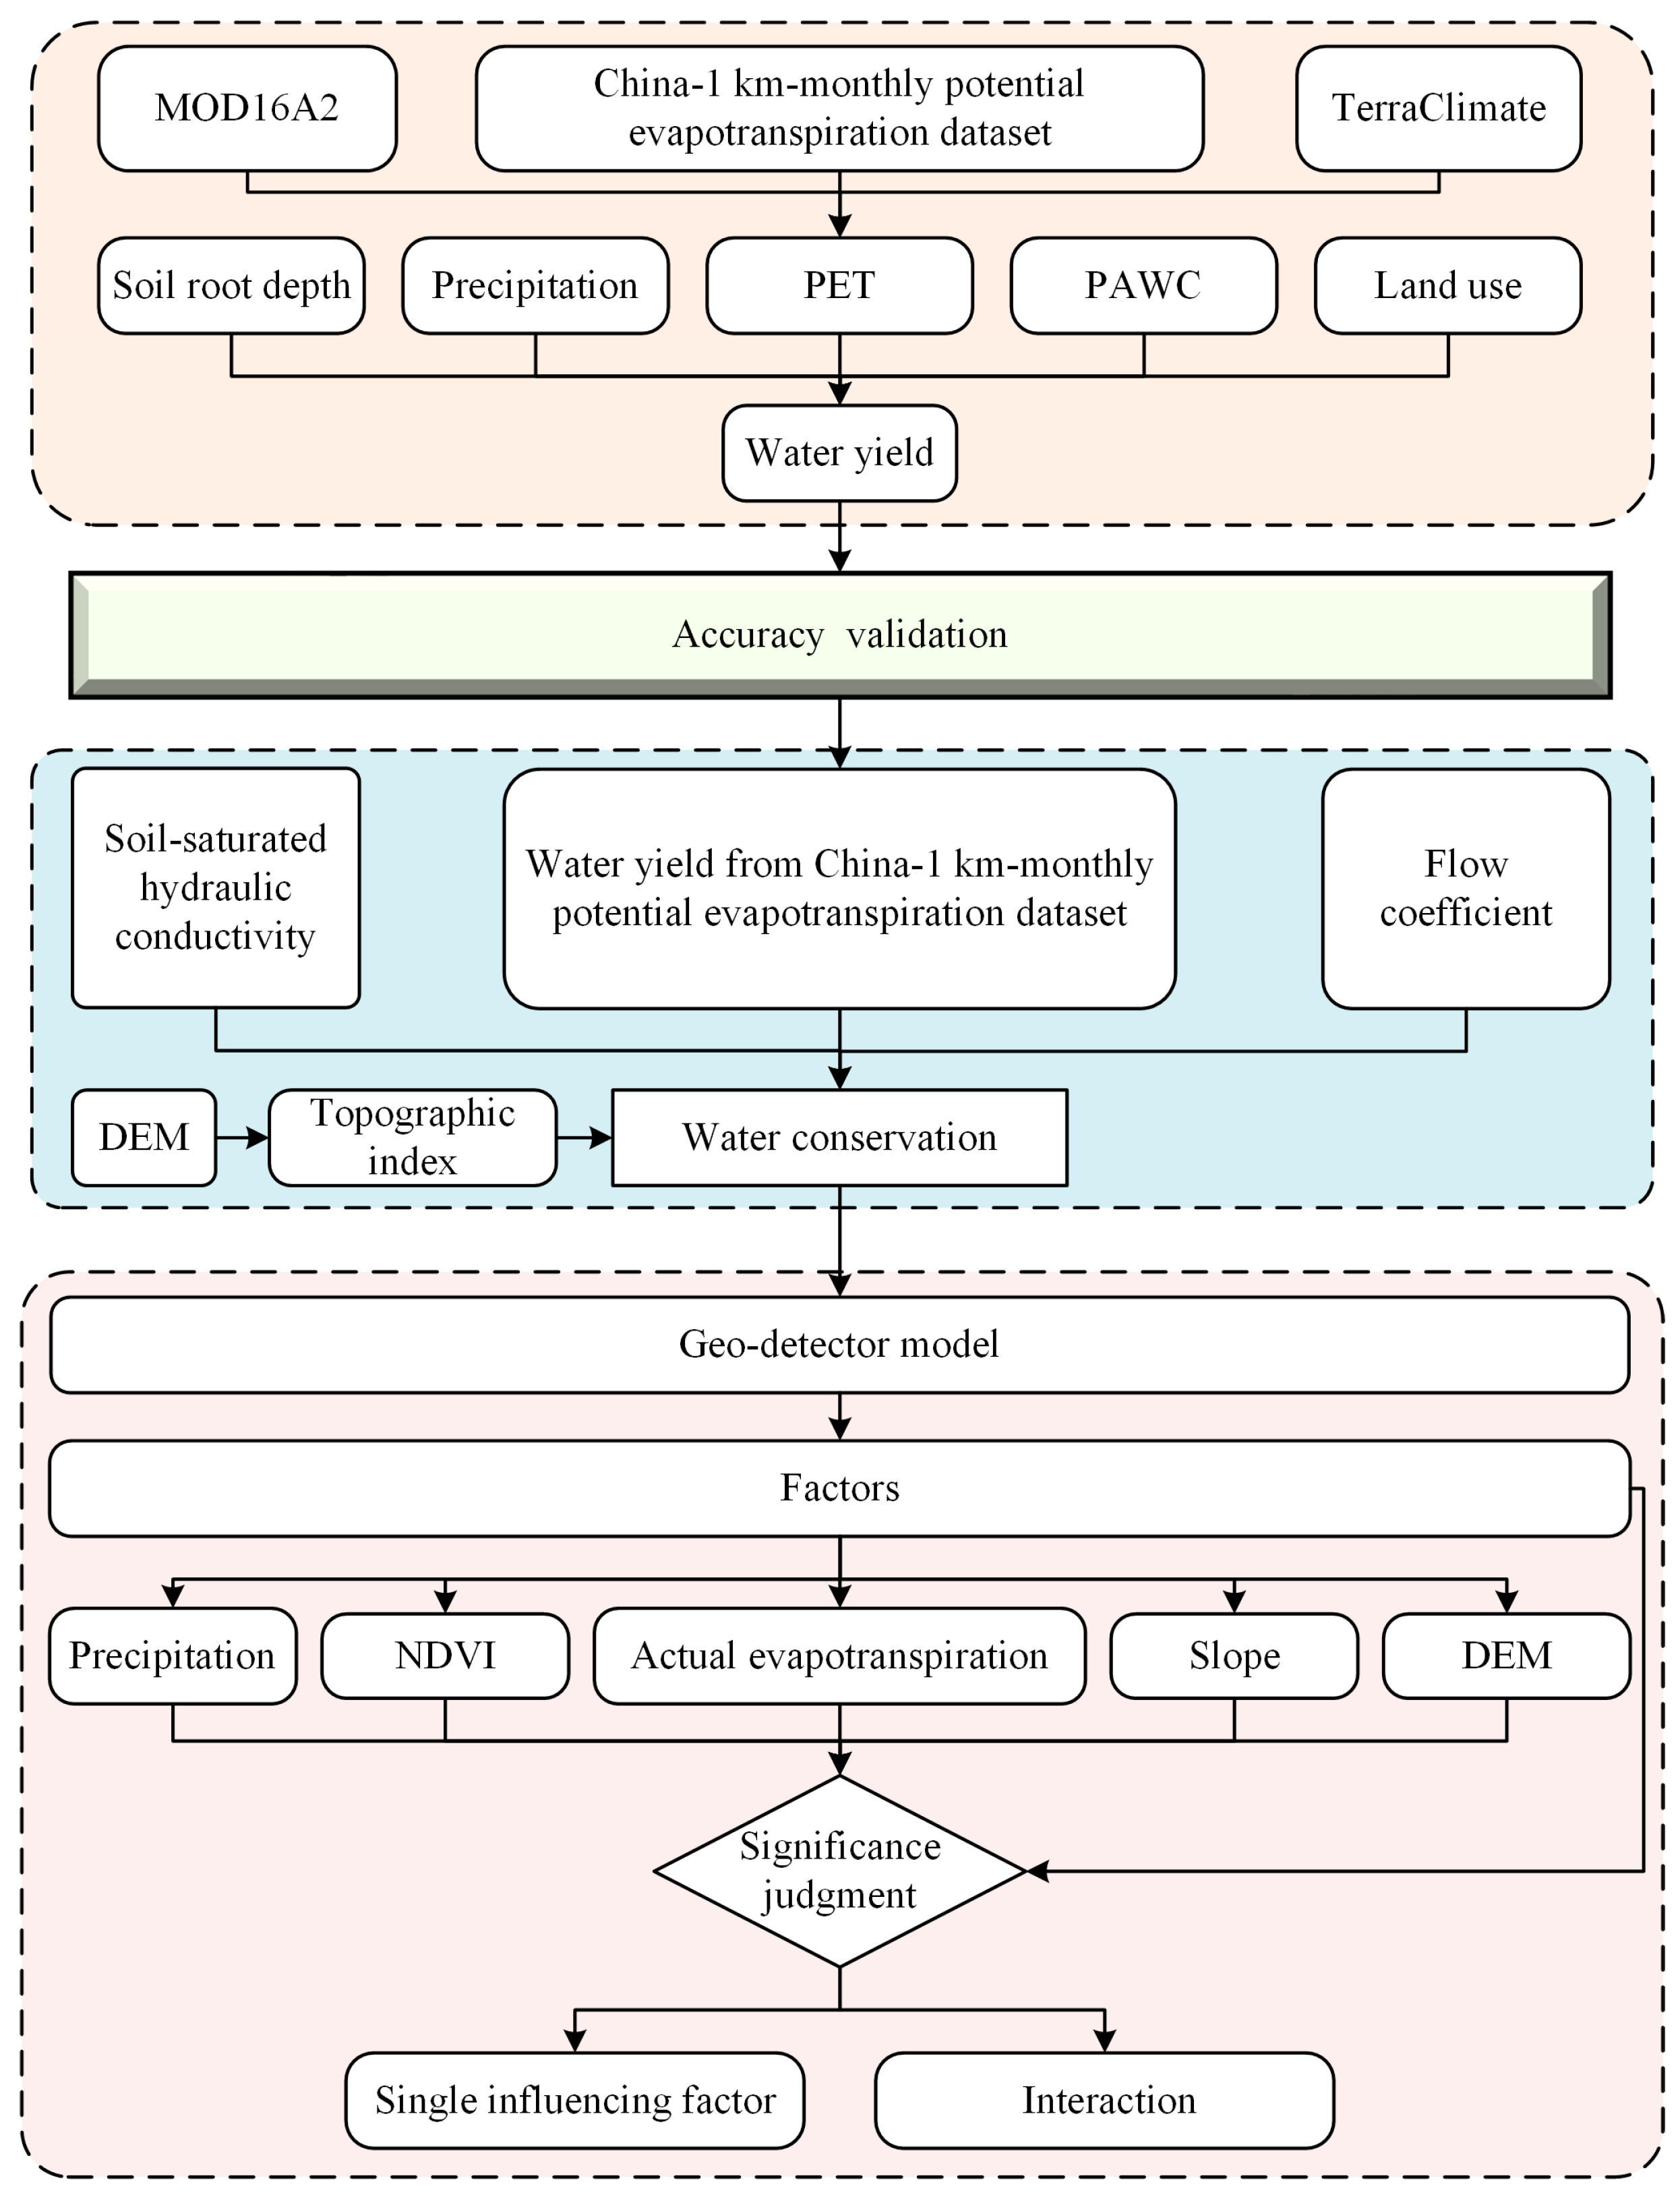
2.3. Methods
2.3.1. Water Yield
2.3.2. Calculation of Water Conservation
2.3.3. Geo-Detector Model and GWR
3. Results
3.1. Results Verification
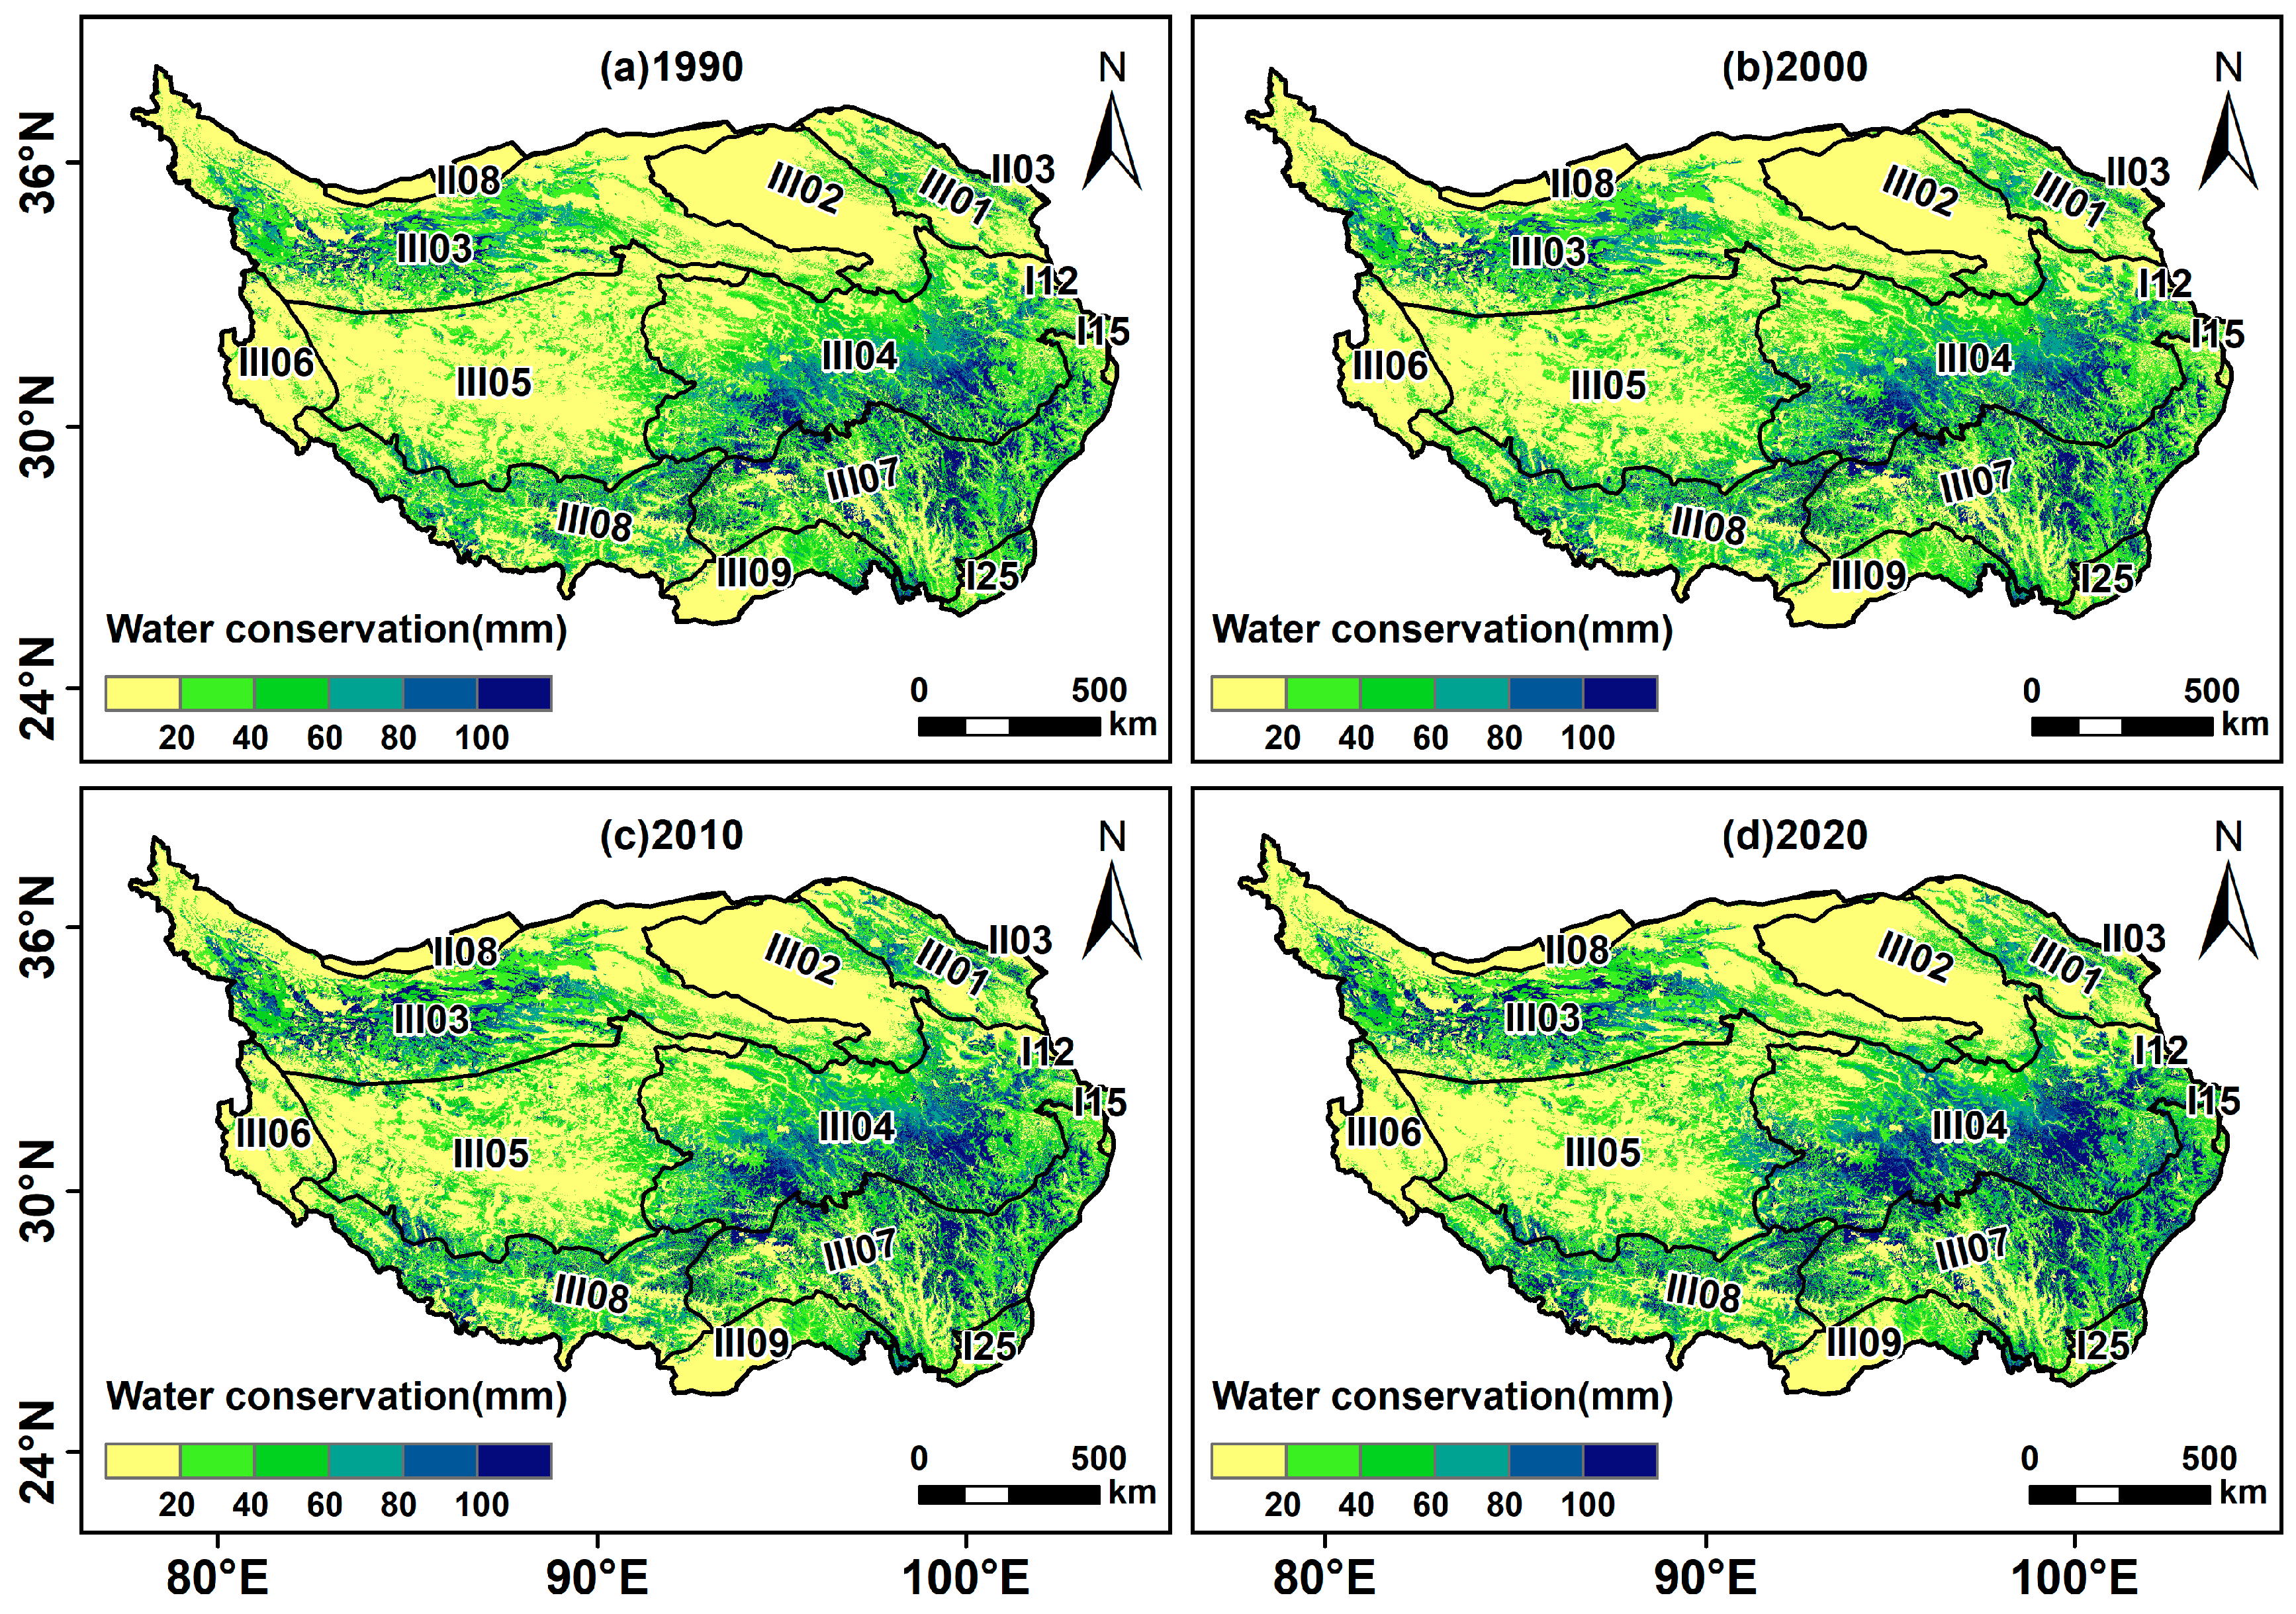
3.2. Spatiotemporal Variation
3.2.1. Spatial Distribution
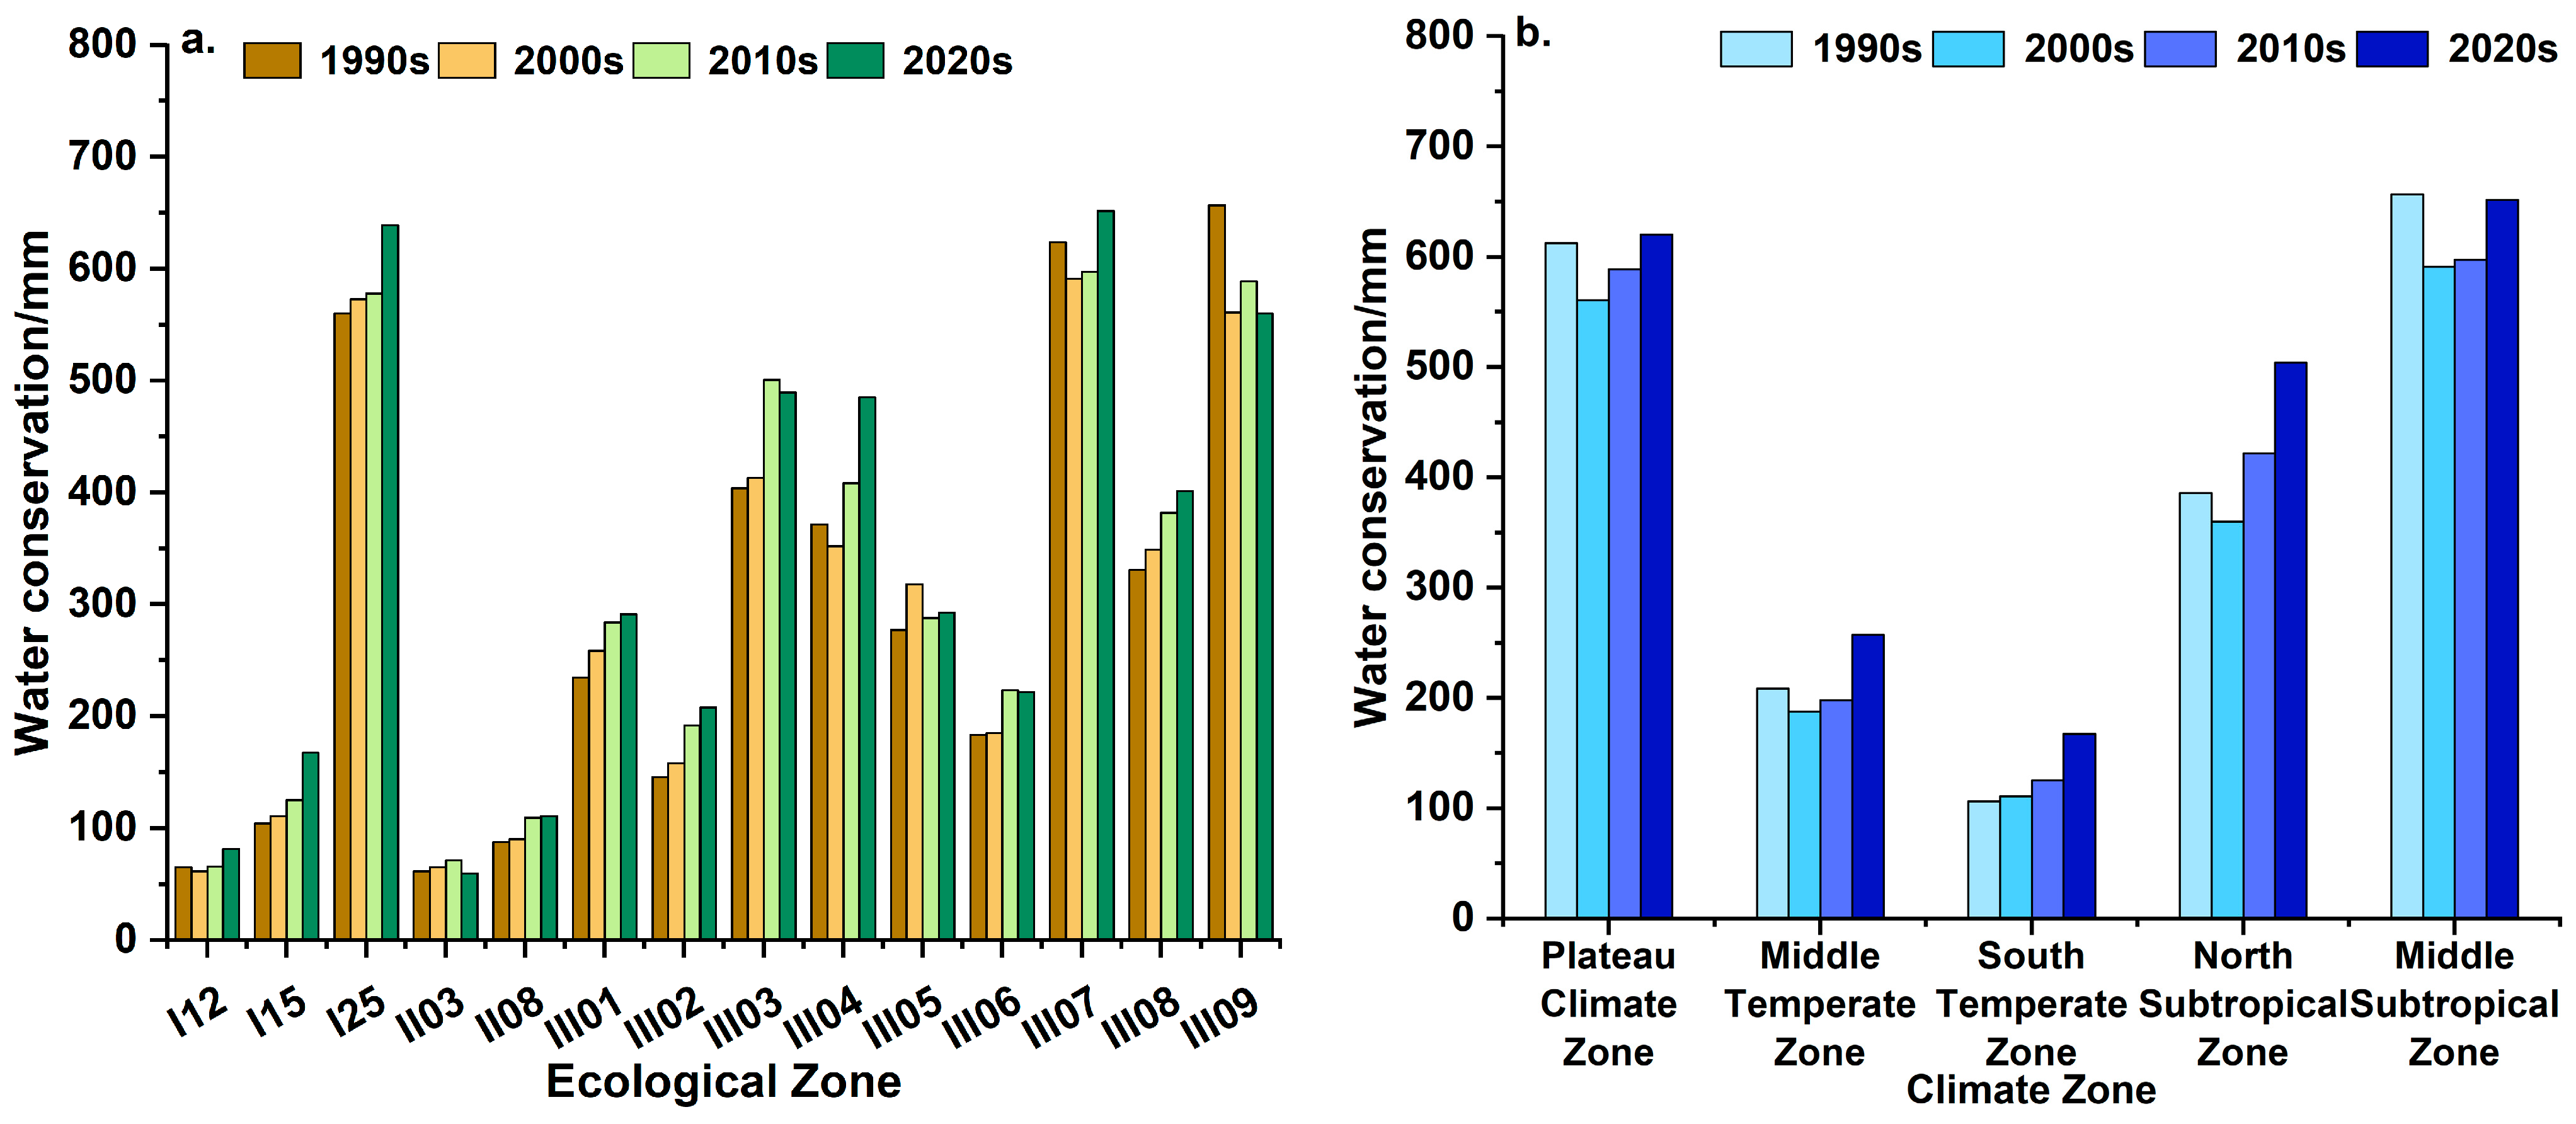
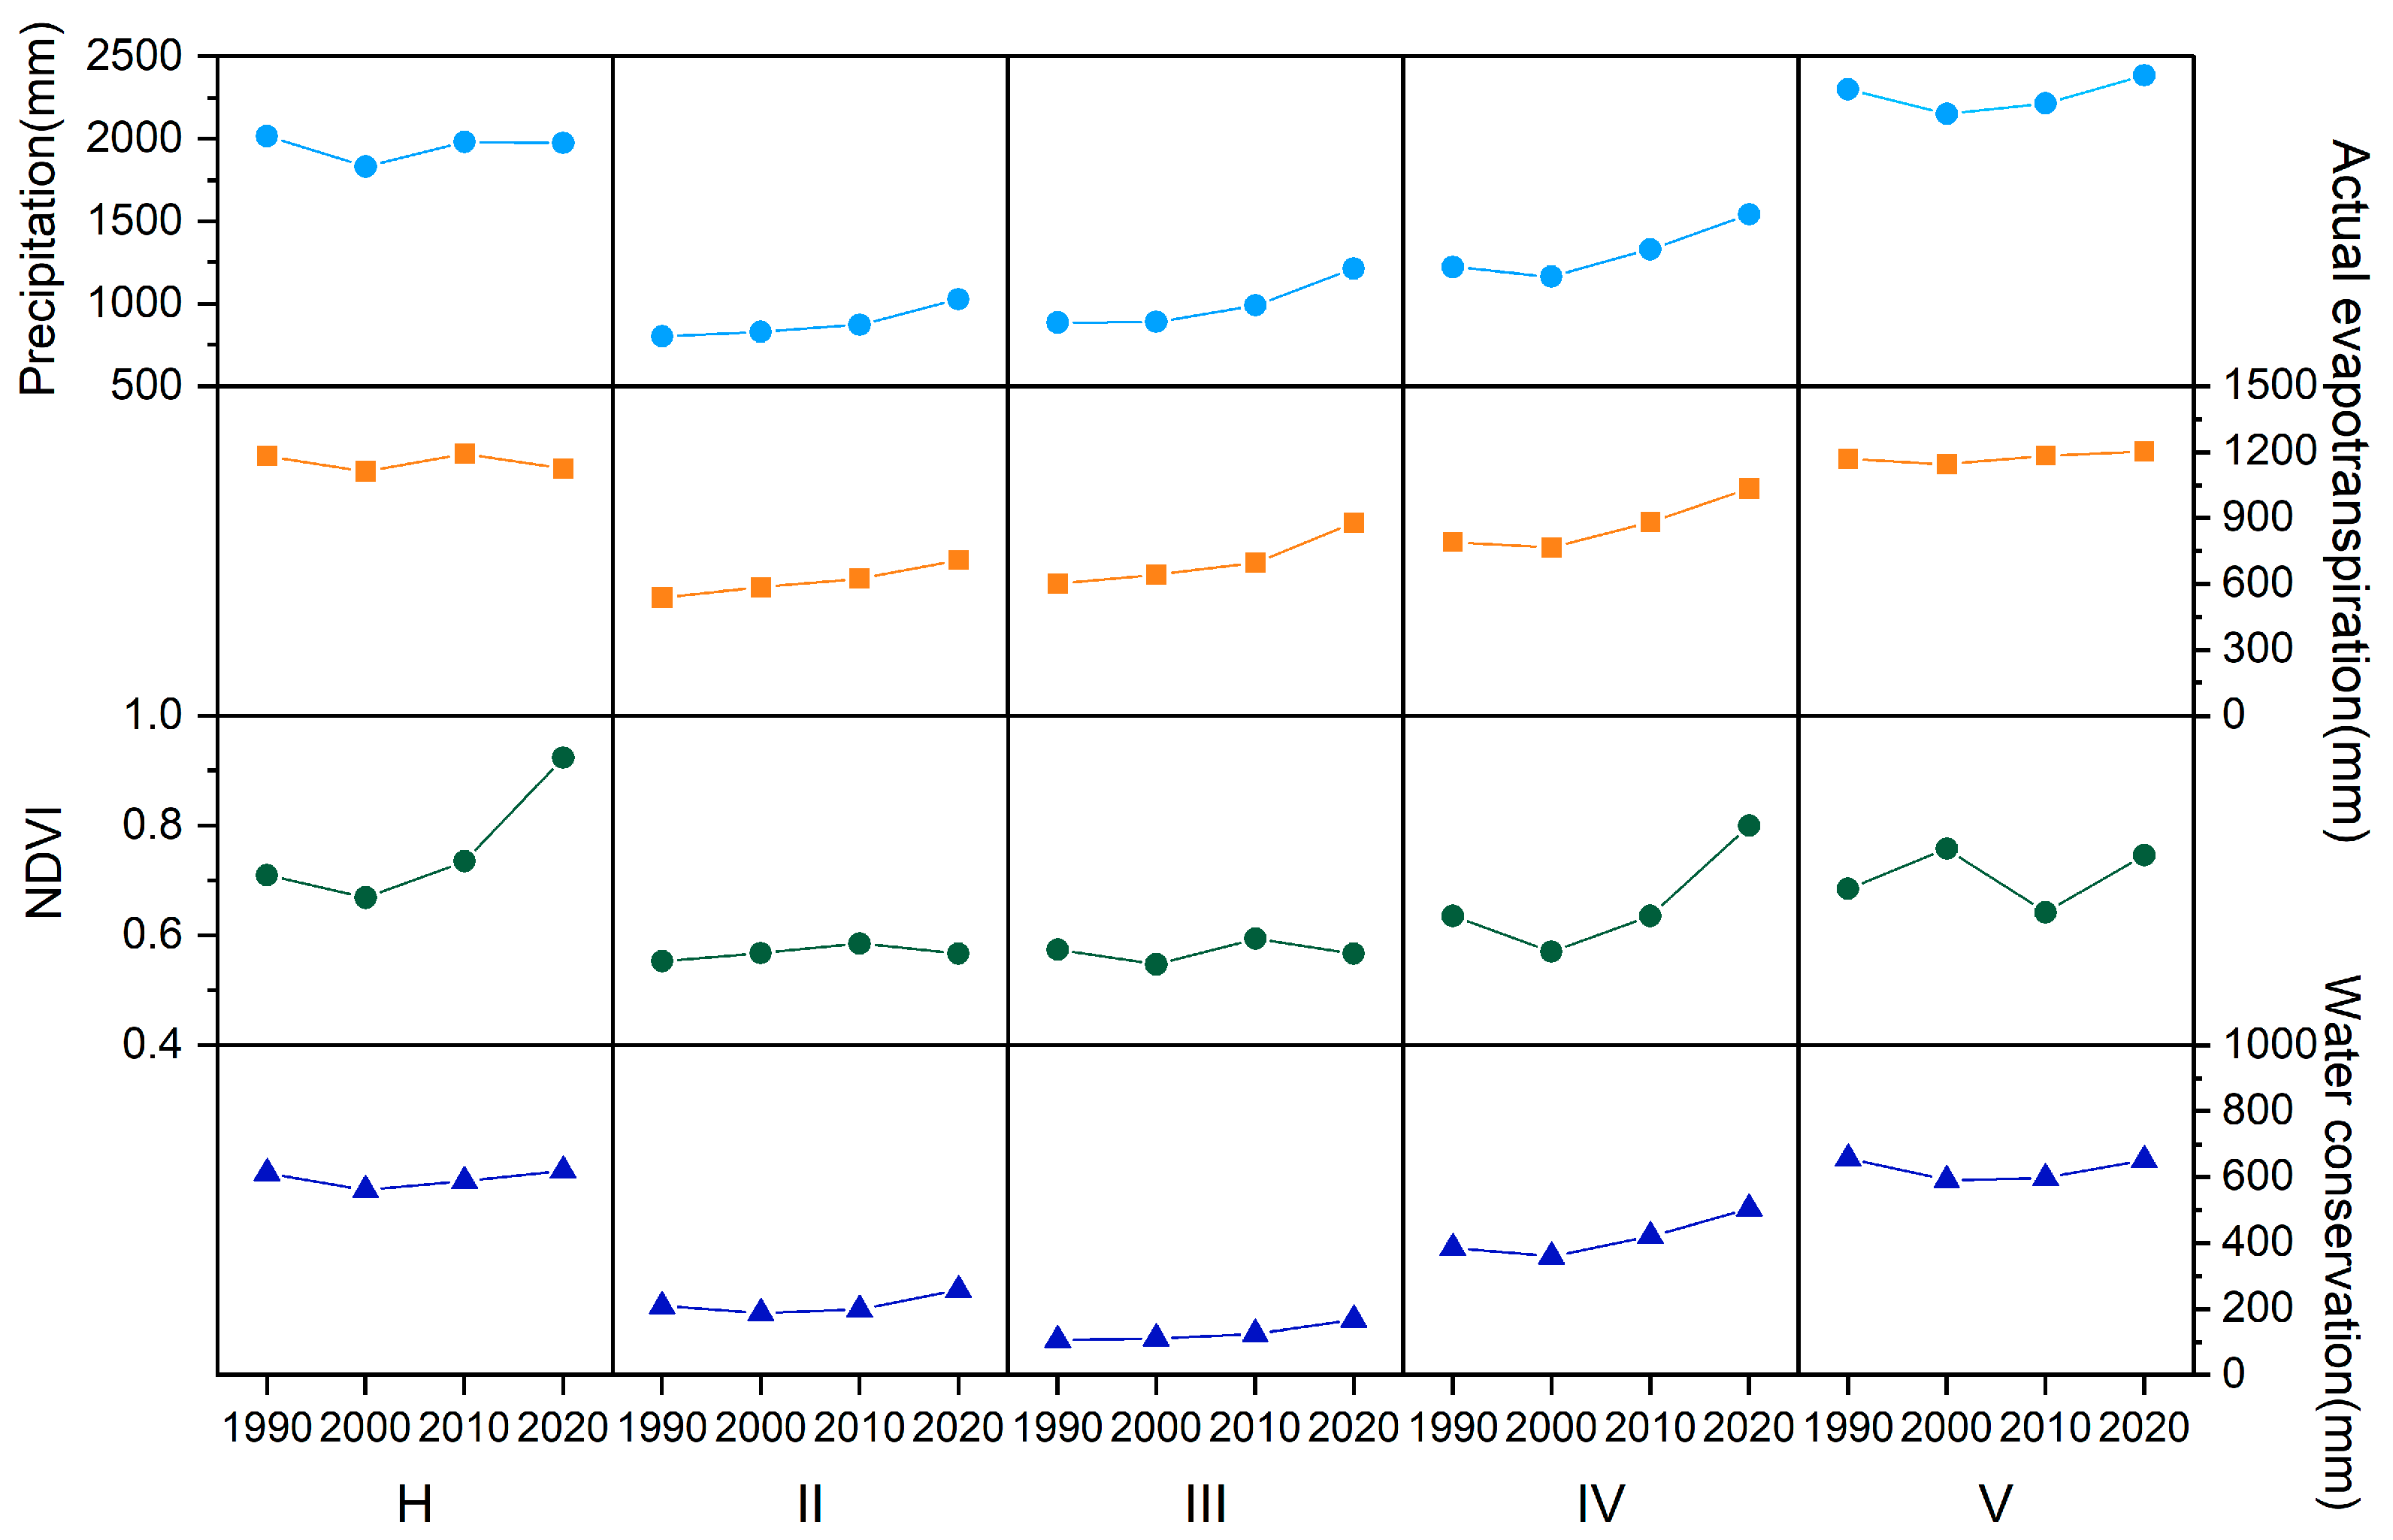
3.2.2. Interdecadal Variation
3.3. Influencing Factors
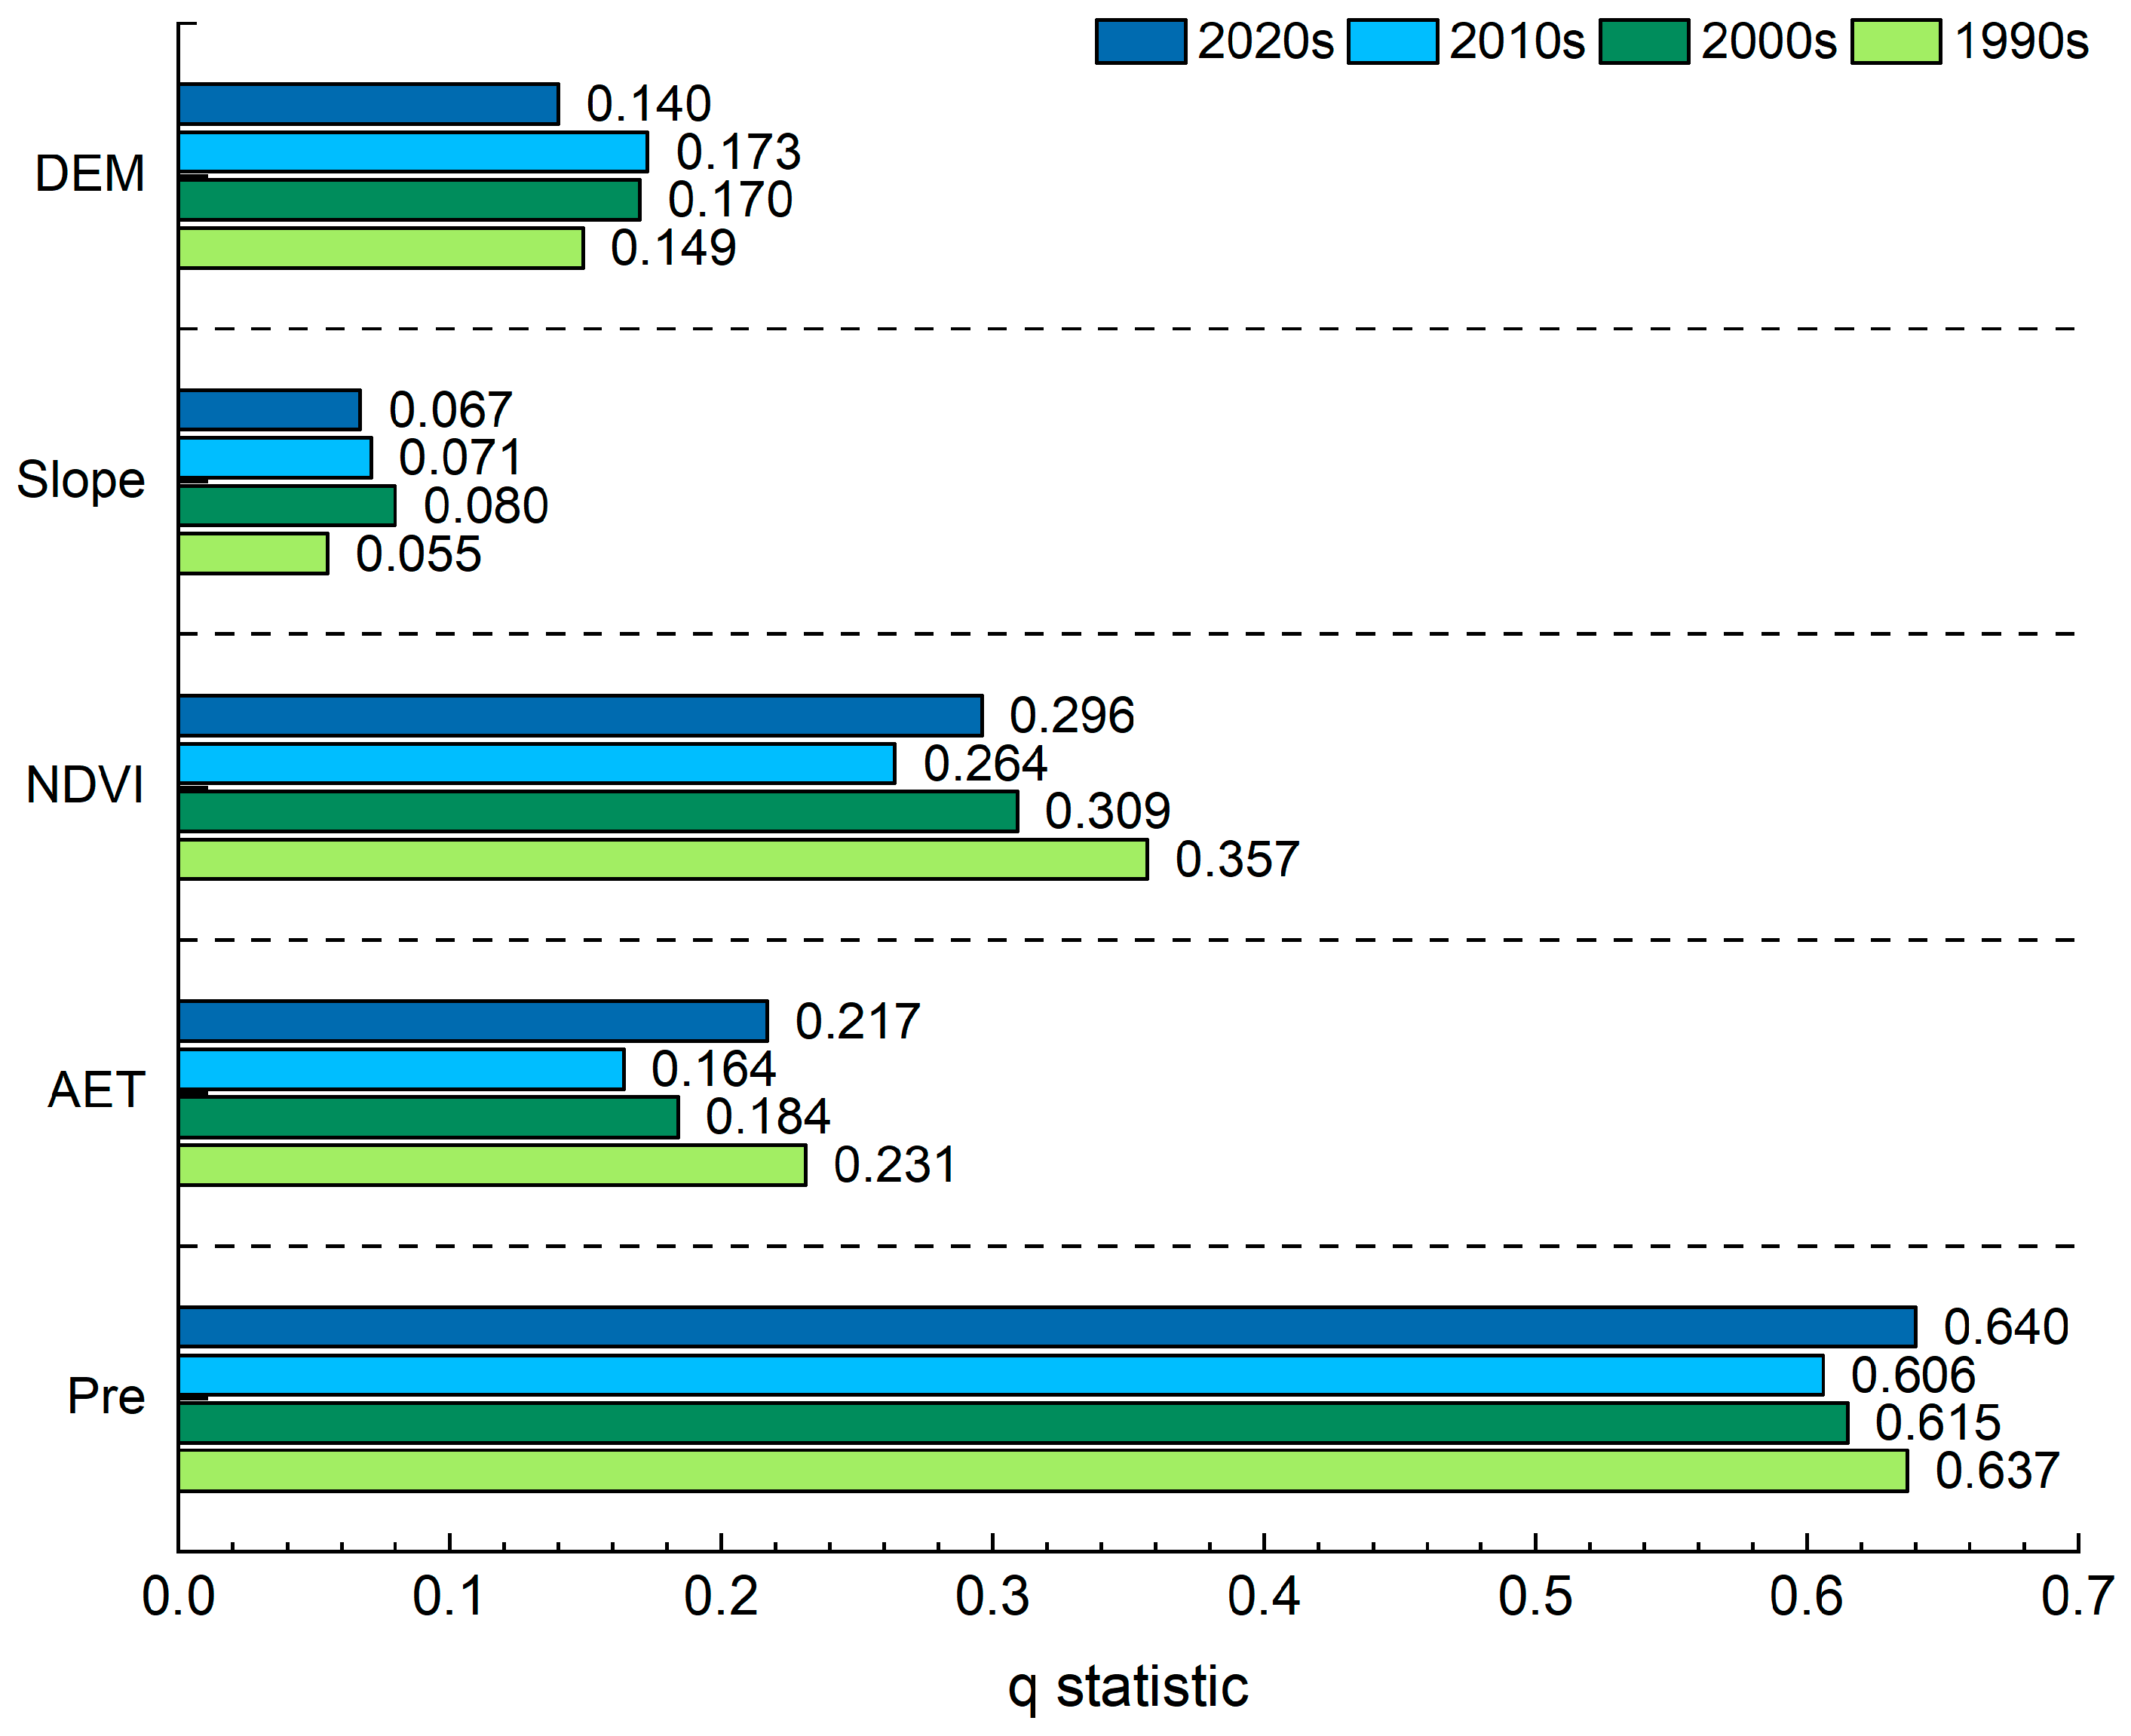
3.3.1. Single Influencing Factor
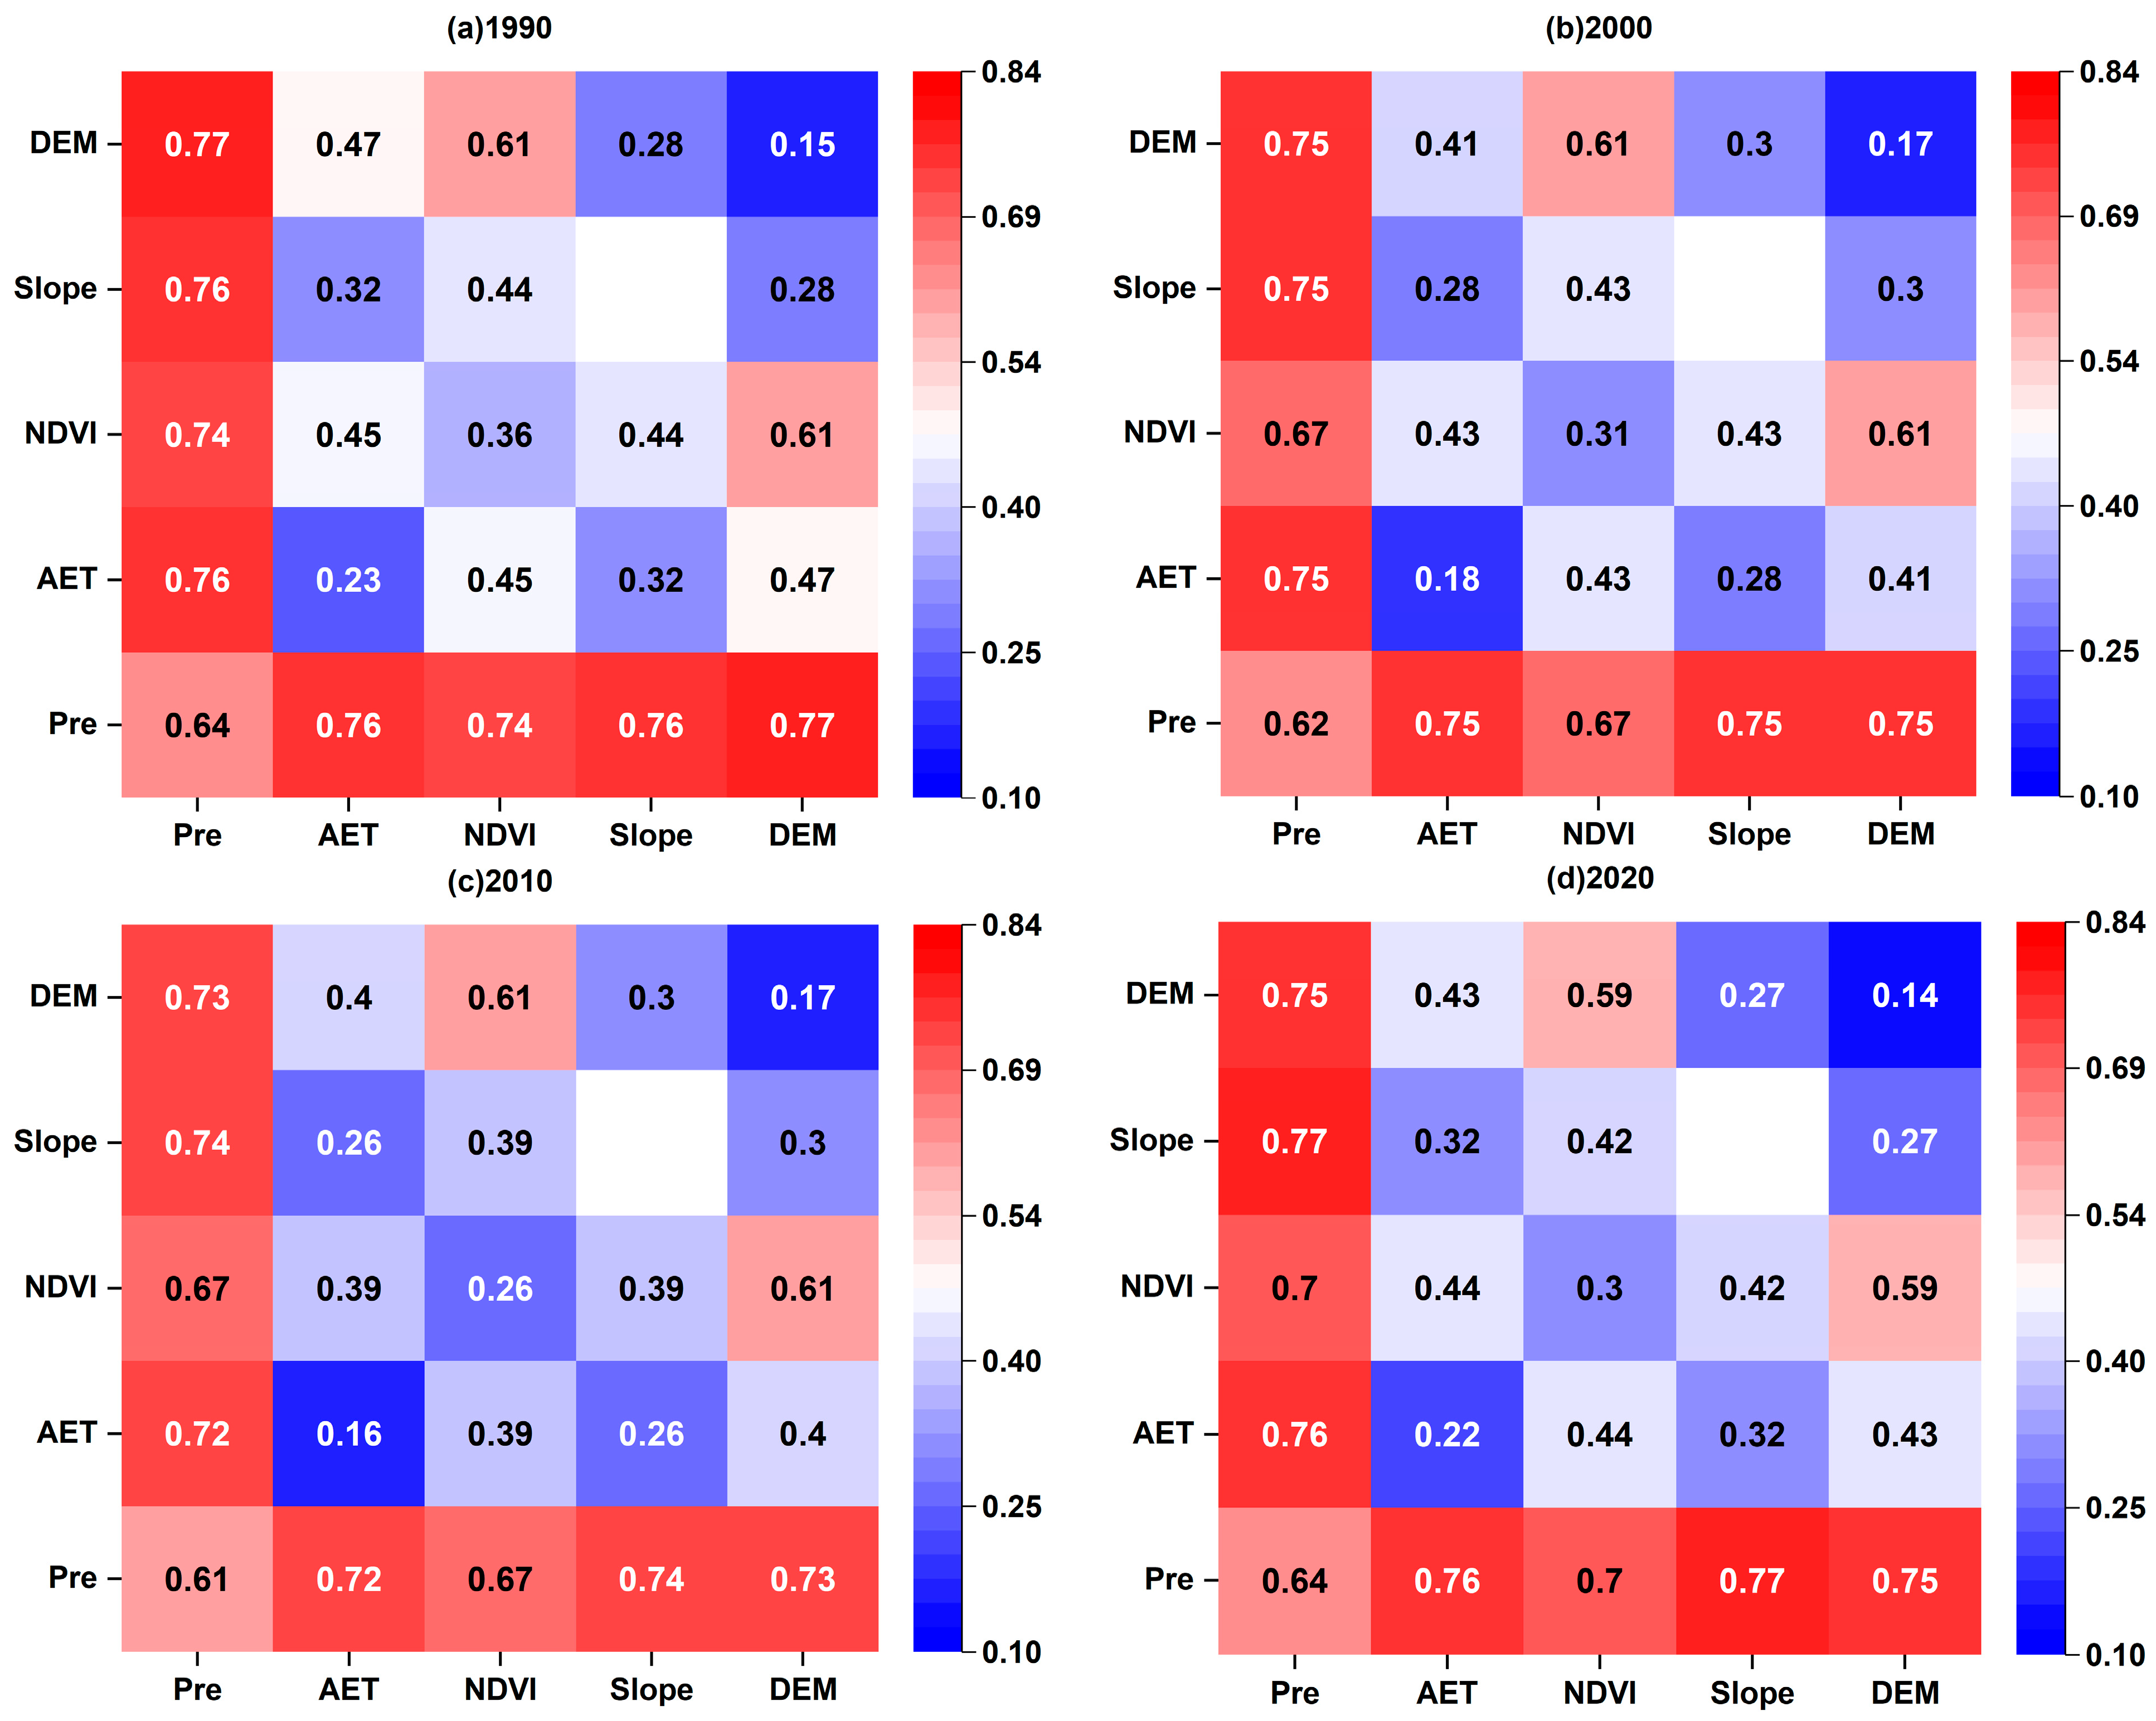
3.3.2. Interaction
4. Discussion
4.1. Comparison of Remote Sensing Evaporation Data
4.2. Influence of the Main Driving Forces on the Spatial Heterogeneity of Water Conservation
4.3. Limitations of the InVEST Model and Perspectives
5. Conclusions
Author Contributions
Funding
Data Availability Statement
Acknowledgments
Conflicts of Interest
References
- Costanza, R.; dArge, R.; deGroot, R.; Farber, S.; Grasso, M.; Hannon, B.; Limburg, K.; Naeem, S.; Oneill, R.V.; Paruelo, J.; et al. The value of the world’s ecosystem services and natural capital. Nature 1997, 387, 253–260. [Google Scholar] [CrossRef]
- Xue, J.; Li, Z.X.; Feng, Q.; Gui, J.; Zhang, B.J. Spatiotemporal variations of water conservation and its influencing factors in ecological barrier region, Qinghai-Tibet Plateau. J. Hydrol.-Reg. Stud. 2022, 42, 101164. [Google Scholar] [CrossRef]
- Zhang, Q.; Shen, Z.; Pokhrel, Y.; Farinotti, D.; Singh, V.P.; Xu, C.-Y.; Wu, W.; Wang, G. Oceanic climate changes threaten the sustainability of Asia’s water tower. Nature 2023, 615, 87–93. [Google Scholar] [CrossRef]
- Li, X.Y.; Long, D.; Scanlon, B.R.; Mann, M.E.; Li, X.D.; Tian, F.Q.; Sun, Z.L.; Wang, G.Q. Climate change threatens terrestrial water storage over the Tibetan Plateau. Nat. Clim. Chang. 2022, 12, 801–807. [Google Scholar] [CrossRef]
- Yao, T.D.; Thompson, L.; Yang, W.; Yu, W.S.; Gao, Y.; Guo, X.J.; Yang, X.X.; Duan, K.Q.; Zhao, H.B.; Xu, B.Q.; et al. Different glacier status with atmospheric circulations in Tibetan Plateau and surroundings. Nat. Clim. Chang. 2012, 2, 663–667. [Google Scholar] [CrossRef]
- Georgescu, M.; Lobell, D.B. Perennial Questions of Hydrology and Climate. Science 2010, 330, 33. [Google Scholar] [CrossRef]
- Immerzeel, W.W.; Lutz, A.F.; Andrade, M.; Bahl, A.; Biemans, H.; Bolch, T.; Hyde, S.; Brumby, S.; Davies, B.J.; Elmore, A.C.; et al. Importance and vulnerability of the world’s water towers. Nature 2020, 577, 364–369. [Google Scholar] [CrossRef]
- Li, Z.W.; Wang, Z.Y.; Brierley, G.; Nicoll, T.; Pan, B.Z.; Li, Y.F. Shrinkage of the Ruoergai Swamp and changes to landscape connectivity, Qinghai-Tibet Plateau. Catena 2015, 126, 155–163. [Google Scholar] [CrossRef]
- Nazareno, A.G.; Laurance, W.F. Brazil’s drought: Beware deforestation. Science 2015, 347, 1427. [Google Scholar] [CrossRef]
- Shi, Y.N.; Song, J.X.; Zhang, J.L.; Huang, P.; Sun, H.T.; Wu, Q.; Cheng, L.; Zhang, J.X.; Xing, L.T.; Lyu, S.X.; et al. Hydrological response to climate change and human activities in the Bahe River, China. J. Hydrol. 2023, 617, 128762. [Google Scholar] [CrossRef]
- Yuan, W.; Liu, Q.; Song, S.; Lu, Y.L.; Yang, S.J.; Fang, Z.L.; Shi, Z. A climate-water quality assessment framework for quantifying the contributions of climate change and human activities to water quality variations. J. Environ. Manag. 2023, 333, 117441. [Google Scholar] [CrossRef] [PubMed]
- Cao, S.X.; Wang, G.S.; Chen, L. Assessing effects of afforestation projects in China Reply. Nature 2010, 466, 315. [Google Scholar] [CrossRef] [Green Version]
- He, J.; Shi, X.Y. Detection of social-ecological drivers and impact thresholds of ecological degradation and ecological restoration in the last three decades. J. Environ. Manag. 2022, 318, 115513. [Google Scholar] [CrossRef]
- Luo, K.S. Response of hydrological systems to the intensity of ecological engineering. J. Environ. Manag. 2021, 296, 113173. [Google Scholar] [CrossRef] [PubMed]
- Ouyang, Z.; Zheng, H.; Xiao, Y.; Polasky, S.; Liu, J.; Xu, W.; Wang, Q.; Zhang, L.; Xiao, Y.; Rao, E.M.; et al. Improvements in ecosystem services from investments in natural capital. Science 2016, 352, 1455–1459. [Google Scholar] [CrossRef]
- Huang, C.; Chen, J.; Huang, W.; Sun, C.; Guo, X. Analysis of water and sediment reducing effects of water conservation measures in the upstream of the Weihe River. J. Glaciol. Geocryol. 2020, 42, 965–973. [Google Scholar]
- Si, J.; Han, P.; Zhao, C. Review of Water Conservation Value Evaluation Methods of Forest and Case Study. J. Nat. Resour. 2011, 26, 2100–2109. [Google Scholar]
- Li, J.; Shao, Q.; Liu, J. Forest Conservation Estimation Based on the Integrated Storage Capacity MethodA Case Study of Xingguo County in Jiangxi. J. Northwest For. Coll. 2012, 27, 83–87. [Google Scholar]
- Qiu, W.; Zhang, Y.; Yu, J.; Zhang, C.; Zheng, C.; Yu, S. Feasibility verification with field application of a water conservation module using the InVEST Model. J. Zhejiang AF Univ. 2018, 35, 810–817. [Google Scholar]
- Biao, Z.; Wen-hua, L.I.; Gao-di, X.I.E.; Yu, X. Water conservation function and its measurement methods of forest ecosystem. Chin. J. Ecol. 2009, 28, 529–534. [Google Scholar]
- Zhao, J.; Mu, X.M.; Gao, P. Dynamic response of runoff to soil and water conservation measures and precipitation based on VAR model. Hydrol. Res. 2019, 50, 837–848. [Google Scholar] [CrossRef]
- Song, X.M.; Zhang, J.Y.; Zhan, C.S.; Xuan, Y.Q.; Ye, M.; Xu, C.G. Global sensitivity analysis in hydrological modeling: Review of concepts, methods, theoretical framework, and applications. J. Hydrol. 2015, 523, 739–757. [Google Scholar] [CrossRef] [Green Version]
- Zhang, M.F.; Liu, N.; Harper, R.; Li, Q.; Liu, K.; Wei, X.H.; Ning, D.Y.; Hou, Y.P.; Liu, S.R. A global review on hydrological responses to forest change across multiple spatial scales: Importance of scale, climate, forest type and hydrological regime. J. Hydrol. 2017, 546, 44–59. [Google Scholar] [CrossRef] [Green Version]
- Francesconi, W.; Srinivasan, R.; Perez-Minana, E.; Willcock, S.P.; Quintero, M. Using the Soil and Water Assessment Tool (SWAT) to model ecosystem services: A systematic review. J. Hydrol. 2016, 535, 625–636. [Google Scholar] [CrossRef]
- Govind, A.; Chen, J.M.; Margolis, H.; Ju, W.M.; Sonnentag, O.; Giasson, M.A. A spatially explicit hydro-ecological modeling framework (BEPS-TerrainLab V2.0): Model description and test in a boreal ecosystem in Eastern North America. J. Hydrol. 2009, 367, 200–216. [Google Scholar] [CrossRef]
- Liu, Q.; McVicar, T.R.; Yang, Z.F.; Donohue, R.J.; Liang, L.Q.; Yang, Y.T. The hydrological effects of varying vegetation characteristics in a temperate water-limited basin: Development of the dynamic Budyko-Choudhury-Porporato (dBCP) model. J. Hydrol. 2016, 543, 595–611. [Google Scholar] [CrossRef]
- Nelson, E.; Mendoza, G.; Regetz, J.; Polasky, S.; Tallis, H.; Cameron, D.R.; Chan, K.M.A.; Daily, G.C.; Goldstein, J.; Kareiva, P.M.; et al. Modeling multiple ecosystem services, biodiversity conservation, commodity production, and tradeoffs at landscape scales. Front. Ecol. Environ. 2009, 7, 4–11. [Google Scholar] [CrossRef]
- Hickel, K.; Zhang, L. Estimating the impact of rainfall seasonality on mean annual water balance using a top-down approach. J. Hydrol. 2006, 331, 409–424. [Google Scholar] [CrossRef]
- Chen, B.X.; Zhang, X.Z.; Tao, J.; Wu, J.S.; Wang, J.S.; Shi, P.L.; Zhang, Y.J.; Yu, C.Q. The impact of climate change and anthropogenic activities on alpine grassland over the Qinghai-Tibet Plateau. Agric. For. Meteorol. 2014, 189, 11–18. [Google Scholar] [CrossRef]
- Hamel, P.; Guswa, A.J. Uncertainty analysis of a spatially explicit annual water-balance model: Case study of the Cape Fear basin, North Carolina. Hydrol. Earth Syst. Sci. 2015, 19, 839–853. [Google Scholar] [CrossRef] [Green Version]
- Li, M.Y.; Liang, D.; Xia, J.; Song, J.X.; Cheng, D.D.; Wu, J.T.; Cao, Y.L.; Sun, H.T.; Li, Q. Evaluation of water conservation function of Danjiang River Basin in Qinling Mountains, China based on InVEST model. J. Environ. Manag. 2021, 286, 112212. [Google Scholar] [CrossRef] [PubMed]
- Wang, Y.F.; Ye, A.Z.; Peng, D.Z.; Miao, C.Y.; Di, Z.H.; Gong, W. Spatiotemporal variations in water conservation function of the Tibetan Plateau under climate change based on InVEST model. J. Hydrol.-Reg. Stud. 2022, 41, 101064. [Google Scholar] [CrossRef]
- Li, Y.; Li, J.J.; Are, K.S.; Huang, Z.G.; Yu, H.Q.; Zhang, Q.W. Livestock grazing significantly accelerates soil erosion more than climate change in Qinghai-Tibet Plateau: Evidenced from Cs-137 and (210)Pbex measurements. Agric. Ecosyst. Environ. 2019, 285, 106643. [Google Scholar] [CrossRef]
- Miehe, G.; Schleuss, P.M.; Seeber, E.; Babel, W.; Biermann, T.; Braendle, M.; Chen, F.H.; Coners, H.; Foken, T.; Gerken, T.; et al. The Kobresia pygmaea ecosystem of the Tibetan highlands-Origin, functioning and degradation of the world’s largest pastoral alpine ecosystem Kobresia pastures of Tibet. Sci. Total Environ. 2019, 648, 754–771. [Google Scholar] [CrossRef] [PubMed]
- Wu, J.S.; Feng, Y.F.; Zhang, X.Z.; Wurst, S.; Tietjen, B.; Tarolli, P.; Song, C.Q. Grazing exclusion by fencing non-linearly restored the degraded alpine grasslands on the Tibetan Plateau. Sci. Rep. 2017, 7, 9. [Google Scholar] [CrossRef] [Green Version]
- Qiu, J. Double threat for Tibet. Nature 2014, 512, 240–241. [Google Scholar] [CrossRef] [Green Version]
- Wang, T.; Zhao, Y.T.; Xu, C.Y.; Ciais, P.; Liu, D.; Yang, H.; Piao, S.L.; Yao, T.D. Atmospheric dynamic constraints on Tibetan Plateau freshwater under Paris climate targets. Nat. Clim. Chang. 2021, 11, 219–225. [Google Scholar] [CrossRef]
- Ma, S.; Wang, L.J.; Jiang, J.; Chu, L.; Zhang, J.C. Threshold effect of ecosystem services in response to climate change and vegetation coverage change in the Qinghai-Tibet Plateau ecological shelter. J. Clean Prod. 2021, 318, 128592. [Google Scholar] [CrossRef]
- Wang, Y.F.; Lv, W.W.; Xue, K.; Wang, S.P.; Zhang, L.R.; Hu, R.H.; Zeng, H.; Xu, X.L.; Li, Y.M.; Jiang, L.L.; et al. Grassland changes and adaptive management on the Qinghai-Tibetan Plateau. Nat. Rev. Earth Environ. 2022, 3, 668–683. [Google Scholar] [CrossRef]
- Shen, M.G.; Wang, S.P.; Jiang, N.; Sun, J.P.; Cao, R.Y.; Ling, X.F.; Fang, B.; Zhang, L.; Zhang, L.H.; Xu, X.Y.; et al. Plant phenology changes and drivers on the Qinghai-Tibetan Plateau. Nat. Rev. Earth Environ. 2022, 3, 633–651. [Google Scholar] [CrossRef]
- Wen, X.; Theau, J. Spatiotemporal analysis of water-related ecosystem services under ecological restoration scenarios: A case study in northern Shaanxi, China. Sci. Total Environ. 2020, 720, 137477. [Google Scholar] [CrossRef] [PubMed]
- Gan, G.J.; Liu, Y.B.; Sun, G. Understanding interactions among climate, water, and vegetation with the Budyko framework. Earth-Sci. Rev. 2021, 212, 103451. [Google Scholar] [CrossRef]
- Satalova, B.; Kenderessy, P. Assessment of water retention function as tool to improve integrated watershed management (case study of Poprad river basin, Slovakia). Sci. Total Environ. 2017, 599, 1082–1089. [Google Scholar] [CrossRef]
- Chen, H.; Zhu, Q.A.; Peng, C.H.; Wu, N.; Wang, Y.F.; Fang, X.Q.; Gao, Y.H.; Zhu, D.; Yang, G.; Tian, J.Q.; et al. The impacts of climate change and human activities on biogeochemical cycles on the Qinghai-Tibetan Plateau. Glob. Chang. Biol. 2013, 19, 2940–2955. [Google Scholar] [CrossRef] [PubMed]
- Guo, D.L.; Wang, H.J. The significant climate warming in the northern Tibetan Plateau and its possible causes. Int. J. Climatol. 2012, 32, 1775–1781. [Google Scholar] [CrossRef]
- Wang, B.; Bao, Q.; Hoskins, B.; Wu, G.X.; Liu, Y.M. Tibetan plateau warming and precipitation changes in East Asia. Geophys. Res. Lett. 2008, 35, 5. [Google Scholar] [CrossRef] [Green Version]
- Kuang, X.X.; Jiao, J.J. Review on climate change on the Tibetan Plateau during the last half century. J. Geophys. Res.-Atmos. 2016, 121, 3979–4007. [Google Scholar] [CrossRef] [Green Version]
- Xie, H.; Zhu, X. Reference evapotranspiration trends and their sensitivity to climatic change on the Tibetan Plateau (1970–2009). Hydrol. Process. 2013, 27, 3685–3693. [Google Scholar] [CrossRef]
- Li, X.P.; Wang, L.; Chen, D.L.; Yang, K.; Wang, A.H. Seasonal evapotranspiration changes (1983–2006) of four large basins on the Tibetan Plateau. J. Geophys. Res.-Atmos. 2014, 119, 13079–13095. [Google Scholar] [CrossRef]
- Yin, Y.H.; Wu, S.H.; Zhao, D.S.; Zheng, D.; Pan, T. Modeled effects of climate change on actual evapotranspiration in different eco-geographical regions in the Tibetan Plateau. J. Geogr. Sci. 2013, 23, 195–207. [Google Scholar] [CrossRef]
- Bing, L.F.; Shao, Q.Q.; Liu, J.Y. Runoff characteristics in flood and dry seasons based on wavelet analysis in the source regions of the Yangtze and Yellow rivers. J. Geogr. Sci. 2012, 22, 261–272. [Google Scholar] [CrossRef] [Green Version]
- Wang, X.F.; Ma, M.G.; Song, Y.; Tan, J.L.; Wang, H.B. Coupling of a biogeochemical model with a simultaneous heat and water model and its evaluation at an alpine meadow site. Environ. Earth Sci. 2014, 72, 4085–4096. [Google Scholar] [CrossRef]
- Arnold, J.G.; Moriasi, D.N.; Gassman, P.W.; Abbaspour, K.C.; White, M.J.; Srinivasan, R.; Santhi, C.; Harmel, R.D.; van Griensven, A.; Van Liew, M.W.; et al. Swat: Model Use, Calibration, and Validation. Trans. ASABE 2012, 55, 1491–1508. [Google Scholar] [CrossRef]
- Baker, T.J.; Miller, S.N. Using the Soil and Water Assessment Tool (SWAT) to assess land use impact on water resources in an East African watershed. J. Hydrol. 2013, 486, 100–111. [Google Scholar] [CrossRef]
- Benra, F.; De Frutos, A.; Gaglio, M.; Alvarez-Garreton, C.; Felipe-Lucia, M.; Bonn, A. Mapping water ecosystem services: Evaluating InVEST model predictions in data scarce regions. Environ. Modell. Softw. 2021, 138, 104982. [Google Scholar] [CrossRef]
- Donohue, R.J.; Roderick, M.L.; McVicar, T.R. Roots, storms and soil pores: Incorporating key ecohydrological processes into Budyko’s hydrological model. J. Hydrol. 2012, 436, 35–50. [Google Scholar] [CrossRef]
- Yang, D.; Liu, W.; Tang, L.Y.; Chen, L.; Li, X.Z.; Xu, X.L. Estimation of water provision service for monsoon catchments of South China: Applicability of the InVEST model. Landsc. Urban Plan. 2019, 182, 133–143. [Google Scholar] [CrossRef]
- Cheng, X.R.; Huang, M.B.; Si, B.C.; Yu, M.K.; Shao, M.A. The differences of water balance components of Caragana korshinkii grown in homogeneous and layered soils in the desert-Loess Plateau transition zone. J. Arid. Environ. 2013, 98, 10–19. [Google Scholar] [CrossRef]
- Jian, Z.; Genxu, W.; Xin, L.I.; Yongmin, Y.; Xiaoduo, P.A.N. Data Assimilation Algorithm Apply to Energy-Water Balance Analysis of the High Cold Ecosystem at Qinghai-Tibet Plain, Northwest China. Adv. Earth Sci. 2008, 23, 965–973. [Google Scholar]
- Shao, Q.Q.; Xiao, T.; Liu, J.Y.; Qi, Y.Q. Soil erosion rates and characteristics of typical alpine meadow using Cs-137 technique in Qinghai-Tibet Plateau. Chin. Sci. Bull. 2011, 56, 1708–1713. [Google Scholar] [CrossRef] [Green Version]
- Su, P.; Zhou, Z.; Shi, R.; Xie, T. Variation in basic properties and carbon sequestration capacity of an alpine sod layer along moisture and elevation gradients. Acta Ecol. Sin. 2018, 38, 1040–1052. [Google Scholar]
- Hu, X.; Li, X.Y.; Li, Z.C.; Gao, Z.; Wu, X.C.; Wang, P.; Lyu, Y.L.; Liu, L.Y. Linking 3-D soil macropores and root architecture to near saturated hydraulic conductivity of typical meadow soil types in the Qinghai Lake Watershed, northeastern Qinghai-Tibet Plateau. Catena 2020, 185, 104287. [Google Scholar] [CrossRef]
- Zi, H.; Ade, L.; Ma, L.; Hu, L.; Chen, Y.; Yang, Y.; Wang, C. Change of Ratio of Root to Soil and Soil Nutrient Content at Different Grassland Types in Alpine Meadow. Southwest China J. Agric. Sci. 2016, 29, 2916–2921. [Google Scholar]
- Cheng, H.; Cheng, Y.; Gong, Y.; Xiong, S.; Zhang, Y.; Liu, J.; Liu, L.; Wu, Q.; Sun, C. Hydrological effect of six soil types in northwestern Sichuan alpine and subalpine mountains. Chin. J. Appl. Environ. Biol. 2019, 25, 225–231. [Google Scholar]
- Lv, X.; Pan, J.; Zhang, J. Study on Reflectance Spectra of Yellow Brown Soil of Different Water Contents. Remote Sens. Inf. 2004, 19, 10. [Google Scholar]
- Chen, J.H.; Wang, D.C.; Li, G.D.; Sun, Z.C.; Wang, X.; Zhang, X.; Zhang, W. Spatial and Temporal Heterogeneity Analysis of Water Conservation in Beijing-Tianjin-Hebei Urban Agglomeration Based on the Geodetector and Spatial Elastic Coefficient Trajectory Models. GeoHealth 2020, 4, e2020GH000248. [Google Scholar] [CrossRef]
- Lu, B.B.; Charlton, M.; Harris, P.; Fotheringham, A.S. Geographically weighted regression with a non-Euclidean distance metric: A case study using hedonic house price data. Int. J. Geogr. Inf. Sci. 2014, 28, 660–681. [Google Scholar] [CrossRef]
- Chen, S.R.; Feng, Y.J.; Tong, X.H.; Liu, S.; Xie, H.; Gao, C.; Lei, Z.K. Modeling ESV losses caused by urban expansion using cellular automata and geographically weighted regression. Sci. Total Environ. 2020, 712, 136509. [Google Scholar] [CrossRef]
- McMillen, D.P. Geographically weighted regression: The analysis of spatially varying relationships. Am. J. Agr. Econ. 2004, 86, 554–556. [Google Scholar] [CrossRef]
- Kebede, S.; Travi, Y.; Alemayehu, T.; Marc, V. Water balance of Lake Tana and its sensitivity to fluctuations in rainfall, Blue Nile basin, Ethiopia. J. Hydrol. 2006, 316, 233–247. [Google Scholar] [CrossRef]
- Zhang, W.X.; Furtado, K.; Wu, P.L.; Zhou, T.J.; Chadwick, R.; Marzin, C.; Rostron, J.; Sexton, D. Increasing precipitation variability on daily-to-multiyear time scales in a warmer world. Sci. Adv. 2021, 7, eabf8021. [Google Scholar] [CrossRef] [PubMed]
- Zhao, F.B.; Ma, S.; Wu, Y.P.; Qiu, L.J.; Wang, W.K.; Lian, Y.Q.; Chen, J.; Sivakumar, B. The role of climate change and vegetation greening on evapotranspiration variation in the Yellow River Basin, China. Agric. For. Meteorol. 2022, 316, 108842. [Google Scholar] [CrossRef]
- Wu, K.; Chen, J.H.; Yang, H.; Yang, Y.; Hu, Z.M. Spatiotemporal Variations in the Sensitivity of Vegetation Growth to Typical Climate Factors on the Qinghai-Tibet Plateau. Remote Sens. 2023, 15, 2355. [Google Scholar] [CrossRef]
- Meng, X.Y.; Gao, X.; Li, S.Y.; Lei, J.Q. Spatial and Temporal Characteristics of Vegetation NDVI Changes and the Driving Forces in Mongolia during 1982-2015. Remote Sens. 2020, 12, 603. [Google Scholar] [CrossRef] [Green Version]
- Zhu, L.J.; Meng, J.J.; Zhu, L.K. Applying Geodetector to disentangle the contributions of natural and anthropogenic factors to NDVI variations in the middle reaches of the Heihe River Basin. Ecol. Indic. 2020, 117, 106545. [Google Scholar] [CrossRef]
- Fan, Z.M.; Bai, X.Y. Scenarios of potential vegetation distribution in the different gradient zones of Qinghai-Tibet Plateau under future climate change. Sci. Total Environ. 2021, 796, 148918. [Google Scholar] [CrossRef] [PubMed]
- Wu, J.H.; Wang, G.Z.; Chen, W.X.; Pan, S.P.; Zeng, J. Terrain gradient variations in the ecosystem services value of the Qinghai-Tibet Plateau, China. Glob. Ecol. Conserv. 2022, 34, e02008. [Google Scholar] [CrossRef]
- Katipoglu, O.M. Revealing the trend and change point in Hargreaves equation based on potential evapotranspiration values with various statistical approaches. Environ. Sci. Pollut. Res. 2023, 17, 70604–70620. [Google Scholar] [CrossRef]
- Zhou, D.; Zhang, B.; Shen, Y. Effect of Potential Evapotranspiration Estimation Method on Reconnaissance Drought Index (RDI) Calculation. Chin. J. Agrometeorol. 2014, 35, 258–267. [Google Scholar]
- Li, Z.S.; Yang, Y.; Kan, G.Y.; Hong, Y. Study on the Applicability of the Hargreaves Potential Evapotranspiration Estimation Method in CREST Distributed Hydrological Model (Version 3.0) Applications. Water 2018, 10, 1882. [Google Scholar] [CrossRef] [Green Version]
- Zhao, C.Y.; Nan, Z.G.; Feng, Z.D. GIS-assisted spatially distributed modeling of the potential evapotranspiration in semi-arid climate of the Chinese Loess Plateau. J. Arid. Environ. 2004, 58, 387–403. [Google Scholar] [CrossRef]
- Belaineh, G.; Sumner, D.; Carter, E.; Clapp, D. Harmonizing Multiple Methods for Reconstructing Historical Potential and Reference Evapotranspiration. J. Hydrol. Eng. 2014, 19, 05014006. [Google Scholar] [CrossRef]
- Abatzoglou, J.T.; Dobrowski, S.Z.; Parks, S.A.; Hegewisch, K.C. Data Descriptor: TerraClimate, a high-resolution global dataset of monthly climate and climatic water balance from 1958–2015. Sci. Data 2018, 5, 12. [Google Scholar] [CrossRef] [Green Version]
- Bai, Y.; Ochuodho, T.O.; Yang, J. Impact of land use and climate change on water-related ecosystem services in Kentucky, USA. Ecol. Indic. 2019, 102, 51–64. [Google Scholar] [CrossRef]
- Chiang, L.C.; Lin, Y.P.; Huang, T.; Schmeller, D.S.; Verburg, P.H.; Liu, Y.L.; Ding, T.S. Simulation of ecosystem service responses to multiple disturbances from an earthquake and several typhoons. Landsc. Urban Plan. 2014, 122, 41–55. [Google Scholar] [CrossRef]
- Hu, W.M.; Li, G.; Li, Z.N. Spatial and temporal evolution characteristics of the water conservation function and its driving factors in regional lake wetlands-Two types of homogeneous lakes as examples. Ecol. Indic. 2021, 130, 108069. [Google Scholar] [CrossRef]
- Yang, K.; Wu, H.; Qin, J.; Lin, C.G.; Tang, W.J.; Chen, Y.Y. Recent climate changes over the Tibetan Plateau and their impacts on energy and water cycle: A review. Glob. Planet. Chang. 2014, 112, 79–91. [Google Scholar] [CrossRef]
- Yang, M.X.; Nelson, F.E.; Shiklomanov, N.I.; Guo, D.L.; Wan, G.N. Permafrost degradation and its environmental effects on the Tibetan Plateau: A review of recent research. Earth-Sci. Rev. 2010, 103, 31–44. [Google Scholar] [CrossRef]
- Liao, C.R.; Liu, B.C.; Xu, Y.N.; Li, Y.K.; Li, H.D. Effect of topography and protecting barriers on revegetation of sandy land, Southern Tibetan Plateau. Sci. Rep. 2019, 9, 10. [Google Scholar] [CrossRef] [Green Version]
- Guo, X.W.; Zhou, H.K.; Dai, L.C.; Li, J.; Zhang, F.W.; Li, Y.K.; Lin, L.; Li, Q.; Qian, D.W.; Fan, B.; et al. Restoration of Degraded Grassland Significantly Improves Water Storage in Alpine Grasslands in the Qinghai-Tibet Plateau. Front. Plant Sci. 2021, 12, 9. [Google Scholar] [CrossRef]
- Pang, G.J.; Wang, X.J.; Yang, M.X. Using the NDVI to identify variations in, and responses of, vegetation to climate change on the Tibetan Plateau from 1982 to 2012. Quat. Int. 2017, 444, 87–96. [Google Scholar] [CrossRef]
- Shen, M.G.; Piao, S.L.; Jeong, S.J.; Zhou, L.M.; Zeng, Z.Z.; Ciais, P.; Chen, D.L.; Huang, M.T.; Jin, C.S.; Li, L.Z.X.; et al. Evaporative cooling over the Tibetan Plateau induced by vegetation growth. Proc. Natl. Acad. Sci. USA 2015, 112, 9299–9304. [Google Scholar] [CrossRef] [PubMed] [Green Version]
- Hua, W.; Fan, G.Z.; Zhou, D.W.; Ni, C.J.; Li, X.M.; Wang, Y.L.; Liu, Y.Q.; Huang, X.L. Preliminary analysis on the relationships between Tibetan Plateau NDVI change and its surface heat source and precipitation of China. Sci. China Ser. D-Earth Sci. 2008, 51, 677–685. [Google Scholar] [CrossRef]
- Sun, W.Y.; Mu, X.M.; Song, X.Y.; Wu, D.; Cheng, A.F.; Qiu, B. Changes in extreme temperature and precipitation events in the Loess Plateau (China) during 1960–2013 under global warming. Atmos. Res. 2016, 168, 33–48. [Google Scholar] [CrossRef]
- Zhang, B.Q.; Tian, L.; Zhao, X.N.; Wu, P.T. Feedbacks between vegetation restoration and local precipitation over the Loess Plateau in China. Sci. China-Earth Sci. 2021, 64, 920–931. [Google Scholar] [CrossRef]
- Li, S.F.; Valdes, P.J.; Farnsworth, A.; Davies-Barnard, T.; Su, T.; Lunt, D.J.; Spicer, R.A.; Liu, J.; Deng, W.Y.D.; Huang, J.; et al. Orographic evolution of northern Tibet shaped vegetation and plant diversity in eastern Asia. Sci. Adv. 2021, 7, eabc7741. [Google Scholar] [CrossRef] [PubMed]
- Huang, K.; Zhang, Y.J.; Zhu, J.T.; Liu, Y.J.; Zu, J.X.; Zhang, J. The Influences of Climate Change and Human Activities on Vegetation Dynamics in the Qinghai-Tibet Plateau. Remote Sens. 2016, 8, 876. [Google Scholar] [CrossRef] [Green Version]
- Brodribb, T.J.; McAdam, S.A.M.; Jordan, G.J.; Martins, S.C.V. Conifer species adapt to low-rainfall climates by following one of two divergent pathways. Proc. Natl. Acad. Sci. USA 2014, 111, 14489–14493. [Google Scholar] [CrossRef] [Green Version]
- Cong, W.C.; Sun, X.Y.; Guo, H.; Shan, R.F. Comparison of the SWAT and InVEST models to determine hydrological ecosystem service spatial patterns, priorities and trade-offs in a complex basin. Ecol. Indic. 2020, 112, 106089. [Google Scholar] [CrossRef]
- Belete, M.; Deng, J.S.; Zhou, M.M.; Wang, K.; You, S.X.; Hong, Y.; Weston, M. A New Approach to Modeling Water Balance in Nile River Basin, Africa. Sustainability 2018, 10, 810. [Google Scholar] [CrossRef] [Green Version]
- Sun, M.L.; Hu, J.; Chen, X.L.; Lu, Y.H.; Yang, L.X. Comparison of Five Models for Estimating the Water Retention Service of a Typical Alpine Wetland Region in the Qinghai-Tibetan Plateau. Remote Sens. 2022, 14, 6306. [Google Scholar] [CrossRef]
- Mu, C.C.; Abbott, B.W.; Norris, A.J.; Mu, M.; Fan, C.Y.; Chen, X.; Jia, L.; Yang, R.M.; Zhang, T.J.; Wang, K.; et al. The status and stability of permafrost carbon on the Tibetan Plateau. Earth-Sci. Rev. 2020, 211, 103433. [Google Scholar] [CrossRef]
- Yang, X.; Chen, R.S.; Meadows, M.E.; Ji, G.X.; Xu, J.H. Modelling water yield with the InVEST model in a data scarce region of northwest China. Water Supply 2020, 20, 1035–1045. [Google Scholar] [CrossRef]
- Scordo, F.; Lavender, T.M.; Seitz, C.; Perillo, V.L.; Rusak, J.A.; Piccolo, M.C.; Perillo, G.M.E. Modeling Water Yield: Assessing the Role of Site and Region-Specific Attributes in Determining Model Performance of the InVEST Seasonal Water Yield Model. Water 2018, 10, 1496. [Google Scholar] [CrossRef] [Green Version]
- Zhang, X.; Li, Y.; Lyu, C.; Bi, R.; Xia, L.; Guo, Y.; Wang, Y.; Xu, C.; Sun, B. Research progress on application of ecosystem service functions based on InVEST model. Ecol. Sci. 2022, 41, 237–242. [Google Scholar]


| Code | Ecological Zone |
|---|---|
| I12 | Agricultural and grassland zone of the Loess Plateau |
| I15 | Ecological area of deciduous and evergreen broad-leaved forest in the Qinba Mountains |
| I25 | Ecological area of evergreen broad-leaved forest in southwest Sichuan and north-central Yunnan |
| II03 | Grassland desertification ecological area in the middle of the Inner Mongolia Plateau |
| II08 | Tarim Basin–eastern Xinjiang desert ecological area |
| III01 | Qilian mountain forest and alpine grassland ecological area |
| III02 | Desert ecological area of the Qaidam Basin |
| III03 | Pamir-Kunlun–Altun alpine desert grassland ecological area |
| III04 | River source area–Gannan alpine meadow grassland ecological area |
| III05 | Alpine desert grassland ecological area of the northern Tibetan Plateau |
| III06 | Ali Mountain warm arid desert ecological area |
| III07 | Cold temperate coniferous forest ecological area in eastern Tibet–western Sichuan |
| III08 | Alpine meadow grassland ecological area in southern Tibet |
| III09 | Seasonal rainforest ecological area of tropical rainforest in southeast Tibet |
| First-Level Zone Code | First-Level Climate Zone | Second-Level Zone Code | Second-Level Climate Zone |
|---|---|---|---|
| II | Middle Temperate Zone | IIC2 | Central Mongolia |
| IID1 | Menggan | ||
| III | South Temperate Zone | IIID1 | Nanjiang |
| IIIB3 | Weihe | ||
| IV | North Subtropical Zone | IVA2 | Qinba |
| V | Middle Subtropical Zone | VA3 | Sichuan |
| VA5 | Northern Yunnan | ||
| H | Plateau Climate Zone | HD2 | Northern Tibet |
| HC3 | Southern Tibet | ||
| HC2 | Central Tibet | ||
| HB2 | Changdu | ||
| HA1 | Bomi–Western Sichuan | ||
| HVVIVIIA1 | Dawang–Chayu | ||
| HC1 | Qilian–Qinghai Lake | ||
| HB1 | Southern Qinghai | ||
| HD1 | Qaidam |
| Data Usage Module | Data | Source | Spatial Resolution | Description |
|---|---|---|---|---|
| InVEST model input parameters | Precipitation | CAS (https://www.resdc.cn/, accessed on 15 January 2023) | 1 km × 1 km | With the daily data of meteorological elements at more than 2400 stations nationwide, the spatial interpolation data of meteorological elements for each year from 1960 to 2021 were generated based on the calculation of annual values of each meteorological element based on Anuspl interpolation software |
| InVEST model input parameters | China-1 km-monthly potential evapotranspiration dataset | (https://data.tpdc.ac.cn/, accessed on 20 January 2023) | 0.0083333 (About 1 km) | Hargreaves Potential Evapotranspiration Calculator was used based on the 1 km monthly average, minimum, and maximum temperature data in China |
| InVEST model input parameters | Average annual PET | TerraClimate (https://www.nature.com/, accessed on 16 January 2023) | 5 km × 5 km | Monthly surface water balance dataset generated using water balance model |
| InVEST model input parameters | MOD16A2 | Google Earth Engine (https://code.earthengine.google.com, accessed on 20 January 2023) | 500 m × 500 m | Data collected based on the Penman-Monteith equation |
| InVEST model input parameters | Land use (LULC) | CAS (https://www.resdc.cn/, accessed on 15 January 2023) | 1 km × 1 km | Secondary classification of land resources according to their natural attributes |
| InVEST model input parameters | Soil root depth | HWSD (https://data.apps.fao.org/, accessed on 20 January 2023) | Contains detailed data on maximum root depth (mm), clay content (%), meal content (%), sand content (%), soil capacity (g/cm³), organic matter content (%), etc. | |
| Calculation of the water conservation | Velocity coefficient | USDA-NRCS | It was obtained by multiplying the flow–slope–landscape table from the National Engineering Handbook provided by the USDA-NRCS by 1000 | |
| Calculation of the water conservation | DEM | CAS (https://www.resdc.cn/, accessed on 15 January 2023) | 90 m × 90 m | TIt is based on the latest SRTM V4.1 data, which is collated and spliced to generate 90 m of sub-provincial data |
| Influencing factors | Actual evaporation | InVEST model | 1 km × 1 km | Derived from the calculation results of the InVEST model water production module |
| Influencing factors | NDVI | NESDC (http://www.nesdc.org.cn/, accessed on 8 February 2023) | 5 km × 5 km | Based on NOAA CDR NDVI data, monthly mean NDVI data for the 1982–2020 growing season (April–October) in the Chinese regions were obtained by averaging the first 15 and last 15 days of each month and then reconstructed using the maximum value synthesis method (MVC) |
| Partition Data | Climate zone data | CAS (https://www.resdc.cn/, accessed on 7 February 2023) | (Vector data) | It was compiled by the National Meteorological Administration of China in 1978 using climate data from 1951 to 1970 |
| Partition Data | Ecological zone data | (http://www.ecosystem.csdb.cn/, accessed on 7 February 2023) | (Vector data) | Zoning by ecosystem type and natural conditions such as structural feature and geological feature |
| Judgment | Interaction |
|---|---|
| q() < min [q(), q()] | Non-linear attenuation |
| min [q(), q()] < q() < max [q(), q()] | Single-factor non-linear weakening |
| q() > max [q(), q()] | Two-factor enhancement |
| q() = q() + q() | Independent |
| q() > q() + q() | Non-linear enhancement |
| Data | Water Yield (108 m3) | Relative Error |
|---|---|---|
| China-1 km-monthly potential evapotranspiration dataset | 5697.40 | 1.57% |
| MOD16A2 | 5399.48 | 3.74% |
| PET dataset TerraClimate | 4970.31 | 11.39% |
Disclaimer/Publisher’s Note: The statements, opinions and data contained in all publications are solely those of the individual author(s) and contributor(s) and not of MDPI and/or the editor(s). MDPI and/or the editor(s) disclaim responsibility for any injury to people or property resulting from any ideas, methods, instructions or products referred to in the content. |
© 2023 by the authors. Licensee MDPI, Basel, Switzerland. This article is an open access article distributed under the terms and conditions of the Creative Commons Attribution (CC BY) license (https://creativecommons.org/licenses/by/4.0/).
Share and Cite
Wen, X.; Shao, H.; Wang, Y.; Lv, L.; Xian, W.; Shao, Q.; Shu, Y.; Yin, Z.; Liu, S.; Qi, J. Assessment of the Spatiotemporal Impact of Water Conservation on the Qinghai–Tibet Plateau. Remote Sens. 2023, 15, 3175. https://doi.org/10.3390/rs15123175
Wen X, Shao H, Wang Y, Lv L, Xian W, Shao Q, Shu Y, Yin Z, Liu S, Qi J. Assessment of the Spatiotemporal Impact of Water Conservation on the Qinghai–Tibet Plateau. Remote Sensing. 2023; 15(12):3175. https://doi.org/10.3390/rs15123175
Chicago/Turabian StyleWen, Xin, Huaiyong Shao, Ying Wang, Lingfeng Lv, Wei Xian, Qiufang Shao, Yang Shu, Ziqiang Yin, Shuhan Liu, and Jiaguo Qi. 2023. "Assessment of the Spatiotemporal Impact of Water Conservation on the Qinghai–Tibet Plateau" Remote Sensing 15, no. 12: 3175. https://doi.org/10.3390/rs15123175