
Characterizing the Development of Photovoltaic Power Stations and Their Impacts on Vegetation Conditions from Landsat Time Series during 1990–2022
 ,
,
Abstract
:
1. Introduction
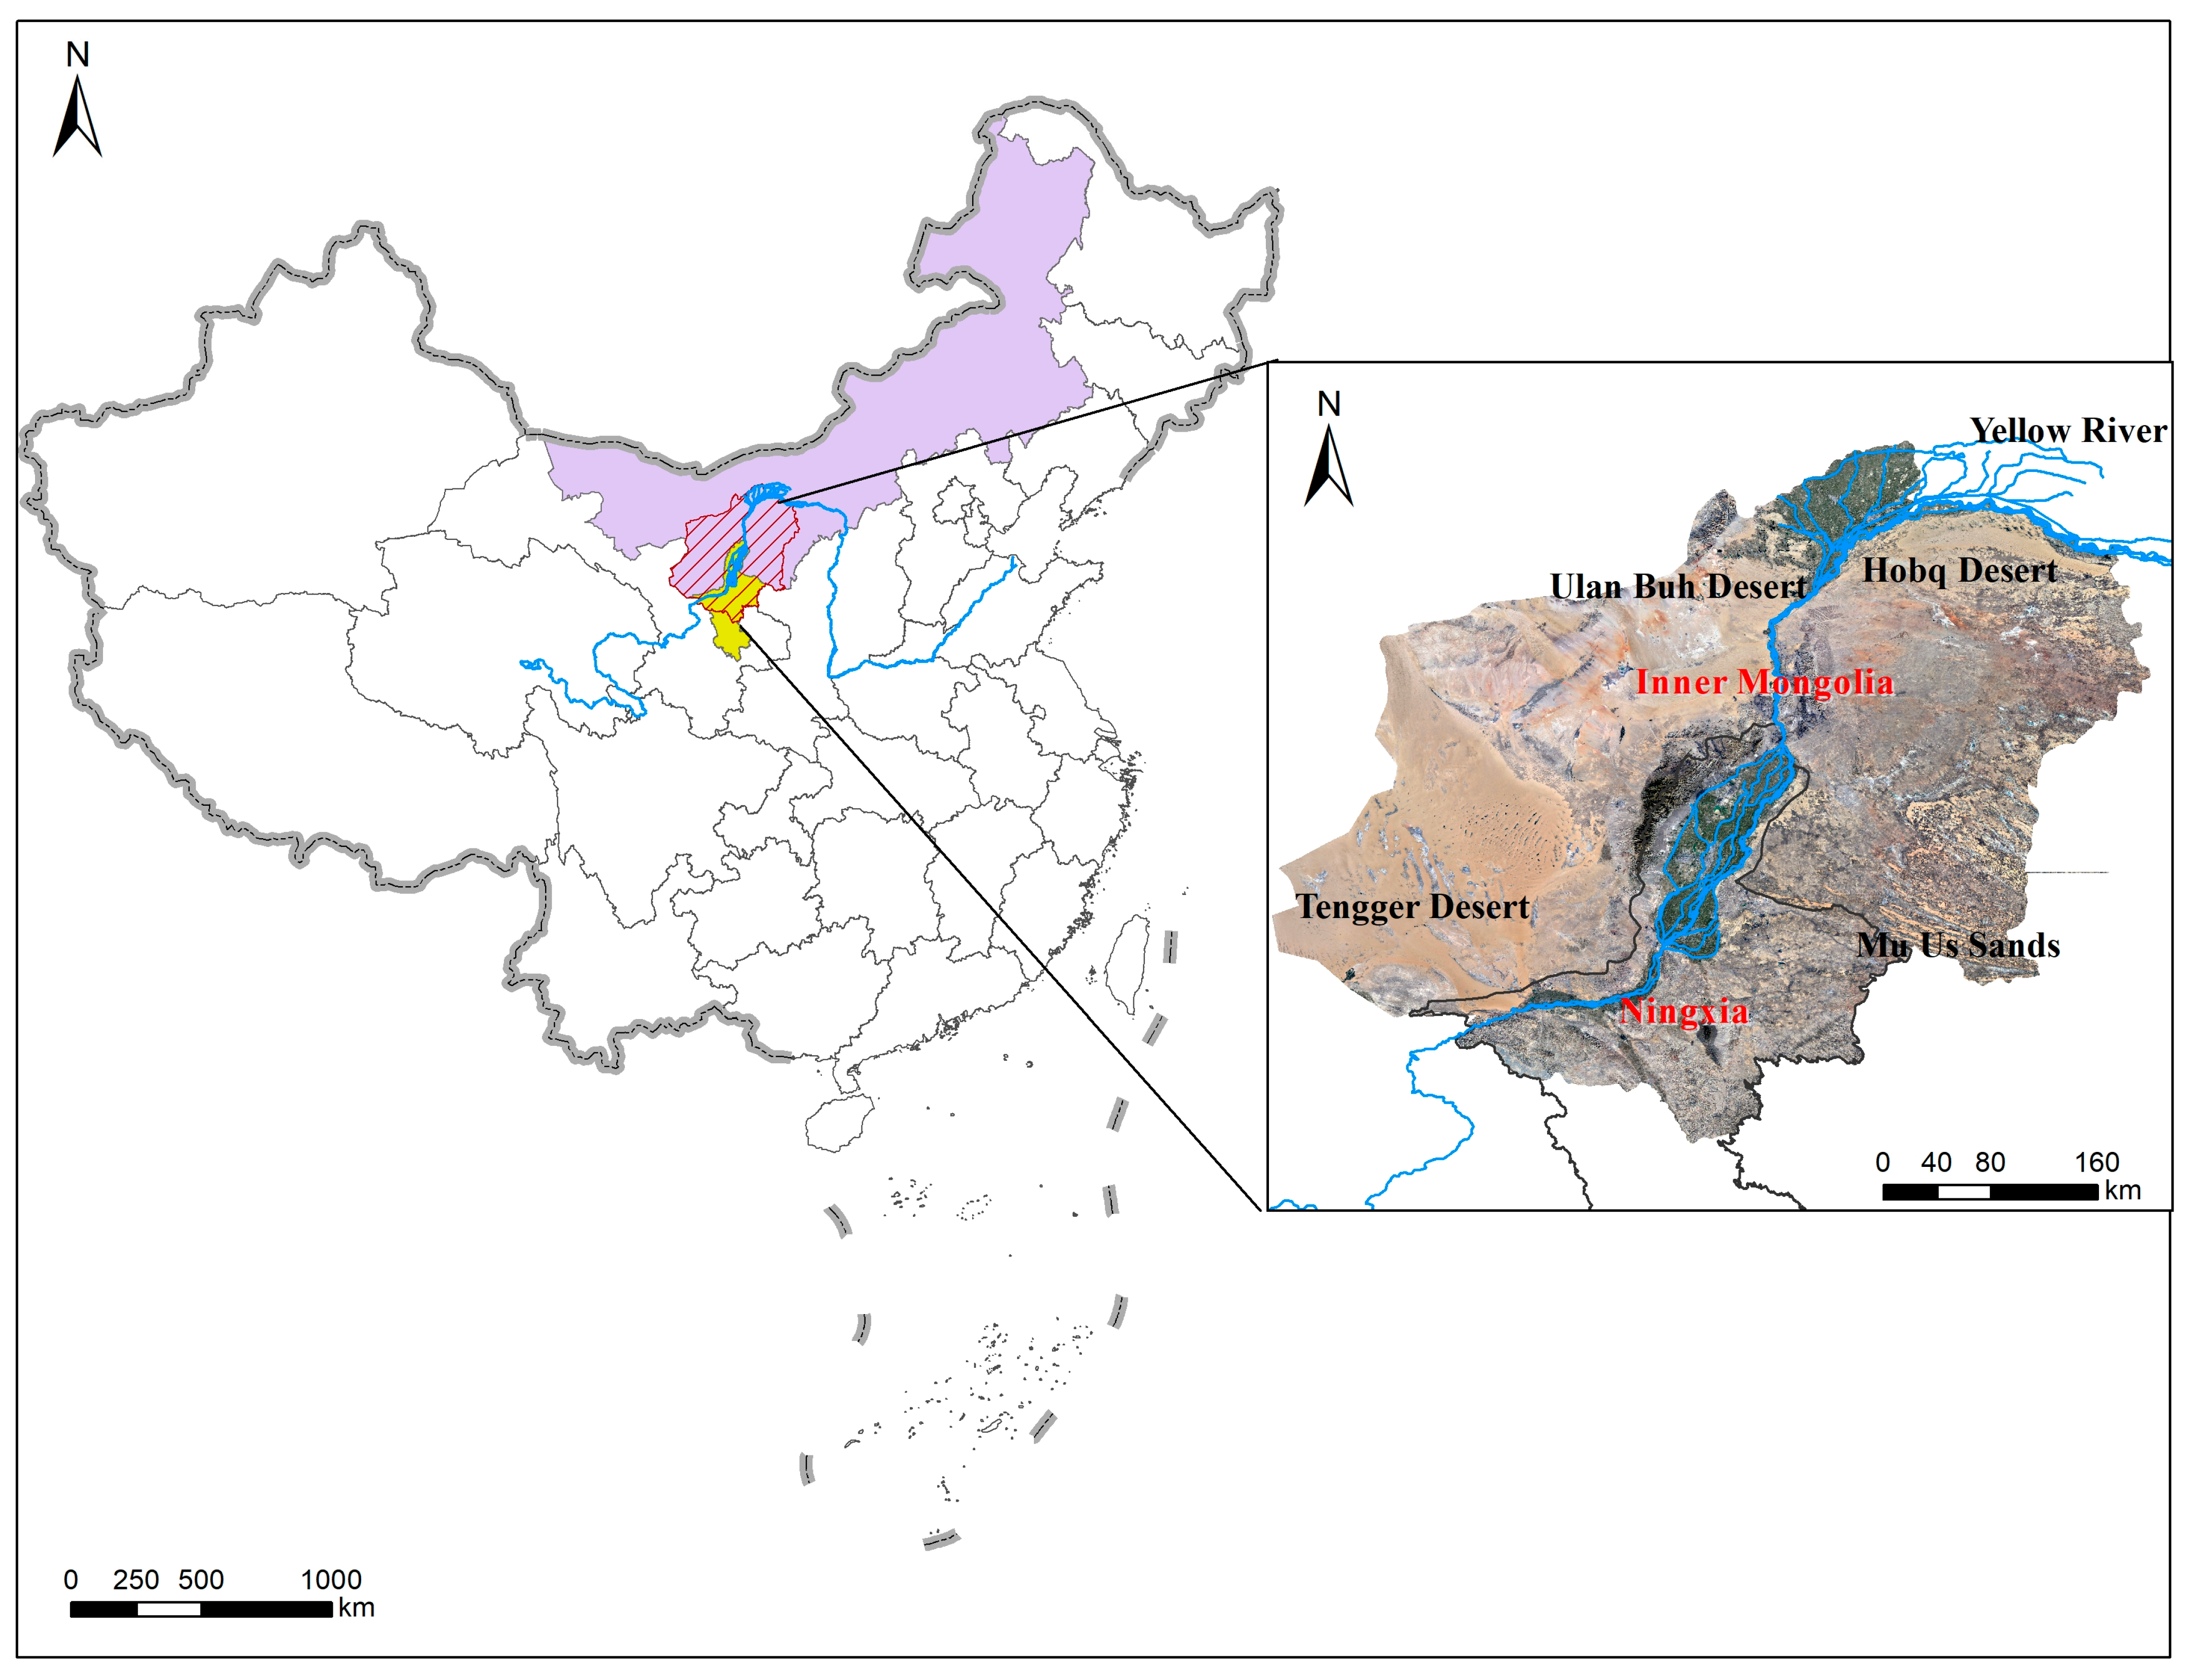
2. Study Area
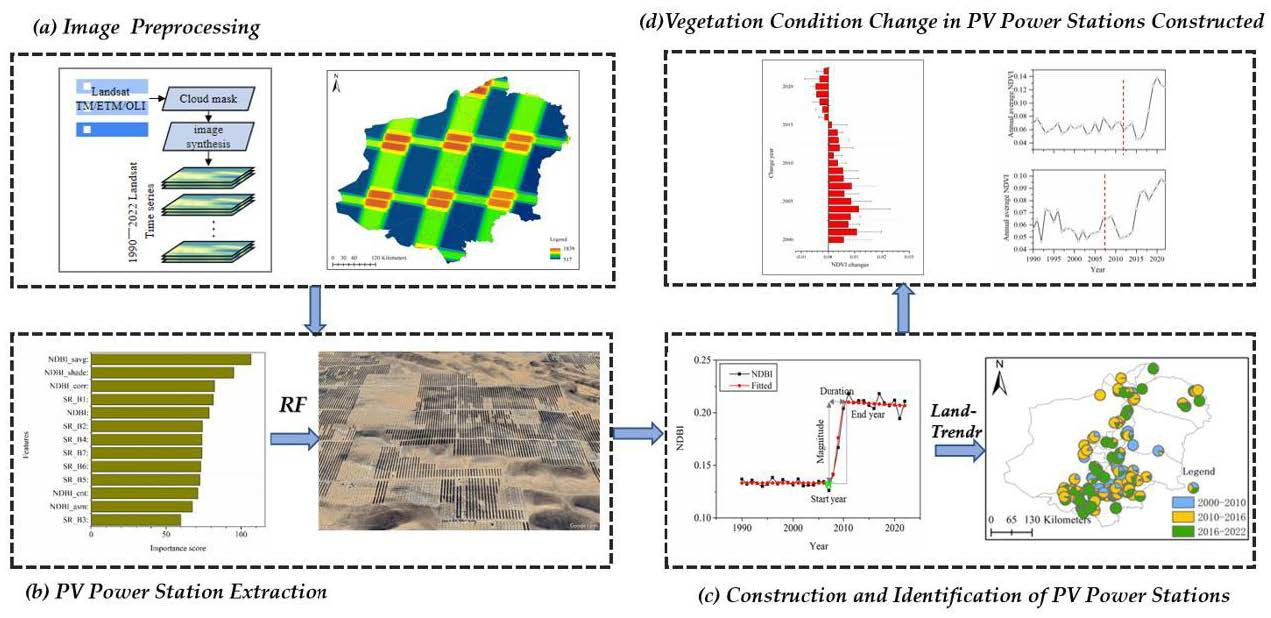
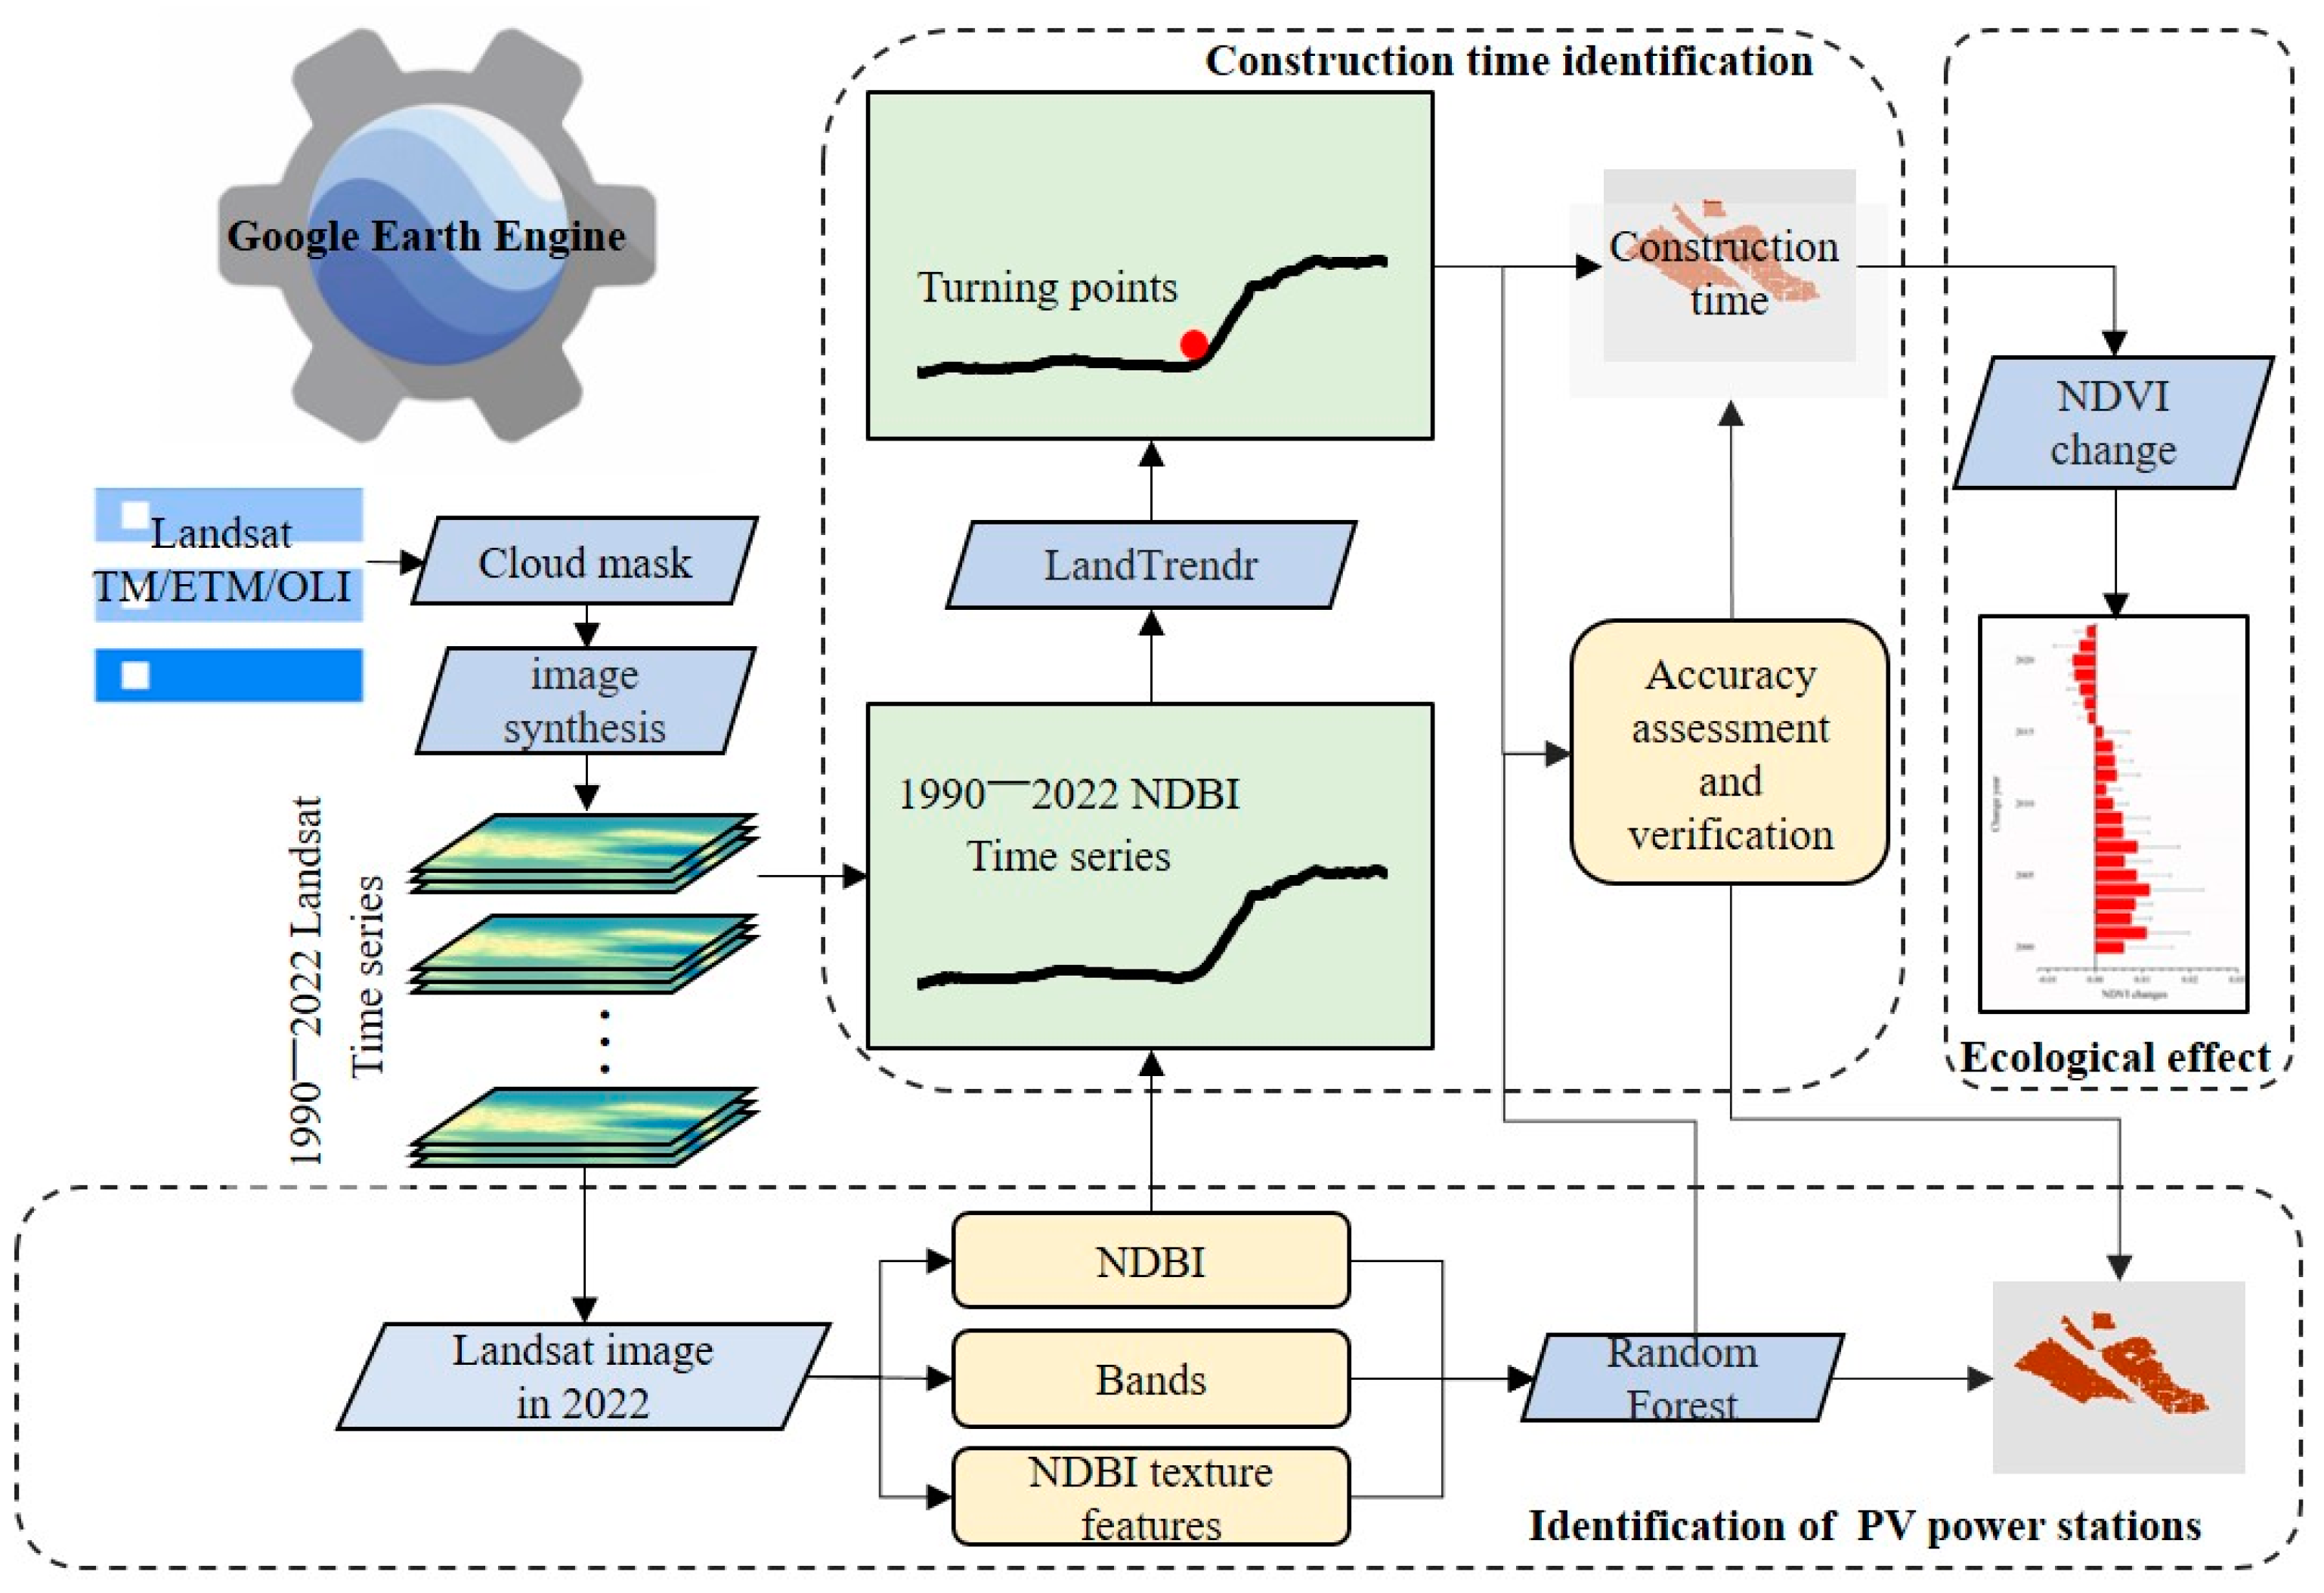
3. Materials and Methods
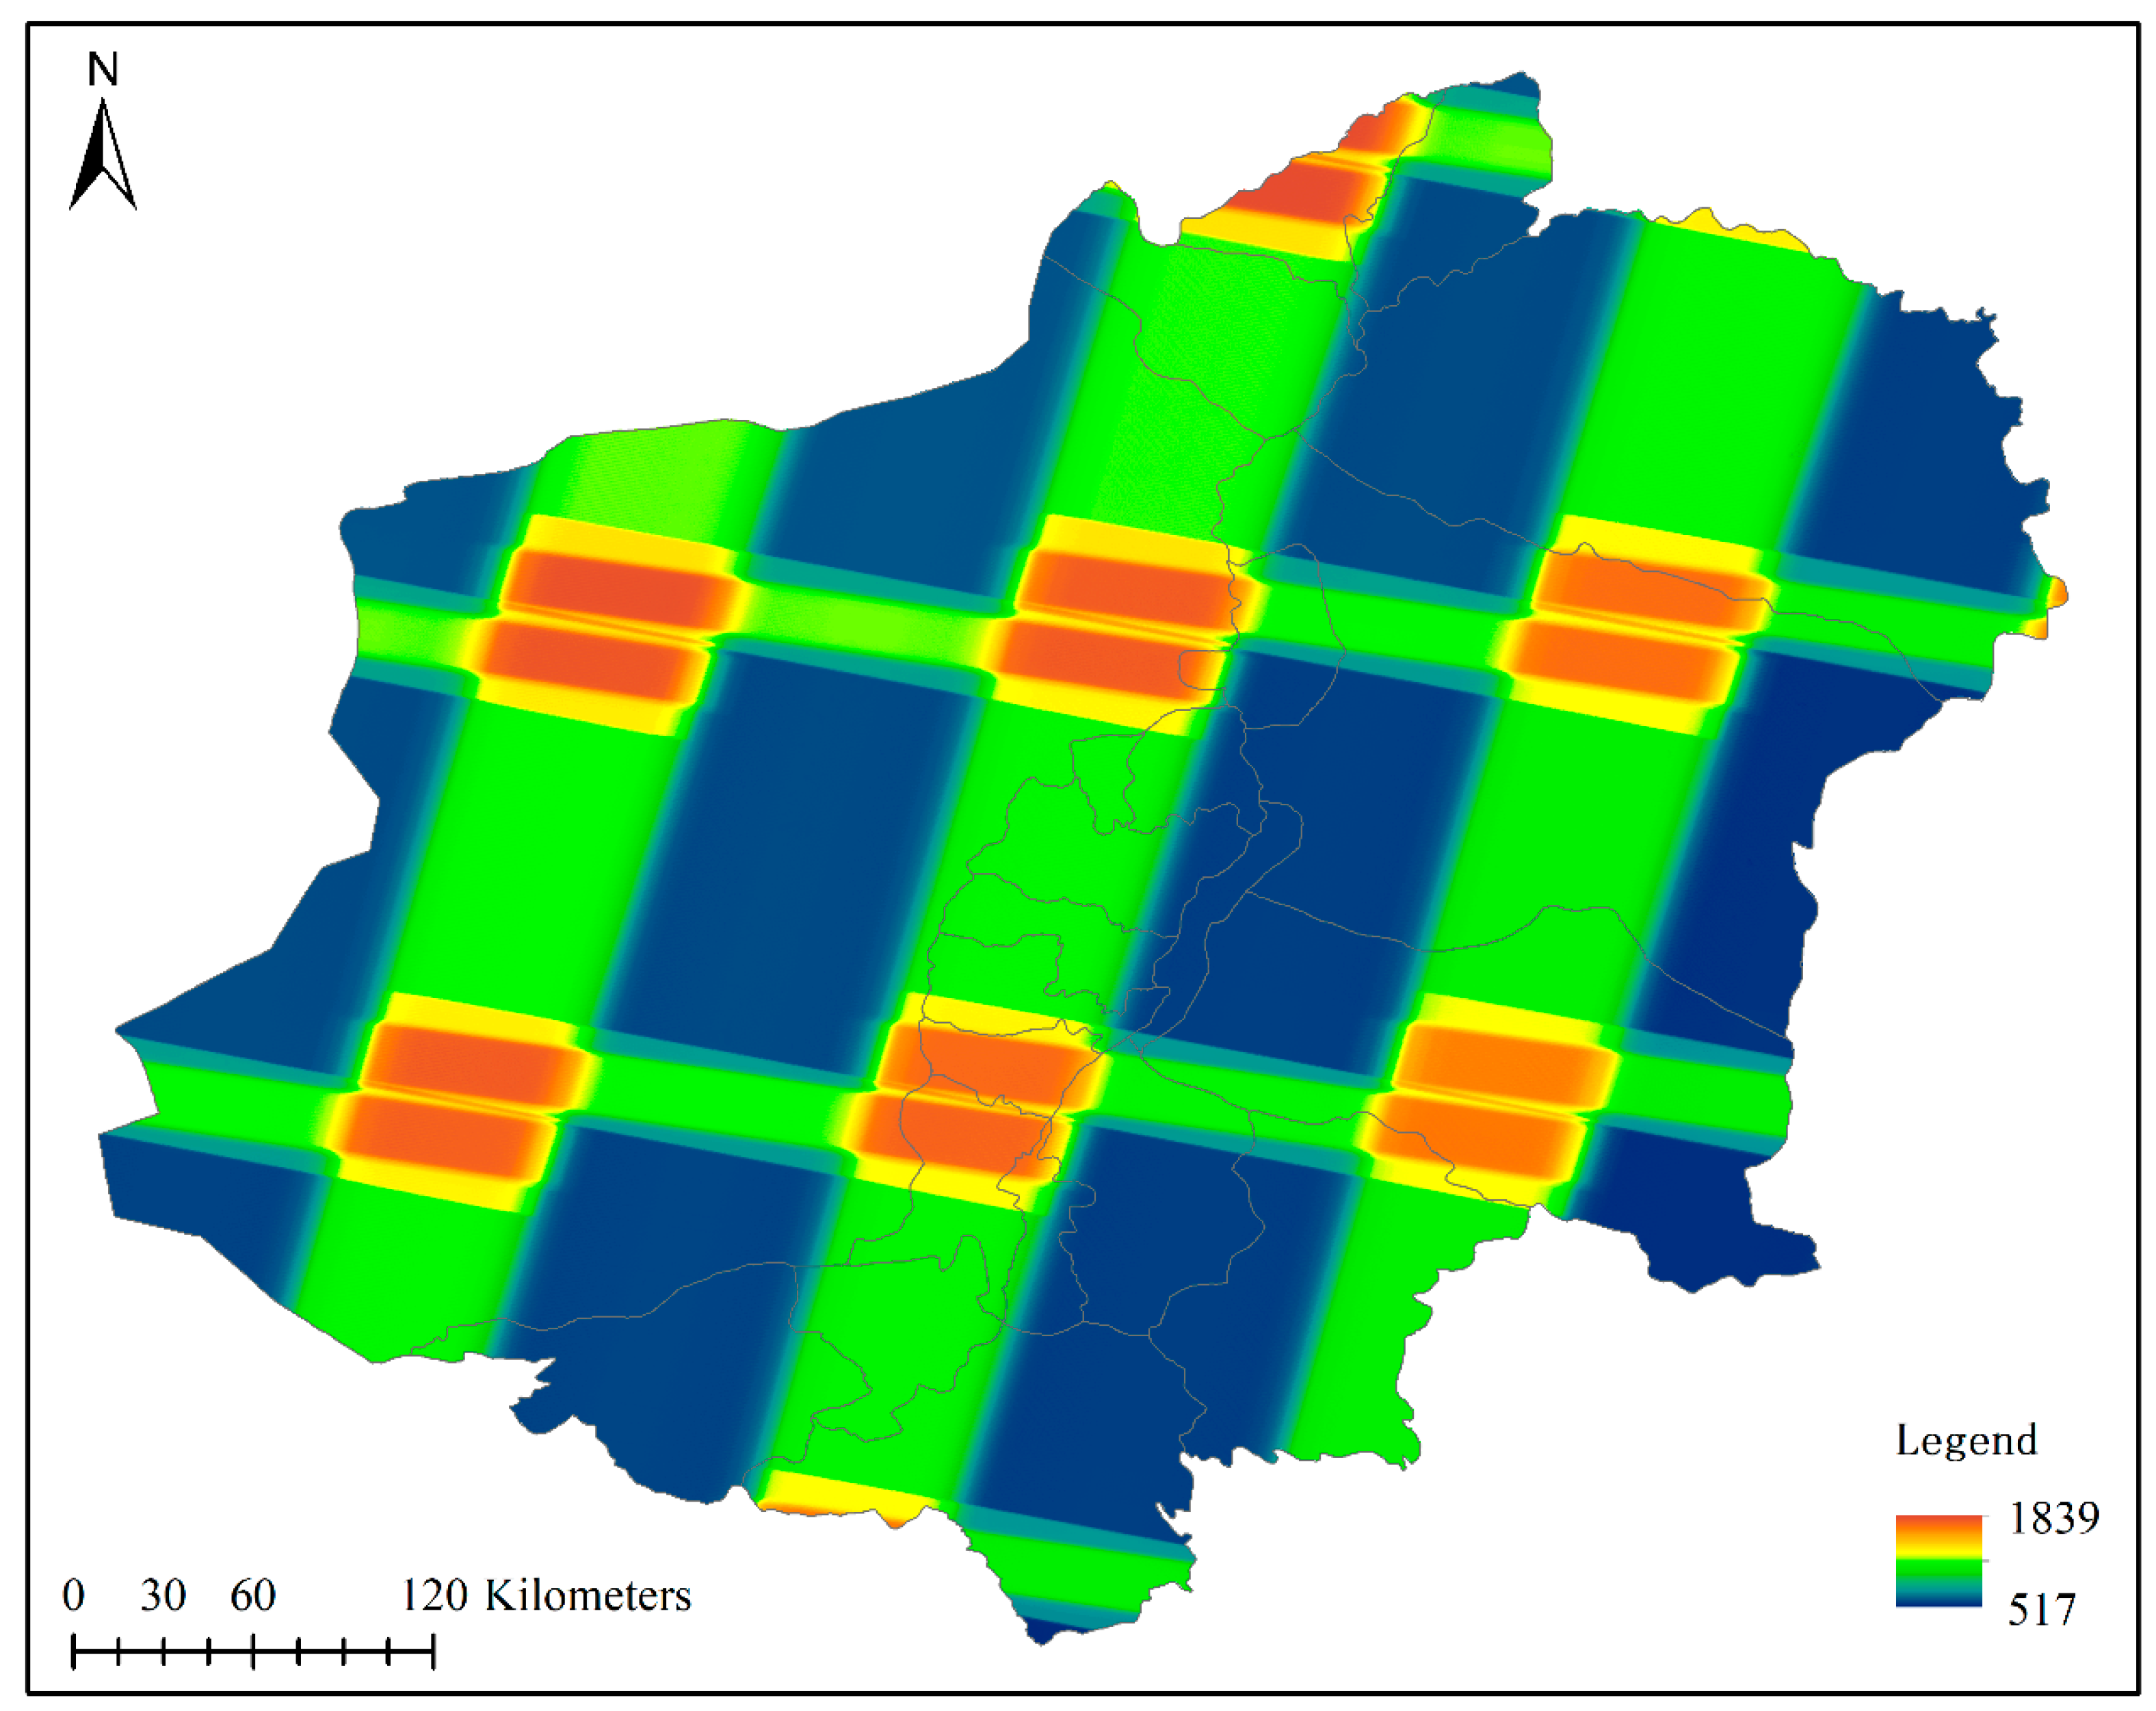
3.1. Landsat Imagery and Preprocessing
3.2. PV Power Station Extraction
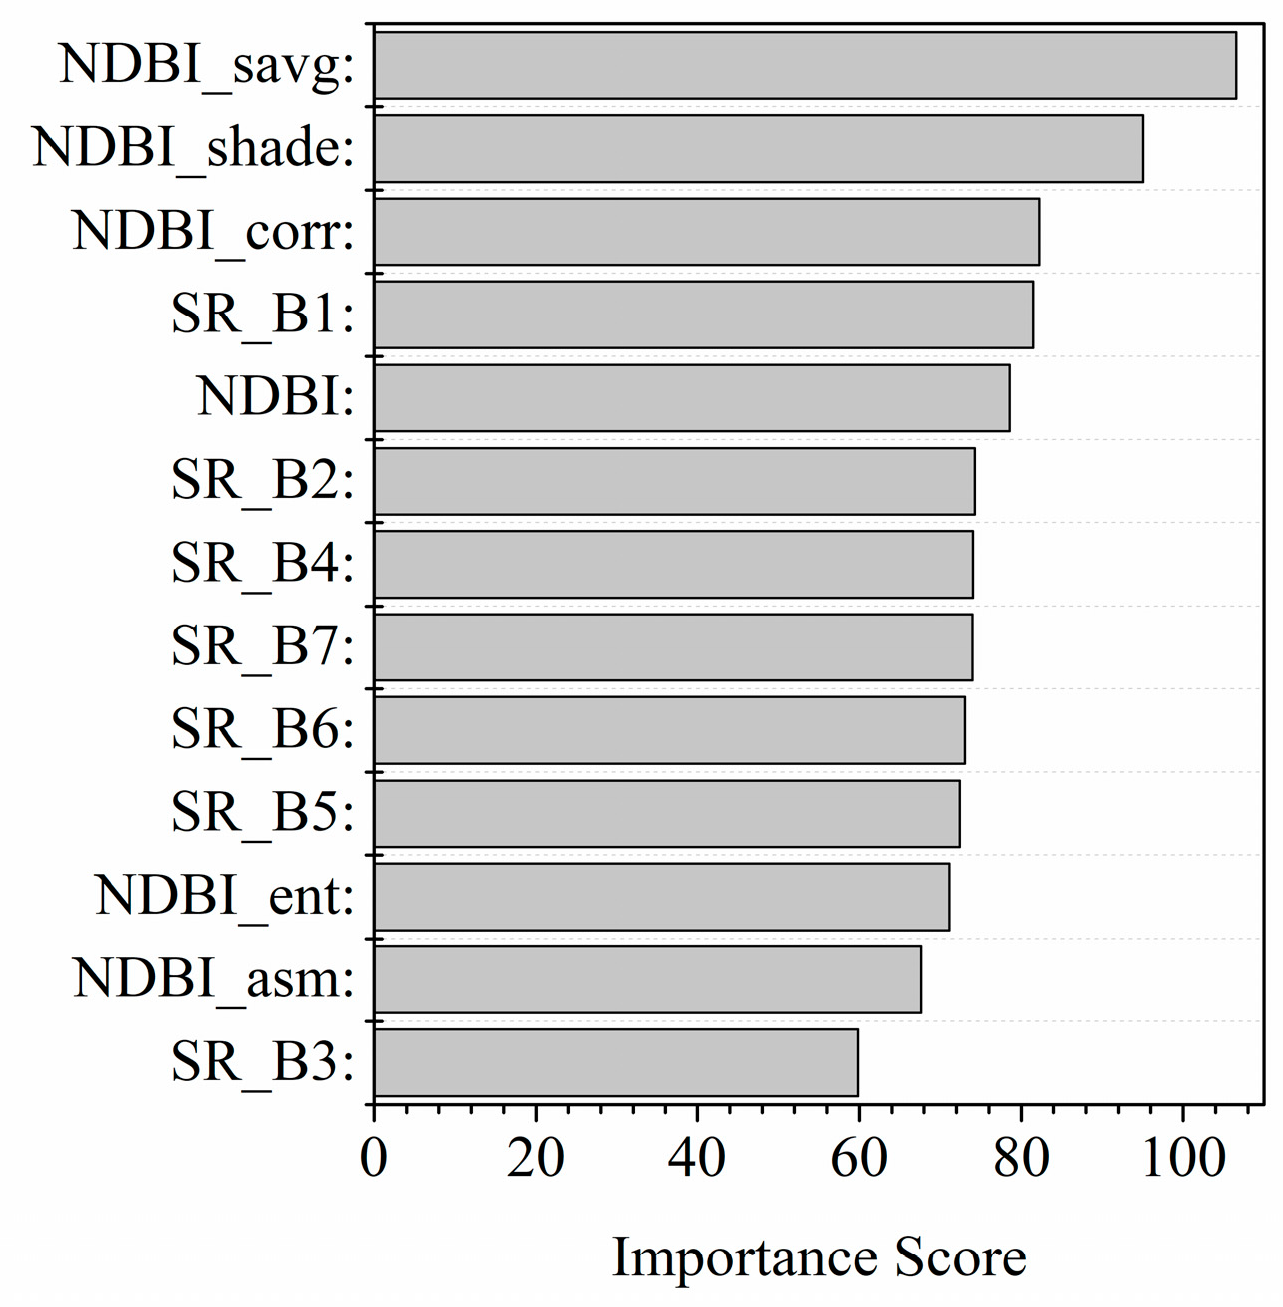
3.2.1. Spectral Feature Selection
3.2.2. Texture Feature Analysis
3.2.3. Random Forest Model
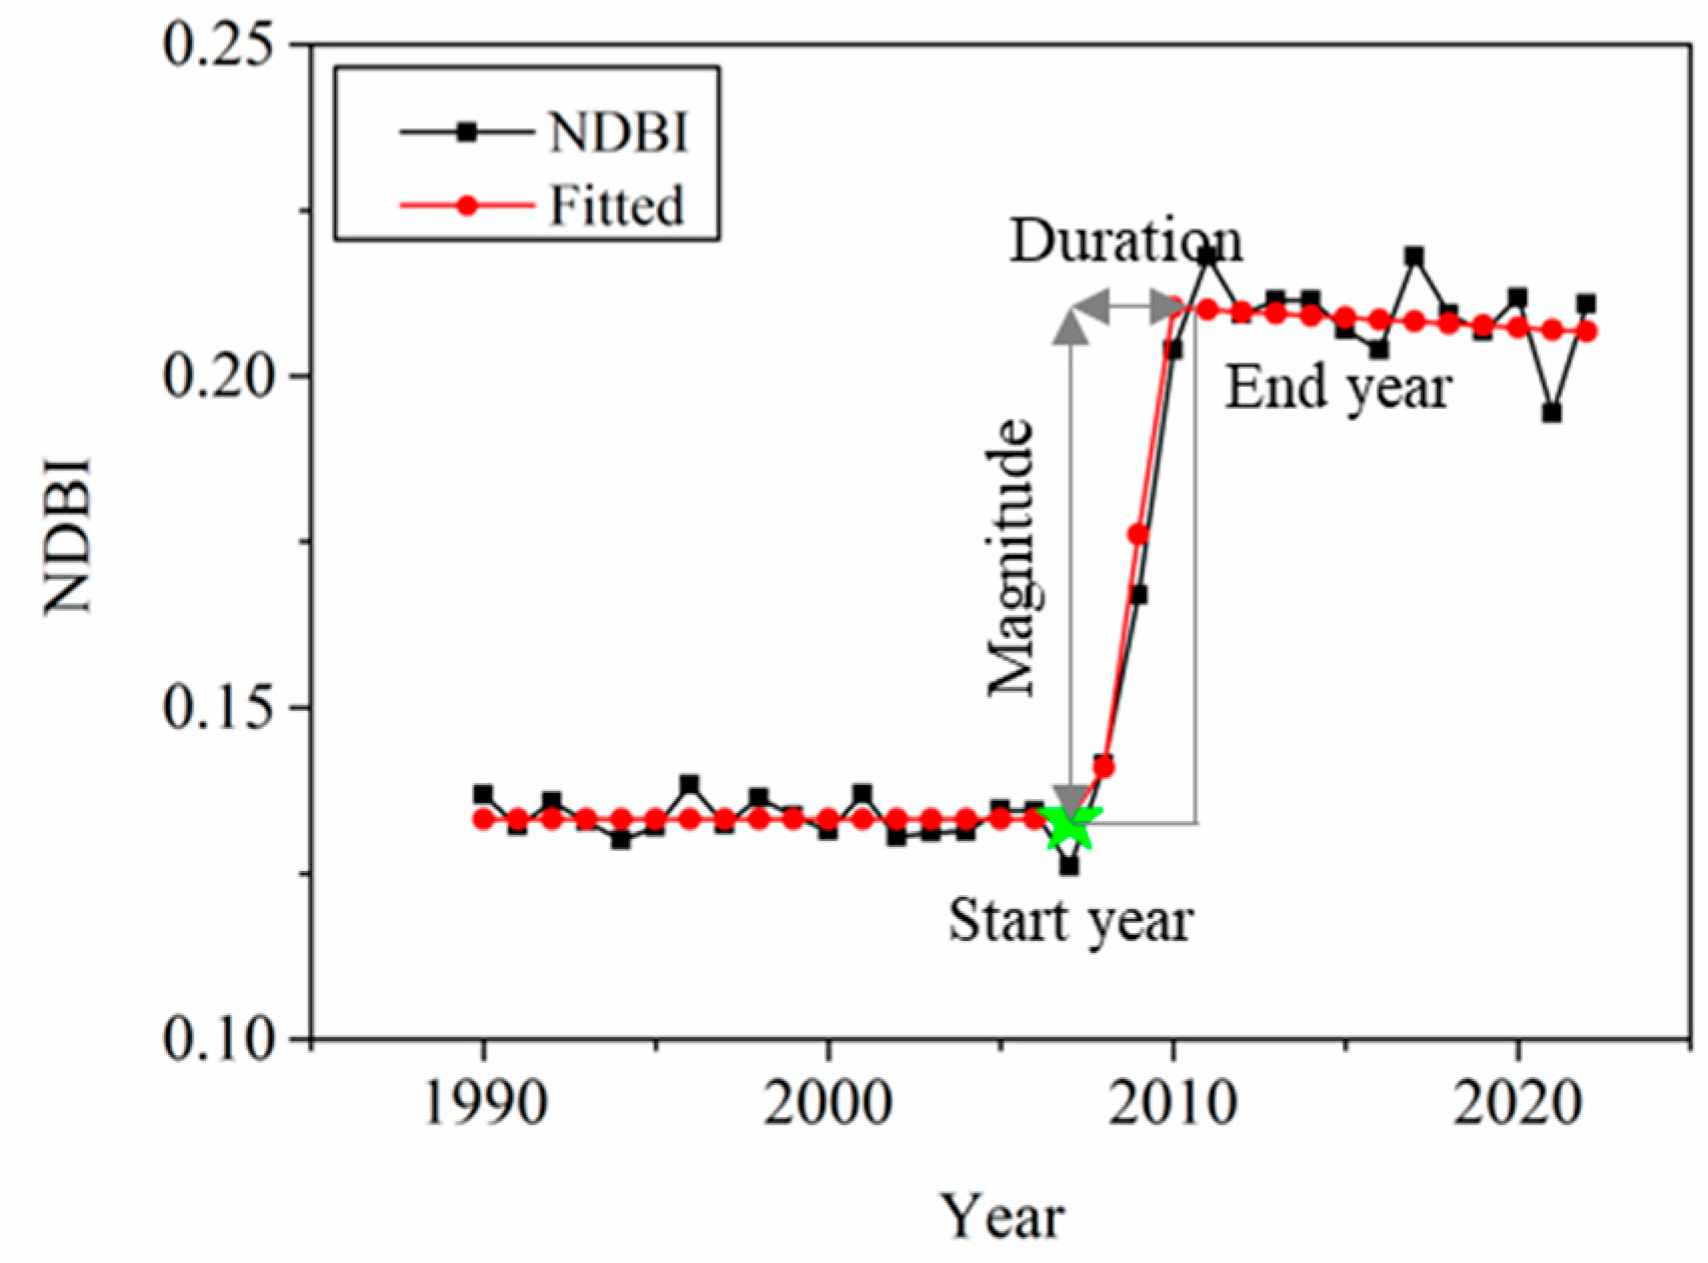
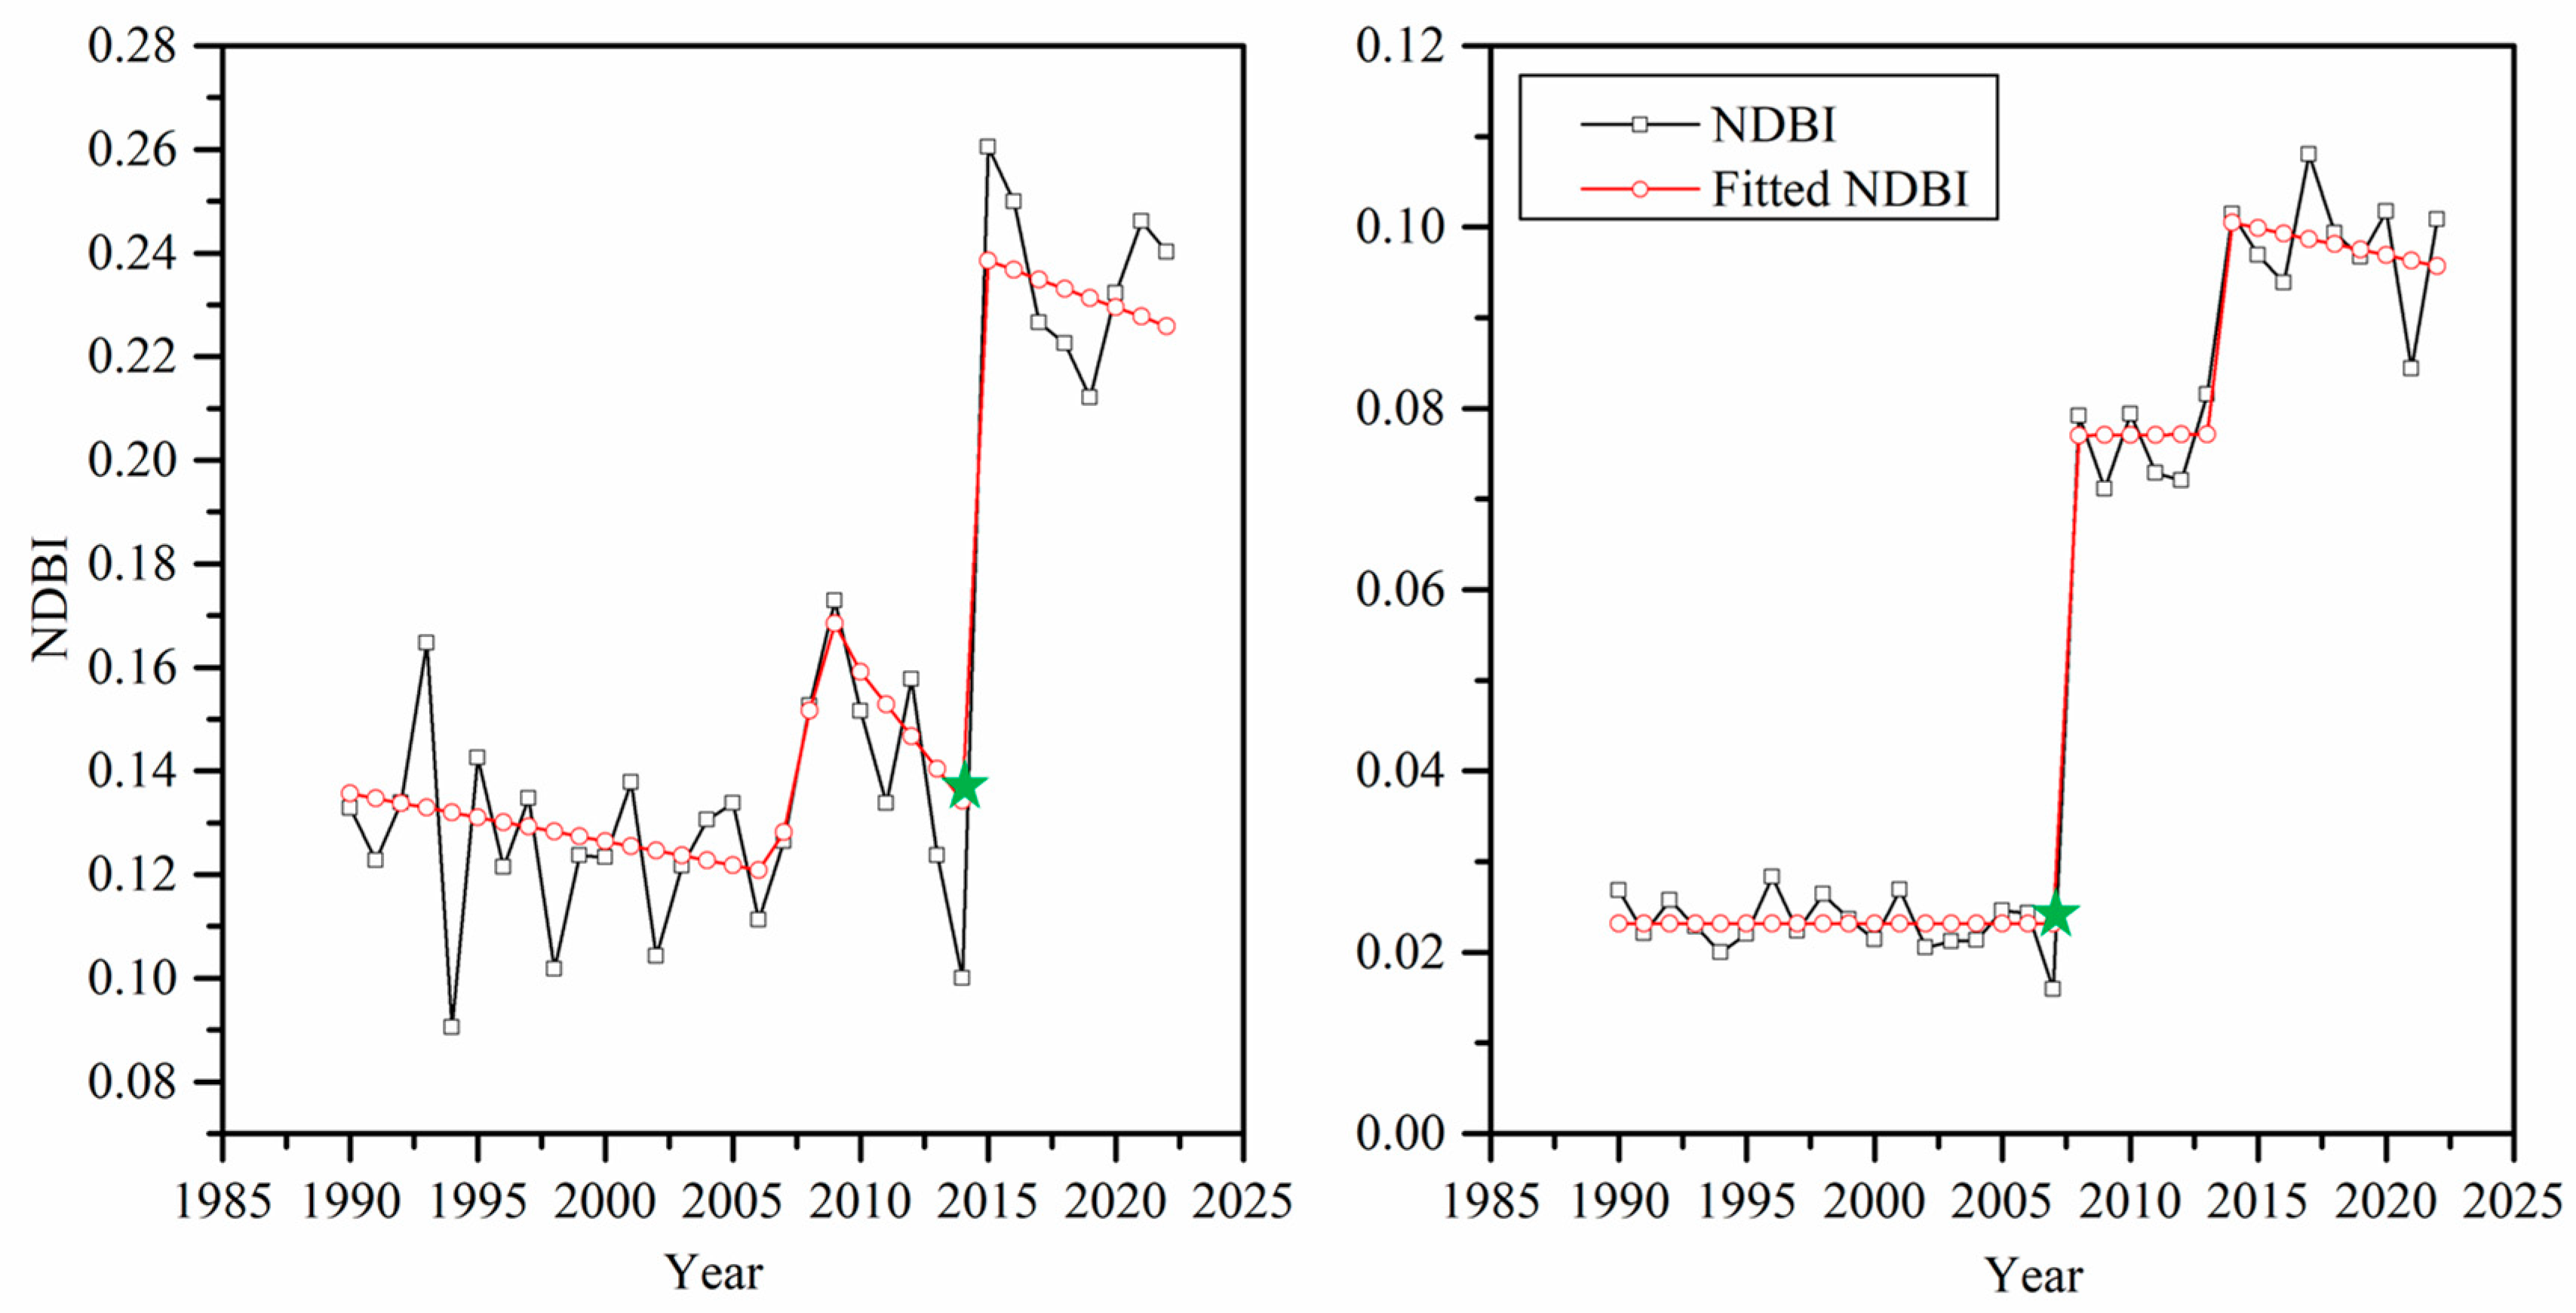
3.3. Time Series Turning Point Detection Based on Landtrendr
3.4. Assessment of the Ecological Impact of PV Power Station Construction
4. Results
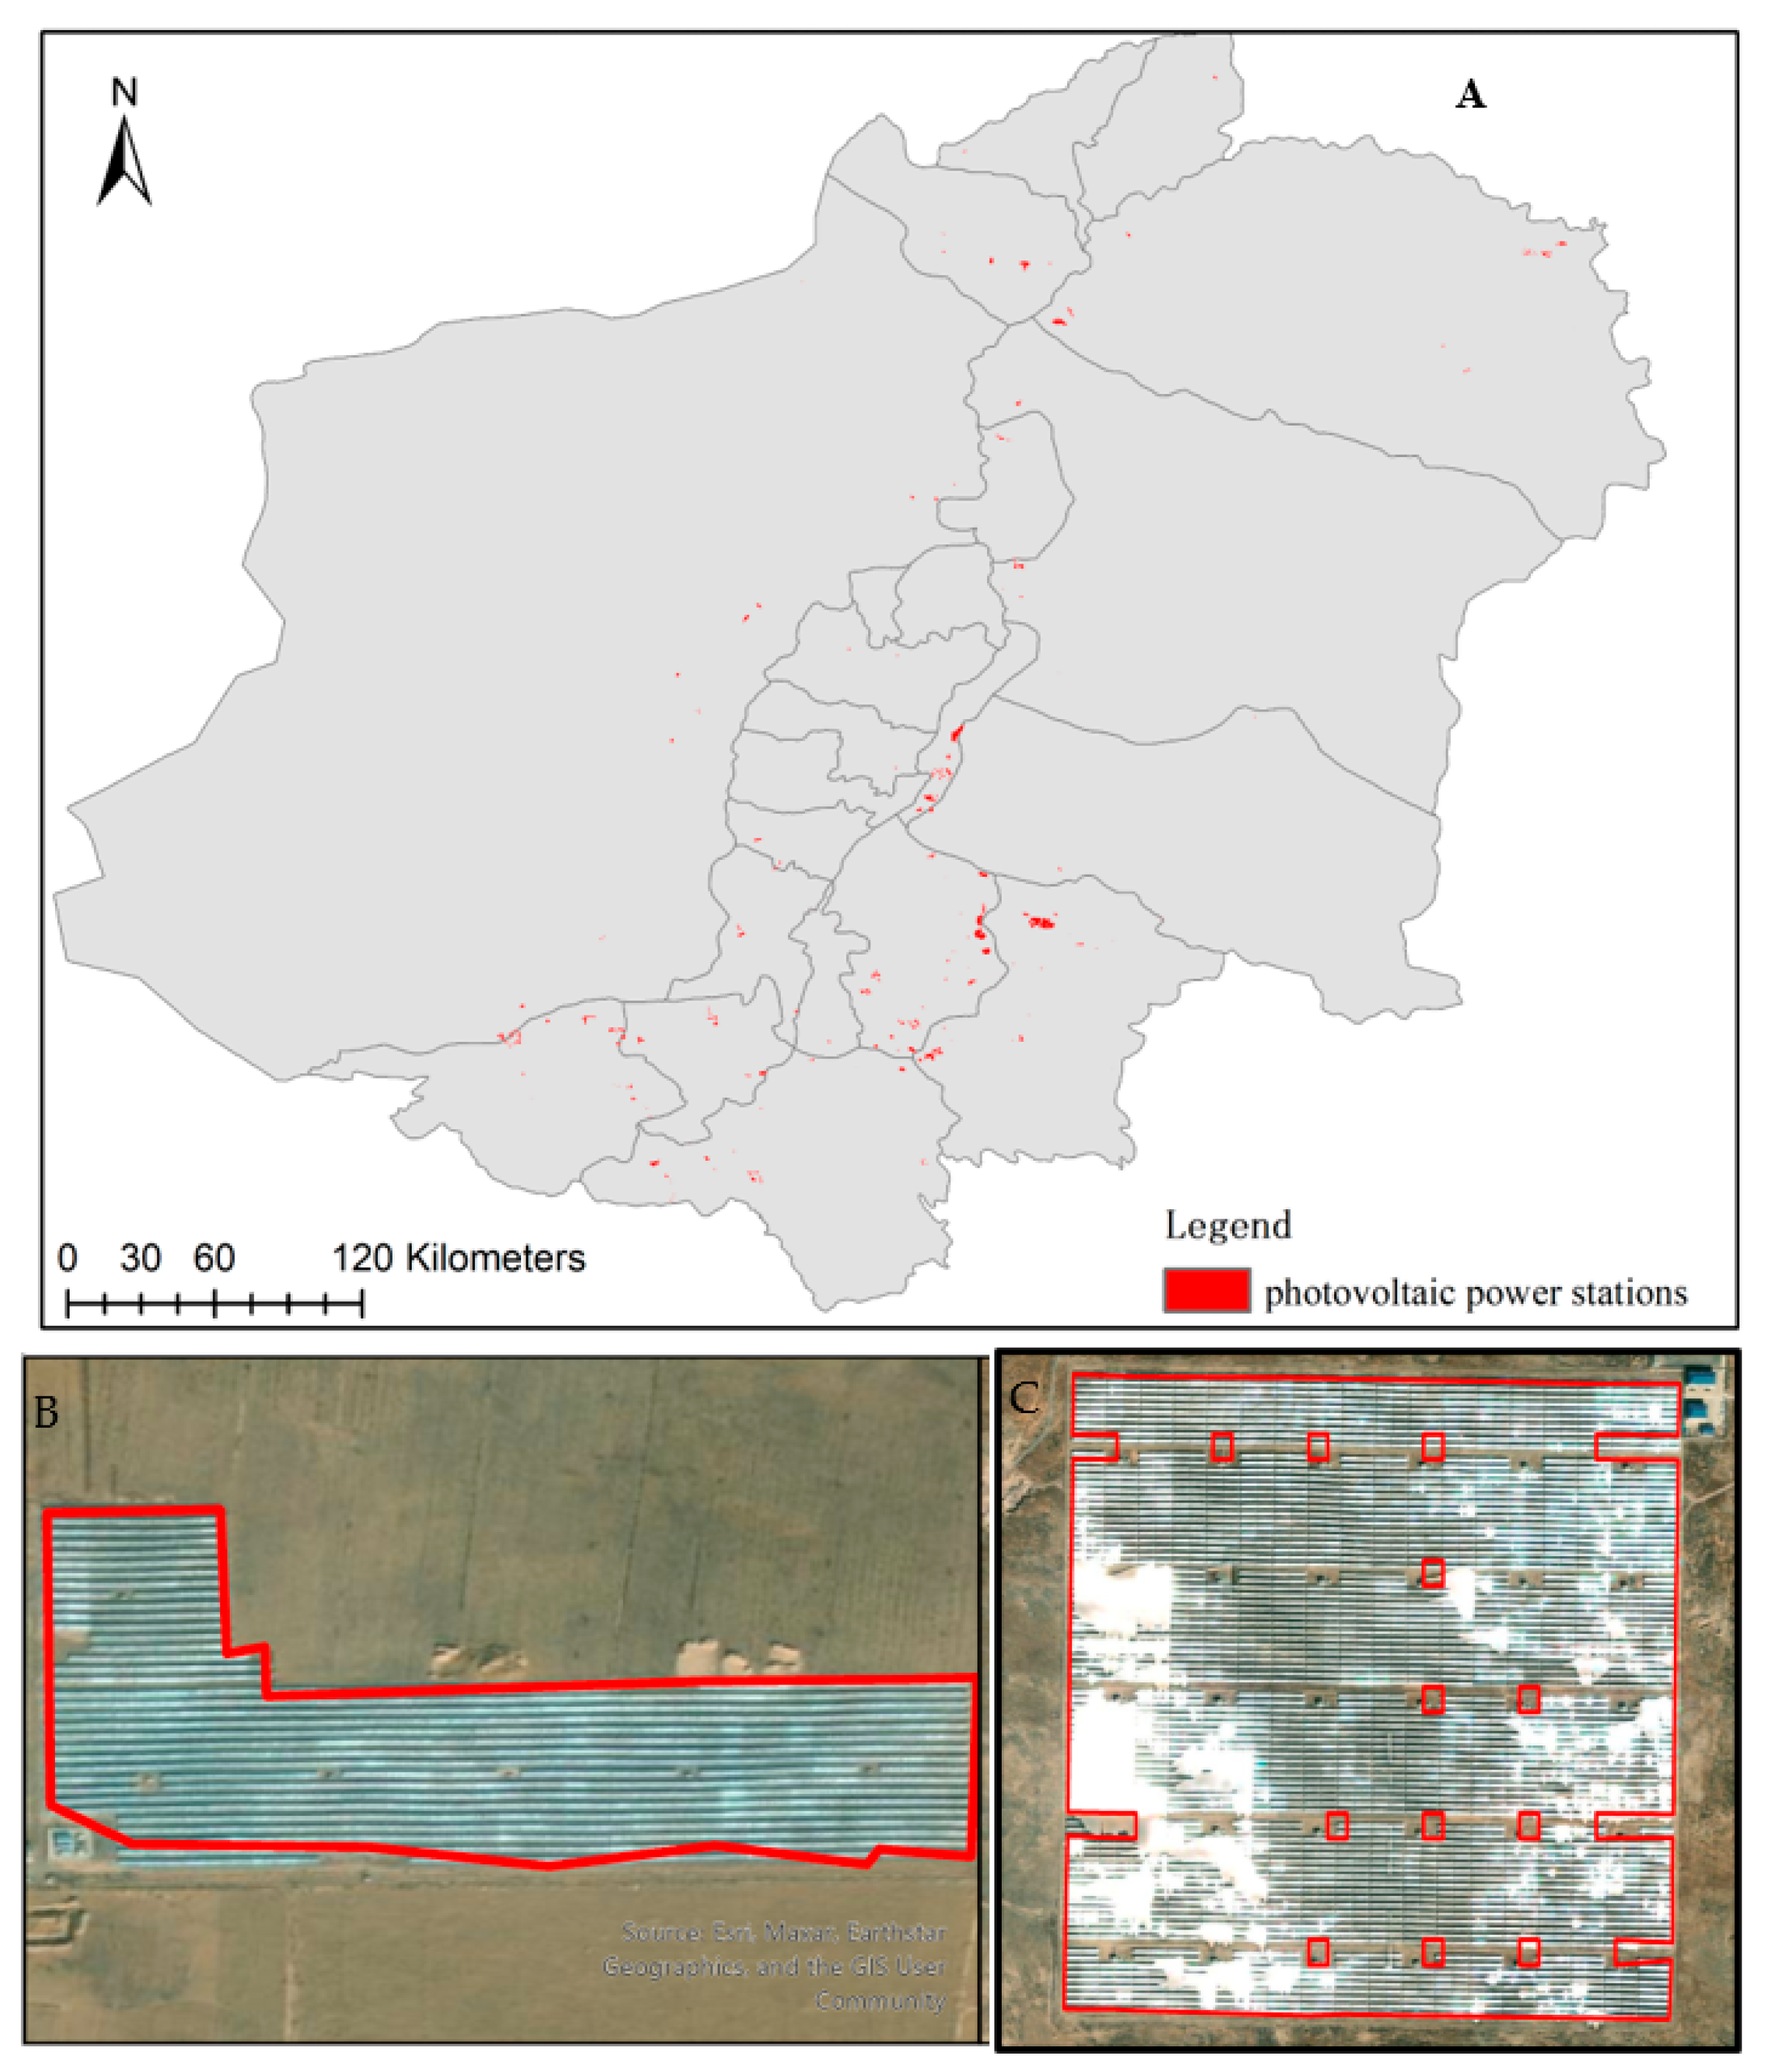
4.1. Mapping of PV Power Stations
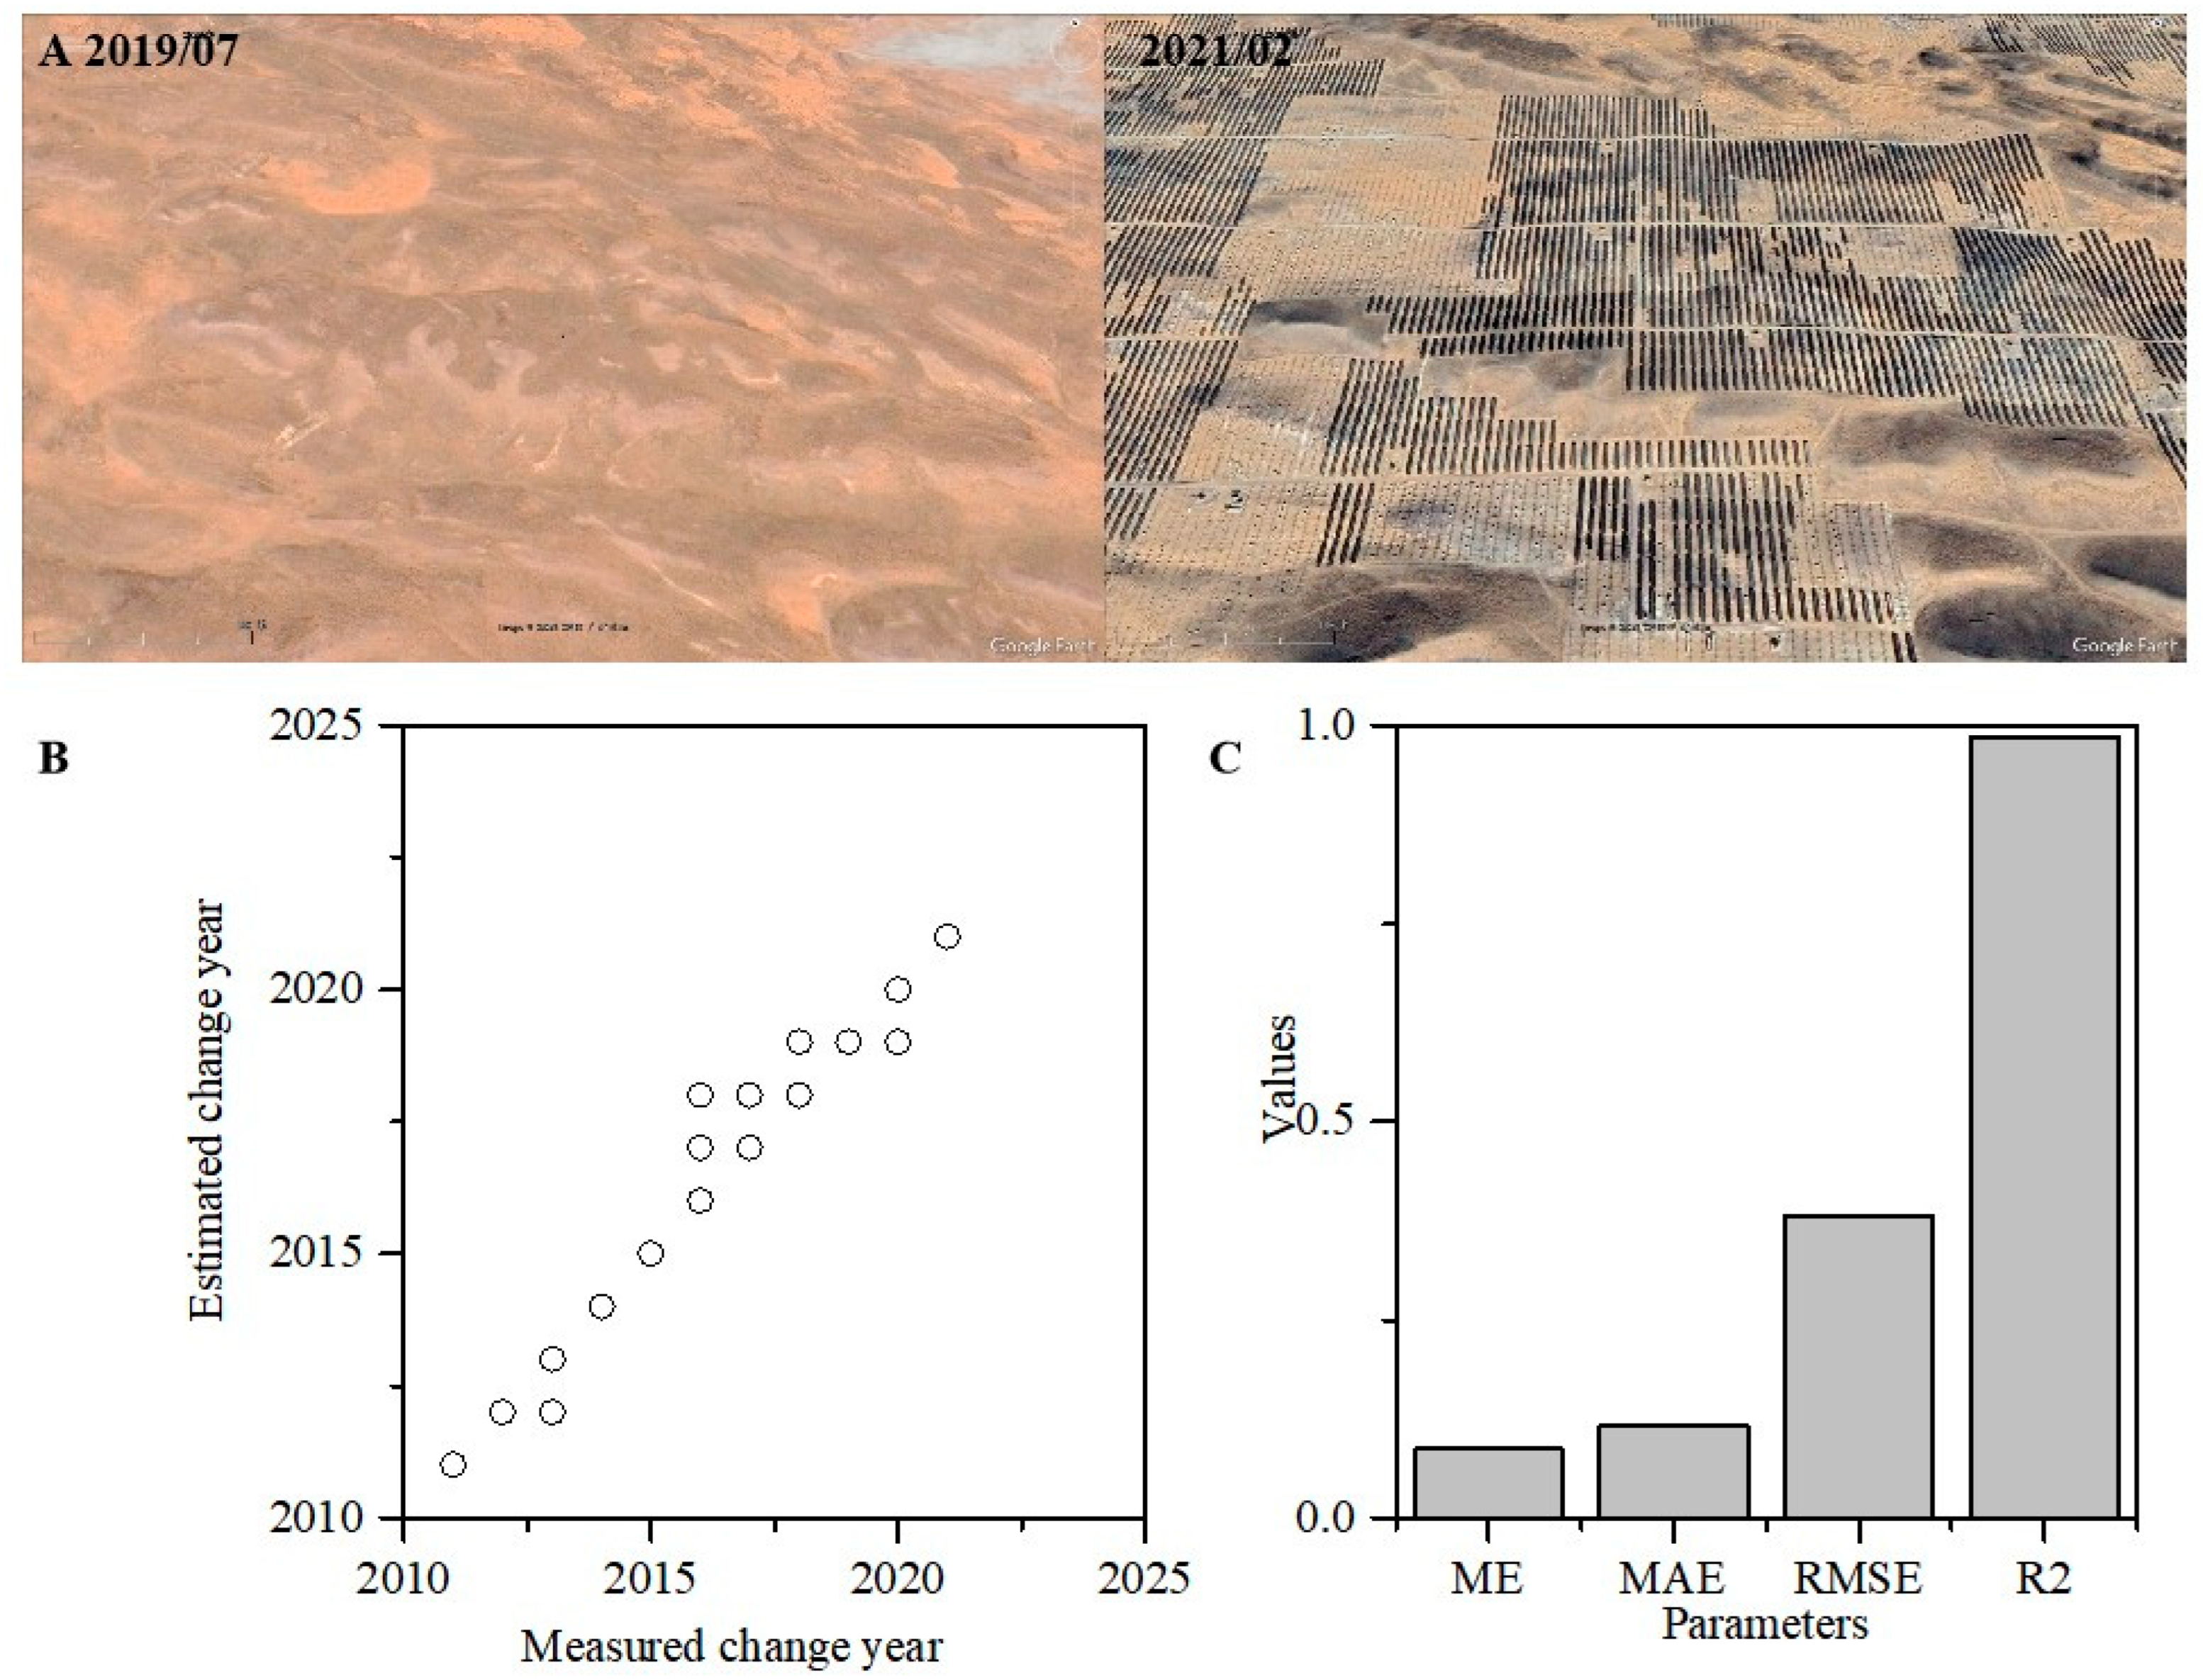
4.1.1. Accuracy Assessment and Verification
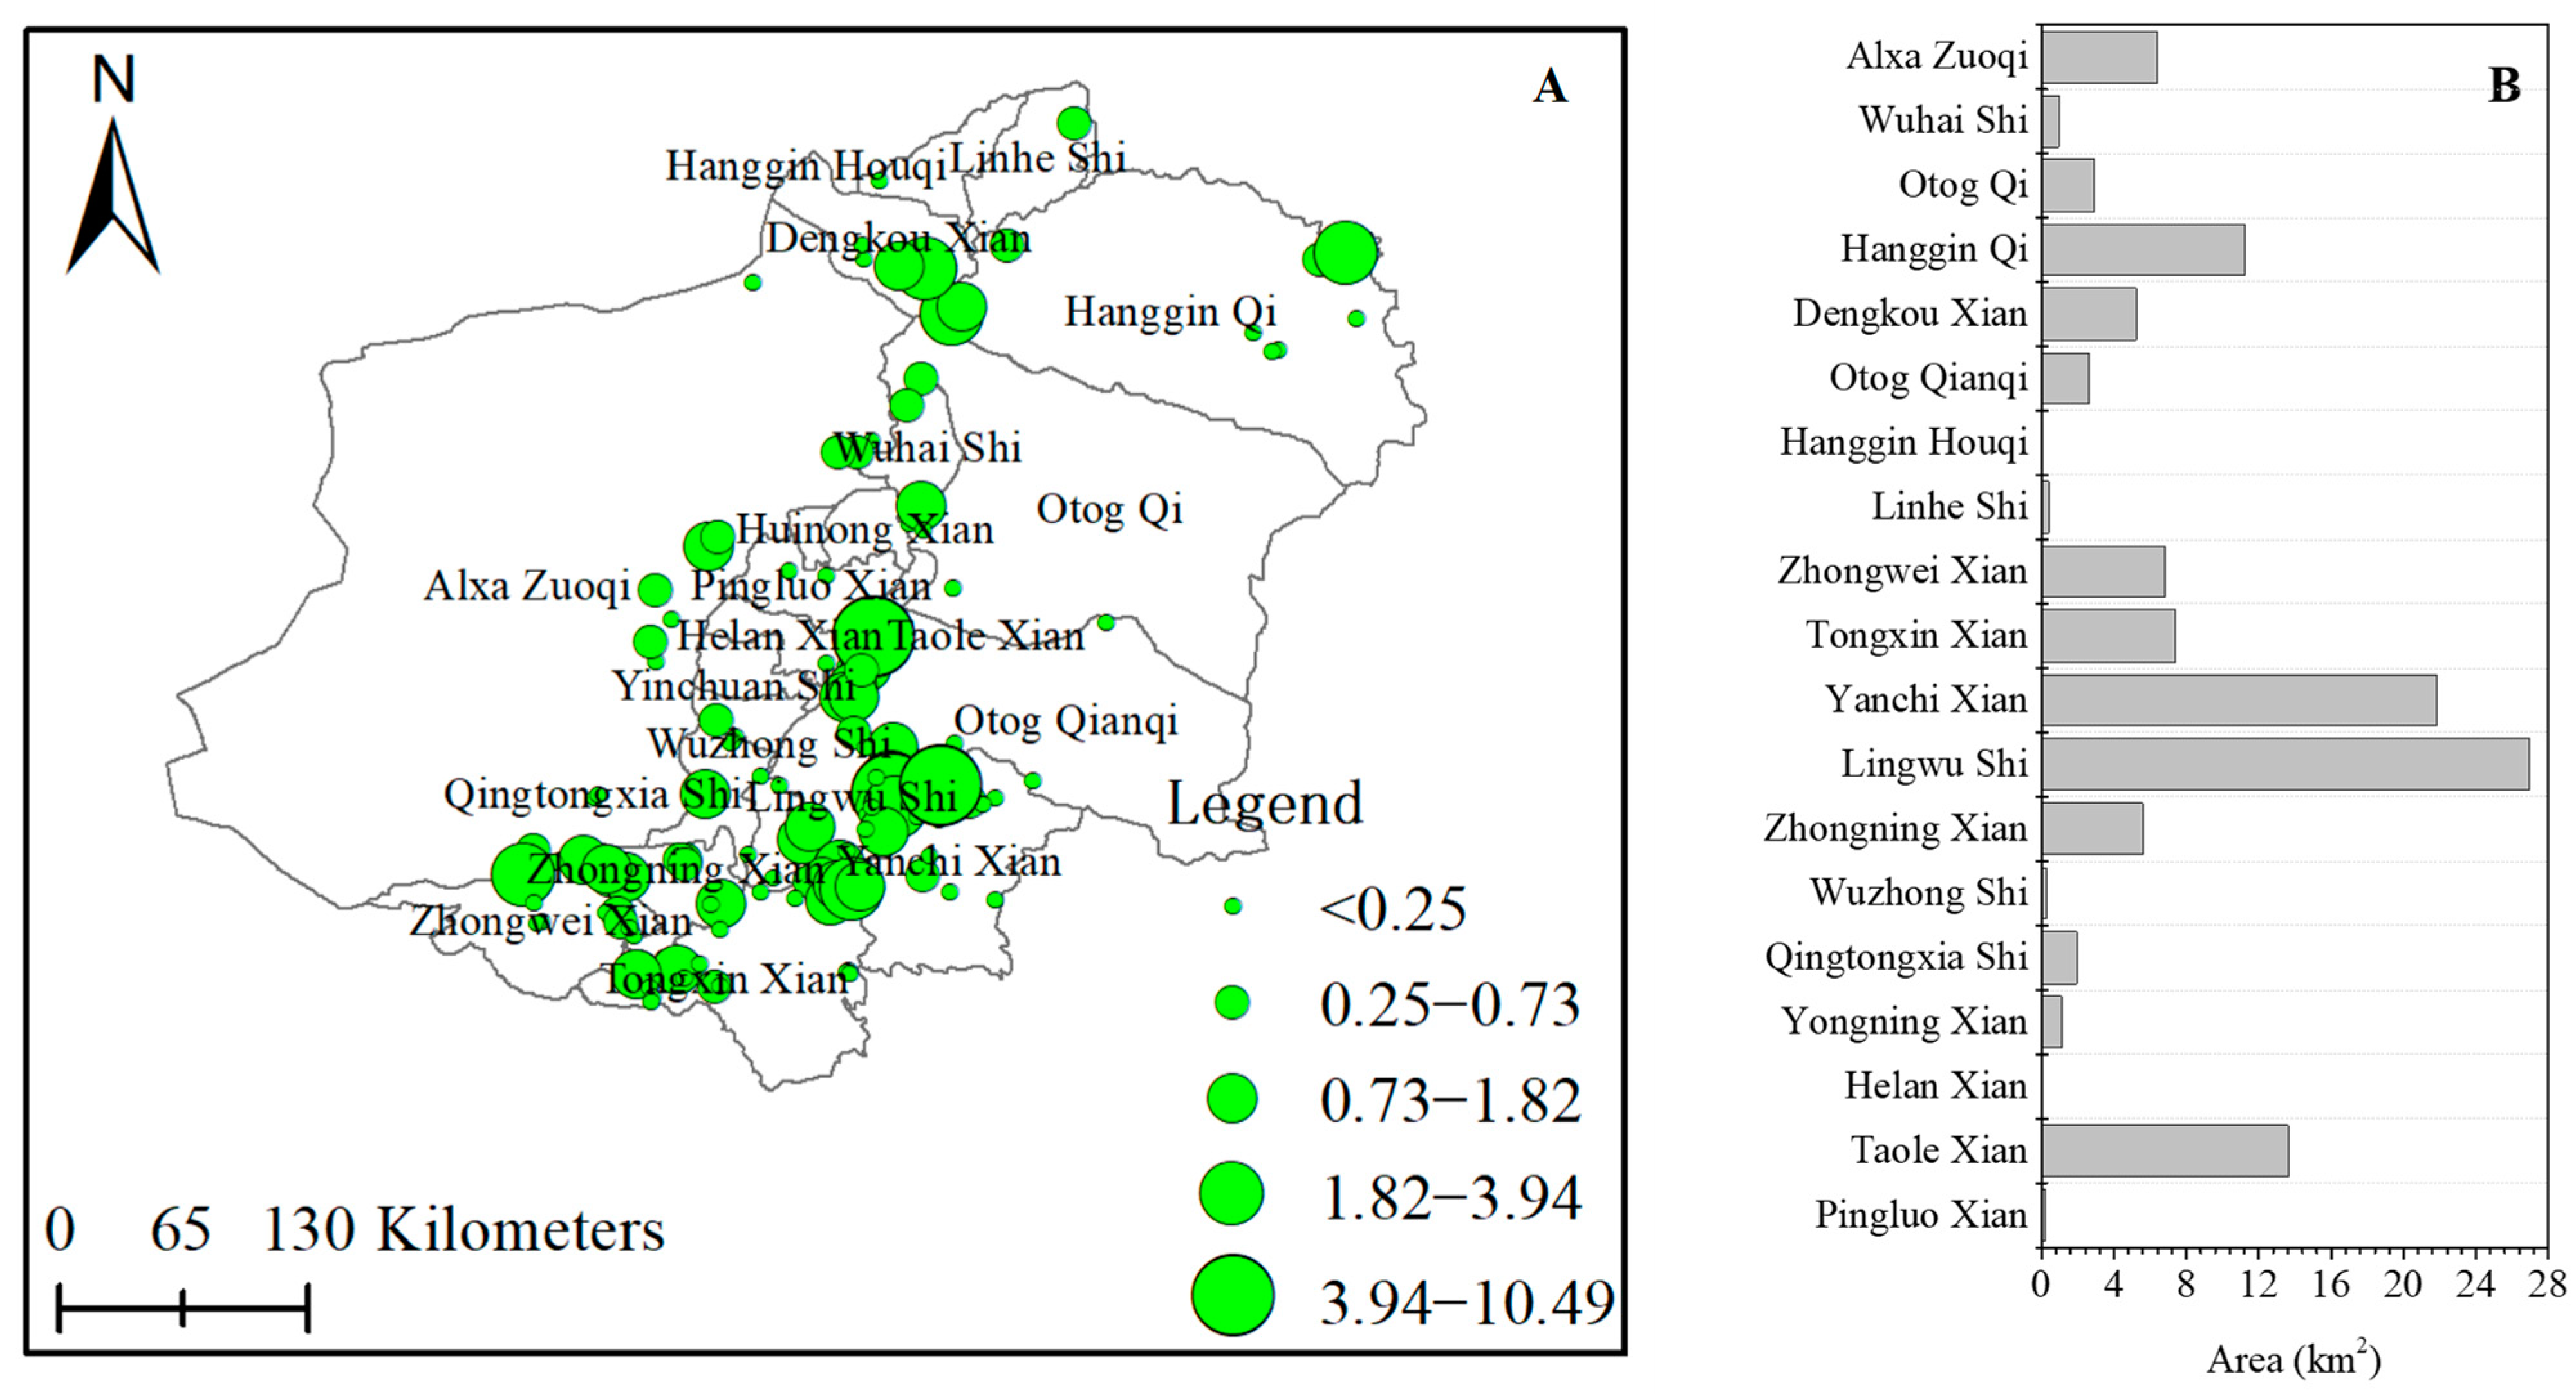
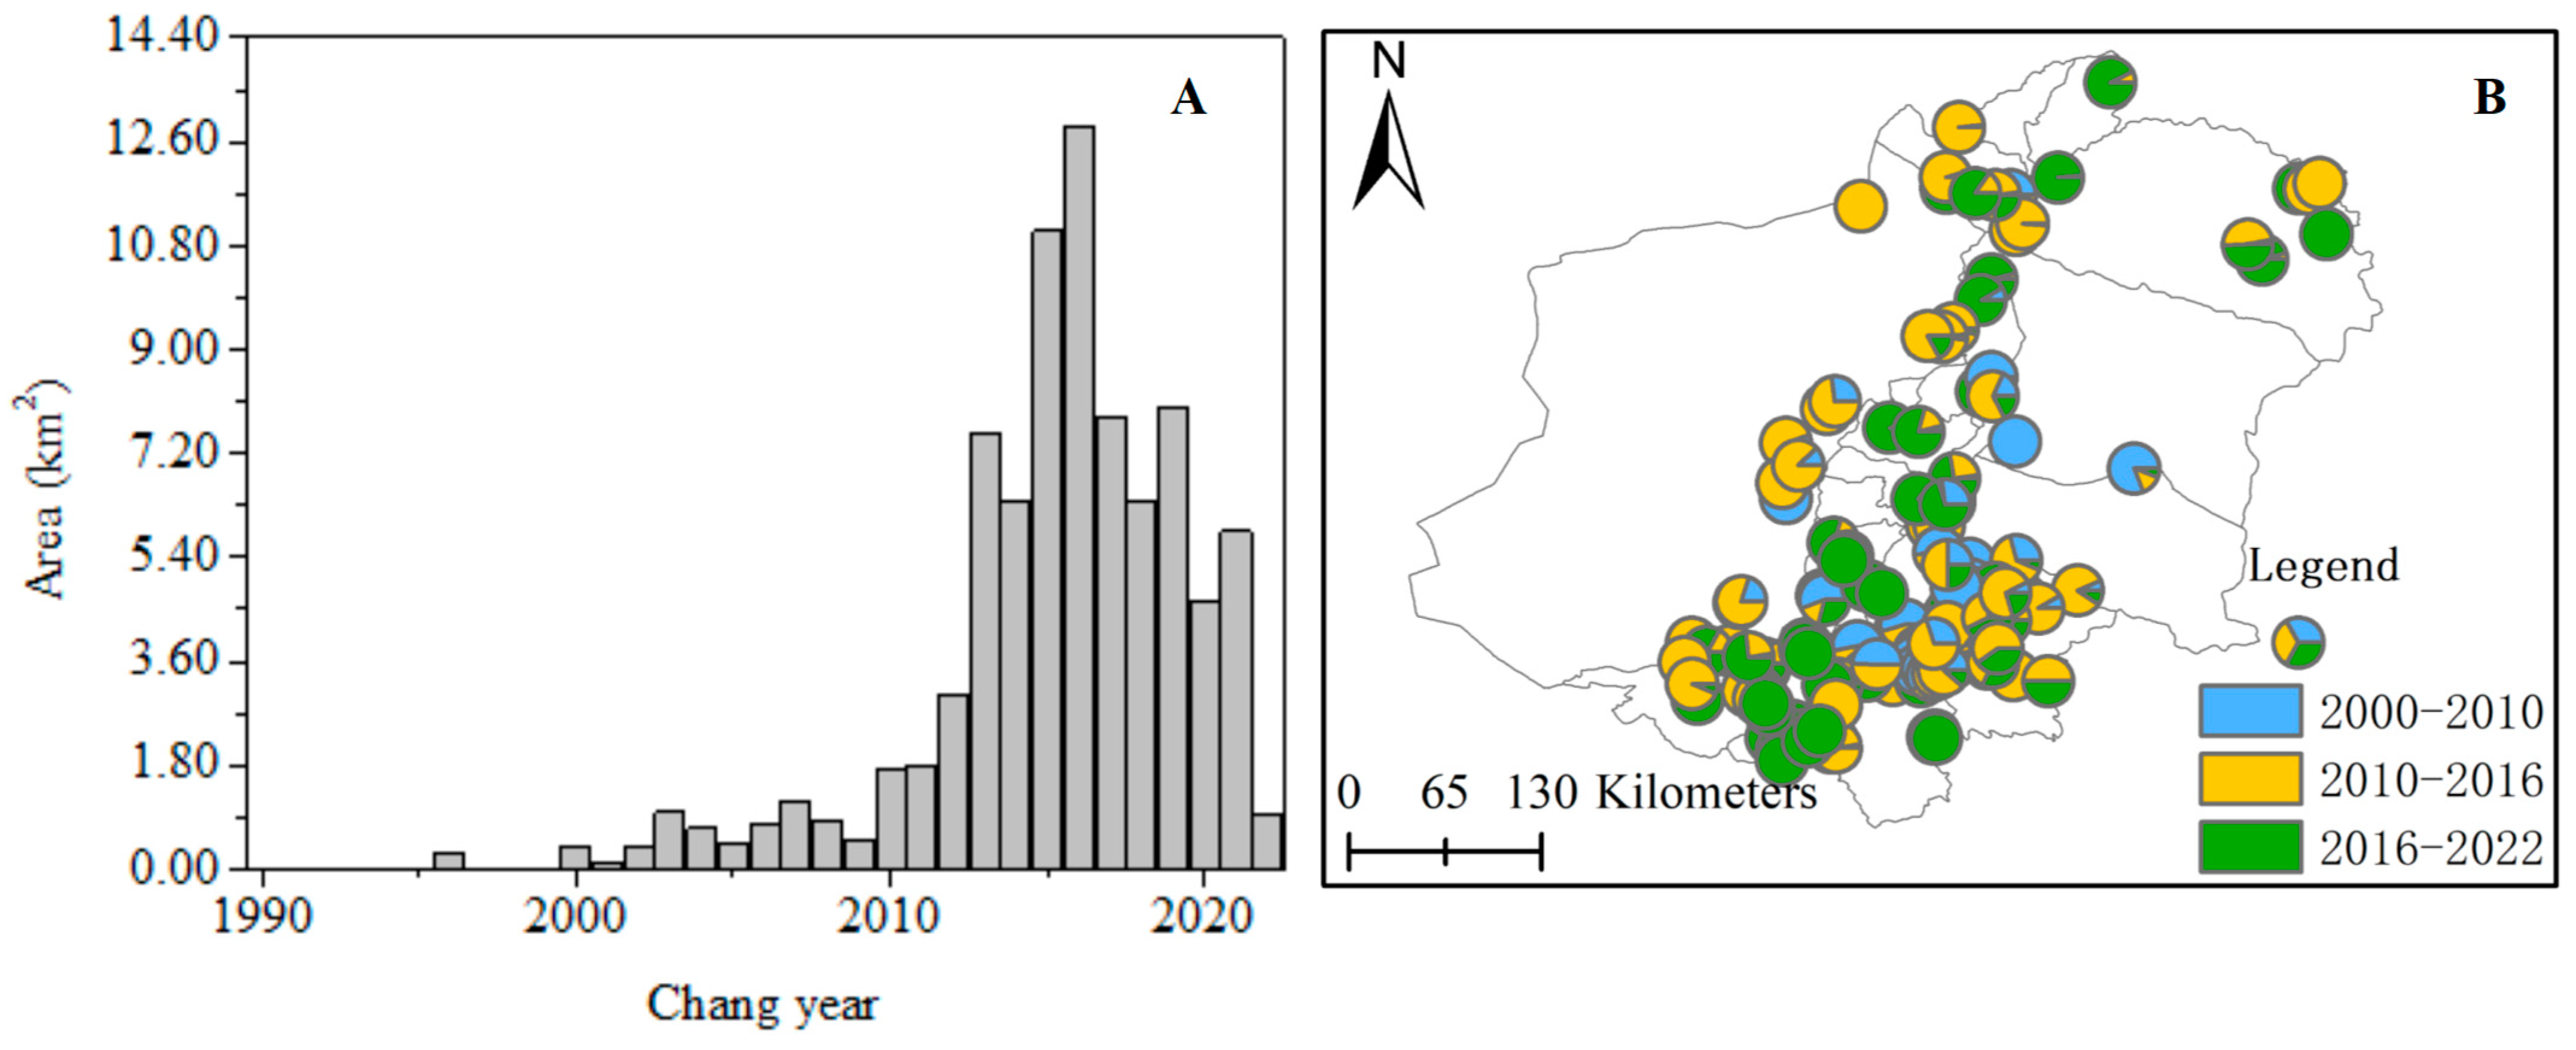
4.1.2. Distribution of PV Power Stations
4.2. Construction and Identification of PV Power Stations
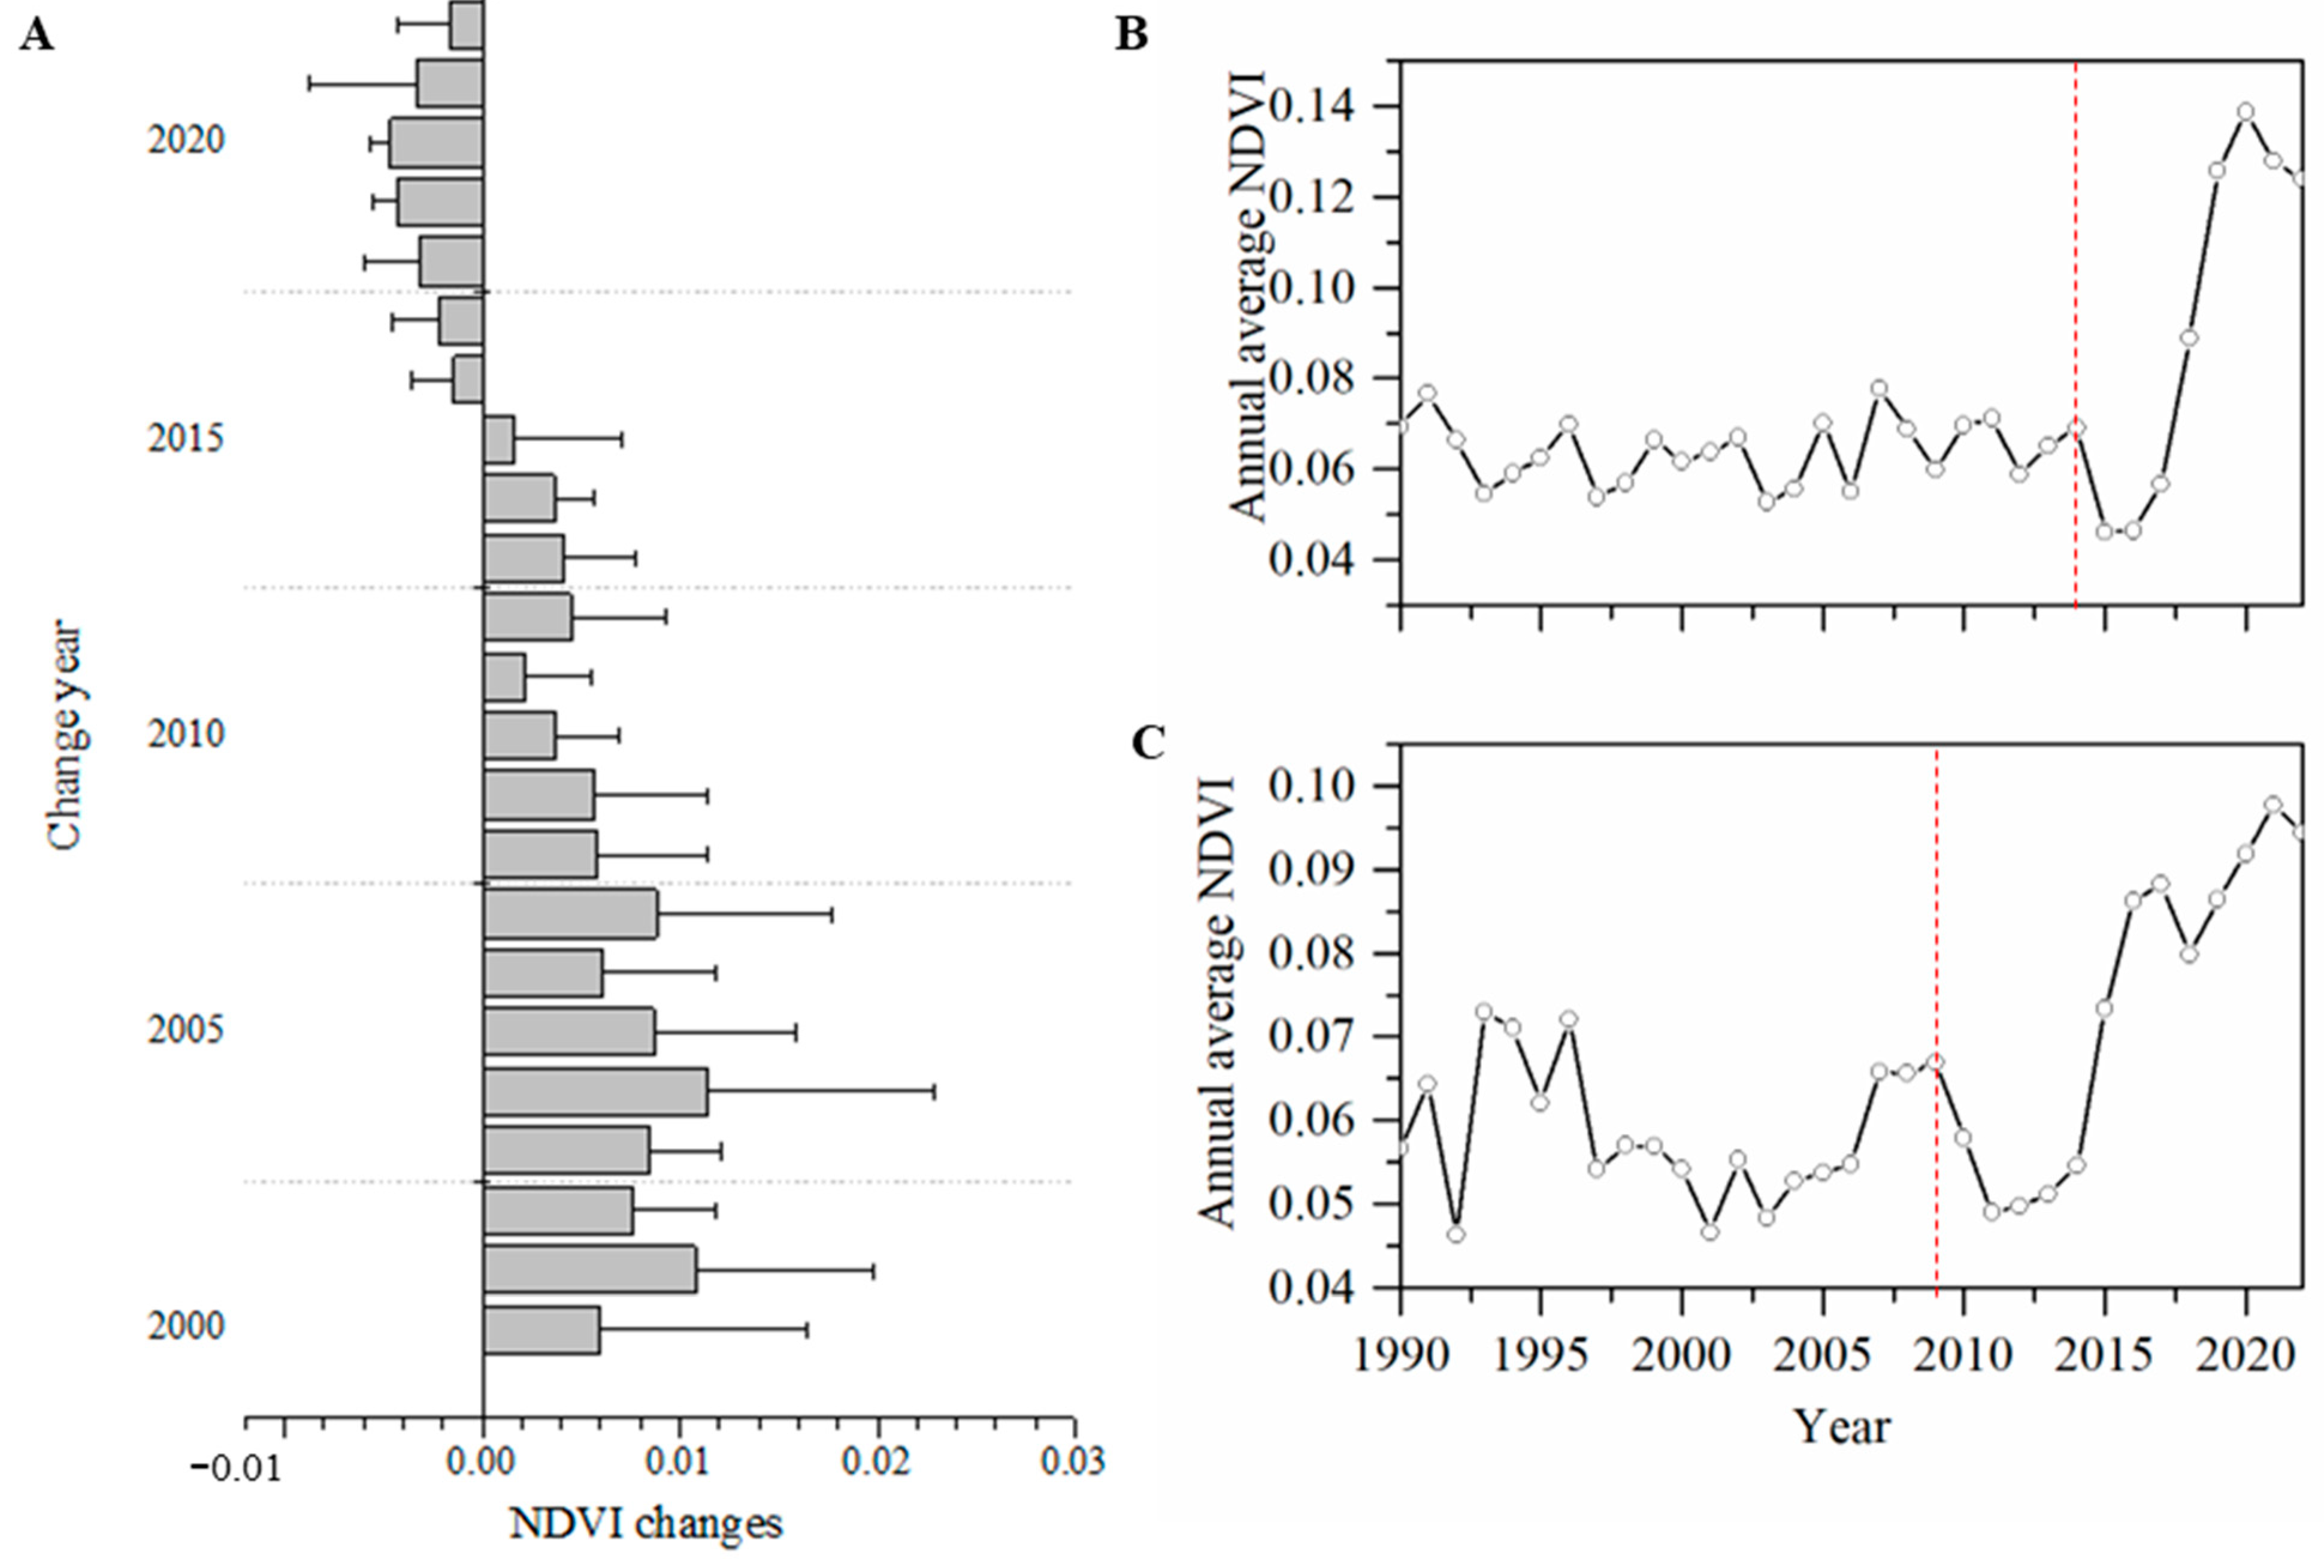
4.3. Vegetation Condition Change in PV Power Stations Constructed in Different Years
5. Discussion
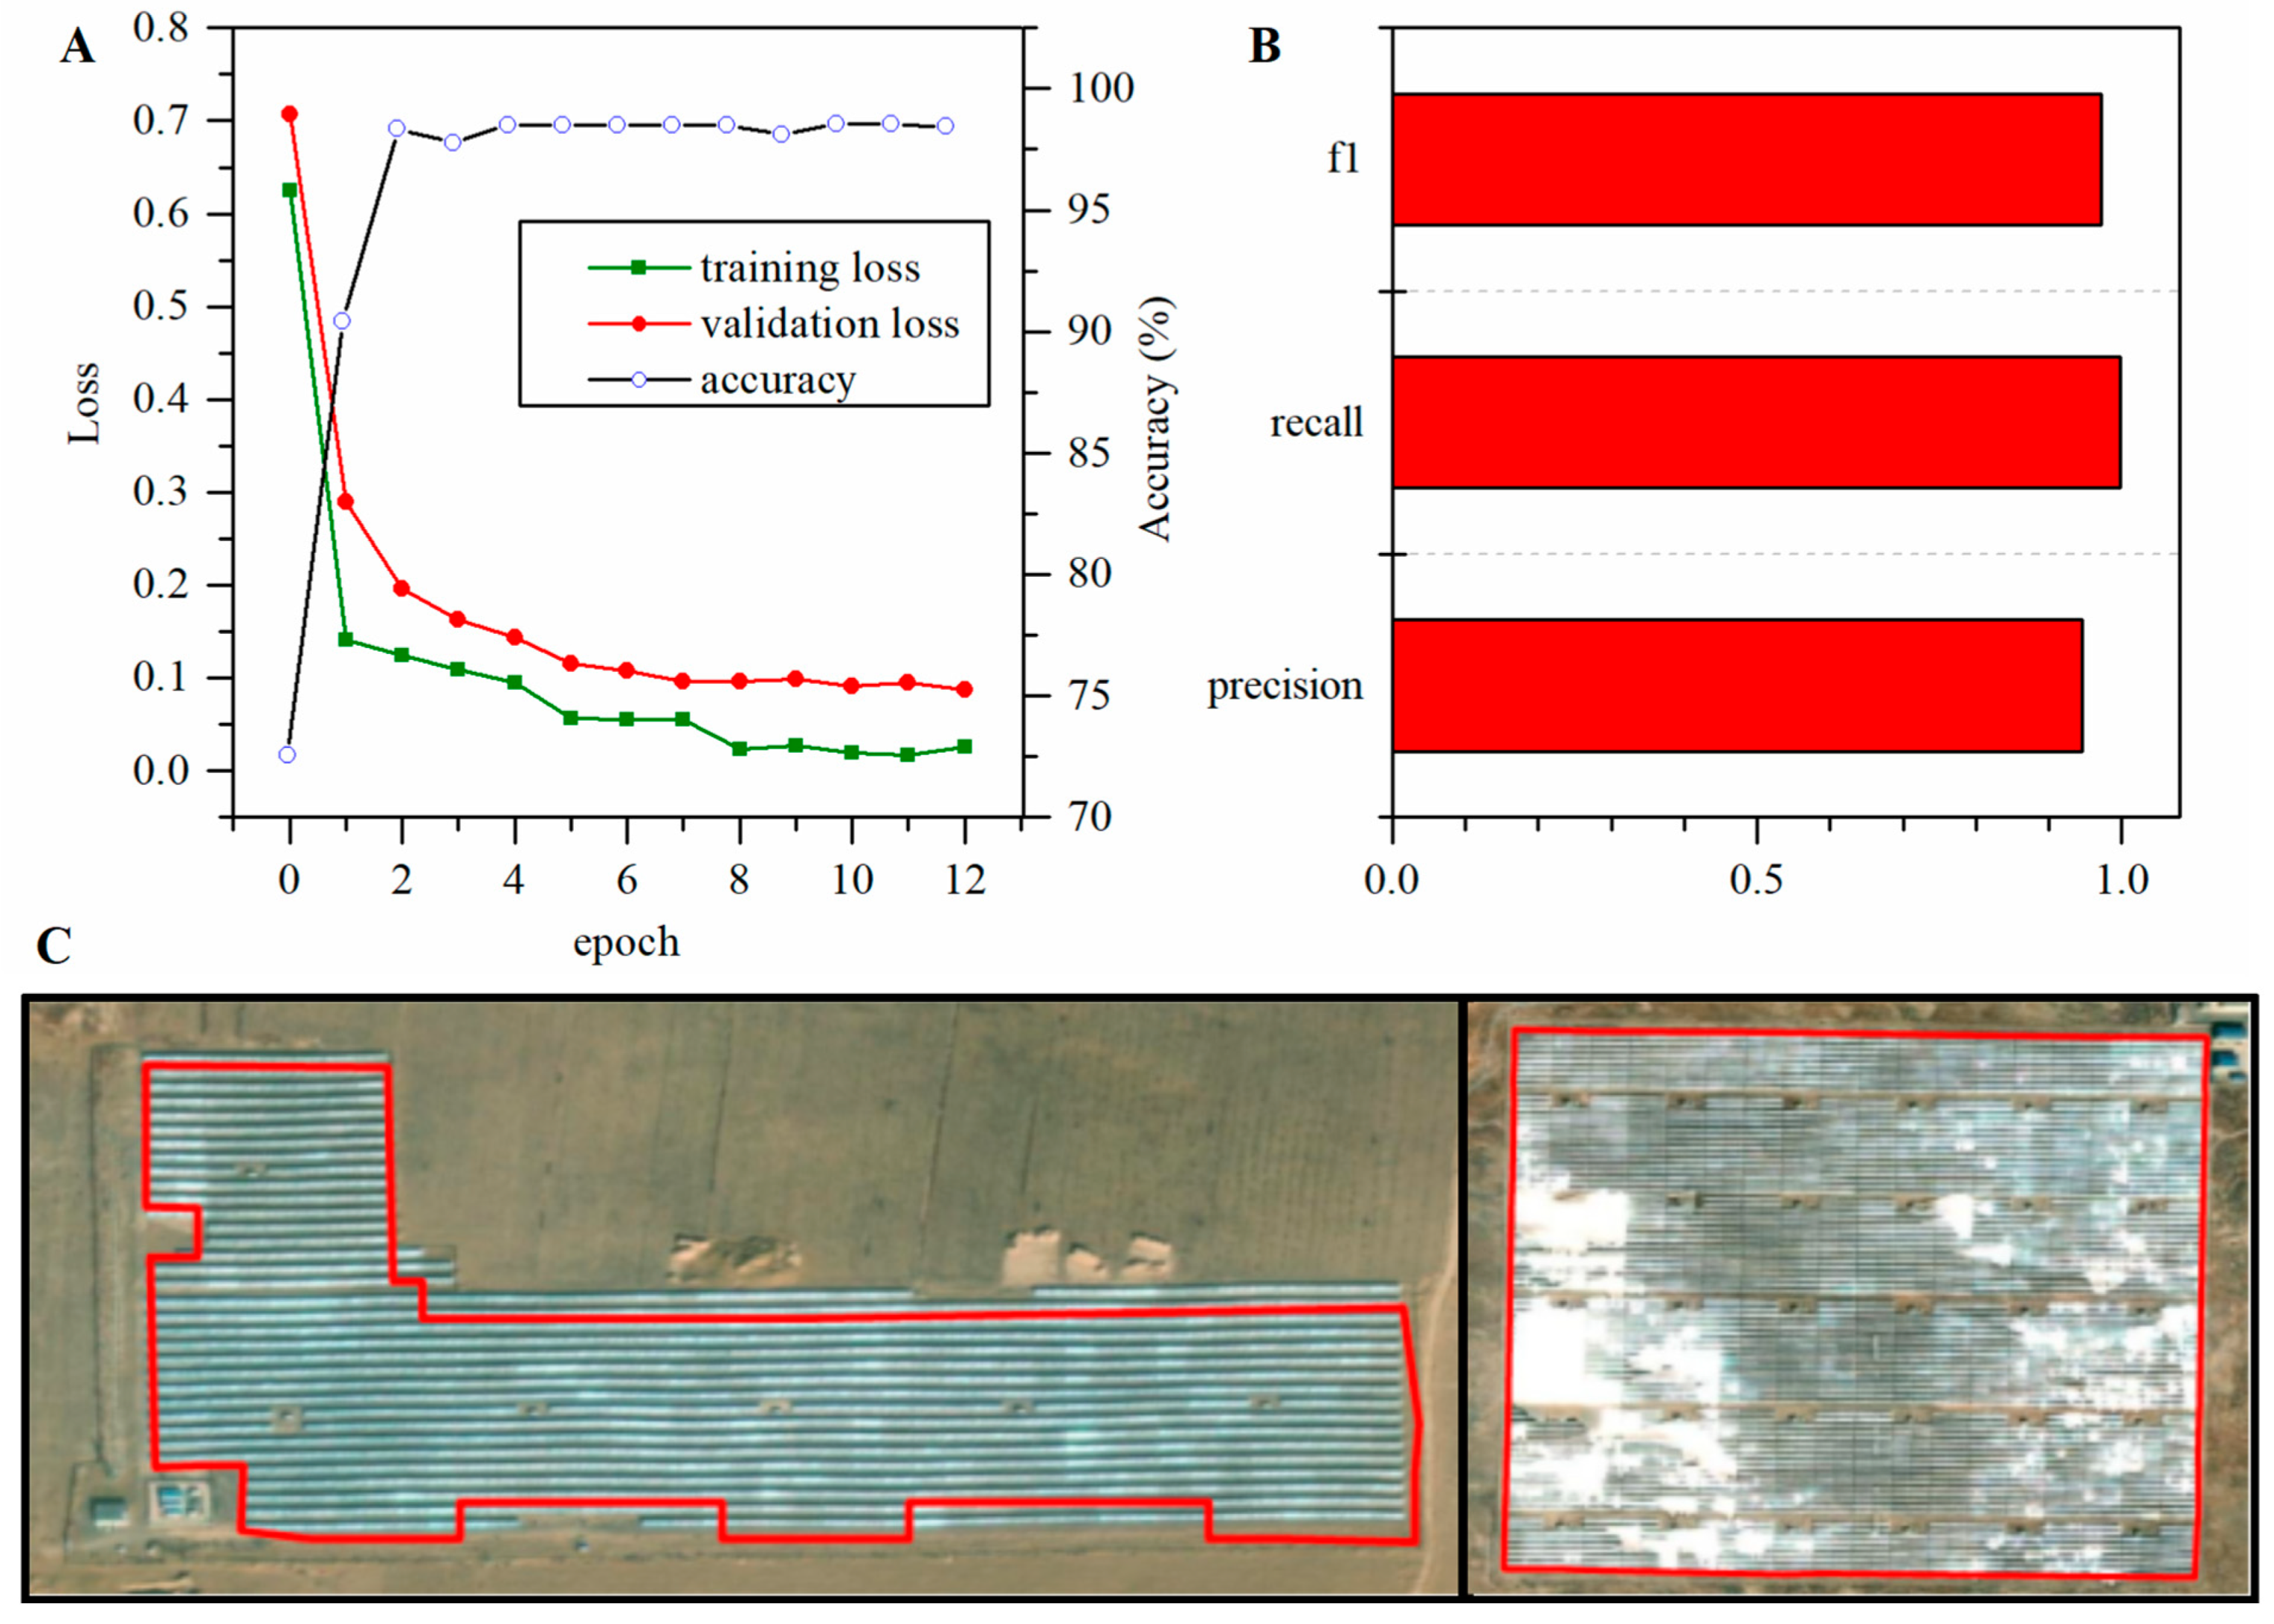
5.1. Comparison between the RF Model and the Deep Learning Model
5.2. Characterizing the Development of PV Power Stations
5.3. Ecological Effects of PV Power Station Construction
6. Conclusions
Author Contributions
Funding
Data Availability Statement
Acknowledgments
Conflicts of Interest
References
- Tao, S.; Rogan, J.; Ye, S.; Geron, N. Mapping photovoltaic power stations and assessing their environmental impacts from multi-sensor datasets in Massachusetts, United States. Remote Sens. Appl. Soc. Environ. 2023, 30, 100937. [Google Scholar] [CrossRef]
- Shahsavari, A.; Akbari, M. Potential of solar energy in developing countries for reducing energy-related emissions. Renew. Sustain. Energy Rev. 2018, 90, 275–291. [Google Scholar] [CrossRef]
- Bahadori, A.; Nwaoha, C. A review on solar energy utilisation in Australia. Renew. Sustain. Energy Rev. 2013, 18, 1–5. [Google Scholar] [CrossRef]
- Panwar, N.L.; Kaushik, S.C.; Kothari, S. Role of renewable energy sources in environmental protection: A review. Renew. Sustain. Energy Rev. 2011, 15, 1513–1524. [Google Scholar] [CrossRef]
- Wang, Y.; Gao, M.; Wang, J.; Wang, S.; Tan, Z. Measurement and key influencing factors of the economic benefits for China’s photovoltaic power generation: A LCOE-based hybrid model. Renew. Energy 2021, 169, 935–952. [Google Scholar] [CrossRef]
- Xu, M. Texture Is Important in Improving the Accuracy of Mapping Photovoltaic Power Plants: A Case Study of Ningxia Autonomous Region, China. Remote Sens. 2021, 13, 3909. [Google Scholar] [CrossRef]
- Jiang, W.; Tian, B.; Duan, Y.; Chen, C.; Hu, Y. Rapid mapping and spatial analysis on the distribution of photovoltaic power stations with Sentinel-1&2 images in Chinese coastal provinces. Int. J. Appl. Earth Obs. Geoinf. 2023, 118, 103280. [Google Scholar] [CrossRef]
- Xia, Z.; Li, Y.; Zhang, W.; Chen, R.; Guo, S.; Zhang, P.; Du, P. Solar photovoltaic program helps turn deserts green in China: Evidence from satellite monitoring. J. Environ. Manag. 2022, 324, 116338. [Google Scholar] [CrossRef] [PubMed]
- Hu, Y.; Tian, B.; Yuan, L.; Li, X.; Sun, C. Mapping coastal salt marshes in China using time series of Sentinel-1 SAR. ISPRS J. Photogramm. Remote Sens. 2021, 173, 122–134. [Google Scholar] [CrossRef]
- Bradbury, K.; Saboo, R.; Johnson, T.L.; Malof, J.M.; Devarajan, A.; Zhang, W.; Collins, L.M.; Newell, R.G. Distributed solar photovoltaic array location and extent dataset for remote sensing object identification. Sci. Data 2016, 3, 160106. [Google Scholar] [CrossRef] [PubMed] [Green Version]
- Jie, Y.; Liu, A.; Huang, Q.; Chen, J.; Meng, Y.; Deng, Y.; Yu, Z. Photovoltaic power station identification using refined encoder-decoder network with channel attention and chained residual dilated convolutions. J. Appl. Remote Sens. 2020, 14, 6506. [Google Scholar] [CrossRef]
- Jie, Y.; Ji, X.; Yue, A.; Chen, J.; Zhang, Y. Combined Multi-Layer Feature Fusion and Edge Detection Method for Distributed Photovoltaic Power Station Identification. Energies 2020, 13, 6742. [Google Scholar] [CrossRef]
- Lima, M.; Fernandez-Ramirez, L.M.; Carvalho, P.; Batista, J.G.; Freitas, D.M. A comparison between Deep Learning and Support Vector Regression Techniques applied to solar forecast in Spain. J. Sol. Energy Eng. 2022, 144, 010802. [Google Scholar] [CrossRef]
- Zhang, X.; Han, L.; Han, L.; Zhu, L. How Well Do Deep Learning-Based Methods for Land Cover Classification and Object Detection Perform on High Resolution Remote Sensing Imagery? Remote Sens. 2020, 12, 417. [Google Scholar] [CrossRef] [Green Version]
- Zhu, R.; Guo, D.; Wong, M.S.; Qian, Z.; Chen, M.; Yang, B.; Chen, B.; Zhang, H.; You, L.; Heo, J.; et al. Deep solar PV refiner: A detail-oriented deep learning network for refined segmentation of photovoltaic areas from satellite imagery. Int. J. Appl. Earth Obs. Geoinf. 2023, 116, 103134. [Google Scholar] [CrossRef]
- Xia, Z.; Li, Y.; Chen, R.; Sengupta, D.; Guo, X.; Xiong, B.; Niu, Y. Mapping the rapid development of photovoltaic power stations in northwestern China using remote sensing. Energy Rep. 2022, 8, 4117–4127. [Google Scholar] [CrossRef]
- Xia, Z.; Li, Y.; Guo, X.; Chen, R. High-resolution mapping of water photovoltaic development in China through satellite imagery. Int. J. Appl. Earth Obs. Geoinf. 2022, 107, 102707. [Google Scholar] [CrossRef]
- Gorelick, N.; Hancher, M.; Dixon, M.; Ilyushchenko, S.; Thau, D.; Moore, R. Google Earth Engine: Planetary-scale geospatial analysis for everyone. Remote Sens. Environ. 2017, 202, 18–27. [Google Scholar] [CrossRef]
- Xu, L.; Herold, M.; Tsendbazar, N.-E.; Masiliūnas, D.; Li, L.; Lesiv, M.; Fritz, S.; Verbesselt, J. Time series analysis for global land cover change monitoring: A comparison across sensors. Remote Sens. Environ. 2022, 271, 112905. [Google Scholar] [CrossRef]
- Verbesselt, J.; Hyndman, R.; Newnham, G.; Culvenor, D. Detecting trend and seasonal changes in satellite image time series. Remote Sens. Environ. 2010, 114, 106–115. [Google Scholar] [CrossRef]
- Jamali, S.; Jönsson, P.; Eklundh, L.; Ardö, J.; Seaquist, J. Detecting changes in vegetation trends using time series segmentation. Remote Sens. Environ. 2015, 156, 182–195. [Google Scholar] [CrossRef]
- Kazemzadeh, M.; Noori, Z.; Alipour, H.; Jamali, S.; Seyednasrollah, B. Natural and anthropogenic forcings lead to contrasting vegetation response in long-term vs. short-term timeframes. J. Environ. Manag. 2021, 286, 112249. [Google Scholar] [CrossRef] [PubMed]
- Sun, Q.; Zhang, P.; Jiao, X.; Han, W.; Sun, Y.; Sun, D. Identifying and understanding alternative states of dryland landscape: A hierarchical analysis of time series of fractional vegetation-soil nexuses in China’s Hexi Corridor. Landsc. Urban Plan. 2021, 215, 104225. [Google Scholar] [CrossRef]
- Kennedy, R.E.; Yang, Z.; Cohen, W.B. Detecting trends in forest disturbance and recovery using yearly Landsat time series: 1. LandTrendr—Temporal segmentation algorithms. Remote Sens. Environ. 2010, 114, 2897–2910. [Google Scholar] [CrossRef]
- Kennedy, R.E.; Yang, Z.; Gorelick, N.; Braaten, J.; Cavalcante, L.; Cohen, W.B.; Healey, S. Implementation of the LandTrendr Algorithm on Google Earth Engine. Remote Sens. 2018, 10, 691. [Google Scholar] [CrossRef] [Green Version]
- Zha, Y.; Gao, J.; Ni, S. Use of normalized difference built-up index in automatically mapping urban areas from TM imagery. Int. J. Remote Sens. 2003, 24, 583–594. [Google Scholar] [CrossRef]
- Haralick, R.M.; Shanmugam, K.; Dinstein, I. Textural Features for Image Classification. Stud. Media Commun. 1973, SMC-3, 610–621. [Google Scholar] [CrossRef] [Green Version]
- Du, P.; Samat, A.; Waske, B.; Liu, S.; Li, Z. Random Forest and Rotation Forest for fully polarized SAR image classification using polarimetric and spatial features. ISPRS J. Photogramm. Remote Sens. 2015, 105, 38–53. [Google Scholar] [CrossRef]
- Tassi, A.; Vizzari, M. Object-Oriented LULC Classification in Google Earth Engine Combining SNIC, GLCM, and Machine Learning Algorithms. Remote Sens. 2020, 12, 3776. [Google Scholar] [CrossRef]
- Rodriguez-Galiano, V.F.; Chica-Olmo, M.; Abarca-Hernandez, F.; Atkinson, P.M.; Jeganathan, C. Random Forest classification of Mediterranean land cover using multi-seasonal imagery and multi-seasonal texture. Remote Sens. Environ. 2012, 121, 93–107. [Google Scholar] [CrossRef]
- Belgiu, M.; Drăguţ, L. Random forest in remote sensing: A review of applications and future directions. ISPRS J. Photogramm. Remote Sens. 2016, 114, 24–31. [Google Scholar] [CrossRef]
- Gislason, P.O.; Benediktsson, J.A.; Sveinsson, J.R. Random Forests for land cover classification. Pattern Recognit. Lett. 2006, 27, 294–300. [Google Scholar] [CrossRef]
- Phalke, A.R.; Özdoğan, M.; Thenkabail, P.S.; Erickson, T.; Gorelick, N.; Yadav, K.; Congalton, R.G. Mapping croplands of Europe, Middle East, Russia, and Central Asia using Landsat, Random Forest, and Google Earth Engine. ISPRS J. Photogramm. Remote Sens. 2020, 167, 104–122. [Google Scholar] [CrossRef]
- Matas-Granados, L.; Pizarro, M.; Cayuela, L.; Domingo, D.; Gómez, D.; García, M.B. Long-term monitoring of NDVI changes by remote sensing to assess the vulnerability of threatened plants. Biol. Conserv. 2022, 265, 109428. [Google Scholar] [CrossRef]
- Yang, Y.; Campana, P.E.; Yan, J. Potential of unsubsidized distributed solar PV to replace coal-fired power plants, and profits classification in Chinese cities. Renew. Sustain. Energy Rev. 2020, 131, 109967. [Google Scholar] [CrossRef]
- Zhang, H.; Zhang, X.; Yuan, J. Transition of China’s power sector consistent with Paris Agreement into 2050: Pathways and challenges. Renew. Sustain. Energy Rev. 2020, 132, 110102. [Google Scholar] [CrossRef]
- Xiong, Y.; Yang, X. Government subsidies for the Chinese photovoltaic industry. Energy Policy 2016, 99, 111–119. [Google Scholar] [CrossRef]
- Wang, Z.; Huang, F.; Liu, J.; Shuai, J.; Shuai, C. Does solar PV bring a sustainable future to the poor?—An empirical study of anti-poverty policy effects on environmental sustainability in rural China. Energy Policy 2020, 145, 111723. [Google Scholar] [CrossRef]
- Li, J.; Wang, Z.; Cheng, X.; Shuai, J.; Shuai, C.; Liu, J. Has solar PV achieved the national poverty alleviation goals? Empirical evidence from the performances of 52 villages in rural China. Energy 2020, 201, 117631. [Google Scholar] [CrossRef]
- Chen, X.-J.; Jia, L.-Q.; Jia, T.; Hao, Z.-G. An carbon neutrality industrial chain of “desert-photovoltaic power generation-ecological agriculture”: Practice from the Ulan Buh Desert, Dengkou, Inner Mongolia. China Geol. 2022, 5, 549–552. [Google Scholar] [CrossRef]


| Satellite Sensor | Spatial Resolution (m) | Revisit Period (Day) | Available Date Range (Year) | Number of Images |
|---|---|---|---|---|
| Landsat-5 | 30 | 16 | 1990–2011 | 6271 |
| Landsat-7 | 30 | 16 | 2012–2013 | 568 |
| Landsat-8 | 30 | 16 | 2014–2022 | 3191 |
| LandTrendr Parameter | Type | Set Values |
|---|---|---|
| Max Segments | Integer | 6 |
| Spike Threshold | Float | 0.9 |
| Vertex Count Overshoot | Integer | 3 |
| Prevent One Year Recovery | Boolean | true |
| Recovery Threshold | Float | 0.25 |
| Pval Threshold | Float | 0.05 |
| Best Model Proportion | Float | 0.75 |
| Min. Observations Needed | Integer | 6 |
| Ground Truth (Pixels) | Producer Accuracy | User Accuracy | ||
|---|---|---|---|---|
| PV Power Stations | Others | |||
| PV power stations | 1833 | 17 | 0.9165 | 0.9908 |
| Others | 167 | 3483 | 0.9951 | 0.9542 |
| Overall accuracy | 0.9665 | |||
| Kappa | 0.9264 | |||
Disclaimer/Publisher’s Note: The statements, opinions and data contained in all publications are solely those of the individual author(s) and contributor(s) and not of MDPI and/or the editor(s). MDPI and/or the editor(s) disclaim responsibility for any injury to people or property resulting from any ideas, methods, instructions or products referred to in the content. |
© 2023 by the authors. Licensee MDPI, Basel, Switzerland. This article is an open access article distributed under the terms and conditions of the Creative Commons Attribution (CC BY) license (https://creativecommons.org/licenses/by/4.0/).
Share and Cite
Ma, S.; Liu, J.; Zhang, P.; Tu, X.; Zhou, J.; Liu, Y.; Zheng, Y. Characterizing the Development of Photovoltaic Power Stations and Their Impacts on Vegetation Conditions from Landsat Time Series during 1990–2022. Remote Sens. 2023, 15, 3101. https://doi.org/10.3390/rs15123101
Ma S, Liu J, Zhang P, Tu X, Zhou J, Liu Y, Zheng Y. Characterizing the Development of Photovoltaic Power Stations and Their Impacts on Vegetation Conditions from Landsat Time Series during 1990–2022. Remote Sensing. 2023; 15(12):3101. https://doi.org/10.3390/rs15123101
Chicago/Turabian StyleMa, Su, Junhui Liu, Ping Zhang, Xingyue Tu, Jianan Zhou, Yang Liu, and Yingjuan Zheng. 2023. "Characterizing the Development of Photovoltaic Power Stations and Their Impacts on Vegetation Conditions from Landsat Time Series during 1990–2022" Remote Sensing 15, no. 12: 3101. https://doi.org/10.3390/rs15123101