
Environmental and Volcanic Implications of Volatile Output in the Atmosphere of Vulcano Island Detected Using SO2 Plume (2021–23)

 , , and
Abstract
:1. Introduction
2. Materials and Methods
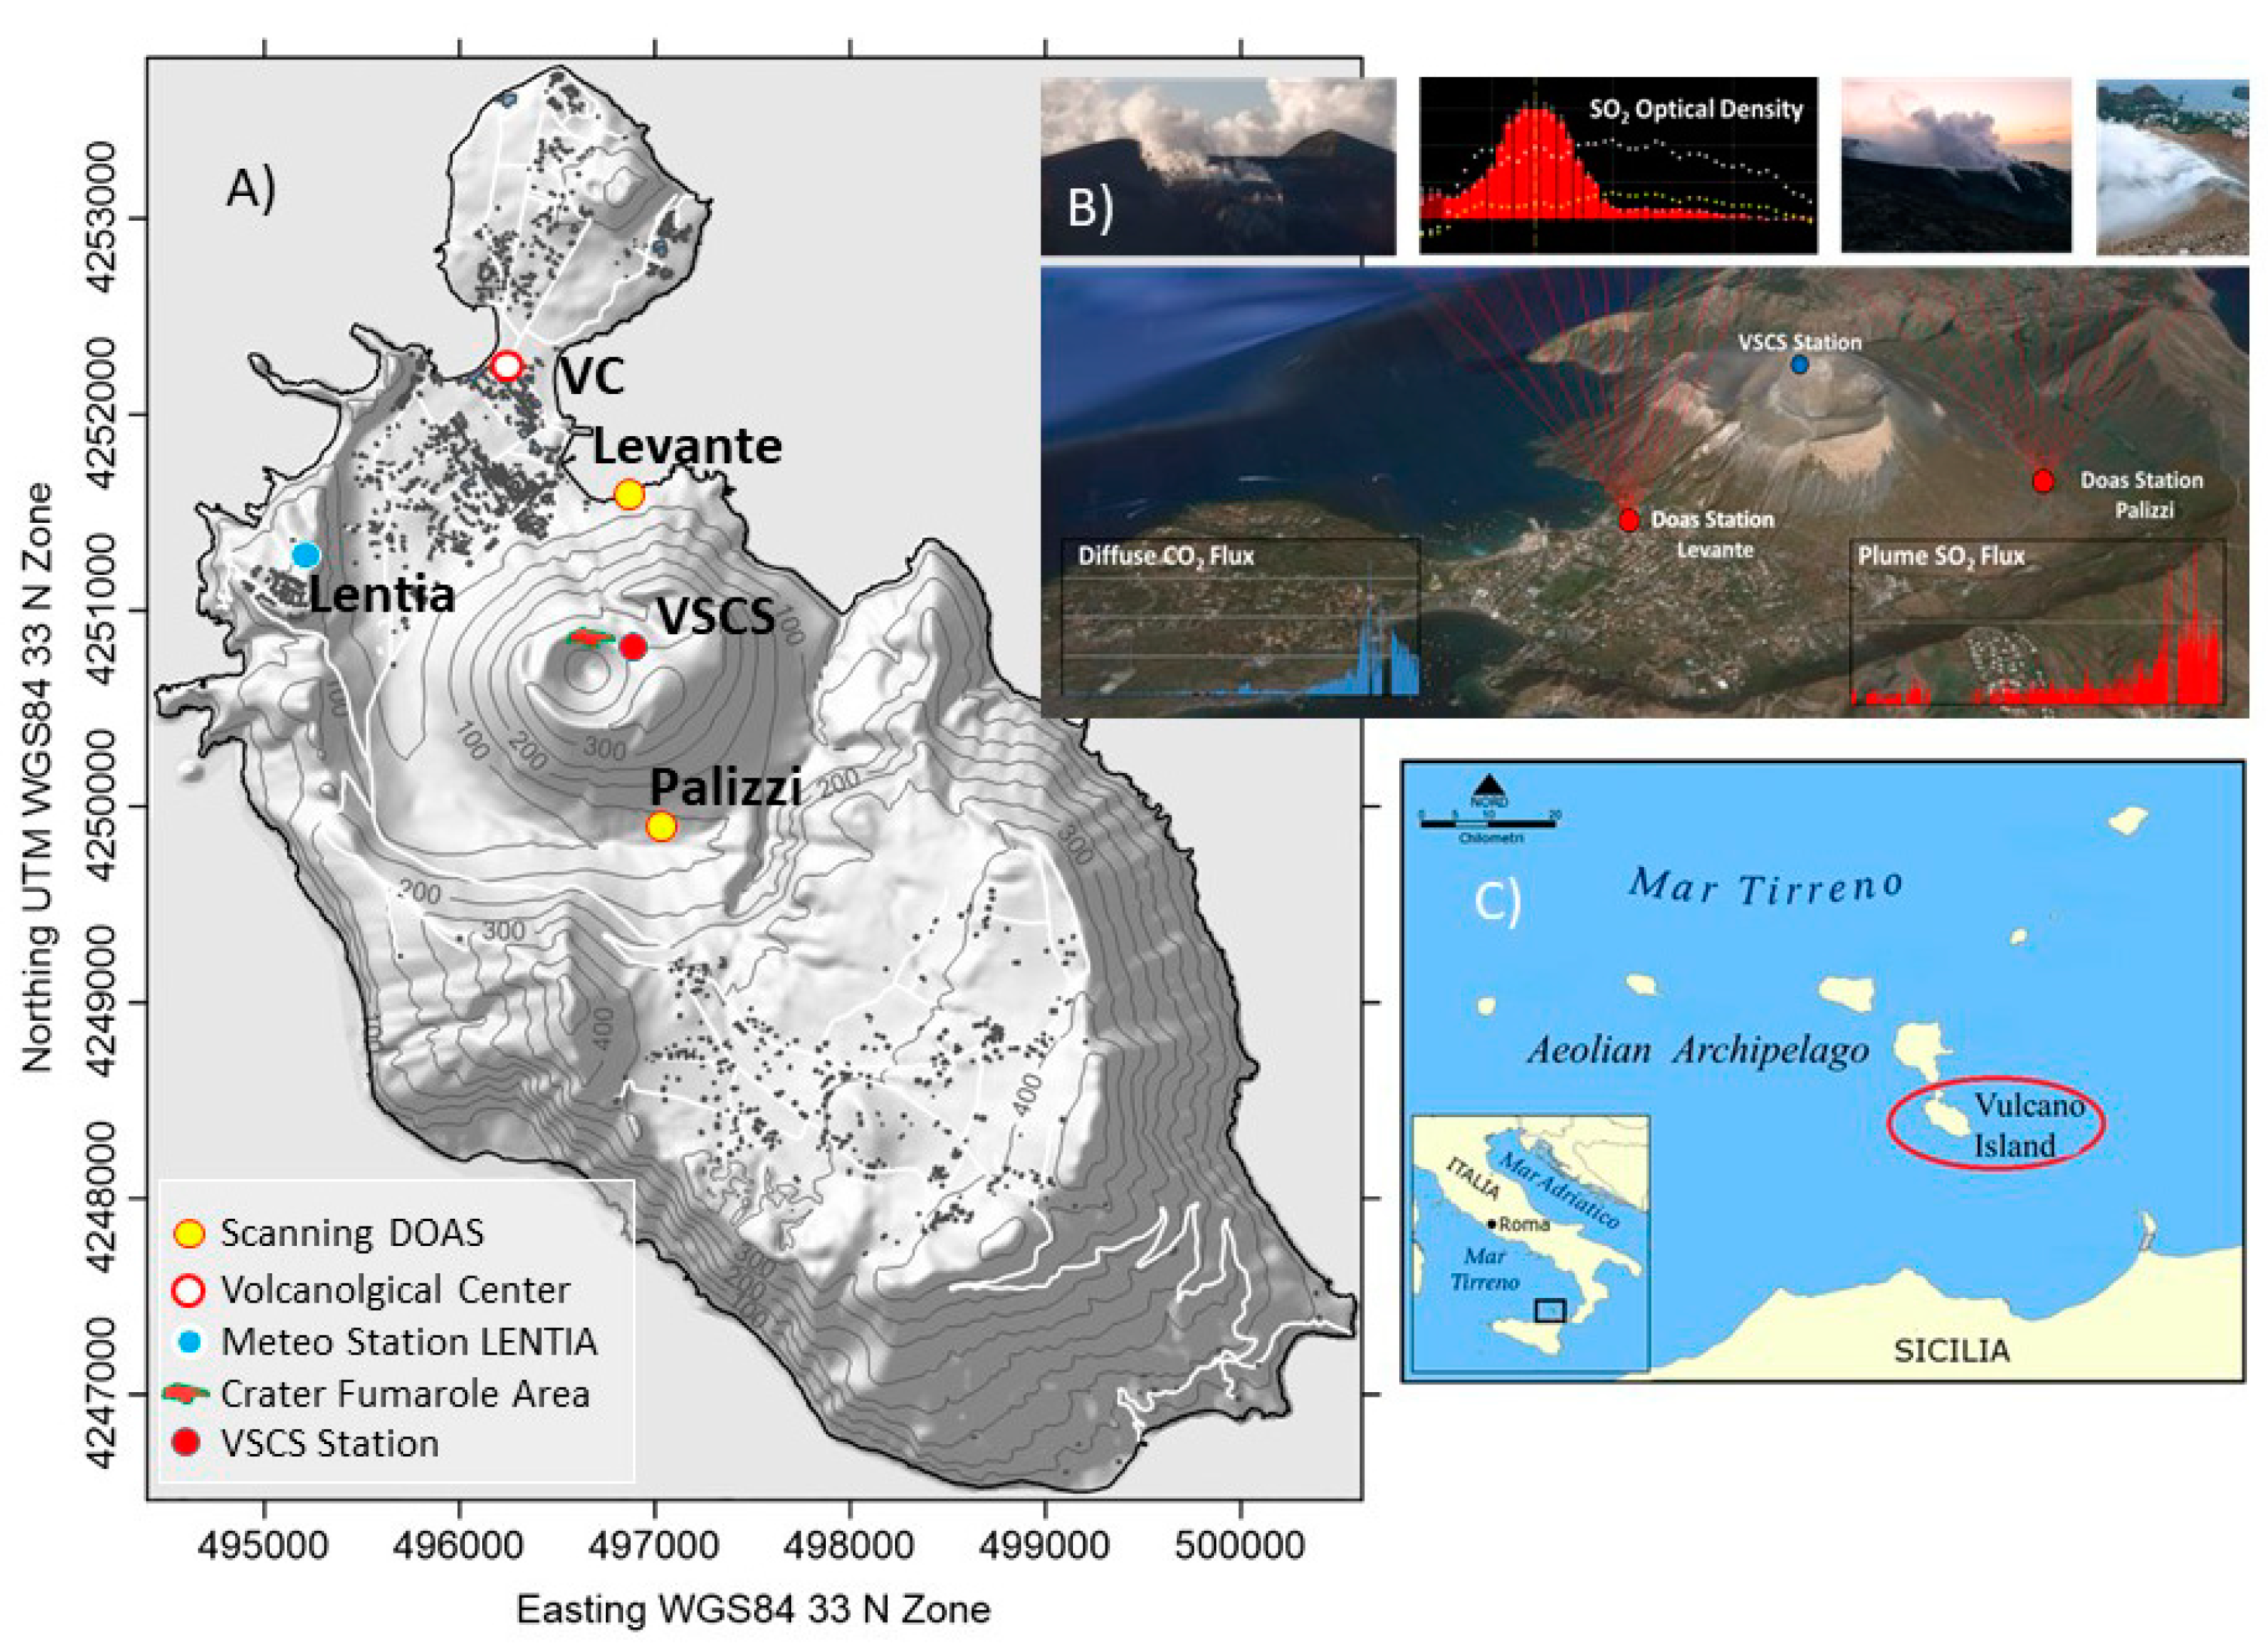
2.1. SO2 Output Network
2.2. Soil Summit CO2 Flux Monitoring
2.3. Air Dispersion Model
3. Results
3.1. Near Real-Time Monitoring of Plume SO2 Flux and Soil CO2 Flux
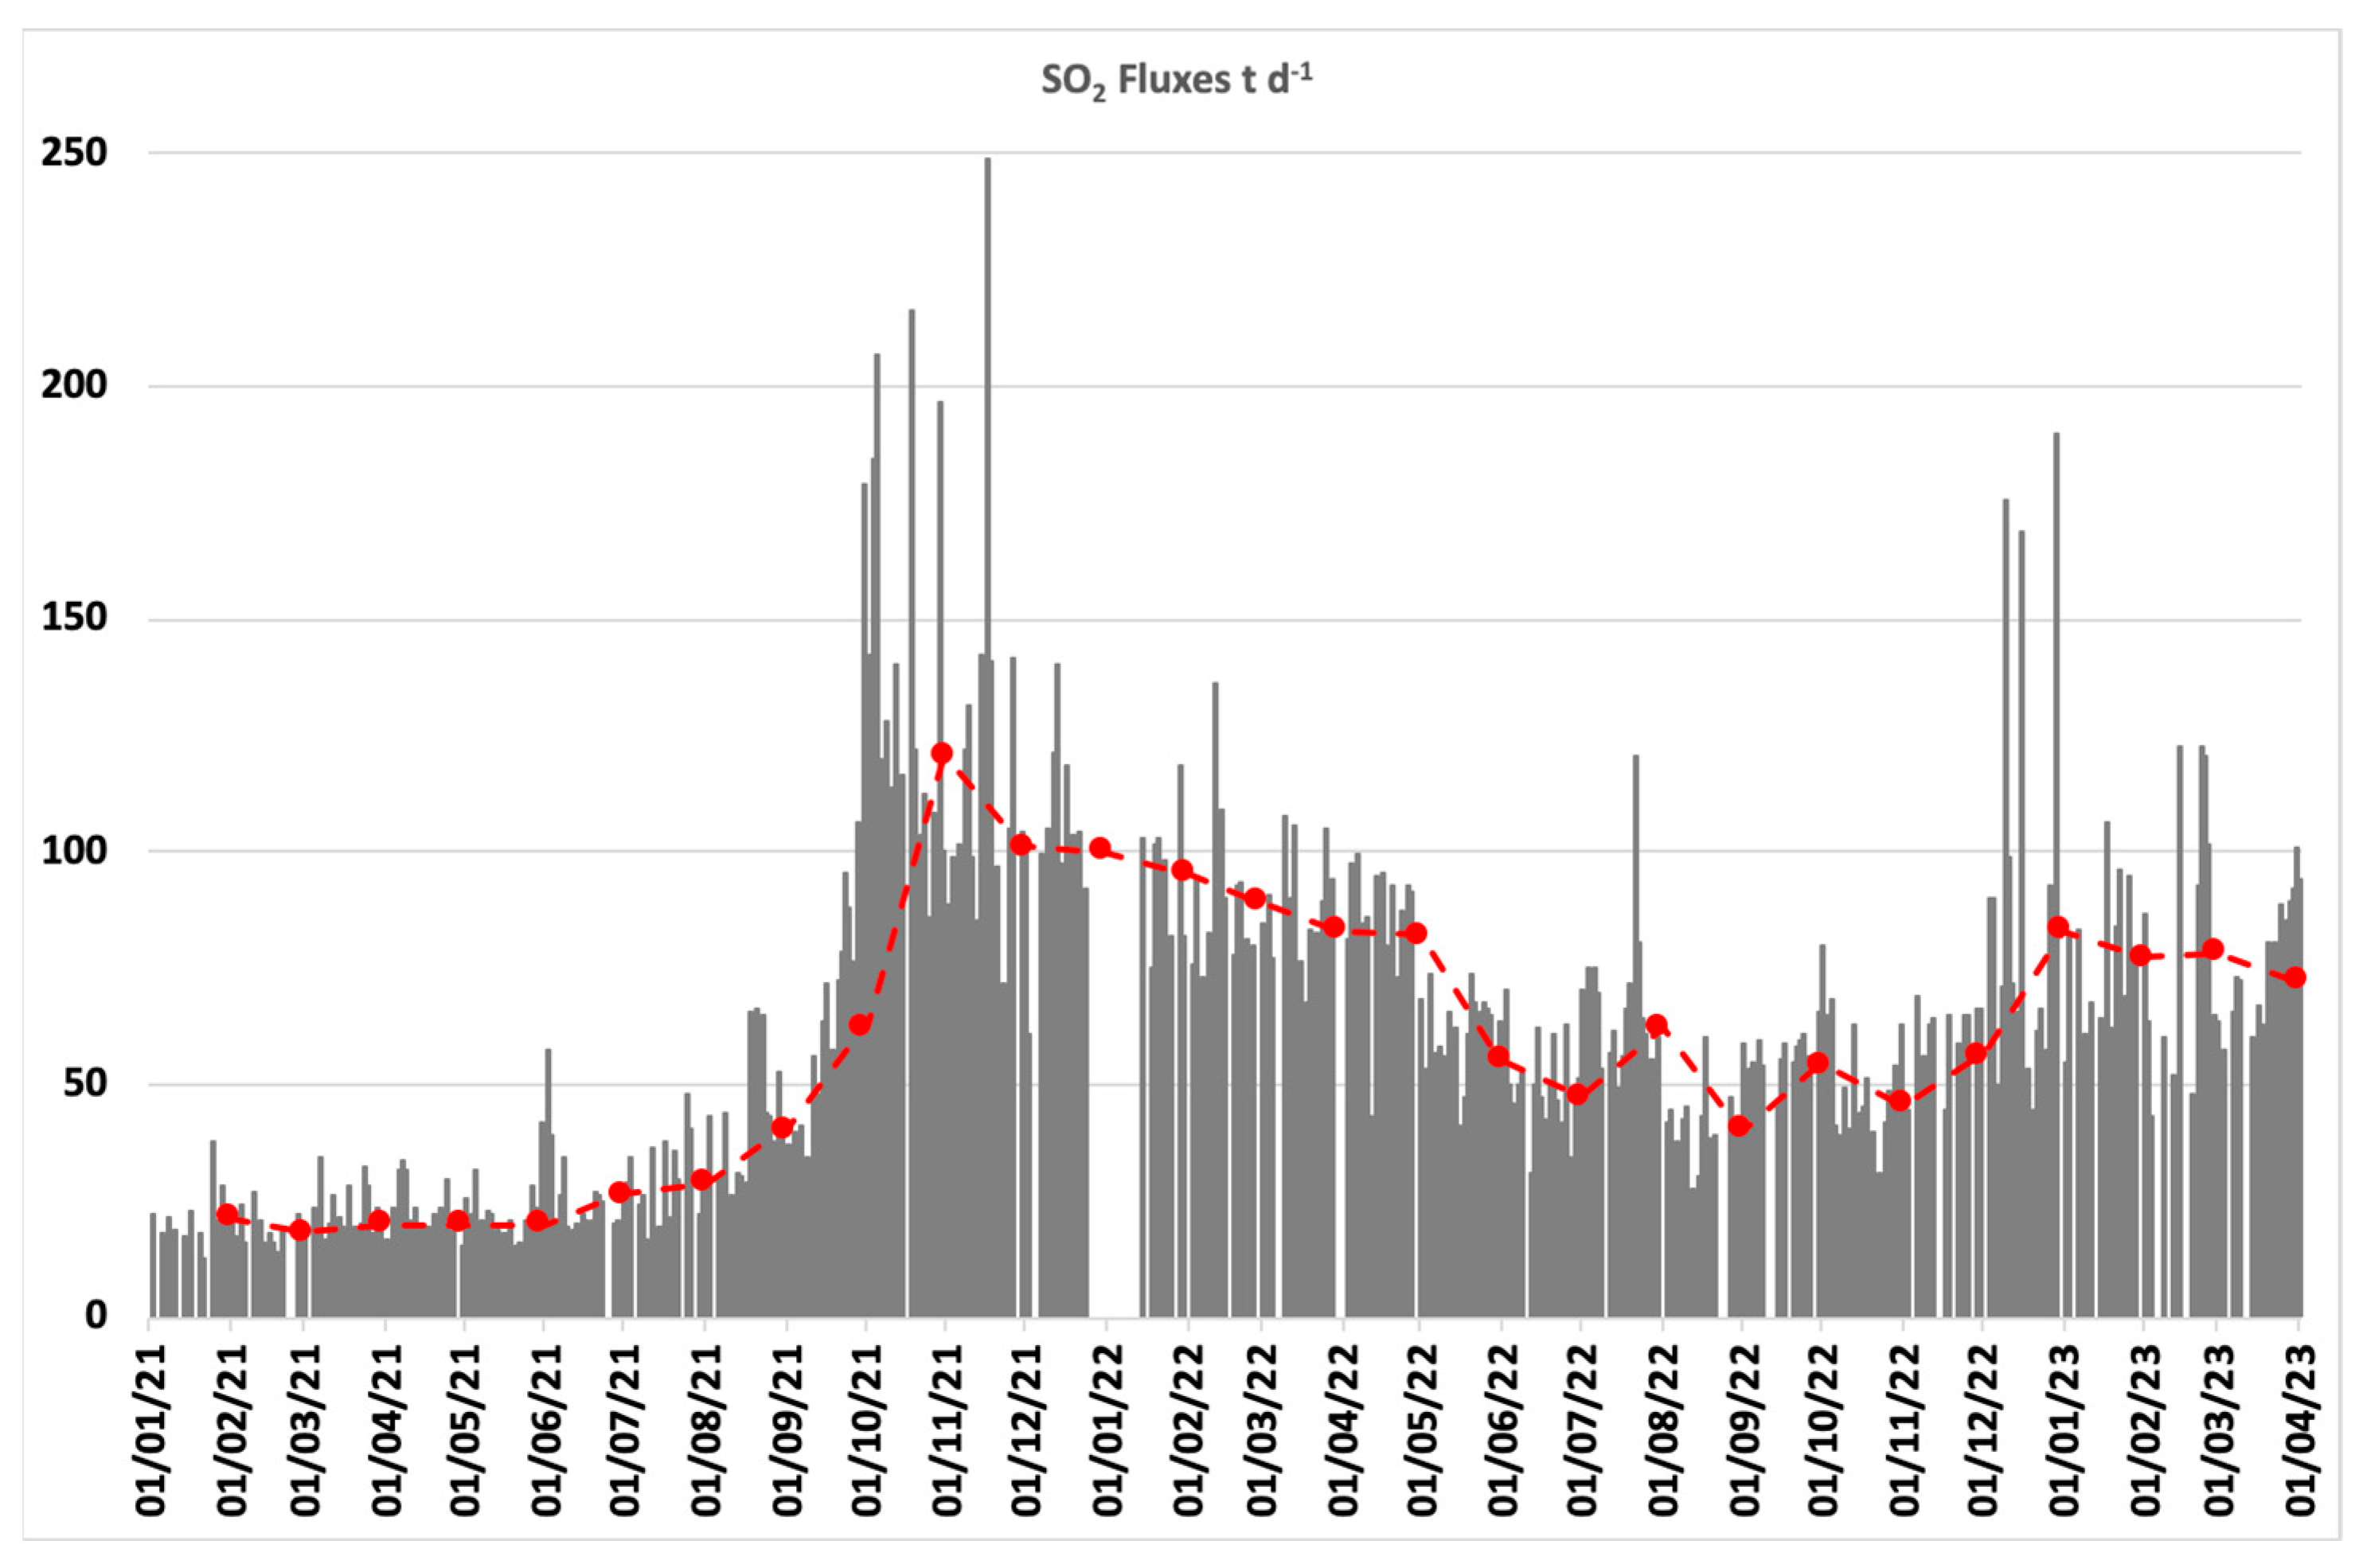
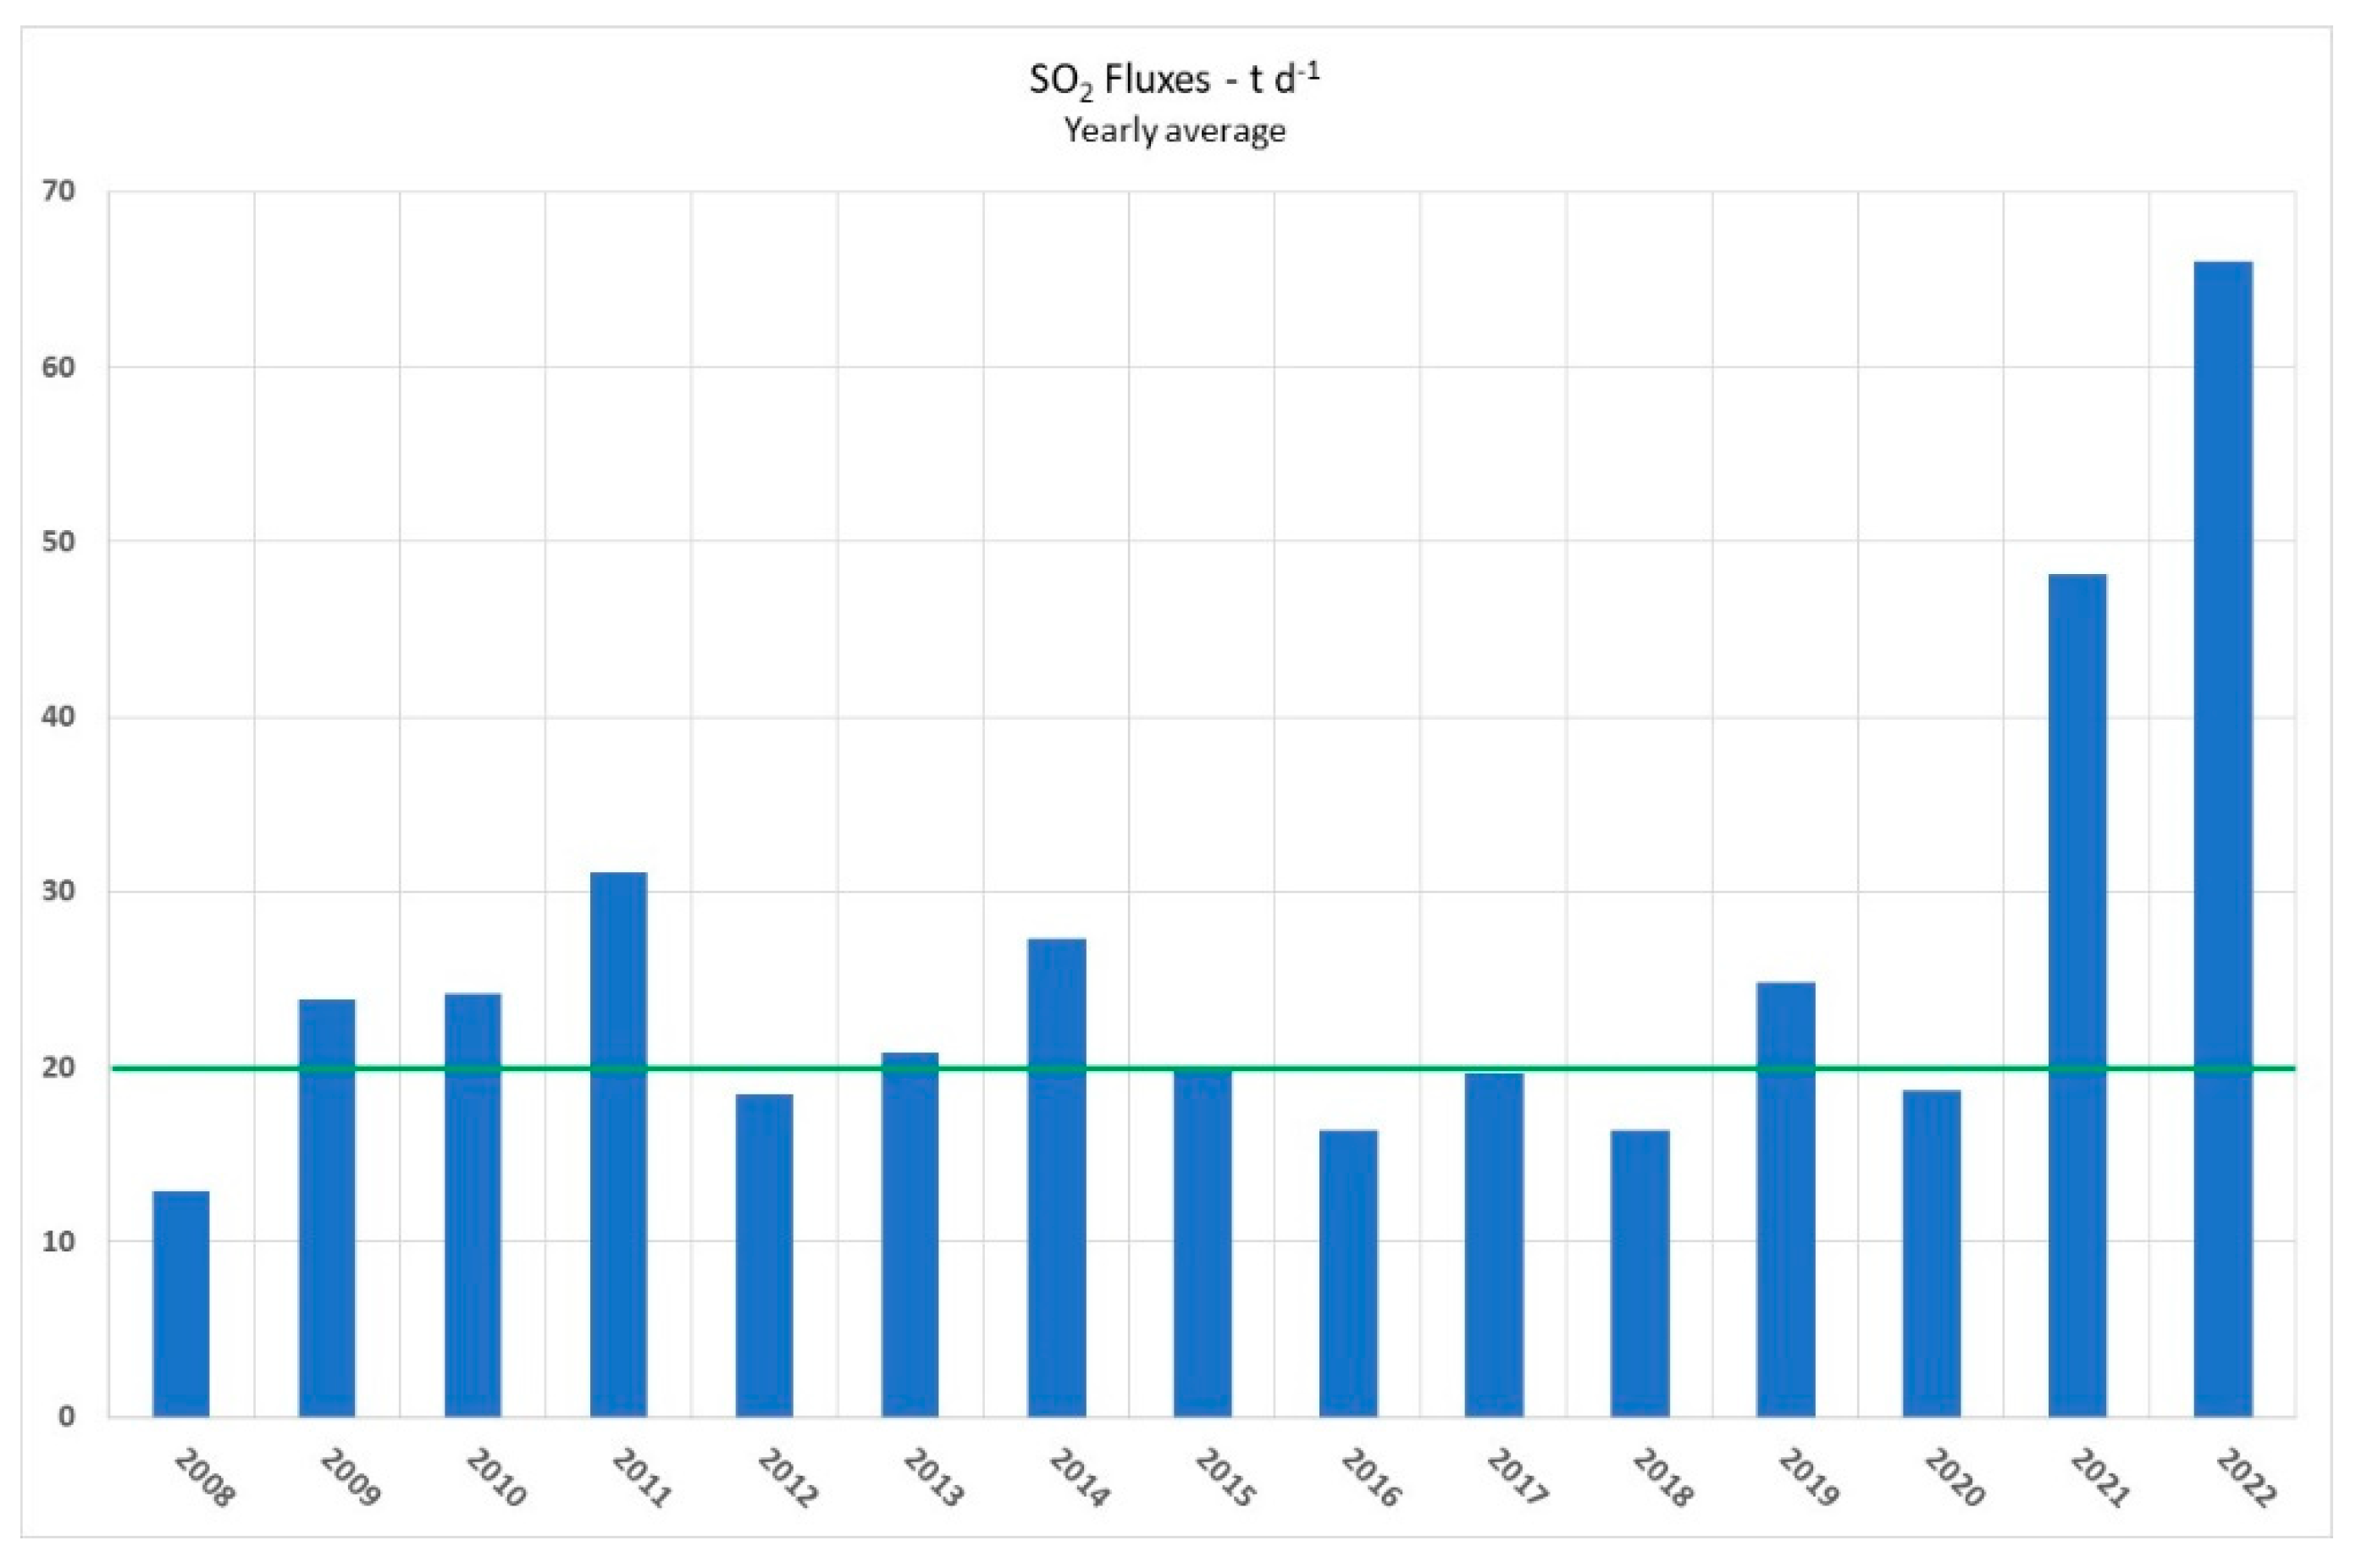
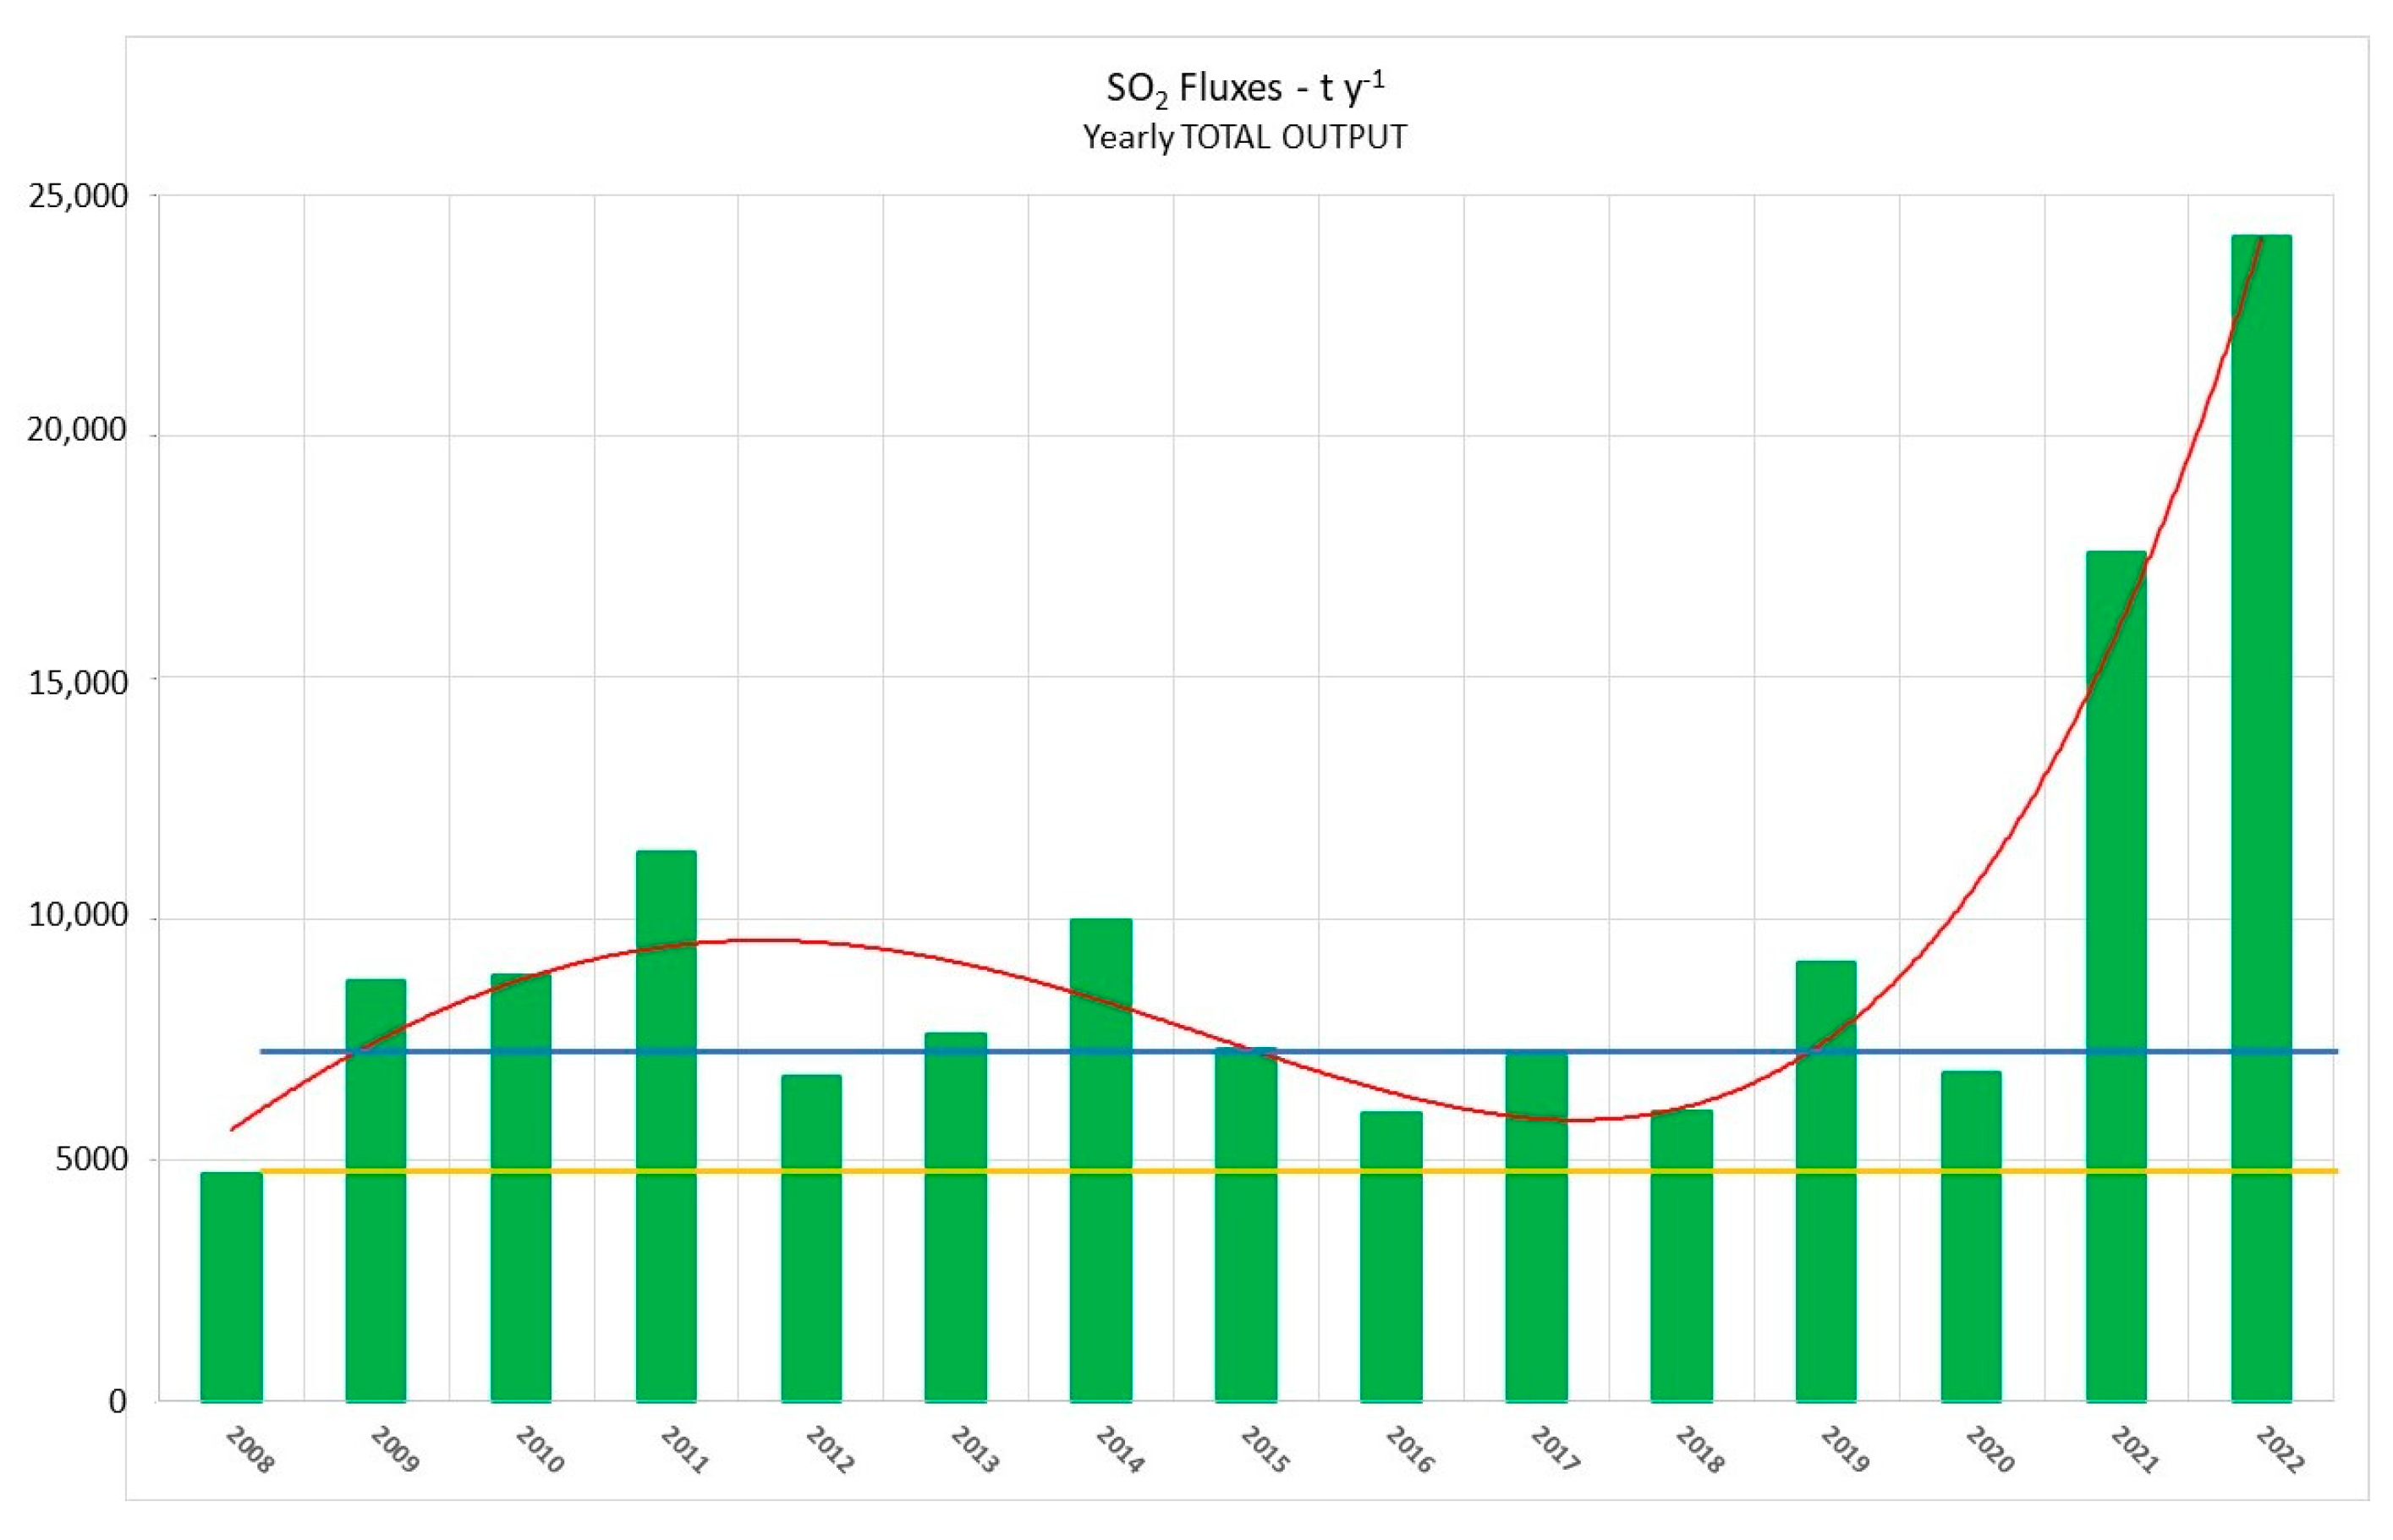
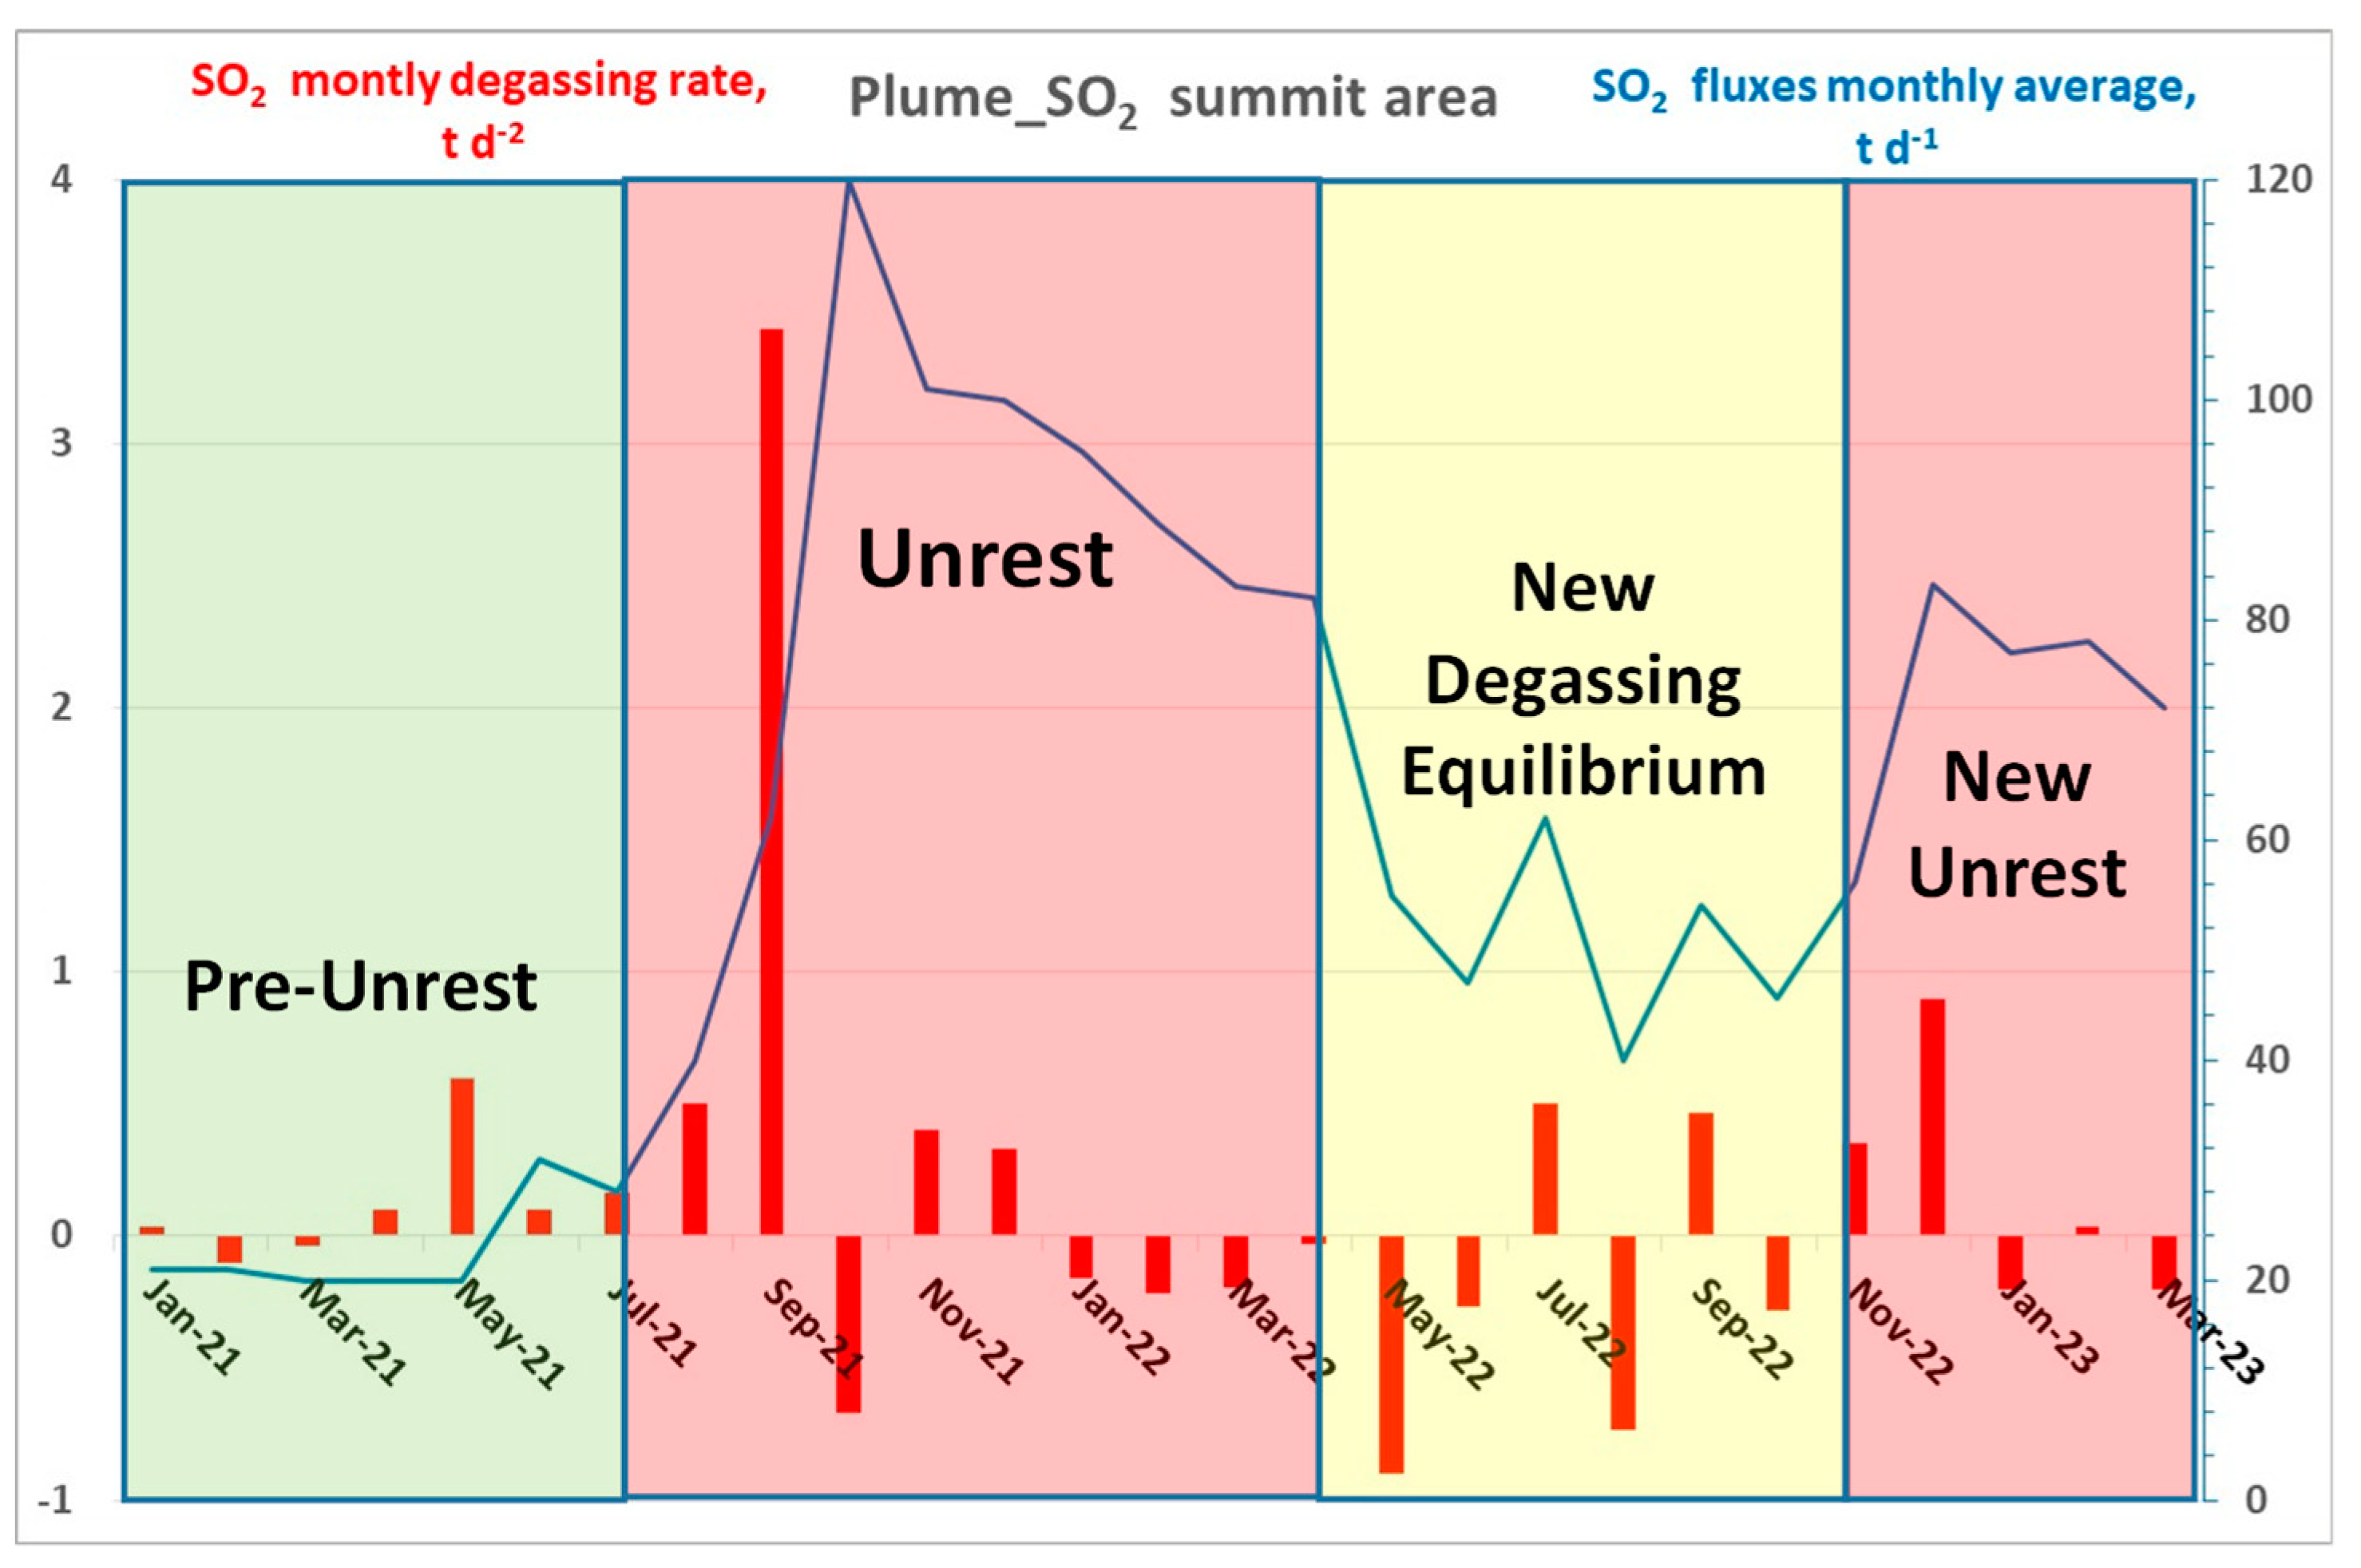
3.1.1. SO2 Monitoring
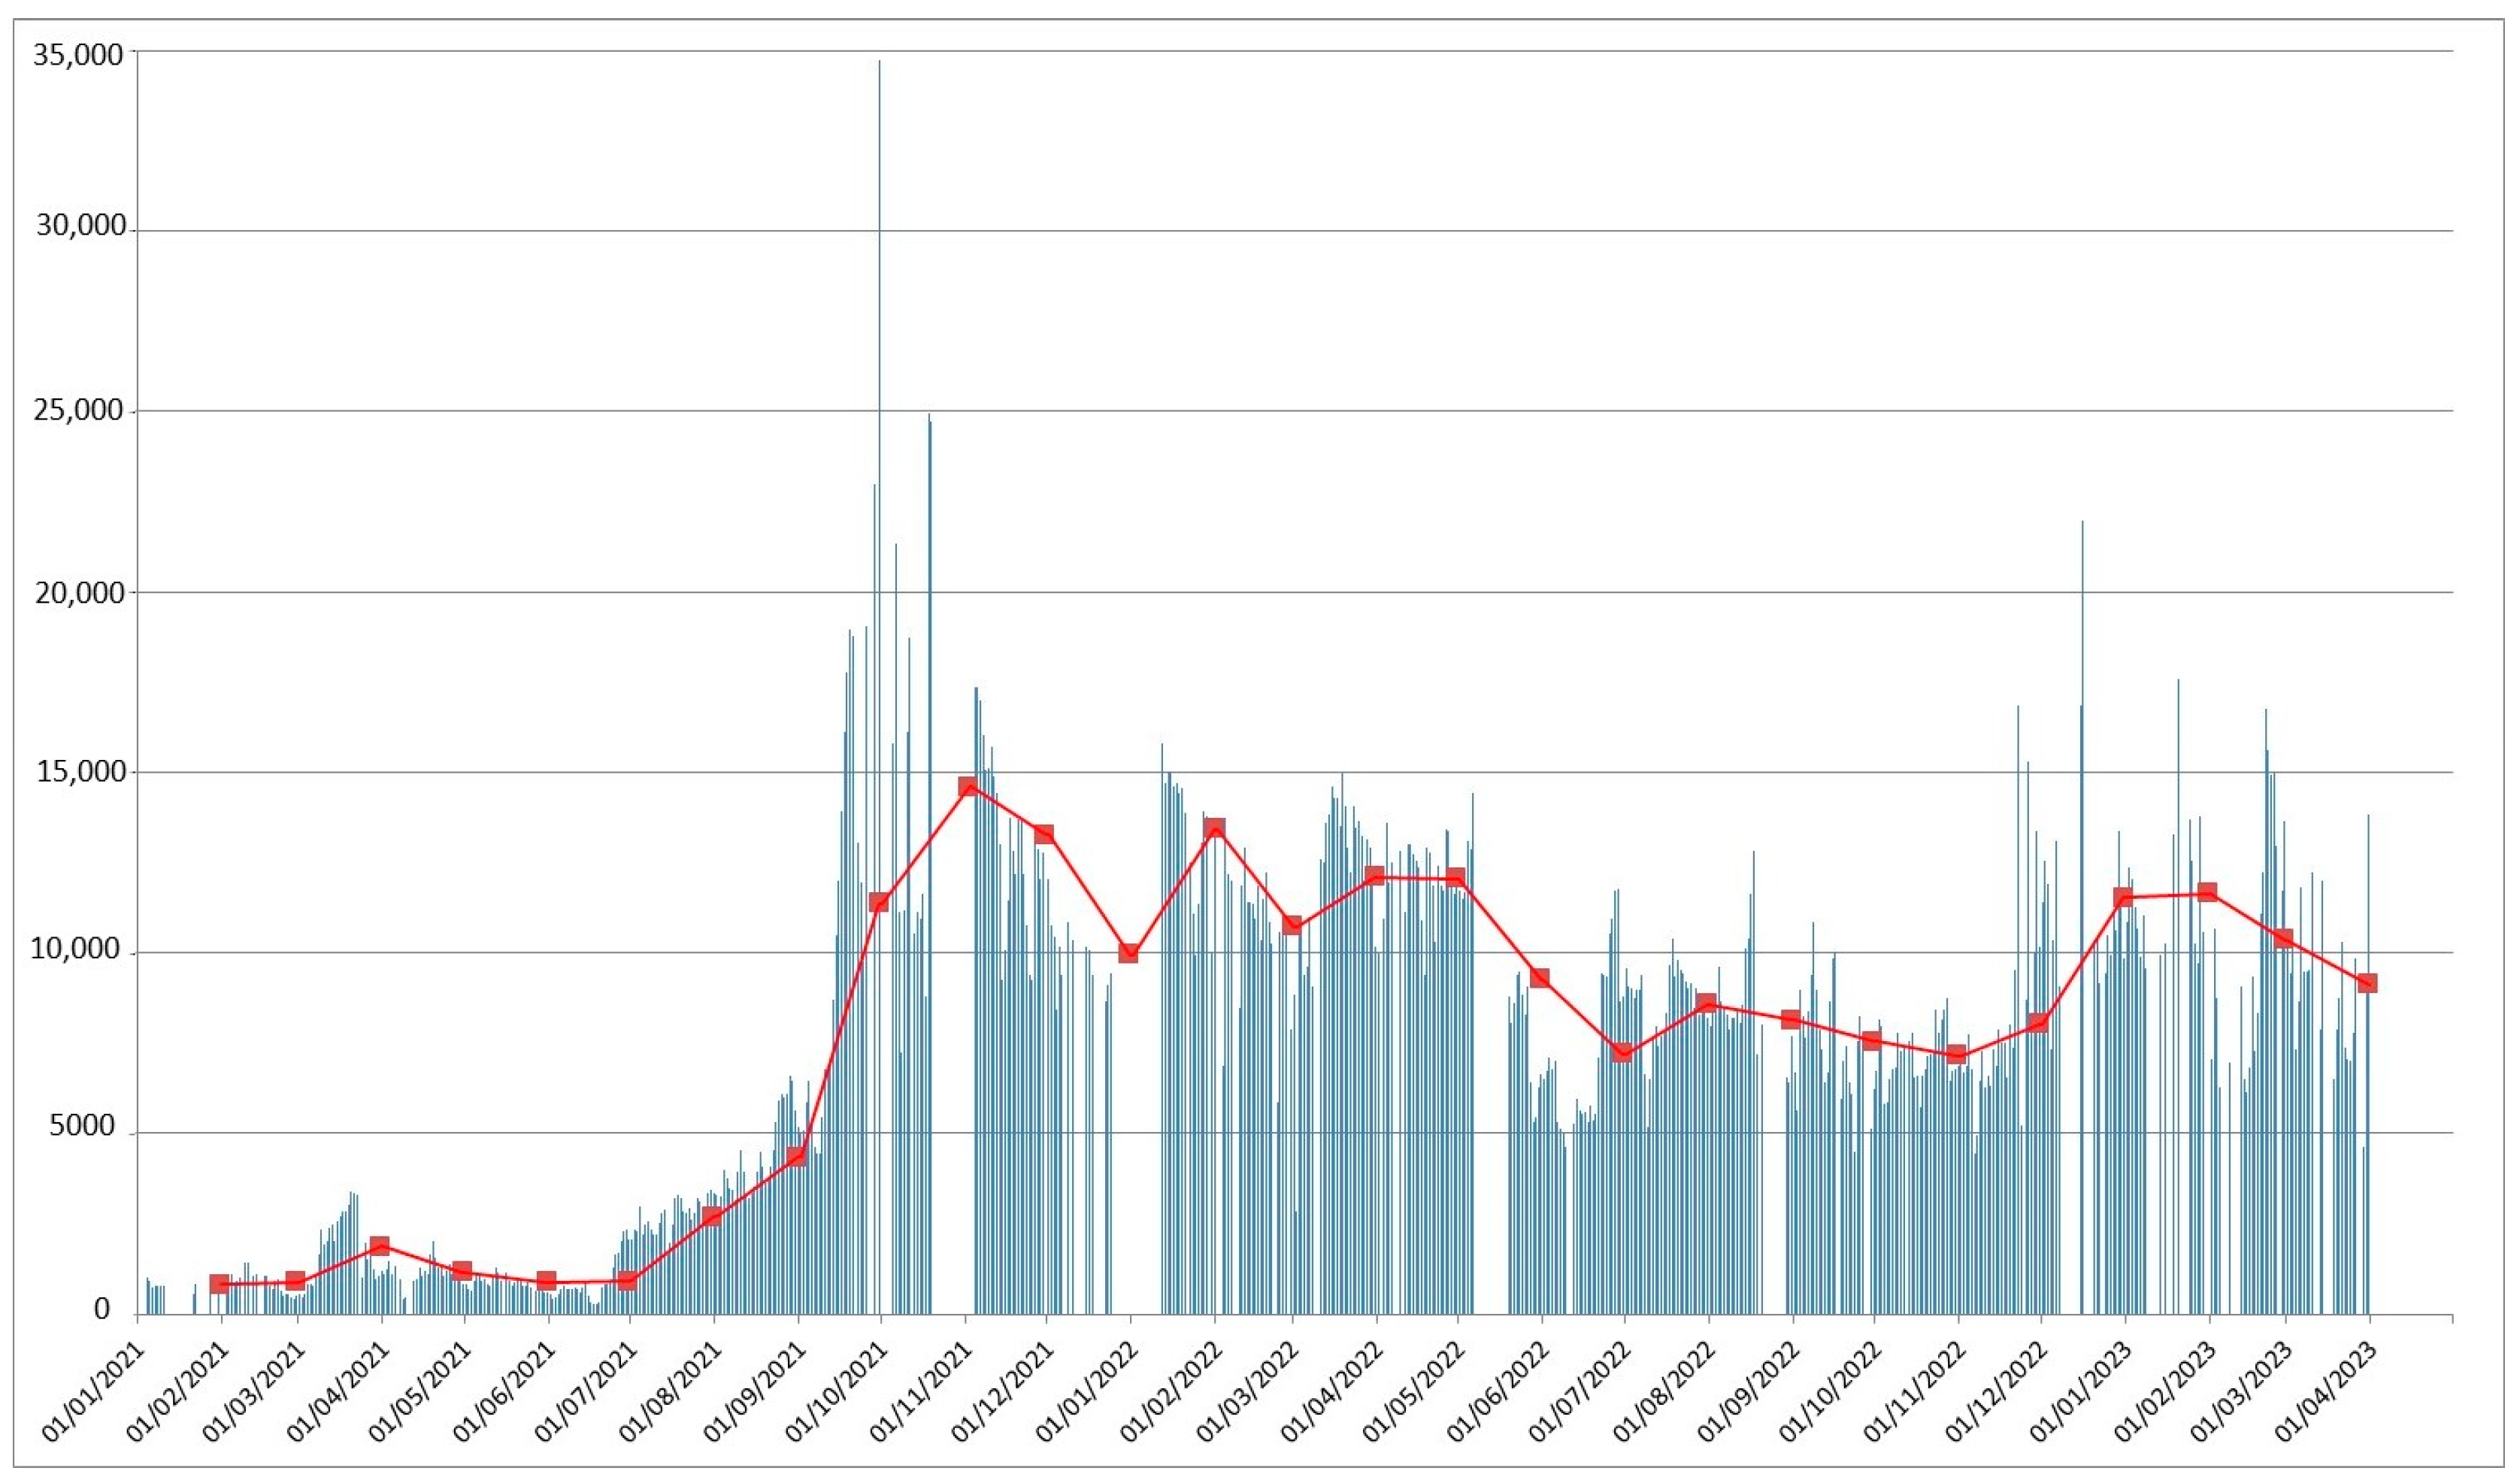
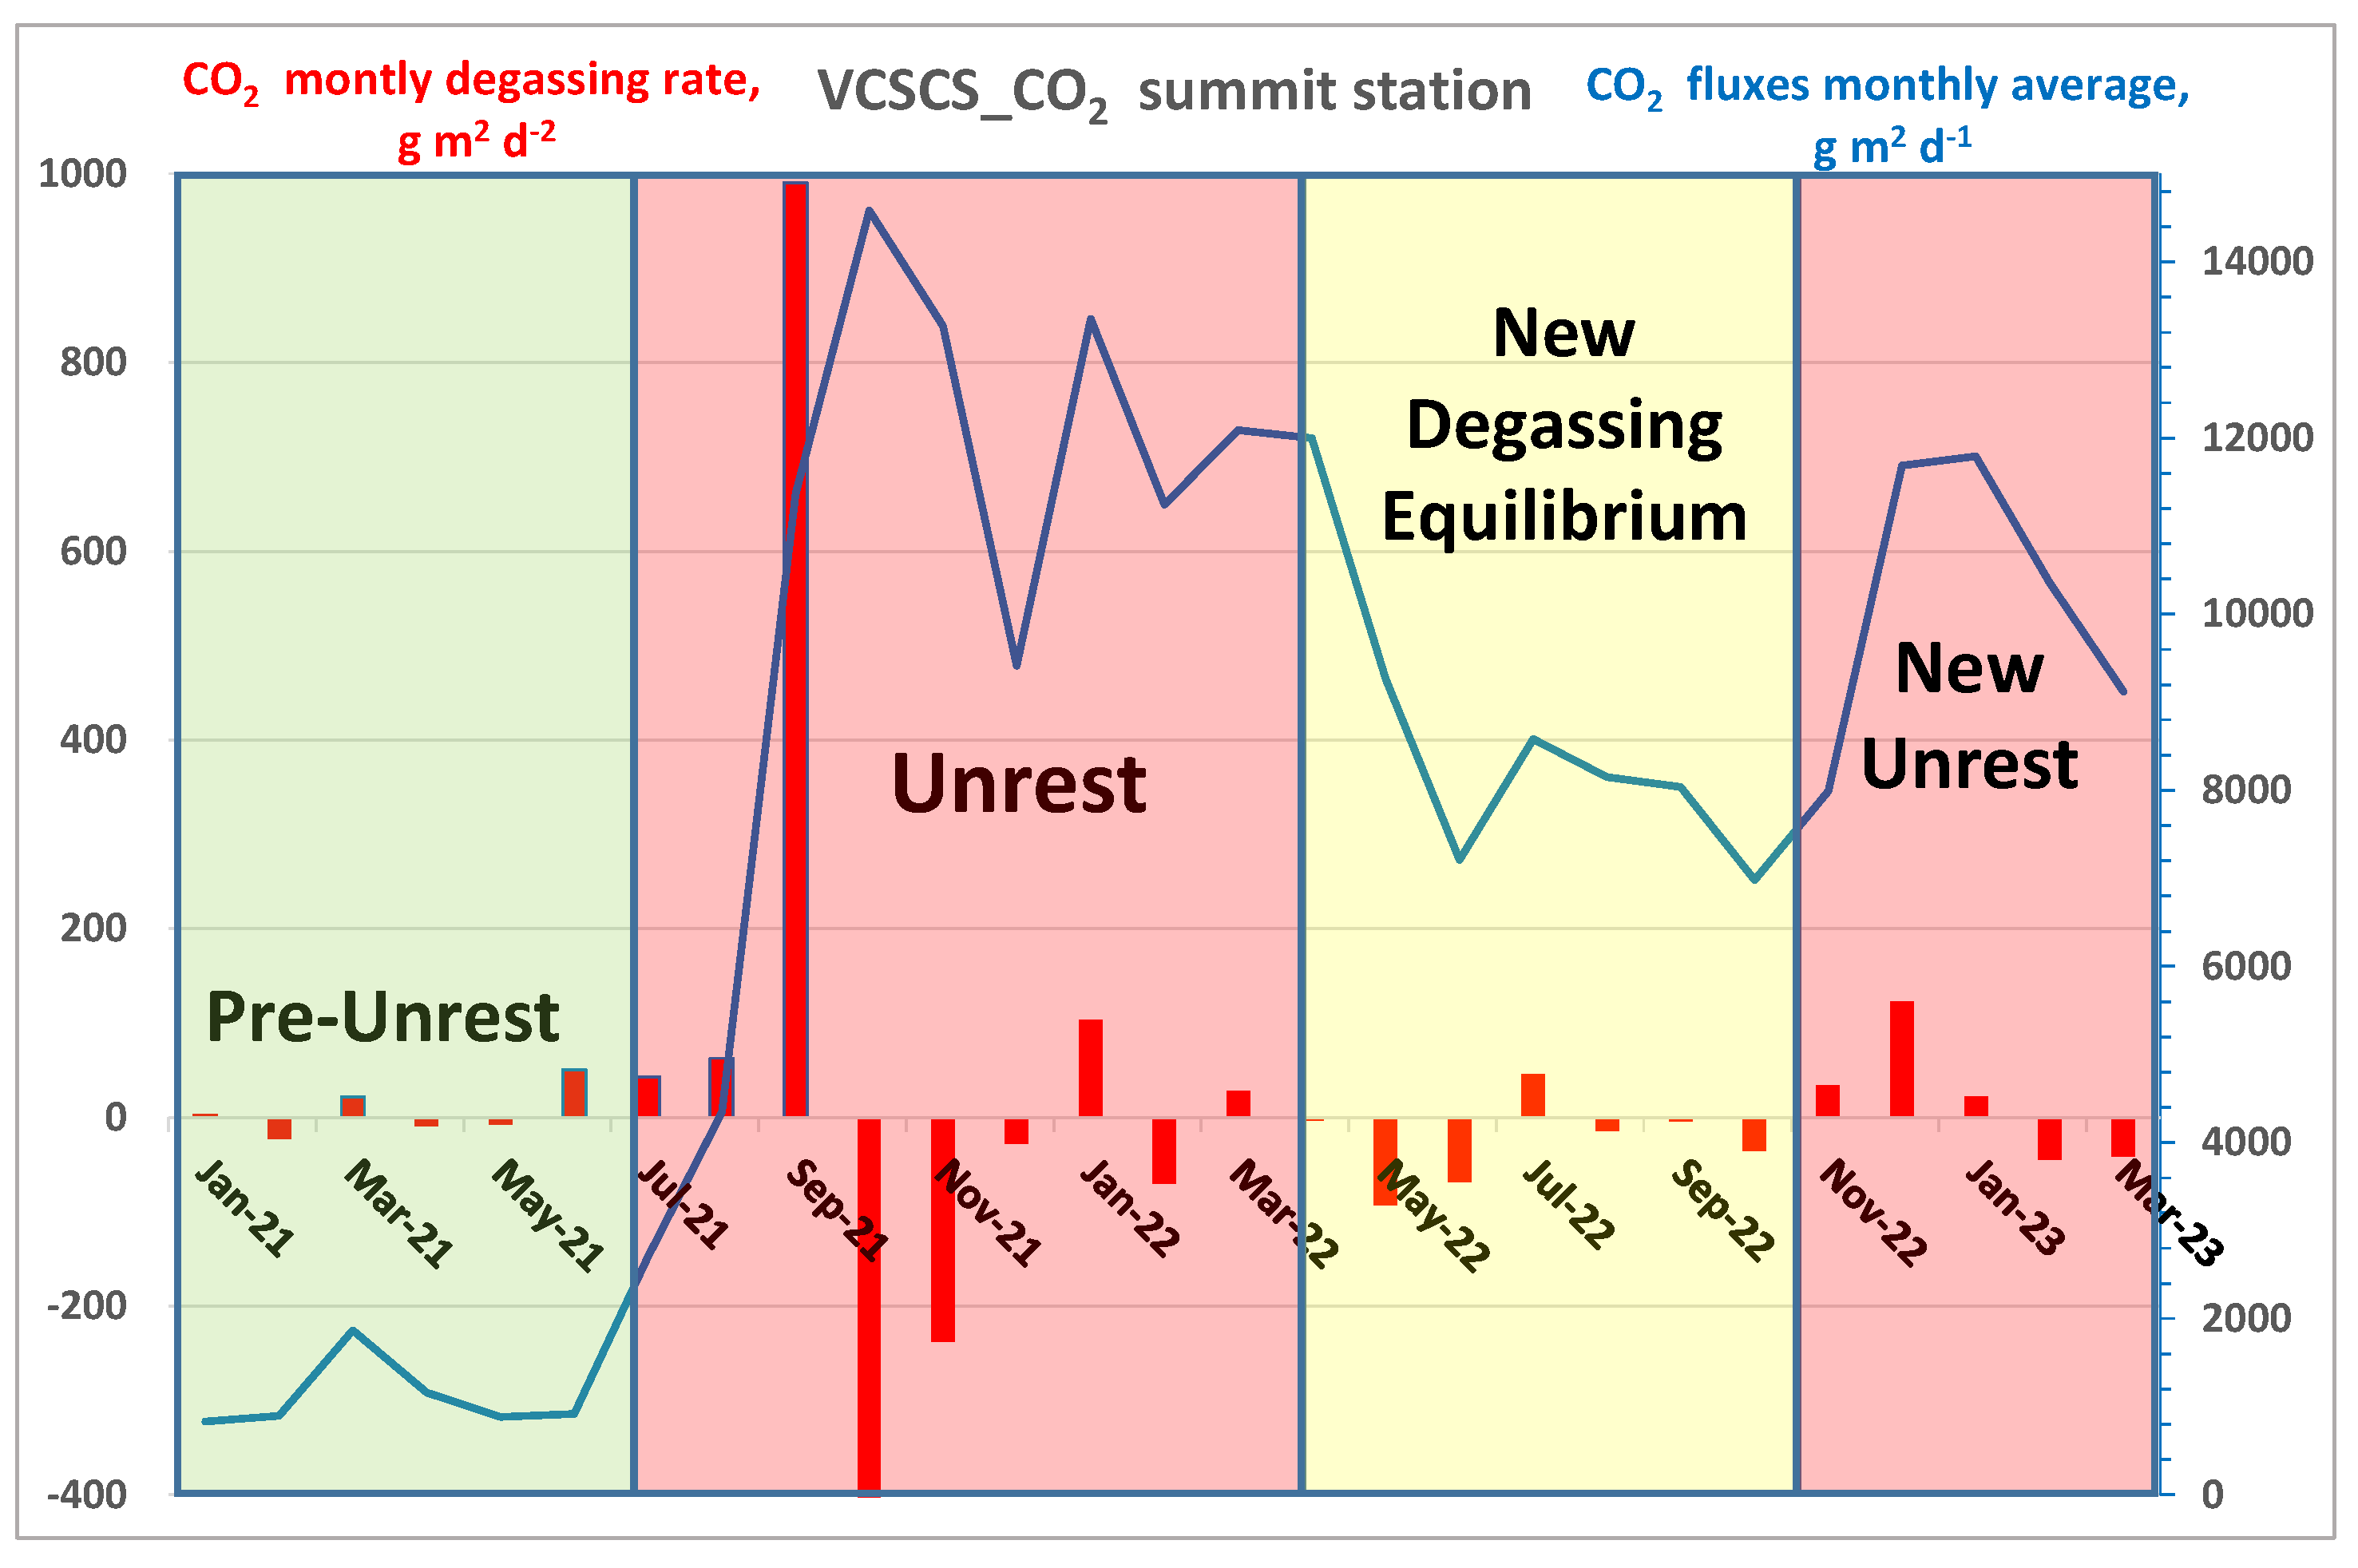
3.1.2. Near Real-Time Soil CO2 Monitoring
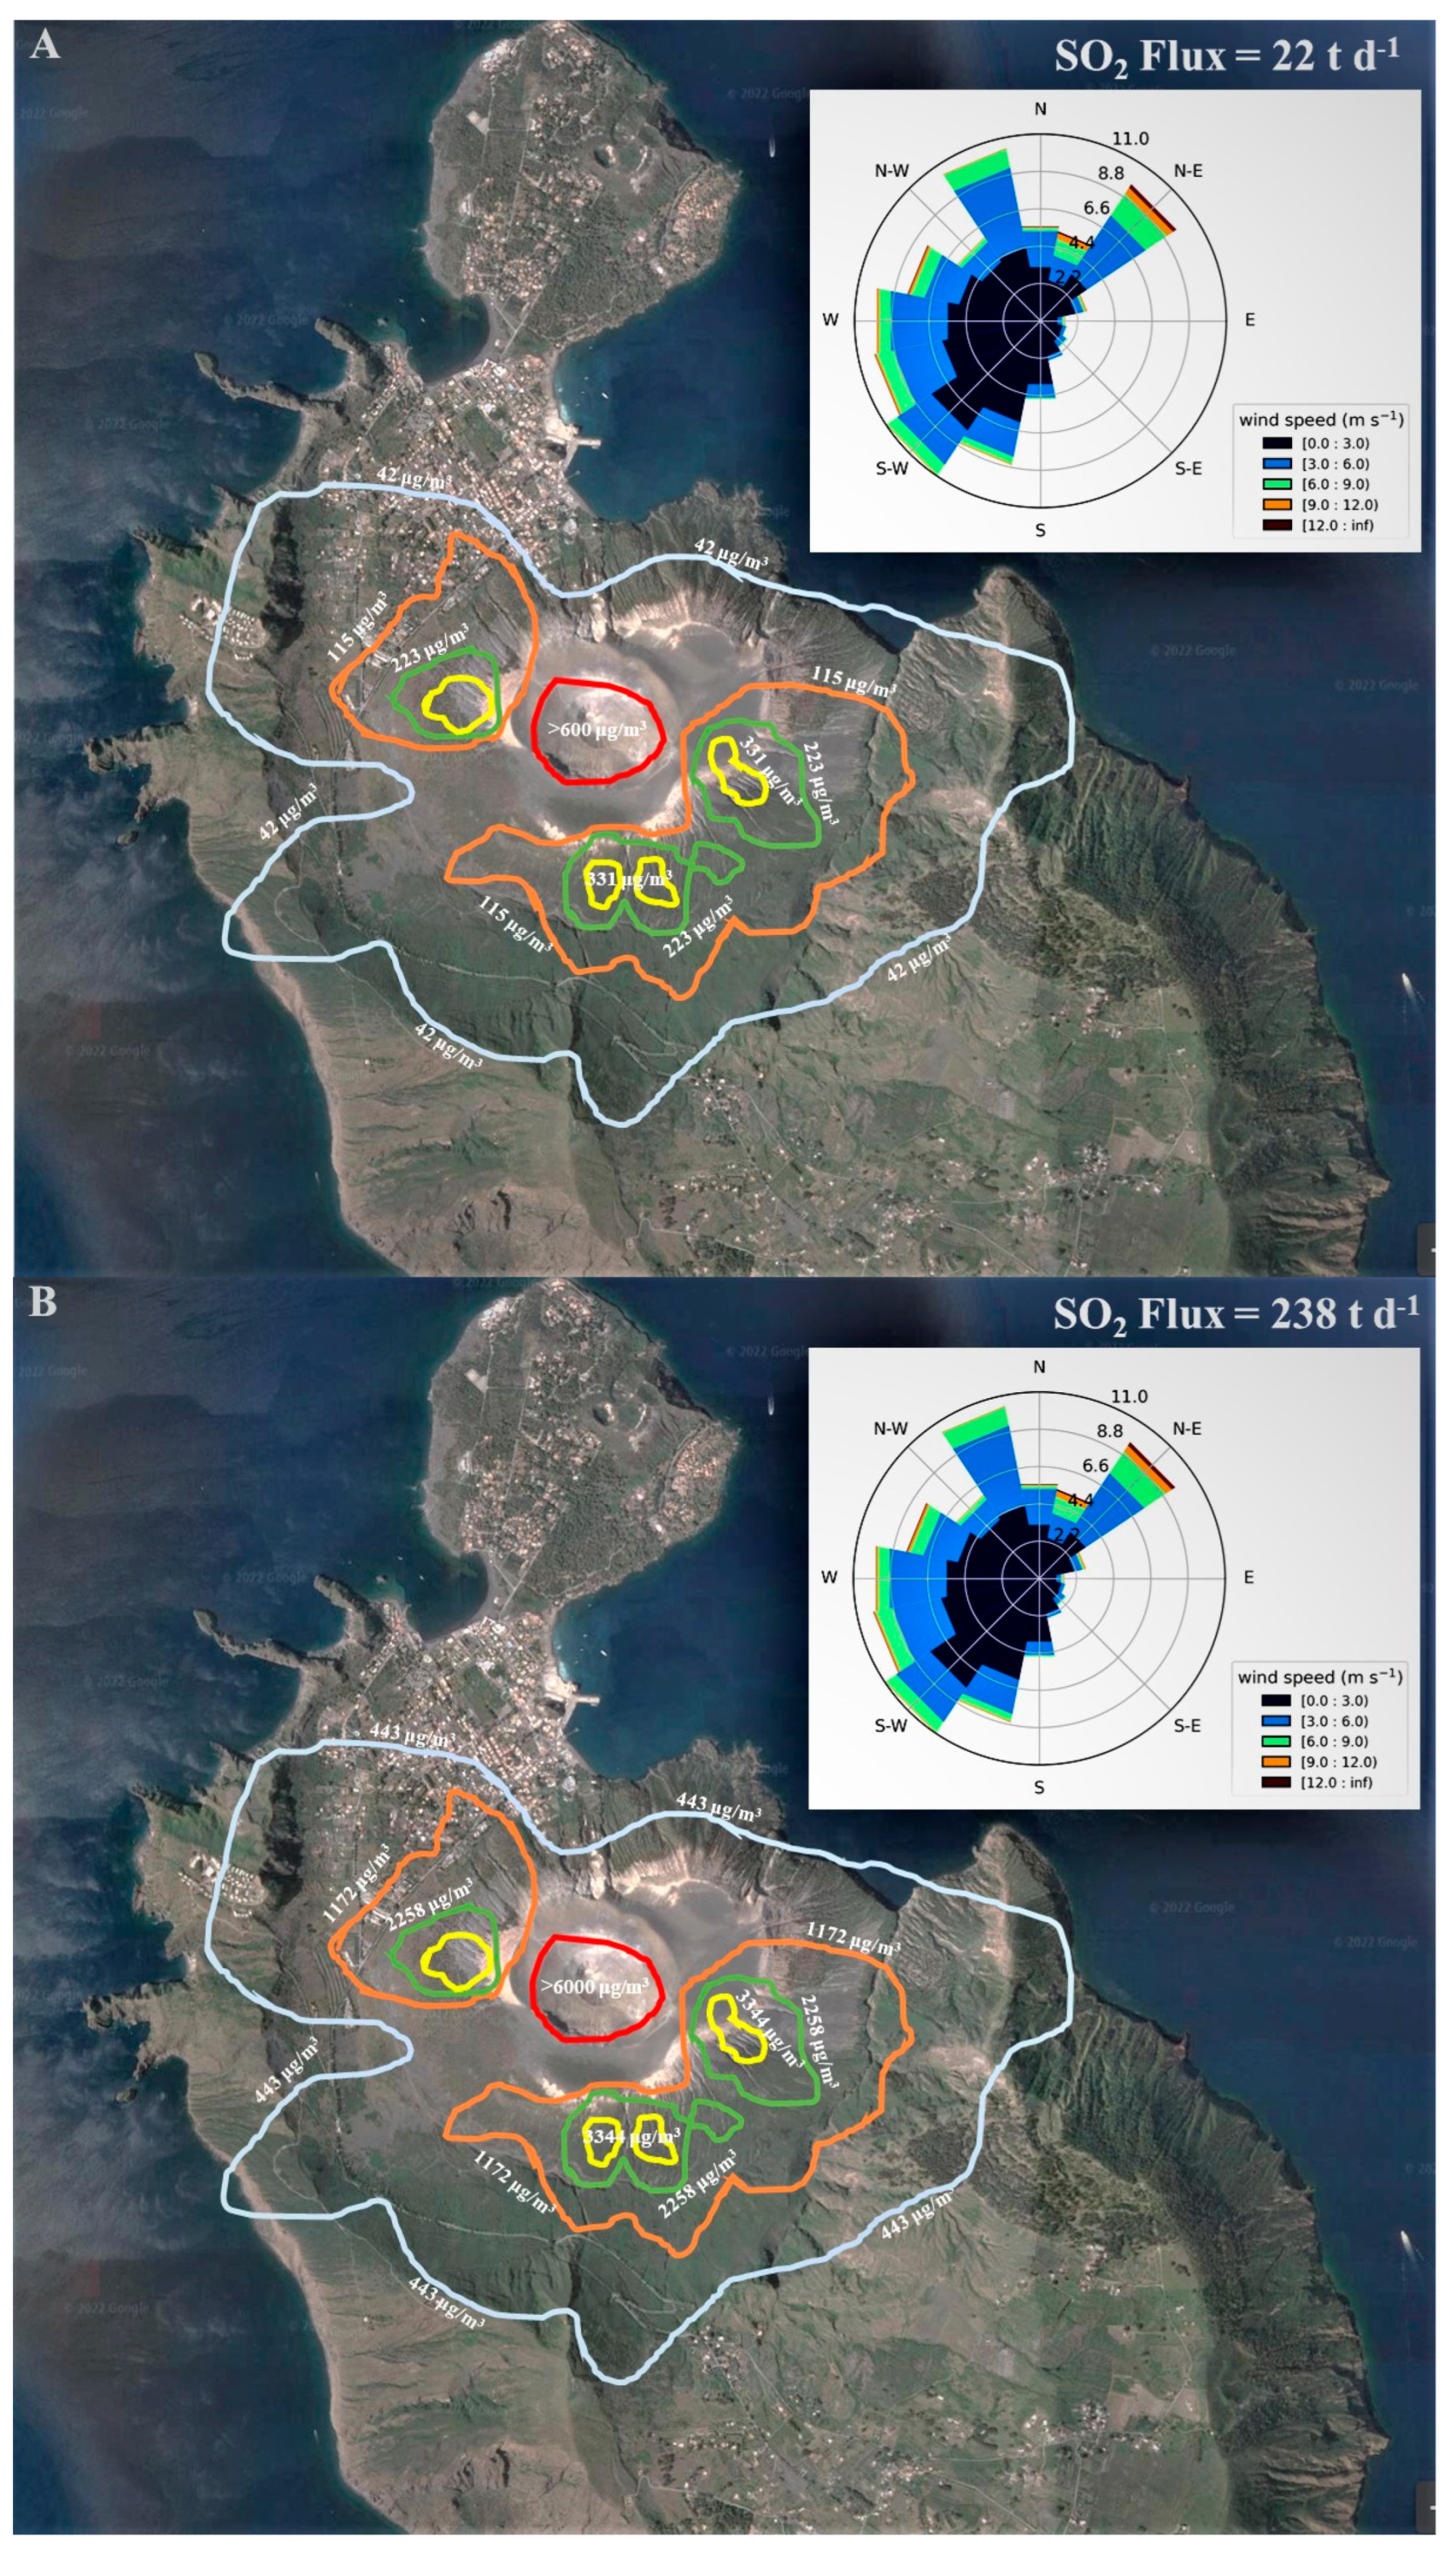
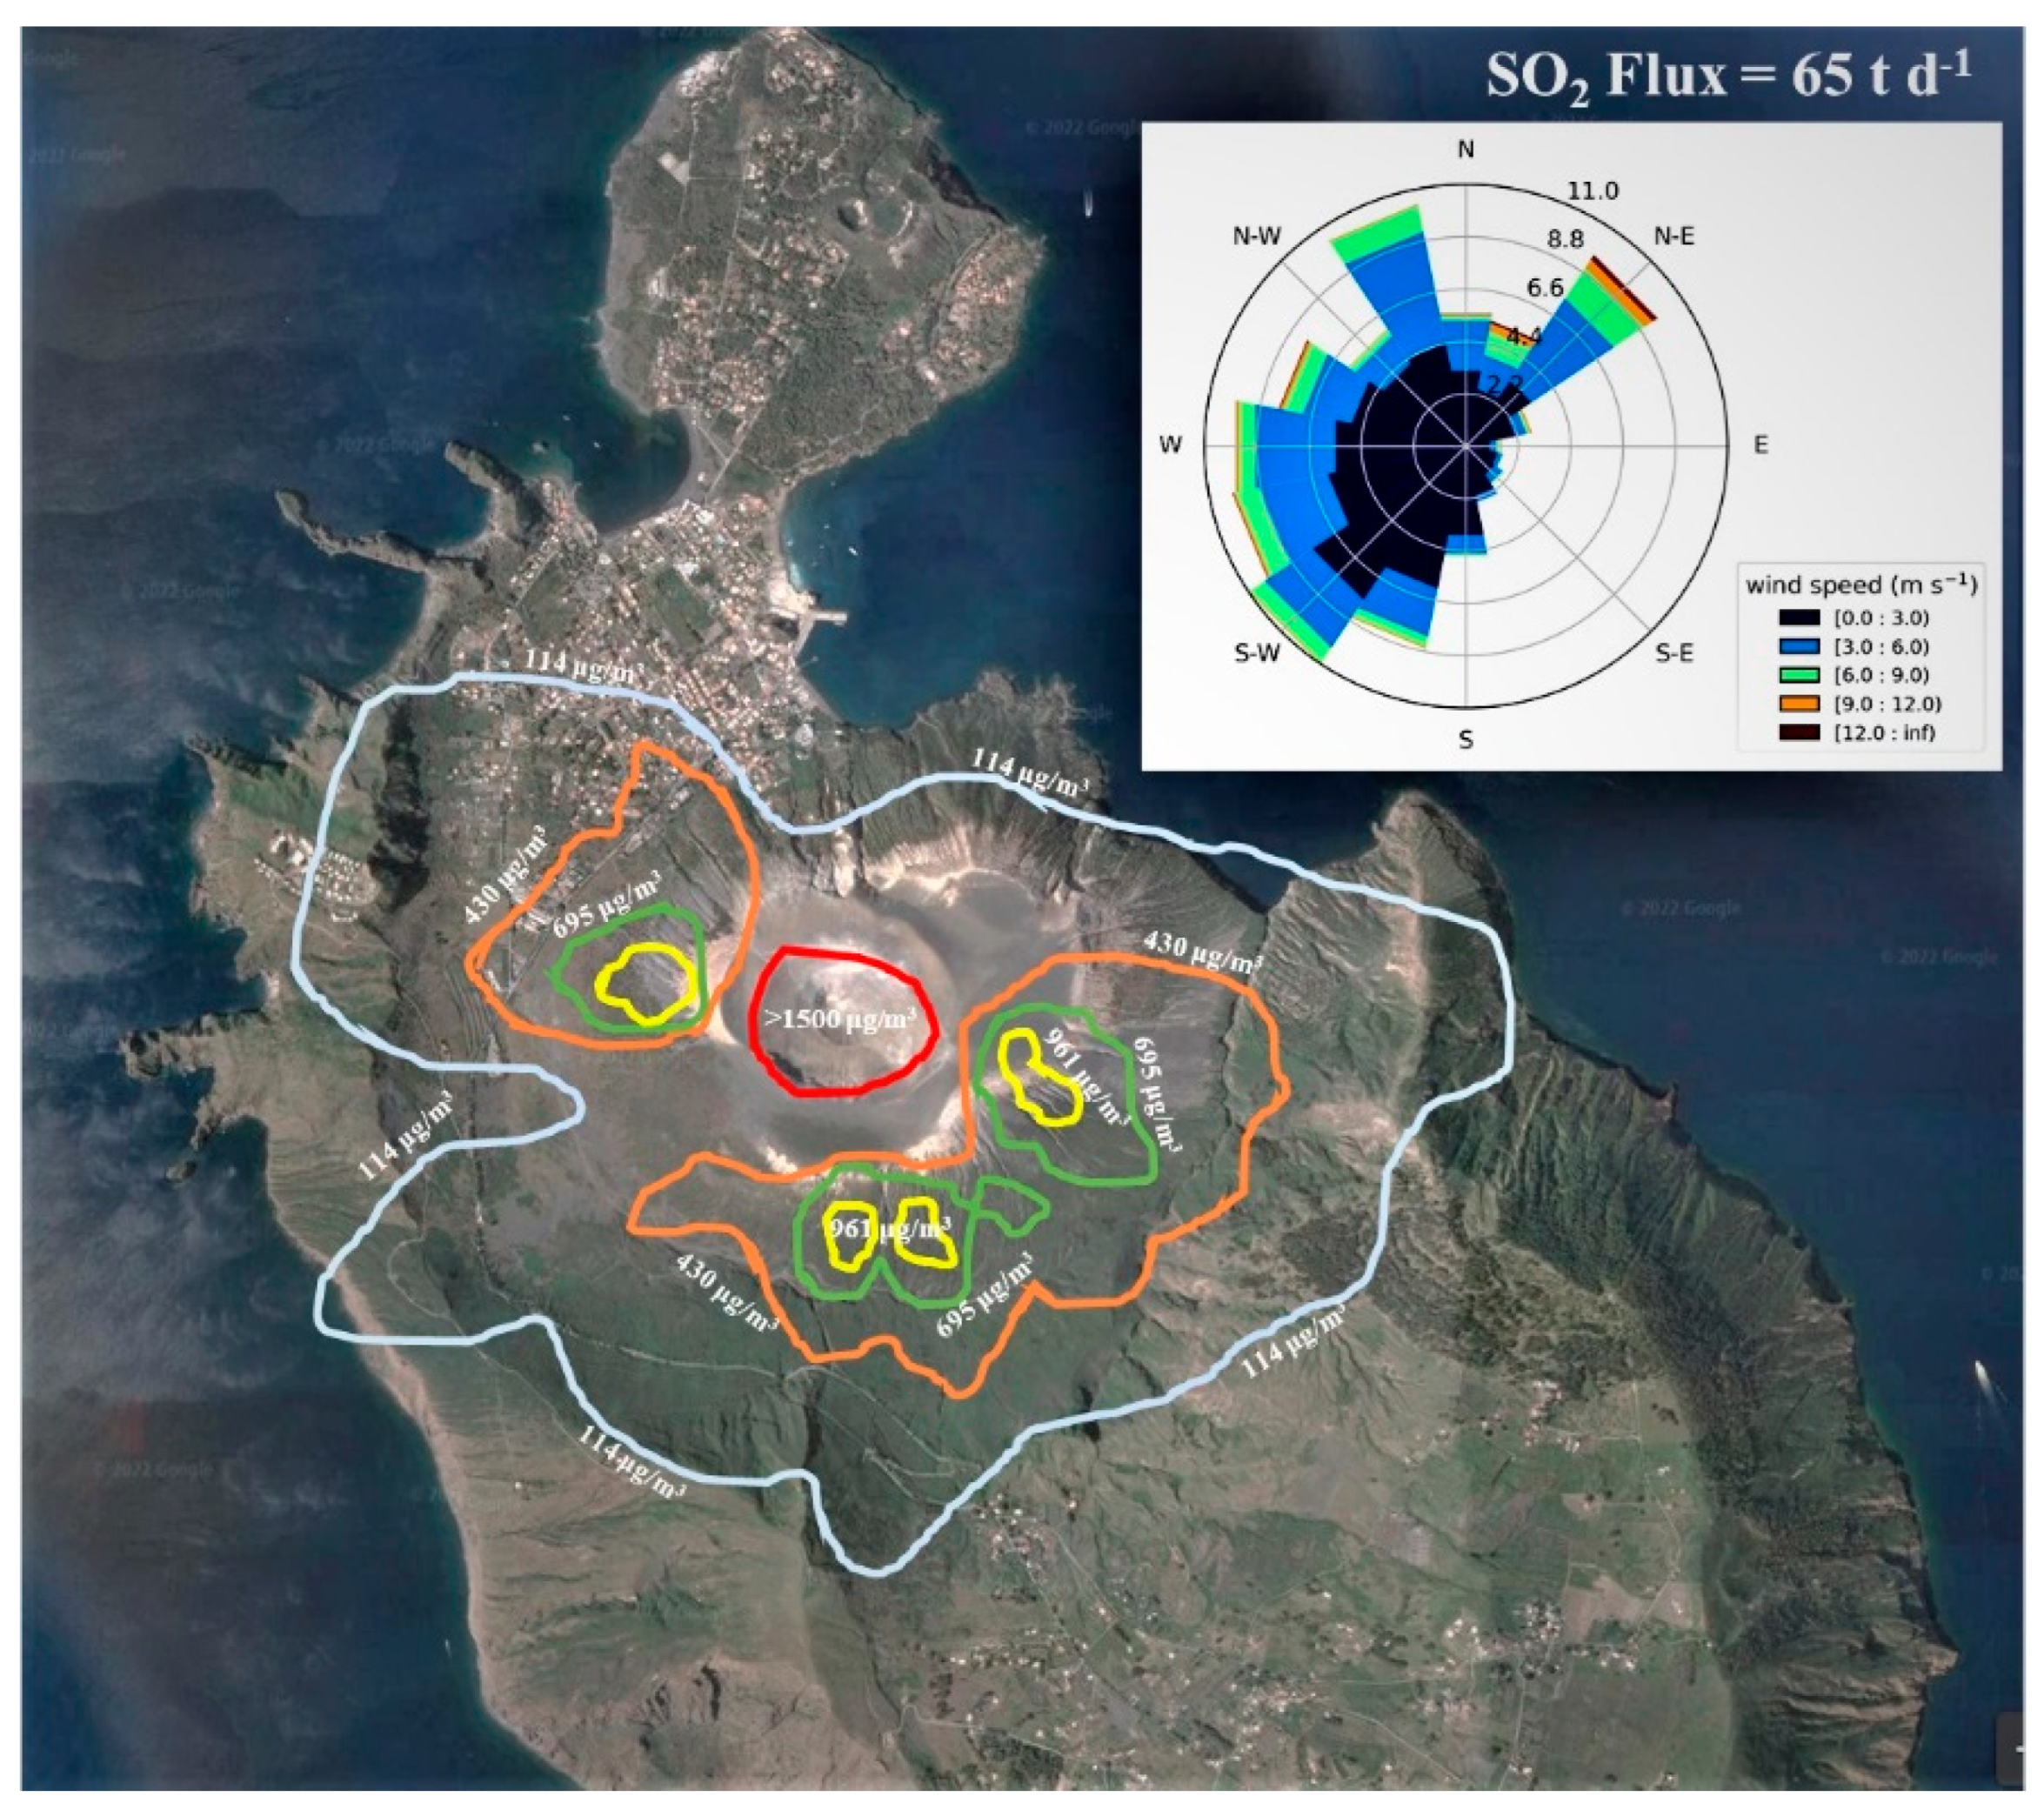
4. SO2 Map Dispersions
5. Discussion
6. Conclusions
Author Contributions
Funding
Data Availability Statement
Acknowledgments
Conflicts of Interest
References
- Brantley, S.L.; Koepenick, K.W. Measured carbon dioxide emissions from Oldoinyo Lengai and the skewed distribution of passive volcanic fluxes. Geology 1995, 23, 933–936. [Google Scholar] [CrossRef]
- Arthur, M.A. Volcanic contributions to the carbonand sulfur geochemical cycles and global change. In Encyclopedia of Volcanoes; Sigurdsson, H., Houghton, B., Rymer, H., Stix, J., McNutt, S., Eds.; Academic Press: San Diego, CA, USA, 2000; pp. 1045–1056. [Google Scholar]
- Carn, S.A.; Fioletov, V.E.; McLinden, C.A.; Li, C.; Krotkov, N.A. A decade of global volcanic SO2 emissions measured from space. Sci. Rep. 2017, 7, 44095. [Google Scholar] [CrossRef] [Green Version]
- Stevenson, D.S.; Johnson, C.E.; Collins, W.J.; Derwent, R.G. The Tropospheric Sulphur Cycle and the Role of Volcanic SO2; Special Publications; Geological Society: London, UK, 2007; Volume 213, p. 295. [Google Scholar] [CrossRef]
- Capasso, G.; Favara, R.; Inguaggiato, S. Chemical features and isotopic composition of gaseous manifestations on Vulcano Island, Aeolian Islands, Italy: An interpretative model of fluid circulation. Geochim. Cosmochim. Acta 1997, 61, 3425–3440. [Google Scholar] [CrossRef]
- Paonita, A.; Favara, R.; Nuccio, P.M.; Sortino, F. Genesis of fumarolic emissions as inferred by isotope mass balances: CO2 and water at Vulcano Island, Italy. Geochim. Cosmochim. Acta 2002, 66, 759–772. [Google Scholar] [CrossRef]
- Aiuppa, A.; Inguaggiato, S.; Mcgonigle, A.J.S.; O’Dwyer, M.; Oppenheimer, C.; Padgett, M.J.; Rouwet, D.; Valenza, M. H2S fluxes from Mt. Etna, Stromboli, and Vulcano (Italy) and implications for the sulfur budget at volcanoes. Geochim. Cosmochim. Acta 2005, 69, 1861–1871. [Google Scholar] [CrossRef]
- McGonigle, A.J.S.; Aiuppa, A.; Giudice, G.; Tamburello, G.; Hodson, A.J.; Gurrieri, S. Unmanned aerial vehicle measurements of volcanic carbon dioxide fluxes. Geophys. Res. Lett. 2008, 35. [Google Scholar] [CrossRef] [Green Version]
- Federico, C.; Cocina, O.; Gambino, S.; Paonita, A.; Branca, S.; Coltelli, M.; Italiano, F.; Bruno, V.; Caltabiano, T.; Camarda, M.; et al. Inferences on the 2021 Ongoing Volcanic Unrest at Vulcano Island (Italy) through a Comprehensive Multidisciplinary Surveillance Network. Remote Sens. 2023, 15, 1405. [Google Scholar] [CrossRef]
- Chiodini, G.; Granieri, D.; Avino, R.; Caliro, S.; Costa, A.; Werner, C. Werner Carbon dioxide diffuse degassing and estimation of heat release from volcanic and hydrothermal systems. J. Geophys. Res. 2005, 110, B08204. [Google Scholar] [CrossRef]
- Inguaggiato, S.; Mazot, A.; Diliberto, I.S.; Inguaggiato, C.; Madonia, P.; Rouwet, D.; Vita, F. Total CO2 output from Vulcano island (Aeolian Islands, Italy). Geochemistry, Geophysics. Geosystems 2012, 13, Q02012. [Google Scholar] [CrossRef]
- Fischer, T.P.; Arellano, S.; Carn, S.; Aiuppa, A.; Galle, B.; Allard, P.; Lopez, T.; Shinohara, H.; Kelly, P.; Werner, C.; et al. The emissions of CO2 and other volatiles from the world’s subaerial volcanoes. Sci. Rep. 2019, 9, 18716. [Google Scholar] [CrossRef] [Green Version]
- Inguaggiato, S.; Vita, F.; Diliberto, I.S.; Mazot, A.; Calderone, L.; Mastrolia, A.; Corrao, M. The Extensive Parameters as a Tool to Monitoring the Volcanic Activity: The Case Study of Vulcano Island (Italy). Remote Sens. 2022, 14, 1283. [Google Scholar] [CrossRef]
- Inguaggiato, S.; Vita, F.; Diliberto, I.S.; Inguaggiato, C.; Mazot, A.; Cangemi, M.; Corrao, M. The volcanic activity changes occurred in the 2021–2022 at Vulcano island (Italy), inferred by the abrupt variations of soil CO2 output. Sci. Rep. 2022, 12, 21166. [Google Scholar] [CrossRef]
- Aiuppa, A.; Bitetto, M.; Calabrese, S.; Delle Donne, D.; Lages, J.; La Monica, F.P.; Chiodini, G.; Tamburello, G.; Cotterill, A.; Pistolesi, M.; et al. Mafic magma feeds degassing unrest at Vulcano Island, Italy. Commun. Earth Environ. 2022, 3, 255. [Google Scholar] [CrossRef]
- Di Martino, R.M.R.; Gurrieri, S.; Camarda, M.; Capasso, G.; Prano, V. Hazardous changes in soil CO2 emissions at Vulcano, Italy, in 2021. J. Geophys. Res. Solid Earth 2022, 127, e2022JB024516. [Google Scholar] [CrossRef]
- Arellano, S.; Galle, B.; Apaza, F.; Avard, G.; Barrington, C.; Bobrowski, N.; Bucarey, C.; Burbano, V.; Burton, M.; Chacón, Z.; et al. Synoptic analysis of a decade of daily measurements of SO2 emission in the troposphere from volcanoes of the global ground-based Network for Observation of Volcanic and Atmospheric Change. Earth Syst. Sci. Data 2021, 13, 1167–1188. [Google Scholar] [CrossRef]
- Platt, U. Differential optical absorption spectroscopy (DOAS). In Air Monitoring by Spectroscopic Techniques; Chemical Analysis Series; Sigrist, M.W., Ed.; John Wiley & Sons Inc.: Hoboken, NJ, USA, 1994; Volume 127, pp. 27–83. [Google Scholar]
- Platt, U.; Stutz, J. Differential Optical Absorption Spectroscopy Principles and Applications, Physics of Earth and Space Environments; Springer: Berlin/Heidelberg, Germany, 2008; p. 597. ISBN 978-3-540-75776-4. [Google Scholar]
- Galle, B.; Johansson, M.; Rivera, C.; Zhang, Y.; Kihlman, M.; Kern, C.; Lehmann, T.; Platt, U.; Arellano, S.; Hidalgo, S. Network for Observation of Volcanic and Atmospheric Change (NOVAC): A global network for volcanic gas monitoring -Network layout and instrument description. J. Geophys. Res. 2010, 115, D05304. [Google Scholar] [CrossRef]
- Vita, F.; Kern, C.; Inguaggiato, S. Development of a portable active long-path differential optical absorption spectroscopy system for volcanic gas measurements. J. Sens. Sens. Syst. 2014, 3, 355–367. [Google Scholar] [CrossRef] [Green Version]
- Vita, F.; Inguaggiato, S.; Bobrowski, N.; Calderone, L.; Galle, B.; Parello, F. Continuous SO2 flux measurements for Vulcano Island, Italy. Ann. Geophys. 2012, 55, 2. [Google Scholar] [CrossRef]
- Vita, F.; Arellano, S.; Inguaggiato, S.; Galle, B. SO2 flux of -VULCANO- volcano from the NOVAC data-base, [Data set], v.001. NOVAC Database 2020. [Google Scholar] [CrossRef]
- Burton, M.R.; Caltabiano, T.; Murè, F.; Salerno, G.; Randazzo, D. SO2 flux from Stromboli during the 2007 eruption: Results from the FLAME network and traverse measurements. J. Volcanol. Geotherm. Res. 2009, 182, 214–220. [Google Scholar] [CrossRef]
- Tamburello, G.; Aiuppa, A.; Kantzas, E.P.; McGonigle, A.J.S.; Ripepe, M. Passive vs. active degassing modes at an open-vent volcano (Stromboli, Italy). Earth Planet. Sci. Lett. 2012, 359, 106–116. [Google Scholar] [CrossRef] [Green Version]
- Inguaggiato, S.; Vita, F.; Rouwet, D.; Bobrowski, N.; Morici, S.; Sollami, A. Geochemical evidence of the renewal of volcanic activity inferred from CO2 soil and SO2 plume fluxes: The 2007 Stromboli eruption (Italy). Bull. Volcanol. 2011, 73, 443–456. [Google Scholar] [CrossRef]
- Granieri, D.; Vita, F.; Inguaggiato, S. Volcanogenic SO2, a natural pollutant: Measurements, modeling and hazard assessment at Vulcano Island (Aeolian Archipelago, Italy). Environ. Pollut. 2017, 231, 219–228. [Google Scholar] [CrossRef]
- Inguaggiato, S.; Calderone, L.; Inguaggiato, C.; Mazot, A.; Morici, S.; Vita, F. Long-time variation of soil CO2 fluxes at summit crater of Vulcano (Italy). Bull. Volcanol. 2012, 74, 1859–1863. [Google Scholar] [CrossRef]
- Inguaggiato, S.; Diliberto, I.S.; Federico, C.; Paonita, A.; Vita, F. Review of the evolution of geochemical monitoring, networks and methodologies applied to the volcanoes of the Aeolian Arc (Italy). Earth-Sci. Rev. 2018, 176, 241–276. [Google Scholar] [CrossRef]
- Perry, S.G.; Cimorelli, A.J.; Paine, R.J.; Brode, R.W.; Weil, J.C.; Venkatram, A.; Wilson, R.B.; Lee, R.F.; Peters, W.D. AERMOD: A dispersion model for industrial source applications. Part II: Model performance against 17 field study databases. J. Appl. Meteorol. Climatol. 2005, 44, 694–708. [Google Scholar] [CrossRef] [Green Version]
- Gibson, M.D.; Pierce, J.R.; Waugh, D.; Kuchta, J.S.; Chisholm, L.; Duck, T.J.; Hopper, J.T.; Beauchamp, S.; King, G.H.; Franklin, J.E.; et al. Identifying the sources driving observed PM2.5 temporal variability over Halifax, Nova Scotia, during BORTAS-B. Atmos. Chem. Phys. 2013, 13, 7199–7213. [Google Scholar] [CrossRef] [Green Version]
- Jenkins, S.F.; Barsotti, S.; Hincks, T.K.; Neri, A.; Phillips, J.C.; Sparks, R.S.J.; Sheldrake, T.; Vougioukalakis, G. Rapid emergency assessment of ash and gas hazard for future eruptions at Santorini Volcano, Greece. J. Appl. Volcanol. 2015, 4, 16. [Google Scholar] [CrossRef] [Green Version]
- Lee, S.S.; Keener, T.C. Dispersion modeling of mercury emissions from coal fired power plants at Coshocton and Manchester, Ohio. J. Sci. 2008, 108, 65–69. [Google Scholar]
- Cimorelli, A.J.; Perry, S.G.; Venkatram, A.; Weil, J.C.; Paine, R.J.; Wilson, R.B.; Lee, R.F.; Peters, W.D.; Paumier, J.O. AERMOD: Description of Model Formulation; U.S. Environmental Protection Agency Report, EPA 2003 454/R,03,002d; U.S. EPA: Washington, DC, USA, 2003; 85p.
- Kumar, A.; Dixit, S.; Varadarajan, C.; Vijayan, A.; Masuraha, A. Evaluation of the AERMOD dispersion model as a function of atmospheric stability for an urban area. Environ. Prog. 2006, 25, 141–151. [Google Scholar] [CrossRef]
- Silverman, K.C.; Tell, J.G.; Sargent, E.V.; Qiu, Z. Comparison of the Industrial Source Complex and AERMOD Dispersion Models: Case Study for Human Health Risk Assessment. J. Air Waste Manag. Assoc. 2007, 57, 1439–1446. [Google Scholar] [CrossRef] [PubMed] [Green Version]
- Cimorelli, A.J.; Perry, S.G.; Venkatram, A.; Weil, J.C.; Paine, R.J.; Wilson, R.B.; Lee, R.F.; Peters, W.D.; Brode, R.W. AERMOD: A Dispersion Model for Industrial Source Applications. Part I: General Model Formulation and Boundary Layer Characterization. J. Appl. Meteorol. Climatol. 2005, 44, 682–693. [Google Scholar] [CrossRef] [Green Version]
- Langner, C.; Klemm, O. A Comparison of Model Performance between AERMOD and AUSTAL2000. J. Air Waste Manag. Assoc. 2011, 61, 640–646. [Google Scholar] [CrossRef] [Green Version]
- Hansell, A.L.; Horwell, C.J.; Oppenheimer, C. The health hazards of volcanoes and geothermal areas. Occup. Environ. Med. 2006, 63, 149–156. [Google Scholar] [CrossRef] [PubMed] [Green Version]
- Diliberto, I.S.; Cangemi, M.; Gagliano, A.L.; Inguaggiato, S.; Paz, M.P.J.; Madonia, P.; Mazot, A.; Pedone, M.; Pisciotta, A. Volcanic gas hazard assessment in the Baia di Levante area (Vulcano Island, Italy) inferred by geochemical investigation of passive fluid degassing. Geosciences 2021, 11, 478. [Google Scholar] [CrossRef]
- Granieri, D.; Carapezza, M.L.; Barberi, F.; Ranaldi, M.; Ricci, T.; Tarchini, L. Atmospheric dispersion of natural carbon dioxide emissions on Vulcano Island, Italy. J. Geophys. Res. Solid Earth 2014, 119, 5398–5413. [Google Scholar] [CrossRef] [Green Version]


| SO2 Fluxes | Pre-Unrest | Unrest | New Degassing Equilibrium | New-Unrest |
|---|---|---|---|---|
| tons day−1 | January–August 2021 | August 2021–April 2022 | April 2022–November 2022 | November 2022–March 2023 |
| min | 4.5 | 14 | 24 | 27 |
| max | 57.7 | 239 | 121 | 190 |
| mean | 22.2 | 89 | 51 | 78 |
| median | 20.4 | 88 | 51 | 68 |
| sd | 7.9 | 35 | 14 | 32 |
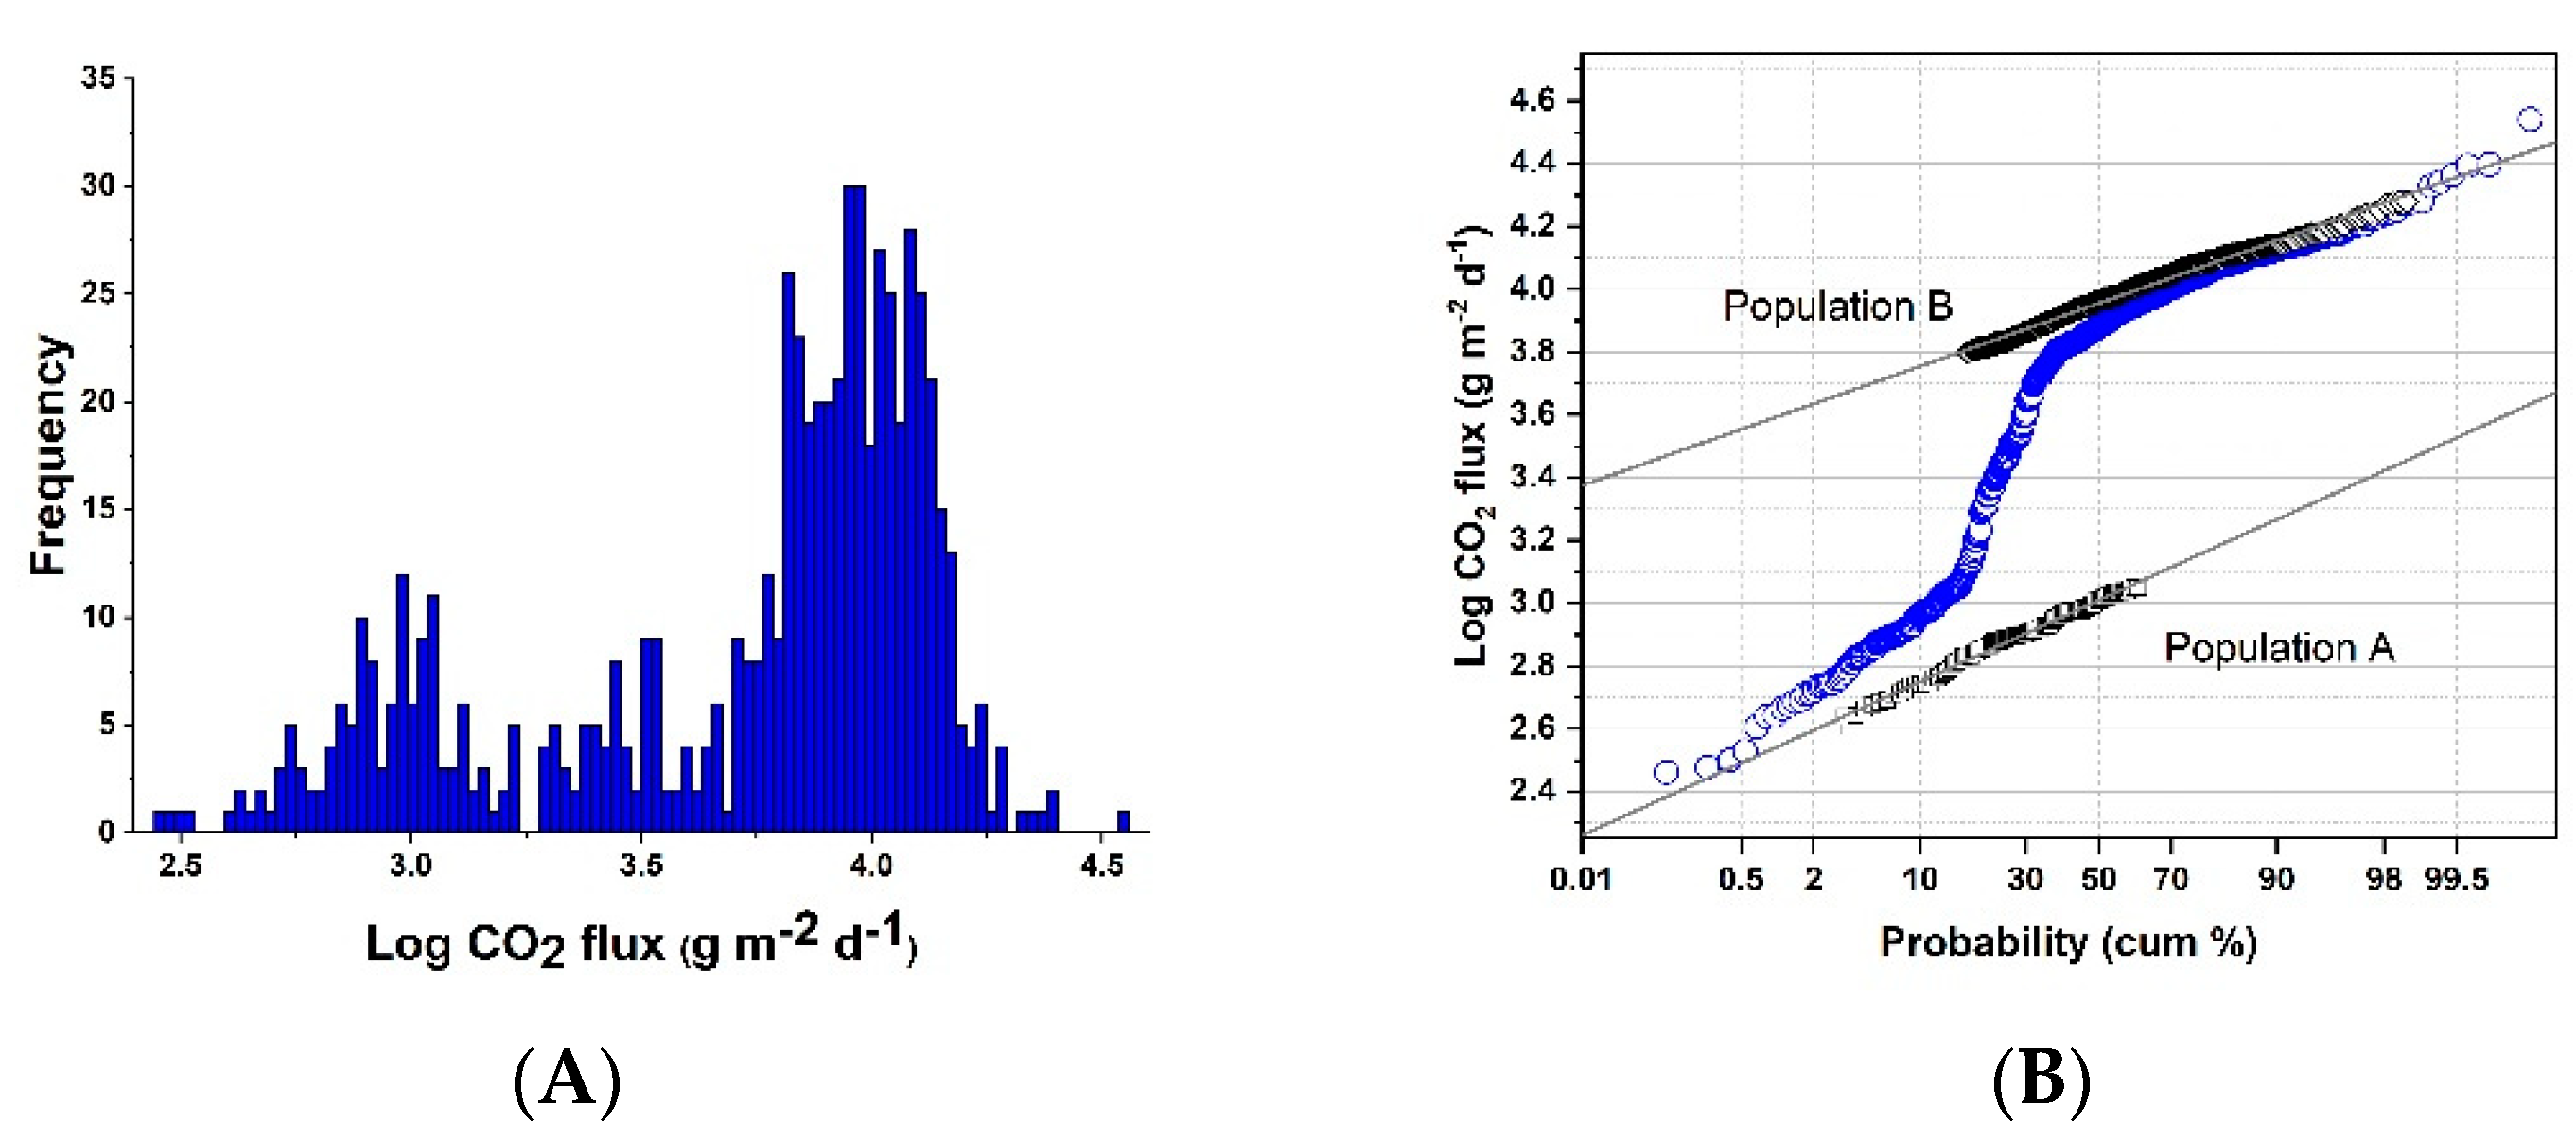
| Population of CO2 Flux | Mean Flux of CO2 (g m−2 d−1) | 90 % Confidence Interval (g m−2 d−1) | Proportion (%) |
|---|---|---|---|
| A | 1144 | 1064–1246 | 25 |
| B | 9498 | 8331–9941 | 75 |
| Pre-Event January–August 2021 | Event August 2021–April 2022 | New Degassing Equilibrium April 2022–November 2022 | New-Event November 2022–March 2023 | |
|---|---|---|---|---|
| min | 289 | 2830 | 4435 | 4635 |
| max | 4526 | 34,741 | 16,859 | 21,956 |
| mean | 1572 | 11,596 | 8006 | 10,556 |
| median | 1106 | 11,871 | 7785 | 10,306 |
| sd | 1014 | 4154 | 1996 | 2893 |
Disclaimer/Publisher’s Note: The statements, opinions and data contained in all publications are solely those of the individual author(s) and contributor(s) and not of MDPI and/or the editor(s). MDPI and/or the editor(s) disclaim responsibility for any injury to people or property resulting from any ideas, methods, instructions or products referred to in the content. |
© 2023 by the authors. Licensee MDPI, Basel, Switzerland. This article is an open access article distributed under the terms and conditions of the Creative Commons Attribution (CC BY) license (https://creativecommons.org/licenses/by/4.0/).
Share and Cite
Vita, F.; Schiavo, B.; Inguaggiato, C.; Inguaggiato, S.; Mazot, A. Environmental and Volcanic Implications of Volatile Output in the Atmosphere of Vulcano Island Detected Using SO2 Plume (2021–23). Remote Sens. 2023, 15, 3086. https://doi.org/10.3390/rs15123086
Vita F, Schiavo B, Inguaggiato C, Inguaggiato S, Mazot A. Environmental and Volcanic Implications of Volatile Output in the Atmosphere of Vulcano Island Detected Using SO2 Plume (2021–23). Remote Sensing. 2023; 15(12):3086. https://doi.org/10.3390/rs15123086
Chicago/Turabian StyleVita, Fabio, Benedetto Schiavo, Claudio Inguaggiato, Salvatore Inguaggiato, and Agnes Mazot. 2023. "Environmental and Volcanic Implications of Volatile Output in the Atmosphere of Vulcano Island Detected Using SO2 Plume (2021–23)" Remote Sensing 15, no. 12: 3086. https://doi.org/10.3390/rs15123086