Article

Microphysical Characteristics of Raindrop Size Distribution and Implications for Dual-Polarization Radar Quantitative Precipitation Estimations in the Tianshan Mountains, China

1
Institute of Desert Meteorology, China Meteorological Administration, Urumqi 830002, China
2
Field Scientific Observation Base of Cloud Precipitation Physics in West Tianshan Mountains, Urumqi 830002, China
3
Xinjiang Cloud Precipitation Physics and Cloud Water Resources Development Laboratory, Urumqi 830002, China
4
Laboratory of Cloud-Precipitation Physics and Severe Storms, Institute of Atmospheric Physics, Chinese Academy of Sciences, Beijing 100029, China
5
College of Earth Science, University of Chinese Academy of Sciences, Beijing 100049, China
*
Author to whom correspondence should be addressed.
Remote Sens. 2023, 15(10), 2668; https://doi.org/10.3390/rs15102668
Submission received: 23 April 2023 / Revised: 19 May 2023 / Accepted: 19 May 2023 / Published: 20 May 2023
(This article belongs to the Special Issue Processing and Application of Weather Radar Data)

Abstract

:
In order to improve the understanding of the microphysical characteristics of raindrop size distribution (DSD) under different rainfall rates (R) classes, and broaden the knowledge of the impact of radar wavelengths and R classes on the QPE of dual-polarization radars in the Tianshan Mountains, a typical arid area in China, we investigated the microphysical characteristics of DSD across R classes and dual-polarimetric radar QPE relationships across radar wavelengths and R classes, based on the DSD data from a PARSIVEL2 disdrometer at Zhaosu in the Tianshan Mountains during the summers of 2020 and 2021. As the R class increased, the DSD became wider and flatter. The mean value of the mass-weighted mean diameters (Dm) increased, while the mean value of logarithm normalized intercept parameters (log10 Nw) decreased after increasing from C1 to C3, as the R class increased. The largest contributions to R and the radar reflectivity factor from large raindrops (diameter > 3 mm) accounted for approximately 50% and 97%, respectively, while 84% of the total raindrops were small raindrops (diameter < 1 mm). Dual-polarization radars—horizontal polarization reflectivity (Zh), differential reflectivity (Zdr), and specific differential phase (Kdp)—were retrieved based on the DSD data using the T-matrix scattering method. The DSD-based polarimetric radar QPE relations of a single-parameter (R(Zh), R(Kdp)), and double-parameters (R(Zh,Zdr), R(Kdp,Zdr)) on the S-, C-, and X-bands were derived and evaluated. Overall, the performance of the R(Kdp) (R(Kdp,Zdr)) scheme was better than that of R(Zh) (R(Zh,Zdr)) for the QPE in the three bands. Furthermore, we have for the first time confirmed and quantified the performance differences in the QPE relationship of dual-polarization radars under different schemes, radar wavelengths, and R classes in typical arid areas of China. Therefore, selecting an appropriate dual-polarization radar band and QPE scheme for different R classes is necessary to improve the QPE ability compared with an independent scheme under all R classes.

1. Introduction

The microphysical characteristics of raindrop size distribution (DSD) are important for understanding the dynamic processes of precipitation [1,2,3]. Furthermore, DSD has an important application value in improving the parameterization scheme of microphysical processes in numerical weather prediction models [4,5,6] and in enhancing the ability to estimate rainfall kinetic energy [7,8,9]. More importantly, DSD information is very helpful for improving the ability of quantitative precipitation estimation (QPE), whether using ground-based or spaceborne radars [10,11,12].
The microphysical characteristics of DSD vary with the climate region, terrain, rainfall type, season, and weather system [13,14,15,16,17,18,19,20]. China is a vast country with significant differences in climatic characteristics among its different regions. Researchers have conducted detailed surveys of DSD in the southern [21,22], eastern [23,24,25,26], northern [27,28,29], and Tibetan Plateau [30,31] regions of China directly affected by the monsoon system and obtained the characteristics of DSD in these regions. However, the research on Xinjiang, which accounts for one-sixth of China’s total land area and is characterized by an arid climate, is insufficient. Xinjiang is not directly affected by the monsoon system and has an uneven distribution of precipitation [32]. Affected by the terrain, the Tianshan Mountains in central Xinjiang, China, and their adjacent areas are rich in precipitation, while the famous Taklimakan Desert and Gurbantunggut Desert form farther away from the Tianshan Mountains [33,34]. In recent years, several studies have partially revealed the characteristics of DSD on the Tianshan Mountains [35,36]. Several recent studies have also shown significant differences in DSD in different seasons (spring, summer, and fall), locations (western and central regions), and altitudes (foot and top stations) in the Tianshan Mountains [37,38,39]. However, further in-depth research is needed on the microphysical characteristics of DSD across the rainfall rate (R) classes in the Tianshan Mountains.
DSD information is of great significance for improving the accuracy of local ground-based radar QPEs by providing accurate microphysical characteristics of raindrops [14,20,40]. The QPE of single-polarization radars has been revealed in many studies by establishing a relationship between radar reflectivity factors and rain rates based on DSD data [41,42,43,44,45,46,47,48]. Single-polarization radar QPE relationships in the southern [22], eastern [25], northern [28], and Tibetan Plateau [31] of China have been established based on local DSD information. Similarly, based on the DSD data observed in the Tianshan Mountains, researchers have established single-polarization radar QPE relationships for different seasons, rainfall types, and altitudes [35,36,37,38,39]. However, the accuracy of the QPE for single-polarization radars is lower than that for dual-polarization radars [49,50,51,52]. Therefore, in recent years, the QPE relationships for dual-polarization radars have been established in different regions of China and have shown significantly better QPE capabilities than single-polarization radars [23,24,26,27,28,29,53,54]. More importantly, both the microphysical characteristics of the DSD and the QPE of the dual-polarization radar are closely related to the rain rate classes [17,18,28,55], and the QPE of the dual-polarization radar is very sensitive to the radar wavelength [24,53]. However, the previous studies mentioned above have mostly focused on the impact of one or two of the three factors, namely the R class, radar wavelength, and QPE scheme, on the QPE of dual-polarization radars. There has been relatively little comprehensive analysis of the impact of these three factors on the QPE of dual-polarization radars, and similarly, there is still a gap in these knowledge in the Tianshan Mountains, a typical arid area in China.
To reveal the microphysical characteristics of DSD under different rain rate classes and to explore the effects of radar wavelengths and rain rate classes on the QPE of dual-polarization radars in the Tianshan Mountains, we conducted this study using DSD data from the Tianshan Mountains and dual-polarization radar variables based on the T-matrix scattering method. The remainder of this paper is organized as follows: The data and methodology are presented in Section 2. Section 3 presents the microphysical characteristics of the DSD under different rain rate classes and the QPE of the dual-polarization radar with different wavelengths in the Tianshan Mountains. Section 4 provides the summary and conclusions of the study.

2. Data and Methodology

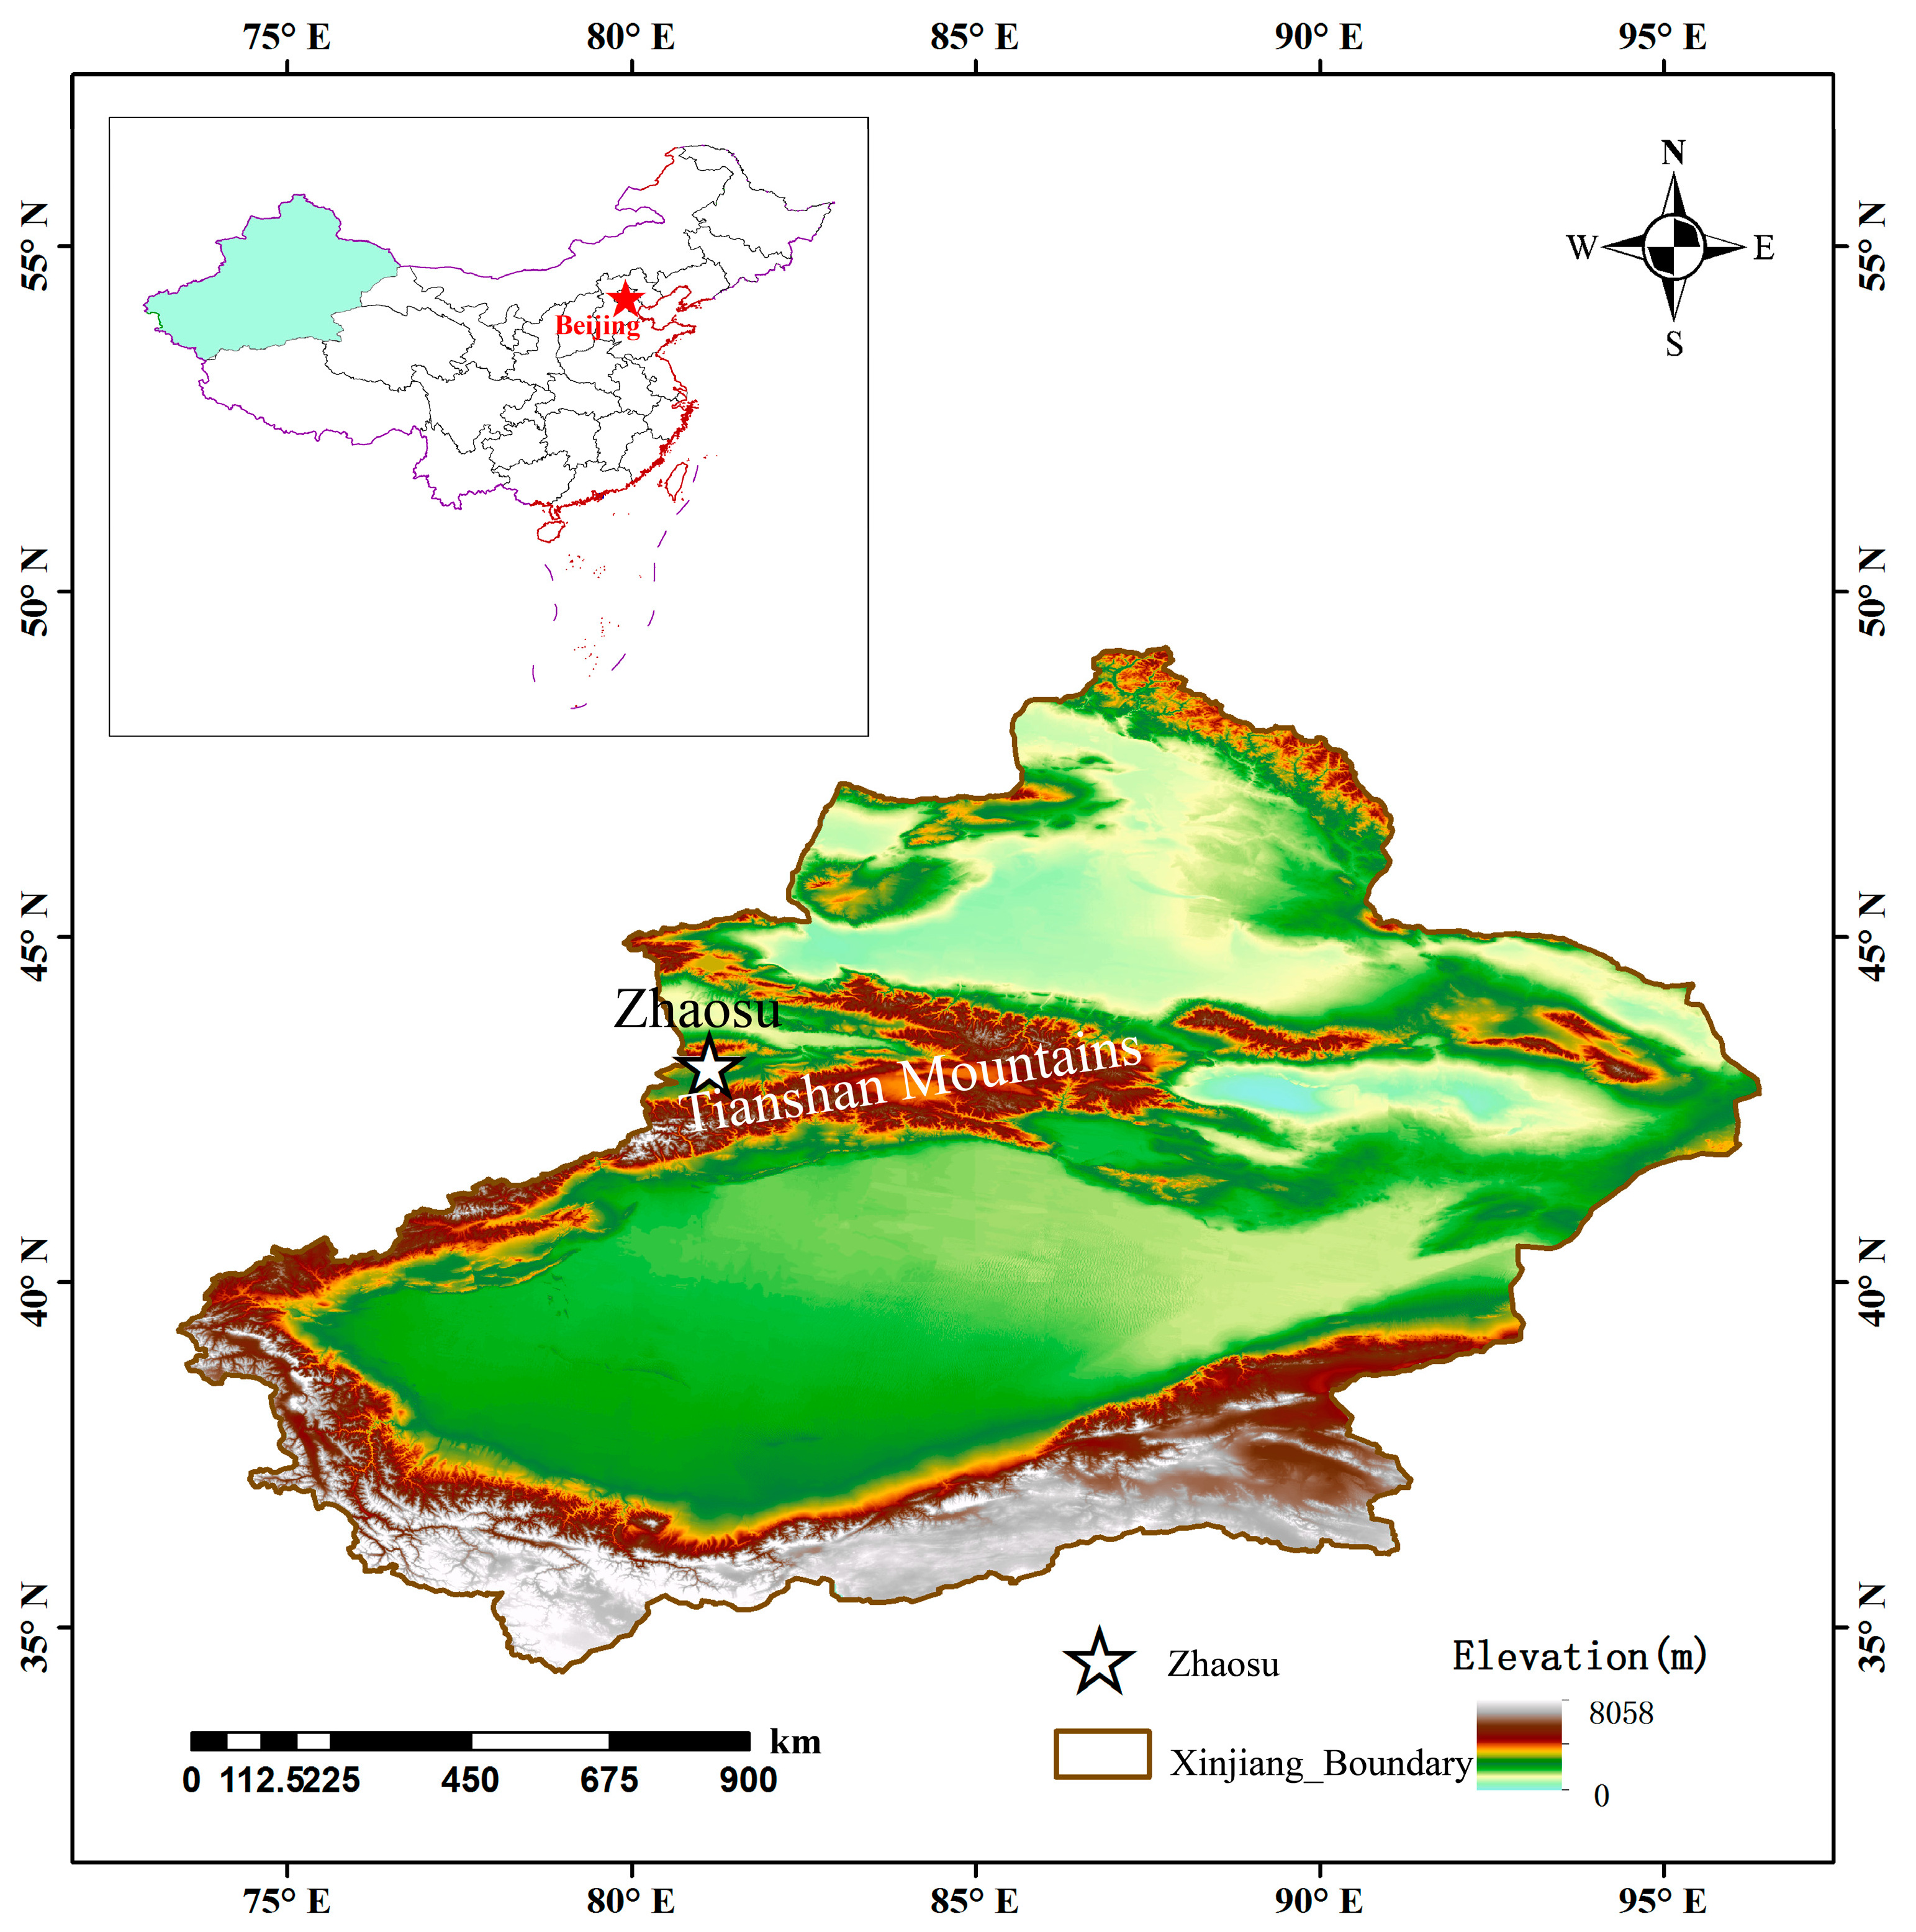
2.1. Study Area and Research Data

Tianshan Mountain is located in northwest China, as well as in Central Asia, and is not directly affected by the monsoon system. Summer is the most important rainfall period. In this study, the DSD measurements were collected at Zhaosu (1850.8 m ASL, 43.14°N, 81.13°E) over the Tianshan Mountains, China (Figure 1), during the 2020 and 2021 summer season, based on the second-generation OTT Particle Size Velocity (PARSIVEL2) disdrometer [54]. The PARSIVEL2 disdrometer obtains DSD information by simultaneously recording particle sizes (32 unequal intervals from 0.062 to 24.5 mm) and fall speeds (32 unequal intervals from 0.05 to 20.8 m s−1) within a resolution of 1 min [56,57].

2.2. Data Quality Control

The DSD data collected by the PARSIVEL2 disdrometer were affected by many factors, such as the measurement accuracy and environmental conditions. Therefore, it is necessary to perform quality control before using DSD data for further analysis. In this study, the first two particle size bins were not considered because of their low signal-to-noise ratios [17,45]. Detected raindrops with very large diameters are likely to be generated by overlapping raindrops rather than by actual independent raindrops [58]; therefore, raindrops with a diameter of more than 8 mm were deleted. Furthermore, to reduce marginal effects [57], strong wind, and splashing effects [59] when measuring raindrops using a PARSIVEL2 disdrometer, the theoretical raindrop fall speed–diameter relation, proposed by Atlas et al. [60] was used to constrain (within ±60%) the correlation between the raindrop fall speed and diameter during measurement, thereby eliminating unrealistic raindrops [59,61]. In this process, the theoretical raindrop fall speed–diameter relation [60] was adjusted by considering a correction factor (1.07) for air density adjustments related to the terrain height of Zhaosu [54]. In addition, samples with raindrop numbers of <10 or with rain rates of <0.1 mm h−1 were removed [14,62]. After data quality control, 14,609 DSD samples were used.

2.3. DSD and DSD-Based Polarimetric Radar QPE Relations

The DSD (N(Di), m−3 mm−1) for raindrop per unit volume per unit diameter interval can be calculated according to Equation (1):
N D i = j = 1 32 n i j A e f f D i Δ t V D i Δ D i
where Di (mm) represents the equivalent spherical raindrop diameter of the ith size class; nij is the number of drops within the ith size class and the ith velocity bin; Δt (s) represents the sampling time resolution (60 s in this study); ΔDi (mm) is the diameter interval of the ith size class; and Aeff (Di) (m2) is the effective sampling area calculated according to Equation (2):
A e f f D i = 180 × 1 0 6 30 0.5     D i
V(Di) (m s−1) is the raindrop velocity at the ith size class [18,45,54,60], which can be expressed as
V ( D i ) = ( 9.65 10.3 exp ( 0.6 D i ) ) δ ( h )
where δ ( h ) represents the correction factor for air density adjustments (1.07), and h (m) is the terrain height of Zhaosu.
The rain rate R (mm h−1), liquid water content LWC (g m−3), total number concentration of raindrops Nt (m−3), median volume diameter D0 (mm), radar reflectivity factor Z (mm6 m−3), the normalized intercept parameter Nw (mm−1 m−3), and the mass-weighted mean diameter Dm (mm) are expressed by Equations (4)–(10), respectively:
R = 6 π 1 0 4 i = 1 32 N D i D i 3 V D i Δ D i
L W C = π 6000 i = 1 32 N D i D i 3 Δ D i
N t = i = 1 32 N D i Δ D i
i = 1 D 0 N D 0 D i 3 Δ D i = i = D 0 32 N D 0 D i 3 Δ D i
Z = i = 1 32 N D i D i 6 Δ D i
N w = 4 4 π · ρ w · 10 3 · W D m 4
D m = i = 1 32 N D i · D i 4 · D i i = 1 32 N D i · D i 3 · D i
The gamma model describing DSD [13] is given by Equation (11).
N ( D ) = N 0 D μ exp ( Λ D )
where N0 (mm−1-μ m−3), μ (−), and Λ (mm−1) represent the intercept parameter, the shape factor, and the slope parameter of the gamma model, respectively [19]. These three parameters were calculated using the truncated moment method [63,64] with the third–fourth–sixth moments [13,14,15,18,45,54], where the nth order moment Mn (mmn m−3), N0, μ, and Λ can be calculated according to the following Equation:
M n = 0 D n N D d D
G = M 4 3 M 3 2 M 6
N 0 = M 3 · μ + 4 Γ μ + 4
μ = 11 · G 8 + G · G + 8 2 1 G
Λ = μ + 4 M 3 M 4
DSD-based QPE relations of dual-polarization radars have been proven to be very helpful in improving the accuracy of QPE [23,24,26,27,28,29,53,54], and these DSD-based QPE relations are established by the dual-polarization radar variables: radar reflectivity at horizontal or vertical polarization Zh,v (mm6 m−3), differential reflectivity Zdr (dB), and the specific differential phase Kdp (° km−1), which can be calculated using the observed DSD based on the method of T-matrix scattering [52,65,66,67] as follows:
Z h , v = 4 λ 4 π 4 K w 2 D m i n D m a x f h h , v v D 2 N ( D ) d D
Z d r = 10 l o g 10 Z h Z v
K d p = 10 3 180 π λ R e D m i n D m a x f h D f v D N ( D ) d D
where λ (mm) and Kw (−) represent the radar wavelength (for the S-, C-, and X-band, the values are 111.0 mm, 53.5 mm, and 33.3 mm, respectively), and the dielectric constant factor of water (here is 0.9639), respectively; fhh,vv(D) and fh,v(D) represent the backscattering amplitude and the forward scattering amplitude of a raindrop with horizontal and vertical polarizations, respectively. In addition, the raindrops followed the axis–ratio relationship proposed by Brandes [52].
The DSD-based QPE relationships, including R(Zh), R(Kdp), R(Zh,Zdr), and R(Kdp,Zdr) of the dual-polarization radar, were derived for the S-, C-, and X-bands. The dual-polarization radar QPE estimators are as follows:
R ( Z h ) = α Z h β
R ( K d p ) = α K d p β
R ( Z h , Z d r ) = α Z h β 10 γ Z d r
R ( K d p , Z d r ) = α K d p β 10 γ Z d r
where α, β, and γ are coefficients in the corresponding QPE estimator.

2.4. Assessing the Accuracy of QPE Estimators

The R value calculated using Equation (4), containing DSD information, was used to evaluate the performance of the QPE algorithms (Equations (20)–(23)) in the S-, C-, and X-band dual-polarization radars at Zhaosu. The correlation coefficient (CC), root mean square error (RMSE), and normalized mean absolute error (NMAE) were adopted for the evaluation of the QPE algorithms in this study, and are defined as
C C = i = 1 n ( R i R ¯ ) ( R e , i R e ¯ ) i = 1 n ( R i R ¯ ) 2 i = 1 n ( R e , i R e ¯ ) 2
R M S E = 1 n i = 1 n ( R e , i R i ) 2
N M A E = 1 n i = 1 n R e , i R i R ¯
where n represents the number of samples; R i and R ¯ are the individual and mean R calculated from the DSD data, respectively; and R e , i and R e ¯ represent the individual and mean R calculated from the QPE algorithms, respectively.

3. Results

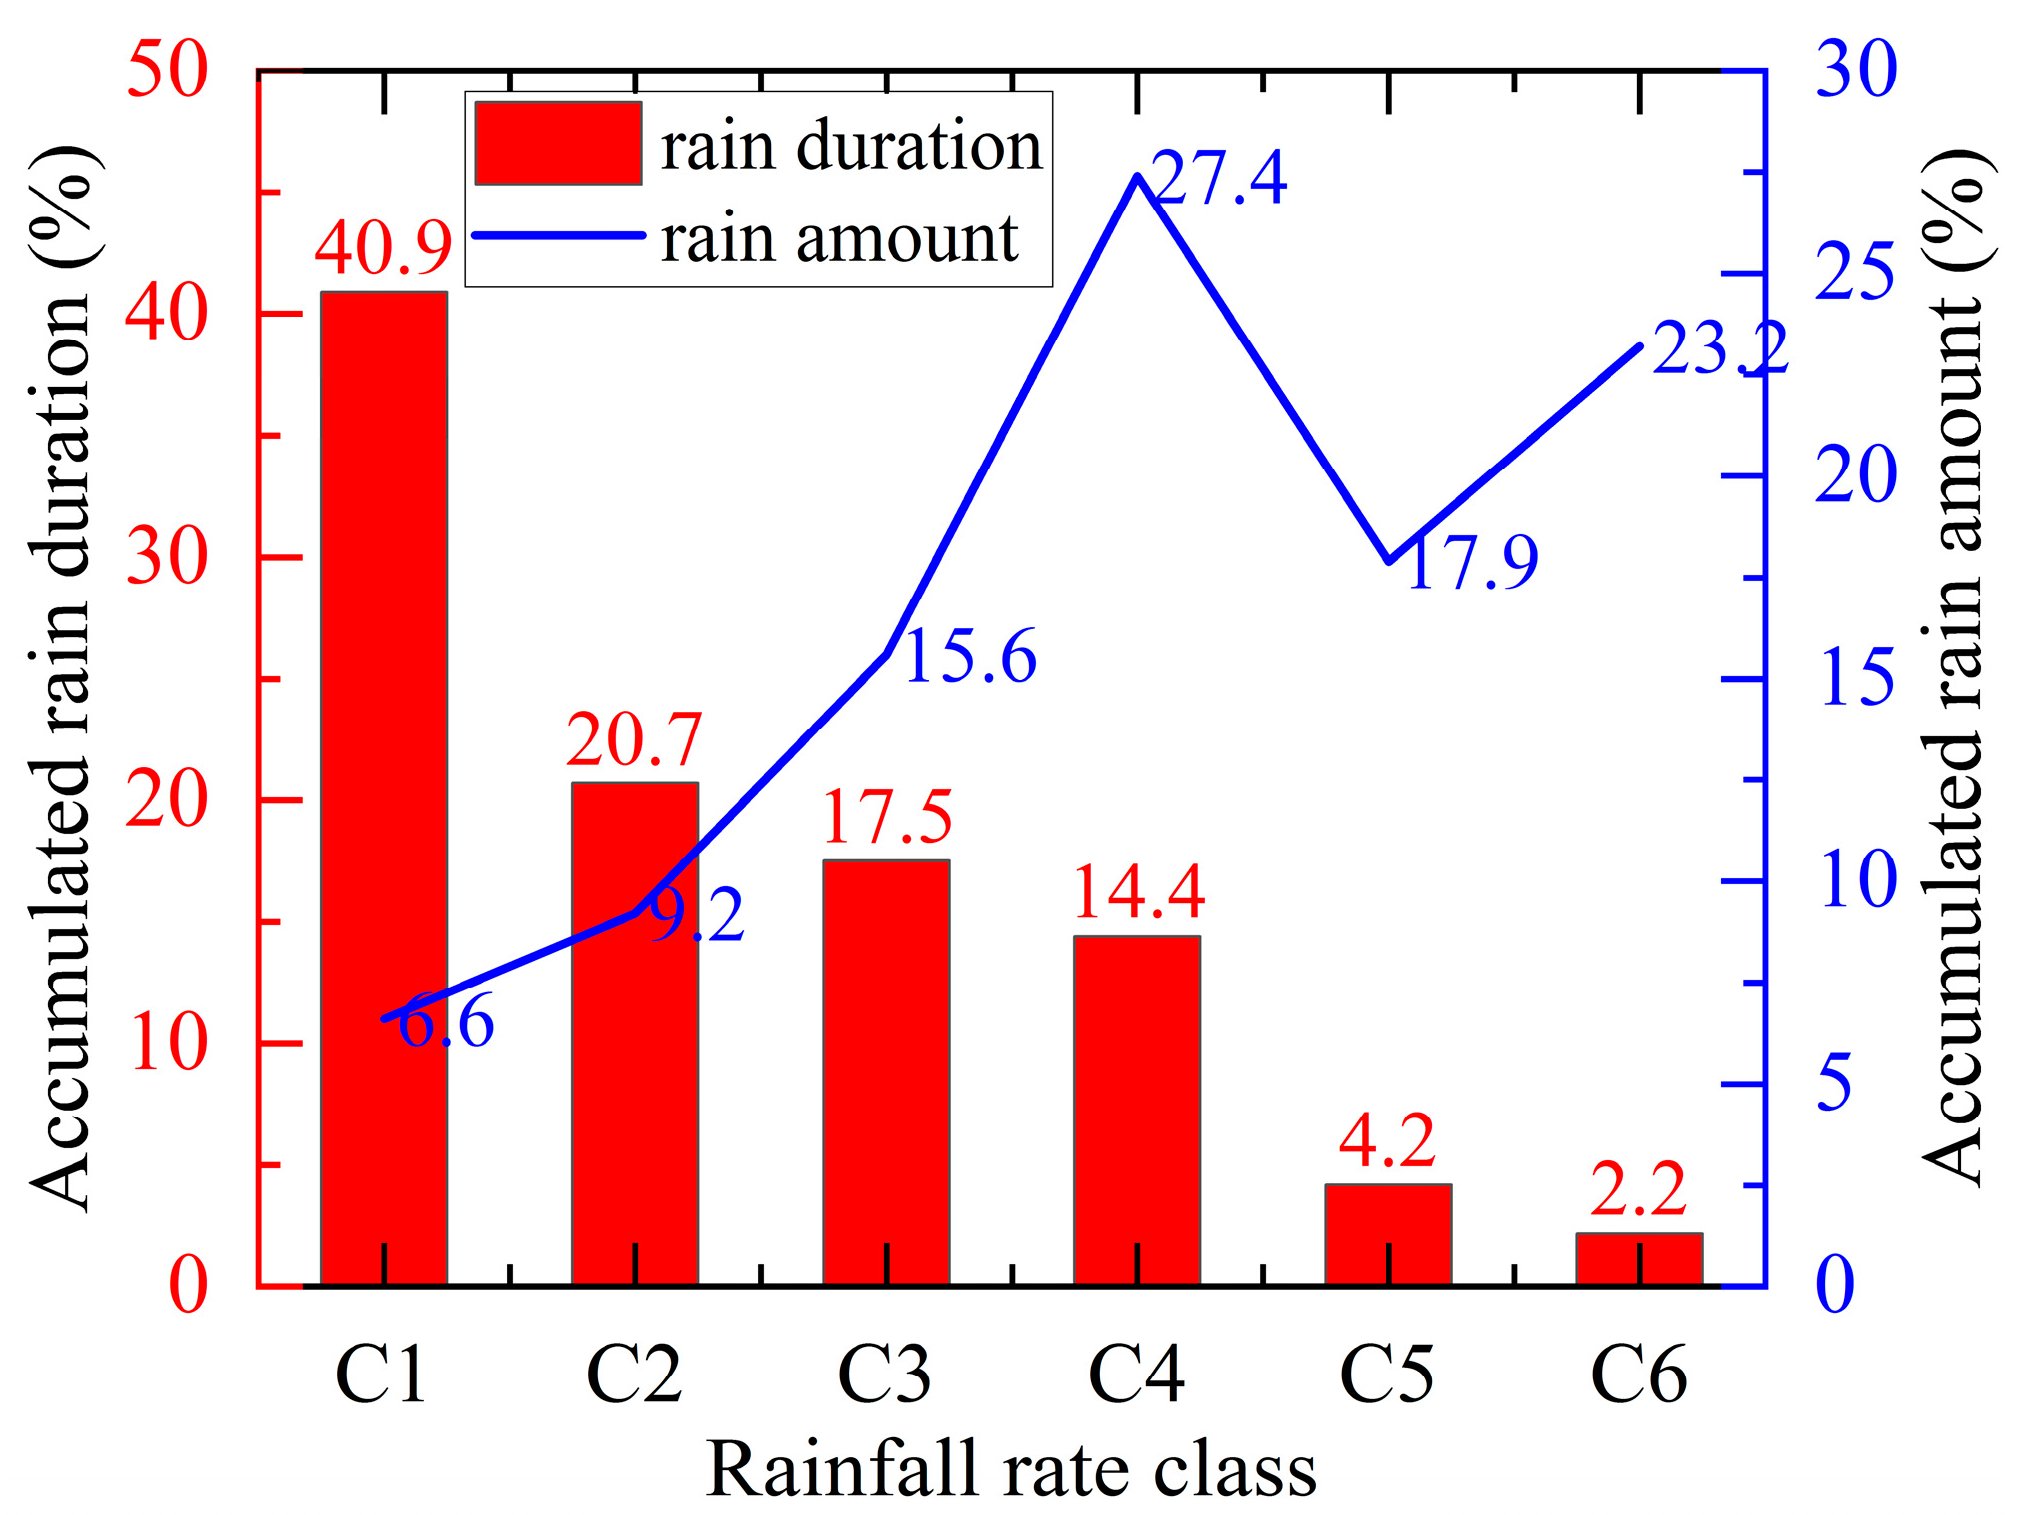
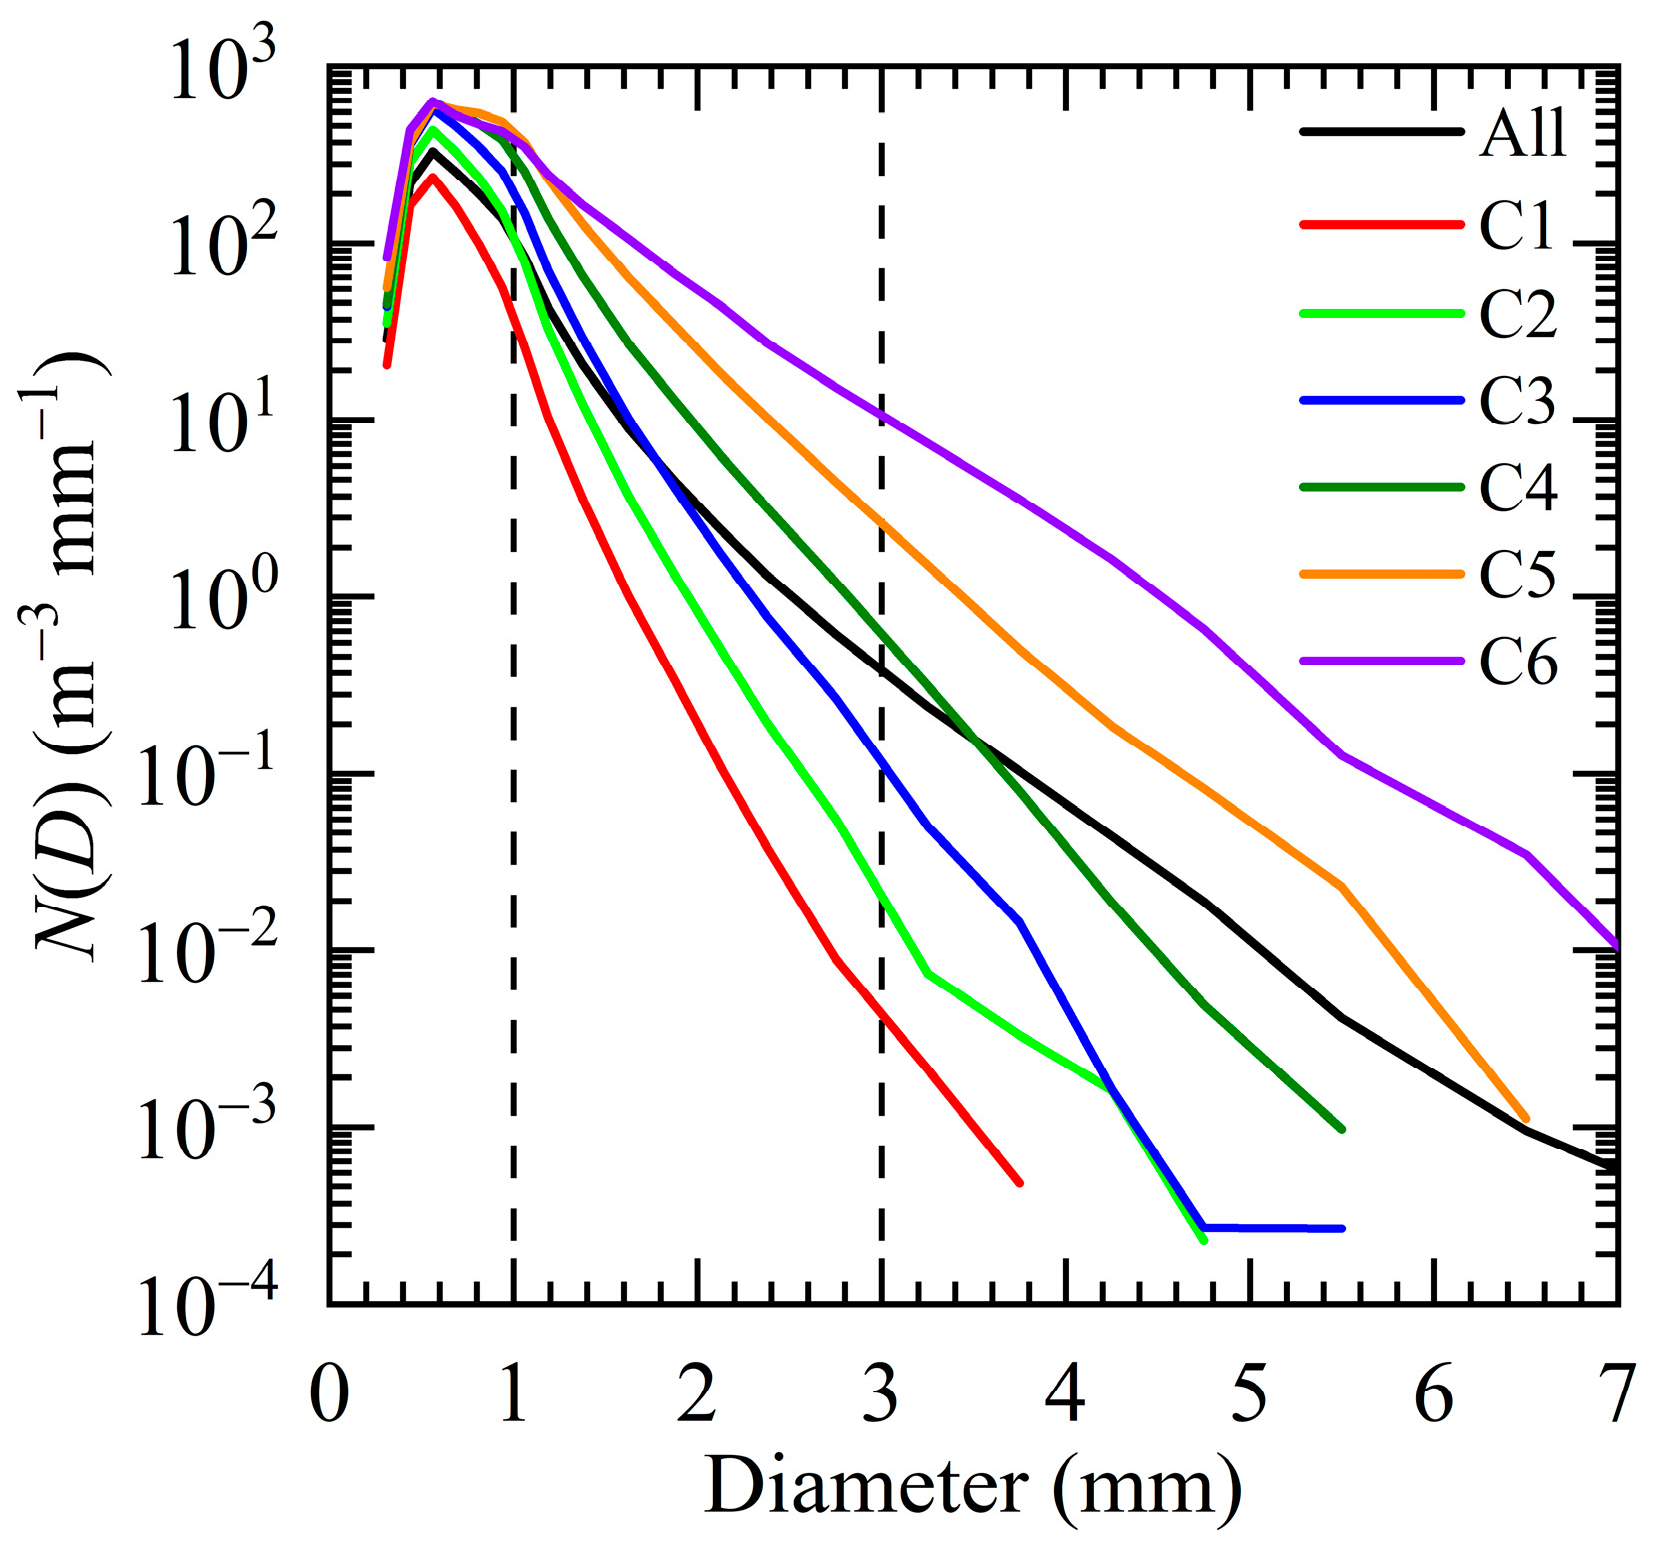
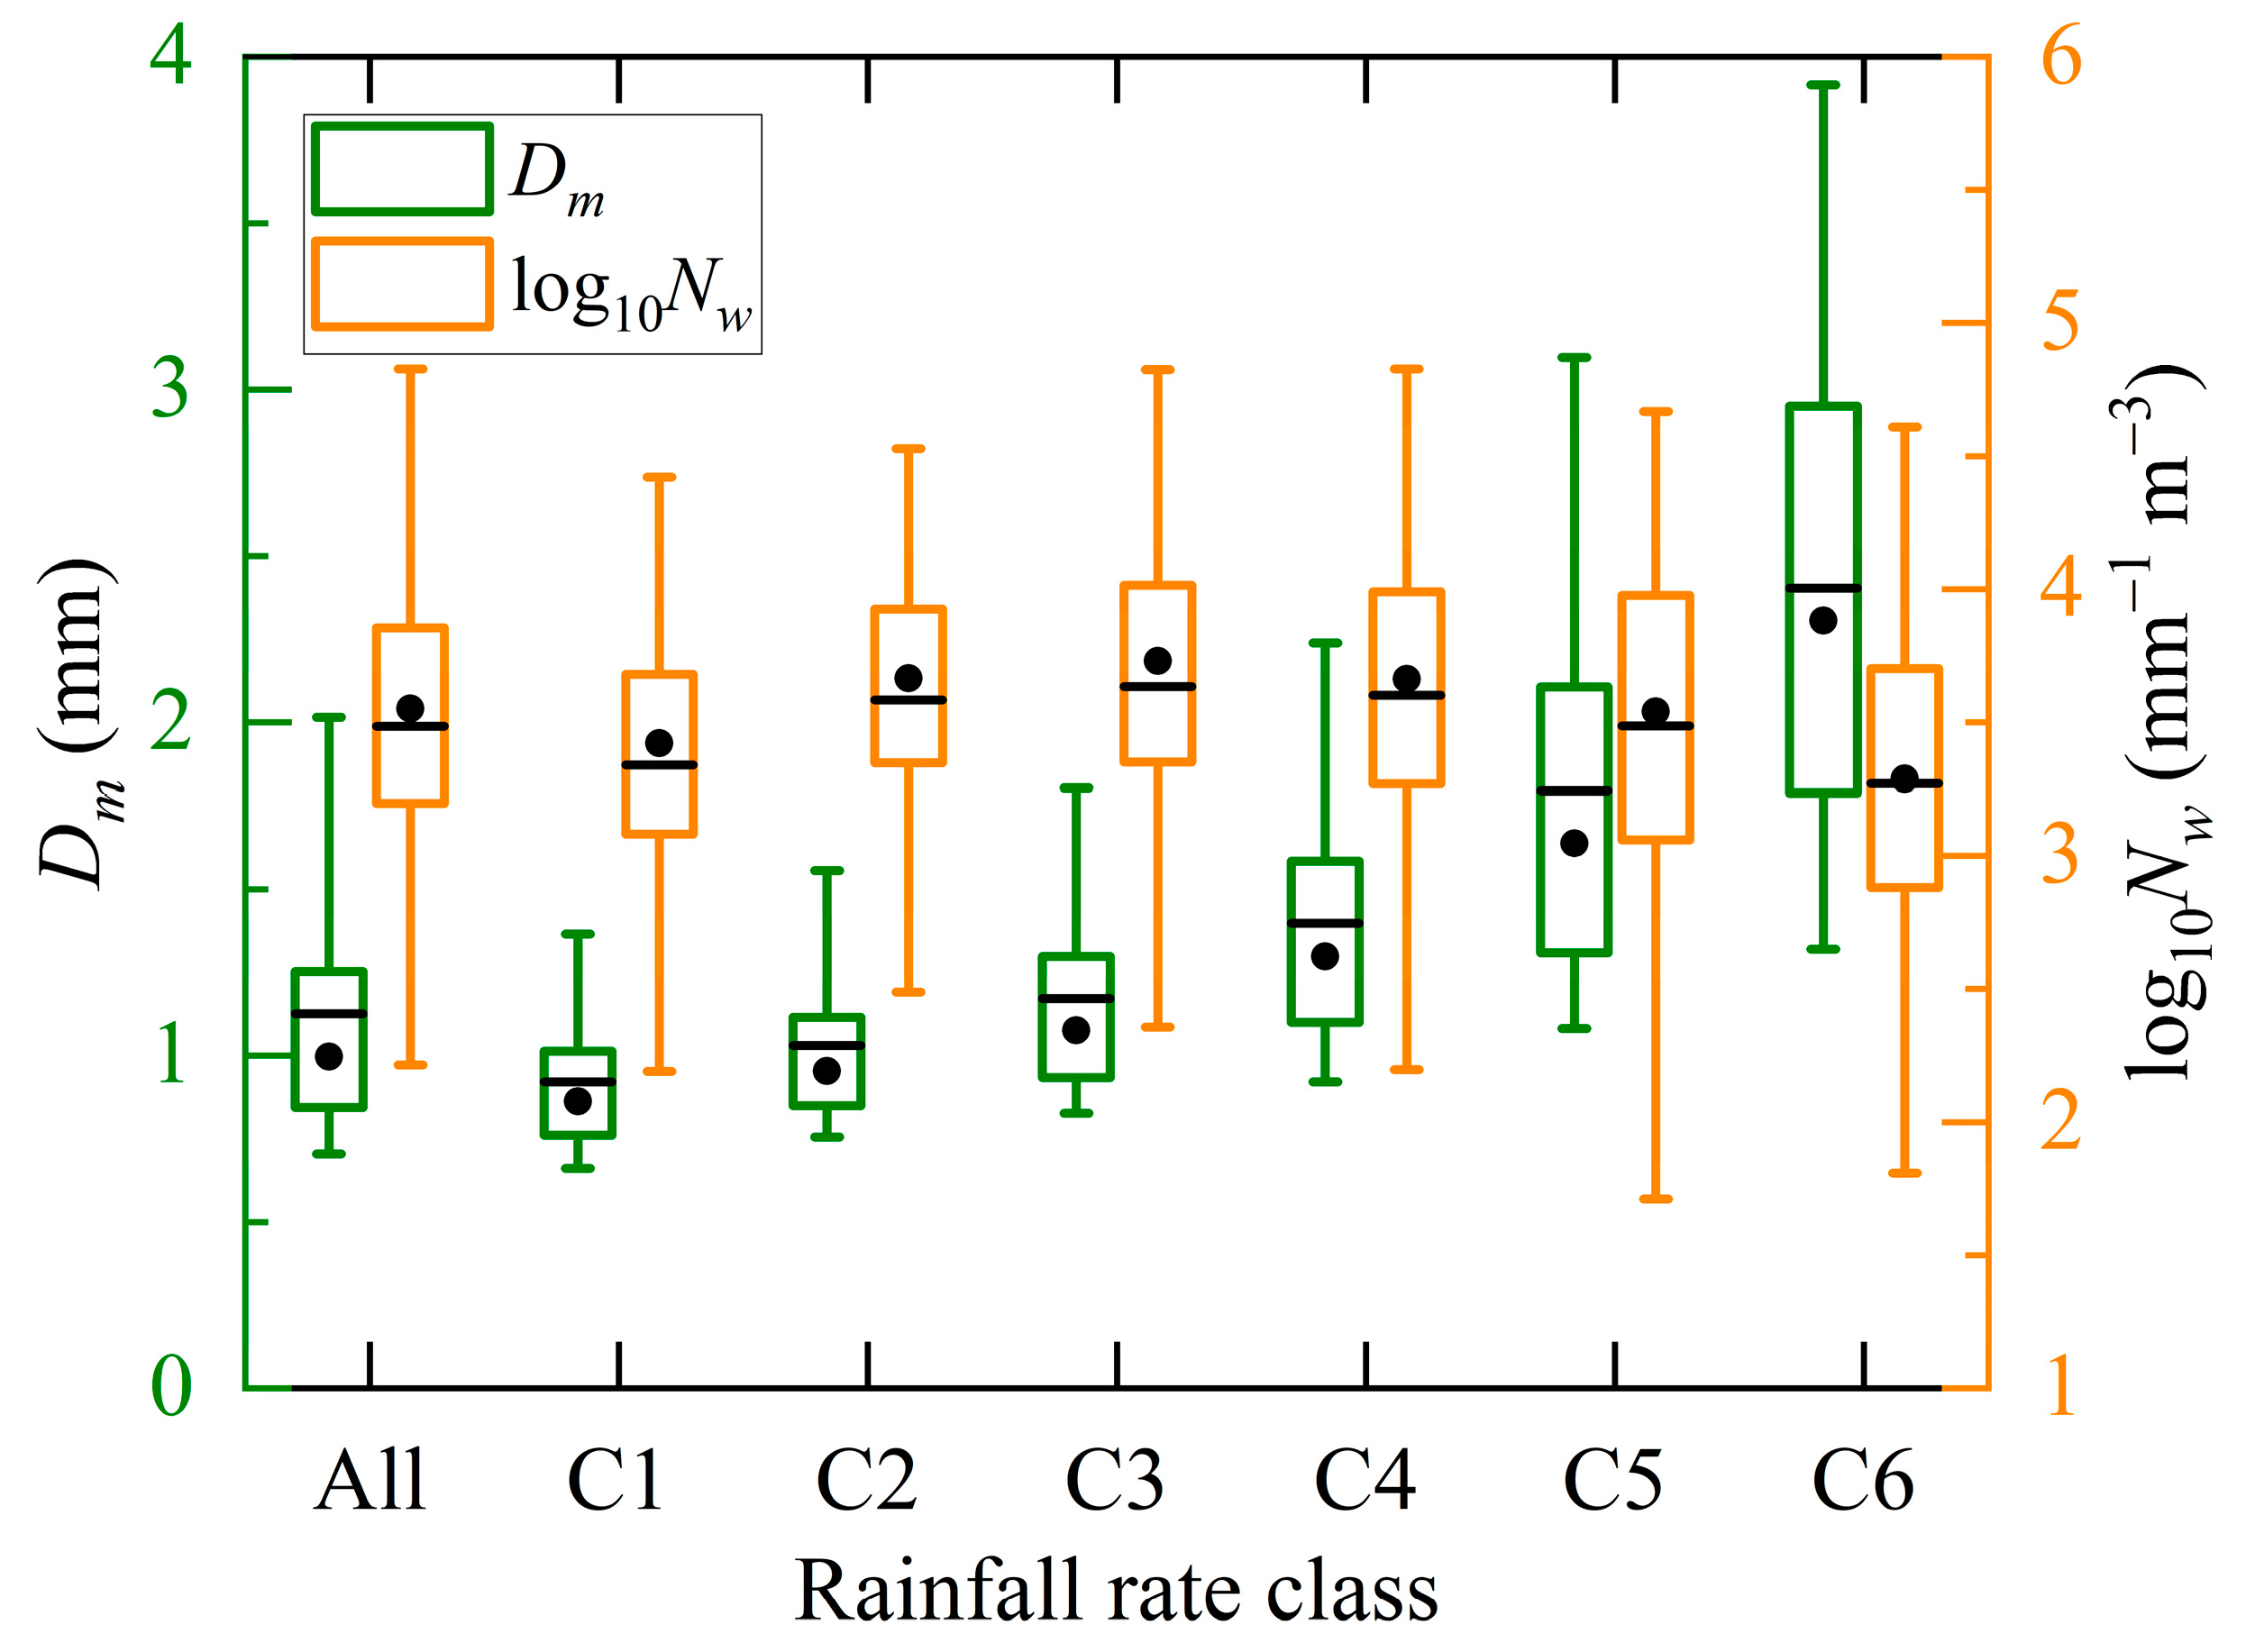
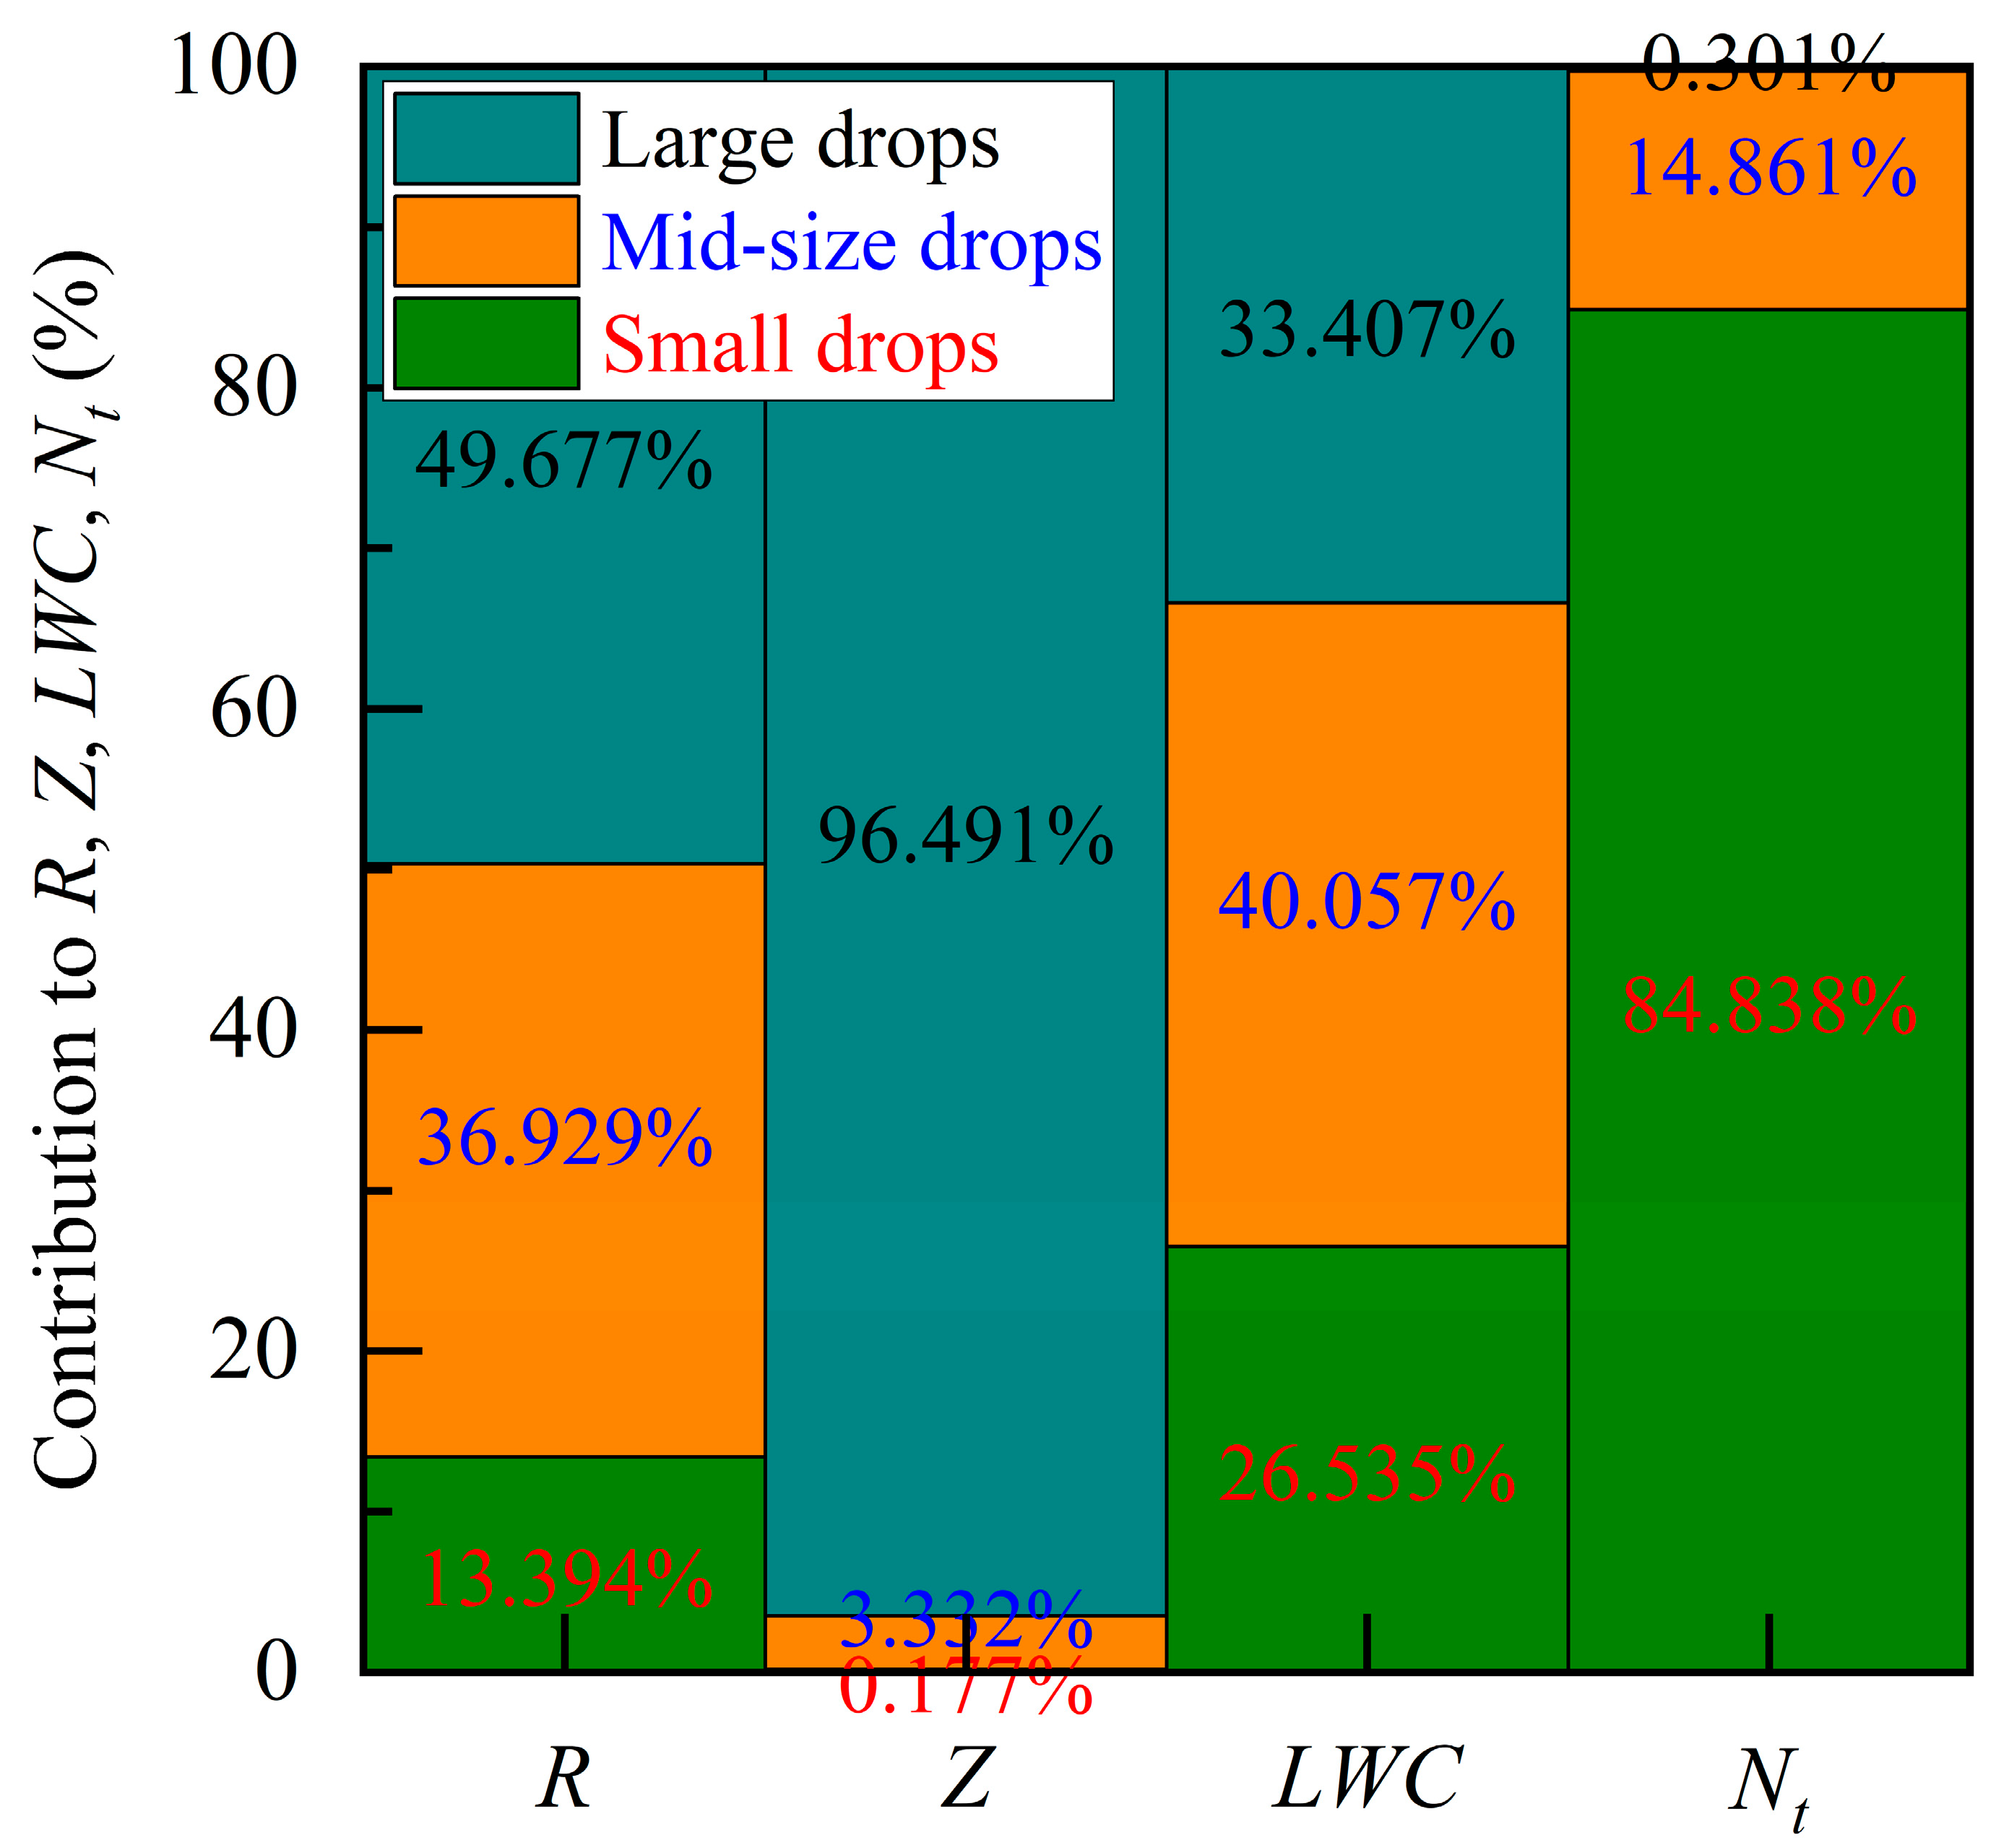
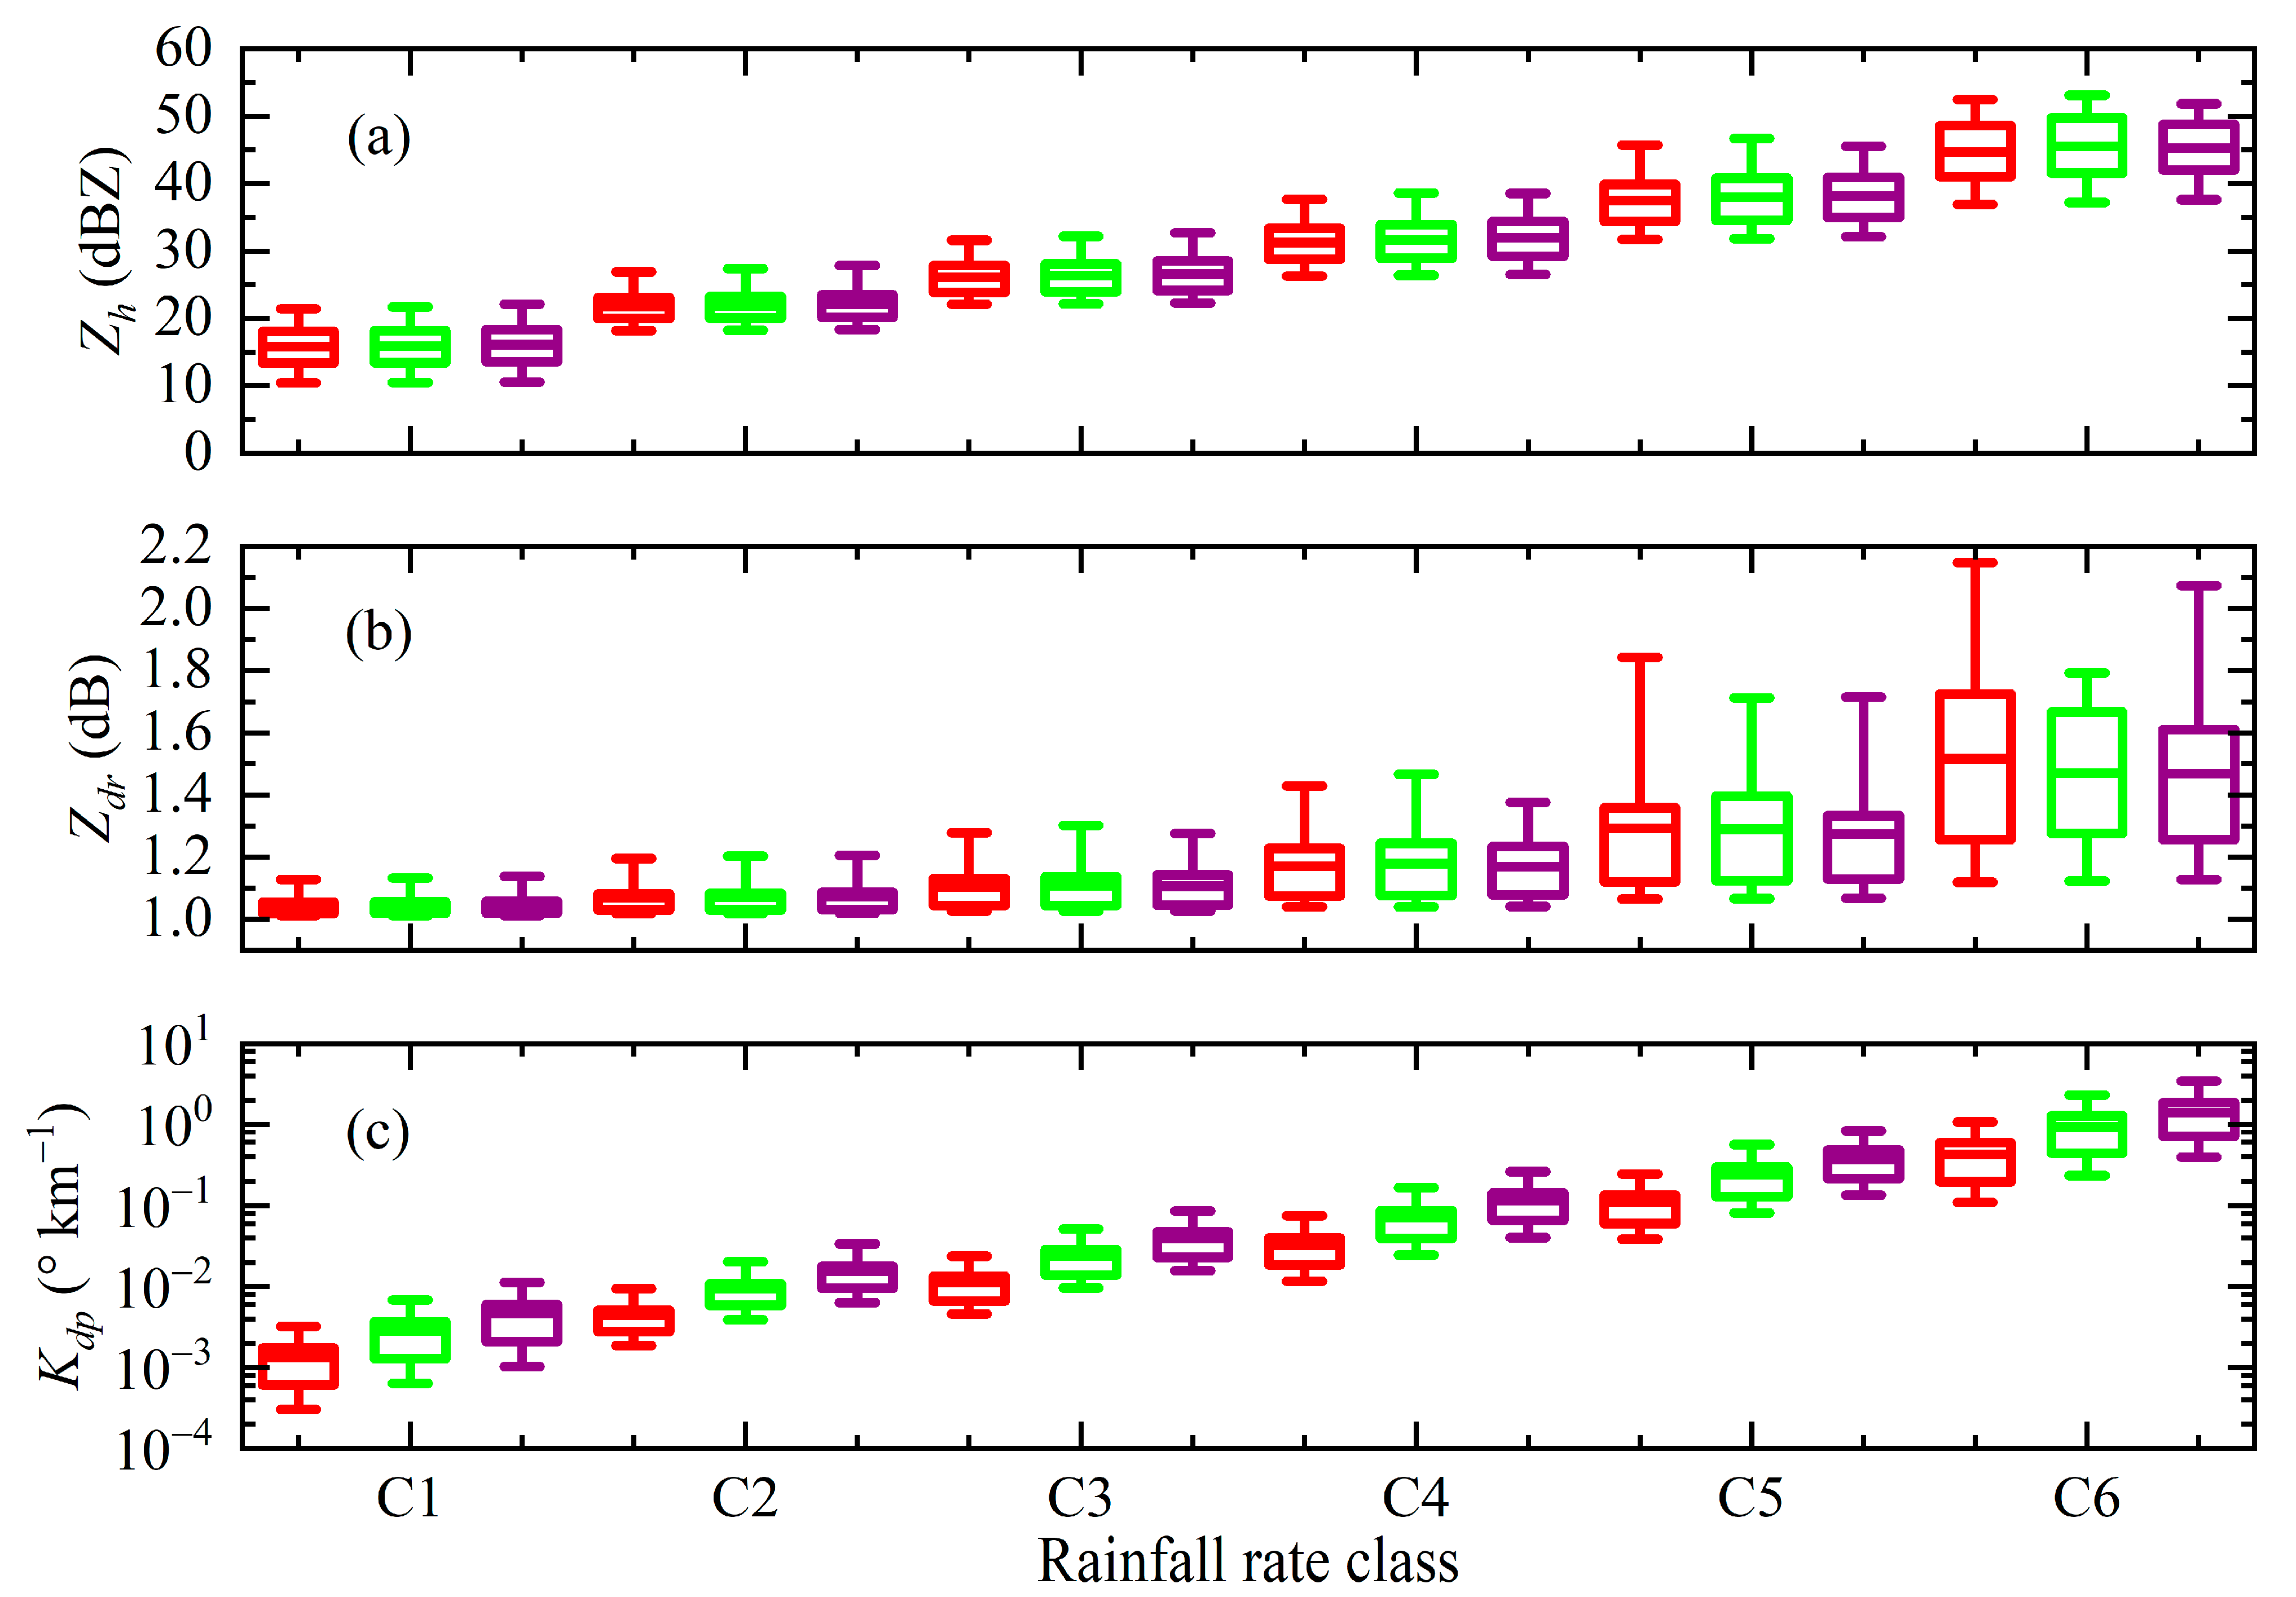
3.1. DSD Characteristics under Different Rain Rate Classes

Many previous studies have revealed that the characteristics of DSD vary with rain rates (R) [17,18,24,30,53]. To reveal the microphysical characteristics of DSD under different rain rate classes, referring to previous classification standards [36,38], all the samples were classified into six classes on the basis of R: C1: 0.1–0.5 mm h−1, C2: 0.5–1 mm h−1, C3: 1–2 mm h−1, C4: 2–5 mm h−1, C5: 5–10 mm h−1, and C6: ≥10 mm h−1. The number of samples for each class is listed in Table 1. The accumulated rain duration (red histogram) and amount (blue line) for the six R classes in Zhaosu are shown in Figure 2. As the R class increased, its contribution to the total rainfall duration decreased. Specifically, the first two classes (C1 and C2) contributed the most to the total rain duration, accounting for 40.9% and 20.7%, respectively, whereas the last two classes (C5 and C6) contributed the least to the total rain duration, contributing less than 7%. The largest contributor to the total amount of rain was the fourth class (C4), followed by the last class (C6), accounting for 27.4% and 23.2%, respectively.
The DSD variations for the different R classes in Zhaosu are shown in Figure 3. As the R class increased, the raindrop spectrum widened, along with the increased concentrations of large raindrops (diameter > 3 mm), medium-size raindrops (1 ≤ diameter ≤ 3 mm), and small raindrops (diameter < 1 mm) [18,68], and reached the peak concentration at small raindrops around 0.6 mm in diameter for all classes (color lines) and all samples (black line). For small raindrops, the raindrop spectra of all the samples were between those of C1 and C2, whereas the raindrop spectrum of medium-size raindrops for all samples was similar to that of C3. For large raindrops, the raindrop spectra of all the samples were between C4 and C5. Box-and-whisker plots of the variations in the mass-weighted mean diameter (Dm) and normalized intercept parameter (log10Nw) for the six R classes are shown in Figure 4. The mean Dm value increased from 0.92 mm at C1 to 2.40 mm at C6 with an increasing R class, while the mean log10Nw value first increased and then decreased with an increasing R class, reaching a maximum at C3 (3.63 mm−1 m−3) and a minimum at C6 (3.27 mm−1 m−3). Furthermore, several other important DSD parameters, such as R, median volume diameter (D0), liquid water content (LWC), radar reflectivity factor (Z), and total number concentration of raindrops (Nt), for different R classes in Zhaosu are shown in Table 1. Their mean values increased with an increasing R class.
The DSD was composed of raindrops of different sizes (large, medium, and small) and their corresponding concentrations. Therefore, discussing the contribution of raindrops of various sizes to the parameters is conducive to further understanding the DSD [37]. Figure 5 illustrates the contributions of small, medium-size, and large drops to R, Z, LWC, and Nt in Zhaosu. Large raindrops contributed nearly half of R; small raindrops contributed less than 14% to R; and medium-size raindrops contributed nearly 37% to R. The vast majority of the contributions to Z were from large raindrops (over 96%), whereas the contribution of small raindrops to Z was minimal (less than 0.2%). Most contributions to LWC came from medium-size raindrops (>40%), followed by large raindrops (>33%). The majority of the contribution to Nt was from small raindrops (over 96%), whereas the contribution of large raindrops to Nt was minimal (approximately 0.3%).

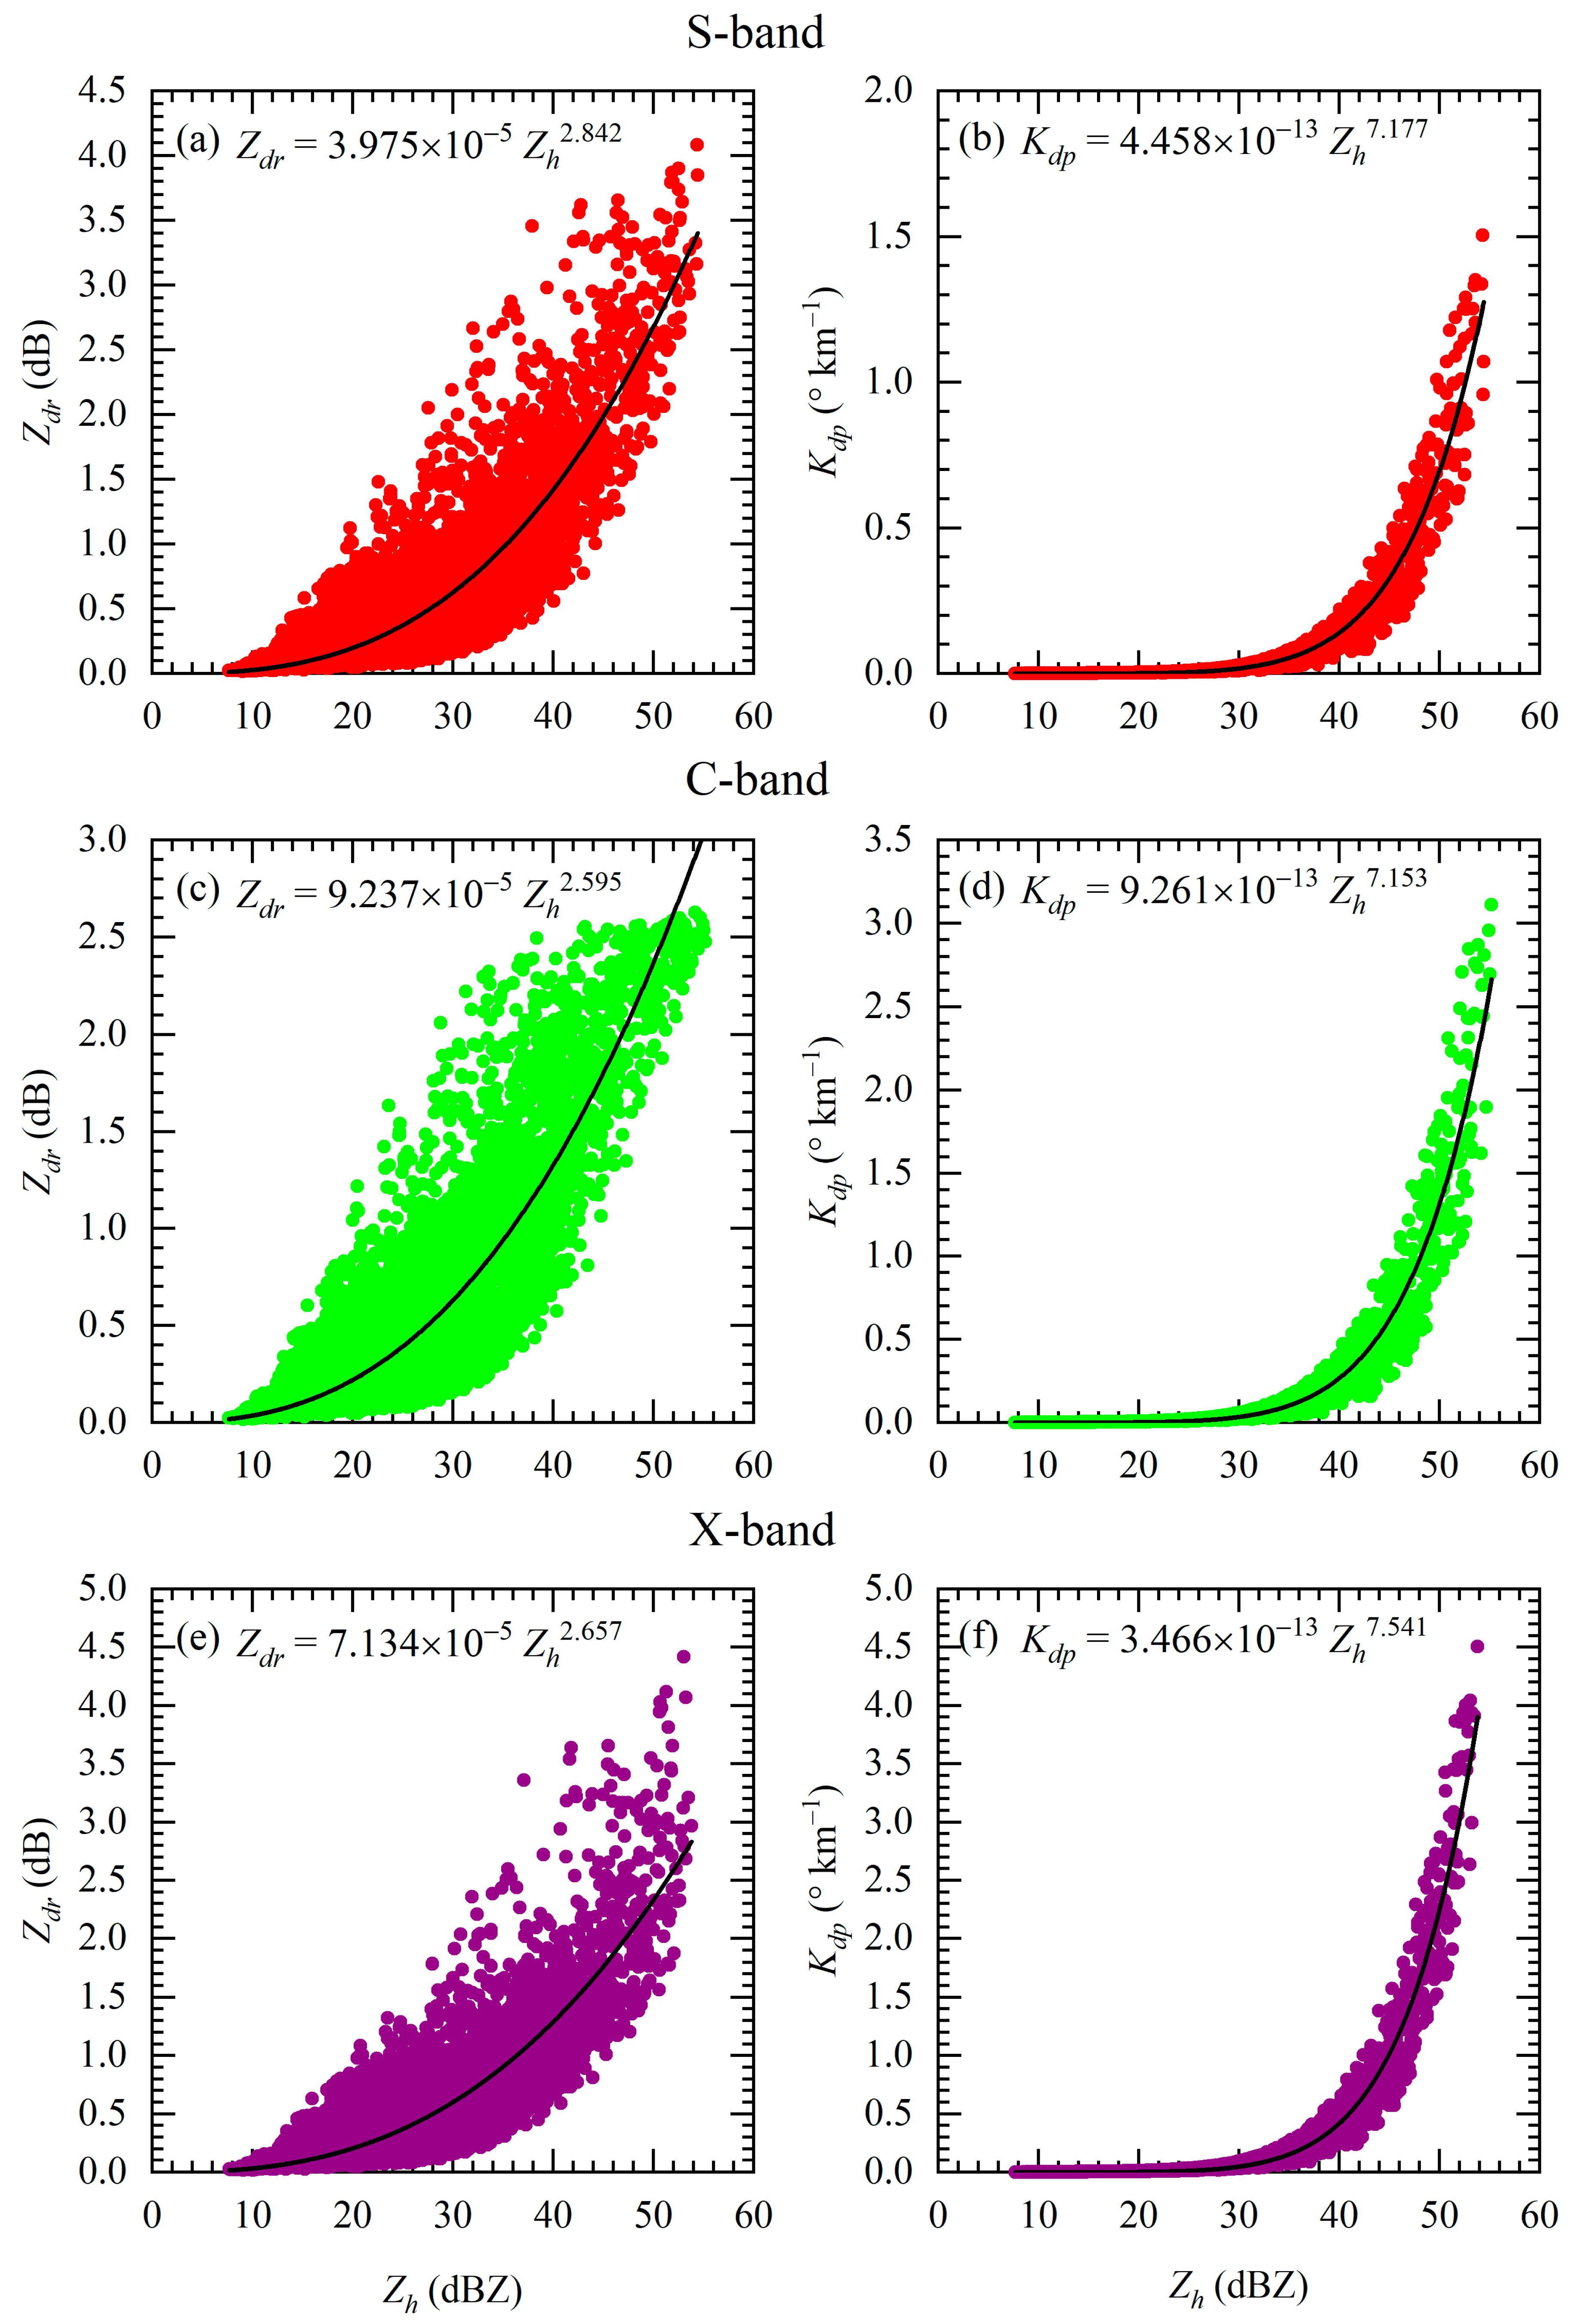
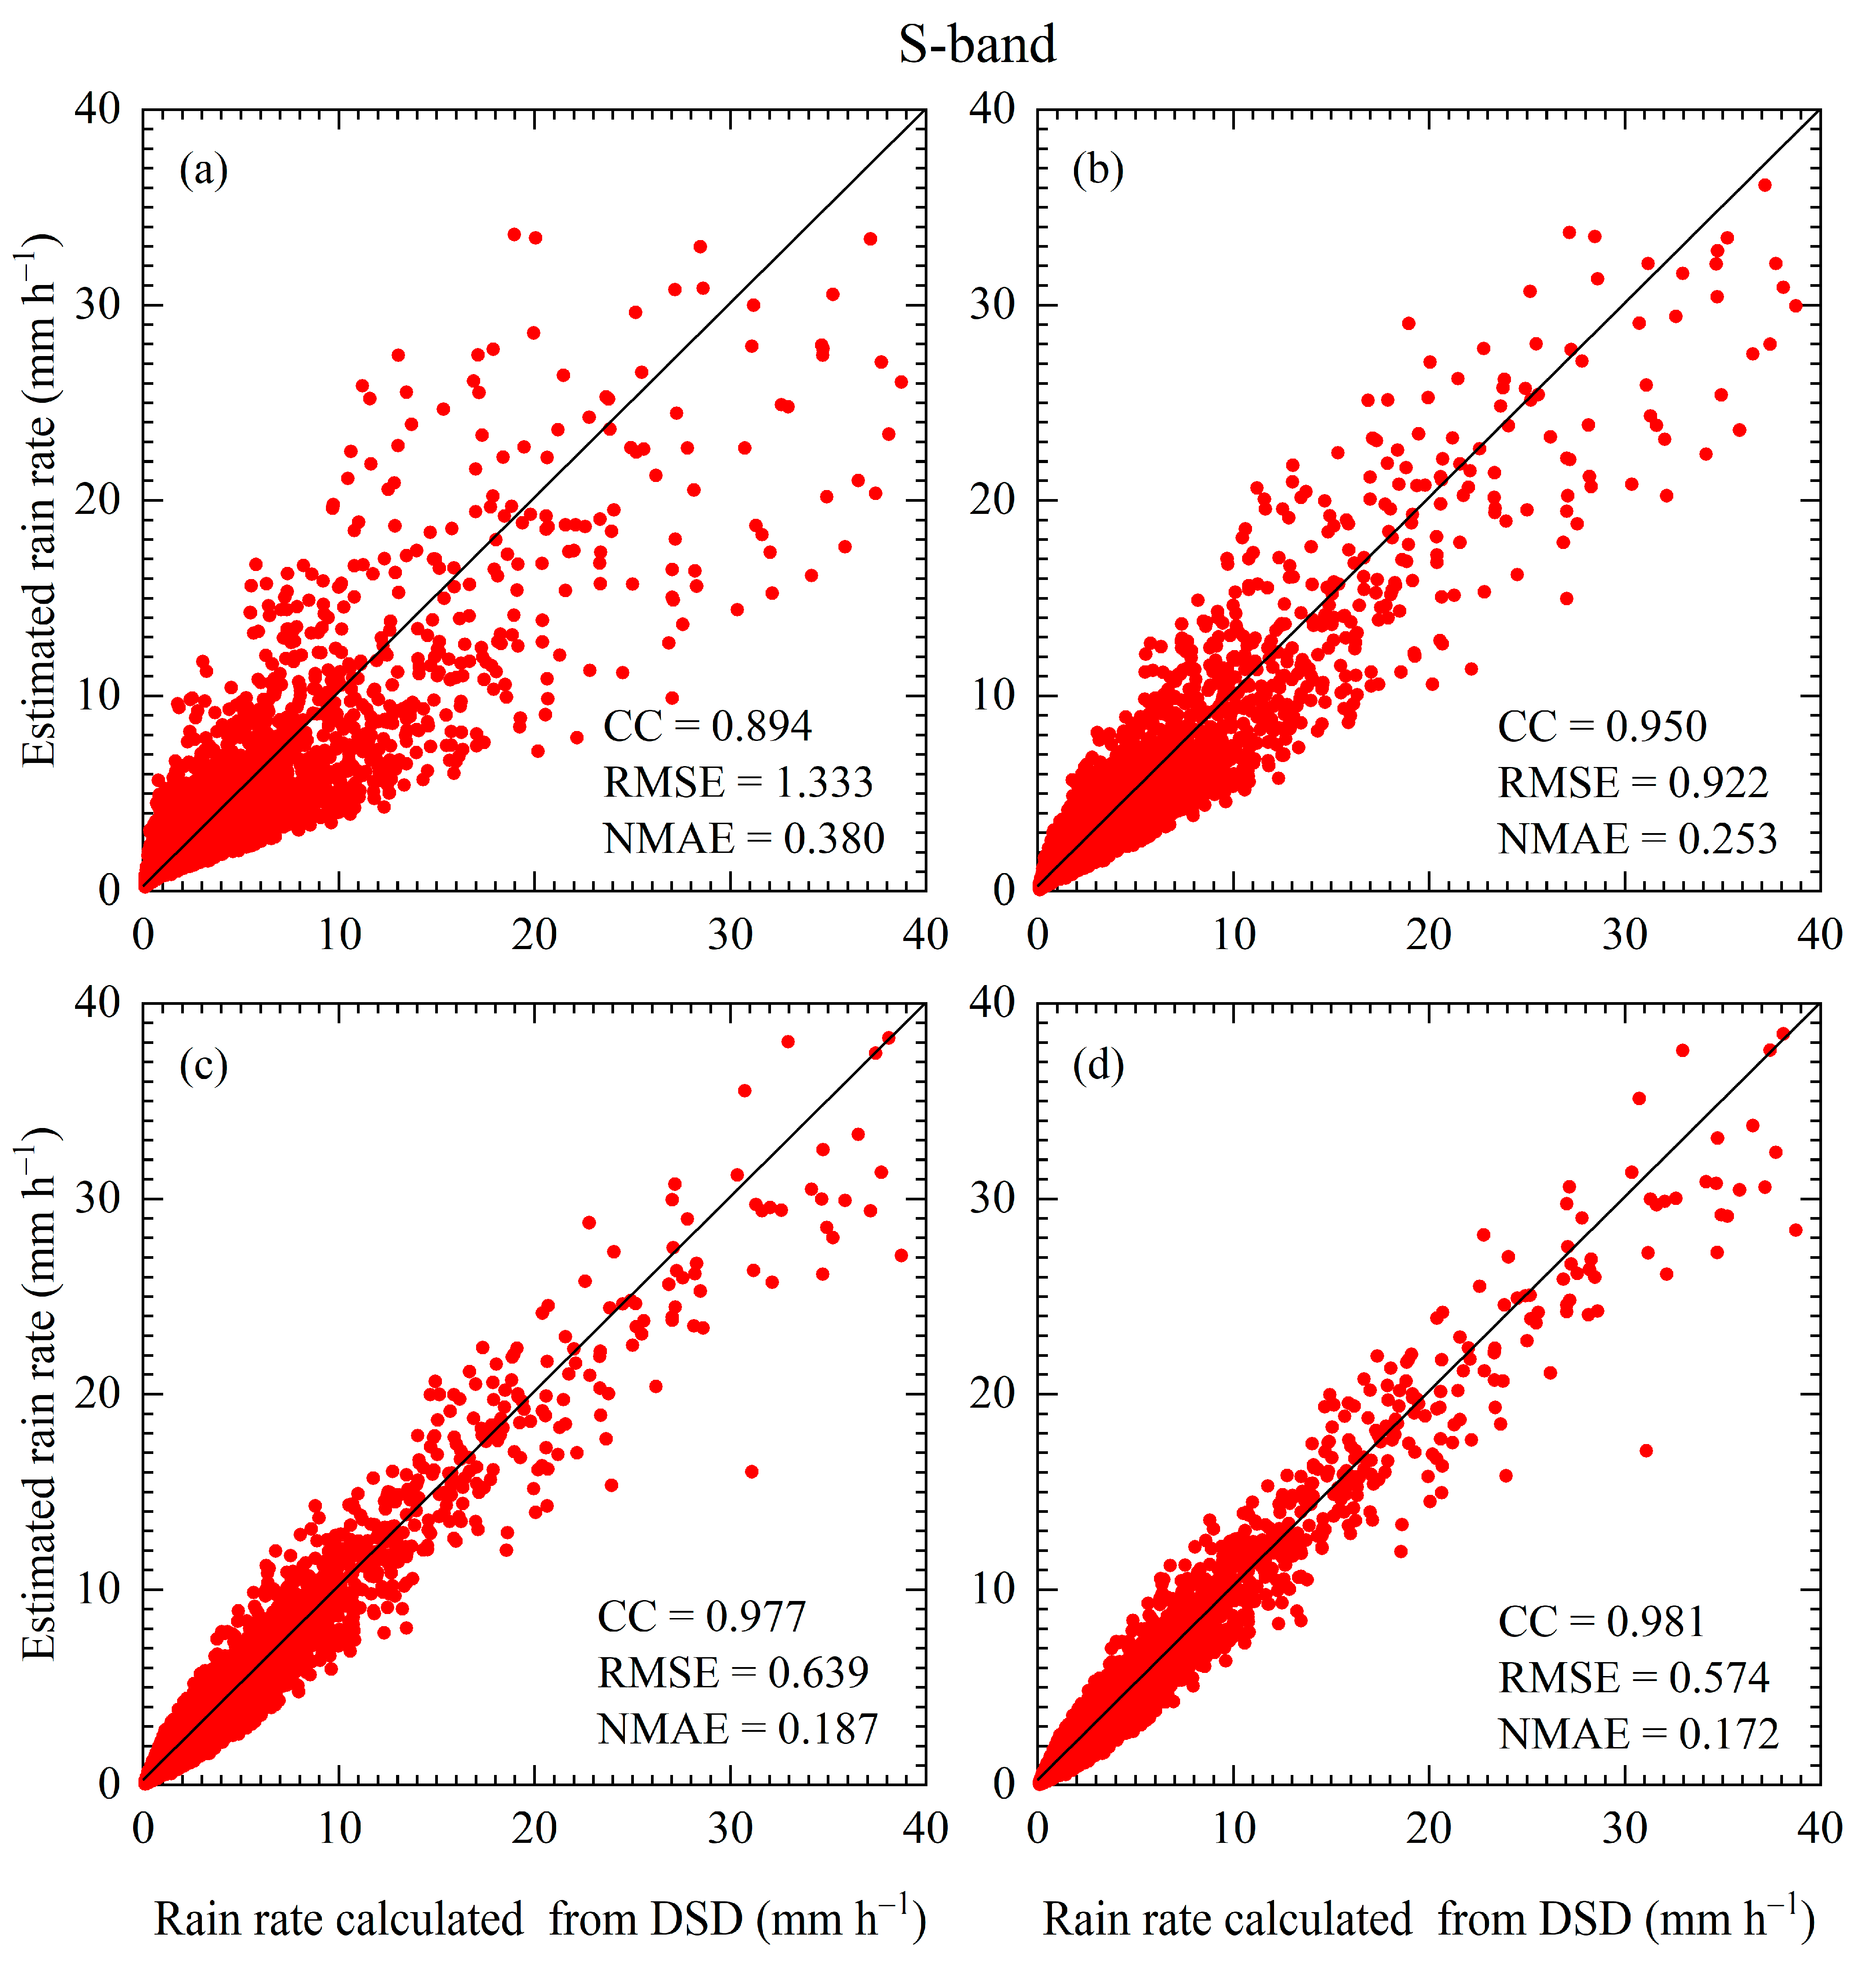
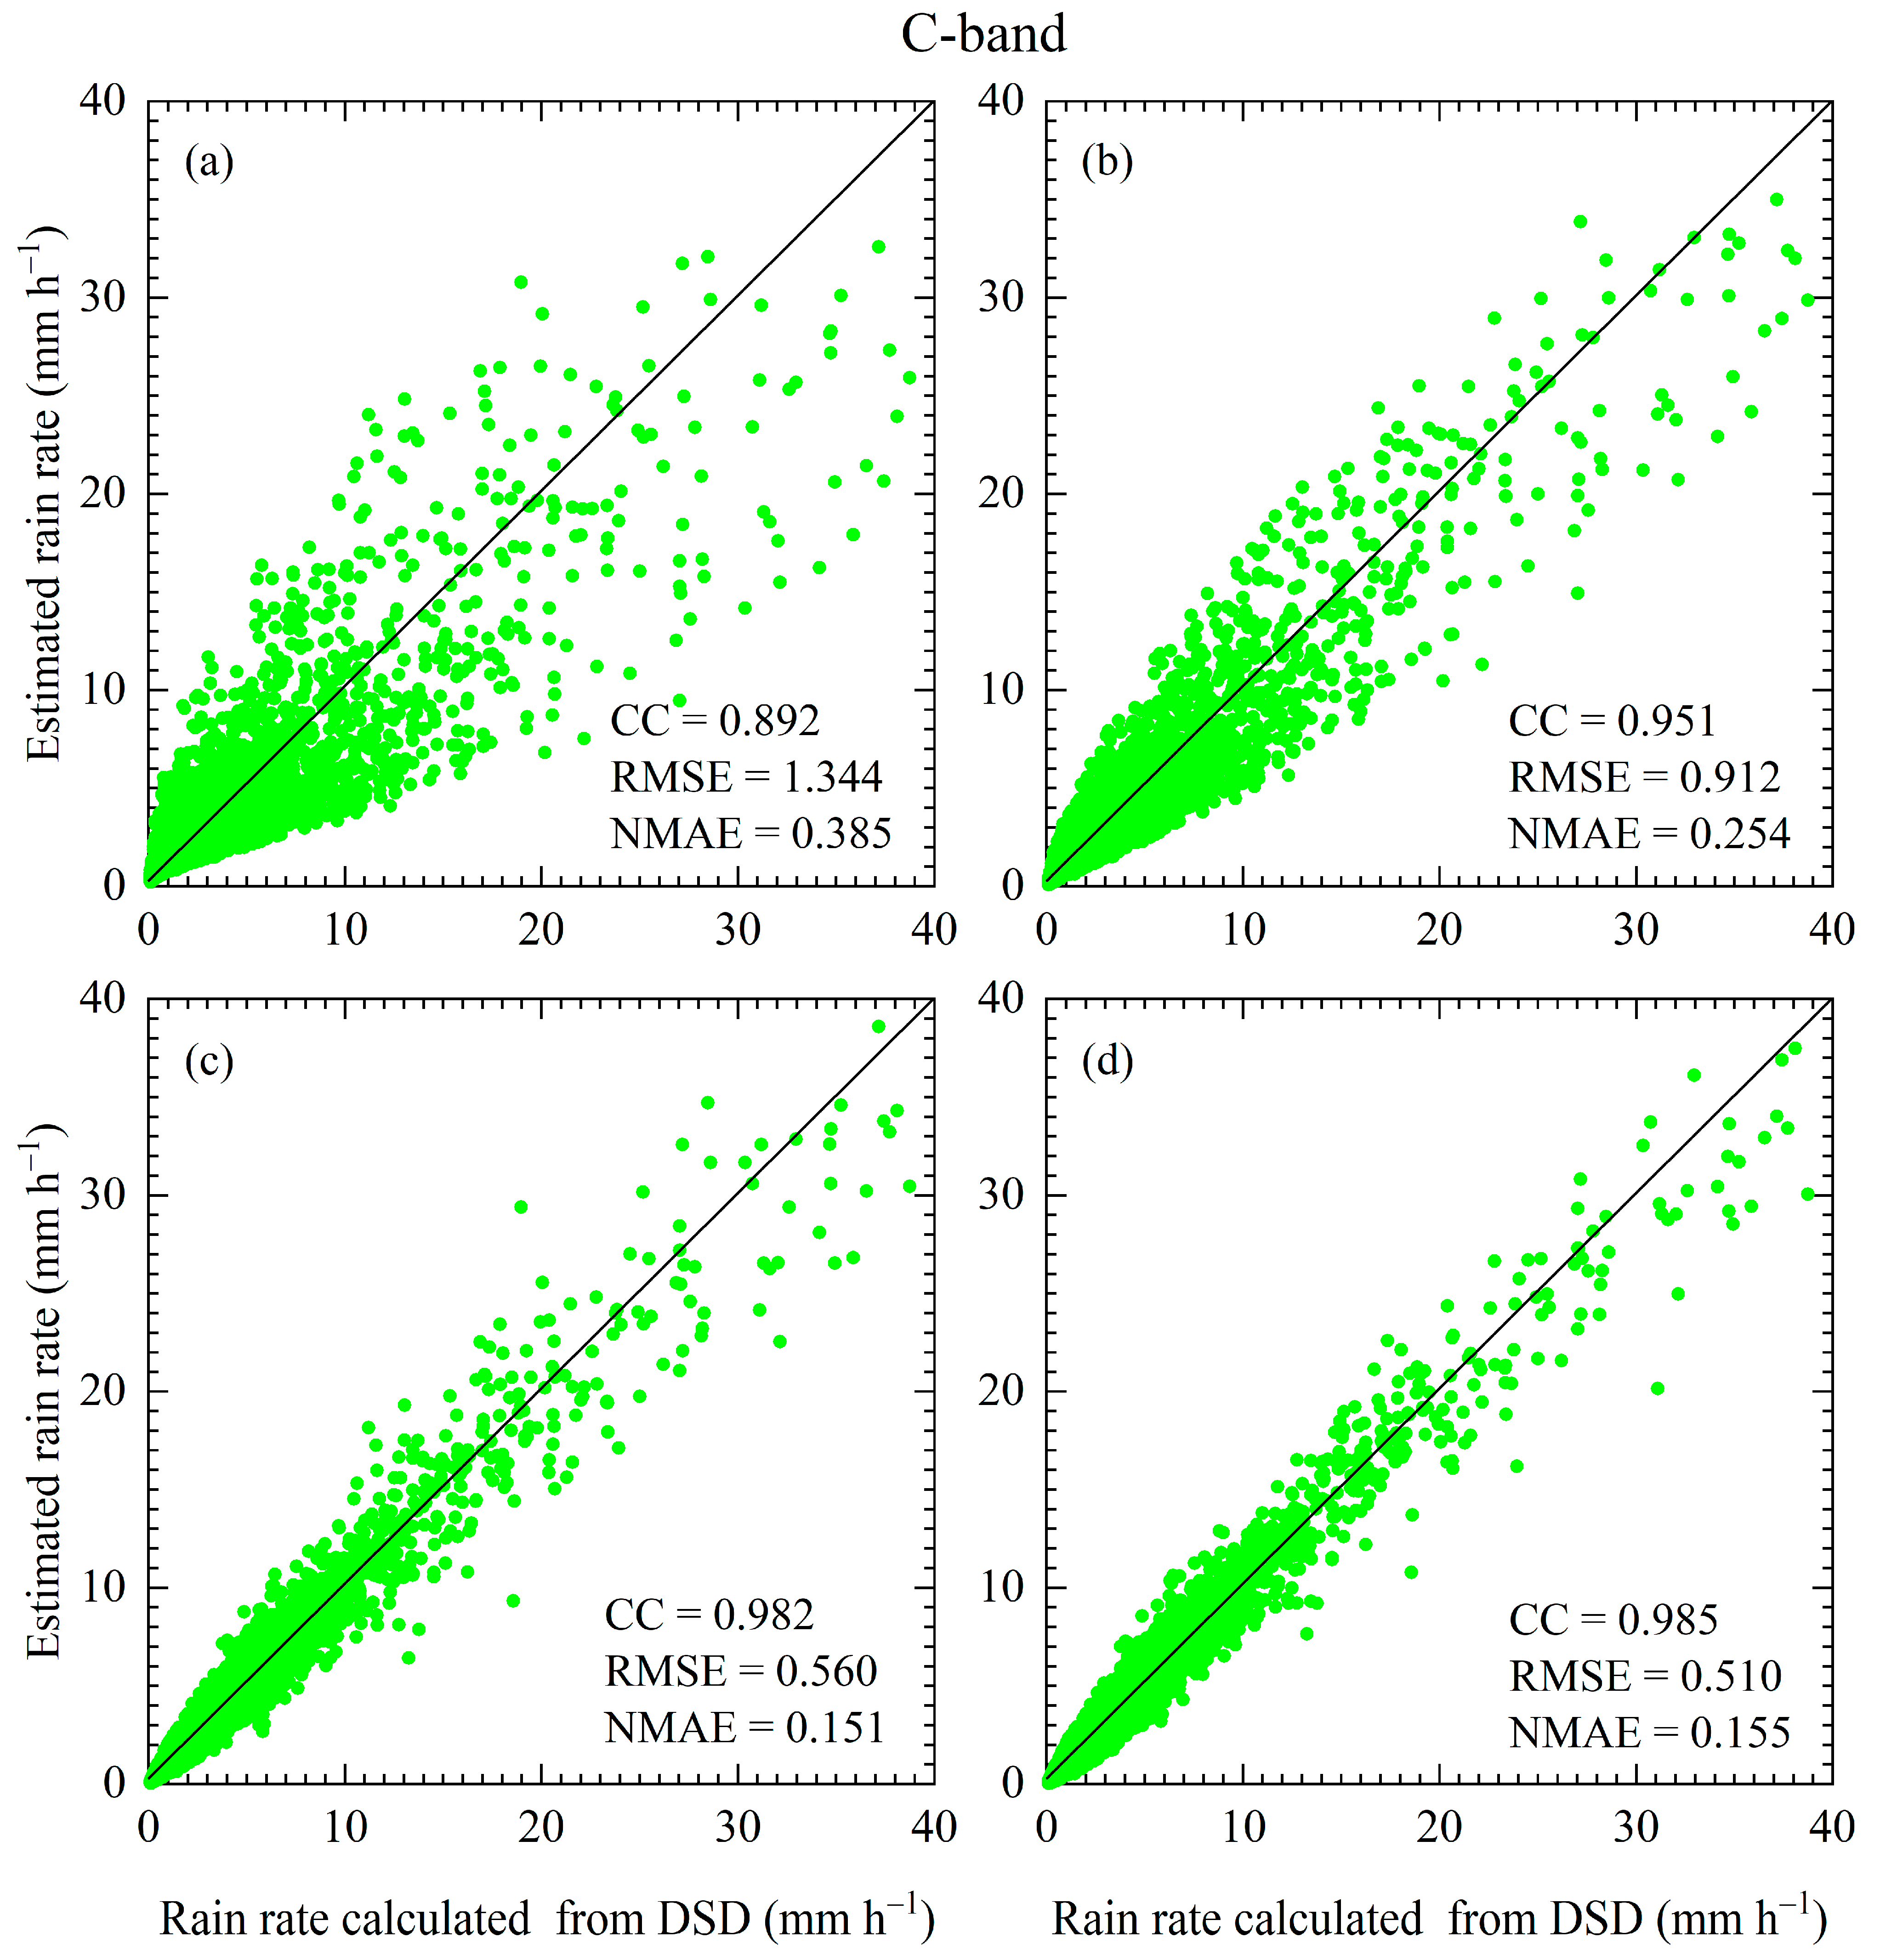
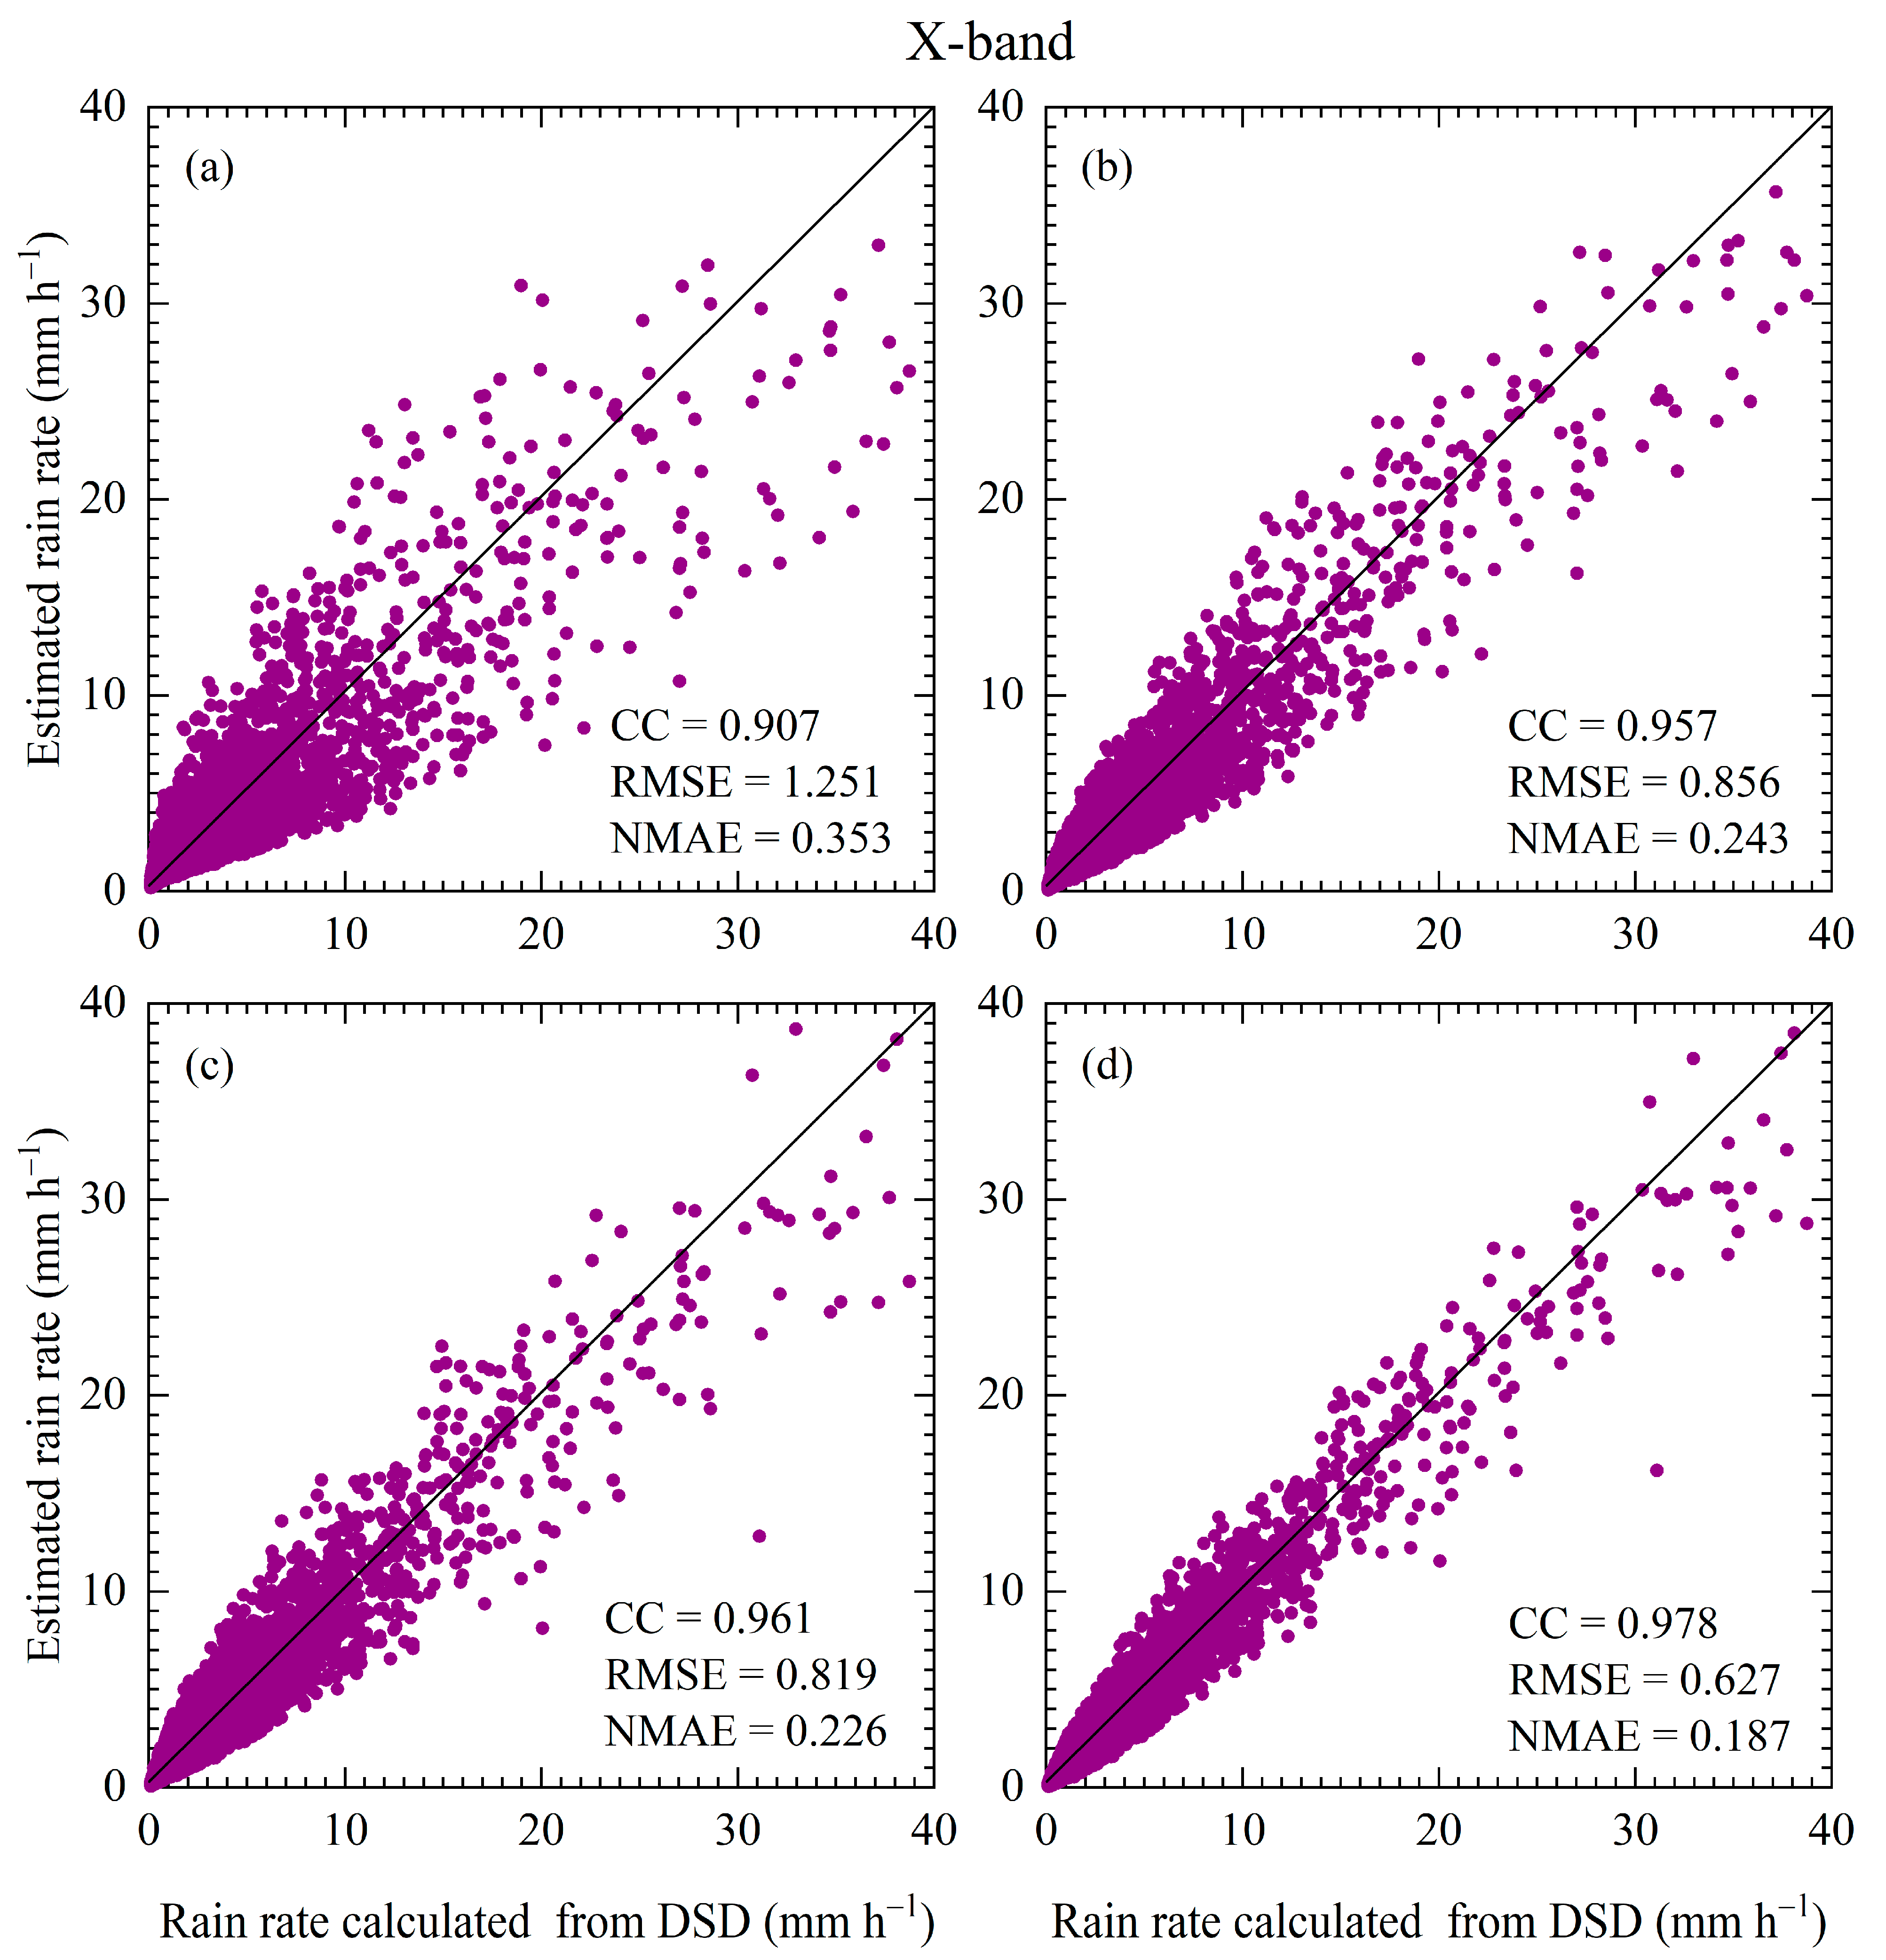
3.2. Dual-Polarization Radar QPE Relations

Previous studies have revealed the advantages of using DSD information to retrieve dual-polarization radar variables for QPE based on the T-matrix scattering method [23,24,26,27,28,29,54]. The dual-polarization radar variables Zh, Zdr, and Kdp were calculated using Equations (17)–(19). Figure 6 shows the scatterplots of Zdr versus Zh and Kdp versus Zh and the power–law fitting algorithms derived for ZdrZh and KdpZh on the S-, C-, and X-bands. For these three-band ZdrZh relations, the coefficient values ranged from 3.975 × 10⁻⁵ to 9.237 × 10⁻⁵, and the exponent values varied between 2.595 and 2.842. Specifically, the ZdrZh relationship in the S-band (C-band) had the smallest coefficient (index) value and the largest index (coefficient) value. For the KdpZh relations on the S-, C-, and X-bands, the coefficient values ranged from 3.466 × 10⁻¹³ (on the X-band) to 9.261 × 10⁻¹³ (on the C-band), and the exponent values varied between 7.153 (on the C-band) and 7.541 (on the X-band). From the above results, it can be seen that the ZdrZh relation corresponding to different radar bands had obvious differences, as did the KdpZh relation, which further illustrates the necessity of studying dual-polarization radar variables and their relationships (including the QPE) at different radar bands.
The DSD-based dual-polarization radar QPE relationships (R(Zh), R(Kdp), R(Zh,Zdr), and R(Kdp,Zdr)) for the S-, C-, and X-bands at Zhaosu were derived in this study and are listed in Table 2. Differences were observed in the QPE estimators for the different bands. Specifically, the two coefficients (α and β, as shown in Equation (20)) of the R(Zh) relation on the S- and C-bands were very similar, with a small difference compared to them on the X-band. For the R(Kdp) relations, the difference in the α coefficient was relatively large (13.053 to 27.831), while the difference in the β coefficient (as shown in Equation (21)) was relatively small (0.639 to 0.668) on these three bands. For the R(Zh,Zdr) relations, the differences in the α and γ coefficients were relatively large, while the difference in the β coefficient (as shown in Equation (22)) was relatively small. The α coefficient (as shown in Equation (23)) was 23.265 on the X-band, while the α coefficient on the C-band was about twice that, and the α coefficient on the S-band was about three times that at the R(Kdp,Zdr) relation.
It is important to evaluate the performance of various DSD-based dual-polarization radar QPE relations in QPE applications. R calculated from DSD (Equation (4)) was used to evaluate the QPE relations [27,28,53,54,69]. In this study, three evaluation indicators—the correlation coefficient (CC), root mean square error (RMSE), and normalized mean absolute error (NMAE)—were used to evaluate the different QPE relations for different bands [27,53]. Figure 7, Figure 8 and Figure 9 show the scatterplots of R computed from the QPE relations and the DSD information on the S-, C-, and X-bands. The performances of the double-parameter schemes (R(Zh, Zdr) and R(Kdp, Zdr)) were superior to those of the single-parameter schemes (R(Zh) and R(Kdp)) for all bands, characterized by a larger CC and smaller RMSE and NMAE. The performance of the R(Kdp) scheme is better than that of the R(Zh) scheme for single-parameter schemes. Similarly, the R(Kdp, Zdr) scheme showed a relatively better performance than the R(Zh, Zdr) scheme in the double-parameter schemes. Moreover, both single-parameter schemes performed the best for the X-band, whereas both double-parameter schemes performed the best for the C-band.

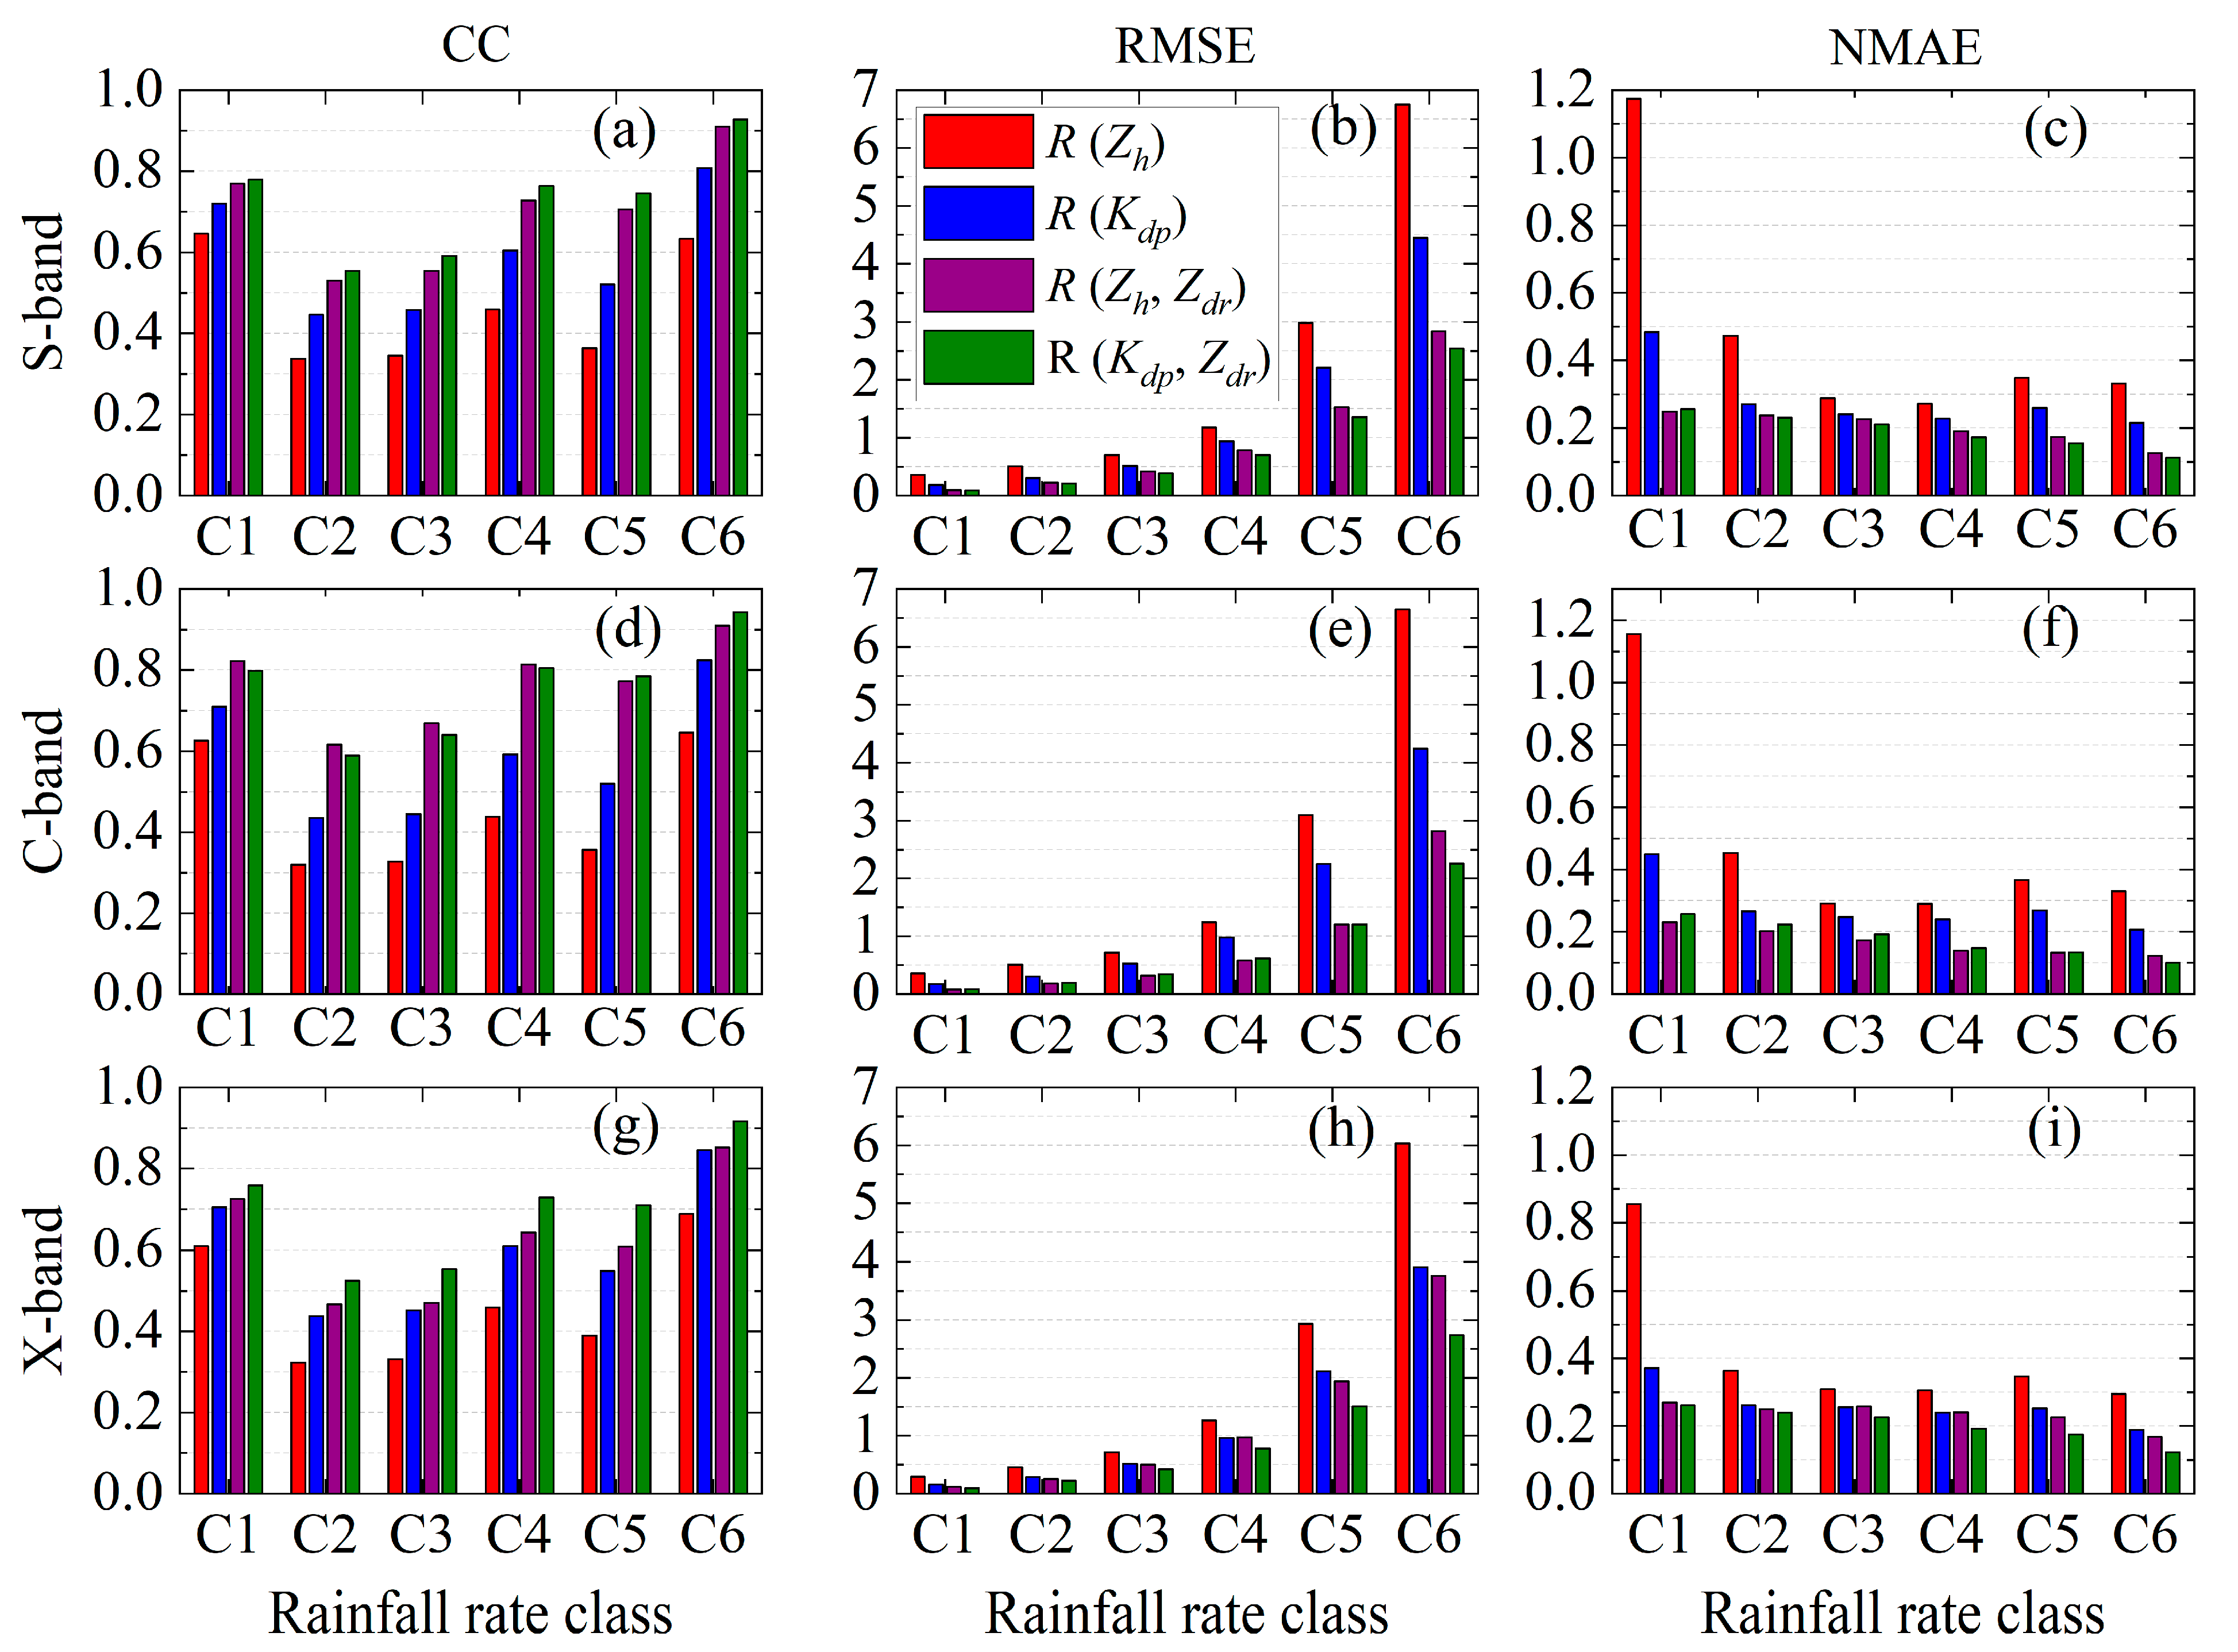
3.3. QPE Relations under Different Rain Rate Classes

R classes have an important impact on the performance of dual-polarization radar QPE estimators [53,55,69] as well as radar bands [53,55,69]. To quantify the performance of QPE estimators under different R classes and different radar bands, we used CC, RMSE, and NMAE to evaluate the performance of these QPE estimators in detail. Before evaluating the performance of the QPE estimators, we first provided the distribution and average values of the dual-polarization radar variables required to establish these QPE estimators in Table 2 for different R classes and different radar bands, as shown in Figure 10 and Table 3. Zh increased with an increasing R class for all bands, and the mean Zh value in the X-band was the largest for all R classes except C6, compared to that in the S- and X-bands. The distribution of Zh was narrowest in C2 and widest in C6 for all the bands. Similar to Zh, Zdr also increased with an increasing R class for all bands; however, in the first two R classes (C1 and C2), Zdr was largest in the X-band, whereas in the middle two R classes (C3 and C4), Zdr was largest in the C-band, and in the last two R classes (C5 and C6), Zdr was largest in the S-band. The distribution of Zdr was narrower in the first three R classes and widened in the last three R classes, particularly in the last R class (C6), where Zdr had the widest distribution. Interestingly, during the process of increasing Kdp as the R class increased, the mean Kdp value of the next R class was about three times that of the previous R class for all bands (for example, 11.3 × 10⁻³ ° km−1 in C3 and 32.8 × 10⁻³ ° km−1 in C4 for S-band). The mean Kdp value in the C-band was about twice that in the S-band, and the mean Kdp value in the X-band was about three times that in the S-band for each R class (for example, 11.3 × 10⁻³ ° km−1 in the S-band, 24.2 × 10⁻³ ° km−1 in the C-band, and 39.8 × 10⁻³ ° km−1 in the X-band for C3).
Figure 11 shows the CC, RMSE, and NMAE of R estimated from the dual-polarization radar QPE estimators against R calculated from the DSD under different R classes (C1–C6) and radar bands (the S-, C-, and X-bands). The performances of the four schemes for these three bands differed under different R classes. For the S-band radar, the R(Zh) estimator had the worst performance, characterized by a relatively lower CC and higher RMSE and NMAE for all R classes, followed by the R(Kdp) estimator. The R(Kdp,Zdr) estimator performed the best (highest CC and lowest RMSE and NMAE) for all R classes. The RMSE of all the estimators increased with an increasing R class, whereas the CC and NMAE did not monotonically increase or decrease during this process (Figure 11a–c). For the C-band radar, similar to the S-band radar, the performance of the R(Zh) estimator remained the worst, followed by that of the R(Kdp) estimator for all R classes. However, unlike in the S-band radar, the performance of the R(Kdp,Zdr) estimator was not always the best for all the R classes in the C-band radar. Specifically, when the R class was between C1 and C4, the R(Zh,Zdr) estimator was slightly superior to the R(Kdp,Zdr) estimator, with a higher CC and lower RMSE and NMAE; however, the opposite was true when the R class was C5 and C6 (Figure 11d–f). For the X-band radar, similar to the S-band radar, the R(Zh) estimator exhibited the worst performance, whereas the R(Kdp,Zdr) estimator exhibited the best performance for all the R classes. However, the gap in performance between the R(Kdp) and R(Zh,Zdr) estimators for X-band radars narrowed compared to the S- and C-band radars, as reflected in the narrowing of the gap between the three evaluation parameters (CC, RMSE, and NMAE) (Figure 11d–f).
For the same type of QPE estimator and the same R class, the performances of the estimators in the different bands were different. Taking the R(Zh,Zdr) estimator at C3 as an example, for the R(Zh,Zdr) estimator at C3, the CC, RMSE, and NMAE were 0.669, 0.318 mm h−1, and 0.73 mm h−1 in the C-band, respectively, while the CC, RMSE, and NMAE were 0.554 (0.471), 0.417 (0.501) mm h−1, and 0.227 (0.258) mm h−1 in the S-band (X-band), respectively. Therefore, among the three bands, the C-band estimator performed the best, whereas the X-band estimator performed the worst for the R(Zh,Zdr) estimator at C3. Similarly, taking the R(Zh) estimator at C6 as an example again, for the R(Zh) estimator at C6, the CC, RMSE, and NMAE were 0.689, 6.032 mm h−1, and 0.295 mm h−1 in the X-band, respectively, while the CC, RMSE, and NMAE were 0.634 (0.646), 6.749 (6.651) mm h−1, and 0.332 (0.329) mm h−1 in the S-band (X-band), respectively. Therefore, among the three bands, the X-band estimator performed best, whereas the S-band estimator performed worst for the R(Zh) estimator at C6. Overall, the performances of the double-parameter schemes were significantly better than those of the single-parameter schemes for all bands and R classes. Furthermore, the performance of the dual-parameter estimators in the C-band was better than that in the S- and X-bands for all R classes, and the performance of the R(Zh,Zdr) estimator was better compared to the R(Kdp,Zdr) estimator at lower R classes (C1 to C4, R less than 5 mm h−1), while the performance of the R(Kdp,Zdr) estimator was better compared to the R(Zh,Zdr) estimator at higher rainfall rates (C5 to C6, R greater than 5 mm h−1) for the C-band. It is worth noting that previous studies have shown the importance of selecting suitable estimators for actual dual-polarization radar QPEs, and suitable estimators need to be provided for different regions and different band radars [55,69,70,71]. For a dual-polarization radar QPE estimator in the Tianshan Mountains, we plan to conduct the relevant research based on dual-polarization radar observational data in the future.

4. Summary and Conclusions

To reveal the microphysical characteristics of the raindrop size distribution (DSD) across rainfall rate (R) classes, and more importantly, to quantify the effects of radar wavelengths, QPE estimators, and R classes on the QPE of dual polarization radars in typical arid areas of China, DSD data from a PARSIVEL2 disdrometer at Zhaosu in the Tianshan Mountains during summer 2020 and 2021 were used to investigate the microphysical characteristics of DSD for six rain rate (R) classes (C1: 0.1–0.5 mm h−1, C2: 0.5–1 mm h−1, C3: 1–2 mm h−1, C4: 2–5 mm h−1, C5: 5–10 mm h−1, and C6: ≥10 mm h−1) and DSD-based polarimetric radar quantitative precipitation estimation (QPE) relations on the S-, C-, and X-bands for different R classes. The analysis revealed that the first two R classes (C1 and C2) contributed the most to the total rain duration, which accounted for 40.9% and 20.7%, respectively, and the largest contributors to the total rain amount were the fourth class (C4) and the last class (C6), which accounted for 27.4% and 23.2%, respectively. The raindrop spectrum widened, characterized by an increase in the concentrations of large raindrops (diameter > 3 mm), medium-size raindrops (1 ≤ diameter ≤ 3 mm), and small raindrops (diameter < 1 mm) with an increasing R class. The mean Dm value increased from 0.92 mm in C1 to 2.40 mm in C6, while the mean logarithm of log10Nw value decreased after increasing from C1 to C3 with an increasing R class. In addition, the mean values of R, D0, LWC, Z, and Nt increased with the R class. For the entire dataset, large raindrops had the largest contribution to R and Z, accounting for 50% and 97% of the total contribution, respectively, compared with small and medium-size raindrops, whereas small raindrops had the largest contribution to Nt, accounting for more than 84% of the total contribution.
Dual-polarization radar parameters including Zh, Zdr, and Kdp were retrieved based on the DSD data using the T-matrix scattering method. The Zdr-Zh and Kdp-Zh relations were established in a power–law fitting form on the S-, C-, and X-bands. The Zdr-Zh relation corresponding to different radar bands had obvious differences as well as the Kdp-Zh relation. The DSD-based dual-polarization radar QPE estimators (R(Zh), R(Kdp), R(Zh,Zdr), and R(Kdp,Zdr)) for the S-, C-, and X-bands were derived. For the R(Zh) relations, the two coefficients (α and β) on the S- and C-bands were very similar, with a small difference compared to them on the X-band. For the R(Kdp) relations, the difference in the α coefficient was relatively large (13.053 to 27.831), while the difference in the β coefficient was relatively small (0.639 to 0.668) on these three bands. For the R(Zh,Zdr) relations, the differences in the α and γ coefficients were relatively large, while the difference in the β coefficient was relatively small. For the R(Kdp,Zdr) relations, the α coefficient was 23.265 on the X-band, while the α coefficient on the C-band was about twice that, and the α coefficient on the S-band was about three times that. The CC, RMSE, and NMAE of R estimated from the dual-polarization radar QPE estimators against R calculated from the DSD were used to evaluate the performance of these dual-polarization radar QPE estimators. The result revealed that the performance of double-parameter estimators (R(Zh,Zdr) and R(Kdp,Zdr)) was superior to that of single-parameter estimators (R(Zh) and R(Kdp)), and the performance of the R(Kdp) (R(Kdp,Zdr)) estimator was superior to that of the R(Zh) (R(Zh,Zdr)) estimator for all the bands. Overall, the single-parameter estimator performed the best for the X-band, whereas the double-parameter estimator performed the best for the C-band.
Furthermore, the distribution and mean values of the dual-polarization radar variables establishing these QPE estimators across R classes and radar wavelengths were determined, and the performance of these four types of estimators (R(Zh), R(Kdp), R(Zh,Zdr), and R(Kdp,Zdr)) for the three bands (S-, C-, and X-bands) showed differences across the R classes. Generally, for all the R classes, the dual-parameter estimators had better performances in the C-band than the other two bands, and the performance of the R(Zh,Zdr) (R(Kdp,Zdr)) estimator was better compared to the R(Kdp,Zdr) (R(Zh,Zdr)) estimator at lower (higher) R classes for the C-band. Our conclusion emphasizes that when conducting dual-polarization radar QPE applications, it is necessary to consider both the appropriate radar wavelength and the type of estimator, as well as the impact of R classes on the accuracy of QPE. It should be noted that although this study reported promising findings, they need to be further confirmed using dual-polarization radar observations in the future.

Author Contributions

Conceptualization, Y.Z. (Yong Zeng) and J.L. (Jiangang Li); data curation, Y.Z. (Yong Zeng), Y.Z. (Yushu Zhou), J.L. (Jiangang Li), and L.Y.; formal analysis, Y.Z. (Yong Zeng); funding acquisition, L.Y. and Y.Z. (Yong Zeng); methodology, Y.Z. (Yong Zeng), J.L. (Jiangang Li), and Y.J.; project administration, X.L., H.L., Z.T. and Y.J.; resources, Y.Z. (Yong Zeng) and Z.T.; supervision, J.L. (Jing Liu), Y.Z. (Yushu Zhou), J.Z. and L.Y.; writing—original draft, Y.Z. (Yong Zeng); writing—review and editing, Y.Z. (Yong Zeng). All authors have read and agreed to the published version of the manuscript.

Funding

This research was funded by the Natural Science Foundation of Xinjiang Uygur Autonomous Region (Grant No. 2022D01B227), the National Natural Science Foundation of China (U2003106), the Tianshan Mountains Talent Project (Grant No. 2021-32), the Natural Science Foundation of Xinjiang Uygur Autonomous Region (Grant No. 2022D01B75), the Tianshan Mountains Talent Project (Grant No. 2022TSYCLJ0003), the Science and Technology Innovation Development Fund Project of Xinjiang Meteorological Bureau (Grant No. MS202210), the S&T Development Fund of IDM (Grant No. KJFZ202303, KJFZ202301), and the Uygur Autonomous Region Tianchi Project for Introducing High-Level Talents (2019).

Data Availability Statement

Not applicable.

Acknowledgments

The authors would like to thank the Institute of Desert Meteorology, China, Meteorological Administration, Urumqi, for providing the data of Disdrometers. Thanks also goes to the reviewers for their thorough comments that really helped improve the manuscript.

Conflicts of Interest

The authors declare no conflict of interest.

References

  1. Rosenfeld, D.; Ulbrich, C.W. Cloud microphysical properties, processes, and rainfall estimation opportunities. Meteorol. Monogr. 2003, 30, 237–258. [Google Scholar] [CrossRef]
  2. Zhang, G.; Sun, J.; Brandes, E.A. Improving parameterization of rain microphysics with disdrometer and radar observations. J. Atmos. Sci. 2006, 63, 1273–1290. [Google Scholar] [CrossRef]
  3. Mason, B.J. Physics of clouds and precipitation. Nature 1954, 174, 957–959. [Google Scholar] [CrossRef]
  4. Milbrandt, J.A.; Yau, M.K. A multimoment bulk microphysics parameterization. Part I: Analysis of the role of the spectral shape parameter. J. Atmos. Sci. 2005, 62, 3051–3064. [Google Scholar] [CrossRef]
  5. Wainwright, C.E.; Dawson, D.T.I.; Xue, M.; Zhang, G. Diagnosing the intercept parameters of the exponential drop size distributions in a single-moment microphysics scheme and impact on supercell storm simulations. J. Appl. Meteorol. Climatol. 2014, 53, 2072–2090. [Google Scholar] [CrossRef]
  6. McFarquhar, G.M.; Hsieh, T.-L.; Freer, M.; Mascio, J.; Jewett, B.F. The characterization of ice hydrometeor gamma size distributions asvolumes in N0–λ–μ phase space: Implications for microphysical process modeling. J. Atmos. Sci. 2015, 72, 892–909. [Google Scholar] [CrossRef]
  7. Kinnell, P.I.A. Rainfall Intensity-Kinetic Energy Relationships for Soil Loss Prediction1. Soil Sci. Soc. Am. J. 1981, 45, 153. [Google Scholar] [CrossRef]
  8. Steiner, M.; Smith, J.A. Reflectivity, Rain Rate, and Kinetic Energy Flux Relationships Based on Raindrop Spectra. J. Appl. Meteorol. 2000, 39, 1923–1940. [Google Scholar] [CrossRef]
  9. Seela, B.K.; Janapati, J.; Kalath Unnikrishnan, C.; Lin, P.-L.; Le Loh, J.; Chang, W.-Y.; Kumar, U.; Reddy, K.K.; Lee, D.-I.; Venkatrami Reddy, M. Raindrop Size Distributions of North Indian Ocean Tropical Cyclones Observed at the Coastal and Inland Stations in South India. Remote Sens. 2021, 13, 3178. [Google Scholar] [CrossRef]
  10. Ryzhkov, A.V.; Zrnic, D.S. Comparison of dual polarization radar estimators of rain. J. Atmos. Ocean. Technol. 1995, 12, 249–256. [Google Scholar] [CrossRef]
  11. Liao, L.; Meneghini, R.; Tokay, A. Uncertainties of GPM DPR rain estimates caused by DSD parameterizations. J. Appl. Meteor. Climatol. 2014, 53, 2524–2537. [Google Scholar] [CrossRef]
  12. Chen, B.; Yang, J.; Pu, J. Statistical characteristics of raindrop size distribution in the Meiyu season observed in eastern China. J. Meteorol. Soc. Jpn. 2013, 91, 215–227. [Google Scholar] [CrossRef]
  13. Ulbrich, C.W. Natural variations in the analytical form of the raindrop size distribution. J. Clim. Appl. Meteorol. 1983, 22, 1764–1775. [Google Scholar] [CrossRef]
  14. Tokay, A.; Short, D.A. Evidence from tropical raindrop spectra of the origin of rain from stratiform versus convective clouds. J. Appl. Meteorol. 1996, 35, 355–371. [Google Scholar] [CrossRef]
  15. Bringi, V.N.; Chandrasekar, V.; Hubbert, J.; Gorgucci, E.; Randeu, W.L.; Schoenhuber, M. Raindrop size distribution in different climatic regimes from disdrometer and dual-polarized radar analysis. J. Atmos. Sci. 2003, 60, 354–365. [Google Scholar] [CrossRef]
  16. Konwar, M.; Das, S.K.; Deshpande, S.M.; Chakravarty, K.; Goswami, B.N. Microphysics of clouds and rain over the Western Ghat. J. Geophys. Res. Atmos. 2014, 119, 6140–6159. [Google Scholar] [CrossRef]
  17. Chen, B.; Hu, Z.; Liu, L.; Zhang, G. Raindrop Size Distribution Measurements at 4500 m on the Tibetan Plateau During TIPEX-III. J. Geophys. Res. Atmos. 2017, 12211, 11092–12006. [Google Scholar] [CrossRef]
  18. Seela, B.K.; Janapati, J.; Lin, P.-L.; Reddy, K.K.; Shirooka, R.; Wang, P.K. A Comparison Study of Summer Season Raindrop Size Distribution between Palau and Taiwan, Two Islands in Western Pacific. J. Geophys. Res. Atmos. 2017, 122, 11–787. [Google Scholar] [CrossRef]
  19. Suh, S.-H.; You, C.-H.; Lee, D.-I. Climatological characteristics of raindrop size distributions in Busan, Republic of Korea. Hydrol. Earth Syst. Sci. 2016, 20, 193–207. [Google Scholar] [CrossRef]
  20. Wen, L.; Zhao, K.; Chen, G. Drop size distribution characteristics of seven typhoons in China. J. Geophys. Res. Atmos. 2018, 123, 6529–6548. [Google Scholar] [CrossRef]
  21. Zheng, J.; Liu, L.; Chen, H. Characteristics of warm clouds and precipitation in South China during the pre-flood season using datasets from a cloud radar, a ceilometer, and a disdrometer. Remote Sens. 2019, 11, 3045. [Google Scholar] [CrossRef]
  22. Zhang, A.; Hu, J.; Chen, S. Statistical characteristics of raindrop size distribution in the monsoon season observed in southern China. Remote Sens. 2019, 11, 432. [Google Scholar] [CrossRef]
  23. Wen, L.; Zhao, K.; Zhang, G. Statistical characteristics of raindrop size distributions observed in East China during the Asian summer monsoon season using 2-D video disdrometer and Micro Rain Radar data. J. Geophys. Res. Atmos. 2016, 121, 2265–2282. [Google Scholar] [CrossRef]
  24. Pu, K.; Liu, X.; Wu, Y.; Hu, S.; Liu, L.; Gao, T. A comparison study of raindrop size distribution among five sites at the urban scale during the East Asian rainy season. J. Hydrol. 2020, 590, 125500. [Google Scholar] [CrossRef]
  25. Wen, L.; Zhao, K.; Wang, M. Seasonal variations of observed raindrop size distribution in East China. Adv. Atmos. Sci. 2019, 36, 346–362. [Google Scholar] [CrossRef]
  26. Zhang, H.; Zhang, Y.; He, H. Comparison of raindrop size distributions in a midlatitude continental squall line during different stages as measured by Parsivel over East China. J. Appl. Meteorol. Climatol. 2017, 56, 2097–2111. [Google Scholar] [CrossRef]
  27. Luo, L.; Guo, J.; Chen, H. Microphysical characteristics of rainfall observed by a 2DVD disdrometer during different seasons in Beijing, China. Remote Sens. 2021, 13, 2303. [Google Scholar] [CrossRef]
  28. Ma, Y.; Ni, G.; Chandra, C.V. Statistical characteristics of raindrop size distribution during rainy seasons in the Beijing urban area and implications for radar rainfall estimation. Hydrol. Earth Syst. Sci. 2019, 23, 4153–4170. [Google Scholar] [CrossRef]
  29. Ji, L.; Chen, H.N.; Li, L.; Chen, B.J.; Xiao, X.; Chen, M.; Zhang, G.F. Raindrop size distributions and rain characteristics observed by a PARSIVEL disdrometer in Beijing, Northern China. Remote Sens. 2019, 11, 1479. [Google Scholar] [CrossRef]
  30. Wang, G.; Zhou, R.; Zhaxi, S.; Liu, S. Raindrop size distribution measurements on the Southeast Tibetan Plateau during the STEP project. Atmos. Res. 2021, 249, 105311. [Google Scholar] [CrossRef]
  31. Wang, G.; Li, R.; Sun, J. Comparative analysis of the characteristics of rainy season raindrop size distributions in two typical regions of the Tibetan Plateau. Adv. Atmos. Sci. 2022, 39, 1062–1078. [Google Scholar] [CrossRef]
  32. Zhang, J.B.; Deng, Z.F. A Generality of Rainfall in Xinjiang; Meteorological Press: Beijing, China, 1987; pp. 1–10. (In Chinese) [Google Scholar]
  33. Yang, L.M.; Li, X.; Zhang, G.X. Some advances and problems in the study of heavy rain in Xinjiang. Clim. Environ. Res. 2011, 16, 188–198. (In Chinese) [Google Scholar]
  34. Zeng, Y.; Yang, L. Triggering mechanism of an extreme rainstorm process near the Tianshan Mountains in Xinjiang, an arid region in China, based on a numerical simulation. Adv. Meteorol. 2020, 2020, 8828060. [Google Scholar] [CrossRef]
  35. Zeng, Y.; Yang, L.; Zhang, Z.; Tong, Z.; Li, J.; Liu, F.; Zhang, J.; Jiang, Y. Characteristics of clouds and raindrop size distribution in Xinjiang, using cloud radar datasets and a disdrometer. Atmosphere 2020, 11, 1382. [Google Scholar] [CrossRef]
  36. Zeng, Y.; Yang, L.; Tong, Z.; Jiang, Y.; Zhang, Z.; Zhang, J.; Zhou, Y.; Li, J.; Liu, F.; Liu, J. Statistical characteristics of raindrop size distribution during rainy seasons in Northwest China. Adv. Meteorol. 2021, 2021, 6667786. [Google Scholar] [CrossRef]
  37. Zeng, Y.; Tong, Z.; Jiang, Y.; Zhou, Y. Microphysical characteristics of seasonal rainfall observed by a Parsivel disdrometer in the Tianshan Mountains, China. Atmos. Res. 2022, 280, 106459. [Google Scholar] [CrossRef]
  38. Zeng, Y.; Yang, L.; Zhou, Y.; Tong, Z.; Jiang, Y. Statistical characteristics of summer season raindrop size distribution in the western and central Tianshan Mountains in China. J. Meteorol. Soc. Jpn. 2022, 100, 855–872. [Google Scholar] [CrossRef]
  39. Zeng, Y.; Yang, L.; Zhou, Y.; Tong, Z.; Jiang, Y.; Chen, P. Characteristics of orographic raindrop size distribution in the Tianshan Mountains, China. Atmos. Res. 2022, 278, 106332. [Google Scholar] [CrossRef]
  40. Fu, Z.; Dong, X.; Zhou, L.; Cui, W.; Wang, J.; Wan, R.; Leng, L.; Xi, B. Statistical characteristics of raindrop size distributions and parameters in Central China during the Meiyu seasons. J. Geophys. Res. Atmos. 2020, 125, e2019JD031954. [Google Scholar] [CrossRef]
  41. Marshall, J.S.; Palmer, W.M. The distribution of raindrops with size. J. Meteor. 1948, 5, 165–166. [Google Scholar] [CrossRef]
  42. Fulton, R.A.; Breidenbach, J.P.; Seo, D.-J. The WSR-88D Rainfall Algorithm. Weather. Forecast. 1998, 13, 377–395. [Google Scholar] [CrossRef]
  43. Atlas, D.; Ulbrich, C.W.; Marks, F.D. Systematic variation of drop size and radar-rainfall relations. J. Geophys. Res. 1999, 104, 6155–6169. [Google Scholar] [CrossRef]
  44. Ulbrich, C.W.; Atlas, D. Microphysics of raindrop size spectra: Tropical continental and maritime storms. J. Appl. Meteor. Climatol. 2007, 46, 1777–1791. [Google Scholar] [CrossRef]
  45. Janapati, J.; Seela, B.K.; Lin, P.-L. Raindrop size distribution characteristics of Indian and Pacific Ocean tropical cyclones observed at India and Taiwan sites. J. Meteorol. Soc. Jpn. 2020, 98, 299–317. [Google Scholar] [CrossRef]
  46. Janapati, J.; Seela, B.K.; Lin, P.-L.; Lee, M.-T.; Joseph, E. Microphysical features of typhoon and non-typhoon rainfall observed in Taiwan, an island in the northwestern Pacific. Hydrol. Earth Syst. Sci. 2021, 25, 4025–4040. [Google Scholar] [CrossRef]
  47. Kim, H.-J.; Jung, W.; Suh, S.-H.; Lee, D.-I.; You, C.-H. The Characteristics of raindrop size distribution at windward and leeward side over mountain area. Remote Sens. 2022, 14, 2419. [Google Scholar] [CrossRef]
  48. Li, R.; Wang, G.; Zhou, R.; Zhang, J.; Liu, L. Seasonal variation in microphysical characteristics of precipitation at the entrance of water vapor channel in Yarlung Zangbo Grand Canyon. Remote Sens. 2022, 14, 3149. [Google Scholar] [CrossRef]
  49. Cifelli, R.; Chandrasekar, V.; Lim, S.; Kennedy, P.C.; Wang, Y.; Rutledge, S.A. A new dual-polarization radar rainfall algorithm: Application in Colorado precipitation events. J. Atmos. Ocean. Technol. 2011, 28, 352–364. [Google Scholar] [CrossRef]
  50. You, C.-H.; Kang, M.; Lee, D.-I. Rainfall estimation by S-band polarimetric radar in Korea. Part I: Preprocessing and preliminary results. Meteorol. Appl. 2014, 21, 975–983. [Google Scholar] [CrossRef]
  51. Cao, Q.; Zhang, G.; Brandes, E.A. Polarimetric radar rain estimation through retrieval of drop size distribution using a Bayesian approach. J. Appl. Meteorol. Climatol. 2010, 49, 973–990. [Google Scholar] [CrossRef]
  52. Brandes, E.A.; Zhang, G.; Vivekanandan, J. Experiments in rainfall estimation with a polarimetric radar in a subtropical environment. J. Appl. Meteorol. 2002, 41, 674–685. [Google Scholar] [CrossRef]
  53. Li, Q.; Wei, J.; Yin, J.; Qiao, Z.; Cao, J.; Shi, Y. Microphysical characteristics of raindrop size distribution and implications for radar rainfall estimation over the northeastern Tibetan Plateau. J. Geophys. Res. Atmos. 2022, 127, e2021JD035575. [Google Scholar] [CrossRef]
  54. Zeng, Y.; Yang, L.; Tong, Z.; Jiang, Y.; Chen, P.; Zhou, Y. Characteristics and applications of summer season raindrop size distributions based on a PARSIVEL2 disdrometer in the western Tianshan Mountains (China). Remote Sens. 2022, 14, 3988. [Google Scholar] [CrossRef]
  55. You, C.-H.; Suh, S.-H.; Jung, W.; Kim, H.-J.; Lee, D.-I. Dual-Polarization Radar-Based Quantitative Precipitation Estimation of Mountain Terrain Using Multi-Disdrometer Data. Remote Sens. 2022, 14, 2290. [Google Scholar] [CrossRef]
  56. Löffler-Mang, M.; Joss, J. An optical disdrometer for measuring size and velocity of hydrometeors. J. Atmos. Ocean. Technol. 2000, 17, 130–139. [Google Scholar] [CrossRef]
  57. Yuter, S.E.; Kingsmill, D.E.; Nance, L.B.; Löffler-Mang, M. Observations of precipitation size and fall speed characteristics within coexisting rain and wet snow. J. Appl. Meteorol. 2006, 45, 1450–1464. [Google Scholar] [CrossRef]
  58. Beard, K.V.; Johnson, D.B.; Baumgardner, D. Aircraft observations of large raindrops in warm, shallow, convective clouds. Geophys. Res. Lett. 1986, 13, 991–994. [Google Scholar] [CrossRef]
  59. Friedrich, K.; Higgins, S.; Masters, F.J.; Lopez, C.R. Articulating and stationary PARSIVEL disdrometer measurements in conditions with strong Winds and heavy rainfall. J. Atmos. Oceanic Technol. 2013, 30, 2063–2080. [Google Scholar] [CrossRef]
  60. Atlas, D.; Srivastava, R.C.; Sekhon, R.S. Doppler radar characteristics of precipitation at vertical incidence. Rev. Geophys. 1973, 11, 1–35. [Google Scholar] [CrossRef]
  61. Jaffrain, J.; Berne, A. Experimental quantification of the sampling uncertainty associated with measurements from PARSIVEL disdrometers. J. Hydrometeorol. 2011, 12, 352–370. [Google Scholar] [CrossRef]
  62. Tokay, A.; Petersen, W.A.; Gatlin, P.; Wingo, M. Comparison of raindrop size distribution measurements by collocated disdrometers. J. Atmos. Ocean. Technol. 2013, 30, 1672–1690. [Google Scholar] [CrossRef]
  63. Ulbrich, C.W.; Atlas, D. Rainfall microphysics and radar properties: Analysis methods for drop size spectra. J. Appl. Meteorol. 1998, 37, 912–923. [Google Scholar] [CrossRef]
  64. Zhang, G.; Vivekanandan, J.; Brandes, E.A.; Meneghini, R.; Kozu, T. The shape-slope relation in observed gamma raindrop size distributions: Statistical error or useful information? J. Atmos. Ocean. Technol. 2003, 20, 1106–1119. [Google Scholar] [CrossRef]
  65. Kalogiros, J.; Anagnostou, M.N.; Anagnostou, E.N. Optimum estimation of rain microphysical parameters from X-band dual-polarization radar observables. IEEE Trans. Geosci. Remote Sens. 2013, 51, 3063–3076. [Google Scholar] [CrossRef]
  66. Leinonen, J. High-level interface to T-matrix scattering calculations: Architecture, capabilities and limitations. Opt. Express 2014, 22, 1655–1660. [Google Scholar] [CrossRef]
  67. Waterman, P.C. Matrix formulation of electromagnetic scattering. Proc. IEEE 1965, 53, 805–812. [Google Scholar] [CrossRef]
  68. Tokay, A.; Bashor, P.G.; Habib, E.; Kasparis, T. Raindrop size distribution measurements in tropical cyclones. Mon. Weather. Rev. 2008, 136, 1669–1685. [Google Scholar] [CrossRef]
  69. Guo, Z.; Hu, S.; Liu, X.; Chen, X.; Zhang, H.; Qi, T.; Zeng, G. Improving S-band polarimetric radar monsoon rainfall estimation with two-dimensional video disdrometer observations in South China. Atmosphere 2021, 12, 831. [Google Scholar] [CrossRef]
  70. Chen, H.; Chandrasekar, V. The quantitative precipitation estimation system for Dallas-Fort Worth (DFW) urban remote sensing network. J. Hydrol. 2015, 531, 259–271. [Google Scholar] [CrossRef]
  71. Chen, H.; Chandrasekar, V.; Bechini, R. An improved dual-polarization radar rainfall algorithm (DROPS2.0): Application in NASA IFloodS field campaign. J. Hydrometeorol. 2017, 18, 917–937. [Google Scholar] [CrossRef]
Figure 1. Location of Zhaosu (the black dot), with shading representing the topography (m) of the Tianshan Mountains.
Remotesensing 15 02668 g001
Figure 2. Accumulated rain duration (red histogram) and rain amount (blue line) for the six R classes in Zhaosu.
Remotesensing 15 02668 g002
Figure 3. Mean DSD variations for different R classes (color lines) and all samples (black line) in Zhaosu. The two vertical dashed lines on the left and right distinguish the raindrop spectrum of small and medium-size raindrops, and the raindrop spectrum of medium-size and large raindrops, respectively.
Remotesensing 15 02668 g003
Figure 4. Variations of the Dm and the log10Nw in Zhaosu for the six R classes. The line and dot of the box indicate the mean (black line) and median (black dot), respectively. The bottom (top) lines of the box indicate the 25th (75th) percentiles. The bottom (top) lines of the vertical lines out of the box indicate the 5th (95th) percentiles.
Remotesensing 15 02668 g004
Figure 5. The contribution of small, medium, and large drops to R, Z, LWC, and Nt in Zhaosu.
Remotesensing 15 02668 g005
Figure 6. Scatterplots of Zdr versus Zh, and the ZdrZh relations represented by black line and equation on the (a) S-band, (c) C-band, and (e) X-band. Scatterplots of Kdp versus Zh, and the KdpZh relations represented by black line and equation on the (b) S-band, (d) C-band, and (f) X-band.
Remotesensing 15 02668 g006
Figure 7. Scatterplot of R calculated from (a) R(Zh), (b) R(Kdp), (c) R(Zh,Zdr), and (d) R(Kdp,Zdr) relations versus the R computed from DSD for S-band in Zhaosu.
Remotesensing 15 02668 g007
Figure 8. Scatterplot of R calculated from (a) R(Zh), (b) R(Kdp), (c) R(Zh,Zdr), and (d) R(Kdp,Zdr) relations versus the R computed from DSD for C-band in Zhaosu.
Remotesensing 15 02668 g008
Figure 9. Scatterplot of R calculated from (a) R(Zh), (b) R(Kdp), (c) R(Zh,Zdr), and (d) R(Kdp,Zdr) relations versus the R computed from DSD for X-band in Zhaosu.
Remotesensing 15 02668 g009
Figure 10. Variations of (a) Zh, (b) Zdr, and (c) Kdp on the S- (red), C- (green), and X-bands (purple) for the six R classes. The line of the box indicates the mean. The bottom (top) lines of the box indicate the 25th (75th) percentiles. The bottom (top) lines of the vertical lines out of the box indicate the 5th (95th) percentiles.
Remotesensing 15 02668 g010
Figure 11. The (a,d,g) CC, (b,e,h) RMSE, and (c,f,i) NMAE of R estimated from the dual-polarization radar QPE estimators against R calculated from the DSD under different R classes and different radar bands, (ac) for S-band, (df) for C-band, and (gi) for X-band, respectively.
Remotesensing 15 02668 g011
Table 1. Several important DSD parameters for the six R classes.
ParametersNo. of SamplesR
(mm h−1)
D0
(mm)
LWC
(g m−3)
Z
(dBZ)
Nt
(m−3)
C159700.260.900.0214.67188
C230300.721.000.0520.66222
C325631.431.130.0925.04237
C421093.071.340.1730.25249
C56126.911.720.3236.21254
C632516.852.300.6643.03260
Table 2. The DSD-based dual-polarization radar QPE relations for S-, C-, and X-band at Zhaosu.
BandR(Zh)R(Kdp)R(Zh,Zdr)R(Kdp,Zdr)
SR(Zh) = 0.096 Zh0.468R(Kdp) = 27.831 Kdp0.639R(Zh,Zdr) = 0.013 Zh0.82410−0.352ZdrR(Kdp,Zdr) = 75.719 Kdp0.84510−0.172Zdr
CR(Zh) = 0.098 Zh0.457R(Kdp) = 16.914 Kdp0.641R(Zh,Zdr) = 0.010 Zh0.90010−0.556ZdrR(Kdp,Zdr) = 51.816 Kdp0.89010−0.251Zdr
XR(Zh) = 0.070 Zh0.497R(Kdp) = 13.053 Kdp0.668R(Zh,Zdr) = 0.018 Zh0.74410−0.294ZdrR(Kdp,Zdr) = 23.265 Kdp0.81610−0.147Zdr
Table 3. The mean of Zh, Zdr, and Kdp on the S-, C-, and X-bands for the six R classes. Red font indicates the maximum value at the same R class.
BandZh (dBZ)Zdr (10−1 dB)Kdp (10−3 km−1)
C1C2C3C4C5C6C1C2C3C4C5C6C1C2C3C4C5C6
S15.8221.7326.0831.2737.4744.6910.4710.7111.0511.7112.9315.171.44.511.332.8110.1426.7
C15.9321.8926.3131.6438.0345.5110.4810.7211.0911.7912.9014.712.99.524.271.5241.7933.6
X16.0922.1026.5831.9438.1845.2210.4910.7311.0711.7012.7514.694.715.539.8116.2379.91394.0
Disclaimer/Publisher’s Note: The statements, opinions and data contained in all publications are solely those of the individual author(s) and contributor(s) and not of MDPI and/or the editor(s). MDPI and/or the editor(s) disclaim responsibility for any injury to people or property resulting from any ideas, methods, instructions or products referred to in the content.

