

Statistical Analysis of Mesovortices during the First Rainy Season in Guangdong, South China
by
 ,
,
Ying Tang
1,2,
Xin Xu
2,3,* ,
,
Yuanyuan Ju
2,3,
Zhenyu Wu
1,
Shushi Zhang
4,
Xunlai Chen
5 and
Qi Xu
6 1
Nanjing Marine Radar Institute, Nanjing 210023, China
2
Key Laboratory of Mesoscale Severe Weather, Ministry of Education, School of Atmospheric Sciences, Nanjing University, Nanjing 210023, China
3
Key Laboratory of Radar Meteorology, China Meteorology Administration, Nanjing 210023, China
4
Key Laboratory of Transportation Meteorology of China Meteorological Administration, Nanjing Joint Institute for Atmospheric Sciences, Nanjing 210023, China
5
Shenzhen Meteorology Bureau, Shenzhen 518040, China
6
Jiangsu Air Traffic Management Branch Bureau of Civil Aviation Administration of China, Nanjing 211113, China
*
Author to whom correspondence should be addressed.
Remote Sens. 2023, 15(8), 2176; https://doi.org/10.3390/rs15082176
Submission received: 9 March 2023
/
Revised: 10 April 2023
/
Accepted: 17 April 2023
/
Published: 20 April 2023
(This article belongs to the Special Issue Processing and Application of Weather Radar Data)
Abstract
:Based on Doppler radar observation and reanalysis data, the statistical characteristics of mesovortices (MVs) during the first rainy season (April–June) in Guangdong, South China, from 2017 to 2019 are studied, including their spatiotemporal distributions, structural features and favorable environmental conditions. The results show that the MVs usually exhibit short lifetimes; about 70% last for less than 30 min. The intensity and horizontal scale of the MVs are proportional to their lifetime. Long-lived MVs have larger horizontal scales and stronger intensities than short-lived ones. The MVs are mainly observed over the Pearl River Delta region, followed by western Guangdong Province, but relatively fewer in both eastern and northern Guangdong Province. The uneven spatial distribution of the MVs is closely related to the differences in the topographical features and the environment conditions over South China. MVs are prone to form over flat regions. The Pearl River Delta and eastern Guangdong regions are relatively flat compared to the more mountainous western and northern Guangdong regions. Moreover, the monsoonal south-westerlies, water vapor flux, atmospheric instability and vertical wind shear over southwest Guangdong are significantly larger than those in other regions and are favorable for the formation of MVs. The occurrence frequencies of MVs in central and southern parts of Guangdong display similar diurnal variations, reaching the peak during the late afternoon and early evening while dropping to the minimum overnight. However, the situation is opposite in northern Guangdong, with the peak overnight and the minimum during the late afternoon and early evening. The regional differences in diurnal variation are likely related to the moving direction of mesoscale convective systems (MCSs) in Guangdong.
1. Introduction
South China is an area with high frequency of severe convective weather where disastrous weather events such as short-term heavy rainfall, tornadoes and gales frequently occur [1,2]. Severe convective weather often causes serious casualties and property losses. For example, on 13 April 2016, a strong squall line caused gusts in most of Guangdong Province, with the wind speed in most areas reaching 13.9 m s−1 (even up to 41.5–46.1 m s−1 in some areas). Meanwhile, it was also accompanied by short-term heavy rainfall, causing great economic losses [3]. On 4 March 2018, a rarely seen strong squall line occurred over the northern and central parts of Jiangxi Province. During this process, high winds exceeding 17.2 m s−1 were found at 521 observational stations, and the wind speeds at 172 stations were above 24.5 m s−1. This severe squall line affected more than 267,000 people and caused great damages to a large number of houses and crops, resulting in a direct economic loss of CNY 410 million [4].
The genesis of severe convective weather and parent mesoscale convective systems (MCSs) in South China has been studied extensively in the past. For example, Du et al. [5] investigated the effects of topography, land–sea contrast and cold pool on convection initiation in the coastal area of South China through a series of sensitivity experiments. The moving direction of cold pool outflow changed due to terrain blocking, thereby affecting the development and movement of the MCS. Based on Doppler radar observation, Liu et al. [6] analyzed an extreme precipitation event caused by two MCSs in South China on 11 May 2014. Results showed that the rapid splitting and reconstructing of bow echoes within the MCSs are conducive to the occurrence of extreme rainfall. By using an objective identification algorithm of convection initiation, Bai et al. [7] conducted a statistical study on the radar climatology of convections in the coastal area of South China. Convection initiation exhibited three peaks, i.e., a late-night-to-morning peak on the windward coast and offshore, a noon-to-late-afternoon peak on the coastal land, and an evening-to-early-morning peak over the northwestern highland, respectively.
Past studies have revealed the relationship between severe convective weather and meso-β-scale convective systems (with horizontal scales ranging from 20 to 200 km). However, the forecasting of severe convective weather is still one of the key challenging tasks in current weather forecasts due to its small horizontal scale and abruptness [8]. With the progress of observation techniques, especially the widespread application of Doppler weather radar, and the continuous development of numerical models, increasing attention has been paid to the meso-γ-scale (with horizontal scales from 2–20 km) or even smaller-scale processes. In particular, severe convective weather (e.g., tornadoes and straight-line winds) can be directly caused by meso-γ-scale vortices. For example, Trapp et al. [9] found that ~26% of meso-γ-scale vortices can develop into tornadoes, in accordance with the radar analysis of tornadic mesocyclones. Based upon single Doppler radar analysis, Wakimoto et al. [10] examined the formation of derechos (i.e., high straight-line winds) produced by bow echoes. They found that the near-surface high winds were due to the superposition of the ambient flow with the rotational flow of low-level meso-γ-scale vortices formed at the bow echo leading convective line. This was also confirmed by Atkins and Laurent [11] and Xu et al. [12] by virtue of the Weather Research and Forecasting Model simulations.
In general, meso-γ-scale vortices can be classified into two types according to their parent convective systems. One is mesocyclones caused by isolated cells [13], and the other is the so-called mesovortices (MVs) generated in the low level of organized MCSs [14]. Previous studies of meso-γ-scale vortices in China focused on mesocyclones [15,16,17]. Taking a squall line that occurred in Guangdong on 20 March 2013 for example [18], there were many supercells within this squall line. Most of the gales were generated by the supercellular mesocyclones. However, there is still a lack of thorough studies of MVs in China. Recently, Tang et al. [19] (hereafter T20) conducted a statistical analysis of MVs that occurred in the warm season of the Yangtze–Huai River Basin (YHRB) using 3-year radar observations. Their results showed that most of the MVs were short-lived, with an average lifetime of 26 min. Long-lived MVs were prone to having a larger size and stronger intensity than those of short-lived MVs. In this work, the characteristics of MVs that occurred in the first rainy season of South China (i.e., April to June) are studied by using 3-year radar observations during 2017–2019, and these characteristics are then compared to those in the YHRB.
2. Data and Methods
2.1. Data
In this study, observations from nine Doppler weather radars in Guangdong from April to June in 2017–2019 were used. The distribution of these radar stations is shown in Figure 1, covering almost the whole Guangdong Province. As in T20, the 88D2ARPS program of the Advanced Regional Prediction System (ARPS) from the Center for Analysis and Prediction of Storms (CAPS) at the University of Oklahoma [20] was used for the raw radar data quality control, which removes non-meteorological echoes and performs the radial velocity de-aliasing [21]. The processed radar data were further used to identify and statistically analyze the MVs. Finally, the ERA5 reanalysis data [22] with a high horizontal resolution of 0.25° × 0.25° from the European Centre for Medium-Range Weather Forecasts (ECMWF) were utilized to study the environmental conditions for MVs in Guangdong from April to June.
2.2. Identification of MVs
Since MVs are mainly generated in organized MCSs, it was necessary to identify the MCSs in advance. Firstly, the composite reflectivity from the nine Doppler radars (Figure 1) was used to identify convective zones (CZs) of >35 dBZ. Then, the area of each CZ was calculated, and a CZ with an area greater than 1000 km2 was considered as an MCS. More details about the detection of MCSs can be found in T20.
In the past, the identification of meso--scale vortices (e.g., mesocyclones) or even smaller-scale circulations (e.g., tornadoes) mainly depended on the appearance of a positive–negative velocity pair in the Doppler radar radial velocity field [23]. The rotational strength of a vortex is measured by the difference between the maximum inbound and outbound radial velocities; however, this measurement is susceptible to velocity noises. When the environmental wind speed is strong, the positive–negative velocity cannot be identified because it is easily submerged in the background wind field. Moreover, when the vortex is far from the radar station, the azimuthal resolution becomes too low to well resolve the velocity pair. In this study, a more advanced linear least square derivative method [24] was used to calculate the azimuthal shear of an MV. This method considers the contribution of all radial velocities in a given range to the azimuthal shear at the center point, thus reducing the noise errors caused by the radial velocities.
In this study, we only calculated the azimuthal shear at the 0.5° elevation within 150 km of the radar because the MVs are mainly generated in the lower troposphere below 3 km. As in T20, a lower limit of 10−3 s−1 was adopted for the azimuthal shear of MVs, which is one order greater than the Coriolis parameter in mid-latitudes. The duration of the MV must exceed 18 min, i.e., three volume scans of the radar. On this basis, a storm cell identification technology similar to WSR-88D was adopted for the forward and backward tracking of MVs to obtain their life cycles [25].
Because the radar radial velocity cannot be composed, the identification of MVs can only be performed for each individual radar. Despite the dense distribution of Doppler radars in Guangdong Province, only four radars covering almost the whole province were selected to identify the MVs. These four radars are the Shaoguan (9751), Shantou (9754), Yangjiang (9662) and Guangzhou (9200) radar stations, representing the northern, eastern and western Guangdong Province and the Pearl River Delta region, respectively.
3. Characteristics of MVs during the First Rainy Season in Guangdong, South China
3.1. Spatiotemporal Distribution
During the first rainy season (April–June) in Guangdong, South China, from 2017 to 2019, a total of 7965 MVs were identified using the four radars in Guangdong Province (Table 1). Figure 2 shows the uneven spatial distribution of MVs in Guangdong Province. The MVs are most concentrated in the Pearl River Delta region, accounting for about 41% of the total, followed by western Guangdong where the MVs account for about 27%. There are far fewer MVs generated in eastern and northern Guangdong, which together account for less than half of the total. In particular, the MVs are sparsely distributed near the Nanling mountains in northern Guangdong. The uneven spatial distribution of the MVs can be attributed to the following two reasons: The first is the different topographical features of Guangdong. Laing and Fritsch [26] have pointed out that MVs are prone to form over flat regions, such as the America Great Plains. Purpura et al. [27] documented supercell activity (i.e., meso-γ-scale mesovortex activity) across the Appalachian Mountains in America and also found that there are fewer supercells in the more mountainous areas. The formation of MVs is therefore affected by the topography of the Nanling mountains in northern Guangdong and the Lianhua, Luofu and Jiulian Mountains in eastern Guangdong. In contrast, the relatively flat terrain in western Guangdong and Pearl River Delta region is conducive to the formation of the MVs. Secondly, the uneven spatial distribution of MVs is intimately related to the differences in environmental conditions in different regions of Guangdong, which will be discussed in Section 3.3. In terms of lifetime, most of the MVs (about 67%) last less than 30 min, and about 30% last more than half an hour, while the ones lasting more than one hour only account for about 5% (Table 1). The statistical characteristics of MV lifetime in Guangdong are similar to those in the YHRB [19].
Figure 3 shows the monthly and diurnal variations of the MVs in Guangdong. The number of MVs generated in June is significantly larger than that in April and May, accounting for about half of the total (Figure 3a). In addition, the MVs display notable diurnal variations (Figure 3b). MV occurrence is most frequent from the late morning to the afternoon (0900 BJT to 1800 BJT, i.e., Beijing time) but drops to the minimum overnight (2100 BJT to 0300 BJT). This diurnal variation is just opposite to that in the warm season in the YHRB [19]. Specifically, the MVs in the YHRB present slight diurnal variations (figures omitted), with two weak peaks at night (1800 BJT to 2100 BJT) and in the morning (0600 BJT to 0900 BJT), respectively. In addition, there is a minimum at night (0300 BJT to 0600 BJT).
Figure 4 shows the distributions of the diameters and intensities (in terms of azimuthal shear) of the MVs. It can be seen that the MV diameters are mostly between 4 km and 12 km (about 80%), while only a few are larger than 12 km or smaller than 4 km (Figure 4a). Most of the MVs (about 94%) are weak, with intensities between 0.001 s−1 and 0.004 s−1, while only about 6% are stronger than 0.004 s−1 (Figure 4b). It is indicated that the diameter of the MV is proportional to its lifetime (Table 2). The MVs presenting a short lifetime of 18–30 min have a mean diameter of 6.96 km, the MVs lasting for 30–60 min have a mean diameter of 8.35 km, and the MVs lasting for more than one hour have a mean diameter of 10.3 km. Similarly, the azimuthal shear of the MVs is also proportional to their lifetime. The MVs with a short lifetime of 18–30 min have an average intensity of 0.002 s−1, while the MVs with a long lifetime of exceeding 60 min have an average intensity of 0.003 s−1. Thus, a longer lifetime is accompanied by greater diameter and stronger intensity, which is similar to the characteristics of the MVs in the YHRB [19].
3.2. Comparison of MVs in Different Regions of Guangdong
As mentioned above, most MVs during the first rainy season in Guangdong appear in the Pearl River Delta region and western Guangdong. In this subsection, the temporal variations of MVs in different regions of Guangdong are compared. About half of the MVs in the Pearl River Delta region occur in June, which is significantly more than that in April and May. Similar monthly variations of MVs are found in eastern Guangdong. However, there are less significant monthly variations in northern and western Guangdong. The percentages of MVs generated in each month (April to June) are almost the same (Figure 5a).
The diurnal variations are quite similar for the MVs in the River Delta region and eastern Guangdong (Figure 5b), which show an afternoon-to-night peak and night-to-early-morning minimum. However, the MVs in northern and western Guangdong present a different diurnal variation. The MVs in northern Guangdong show a night-to-early-morning peak and afternoon-to-evening minimum. The MVs in western Guangdong have a midday peak and night-to-early-morning minimum. This may be explained by the moving direction of MCSs in Guangdong. On the one hand, during April and May in South China, there is still weak cold air frequently affecting Guangdong from the north. Under the combined influence of dry and cold air from the north and warm and moist air from the sea, there is usually an MCS accompanied by a cold front, affecting Guangdong from the north to the south. The MCS tends to be triggered in northern Guangdong during the night-to-morning period and then moves eastward and southward to southern Guangdong from the afternoon to evening [28]. Strong urban heat island effects over the River Delta region could also play some role in the development of MCSs. The afternoon peak of MCSs is partially attributed to the solar heating-induced increase in CAPE. Therefore, the MVs generated in the MCS present diurnal variations consistent with those of the MCSs.
Moreover, the statistical characteristics of MV lifetime in the Pearl River Delta region are similar to those in the other three regions, with an average lifetime of 25–30 min. The azimuthal shear intensity and horizontal scale of the MVs are also similar in the Pearl River Delta region and northwest Guangdong, with an average diameter of about 7 km and an average intensity of about 0.002 s−1. The MVs in eastern Guangdong are slightly weaker and smaller than those in the other three regions (Table 3).
3.3. Environmental Conditions
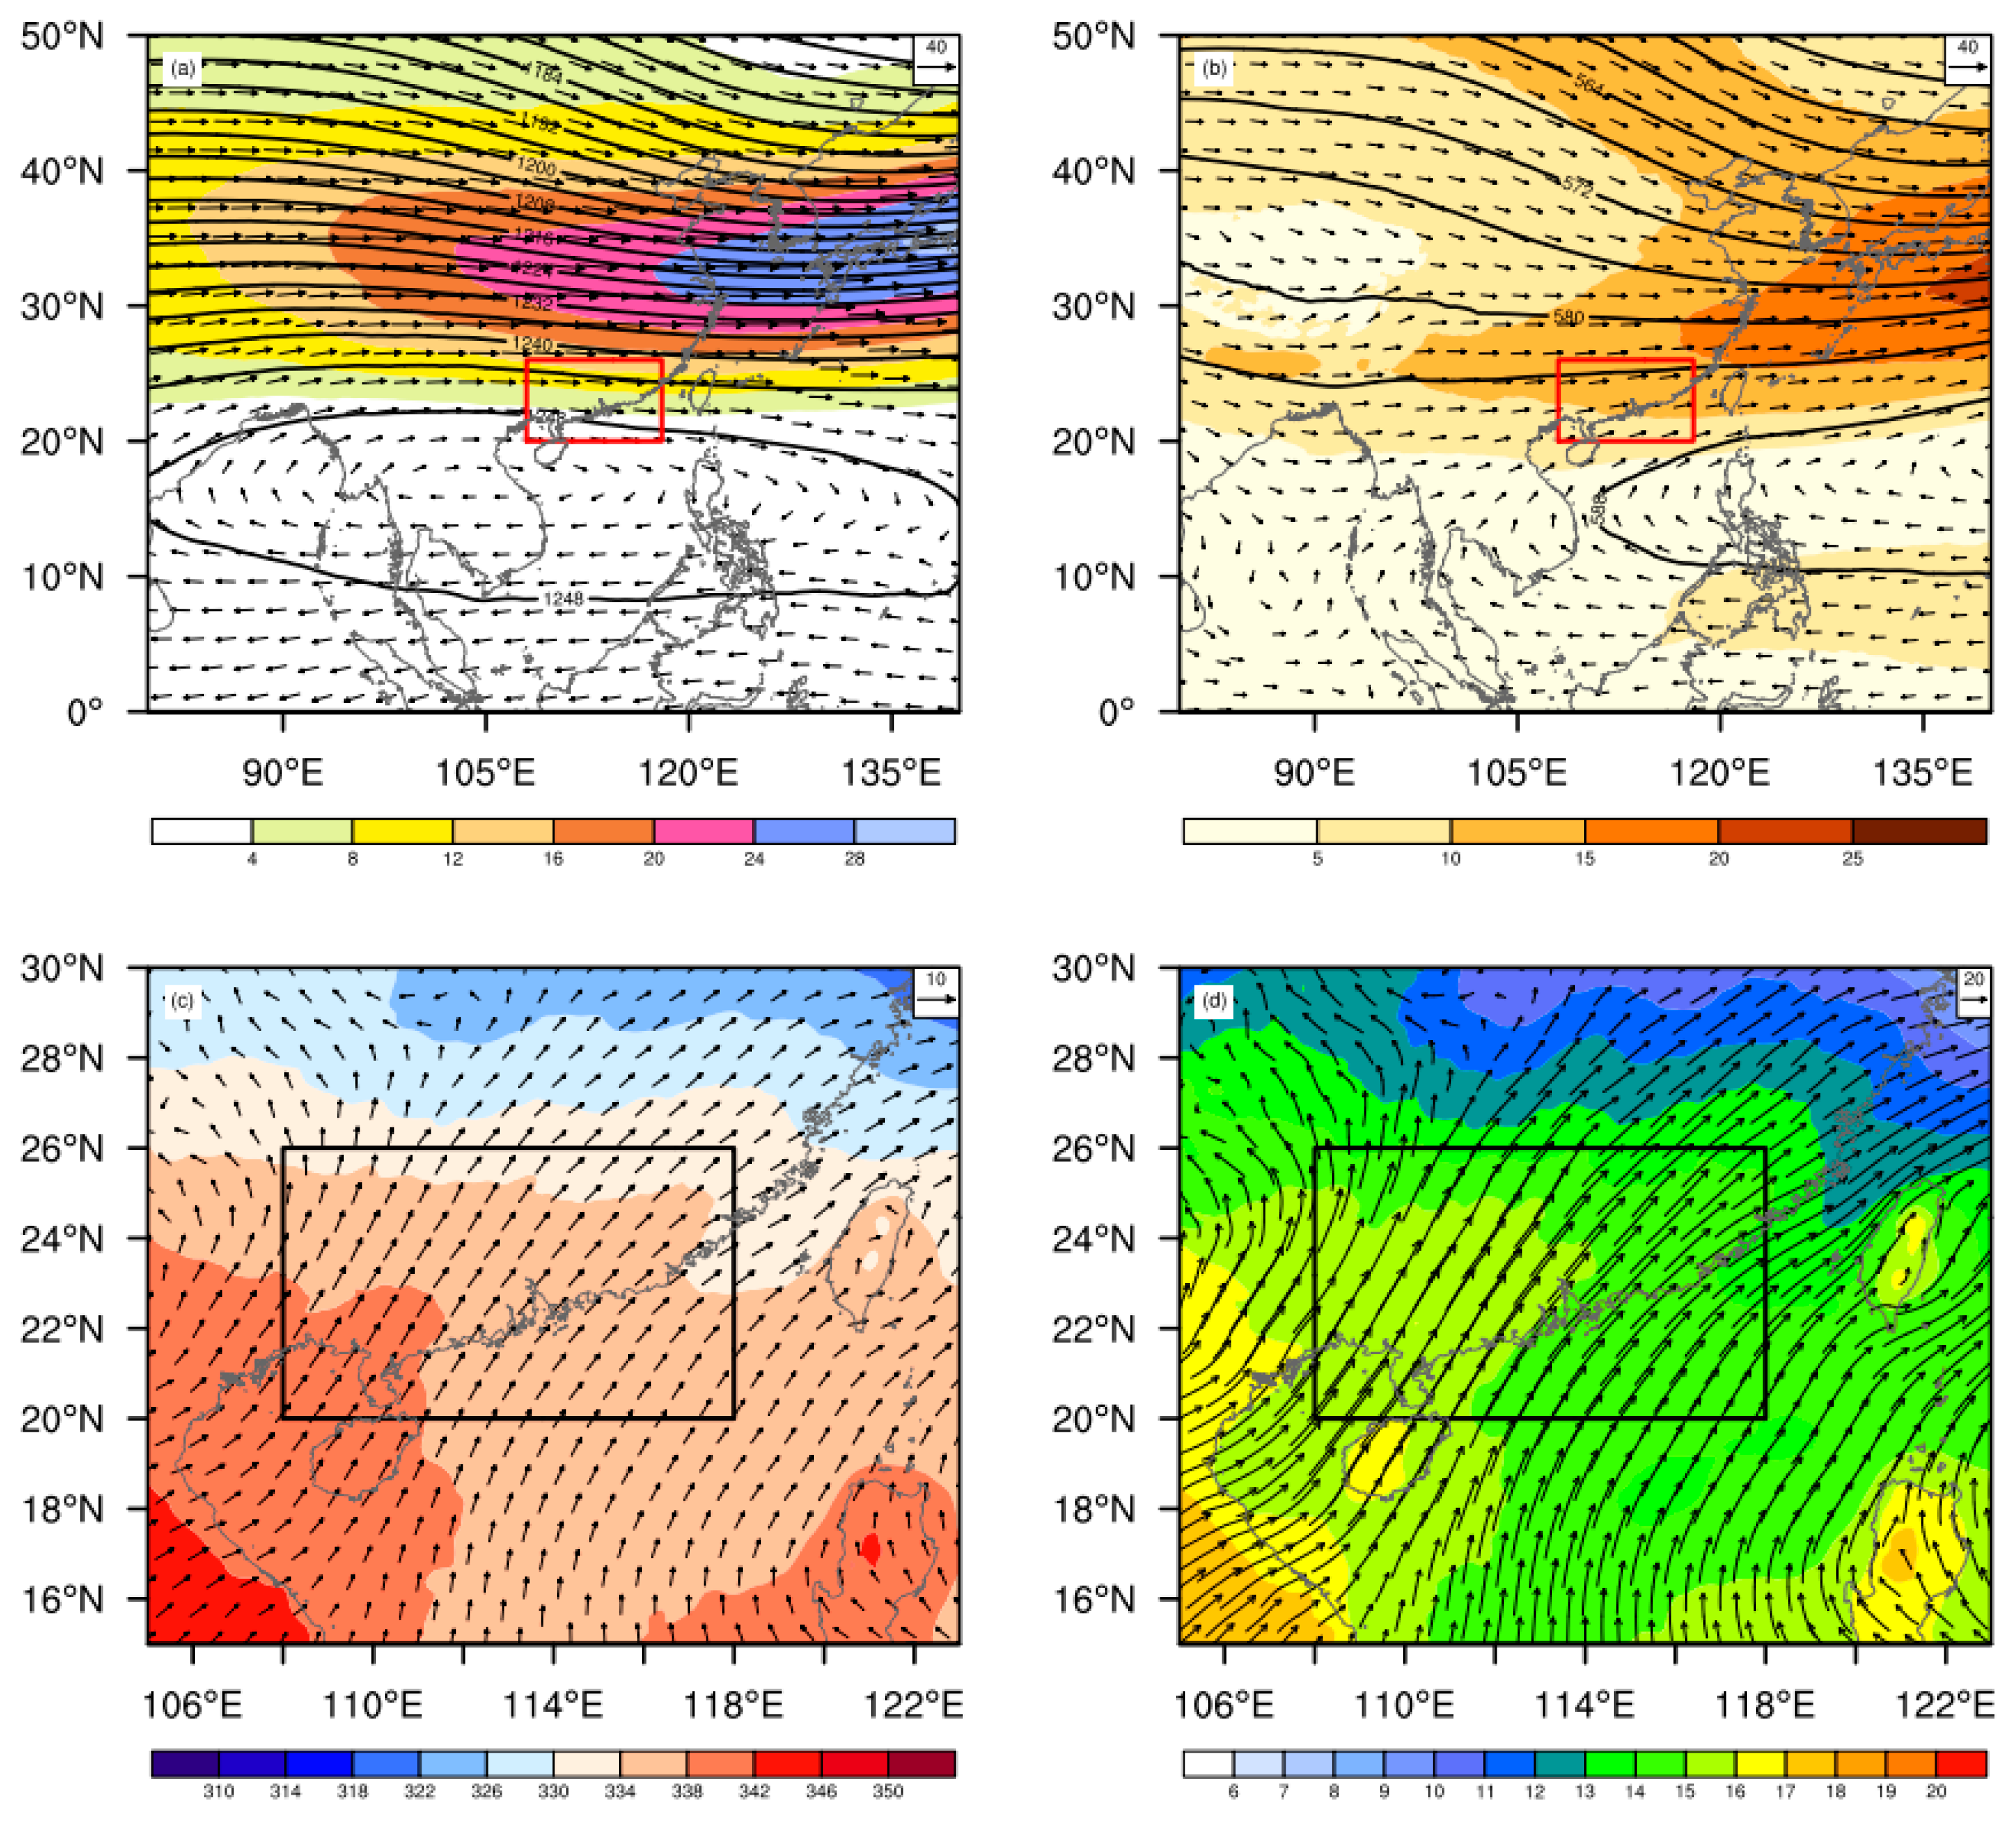
As noted above, the spatial distribution of the MVs during the first rainy season in South China is affected by environmental conditions. During this period, the South Asia high center is located in the upper troposphere (200 hPa) over the Indochina Peninsula and adjacent areas (Figure 6a). South China is on the southern side of the upper-level jet axis at its entrance region. In the middle troposphere (500 hPa), the subtropical high lies between 10°N and 20°N, and South China lies on the northern side of the subtropical high and in the westerlies at the bottom of the East Asia trough (Figure 6b). In the lower troposphere (850 hPa), with the onset of the southwest monsoon, the equatorial westerlies from the Indian Ocean and the cross-equatorial flow from near Kalimantan Island entering the South China Sea converge and blow over South China (Figure 6c,d). Meanwhile, the low-level southwesterly jets transport abundant warm and moist air to South China, especially to the west of the Pearl River Estuary (the Pearl River Delta region and western Guangdong), resulting in the higher potential pseudo-equivalent temperature and water vapor flux in this region than in northern and eastern Guangdong.
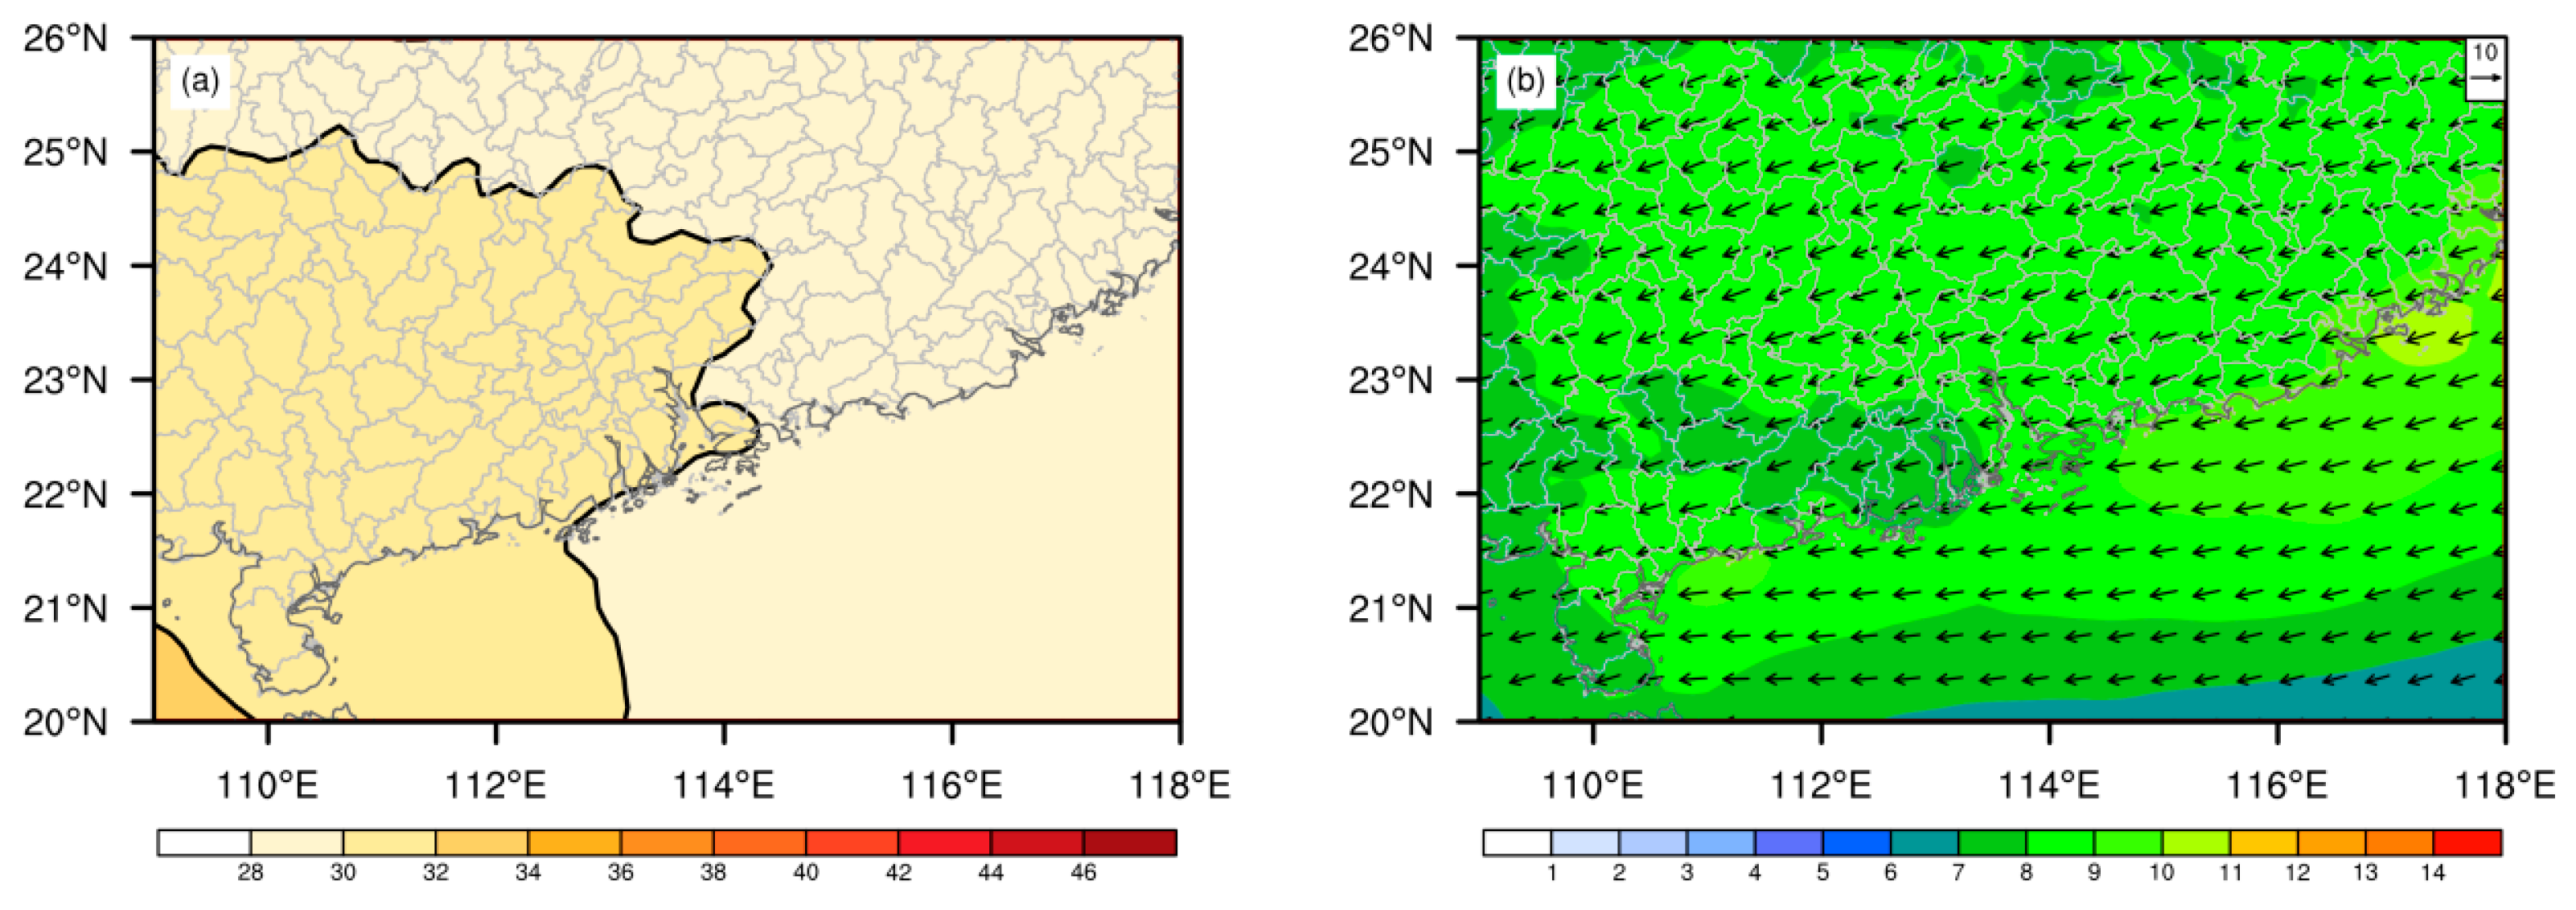
Due to the warm and moist airflow transported by the southwest monsoon, the mean low-level instability during April–June is relatively higher across the whole Guangdong Province (Figure 7a). The potential pseudo-equivalent temperature in southwest Guangdong (30–32 °C) is significantly higher than that in other regions (28–30 °C). In addition, the existence of the low-level jet causes stronger low-level wind shear over southwest Guangdong than in other regions (Figure 7b). In short, the relatively higher instability and stronger low-level vertical wind shear are conducive to the formation of MVs and are similar to the environmental conditions for the formation of MVs in the YHRB. Weisman and Trapp [29] studied the effects of vertical wind shear and CAPE on the genesis of MVs using idealized simulations. The results show that the stronger the vertical wind shear is, especially for the low-level wind shear, the stronger the MVs will be. High CAPE is favorable for the formation of MVs. Atkins and Laurent [11] obtained a similar result by using the Advanced Research Weather Research and Forecasting (ARW-WRF) model to study the relationship between the development of MVs and these two parameters.
4. Conclusions
In this paper, the mesovortices (MVs) that occurred during the first rainy season (April to June) in South China during 2017–2019 were analyzed using Doppler radar observations as well as ERA5 reanalysis. The spatiotemporal distributions and structural features of MVs were examined, as were their favorable environmental conditions. The main conclusions are as follows:
The MVs are mainly observed in the Pearl River Delta region, followed by western Guangdong, and relatively fewer in both eastern and northern Guangdong. Similar to the Yangtze–Huaihe River Basin (YHRB), the MVs in South China present a very short lifetime, with about 70% lasting less than 30 min. The intensity and horizontal scale of the MVs are proportional to their lifetime; i.e., long-lived MVs have larger horizontal scales and stronger intensities than short-lived ones. Different from the MVs in the YHRB, the MVs in South China display more significant diurnal variations, which occur most frequently from late morning toward evening (1100 BJT to 1700 BJT) but drop to the minimum overnight (2000 BJT to 0200 BJT on the next day). In contrast, the MVs in the YRHB present slight diurnal variations, with two weak peaks at night (1800 BJT to 2100 BJT) and in the morning (0600 BJC to 0900 BJT) as well as a minimum in the early morning (0300 BJT to 0600 BJT).
The diurnal variations are quite similar for the MVs in the Pearl River Delta region, western and eastern Guangdong, with an afternoon-to-evening peak and a night-to-early-morning minimum. On the contrary, the diurnal variation of MVs in northern Guangdong is opposite to that mentioned above. This is because during the first rainy season in South China, under the combined influence of dry and cold air from the north and the warm and moist air from the sea, there is usually an MCS accompanied by a cold front, which thereby affects South China from north to south. The MCS tends to be triggered in northern Guangdong from night to morning and then moves to the southern coastal areas from afternoon to evening. As a result, MVs generated within MCSs have a similar diurnal variation to their parent systems.
The uneven spatial distribution of MVs is closely related to the environmental differences in South China. Affected by the southwest monsoon, the water vapor flux, low-level instability and vertical wind shear in southwest Guangdong are significantly greater than those in other regions during the first rainy season and are favorable to the formation of MVs.
This study contributes to the understanding of MVs in South China and thus has a great significance for the operational nowcasting and warning of MVs. However, the relationship between the MVs and severe weather (such as gales and heavy rainfall [30,31]) in South China is still unclear and will be studied in the future.
Author Contributions
Conceptualization, Y.T. and X.X.; formal analysis, Y.T. and X.X.; methodology, Y.T. and X.X.; resources, X.C. and Q.X.; writing—original draft preparation, Y.T. and X.X.; writing—review and editing, Y.T., X.X., Y.J., Z.W. and S.Z. All authors have read and agreed to the published version of the manuscript.
Funding
This work is supported by the National Natural Science Foundation of China (42122036, 42230607, 41750965) and the Second Tibetan Plateau Scientific Expedition and Research (STEP) program (2019QZKK0105).
Data Availability Statement
The data that support the findings of this study are available from the first author, upon reasonable request.
Acknowledgments
The authors would like to thank the anonymous reviewers for helpful comments and suggestions.
Conflicts of Interest
The authors declare no conflict of interest.
References
- Fan, L.M.; Yu, X.D. Characteristic analyses on environmental parameters in short-term severe convective weather in China. Plateau. Meteorol. 2013, 32, 156–165. [Google Scholar]
- Xue, X.Y.; Ren, G.Y.; Sun, X.B.; Ren, Y.Y.; Yu, Y. Climatological characteristics of meso-scale and micro-scale strong convective weather events in China. Clim. Environ. Res. 2019, 24, 199. (In Chinese) [Google Scholar]
- Wang, L.; Shen, X.; Wang, Y.; Zhang, C.; Wang, Y.; Li, X. Mechanism analysis of a squall line upscale growing process in South China. Plateau. Meteorol. 2021, 40, 145–158. [Google Scholar]
- Zhang, C.; Zhi, S.L.; Xu, A.H. Analysis of radar echo characteristics of rare force 10 gale with a strong squall line event in Jiangxi. Torrential Rain Disasters 2019, 38, 135–143. (In Chinese) [Google Scholar]
- Du, Y.; Chen, G.X.; Han, B.; Bai, L.Q.; Li, M.H. Convection initiation and growth at the coast of South China. Part II: Effects of the terrain, coastline, and cold pools. Mon. Weather Rev. 2020, 148, 3871–3892. [Google Scholar] [CrossRef]
- Liu, X.; Luo, Y.L.; Guan, Z.Y.; Zhang, D.L. An extreme rainfall event in coastal South China during SCMREX-2014: Formation and roles of rainband and echo trainings. J. Geophys. Res. Atmos. 2018, 123, 9256–9278. [Google Scholar] [CrossRef]
- Bai, L.Q.; Chen, G.X.; Huang, L. Image processing of radar mosaics for the climatology of convection initiation in South China. J. Appl. Meteorol. Climatol. 2020, 59, 65–81. [Google Scholar] [CrossRef]
- Yu, X.D.; Zhou, X.G.; Wang, X.M. The advances in the nowcasting techniques on thunderstorms and severe convection. Acta Meteorol. Sin. 2012, 70, 311–337. [Google Scholar]
- Trapp, R.J.; Tessendorf, S.A.; Godfrey, E.S.; Brooks, H.E. Tornadoes from squall lines and bow echoes. Part I: Climatological distribution. Weather. Forecast. 2005, 20, 23–34. [Google Scholar] [CrossRef]
- Wakimoto, R.M.; Murphey, H.V.; Davis, C.A.; Atkins, N.T. High winds generated by bow echoes. Part II: The relationship between the mesovortices and damaging straight-line winds. Mon. Weather Rev. 2006, 134, 2813–2829. [Google Scholar] [CrossRef]
- Atkins, N.T.; St. Laurent, M. Bow echo mesovortices. Part I: Processes that influence their damaging potential. Mon. Weather Rev. 2009, 137, 1497–1513. [Google Scholar] [CrossRef]
- Xu, X.; Xue, M.; Wang, Y. The genesis of mesovortices within a real-data simulation of a bow echo system. J. Atmos. Sci. 2015, 72, 1963–1986. [Google Scholar] [CrossRef]
- Burgess, D.W.; Donaldson, R.J., Jr.; Desrochers, P.R. The Tornado: Its Structure, Dynamics, Prediction, and Hazards; American Geophysical Union: Washington, DC, USA, 1993. [Google Scholar] [CrossRef]
- Funk, T.W.; Darmofal, K.E.; Kirkpatrick, J.D.; Dewald, V.L.; Przybylinski, R.W.; Schmocker, G.K.; Lin, Y.-J. Storm reflectivity and mesocyclone evolution associated with the 15 April 1994 squall line over Kentucky and Southern Indiana. Weather Forecast. 1999, 14, 976–993. [Google Scholar] [CrossRef]
- Yu, X.D.; Zheng, Y.Y.; Zhang, A.M.; Yao, Y.Q.; Fang, C. The detection of a severe tornado event in Anhui with China new generation weather radar. Plateau. Meteorol. 2006, 25, 914–924. [Google Scholar]
- Feng, J.Q.; Tang, D.Z.; Yu, X.D.; Zhang, H.M.; Chen, Q.P. The accuracy statistics of mesocyclone identification products from CINRAD/SA. Meteorol. Mon. 2010, 36, 47–52. [Google Scholar]
- Fang, C.; Zheng, Y. The analysis of mesocyclone product from the doppler weather radar. Meteorol. Mon. 2007, 33, 16–20. [Google Scholar]
- Fang, C.; Yu, X.D.; Zhu, W.J.; Yin, Z.H.; Zhou, K.H. Characteristics of the thunderstorm gale process in Hunan and Guangdong on 20 March 2013. Meteorol. Mon. 2015, 41, 1305–1314. [Google Scholar]
- Tang, Y.; Xu, X.; Xue, M.; Tang, J.; Wang, Y. Characteristics of low-level meso-γ-scale vortices in the warm season over East China. Atmos. Res. 2020, 235, 104768. [Google Scholar] [CrossRef]
- Xue, M.; Droegemeier, K.K.; Wong, V.; Shapiro, A.; Brewster, K.; Carr, F.; Weber, D.; Liu, Y.; Wang, D. The Advanced Regional Prediction System (ARPS)—A multi-scale nonhydrostatic atmospheric simulation and prediction tool. Part II: Model physics and applications. Meteor. Atmos. Phys. 2000, 76, 143–165. [Google Scholar] [CrossRef]
- Brewster, K.; Hu, M.; Xue, M.; Gao, J. Efficient assimilation of radar data at high resolution for short-range numerical weather prediction. In Proceedings of the World Weather Research Program Symposium on Nowcasting and Very Short-range Forecasting, Toulouse, France, 6 September 2005. [Google Scholar]
- Hersbach, H.; Dee, D. ERA5 Reanalysis is in Production. ECMWF Newsl. 2016, 147, 7. [Google Scholar]
- Mitchell, E.D.; Vasiloff, S.V.; Stumpf, G.J.; Witt, A.; Eilts, M.D.; Johnson, J.T.; Thomas, K.W. The national severe storms laboratory tornado detection algorithm. Weather Forecast. 1998, 13, 352–366. [Google Scholar] [CrossRef]
- Smith, T.M.; Elmore, K.L. The use of radial velocity derivatives to diagnose rotation and divergence. In Proceedings of the 11th Conf. on Aviation, Range, and Aerospace, Hyannis, MA, USA, 5 October 2004. [Google Scholar]
- Johnson, J.T.; Mackeen, P.L.; Witt, A.; Mitchell, E.D.; Stumpf, G.J.; Eilts, M.D.; Thomas, K.W. The storm cell identification and tracking algorithm: An enhanced WSR-88D algorithm. Weather. Forecast. 1998, 13, 263–276. [Google Scholar] [CrossRef]
- Laing, A.G.; Fritsch, J.M. The global population of mesoscale convective complexes. Q. J. R. Meteorol. Soc. 1997, 123, 389–405. [Google Scholar] [CrossRef]
- Purpura, S.M.E.; Davenport, M.D.; McKeown, K.E.; Riggin, R.R. Environmental evolution of supercell thunderstorms interacting with the Appalachian Mountains. Weather. Forecast. 2023, 38, 179–198. [Google Scholar] [CrossRef]
- Wu, N.G.; Ding, X.; Wen, Z.P.; Chen, G.X.; Meng, Z.Y.; Lin, L.X.; Min, J.Z. Contrasting frontal and warm-sector heavy rainfalls over South China during the early-summer rainy season. Atmos. Res. 2020, 235, 104693. [Google Scholar] [CrossRef]
- Weisman, M.L.; Trapp, R.J. Low-level mesovortices within squall lines and bow echoes. Part I: Overview and dependence on environmental shear. Mon. Weather Rev. 2003, 131, 2779–2803. [Google Scholar]
- Wei, P.; Xu, X.; Xue, M.; Zhang, C.; Wang, Y.; Zhao, K.; Zhou, A.; Zhang, S.; Zhu, K. On the Key Dynamical Processes Supporting the 21.7 Zhengzhou Record-breaking Hourly Rainfall in China. Adv. Atmos. Sci. 2023, 40, 337–349. [Google Scholar] [CrossRef]
- Liu, Q.; Xu, X.; Zhao, K.; Zhou, A. A merger-formation bow echo caused by low-level mesovortex. J. Geophy. Res. Atmos. 2023, 128, 8. [Google Scholar] [CrossRef]
Figure 1.
Distribution of nine Doppler weather radars in Guangdong: Guangzhou (9200), Yangjiang (9662), Shaoguan (9751), Meizhou (9753), Shantou (9754), Shenzhen (9755), Zhaoqing (9758), Zhanjiang (9759) and Lianzhou (9763) radar stations. Red dots represent radars used to identify MVs.
Figure 1.
Distribution of nine Doppler weather radars in Guangdong: Guangzhou (9200), Yangjiang (9662), Shaoguan (9751), Meizhou (9753), Shantou (9754), Shenzhen (9755), Zhaoqing (9758), Zhanjiang (9759) and Lianzhou (9763) radar stations. Red dots represent radars used to identify MVs.

Figure 2.
Spatial distribution of occurrence frequency of MVs during the first rainy season in Guangdong, South China, from 2017 to 2019.
Figure 2.
Spatial distribution of occurrence frequency of MVs during the first rainy season in Guangdong, South China, from 2017 to 2019.

Figure 3.
(a) Monthly and (b) diurnal variations of the MVs in Guangdong from April to June during 2017–2019.
Figure 3.
(a) Monthly and (b) diurnal variations of the MVs in Guangdong from April to June during 2017–2019.

Figure 4.
Distributions of the (a) diameter (km) and (b) intensity (10−3·s−1) of the MVs in Guangdong from April to June during 2017–2019.
Figure 4.
Distributions of the (a) diameter (km) and (b) intensity (10−3·s−1) of the MVs in Guangdong from April to June during 2017–2019.

Figure 5.
(a) Monthly variations and (b) diurnal variations of MVs in the four different regions of Guangdong. Red bar (solid line) represents the Pearl River Delta region, with blue bar (solid line) for western Guangdong, green bar (solid line) for northern Guangdong and black bar (solid line) for eastern Guangdong.

Figure 6.
Wind fields (arrows and shaded, unit: m∙s−1) and geopotential height fields (black contours, unit: m) during April–June in (a) East Asia at 200 hPa and (b) Pan-South China at 500 hPa; (c) wind field (arrows, unit: m∙s−1) and potential pseudo-equivalent temperature (shaded, unit: K) in Pan-South China at 850 hPa; (d) water vapor flux (arrows and shaded, unit: g∙cm−1∙hPa−1∙s−1) in Pan-South China at 850 hPa. Both the red and black boxes represent Guangdong Province.

Figure 7.
(a) Potential pseudo-equivalent temperature (shaded and black contours, unit: °C) and (b) vertical wind shear (shaded and arrows, unit: m∙s−1) at 1000–700 hPa in Guangdong from April to June.
Figure 7.
(a) Potential pseudo-equivalent temperature (shaded and black contours, unit: °C) and (b) vertical wind shear (shaded and arrows, unit: m∙s−1) at 1000–700 hPa in Guangdong from April to June.


Table 1.
Statistics for the number and lifetime of the MVs identified by four radars in Guangdong from April to June during 2017–2019. Percentages of the total MVs with different lifetimes are shown in parentheses.
Table 1.
Statistics for the number and lifetime of the MVs identified by four radars in Guangdong from April to June during 2017–2019. Percentages of the total MVs with different lifetimes are shown in parentheses.
| Guangzhou (9200) | Shaoguan (9751) | Yangjiang (9662) | Shantou (9754) | Total | |
|---|---|---|---|---|---|
| Number of MVs | 3267 | 794 | 2182 | 1722 | 7965 |
| 18–30 min | 2153 (66%) | 551 (69%) | 1466 (67%) | 1172 (68%) | 5342 (67%) |
| 30–60 min | 992 (30%) | 223 (28%) | 626 (29%) | 479 (28%) | 2320 (29%) |
| >60 min | 122 (4%) | 20 (3%) | 90 (4%) | 71 (4%) | 303 (4%) |
Table 2.
Average diameter, azimuthal shear intensity and lifetime of the MVs in Guangdong from April to June during 2017–2019.
Table 2.
Average diameter, azimuthal shear intensity and lifetime of the MVs in Guangdong from April to June during 2017–2019.
| Diameter (km) | Azimuthal Shear (10−3·s−1) | Lifetime (Minutes) | |
|---|---|---|---|
| All MVs | 7.49 | 2.15 | 26 |
| Short-lived MVs | 6.96 | 2.03 | 20 |
| Medium-lived MVs | 8.35 | 2.33 | 36 |
| Long-lived MVs | 10.30 | 2.88 | 75 |
Table 3.
Average diameter, azimuthal shear intensity and lifetime of the MVs in different regions of Guangdong from April to June during 2017–2019.
Table 3.
Average diameter, azimuthal shear intensity and lifetime of the MVs in different regions of Guangdong from April to June during 2017–2019.
| Diameter (km) | Azimuthal Shear (10−3·s−1) | Lifetime (Minutes) | |
|---|---|---|---|
| Pearl River Delta | 7.64 | 2.16 | 27 |
| Western Guangdong | 7.54 | 2.23 | 26 |
| Northern Guangdong | 7.34 | 2.28 | 25 |
| Eastern Guangdong | 7.22 | 1.98 | 26 |
Disclaimer/Publisher’s Note: The statements, opinions and data contained in all publications are solely those of the individual author(s) and contributor(s) and not of MDPI and/or the editor(s). MDPI and/or the editor(s) disclaim responsibility for any injury to people or property resulting from any ideas, methods, instructions or products referred to in the content. |
© 2023 by the authors. Licensee MDPI, Basel, Switzerland. This article is an open access article distributed under the terms and conditions of the Creative Commons Attribution (CC BY) license (https://creativecommons.org/licenses/by/4.0/).
Share and Cite
MDPI and ACS Style
Tang, Y.; Xu, X.; Ju, Y.; Wu, Z.; Zhang, S.; Chen, X.; Xu, Q. Statistical Analysis of Mesovortices during the First Rainy Season in Guangdong, South China. Remote Sens. 2023, 15, 2176. https://doi.org/10.3390/rs15082176
AMA Style
Tang Y, Xu X, Ju Y, Wu Z, Zhang S, Chen X, Xu Q. Statistical Analysis of Mesovortices during the First Rainy Season in Guangdong, South China. Remote Sensing. 2023; 15(8):2176. https://doi.org/10.3390/rs15082176
Chicago/Turabian StyleTang, Ying, Xin Xu, Yuanyuan Ju, Zhenyu Wu, Shushi Zhang, Xunlai Chen, and Qi Xu. 2023. "Statistical Analysis of Mesovortices during the First Rainy Season in Guangdong, South China" Remote Sensing 15, no. 8: 2176. https://doi.org/10.3390/rs15082176
Note that from the first issue of 2016, this journal uses article numbers instead of page numbers. See further details here.