Article

Higher Sensitivity of NIRv,Rad in Detecting Net Primary Productivity of C4 Than that of C3: Evidence from Ground Measurements of Wheat and Maize

1
College of Grassland Science and Technology, China Agricultural University, Beijing 100083, China
2
School of Geomatics and Urban Spatial Information, Beijing University of Civil Engineering and Architecture, Beijing 100044, China
*
Author to whom correspondence should be addressed.
These authors contributed equally to this work.
Remote Sens. 2023, 15(4), 1133; https://doi.org/10.3390/rs15041133
Submission received: 3 January 2023 / Revised: 4 February 2023 / Accepted: 14 February 2023 / Published: 19 February 2023

Abstract

:
Accurate quantification of net primary productivity (NPP) is key to estimating vegetation productivity and studying the global carbon cycle. However, C3 and C4 plants vary in their living environments and potential productivity due to their different photosynthetic pathways. This study thus explored the potential of the near-infrared radiance of vegetation (NIRv,Rad) to track hourly and daily changes in C3 and C4 plants and investigate whether their photosynthetic pathways affect the relationship between NPP and NIRv,Rad. Statistics including long-term spectral data, the growth environment, and physiological indicators were collected using an automatic spectral monitoring system. The vegetation index NIRv,Rad was extracted from the collected spectral data and NPP was calculated using the collected net photosynthetic rate and leaf area index. The results showed that NIRv,Rad can effectively respond to NPP changes in C3 and C4 plants on hourly and daily scales. The NPP–NIRv,Rad relationship on the hourly scale was superior, with R2 values for winter wheat and summer maize of 0.81 and 0.70, respectively. Furthermore, when the accumulation of NPP was equal, the NIRv,Rad of summer maize showed larger changes, indicating that it was more sensitive to NPP change for this species than for winter wheat. Overall, the study demonstrated that NIRv,Rad can serve as an effective proxy indicator of NPP. In addition, this study provides a theoretical basis and scientific guidance for the construction of new simple models and realizing efficient agriculture, as well as a new method for rapid and accurate quantification of the NPP of C3 and C4 plants at geospatial scales in future research.

1. Introduction

Net primary productivity (NPP) refers to the net content of organic matter synthesized by plants through the uptake of CO2 minus the consumption by plant autotrophic respiration per unit area and time. As an important part of the terrestrial carbon cycle, NPP can directly reflect the productivity of terrestrial vegetation [1,2,3]. The accurate quantification of NPP is thus central to studying the global carbon cycle and changes in ecosystem carbon [4]. However, factors such as topography, climate change, land-use types, and ecosystem heterogeneity add uncertainty to the estimation of terrestrial NPP [5].
Existing studies have not directly observed NPP, but have succeeded in its indirect measurement through media or mathematical models [6]. The inventory method obtains data on terrestrial carbon sinks by comparing the inventory of ecosystem carbon stocks (mainly in vegetation and soil) over different periods. The sampled data are then used to accurately measure vegetation NPP [7,8,9,10]. However, due to the long revisit period interval between sampling, low spatial resolution, and lack of certain ecosystem data, expanding the inventory method to regional scales has great uncertainty. Alternatively, eddy covariance extends NPP measurement to the regional ecosystem scale by directly measuring the net CO2 exchange between terrestrial ecosystems and the atmosphere [11,12,13,14]. This method is widely used to study the response of the terrestrial carbon cycle to climate change, but does not apply to NPP estimation in agro-ecosystems due to its inability to distinguish the carbon budgets of above- and below-ground biomass [5]. Process-based ecosystem models estimate regional and global carbon fluxes by simulating the processes and mechanisms of carbon cycling in terrestrial ecosystems. These models can quantitatively study the contribution of various factors to NPP changes and predict changes under different conditions [15,16]. However, uncertainties remain regarding model settings, structures, and factors. Due to the time lag of the data obtained by the above measurements, changes in NPP are difficult to track in an accurate and timely manner [6]. In addition, conventional site-based NPP measurement is restricted by the number of sites and therefore cannot effectively quantify global NPP, while remote sensing data models can meet the requirements of long-term and large-scale estimation [17,18]. Many studies have used different remote sensing data and procedures to calculate global NPP and estimate changes in vegetation NPP over long periods by establishing empirical relationships between observed vegetation carbon stocks and remote sensing vegetation indices (VIs) [19,20]. However, substantial uncertainties over NPP on short-time scales have hindered an accurate understanding of the global carbon cycle changes [21]. To solve this issue, a mass vegetation productivity model (Formula (1)) has been developed based on the concept of light use efficiency (LUE). The LUE method considers that the absorbed photosynthetically active radiation (APAR) by vegetation is the primary control factor for NPP estimation [22].
NPP = APAR × LUE
In recent years, the near-infrared (NIR) reflection of vegetation (NIRv,Ref), a type of vegetation index, has also provided a new means to study ecosystem carbon stock changes. NIR reflection has been reported to better represent fPAR than the normalized difference vegetation index (NDVI), but it is difficult to separate the NIR reflected by non-vegetation elements from mixed pixels [23]. To address this issue, Badgley, et al. [24] proposed to use NDVI as a proxy indicator of vegetation coverage, rather than of fPAR. NIRv,Ref can thus be obtained by multiplying NDVI by the NIR reflection, and defining canopy photosynthetic utilization rate as a function of NIRv,Ref from a physical point of view and stating that canopy photosynthesis is proportional to the flux density of NIR radiance from vegetation:
A c = Q a , P f esc = f a , P Q P ρ NIR v f a , P = Q P ρ NIR V NIR v , Ref
where A c represents canopy photosynthesis, Q a , P signifies visible light, f esc is the fraction of photons escaping from canopies, f a , P represents the portion of APAR, Q P signifies the flux density of PAR, and   ρ NIR V   is the reflectance of vegetation NIR radiation. This index is strongly correlated with solar-induced fluorescence (SIF) and gross primary productivity (GPP) on specific temporal scales [25,26]. The near-infrared radiance of vegetation (NIRv,Rad) replaces NIR reflection with NIR radiance, which fluctuates more within short time scales. NIRv,Rad is defined as the product of NIR radiance and NDVI and is considered to better estimate GPP [27,28]. The relationship between NIRv,Rad, and NIRv,Ref can be further expressed as [24,27,29]:
NIR v , Rad = 1 / π × NIR Irra   × NDVI × NIR v , Ref
where NIR Irra   represents the incident radiation in the NIR band. Formula (3) shows that NIRv,Rad, and NIRv,Ref are mathematically proportional, so canopy photosynthesis and NIRv,Rad can also be considered proportional. This provides a theoretical explanation of the ability of NIRv,Rad to effectively monitor changes in NPP.
Unlike the conventional “green” vegetation index NDVI and the enhanced vegetation index (EVI), NIRv,Rad can detect intraday changes in vegetation photosynthetic capacity and somewhat eliminate the influence of soil background. Liu, et al. [29] reported that NIRv,Rad accurately estimated the GPP of soybean and maize on daily and half-hour scales. Zhao, et al. [27] found that models based on NIRv,Rad had been shown to accurately estimate NPP. However, NIR radiance is affected by vegetation canopy structure and photosynthesis, particularly as the SCOPE model has shown that the leaf area index (LAI), leaf inclination angle, and solar zenith angle can lead to changes in the canopy absorbed radiation [30]. Many studies have explored the mechanisms affecting the photosynthetic capacity of plant canopies [25,31].
The production of plant NPP is intricately linked to canopy photosynthesis, which directly affects the productivity of crops and other plant-based food sources. Accurate monitoring of NPP can therefore provide insight into the health and productivity of agricultural systems, which in turn can influence food security. As the world population and economies continue to grow, global food demand is increasing rapidly. Although global crop production has increased by 53% in the last 20 years, the global food security situation is not optimistic. In the future, crop production will face challenges such as a reduction in arable land and a changing climate [32], which will require more accurate methods to achieve more efficient agriculture. The common plants in agricultural production are divided into C3 and C4 according to different carbon treatment methods. These two plants with different photosynthetic pathways have great differences in their environmental requirements and global change feedback and are generally regarded as two important plant function types in the climate-carbon model [33]. Plant physiologists generally believe that the C4 pathway evolved from the C3 pathway to adapt to high temperatures and droughts as it allows higher resource utilization rates and productivity [34,35,36,37]. For example, some studies have reported that the quantum yield of some C4 plants is 1.5 times higher than that of C3 plants [36,38]. Furthermore, although C4 plants account for only a small part of flowering plant species (about 3%), they account for about 25% of terrestrial NPP and 30% of global agricultural food production. Therefore, it is of great significance to study the NPP of C3 and C4 plants separately to ensure food security and achieve efficient agriculture [39]. Wu et al. [40] found the general relationship between NIRv,Rad -GPP on a global scale, in which C3 and C4 plants have obvious slope differences. Previous studies on NIRv,Ref-GPP, and SIF-GPP also reflected the differences between C3 and C4 plants [24,33]. We thus hypothesized that NIRv,Rad can accurately capture the differences between the photosynthetic pathways of C3 and C4 plants and their subsequent relationships to NPP.
Wheat (C3) and maize (C4) are the two most important food crops in the world, with a long planting history and extensive planting area. Wheat is one of the earliest cultivated plants in the world, which is distributed in all continents and occupies an absolutely dominant position in the world [41]. Maize is an important food, feed, and industrial raw material crop, which can provide 25–50% of energy for the population in 14 countries around the world [42]. In this study, winter wheat and summer maize were selected as research organisms. Their NPP and vegetation indices were calculated based on actual collected data. The main research objectives were (1) to assess the potential of NIRv,Rad, NIRv,Ref, NDVI, and EVI2 to track NPP changes in C3 and C4 plants on hourly and daily scales; (2) to explore the mechanism underlying the NIRv,Rad–NPP relationship by analyzing the relationship between LUE, PAR*LAI, and NIRv,Rad; and (3) to explore how the difference between C3 and C4 photosynthetic pathways influences the NIRv,Rad–NPP relationship. This study provides a reference for the rapid and accurate detection of NPP in vegetation ecosystems, and for the establishment of NIRv,Rad-based models for different photosynthetic pathways.

2. Materials and Methods

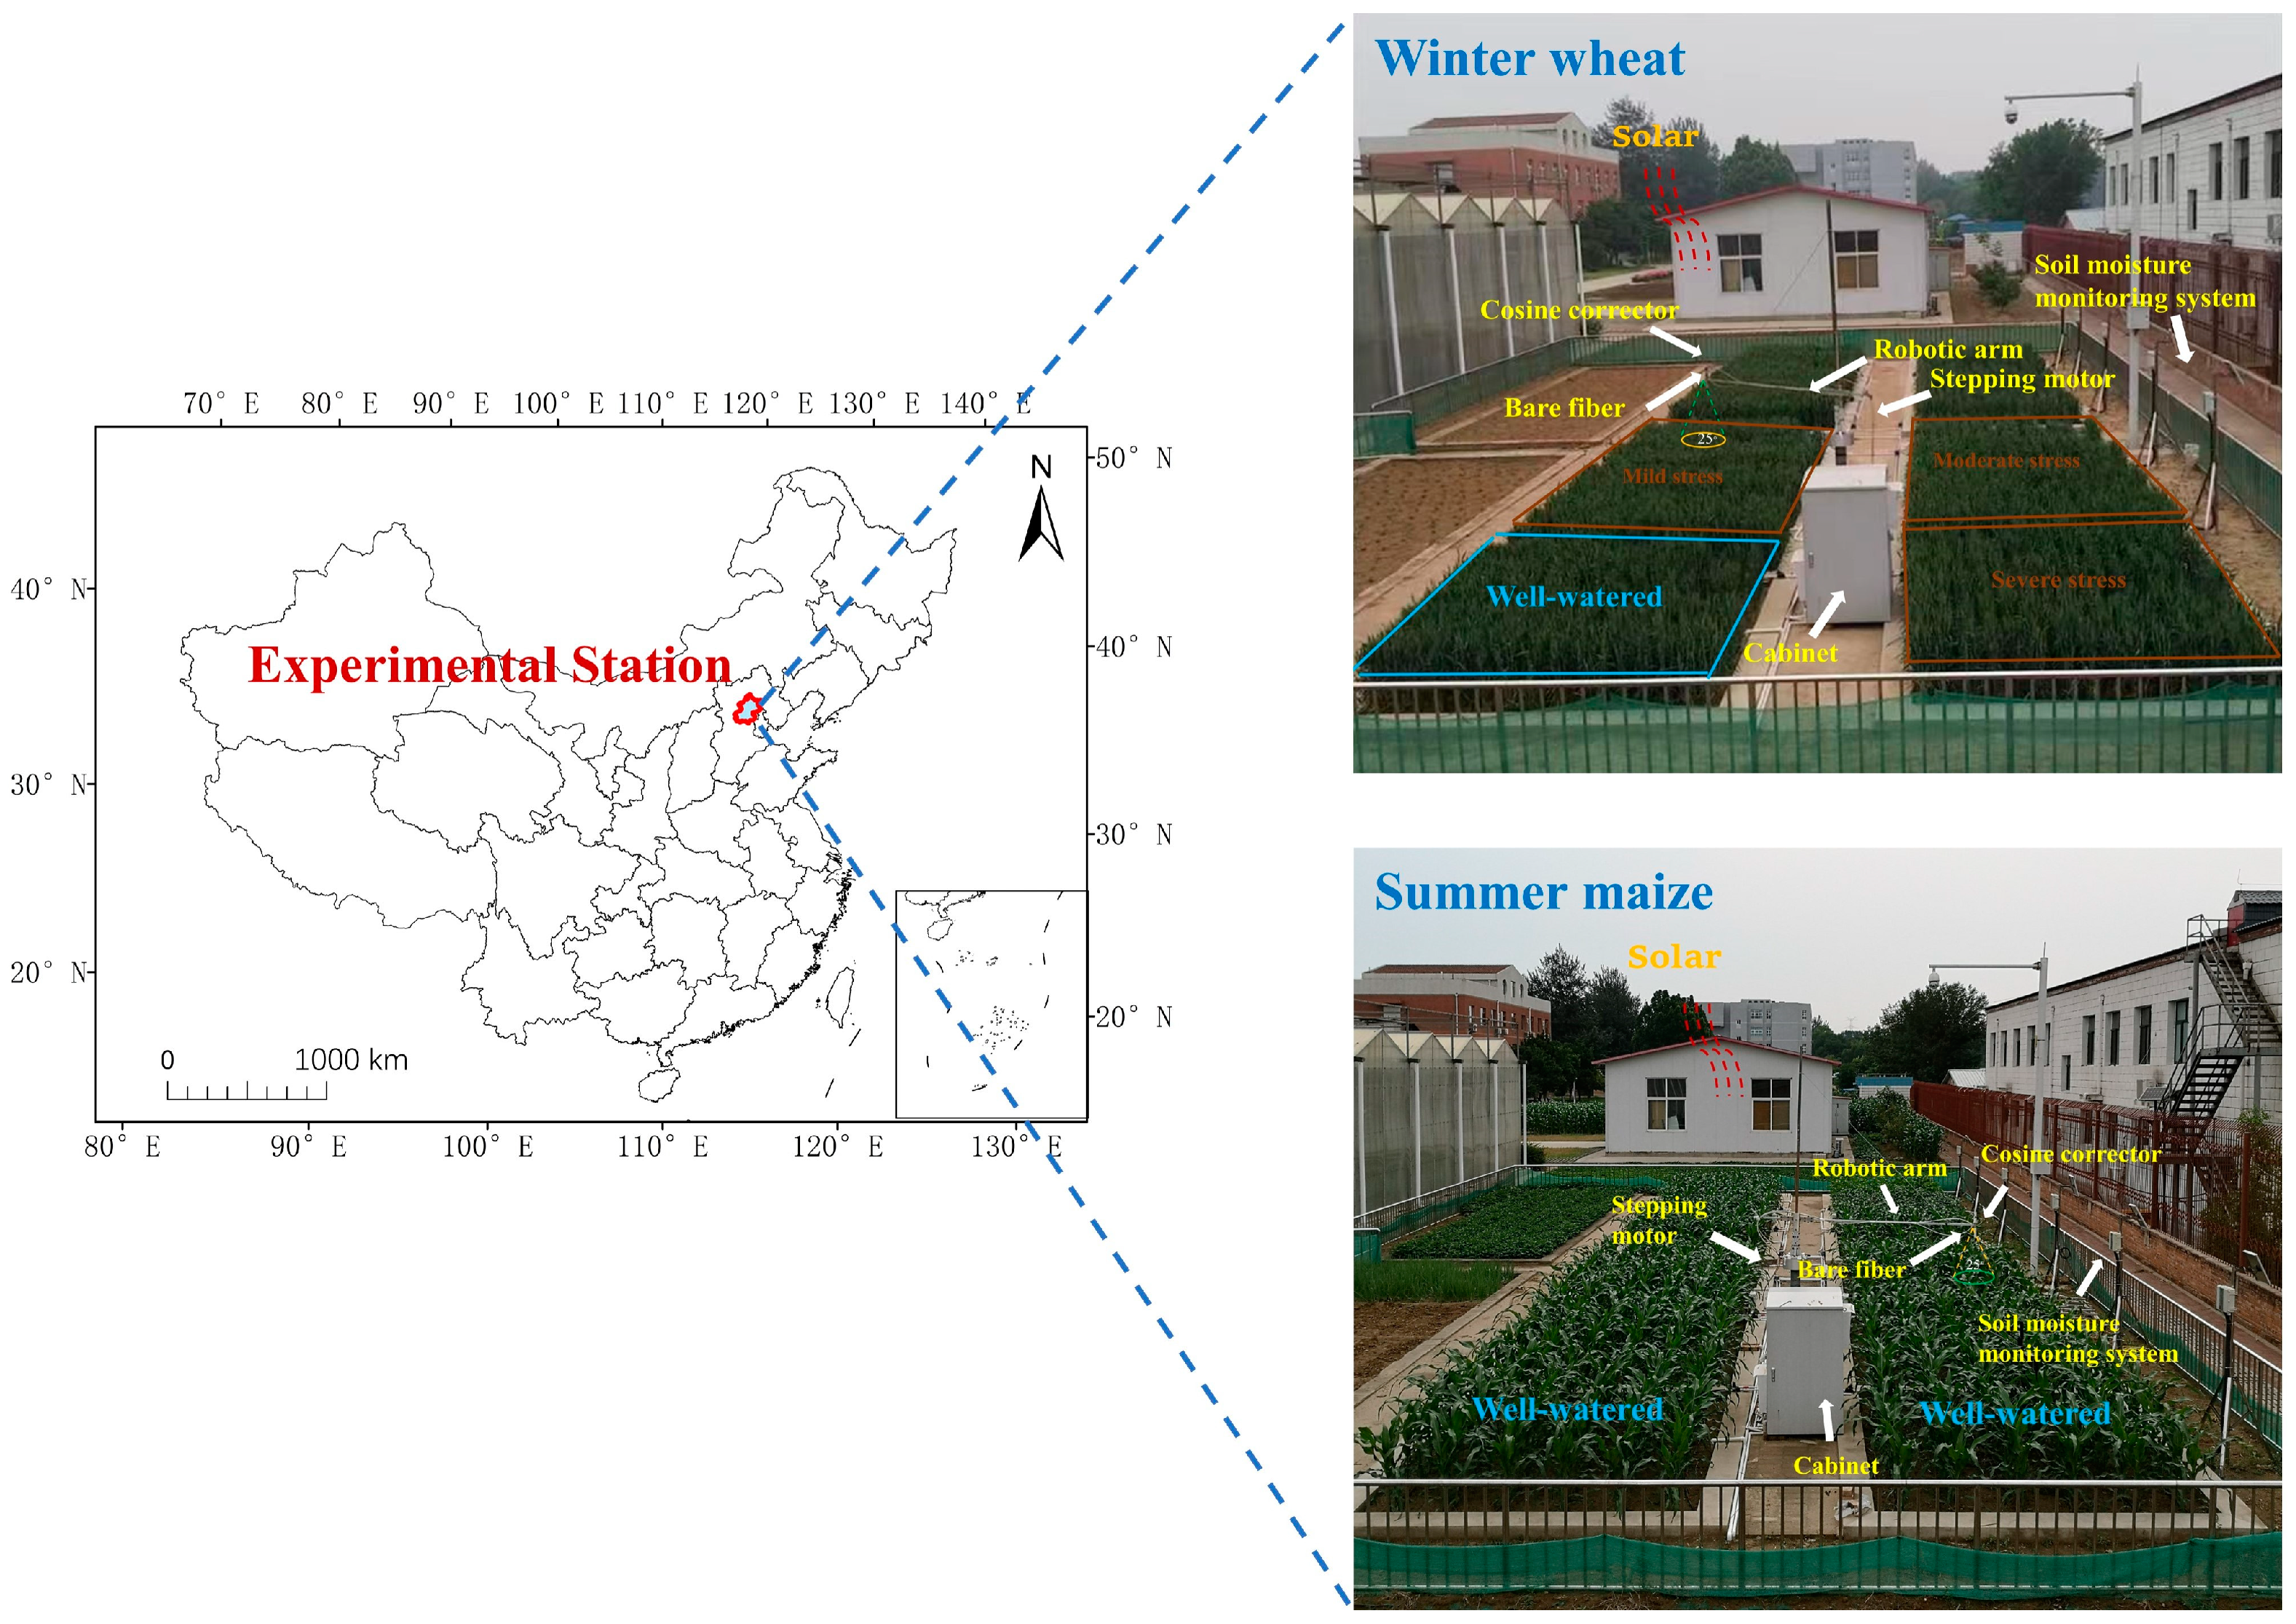
2.1. Experimental Site

The experiment was conducted at the Fangshan District Experimental Station (39°35′N, 115°42.5’E) in Beijing (Figure 1). The area is flat and warm with a semi-humid and semi-arid continental monsoon climate. According to the international soil classification (Gerasimova, 2010), the soil of the experimental field was silty loam, consisting of 14.5% clay, 44.7% sand, and 40.8% loam.
C3 winter wheat (Jinnong 7) and C4 summer maize (Zhengdan 958) were selected as research organisms. The winter wheat was sown in October 2018 and harvested in June 2019 in four 3 m × 4 m plots set with the following moisture stress levels: 60–80% (W1, adequate moisture), 50–60% (W2, mild drought), 40–50% (W3, moderate drought), and 30–40% (W4, severe drought) of the field’s maximum water holding capacity [29]. It was planted with a row spacing of 20 cm and a sowing density of 350 grains/m2. The summer maize was planted in June 2019 and harvested in September 2019 in four 3 m × 4 m plots with a row spacing of 40 cm and a plant spacing of 30 cm. In this study, to distinguish the differences between C3 plants and C4 plants, and to minimize the impact of other variables, water stress was originally set when planting summer maize, but due to adequate rainfall during the growth period, the soil moisture was maintained at 60–80% of the field water holding capacity. None of the four plots experienced moisture stress. The final analysis did not account for the effects of moisture stress and used the crop data measured at 60–80% of the field’s maximum water-holding capacity (adequate moisture).

2.2. Data Acquisition

2.2.1. Spectral Data Acquisition and Processing

A QE Pro spectrometer (Ocean Insight, Largo, FL, USA) with a spectral range of 640–800 nm and a sampling interval of 0.18 nm was used to monitor the canopy spectra of the winter wheat and summer maize. A cosine corrector was used for radiometric correction during vegetation spectral data collection. The spectrometer automatically-collected data every day from 07:00 to 18:00 [27].
The raw spectral data obtained through radiometric correction were processed to obtain a radiance correction factor. A Savitzky–Golay filter was used to smooth the collected raw vegetation spectral data. The dark current was reduced to eliminate noise interference generated in the sensor. The radiance correction factor for radiometric correction was used to eliminate optical coupling. Finally, the reflectance and radiance data of the vegetation in the infrared and NIR bands were extracted. All spectral data were processed using IDL 8.5.
The processed spectral data were used to calculate the NDVI, which represent the greenness of vegetation, and the enhanced vegetation index EVI2, as well as the NIRv,Rad, and NIR reflectance of vegetation (NIRv,Ref), which represent the solar radiation.
The “greenness” vegetation indices NDVI and EVI2 are calculated as follows:
EVI 2 = 2.5 × R 750 R 705 / 1 + R 800 + 2.4 * R 660
NDVI = R 750 R 685 / R 750 + R 685
where   R 750 , R 705 , R 800 , R 660 , and R 685 represent the reflectance at 750, 705, 800, 660, and 685 nm, respectively [43].
The formulas for NIRv,Ref, and NIRv,Rad are as below:
NIR V , Ref = Ref NIR × NDVI  
NIR V , Rad = Rad NIR × NDVI
In the above formula, Ref NIR denotes the reflectance at 770–780 nm, and Rad NIR denoted the radiance at 770–780 nm [33,44].

2.2.2. Photosynthetic Data Collection

The photosynthetic data of the winter wheat were measured by the Li-6800 system (LI-COR, Lincoln, NE, USA), while those of the summer maize were measured by the Li-6400 system (LI-COR, Lincoln, NE, USA). The data were collected at the experimental site on sunny days with a portable photosynthetic measurement instrument. During the measurement, to achieve natural conditions, no leaf chambers were set. Net photosynthetic rate (Pn), photosynthetically active radiation (PAR), transpiration rate (E), stomatal conductance (Gs), intercellular CO2 concentration (Ci), and other basic photosynthetic indicators were directly collected by the instrument. Air circulation was achieved through the connection between the surge tank and the main engine air intake. The leaves of 10 healthy winter wheat plants and 10 healthy summer maize plants were randomly selected to measure photosynthetic data. Measurements were conducted once every hour from 07:00 to 18:00 on one day per week selected based on weather conditions. The LUE is calculated as follows:
LUE = Pn / PAR  
The LUE is defined as the PAR absorption efficiency of green leaves in the canopy. It only represents the capability to fix CO2 and does not include the absorption of non-green elements [38].
The value of APAR was obtained by multiplying the measured PAR by the fraction of PAR absorbed by plants (fPAR). The formula of fPAR is as follows [29]:
fPAR=1.33×RNDVI-0.15
RNDVI= (R750∼757.5-R703.75∼713.75 )/(R750∼757.5+R703.75∼713.75 )
where RNDVI is the red-edge NDVI. R 750 757.5 and R 703.75 713.75 represent the reflectance at 750–757.5 nm and at 703.75–713.75 nm, respectively. Therefore, APAR is calculated as follows [28]:
APAR = fPAR × PAR

2.2.3. Spectral Data Collection

The LAI-2200 (LI-COR, Lincoln, NE, USA) was used for LAI measurement. This optical sensor measures transmitted light at two angles, vertically upward and vertically downward, and calculates the LAI using the radiative transfer model of vegetation. The measurement was mainly conducted at sunrise or sunset or on cloudy days to avoid direct sunlight as much as possible. A view cover of 270 degrees or less was required. The LAI was measured between 18:00 and 18:30. For details, see the online manual of the LAI-2200 at https://www.licor.com/env/support/LAI-2200C/manuals.html (accessed on 2 January 2023).
The formula of NPP is as follows [6]:
NPP = LAI × Pn

2.2.4. Environmental Parameters

In order to scrutinize the effects of environmental parameters on the relationship between NIRv,Rad detection in C3 and C4 plants, we gathered data on atmospheric temperature (air temperature, Ta, °F) and solar radiation (SR,W m−2) using commercially available instruments. Specifically, Ta data (S-THB-M002, Onset Corporation, USA) and SR data (300–1100 nm, S-LIB-M003 detector, Onset Corporation, USA) were recorded at 5-min intervals by a weather station data collector (HOBO U30, Onset Corporation, USA) and converted to hourly averages.

2.3. Data Analysis

Photosynthetic data were collected on clear days. The data collected on the same date as the spectral data were selected for analysis. All data were sorted using Excel 2021. SPSS.20 was used to conduct Pearson correlation analysis on VIs, NPP, PAR, LAI*PAR, and LUE, and to test the differences between the VIs and physiological indicators of winter wheat and summer maize on hourly and daily scales. The partial correlations between photosynthetic indicators (Pn, Gs, Ci, E, SPAD, and LAI) were also analyzed to quantify the NIRv,Rad–NPP relationship.

3. Results

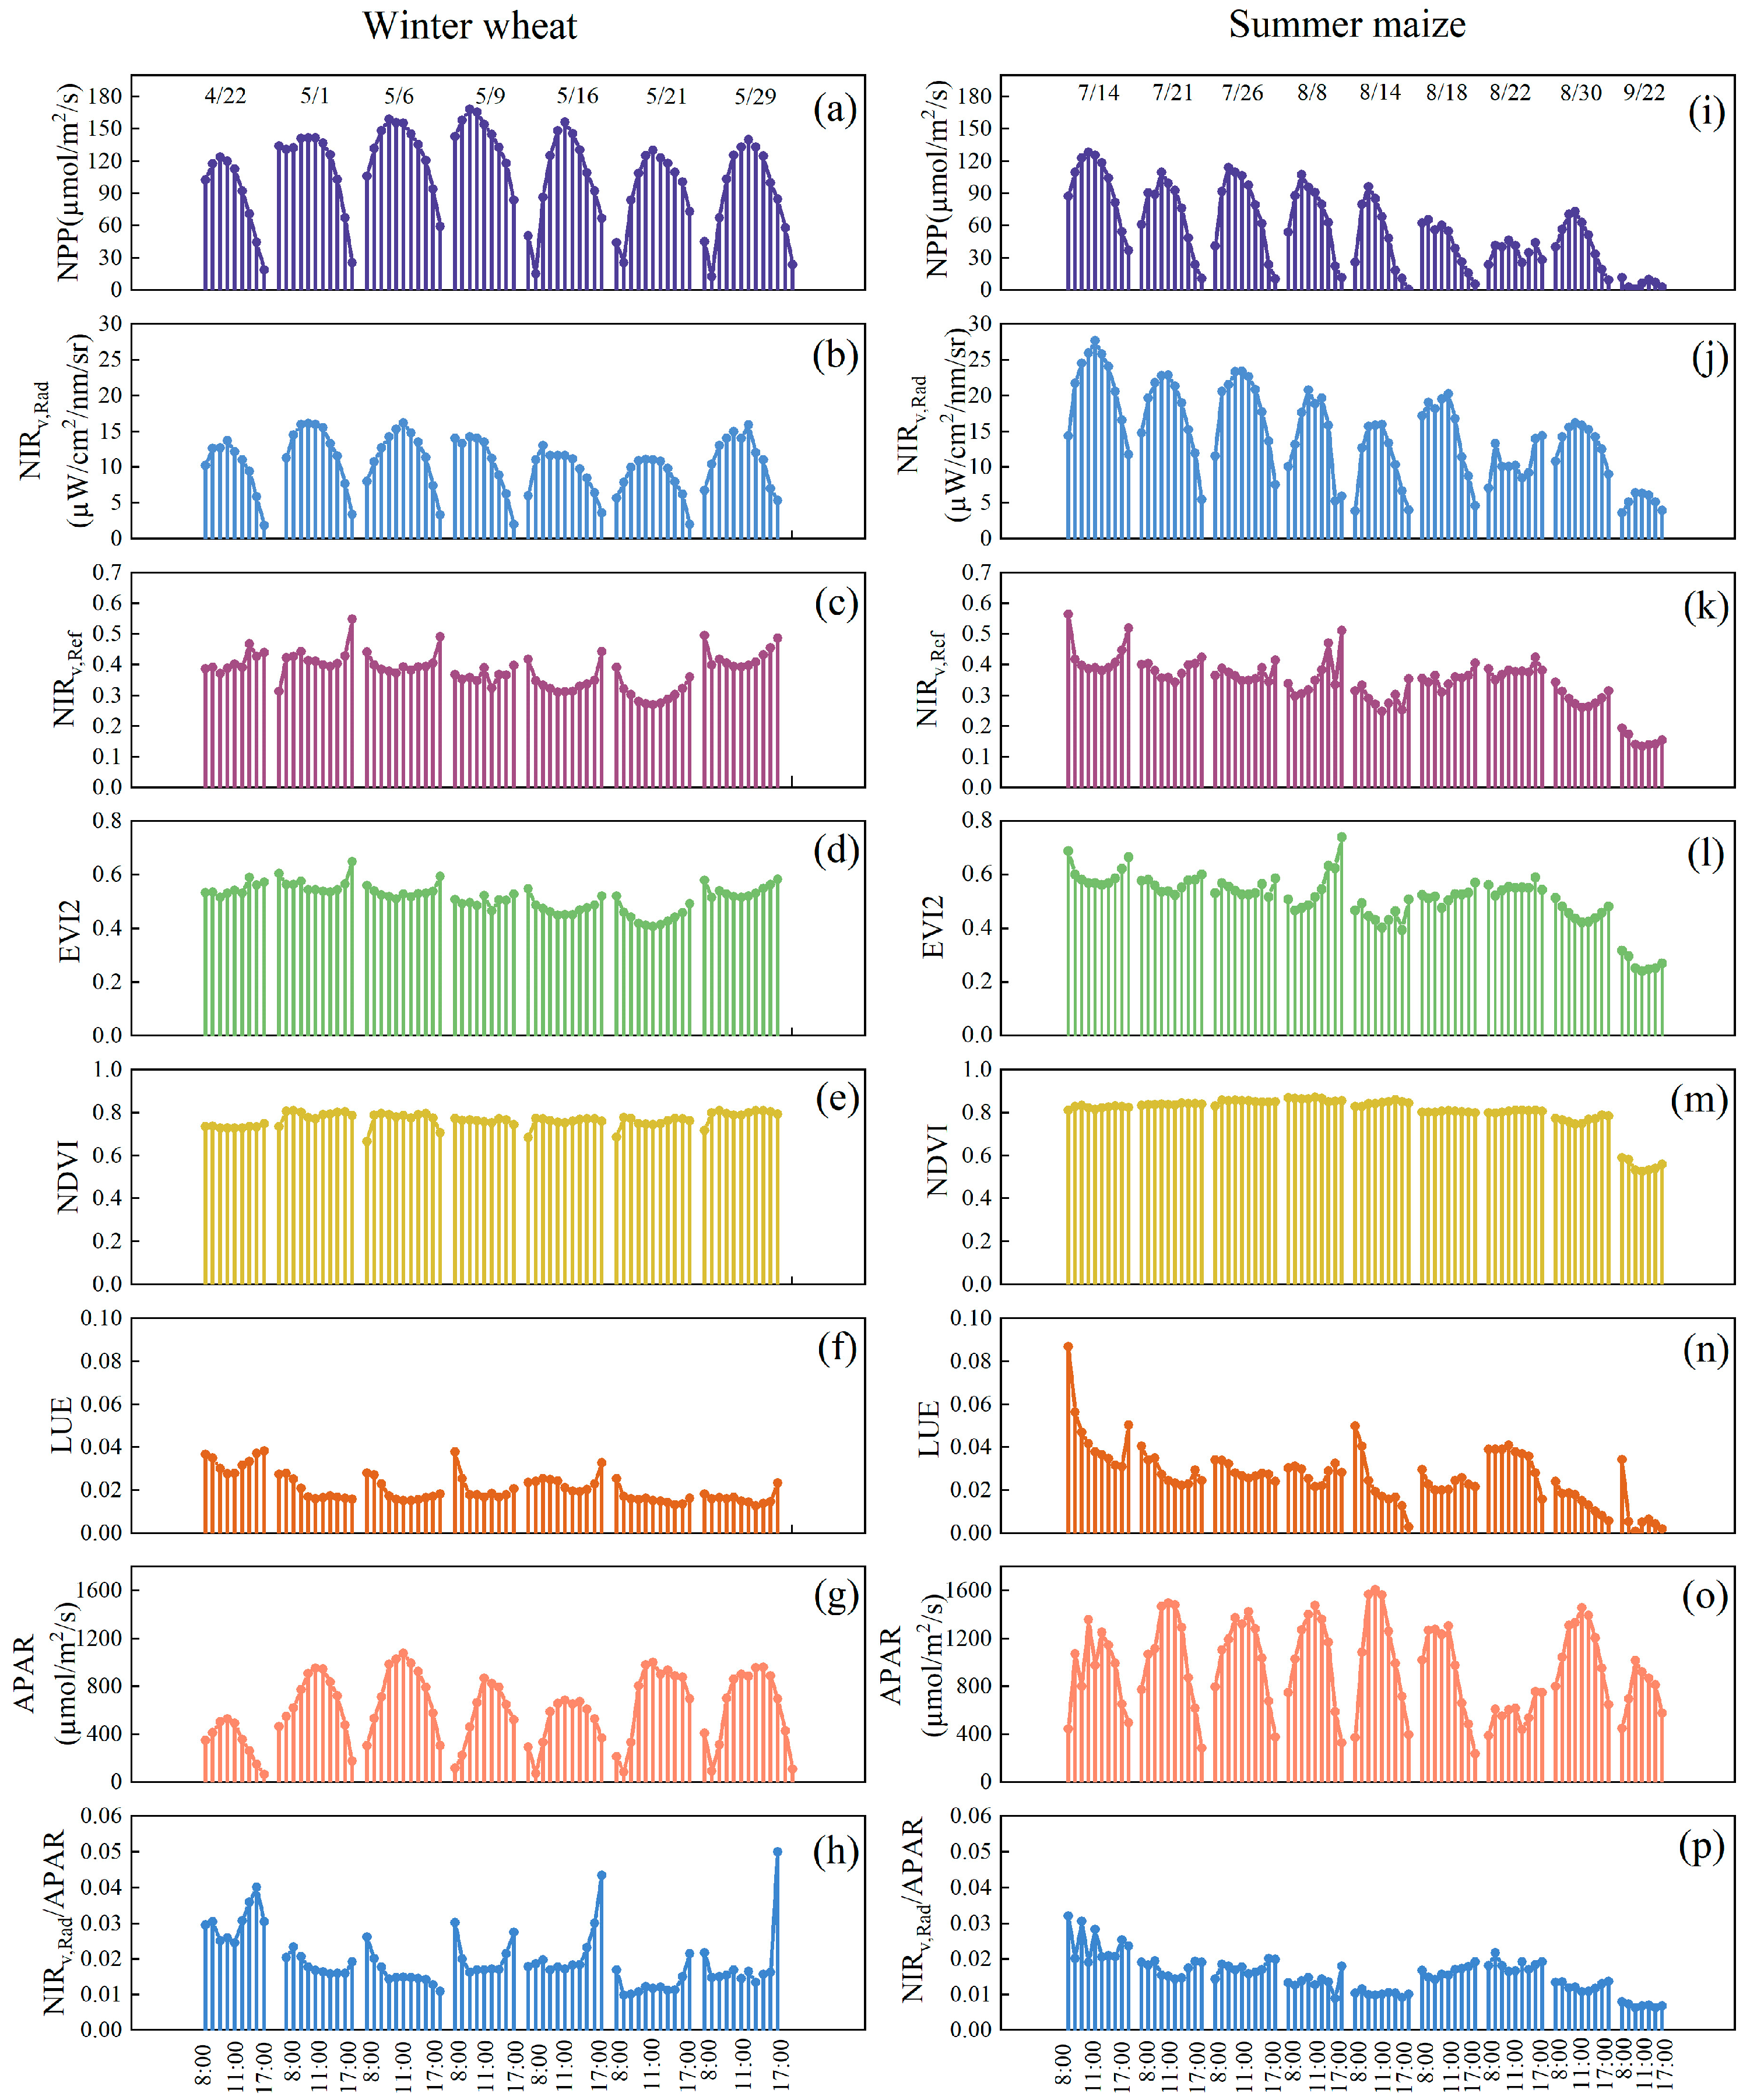
3.1. Seasonal and Diurnal Changes of VIs Compared with NPP

In our study, the hourly variation results show that NPP has similar trends to NIRv,Rad, as well as APAR, on the hourly scale (Figure 2). That is, NIRv,Rad tracked the daily changes in NPP and the capacity of plant canopies to absorb PAR. The NPP, NIRv,Rad, and APAR of winter wheat and summer maize showed a trend of first rising and then falling throughout the day, with the peak at around 11:00. For winter wheat, the NPP peaked at 168.49 µmol/m2/s at noon on 9 May (Figure 2a). For summer maize, the NPP peaked at 128.13 µmol/m2/s at noon on 14 July. The NPP, NIRv,Rad, and APAR fluctuated abnormally on 18 August, 22 August, and 22 September (Figure 2i). The value of APAR removed by NIRv,Rad formed a V-shaped pattern, which was opposite to the changing pattern of the relationship between NPP, NIRv,Rad, and APAR, but similar to that between NIRv,Rad, EVI2, and LUE (Figure 2). After the removal of APAR, the fluctuation range of summer maize NIRv,Rad was smaller than that of winter wheat (Figure 2h,p). The indicators reflecting plant photosynthesis (Pn and LUE) did not show obvious differences in the growth period on a daily scale. In addition, the NDVI of winter wheat and summer maize did not significantly increase during the plant growth period from 14 July to 30 August, but instead reached a plateau (Figure 2e,m).
NIRv,Rad tracked the differences in canopy radiation uptake by C3 and C4 plants on an hourly scale and showed a clear significant difference between winter wheat and summer maize (Figure 3). The diurnal fluctuation of the winter wheat NIRv,Rad during the growth period ranged from 1.89 µW/cm2/nm/sr to 16.15 µW/cm2/nm/sr, with an average of 10.61 µW/cm2/nm/sr, while the summer maize NIRv,Rad, fluctuated more widely from 0.67 µW/cm2/nm/sr to 27.64 µW/cm2/nm/sr, with an average of 20.87 µW/cm2/nm/sr, which was approximately double that of winter wheat. However, the NPP of winter wheat was significantly higher than that of summer maize (Figure 3) because the change in NPP is not only affected by solar radiation but also by vegetation growth and LUE. The LAI of winter wheat was significantly higher than that of summer maize (Figure 4): the average LAI of summer maize was 2.64, while that of winter wheat was 5.66. The canopy structure of summer maize resulted in a significantly higher PAR absorption capacity than that of winter wheat. On the hourly scale, the average APAR of summer maize reached 964.16 µmol/m2/s, while that of winter wheat was 604.228 µmol/m2/s. However, the Pn and LUE, which reflect photosynthesis rate, did not significantly differ between the two crops. In addition, NIRv,Ref and EVI2 showed significant differences between the two species on the hourly scale.

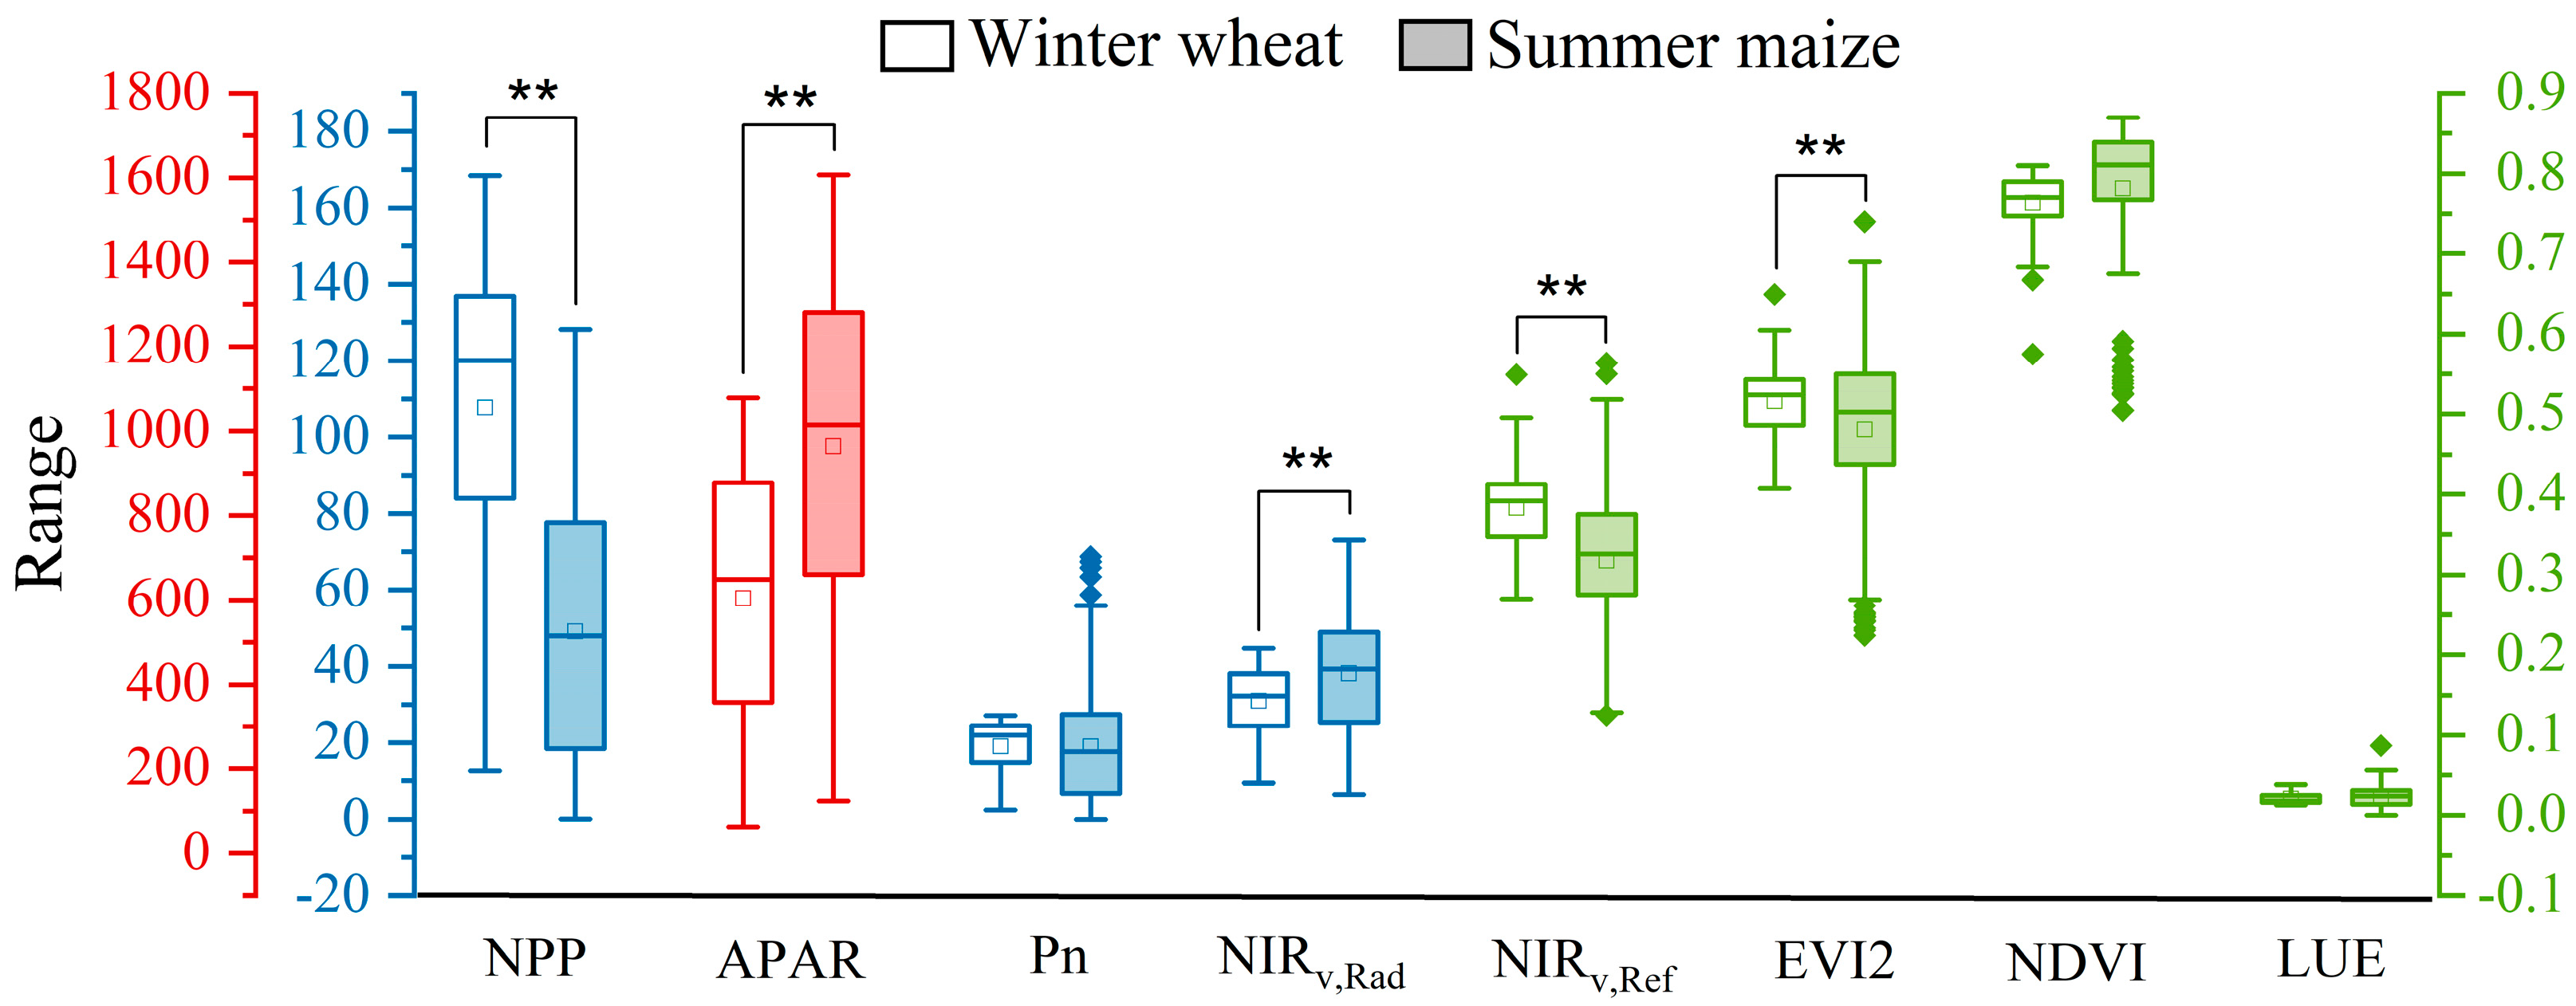
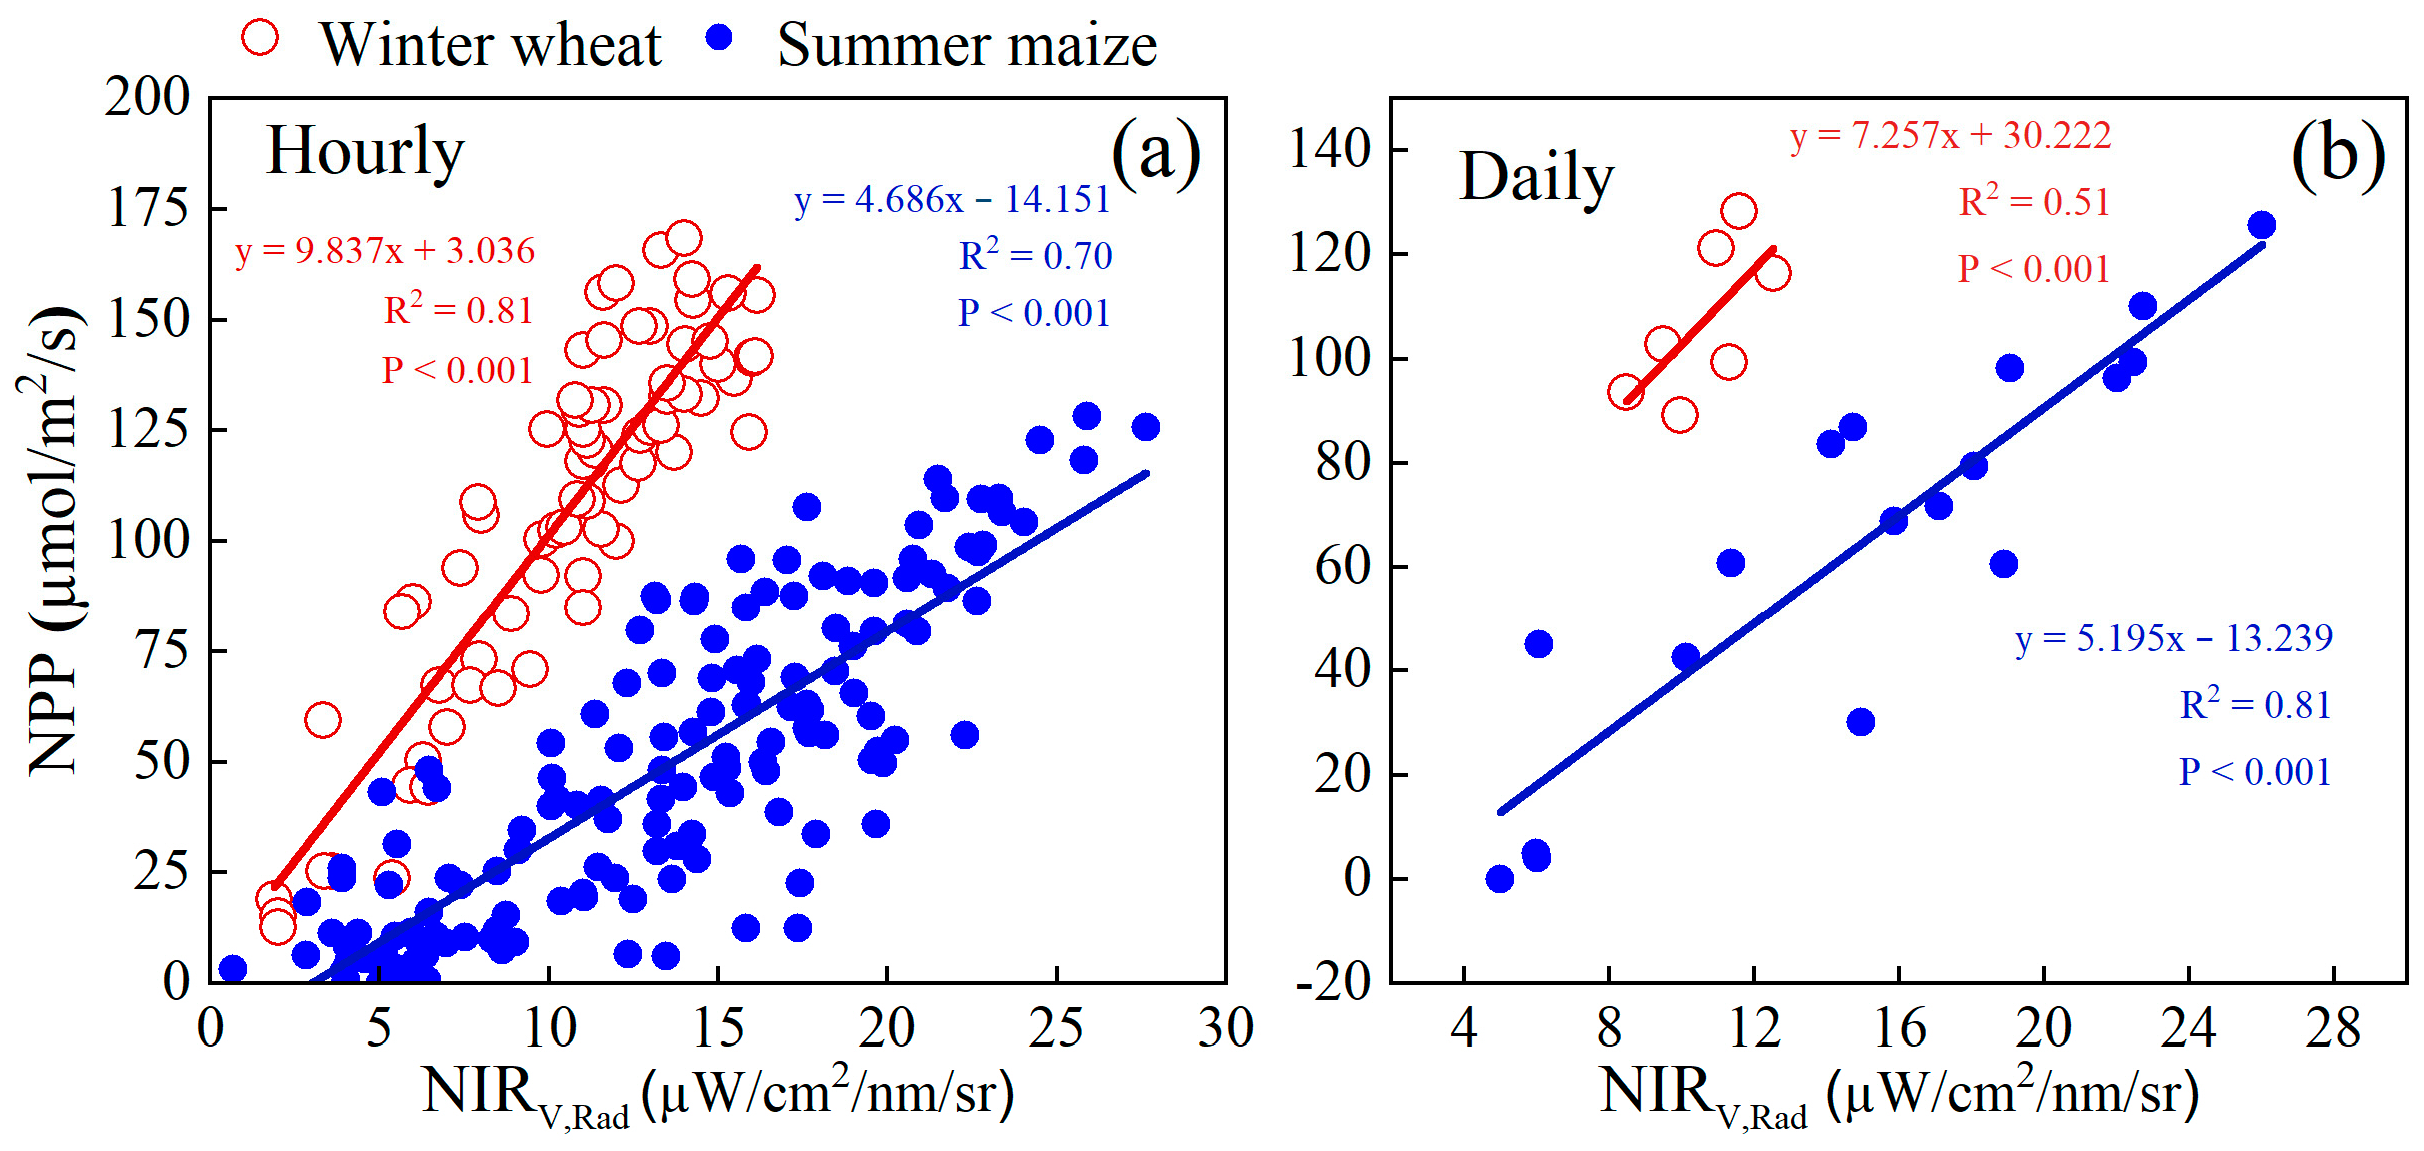
3.2. NIRv,Rad Differences between C3 and C4 in Relating to NPP

We found a strong linear correlation between NIRv,Rad and NPP on both hourly and daily scales. NIRv,Rad had a particularly strong correlation for both winter wheat and summer maize on the hourly scale and had a stronger relationship for summer maize on the daily scale (Figure 5). On the hourly scale, NIRv,Rad had a significantly stronger correlation with NPP than did NIRv,Ref, NDVI, and EVI2, with NIRv,Rad–NPP coefficients of determination (R2) 0.81 and 0.70 for winter wheat and summer maize, respectively. On the daily scale, the NIRv,Rad–NPP relationship of summer maize (R2 = 0.81) was significantly stronger than that of winter wheat (R2 = 0.51), indicating that NIRv,Rad may be more suitable for estimating the NPP of summer maize than that of winter wheat on the daily scale. In addition, NIRv,Ref, NDVI, and EVI2 of summer maize showed moderate correlations with NPP on the daily scale, while only the NDVI of winter wheat showed slightly strong correlations with NPP. Previous studies have also demonstrated a strong NIRv,Rad–NPP relationship for wheat in different plots on short time scales [27]. This suggests that reflection-based vegetation indices (NIRv,Ref, NDVI, and EVI2) are more suitable for estimating vegetation carbon uptake on long timescales, while NIRv,Rad may be more suitable for monitoring rapid changes in vegetation NPP.
There were clear differences between the slopes of the NIRv,Rad–NPP relationships of winter wheat and summer maize, which reflect the potential of NIRv,Rad to track NPP. The NIRv,Rad–NPP slope of winter wheat was higher than that of summer maize on both hourly and daily scales, indicating that the NPP of winter wheat is more susceptive to tiny variation in NIRv,Rad than that of summer maize. When NPP does not show large changes, NIRv,Rad might not be sensitive to winter wheat NPP and may be more effective in monitoring summer maize NPP. The daily observation data yielded similar results, wherein the slope of summer maize (5.195) was significantly lower than that of winter wheat (7.257). However, this difference in slopes on the daily scale (2.062) was smaller than that on the hourly scale (5.155), indicating that NIRv,Rad may be more susceptive to hourly NPP detection (Figure 6b).
Despite higher sensitivity on the hourly scale, the sensitivity may be correlated with the data distribution. On the hourly scale, when NPP < 50, the data points of NIRv,Rad and NPP for winter wheat and summer maize partially overlap. When NPP > 50 and NIRv,Rad > 8, the data are clearly separate. The diurnal NIRv,Rad of summer maize has a larger span and stronger dispersion, while the distribution of the winter wheat data is more concentrated. This shows that when NPP < 50, NIRv,Rad has different performance in detecting the NPP of winter wheat and summer maize, whereas when NPP > 50, NIRv,Rad is more sensitive to summer maize NPP detection (Figure 6). Due to the small amount of data, corresponding daily trends could not be found.
We further found that the slope differences between winter wheat and summer maize were influenced by respiration. When NIRv,Rad = 0, that is, when the light intensity is 0 (Rad = 0), respiration is presumed to be the only process that occurs. The respiration volume is represented by the intercept in Figure 6. On the hourly scale, the intercept of winter wheat is 3.036 µmol/m2/s (very small), while that of summer maize is −14.151 µmol/m2/s, indicating that the respiration intensity of summer maize is greater than that of winter wheat. This intense respiration of summer maize greatly reduces its NPP relative to that of winter wheat for every unit change in NIRv,Rad, resulting in a significantly lower slope (Figure 6). This difference had little effect on the determination accuracy of NIRv,Rad–NPP in C3 plants on the hourly scale during the day, but had a great influence on the daily scale as the R2 of winter wheat decreased from 0.81 to 0.51. In the early stage of growth (low NDVI) or weak light (small NIRv,Rad), the photosynthetic rate of plants is very low, and plants produce most of the energy required for their growth through respiration. NIRv,Rad was not sensitive to respiration by winter wheat. Baldocchi, et al. [25] reported that NIRv,Rad explained a greater proportion of the NPP changes in C4 maize than in C3 soybeans) on the half-hourly, daily, and monthly scales, and provided higher R2 values than this study.

3.3. Relationship between LUE, PAR*LAI, and NPP

To further explore how NIRv,Rad responds to NPP in different plants, we combined Formulas (1), (6) and (10) as follows to demonstrate the relationship of NPP with PAR, LAI, and LUE.
NPP = Pn × LAI = LUE × PAR × LAI  
The results show that NIRv,Rad captured the changes in PAR*LAI, and the correlation was strong in both winter wheat and summer maize. On the hourly scale, the PAR*LAI of summer maize and winter wheat showed strong correlations with NIRv,Rad (R2 values were 0.70 and 0.60, respectively), indicating that NIRv,Rad captured the hourly changes in PAR*LAI (Figure 7a). On the daily scale, the PAR*LAI–NIRv,Rad relationship was not ideal in winter wheat due to the lack of daily data, while the R2 of this relationship for summer maize was 0.51. NIRv,Rad and LUE were negatively correlated over short time scales. After eliminating the effect of APAR from NIRv,Rad, the NPP of both winter wheat and summer maize was strongly correlated with LUE on the daily scale and that of winter wheat also showed a strong correlation with LUE on the hourly scale (Figure 7e,f). However, the hourly-scale NIRv,Rad/APAR–LUE correlation was weak in summer maize, suggesting that some mechanism other than APAR affected the NIRv,Rad response to plant NPP changes. PAR*LAI was thus the main factor leading to different NIRv,Rad–NPP relationships in C3 and C4 plants, while LUE was not the main factor causing changes in NIRv,Rad.
The results show similar slopes in the relationships between PAR*LAI, LUE, and NIRv,Rad, although the slopes for winter wheat are higher than those for summer maize on hourly and daily scales. This indicated that a common factor affects PAR*LAI and LUE and results in the differences between the slopes of C3 and C4 plants, which may be due to the differences between their photosynthetic pathways. On both temporal scales, the slopes of the PAR*LAI–NIRv,Rad relationship in winter wheat are higher than those in summer maize (Figure 7a,b), such that a given change in PAR*LAI causes a larger change in the NIRv,Rad of summer maize than in that of winter wheat. This shows that NIRv,Rad can better capture changes in the absorbed radiation of summer maize canopies than those of winter wheat canopies, and subsequently reflect changes in NPP.

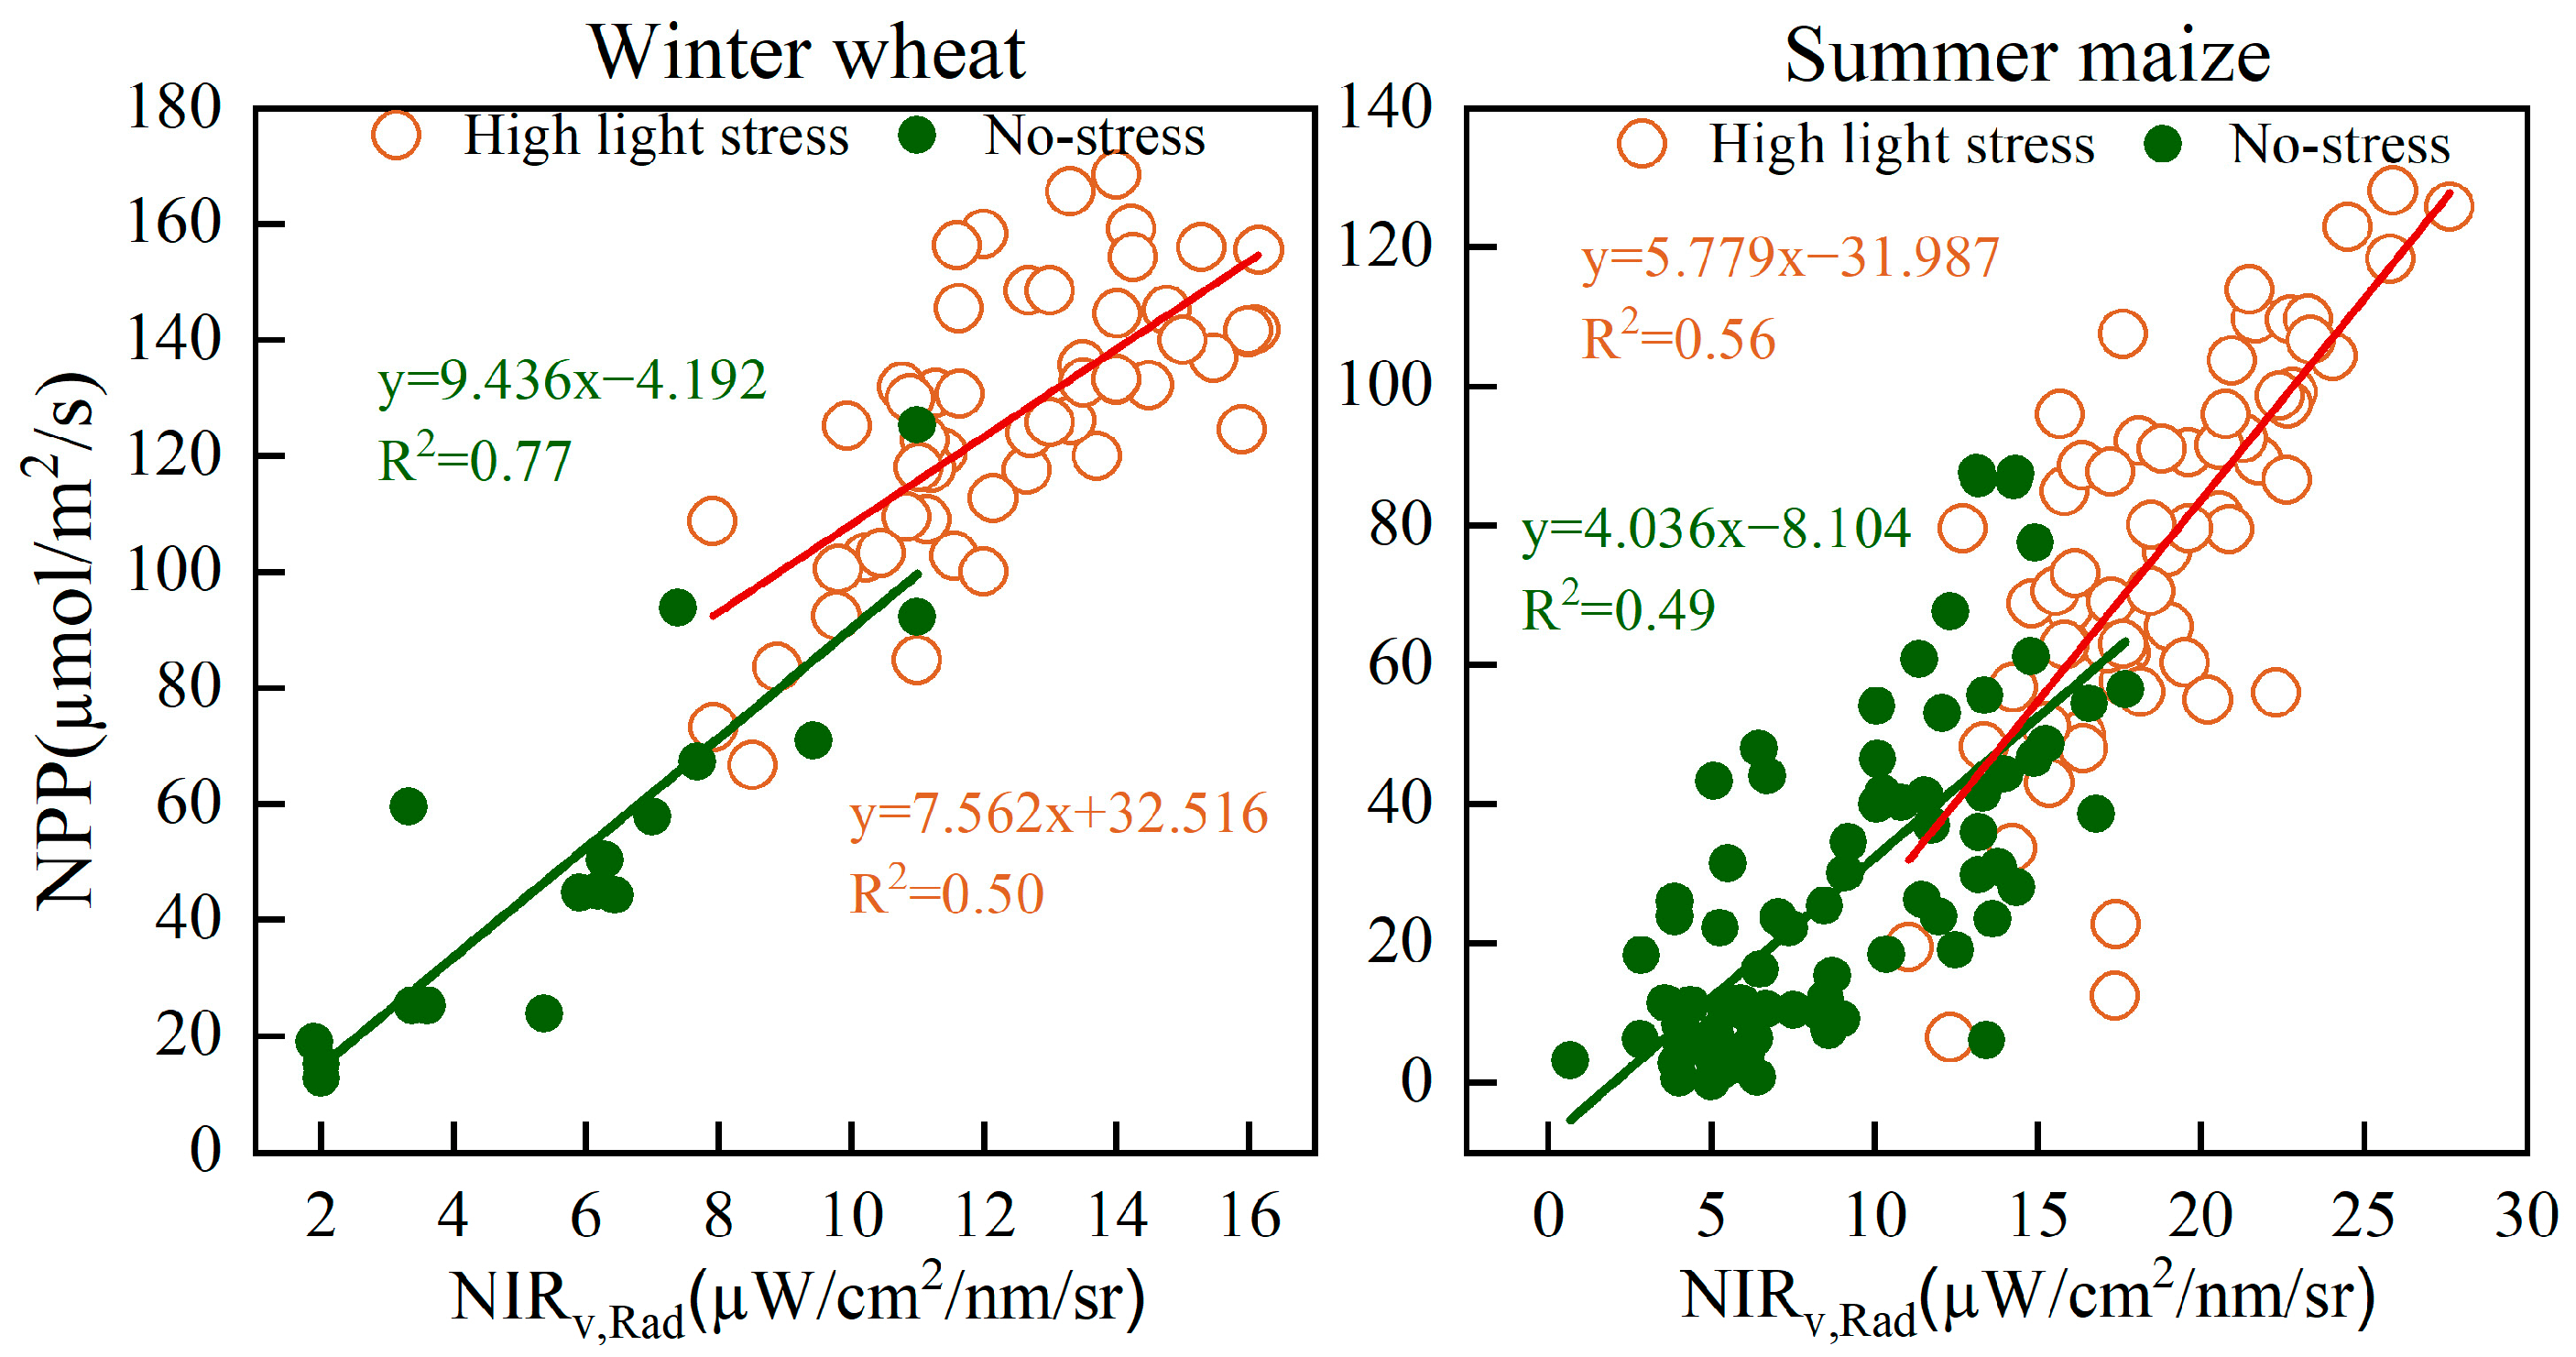
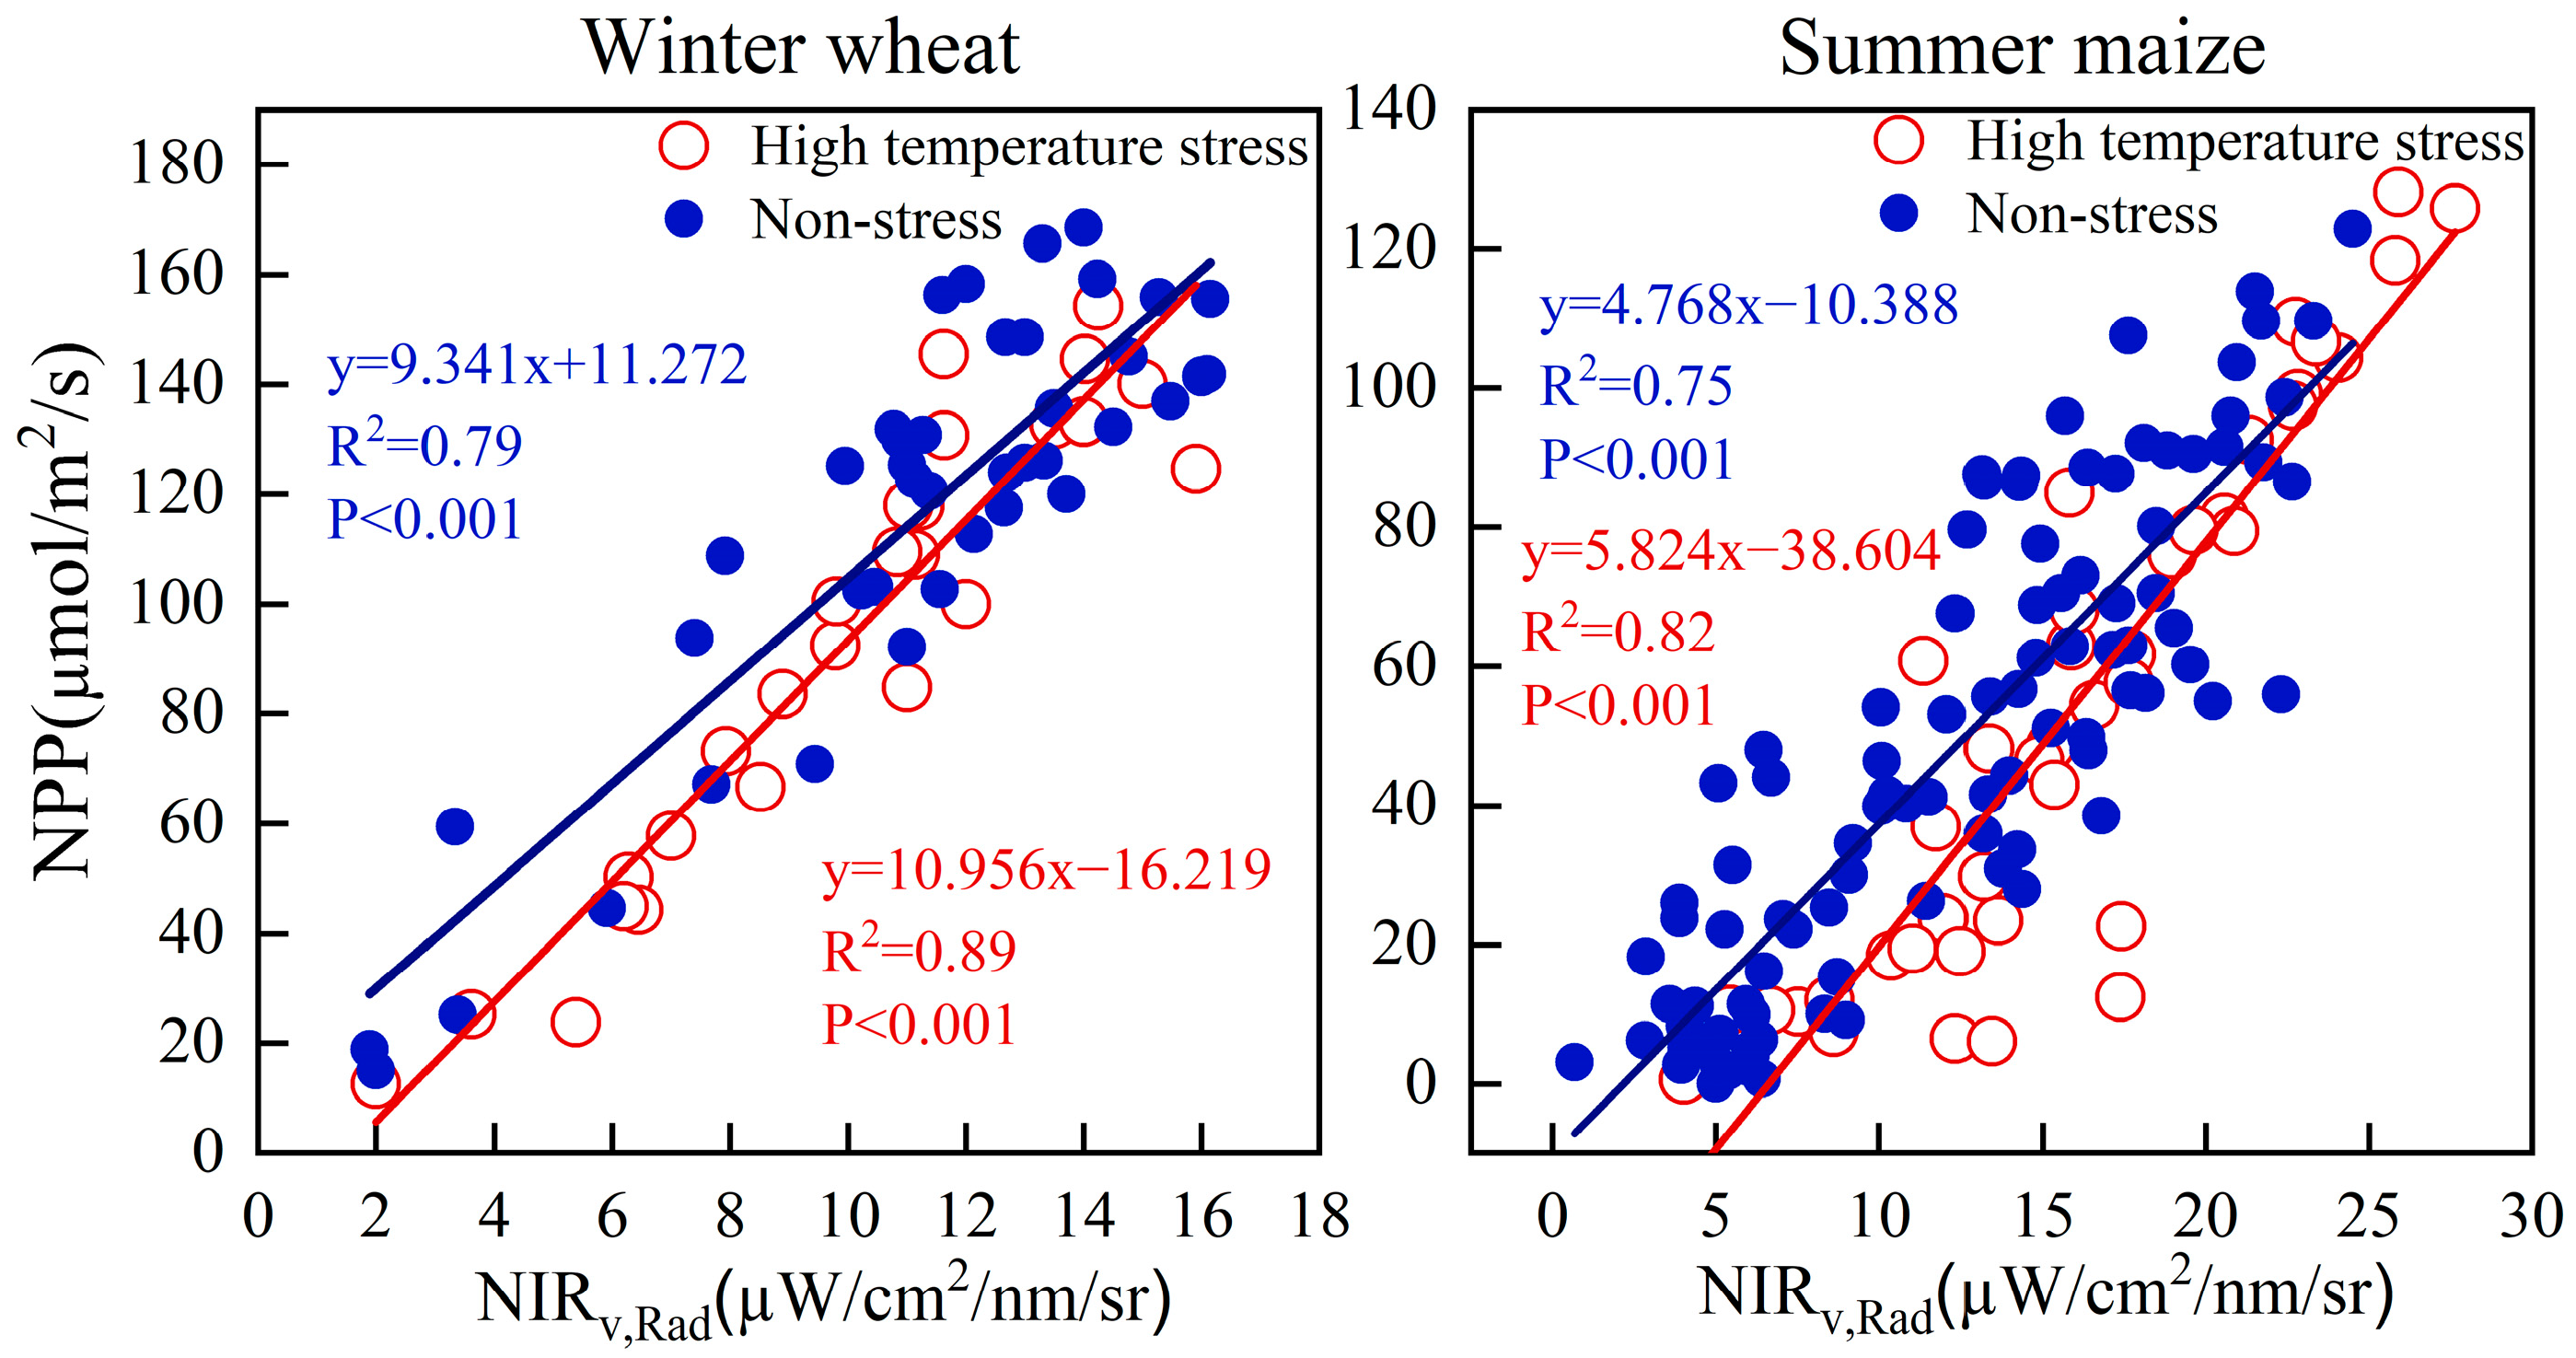
3.4. Effect of Light and Temperature on NIRv,Rad-NPP

In order to explore the impact of environmental factors on the variability of NIRv,Rad -NPP relationships in winter wheat and summer maize, we conducted further analysis of these relationships under both stress and non-stress conditions. It is worth noting that we only utilized adequately irrigated data in our study and as a result, there was no water stress during the analysis. However, we observed light and temperature stress during the growing period of winter wheat and summer maize. Therefore, we focused our investigation solely on the NIRv,Rad -NPP relationships under light and temperature stress in both C3 and C4 plants.
It was recorded that winter wheat was experiencing high-temperature stress when hourly temperatures exceeded 30 °C [45]. In the case of summer maize, high-temperature stress was observed when hourly temperatures surpassed 33 °C [46]. Additionally, we identified high light stress for winter wheat when light intensity exceeded 2000 µmol m−2 s−1 [47]. Similarly, for summer maize, high light stress was present when light intensity surpassed 2400 µmol m−2 s−1 [46] (1 µmol m−2 s−1 ≈ 0.219 W m−2) [48]. The data was analyzed separately for both stressed and non-stressed plants.
The impact of light stress on the NIRv,Rad-NPP relationship was found to be significant in winter wheat and summer maize, but it did not alter the result that NIRv,Rad detects greater sensitivity to NPP in summer maize. Specifically, light stress had a significant negative effect on the NIRv,Rad -NPP relationship in winter wheat, while no significant effect was observed in summer maize. In winter wheat, the R2 value decreased significantly under light stress, falling from 0.77 to 0.50. In contrast, the R2 value in summer maize slightly increased under light stress, rising from 0.49 to 0.56. Prior to the application of light stress, the slope of winter wheat was higher than that of summer maize (9.436 versus 4.036). This trend continued even after application of stress, with the slope of winter wheat (7.562) still being higher than that of summer maize (5.779). In addition, the intercept for winter wheat without light stress was negative (−4.192), whereas under light stress, the intercept became positive (32.516). This suggests that light stress influenced winter wheat respiration to a certain, causing NIRv,Rad to no longer be sensitive to changes in winter wheat respiration at that time. In contrast, the intercept for summer maize under high light stress changed from negative (−8.104) to even more negative (−32.987) under non-light stress, indicating that light stress actually increased respiration in summer maize (Figure 8).
High-temperature stress exerted significantly effect on the NIRv,Rad-NPP relationship in both winter wheat and summer maize, yet did not affect the greater sensitivity of NIRv,Rad to NPP in summer maize. The R2 value increased for both winter wheat (from 0.79 to 0.89) and summer maize (from 0.75 to 0.82). Moreover, the slope of the NIRv,Rad-NPP linear relationship was 9.314 for winter wheat, which was approximately twice the slope for summer maize (4.768) in the absence of high-temperature stress (Figure 9). This result persisted when subjected to high-temperature stress. When considering each plants separately, high-temperature stress did not affect the NIRv,Rad detection of NPP sensitivity. The intercept for winter wheat was 11.272 in the absence of heat stress, indicating very low respiration, and increased respiration in winter wheat with an intercept of −16.219 when exposed to heat stress. Similarly, heat stress increased respiration in summer maize with an intercept of −10.388, which changed from −10.388 to −38.604.

4. Discussion

4.1. NIRv,Rad as a Structural Proxy for NPP

Figure 5 shows the accuracy of NIRv,Rad in NPP estimation on hourly and daily scales, while Figure 2 shows that NIRv,Rad and APAR, and NIRv,Rad/APAR and LUE have similar fluctuation patterns. Figure 7 also shows a good correlation between NIRv,Rad and PAR*LAI, and between NIRv,Rad/APAR and LUE. These results illustrate that the response of NIRv,Rad to APAR contributes to the capability of NIRv,Rad to estimate NPP.
NIRv,Rad performs well because it is a radiation-based index. Therefore, it captures changes in the APAR of plant canopies, whereas reflective vegetation indices cannot respond to radiation changes so sensitively. Radiation absorption changes rapidly during the day, making it possible to track NPP changes on short time scales [25,27,28]. Reflectance itself can indicate long-term changes in global plant photosynthesis. In contrast, hourly and daily changes are strongly affected by the highly frequent PAR variation caused by changes in sun angle and sky conditions, which do not strongly influence bidirectional reflectance [49,50]. Therefore, the common reflection-based vegetation indices do not perform well on short time scales, while NIRv,Rad, which contains both PAR and plant physiological and biochemical information, can better reveal changes in NPP. For example, Liu, et al. [29] showed extremely strong linear relationships between the GPP and APAR of maize and soybeans in three regions of the Corn Belt in the USA from 1990 to 2018 on small time scales. Our study further demonstrated the success of NIRv,Rad in estimating the NPP of winter wheat and summer maize from data measured during the day (Figure 4), illustrating that NIRv,Rad can be regarded as an effective indicator of vegetation NPP.
Although LUE is not the foundation for the correlation between NIRv,Rad and NPP, our results indicate that LUE and NIRv,Ref exhibit similar patterns of variation on an hourly scale (Figure 2). LUE remained high in the morning and gradually decreased as temperature and radiation increased. It reached its minimum at noon, when the solar phase angle is the smallest and the bidirectional reflectance of the plant canopy is strongest. This result is consistent with previous studies. Liu, et al. [28] proposed that although there may be no clear physical relationship between NIRv,Rad, LUE, and APAR, they have similar patterns on the daily and seasonal scales. Gitelson, et al. [51] found that when plants were subjected to drought, low temperature, and other external stresses, they often adapted through changes in leaf edge curling and inclination. This change was often accompanied by changes in radiation absorption and subtle changes in LUE. We also observed that LUE changed minimally throughout the growing season of plants, particularly in summer maize (Figure 2). Studies of soybean, rapeseed, alfalfa, and other plants have also reported the stability of LUE [29]. After APAR was removed in our study, NIRv,Rad showed a similar change pattern to LUE on hourly and daily scales (Figure 2). This is consistent with Liu, et al. [28], who also demonstrated that NIRv,Rad had a similar change pattern to LUE on daily and seasonal scales after eliminating the effect of APAR.
The dominant effect of the plant canopy structure on photosynthesis can further explicate the capability of NIRv,Rad to respond to NPP changes. Many studies have illustrated the strong relationship between LAI and NIRv,Rad [22,27,29]. In addition, the photosynthesis of plant canopies is the dominant factor controlling the amount of carbon entering the carbon cycle. Studies using the LUE model, which is most commonly used to simulate canopy photosynthesis, have also shown that LUE only fluctuates slightly on short (hourly) time scales [52], demonstrating that LUE-related models and indices are not effective over short time scales. Previous studies have also reported that the product of the fraction of photons escaping from canopies ( f esc ) and visible light can explain most of the changes in canopy photosynthesis (~50–80%), while the conventional LUE formula can only explain less than 50% of such changes [25]. The superiority of this measure results from the definition of f esc   as the ratio of NIRv,Ref to PAR.

4.2. Explaining the Difference between NIRv,Rad–NPP Relationships in Wheat and Maize

Our study found that NIRv,Rad detects NPP in C3 and C4 plants in significantly different ways, as mainly reflected in the different linear slopes of the NIRv,Rad–NPP relationship. NIRv,Rad is more susceptible to changes in summer maize NPP, as described in Section 3.2. The higher photosynthetic utilization efficiency of C4 plants may lead to this higher sensitivity of NIRv,Rad to detection of NPP in C4 plants.
Under natural conditions, the photosynthetic efficiency of C3 plants is normally lower than that of C4 plants for several reasons [53]. C3 plants only have one CO2 receptor, while C4 plants have two. C3 plants photosynthesize merely when stomata are open, while C4 plants also photosynthesize when stomata are closed. Photorespiration is high in C3 plants, but minimal or even absent in C4 plants [54]. The dual activity of CO2 fixation enzymes (ribulose-1,5-bisphosphate carboxylase/oxygenase) in C3 plants results in lower photosynthetic efficiency in C3 plants [55]. However, C4 plants are dependent on PEP carboxylase (PEPc), which has no oxygenase activity. PEP carboxylase has a high affinity for CO2, allowing C4 plants to fix CO2 at lower CO2 levels and maintain photosynthesis even when stomata are not fully open. In addition to the presence of PEPc, C4 plants have a number of characteristics that together increase photosynthetic rates. One of the most important features is that the sites where CO2 fixation and the Calvin cycle take place are spatially separated, i.e., the vascular sheath cells (BSc) are the main sites where photosynthesis takes place, while the chloroplasts are only involved in CO2 fixation [56]. However, photosynthesis in C3 plants occurs in both BSc and chloroplasts, although in most cases the contribution of BS cells to photosynthesis is minimal [57]. The unique CO2 concentrating mechanism of C4 plants operates around rubisco, which significantly reduces the oxygenase activity of this key enzyme [58]. The metabolic mechanism of C4 plants is the same as that of C3 plants, thus improving energy utilization efficiency by reducing the subsequent energy loss caused by photorespiration. This results in higher photosynthetic performance and water utilization efficiency in C4 plants [59]. This CO2 concentrating mechanism in C4 metabolism is considered an evolutionary response to declining atmospheric CO2 concentrations [60]. This mechanism increases the CO2 concentration of rubisco’s catalytic sites in the BSCs by 10–100 times compared with the surrounding air [61]. Moreover, the mechanism functions with a stomatal conductance lower than that in C3 plants, thereby reducing transpiration, which enables higher water utilization efficiency. The difference in the photosynthetic capacity of C3 and C4 plants can also be explained by quantum yields. Physiologically, the point at which the instantaneous quantum yields of C3 and C4 plants are equal is defined as the “crossover temperature” [23,60]. When the temperature is below this critical value, C3 plants have a higher yield and higher carbon sequestration capacity, but when the temperature exceeds this critical value, C4 plants achieve superior yield and carbon sequestration. The quantum yields of C3 and C4 plants differ because C3 plants are more sensitive to temperature and CO2 than C4 plants. The quantum yield of C3 plants decreases as the temperature increases at a fixed CO2 level, and increases as the CO2 concentration increases at a fixed temperature. However, the maximum quantum yield of C4 plants always exceeds that of C3 plants because the CO2 concentrating mechanism reduces their photorespiration while that of C3 plants remains higher [53]. In summary, the photosynthetic utilization efficiency of C4 plants is generally higher than that of C3 plants, largely due to the CO2 concentrating mechanism of C4 photosynthetic metabolism.
Our analysis of physiological indicators further explains the high photosynthetic efficiency of C4 plants. A partial correlation analysis of the NIRv,Rad–NPP relationship on a series of physiological indicators related to photosynthesis showed that Gs was the dominant factor that affected the response of NIRv,Rad to NPP changes during the growing season (Figure S1). Under temperature, light, or water stress, stomatal limitations may lead to lower photosynthetic CO2 uptake in C3 than in C4 plants. For example, C3 plants were dormant at midday due to changes in leaf water potential caused by high temperature and irradiance. These high temperatures sharply increase transpiration and stomatal conductance. The difference in stomatal conductance greatly reduces the water utilization efficiency and photosynthetic rate of C3 plants compared with C4 plants and decreases their proportion of fixed carbon [62,63]. High temperature and radiation also affect the activity of enzymes, thereby reducing the capacity of plants to fix CO2. However, the high CO2 concentration in the chloroplasts of C4 plant mesophyll cells can mitigate this deficiency. C3 plants, which lack such function, are therefore more susceptible to high temperature and radiation.

4.3. Environmental Stress in Relation to NIRv,Rad-NPP

Plants have limited capacity to cope with sudden environmental changes, and even minor fluctuations small can adversely affect their growth. Among the various abiotic stresses that pose a significant threat to agricultural production, drought, light stresses, and temperature stress are particularly detrimental. In this study, we found that light and temperature stress can impact the NIRv,Rad -NPP relationship in both C3 and C4 plants. However, these stresses do not alter the finding that NIRv,Rad is more sensitive to NPP detection in C4 plants.
The study suggests that changes in environmental factors, such as light stress, can have a significant impact on the relationship between NIRv,Rad and NPP in both C3 and C4 palnts. Specifically, the NIRv,Rad -NPP relationship was significantly weakened in winter wheat (C3) and slightly increased in summer maize (C4) under high light stress (Figure 8). Due to the extremely strong NIRv,Rad -SIF relationship [64], these finding are supported by previous studies on the relationship between solar-induced fluorescence (SIF) and GPP. Field observations of the C3 plant winter wheat by Goulas et al. reported a significant weakening of the SIF-GPP relationship under strong light conditions for half an hour [65]. A study by Miao et al. reported that the SIF-GPP relationship of the C3 plant soybean was significantly reduced under cloudy weather [66]. For C4 plants, Zeng et al. reported an increase in SIF-PAR in maize under light stress [67]. The canopy structure of soybean, winter wheat, and summer maize varied considerably in terms of leaf area index and leaf inclination, but the effects of PAR were observed in all cases. Our observations also showed that at the hourly scale, changes in PAR introduced uncertainty to the changes in NPP and NIRv,Rad of summer maize (Figure 2). Therefore, at the canopy scale, the effects of light intensity and PAR factors together with canopy structure should be fully considered to establish NIRv,Rad -NPP relationships. These study showed that although light stress significantly altered the NIRv,Rad-NPP relationship in winter wheat and summer maize, it did not affect the result that NIRv,Rad detects a more sensitive NPP in summer maize. This result is in agreement with a previous study by Liu et al. who also reported a higher sensitivity of SIF detection in summer maize than in winter wheat [33].
The elevated temperature stress had a significant impact on the NIRv,Rad -NPP relationship in winter wheat and summer maize. However, high temperature stress did not alter the results of NIRv,Rad which was more sensitive to the detection of NPP in summer maize. From the results of the correlation between NPP and NIRv,Rad (Figure 9), we gained insight into the mechanisms behind the impact of heat stress on both plants during the growing periods. The change in the NIRv,Rad -NPP slope in both plants can be attributed to some extent to the response of NIRv,Rad under heat stress conditions. In C3 plants such as winter wheat, the stomatal were observed to close, and there was decline in CO2 uptake and net photosynthetic rate in the early stages of high midday temperature decreases [68]. In contrast, C4 plants like summer maize were able to withstand high-temperature stress by increasing water use efficiency and inhibiting photorespiration. However, even C4 plants summer maize was inevitably subject to a decline in stomatal conductance and photosynthetic rate (Figure S2). This suggests that when plants are exposed to high temperatures, even short periods of heat stress can cause a reduction in photosynthetic rates [69]. This finding aligns with prior research by Lobell et al., who found that excessively high temperatures in a shorter reproductive period in C3 plants, leading to a decrease in wheat yield. Song et al. [70] demonstrated that a sudden temperature increase in March caused a 6% yield reduction compared to the previous year. In C4 plant maize yields, SIF predicted a yield reduction of roughly 13.9%, as opposed to the 1.2% predicted by EVI2 and the 0.4% predicted by NDVI. Furthermore, previous studies have also shown that various physiological indicators decrease substantially also decline during the senescence stage in all plants [71]. The canopy structure of C3 plant winter wheat can change significantly at high-stress levels. Therefore, the insensitivity of NIRv,Rad to NPP in C3 plants, in this instance, may be partly due to the alterations in canopy structure.

4.4. Outlook for the Future

The indicator NIRv,Rad has been applied extensively. In this study, observing the slope differences between C3 and C4 plants provided a new paradigm and method for studying their NPP. If slope sorting were applied to the analysis of spectral data obtained by satellite sensors, it would facilitate the accurate inversion of plant NPP on long-time scales. However, some challenges remain regarding its wide use for vegetation photosynthesis evaluation. Existing satellite data (such as MODIS) have large transit time intervals, as well as problems such as spatiotemporal mismatch and low resolution, while updating the existing spatiotemporal data may introduce uncertainties. Furthermore, removing background interference from soil and other non-green plants is essential to using NIRv,Rad as a proxy for canopy photosynthesis. NIRv,Rad is determined by measuring the NIR radiance time, while NDVI is less sensitive on short time scales, and its value is constrained between 0 and 1. In our study, the canopies of winter wheat and summer maize were dense and therefore had NDVI values close to 1. More work is required to study the applicability of NIRv,Rad to vegetation with sparse canopies and subsequently low NDVI.
Although our results indicate that NIRv,Rad-based estimation on the NPP of winter wheat and summer maize was relatively accurate on both hourly and daily scales, some limitations remain. First, the environmental conditions required to grow C3 and C4 plants are completely different. Due to the different growing seasons of winter wheat and summer maize, the slope differences in the NIRv,Rad–NPP relationship of C3 and C4 plants may be affected by complex physiological, photodynamic, and thermodynamic factors. To accurately quantify and characterize the specific NIRv,Rad–NPP relationships of C3 and C4 plants, future research should simultaneously observe C3 and C4 plants with substantially overlapping growth phases.
Moreover, NDVI and NIRIrra are basic data provided by various satellite platforms. These long-term and high-resolution satellite data can greatly reduce NPP calculation costs. However, the spatiotemporal mismatch is currently the largest challenge to applying NIRv,Rad in satellite and long-time-scale analysis, particularly as the temporal resolution of most satellite sensors, such as MODIS and SPOT, cannot be set to the hourly scale [33]. Although the spatiotemporal mismatch of data also remains a common problem faced by most fine inversions on long timescales, studies have proposed feasible solutions. For example, Hu, et al. [72] used a PAR-driven method to upgrade the instantaneous SIF to the daily scale. This method can also effectively resolve the time-spatial misalignment between NIRv,Rad and NPP.

5. Conclusions

Based on field observation data, we probed into the capability of NIRv,Rad to estimate the NPP of C3 winter wheat and C4 summer maize on hourly and daily scales. The results showed that NIRv,Rad can effectively monitor changes in the canopy photosynthetic capacity of these plants. NIRv,Rad and NPP had strong linear correlations on both hourly and daily scales in C3 and C4 plants, demonstrating that NIRv,Rad is an effective indicator to monitor changes in NPP. However, we found that NIRv,Rad is more susceptible to NPP changes in C4 plants than in C3 plants because of the higher photosynthetic utilization efficiency of the former. We, therefore, suggest that the differences in the C3 and C4 photosynthetic pathways should be accounted for in future applications of the NIRv,Rad–NPP relationship. Furthermore, NIRv,Rad can be used to extract plant physiological data and thereby improve NPP estimation methods to provide new insights into dynamic vegetation change monitoring.
Our study sheds new light on carbon sequestration monitoring in ecosystems containing both C3 and C4 plants. While more studies are needed to deepen our understanding of the NIRv,Rad–NPP relationship in C3 and C4 plants on different temporal and spatial scales, this research provides a new method for rapid and accurate quantification of the NPP of C3 and C4 plants on the geospatial scale in future research.

Supplementary Materials

The following supporting information can be downloaded at: https://www.mdpi.com/article/10.3390/rs15041133/s1, Figure S1: Partial correlation analysis of NIRv,Rad, NPP, and physiological indicators, namely stomatal conductance (Gs), intercellular CO2 concentration (Ci), net photosynthetic rate (Pn), transpiration rate (E), SPAD, and leaf area index (LAI). Figure S2: Daily and seasonal changes of physiological indicators, namely stomatal conductance (Gs), intercellular CO2 concentration (Ci), net photosynthetic rate (Pn), transpiration rate (E), SPAD, and leaf area index (LAI).

Author Contributions

Conceptualization, S.C.; methodology, W.Z.; software, S.C.; validation, S.C. and W.Z.; formal analysis, S.C.; investigation, S.C., W.Z., R.Z. and X.S.; resources, R.Z. and Y.Z.; data curation, W.Z.; writing—original draft preparation, S.C.; writing—review and editing, S.C. and W.Z.; visualization, S.C.; supervision, L.L.; project administration, L.L.; funding acquisition, L.L. All authors have read and agreed to the published version of the manuscript.

Funding

This research was funded by National Natural Science Foundation of China, grant number 42101081; Construction of World-class University (Discipline) and Special Development Guidance Project of China Agricultural University: Study on Key Technologies of Intelligent Coupling of Water and Fertilizer for Alfalfa in Horqin Sandy Land, grant number 00112302; Development and application of intelligent coupling technology of water and fertilizer for alfalfa in Horqin sandy land, grant number 2022YFDZ0042.

Data Availability Statement

The data presented in this study are available on request from the corresponding author.

Acknowledgments

The authors gratefully acknowledge Yanrong Zhang for providing valuable suggestions on the modification of the pictures.

Conflicts of Interest

The authors declare no conflict of interest.

References

  1. Field, C.B.; Behrenfeld, M.J.; Randerson, J.T.; Falkowski, P. Primary production of the biosphere: Integrating terrestrial and oceanic components. Science 1998, 281, 237–240. [Google Scholar] [CrossRef] [PubMed] [Green Version]
  2. Nemani, R.R.; Keeling, C.D.; Hashimoto, H.; Jolly, W.M.; Piper, S.C.; Tucker, C.J.; Myneni, R.B.; Running, S.W. Climate-driven increases in global terrestrial net primary production from 1982 to 1999. Science 2003, 300, 1560–1563. [Google Scholar] [CrossRef] [PubMed] [Green Version]
  3. Piao, S.; Sitch, S.; Ciais, P.; Friedlingstein, P.; Peylin, P.; Wang, X.; Ahlström, A.; Anav, A.; Canadell, J.G.; Cong, N. Evaluation of terrestrial carbon cycle models for their response to climate variability and to CO2 trends. Global Chang. Biol. 2013, 19, 2117–2132. [Google Scholar] [CrossRef] [Green Version]
  4. Ma, B.; Jing, J.; Liu, B.; Xu, Y.; Dou, S.; He, H. Quantitative assessment of the relative contributions of climate change and human activities to NPP changes in the Southwest Karst area of China. Environ. Sci. Pollut. Res. 2022, 29, 80597–80611. [Google Scholar] [CrossRef] [PubMed]
  5. Piao, S.; He, Y.; Wang, X.; Chen, F. Estimation of China’s terrestrial ecosystem carbon sink: Methods, progress and prospects. Sci. China Earth Sci. 2022, 65, 641–651. [Google Scholar] [CrossRef]
  6. Zhao, W.; Luo, T.; Wei, H.; Zhang, L. Relative impact of climate change and grazing on NDVI changes in grassland in the Mt. Qomolangma nature reserve and adjacent regions during 2000–2018. Diversity 2022, 14, 171. [Google Scholar] [CrossRef]
  7. Fang, J.; Chen, A.; Peng, C.; Zhao, S.; Ci, L. Changes in forest biomass carbon storage in China between 1949 and 1998. Science 2001, 292, 2320–2322. [Google Scholar] [CrossRef]
  8. Dixon, R.K.; Solomon, A.; Brown, S.; Houghton, R.; Trexier, M.; Wisniewski, J. Carbon pools and flux of global forest ecosystems. Science 1994, 263, 185–190. [Google Scholar] [CrossRef]
  9. Pan, Y.; Birdsey, R.A.; Fang, J.; Houghton, R.; Kauppi, P.E.; Kurz, W.A.; Phillips, O.L.; Shvidenko, A.; Lewis, S.L.; Canadell, J.G. A large and persistent carbon sink in the world’s forests. Science 2011, 333, 988–993. [Google Scholar] [CrossRef] [Green Version]
  10. Piao, S.; Fang, J.; Ciais, P.; Peylin, P.; Huang, Y.; Sitch, S.; Wang, T. The carbon balance of terrestrial ecosystems in China. Nature 2009, 458, 1009–1013. [Google Scholar] [CrossRef]
  11. Yu, G.; Chen, Z.; Piao, S.; Peng, C.; Ciais, P.; Wang, Q.; Li, X.; Zhu, X. High carbon dioxide uptake by subtropical forest ecosystems in the East Asian monsoon region. Proc. Natl. Acad. Sci. USA 2014, 111, 4910–4915. [Google Scholar] [CrossRef] [PubMed] [Green Version]
  12. Wang, Q.; Zheng, H.; Zhu, X.; Yu, G. Primary estimation of Chinese terrestrial carbon sequestration during 2001–2010. Sci. Bull. 2015, 60, 577–590. [Google Scholar] [CrossRef] [Green Version]
  13. Yao, Y.; Li, Z.; Wang, T.; Chen, A.; Wang, X.; Du, M.; Jia, G.; Li, Y.; Li, H.; Luo, W. A new estimation of China’s net ecosystem productivity based on eddy covariance measurements and a model tree ensemble approach. Agric. For. Meteorol. 2018, 253, 84–93. [Google Scholar] [CrossRef]
  14. Frankenberg, C.; Fisher, J.B.; Worden, J.; Badgley, G.; Saatchi, S.S.; Lee, J.E.; Toon, G.C.; Butz, A.; Jung, M.; Kuze, A. New global observations of the terrestrial carbon cycle from GOSAT: Patterns of plant fluorescence with gross primary productivity. Geophys. Res. Lett. 2011, 38. [Google Scholar] [CrossRef] [Green Version]
  15. Sitch, S.; Huntingford, C.; Gedney, N.; Levy, P.; Lomas, M.; Piao, S.; Betts, R.; Ciais, P.; Cox, P.; Friedlingstein, P. Evaluation of the terrestrial carbon cycle, future plant geography and climate-carbon cycle feedbacks using five Dynamic Global Vegetation Models (DGVMs). Global Chang. Biol. 2008, 14, 2015–2039. [Google Scholar] [CrossRef]
  16. Piao, S.; Liu, Z.; Wang, T.; Peng, S.; Ciais, P.; Huang, M.; Ahlstrom, A.; Burkhart, J.F.; Chevallier, F.; Janssens, I.A. Weakening temperature control on the interannual variations of spring carbon uptake across northern lands. Nat. Clim. Chang. 2017, 7, 359–363. [Google Scholar] [CrossRef] [Green Version]
  17. Zhang, Y.; Gurung, R.; Marx, E.; Williams, S.; Ogle, S.M.; Paustian, K. DayCent model predictions of NPP and grain yields for agricultural lands in the contiguous US. J. Geophys. Res. Biogeosci. 2020, 125, e2020JG005750. [Google Scholar] [CrossRef]
  18. Zheng, Q.; Weng, Q.; Wang, K. Developing a new cross-sensor calibration model for DMSP-OLS and Suomi-NPP VIIRS night-light imageries. ISPRS J. Photogramm. Remote Sens. 2019, 153, 36–47. [Google Scholar] [CrossRef]
  19. Yuan, W.; Liu, S.; Zhou, G.; Zhou, G.; Tieszen, L.L.; Baldocchi, D.; Bernhofer, C.; Gholz, H.; Goldstein, A.H.; Goulden, M.L. Deriving a light use efficiency model from eddy covariance flux data for predicting daily gross primary production across biomes. Agric. For. Meteorol. 2007, 143, 189–207. [Google Scholar] [CrossRef] [Green Version]
  20. Qiao, K.; Zhu, W.; Xie, Z.; Li, P. Estimating the seasonal dynamics of the leaf area index using piecewise LAI-VI relationships based on phenophases. Remote Sens. 2019, 11, 689. [Google Scholar] [CrossRef] [Green Version]
  21. Ruimy, A.; Kergoat, L.; Bondeau, A.; Intercomparison, T.P.O.T.P.N.M. Comparing global models of terrestrial net primary productivity (NPP): Analysis of differences in light absorption and light-use efficiency. Global Change Biol. 1999, 5, 56–64. [Google Scholar] [CrossRef] [Green Version]
  22. Pan, N.; Wang, S.; Wei, F.; Shen, M.; Fu, B. Inconsistent changes in NPP and LAI determined from the parabolic LAI versus NPP relationship. Ecol. Indic. 2021, 131, 108134. [Google Scholar] [CrossRef]
  23. Colello, G.; Grivet, C.; Sellers, P.; Berry, J. Modeling of energy, water, and CO 2 flux in a temperate grassland ecosystem with SiB2: May–October 1987. J. Atmos. Sci. 1998, 55, 1141–1169. [Google Scholar] [CrossRef]
  24. Badgley, G.; Field, C.B.; Berry, J.A. Canopy near-infrared reflectance and terrestrial photosynthesis. Sci. Adv. 2017, 3, e1602244. [Google Scholar] [CrossRef] [Green Version]
  25. Baldocchi, D.D.; Ryu, Y.; Dechant, B.; Eichelmann, E.; Hemes, K.; Ma, S.; Sanchez, C.R.; Shortt, R.; Szutu, D.; Valach, A. Outgoing near-infrared radiation from vegetation scales with canopy photosynthesis across a spectrum of function, structure, physiological capacity, and weather. J. Geophys. Res. Biogeosci. 2020, 125, e2019JG005534. [Google Scholar] [CrossRef]
  26. Camps-Valls, G.; Campos-Taberner, M.; Moreno-Martínez, Á.; Walther, S.; Duveiller, G.; Cescatti, A.; Mahecha, M.D.; Muñoz-Marí, J.; García-Haro, F.J.; Guanter, L. A unified vegetation index for quantifying the terrestrial biosphere. Sci. Adv. 2021, 7, eabc7447. [Google Scholar] [CrossRef] [PubMed]
  27. Zhao, W.; Wu, J.; Shen, Q.; Liu, L.; Lin, J.; Yang, J. Estimation of the net primary productivity of winter wheat based on the near-infrared radiance of vegetation. Sci. Total Environ. 2022, 838, 156090. [Google Scholar] [CrossRef]
  28. Liu, L.; Liu, X.; Chen, J.; Du, S.; Ma, Y.; Qian, X.; Chen, S.; Peng, D. Estimating maize GPP using near-infrared radiance of vegetation. Sci. Remote Sens. 2020, 2, 100009. [Google Scholar] [CrossRef]
  29. Liu, L.; Zhao, W.; Shen, Q.; Wu, J.; Teng, Y.; Yang, J.; Han, X.; Tian, F. Nonlinear Relationship Between the Yield of Solar-Induced Chlorophyll Fluorescence and Photosynthetic Efficiency in Senescent Crops. Remote Sens. 2020, 12, 1518. [Google Scholar] [CrossRef]
  30. Lu, X.-Y.; Chen, X.; Zhao, X.-L.; Lv, D.-J.; Zhang, Y. Assessing the impact of land surface temperature on urban net primary productivity increment based on geographically weighted regression model. Sci. Rep. 2021, 11, 22282. [Google Scholar] [CrossRef]
  31. Hikosaka, K.; Niinemets, Ü.; Anten, N.P. Canopy Photosynthesis: From Basics to Applications; Springer: Berlin/Heidelberg, Germany, 2016. [Google Scholar]
  32. Gennari, P.; Rosero-Moncayo, J.; Tubiello, F.N. The FAO contribution to monitoring SDGs for food and agriculture. Nat. Plants 2019, 5, 1196–1197. [Google Scholar] [CrossRef]
  33. Liu, L.; Guan, L.; Liu, X. Directly estimating diurnal changes in GPP for C3 and C4 crops using far-red sun-induced chlorophyll fluorescence. Agric. For. Meteorol. 2017, 232, 1–9. [Google Scholar] [CrossRef]
  34. Lara, M.V.; Andreo, C.S. C4 plants adaptation to high levels of CO2 and to drought environments. In Abiotic Stress in Plants: Mechanisms and Adaptations; BoD–Books on Demand: Norderstedt, Germany, 2011; pp. 415–428. [Google Scholar]
  35. Sage, R.F.; Zhu, X.-G. Exploiting the engine of C4 photosynthesis. J. Exp. Bot. 2011, 62, 2989–3000. [Google Scholar] [CrossRef] [Green Version]
  36. Gitelson, A.A.; Viña, A.; Verma, S.B.; Rundquist, D.C.; Arkebauer, T.J.; Keydan, G.; Leavitt, B.; Ciganda, V.; Burba, G.G.; Suyker, A.E. Relationship between gross primary production and chlorophyll content in crops: Implications for the synoptic monitoring of vegetation productivity. J. Geophys. Res. Atmos. 2006, 111. [Google Scholar] [CrossRef] [Green Version]
  37. Gowik, U.; Westhoff, P. The path from C3 to C4 photosynthesis. Plant Physiol. 2011, 155, 56–63. [Google Scholar] [CrossRef] [PubMed] [Green Version]
  38. Gitelson, A.A.; Peng, Y.; Arkebauer, T.J.; Suyker, A.E. Productivity, absorbed photosynthetically active radiation, and light use efficiency in crops: Implications for remote sensing of crop primary production. J. Plant Physiol. 2015, 177, 100–109. [Google Scholar] [CrossRef] [PubMed] [Green Version]
  39. Zhang, Z.; Zhang, Y.; Porcar-Castell, A.; Joiner, J.; Guanter, L.; Yang, X.; Migliavacca, M.; Ju, W.; Sun, Z.; Chen, S. Reduction of structural impacts and distinction of photosynthetic pathways in a global estimation of GPP from space-borne solar-induced chlorophyll fluorescence. Remote Sens. Environ. 2020, 240, 111722. [Google Scholar] [CrossRef]
  40. Wu, G.; Guan, K.; Jiang, C.; Peng, B.; Kimm, H.; Chen, M.; Yang, X.; Wang, S.; Suyker, A.E.; Bernacchi, C.J. Radiance-based NIRv as a proxy for GPP of corn and soybean. Environ. Res. Lett. 2020, 15, 034009. [Google Scholar] [CrossRef]
  41. Nuttall, J.; O'leary, G.; Panozzo, J.; Walker, C.; Barlow, K.; Fitzgerald, G. Models of grain quality in wheat—A review. Field Crops Res. 2017, 202, 136–145. [Google Scholar] [CrossRef] [Green Version]
  42. Yan, J.; Warburton, M.; Crouch, J. Association mapping for enhancing maize (Zea mays L.) genetic improvement. Crop Sci. 2011, 51, 433–449. [Google Scholar] [CrossRef]
  43. Karkauskaite, P.; Tagesson, T.; Fensholt, R. Evaluation of the plant phenology index (PPI), NDVI and EVI for start-of-season trend analysis of the Northern Hemisphere boreal zone. Remote Sens. 2017, 9, 485. [Google Scholar] [CrossRef] [Green Version]
  44. Ahlström, A.; Fälthammar-de Jong, G.; Nijland, W.; Tagesson, T. Primary productivity of managed and pristine forests in Sweden. Environ. Res. Lett. 2020, 15, 094067. [Google Scholar] [CrossRef]
  45. Wang, X.; Liu, F. Effects of elevated CO2 and heat on wheat grain quality. Plants 2021, 10, 1027. [Google Scholar] [CrossRef] [PubMed]
  46. TAO, Z.-q.; CHEN, Y.-q.; Chao, L.; ZOU, J.-x.; Peng, Y.; YUAN, S.-f.; Xia, W.; Peng, S. The causes and impacts for heat stress in spring maize during grain filling in the North China Plain—A review. J. Integr. Agric. 2016, 15, 2677–2687. [Google Scholar] [CrossRef] [Green Version]
  47. Sharma, D.K.; Andersen, S.B.; Ottosen, C.O.; Rosenqvist, E. Wheat cultivars selected for high Fv/Fm under heat stress maintain high photosynthesis, total chlorophyll, stomatal conductance, transpiration and dry matter. Physiol. Plant 2015, 153, 284–298. [Google Scholar] [CrossRef]
  48. Siegmann, B.; Cendrero-Mateo, M.P.; Cogliati, S.; Damm, A.; Gamon, J.; Herrera, D.; Jedmowski, C.; Junker-Frohn, L.V.; Kraska, T.; Muller, O. Downscaling of far-red solar-induced chlorophyll fluorescence of different crops from canopy to leaf level using a diurnal data set acquired by the airborne imaging spectrometer HyPlant. Remote Sens. Environ. 2021, 264, 112609. [Google Scholar] [CrossRef]
  49. Kim, J.; Ryu, Y.; Jiang, C.; Hwang, Y. Continuous observation of vegetation canopy dynamics using an integrated low-cost, near-surface remote sensing system. Agric. For. Meteorol. 2019, 264, 164–177. [Google Scholar] [CrossRef]
  50. Peng, Y.; Gitelson, A.A. Application of chlorophyll-related vegetation indices for remote estimation of maize productivity. Agric. For. Meteorol. 2011, 151, 1267–1276. [Google Scholar] [CrossRef]
  51. Gitelson, A.A.; Viña, A.; Masek, J.G.; Verma, S.B.; Suyker, A.E. Synoptic monitoring of gross primary productivity of maize using Landsat data. IEEE Geosci. Remote Sens. Lett. 2008, 5, 133–137. [Google Scholar] [CrossRef] [Green Version]
  52. Pei, Y.; Dong, J.; Zhang, Y.; Yuan, W.; Doughty, R.; Yang, J.; Zhou, D.; Zhang, L.; Xiao, X. Evolution of light use efficiency models: Improvement, uncertainties, and implications. Agric. For. Meteorol. 2022, 317, 108905. [Google Scholar] [CrossRef]
  53. Still, C.J.; Berry, J.A.; Collatz, G.J.; DeFries, R.S. Global distribution of C3 and C4 vegetation: Carbon cycle implications. Global Biogeochem. Cycles 2003, 17, 6-1–6-14. [Google Scholar] [CrossRef]
  54. Boretti, A.; Florentine, S. Atmospheric CO2 concentration and other limiting factors in the growth of C3 and C4 plants. Plants 2019, 8, 92. [Google Scholar] [CrossRef] [Green Version]
  55. Brown, N.J.; Newell, C.A.; Stanley, S.; Chen, J.E.; Perrin, A.J.; Kajala, K.; Hibberd, J.M. Independent and parallel recruitment of preexisting mechanisms underlying C4 photosynthesis. Science 2011, 331, 1436–1439. [Google Scholar] [CrossRef]
  56. Cui, H. Challenges and approaches to crop improvement through C3-to-C4 engineering. Front. Plant Sci. 2021, 12, 715391. [Google Scholar] [CrossRef]
  57. Kangasjärvi, S.; Nurmi, M.; Tikkanen, M.; ARO, E.M. Cell-specific mechanisms and systemic signalling as emerging themes in light acclimation of C3 plants. Plant Cell Environ. 2009, 32, 1230–1240. [Google Scholar] [CrossRef]
  58. Guidi, L.; Lo Piccolo, E.; Landi, M. Chlorophyll fluorescence, photoinhibition and abiotic stress: Does it make any difference the fact to be a C3 or C4 species? Front. Plant Sci. 2019, 10, 174. [Google Scholar] [CrossRef]
  59. Majeran, W.; Friso, G.; Ponnala, L.; Connolly, B.; Huang, M.; Reidel, E.; Zhang, C.; Asakura, Y.; Bhuiyan, N.H.; Sun, Q. Structural and metabolic transitions of C4 leaf development and differentiation defined by microscopy and quantitative proteomics in maize. Plant Cell 2010, 22, 3509–3542. [Google Scholar] [CrossRef] [Green Version]
  60. Ehleringer, J.R.; Sage, R.F.; Flanagan, L.B.; Pearcy, R.W. Climate change and the evolution of C4 photosynthesis. Trends Ecol. Evol. 1991, 6, 95–99. [Google Scholar] [CrossRef] [PubMed]
  61. Kumar, V.; Sharma, A.; Soni, J.K.; Pawar, N. Physiological response of C3, C4 and CAM plants in changeable climate. Pharma Innov. 2017, 6, 70. [Google Scholar]
  62. Damm, A.; Elbers, J.; Erler, A.; Gioli, B.; Hamdi, K.; Hutjes, R.; Kosvancova, M.; Meroni, M.; Miglietta, F.; Moersch, A. Remote sensing of sun-induced fluorescence to improve modeling of diurnal courses of gross primary production (GPP). Global Change Biol. 2010, 16, 171–186. [Google Scholar] [CrossRef] [Green Version]
  63. Yang, K.; Ryu, Y.; Dechant, B.; Berry, J.A.; Hwang, Y.; Jiang, C.; Kang, M.; Kim, J.; Kimm, H.; Kornfeld, A. Sun-induced chlorophyll fluorescence is more strongly related to absorbed light than to photosynthesis at half-hourly resolution in a rice paddy. Remote Sens. Environ. 2018, 216, 658–673. [Google Scholar]
  64. Liu, X.; Liu, Z.; Liu, L.; Lu, X.; Chen, J.; Du, S.; Zou, C. Modelling the influence of incident radiation on the SIF-based GPP estimation for maize. Agric. For. Meteorol. 2021, 307, 108522. [Google Scholar] [CrossRef]
  65. Goulas, Y.; Fournier, A.; Daumard, F.; Champagne, S.; Ounis, A.; Marloie, O.; Moya, I. Gross primary production of a wheat canopy relates stronger to far red than to red solar-induced chlorophyll fluorescence. Remote Sens. 2017, 9, 97. [Google Scholar] [CrossRef] [Green Version]
  66. Miao, G.; Guan, K.; Yang, X.; Bernacchi, C.J.; Berry, J.A.; DeLucia, E.H.; Wu, J.; Moore, C.E.; Meacham, K.; Cai, Y. Sun-induced chlorophyll fluorescence, photosynthesis, and light use efficiency of a soybean field from seasonally continuous measurements. J. Geophys. Res. Biogeosci. 2018, 123, 610–623. [Google Scholar] [CrossRef]
  67. Zeng, Y.; Chen, M.; Hao, D.; Damm, A.; Badgley, G.; Rascher, U.; Johnson, J.E.; Dechant, B.; Siegmann, B.; Ryu, Y. Combining near-infrared radiance of vegetation and fluorescence spectroscopy to detect effects of abiotic changes and stresses. Remote Sens. Environ. 2022, 270, 112856. [Google Scholar] [CrossRef]
  68. Hura, T.; Hura, K.; Grzesiak, M.; Rzepka, A. Effect of long-term drought stress on leaf gas exchange and fluorescence parameters in C 3 and C 4 plants. Acta Physiol. Plant. 2007, 29, 103–113. [Google Scholar] [CrossRef]
  69. Al-Khatib, K.; Paulsen, G.M. Photosynthesis and productivity during high-temperature stress of wheat genotypes from major world regions. Crop Sci. 1990, 30, 1127–1132. [Google Scholar] [CrossRef]
  70. Song, L.; Guanter, L.; Guan, K.; You, L.; Huete, A.; Ju, W.; Zhang, Y. Satellite sun-induced chlorophyll fluorescence detects early response of winter wheat to heat stress in the Indian Indo-Gangetic Plains. Global Chang. Biol. 2018, 24, 4023–4037. [Google Scholar] [CrossRef] [PubMed] [Green Version]
  71. Yoshida, Y.; Joiner, J.; Tucker, C.; Berry, J.; Lee, J.-E.; Walker, G.; Reichle, R.; Koster, R.; Lyapustin, A.; Wang, Y. The 2010 Russian drought impact on satellite measurements of solar-induced chlorophyll fluorescence: Insights from modeling and comparisons with parameters derived from satellite reflectances. Remote Sens. Environ. 2015, 166, 163–177. [Google Scholar] [CrossRef]
  72. Hu, J.; Liu, L.; Guo, J.; Du, S.; Liu, X. Upscaling solar-induced chlorophyll fluorescence from an instantaneous to daily scale gives an improved estimation of the gross primary productivity. Remote Sens. 2018, 10, 1663. [Google Scholar] [CrossRef] [Green Version]
Figure 1. The location of the test site and the test area of winter wheat and summer maize.
Remotesensing 15 01133 g001
Figure 2. The NPP (µmol/m2/s) and NIRv,Rad (µW/cm2/nm/sr), NIRv,Ref, enhanced vegetation index-2 (EVI2), NDVI, LUE (ratio of organic matter produced to solar energy received by plants), APAR (µmol/m2/s) and the changes in NIRv,Rad/APAR(mWsnm/sr/µmol) of winter wheat and summer maize throughout the growth period. All data are hourly from 8:00 to 17:00 on a day. The data of winter wheat with adequate moisture are analyzed. Where (ah) represent changes in winter wheat and (ip) represent changes in summer maize.
Remotesensing 15 01133 g002
Figure 3. Changes in vegetation and physiological indices on the hourly scale, and difference analysis between winter wheat and summer maize. Box plot colors correspond to those of the coordinate axes. Hollow box plots represent winter wheat, while solid box plots represent summer maize. Asterisk denotes statistically significant differences ** p < 0.01.
Remotesensing 15 01133 g003
Figure 4. Changes in vegetation and physiological indices on the daily scale, and difference analysis between winter wheat and summer maize. The significance values: p < 0.01. Box plot colors correspond to those of the coordinate axes. Hollow box plots represent winter wheat, while solid box plots represent summer maize. Asterisk denotes statistically significant differences ** p < 0.01.
Remotesensing 15 01133 g004
Figure 5. Squared Pearson correlation coefficients (R2) of the NPP proxies (NIRv,Rad, NIRv,Ref, NDVI, and EVI2) with the measured NPP of winter wheat and summer maize on hourly and daily scales. Asterisk denotes statistically significant differences * p < 0.05, ** p < 0.01.
Remotesensing 15 01133 g005
Figure 6. Scatterplot of NIRv,Rad–NPP relationships for winter wheat (C3) and summer maize (C4) on hourly and daily scales. p < 0.001 on both hourly and daily scales. The red and blue lines represent the fitting curve between the near-infrared radiance index and NPP of winter wheat and summer maize, respectively.
Remotesensing 15 01133 g006
Figure 7. PAR*LAI–NIRv,Rad, LUE–NIRv,Rad, and LUE–NIRv,Rad/APAR relationships in winter wheat and summer maize on hourly and daily scales. Red and blue lines in each panel represent the regression between the LUE and VIs of winter wheat and summer maize, respectively.
Remotesensing 15 01133 g007
Figure 8. Scatter plots of NIRv,Rad-NPP correlations at the hourly scale for winter wheat (C3) and summer maize (C4) under high light stress and non-stress conditions, coefficient of determination (R2), red solid lines indicate fitted curves of NIRv,Rad-NPP under high light stress, green solid lines indicate fitted curves of NIRv,Rad-NPP under non-light stress.
Remotesensing 15 01133 g008
Figure 9. Scatter plots of NIRv,Rad-NPP correlations at hourly scales for winter wheat (C3) and summer maize (C4) under high-temperature stress and non-stress conditions, coefficient of determination (R2), red solid lines indicate fitted curves of NIRv,Rad-NPP under high light stress, blue solid lines indicate fitted curves of NIRv,Rad-NPP under non-light stress.
Remotesensing 15 01133 g009
Disclaimer/Publisher’s Note: The statements, opinions and data contained in all publications are solely those of the individual author(s) and contributor(s) and not of MDPI and/or the editor(s). MDPI and/or the editor(s) disclaim responsibility for any injury to people or property resulting from any ideas, methods, instructions or products referred to in the content.

