Communication

Integrated GPR and ERT Surveys for the Investigation of the External Sectors of the Castle of Melfi (Potenza, Italy)

ISPC-CNR—Istituto di Scienze del Patrimonio Culturale, Consiglio Nazionale delle Ricerche, 80134 Napoli, Italy
*
Author to whom correspondence should be addressed.
Remote Sens. 2023, 15(4), 1019; https://doi.org/10.3390/rs15041019
Submission received: 9 January 2023 / Revised: 9 February 2023 / Accepted: 10 February 2023 / Published: 12 February 2023

Abstract

:
The Castle of Melfi is placed on a hilltop overlooking the modern town and it includes many buildings that have been modified and expanded over time. Its Norman-era core was probably built between the end of the 11th and the start of the 12th century on top of an earlier Byzantine castrum; it was enlarged during the reign of Frederick II and additional alterations were undertaken during the reigns of the Angevin and Aragonese. Integrated ground-penetrating radar (GPR) and electrical resistivity tomography (ERT) surveys were carried out inside two courtyards of the westernmost part of the castle, the Cortile degli Armigeri and the Cortile del Mortorio, and in an external eastern wall area in order to identify ancient buried structures through two different methods of investigation and to compare the results.
Keywords:
GPR; ERT; archaeology; castle

1. Introduction

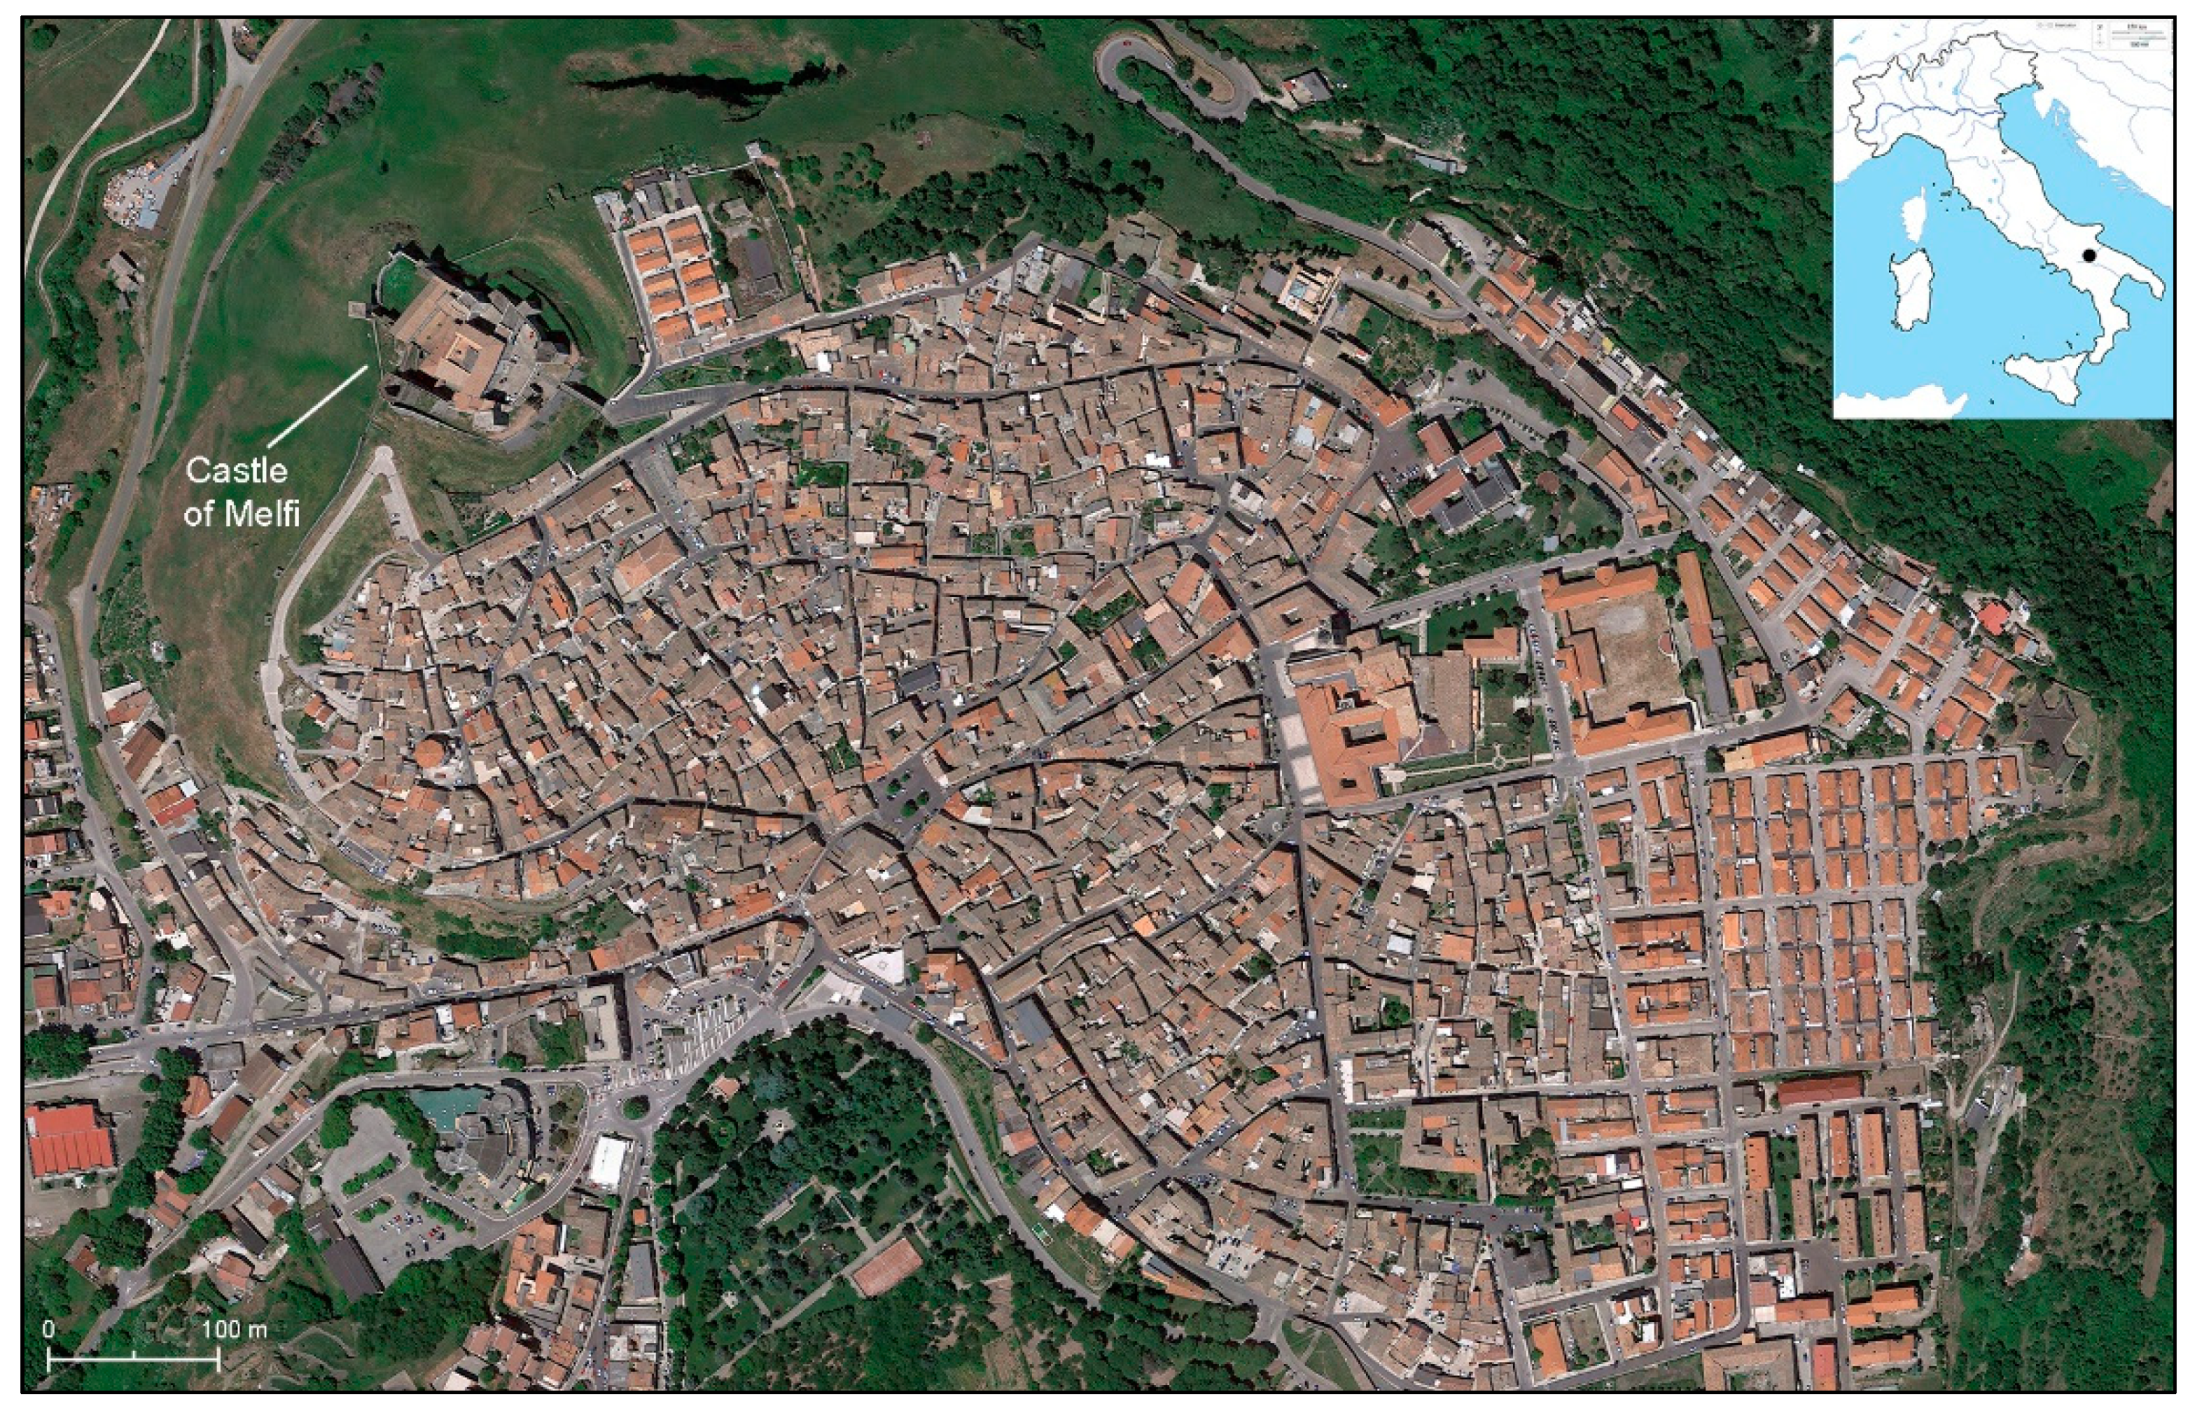
The Castle of Melfi is made up of several buildings modified and added between the Norman age and the twentieth century. With its impressive size, it overlooks the entire town of Melfi from the north-west ridge of the hill (Figure 1) [1]. The castle is encircled by defensive walls with towers and has a wide moat on its south and east sides, but not on its north and west, where the hill slopes abruptly down into the valley of the Melfa river. The building’s original core dates back to the Norman period and was probably built on top of a previous Byzantine castrum between the end of the 11th and the beginning of the 12th century. The castle was expanded during the Frederick era, when it served as the location of the royal archive and treasury as well as the Emperor’s summer residence, where he hosted influential people from the politics and culture of the time. This was, in fact, the place of the Constitutions of Melfi in 1231, the Kingdom of Sicily’s code. The Norman–Swabian castle was significantly strengthened during the Angevin period (13th century) thanks to a new project of the military architect Pierre d’Agincourt. The structural modifications took place between 1277 and 1280: the external walls, the wide moat, and a new perimeter wall with rectangular towers were constructed, giving the castle its current aspect. At this time, the fortress gate opened to the south-west at the beginning of the moat, precisely where the castle walls and the city walls intersect. Subsequently, during the Kingdom of Aragon, the castle underwent additional renovations and was afterwards owned by the aristocratic families of Acciaiuoli, Marzano, and Caracciolo. With the latter, in the 15th century, the process of converting the castle’s main structure into a baronial palace was underway. The Doria family started the modifications in the 16th century and these continued for the next three centuries. This family also constructed the new, wide gate that faces the city from the south; a three-arched stone bridge, once a drawbridge, crosses the deep moat and leads to the Cortile Principale, on which the Palazzo Doria and the 16th-century noble chapel look out.
The 
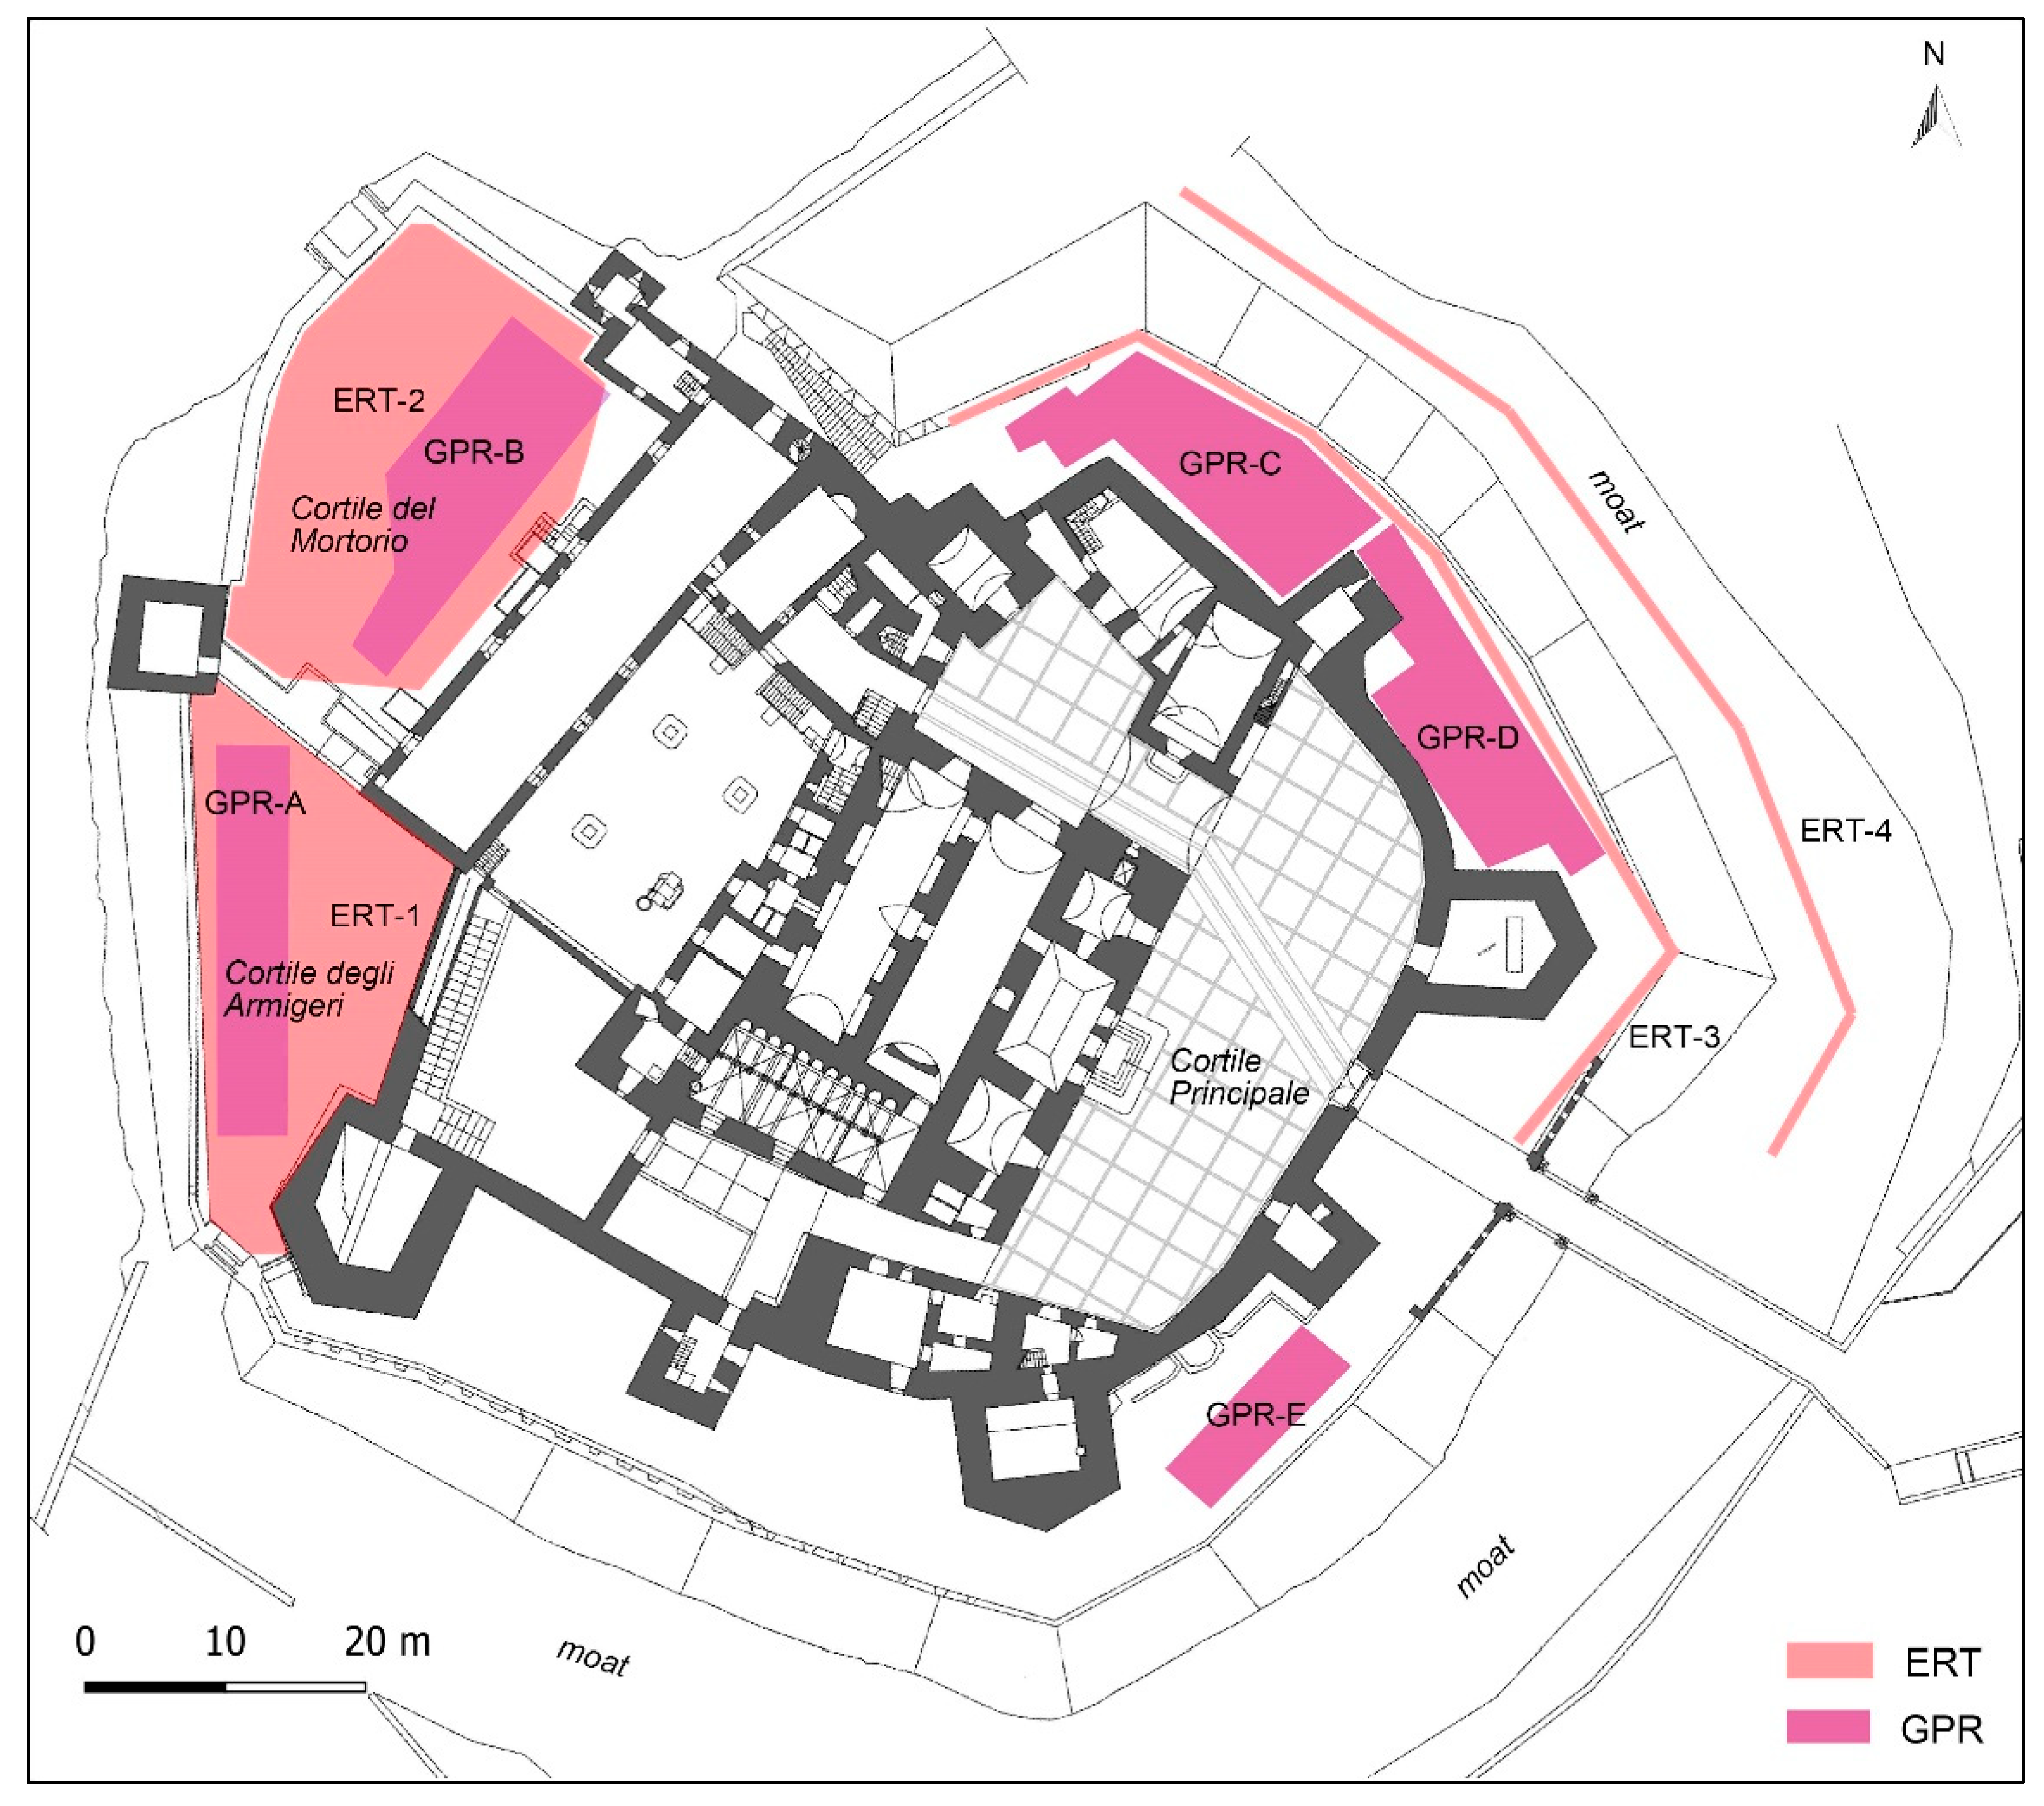
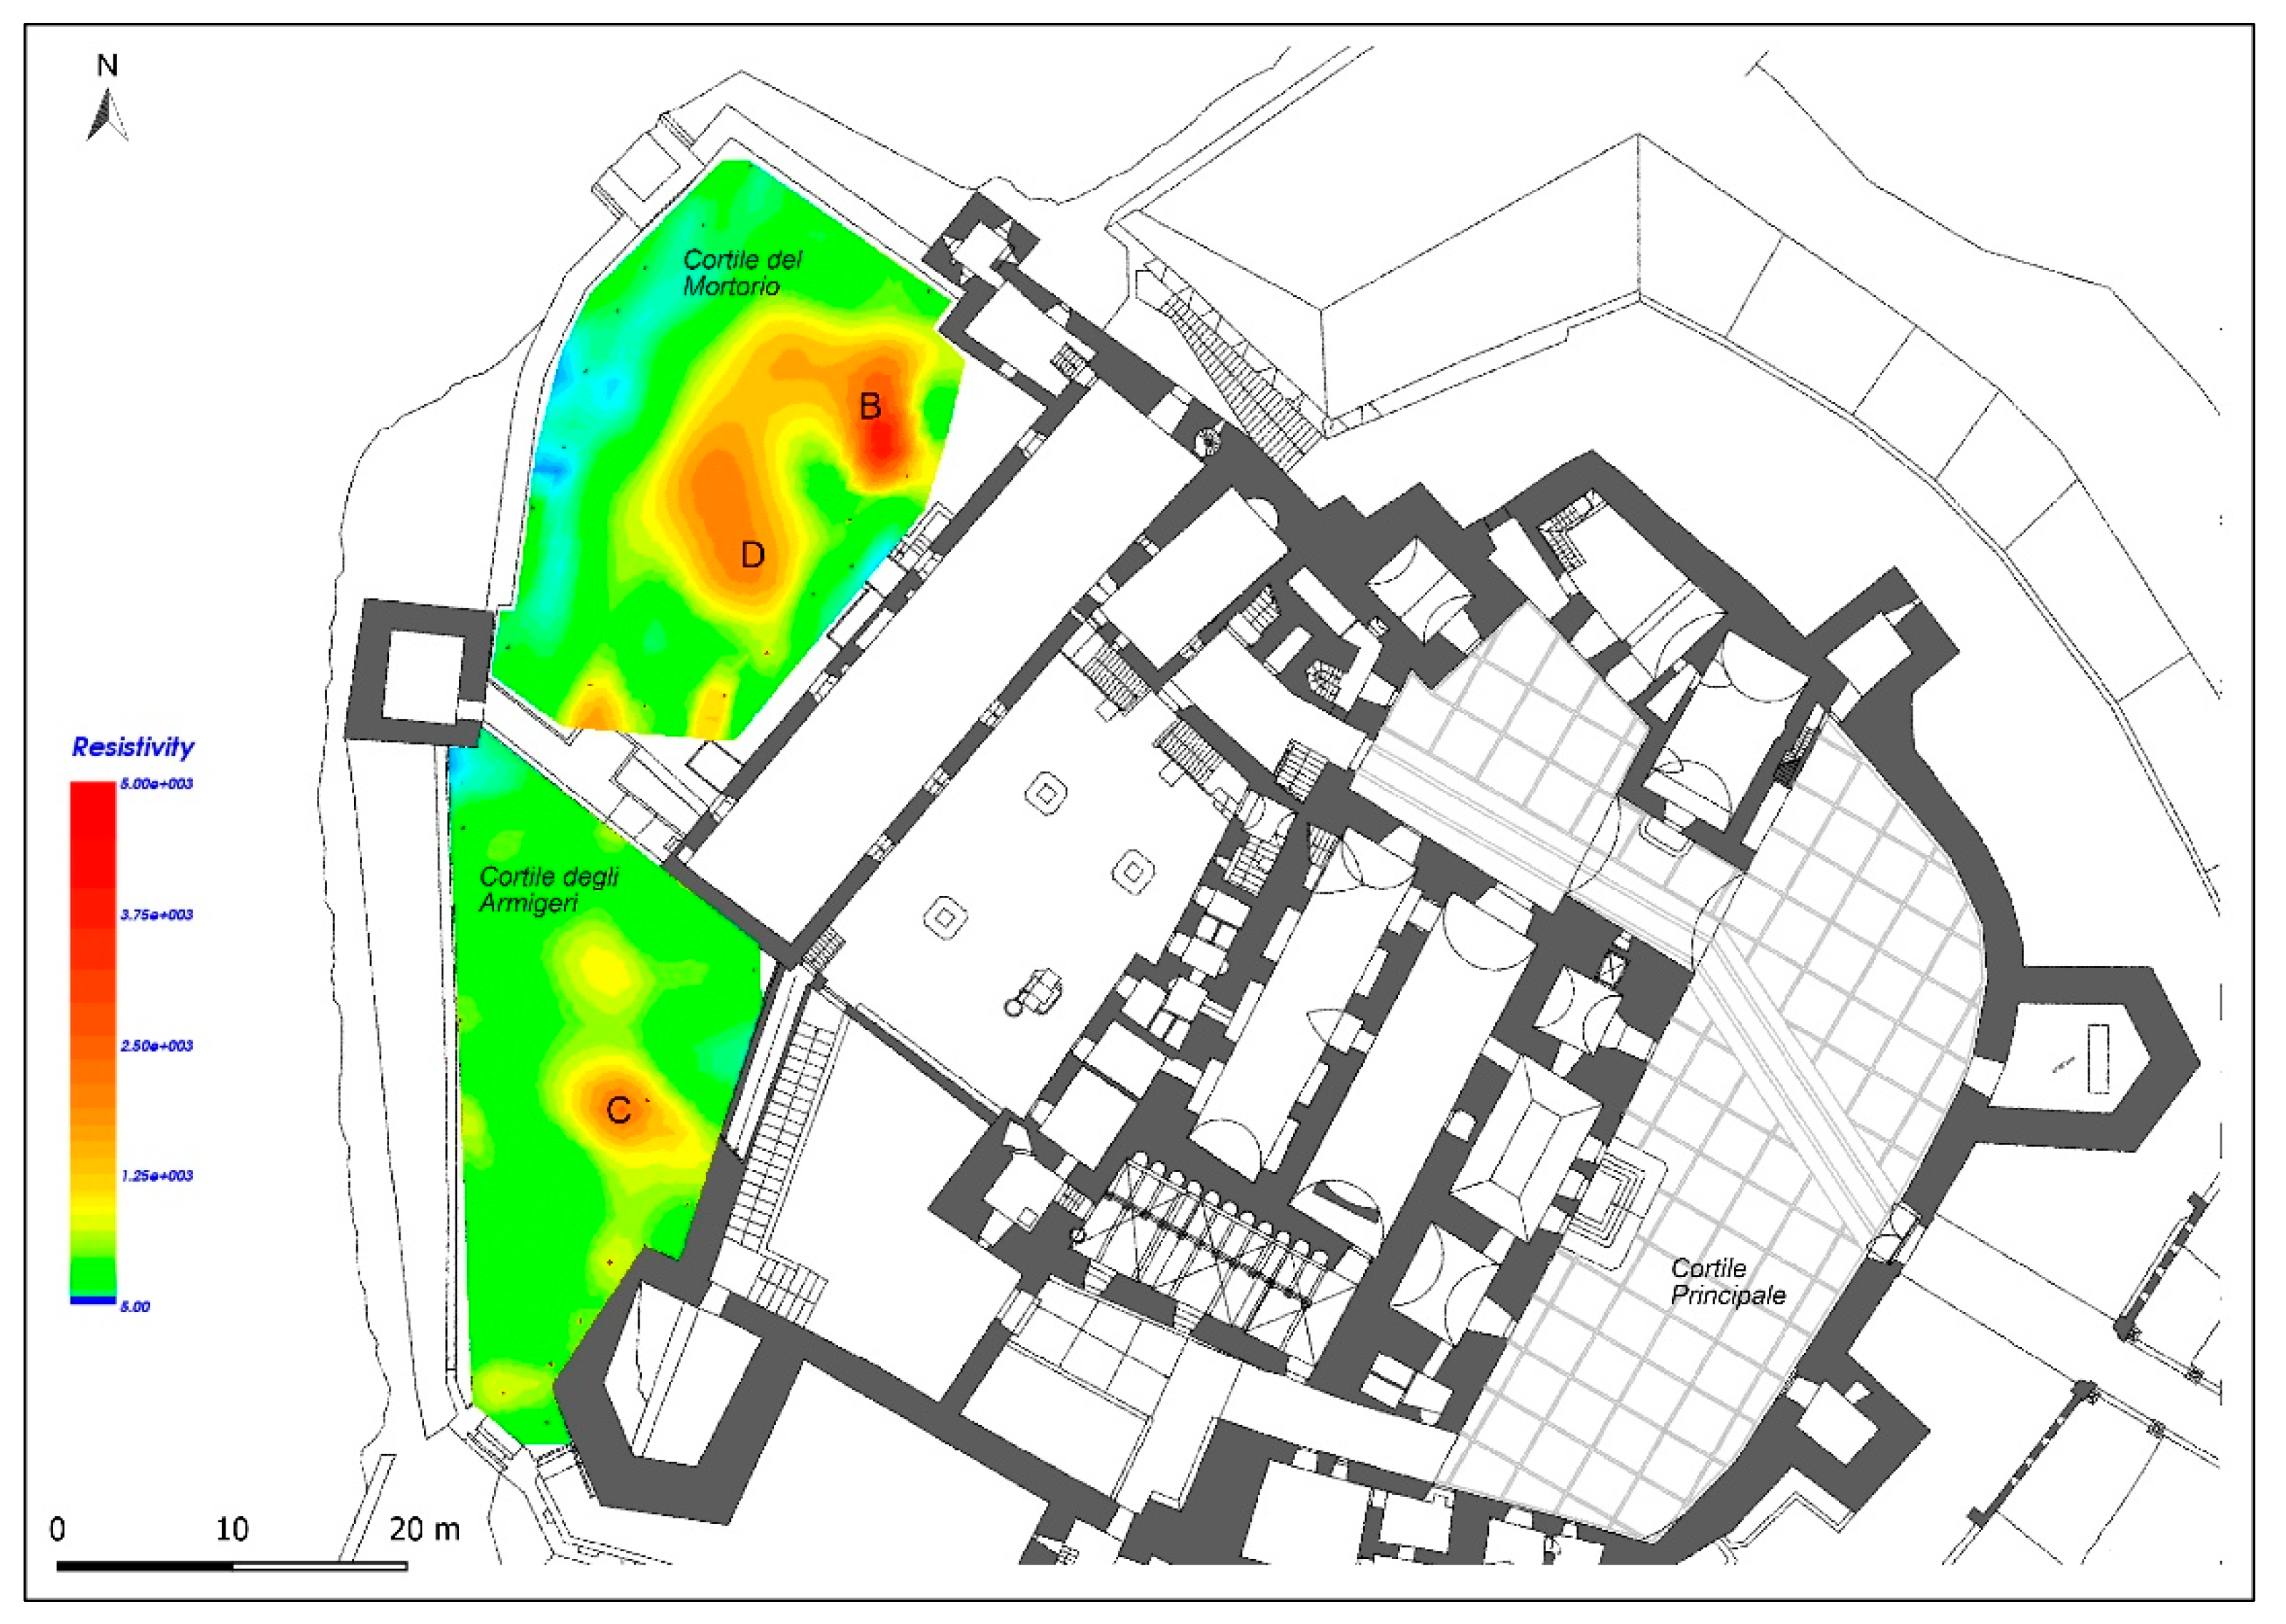
Museo Archeologico Nazionale del Vulture e Melfese “Massimo Pallottino” is currently located in the castle. The Geophysics Lab and the Archaeological Mapping Lab of the Institute for Heritage Science of CNR conducted geophysical investigations using the ground-penetrating radar (GPR) and electrical resistivity tomography (ERT) methods in the two Angevin courtyards located in the exterior of the western sector of the castle (the so-called Cortile degli Armigeri, on whose southern end was the 13th-century entrance, the Cortile del Mortorio) and in the north-eastern sectors of the external walls and moat (Figure 2).
The main focus of this geophysical prospecting is to identify and locate, in a precise and non-invasive way, the presence of possible ancient buried structures in order to better direct both archaeological preventive excavations and preservation work in the castle. Specifically, these interventions will concern the investigation and restoration of the two external courtyards and the arrangement of the entire area of the castle battlements. In this case, geophysical prospecting represents a fundamental non-invasive investigation tool, especially for preventive archaeology, which needs to know the characteristics of the upper layers of the subsoil before carrying out any excavation work. The goal is to minimise the destruction of possible buried archaeological structures otherwise not visible. However, the data obtained are certainly useful to the scientific community in the deeper knowledge of a complex archaeological site such as the Castle of Melfi.
As is typical of many fortresses, this castle stands on the rocky prominence of a hill and occupies a place already previously built. These conditions of continuous occupation and transformation over the centuries make this site suitable for geophysical survey methods that shed new light on a complex archaeological stratigraphy and initiate further investigations.
There are many applications of geophysics in urban areas to highlight the presence of buried structures of archaeological interest [2,3,4,5,6,7,8,9,10,11,12,13,14,15]. Each of these is linked to a particular peculiarity of the survey site and therefore the methodologies used are linked to the particular soil matrix and to the particular type of target to be highlighted.
In the presented case study, the application of the two survey methods was due to the characteristics and conditions of the investigated area. In fact, in some areas, the presence of working debris on the ground prevented the use of GPR on the entire surface (the investigations were, in fact, limited to small areas). The investigations were therefore integrated with the use of the ERT method to overcome these limitations.
The primary purpose remained the identification of possible buried wall structures in the more superficial layers of the soil, and so the use of GPR, and in particular of the 600 MHz antenna, proved to be very efficient; however, the application of individual ERT profiles returned data regarding the consistency of the bedrock on which the fortress was built and was useful to identify the possible presence of cavities or anomalies related to anthropic features.

2. Materials and Methods

Ground-penetrating radar is a high-resolution technique that allows the collection of a large amount of information on vast areas in the first metres of the subsoil, referable to the presence of buried bodies, cavities, structures of archaeological interest, subsoil stratifications, etc. An instrumental radar apparatus operates through the generation of high-frequency impulsive waves (typically between 10 MHz and a few GHz), which are transmitted underground by means of a suitable “transmitting antenna” placed on the surface of the ground. The electromagnetic signal propagates in the medium and undergoes the reflections if it encounters a medium with discontinuity of the electromagnetic parameters. The reflected wave that returns to the surface is recorded by a “receiving antenna”. The captured signal is then transmitted to the control unit, which amplifies it and records it in digital format. By measuring the time interval taken by the pulse to (i) arrive at the buried discontinuity, (ii) reflect, and (iii) return to receiver, the position of the reflecting structure can be traced if the propagation velocity is known [16,17].
This method has the advantage of providing a detailed description of the investigated subsoil in real time. GPR finds excellent uses in resistive soils (empty spaces, gravel, loose sand, etc.), allowing the identification of structures with different “electromagnetic characteristics” compared to the surrounding environment, while it is practically “blind” in soils with high conductivity, in which the absorption of energy by the material itself limits the depth of investigation (for example, in the case of layers of clay, groundwater, or humidity in the subsoil). The physical parameters that influence the propagation of electromagnetic waves in the medium (in this subsoil) are: (i) the electrical conductivity σ (s/m); (ii) the dielectric permittivity ε; and (iii) the magnetic permeability μ [16,17].
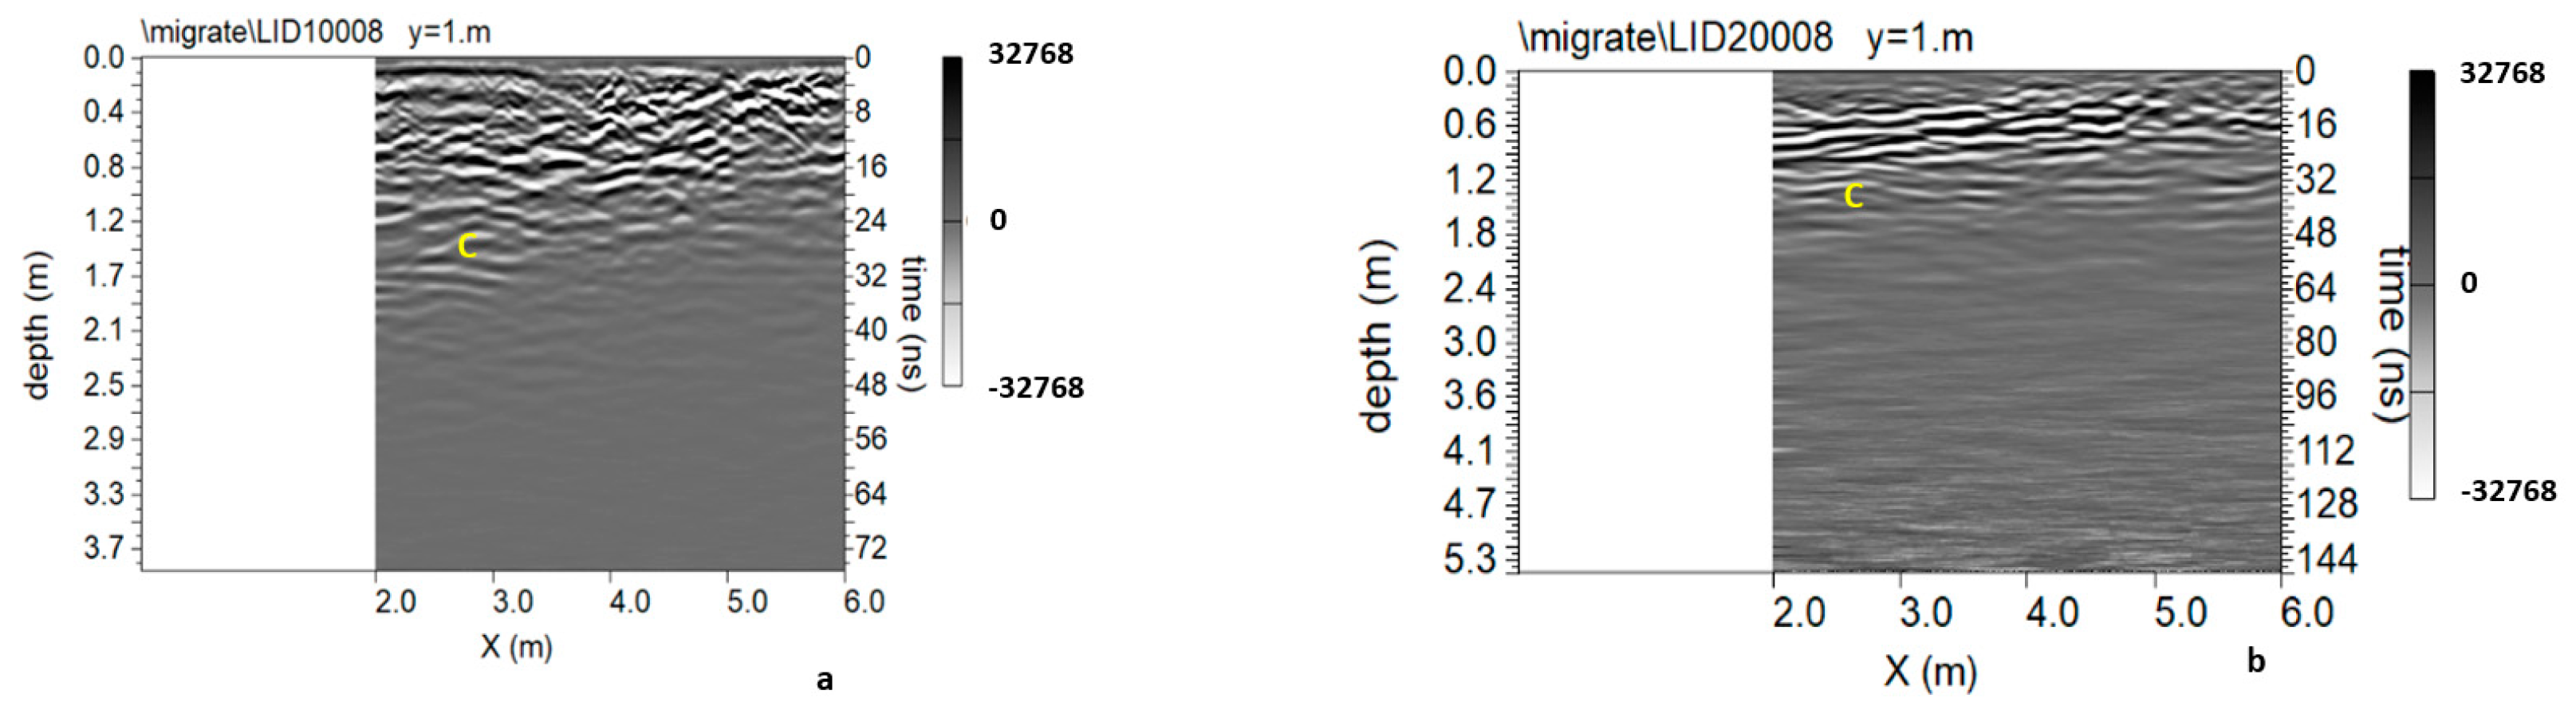
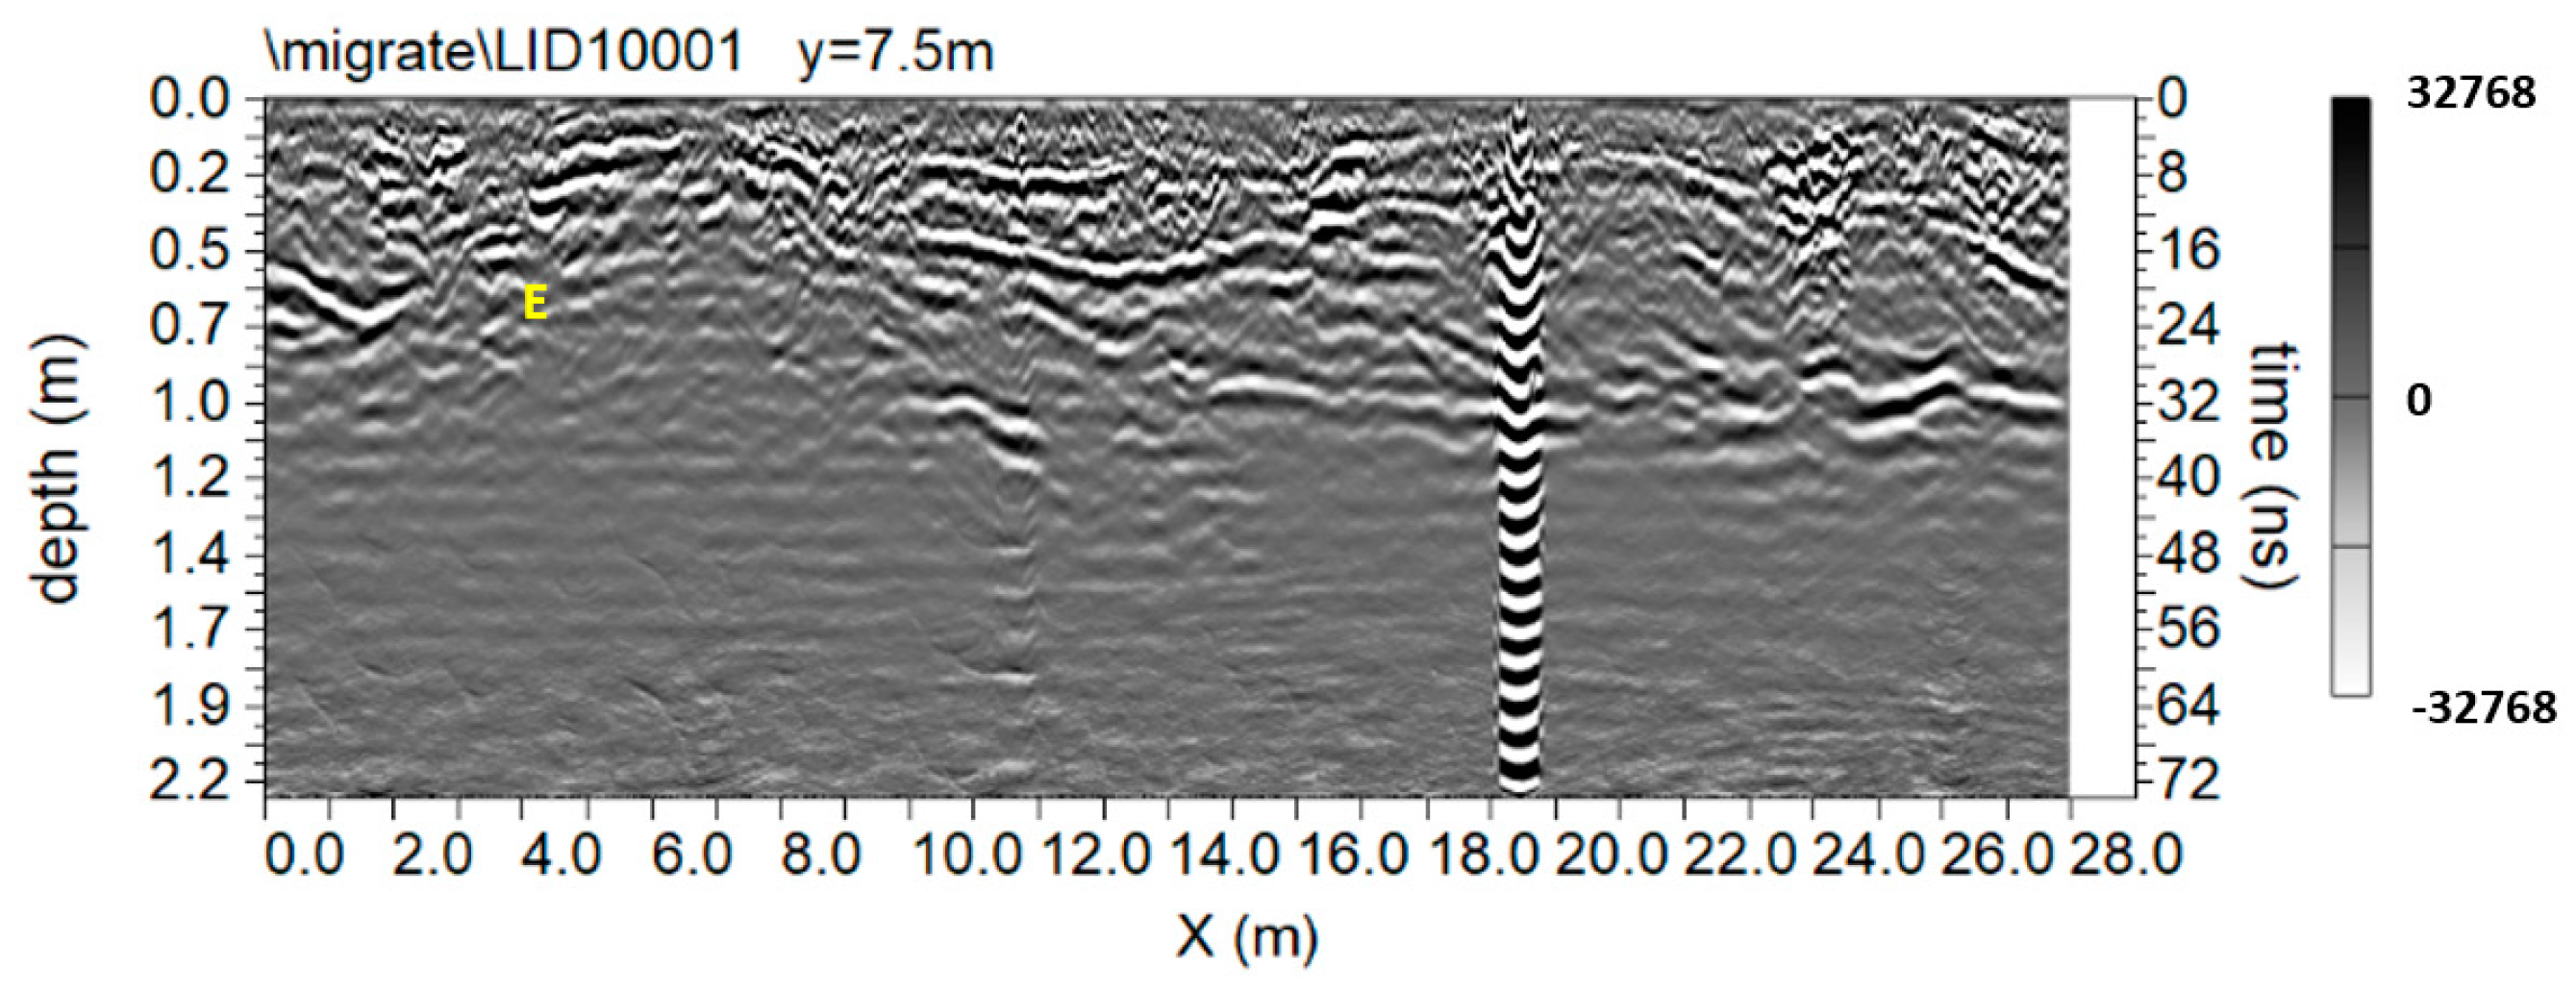
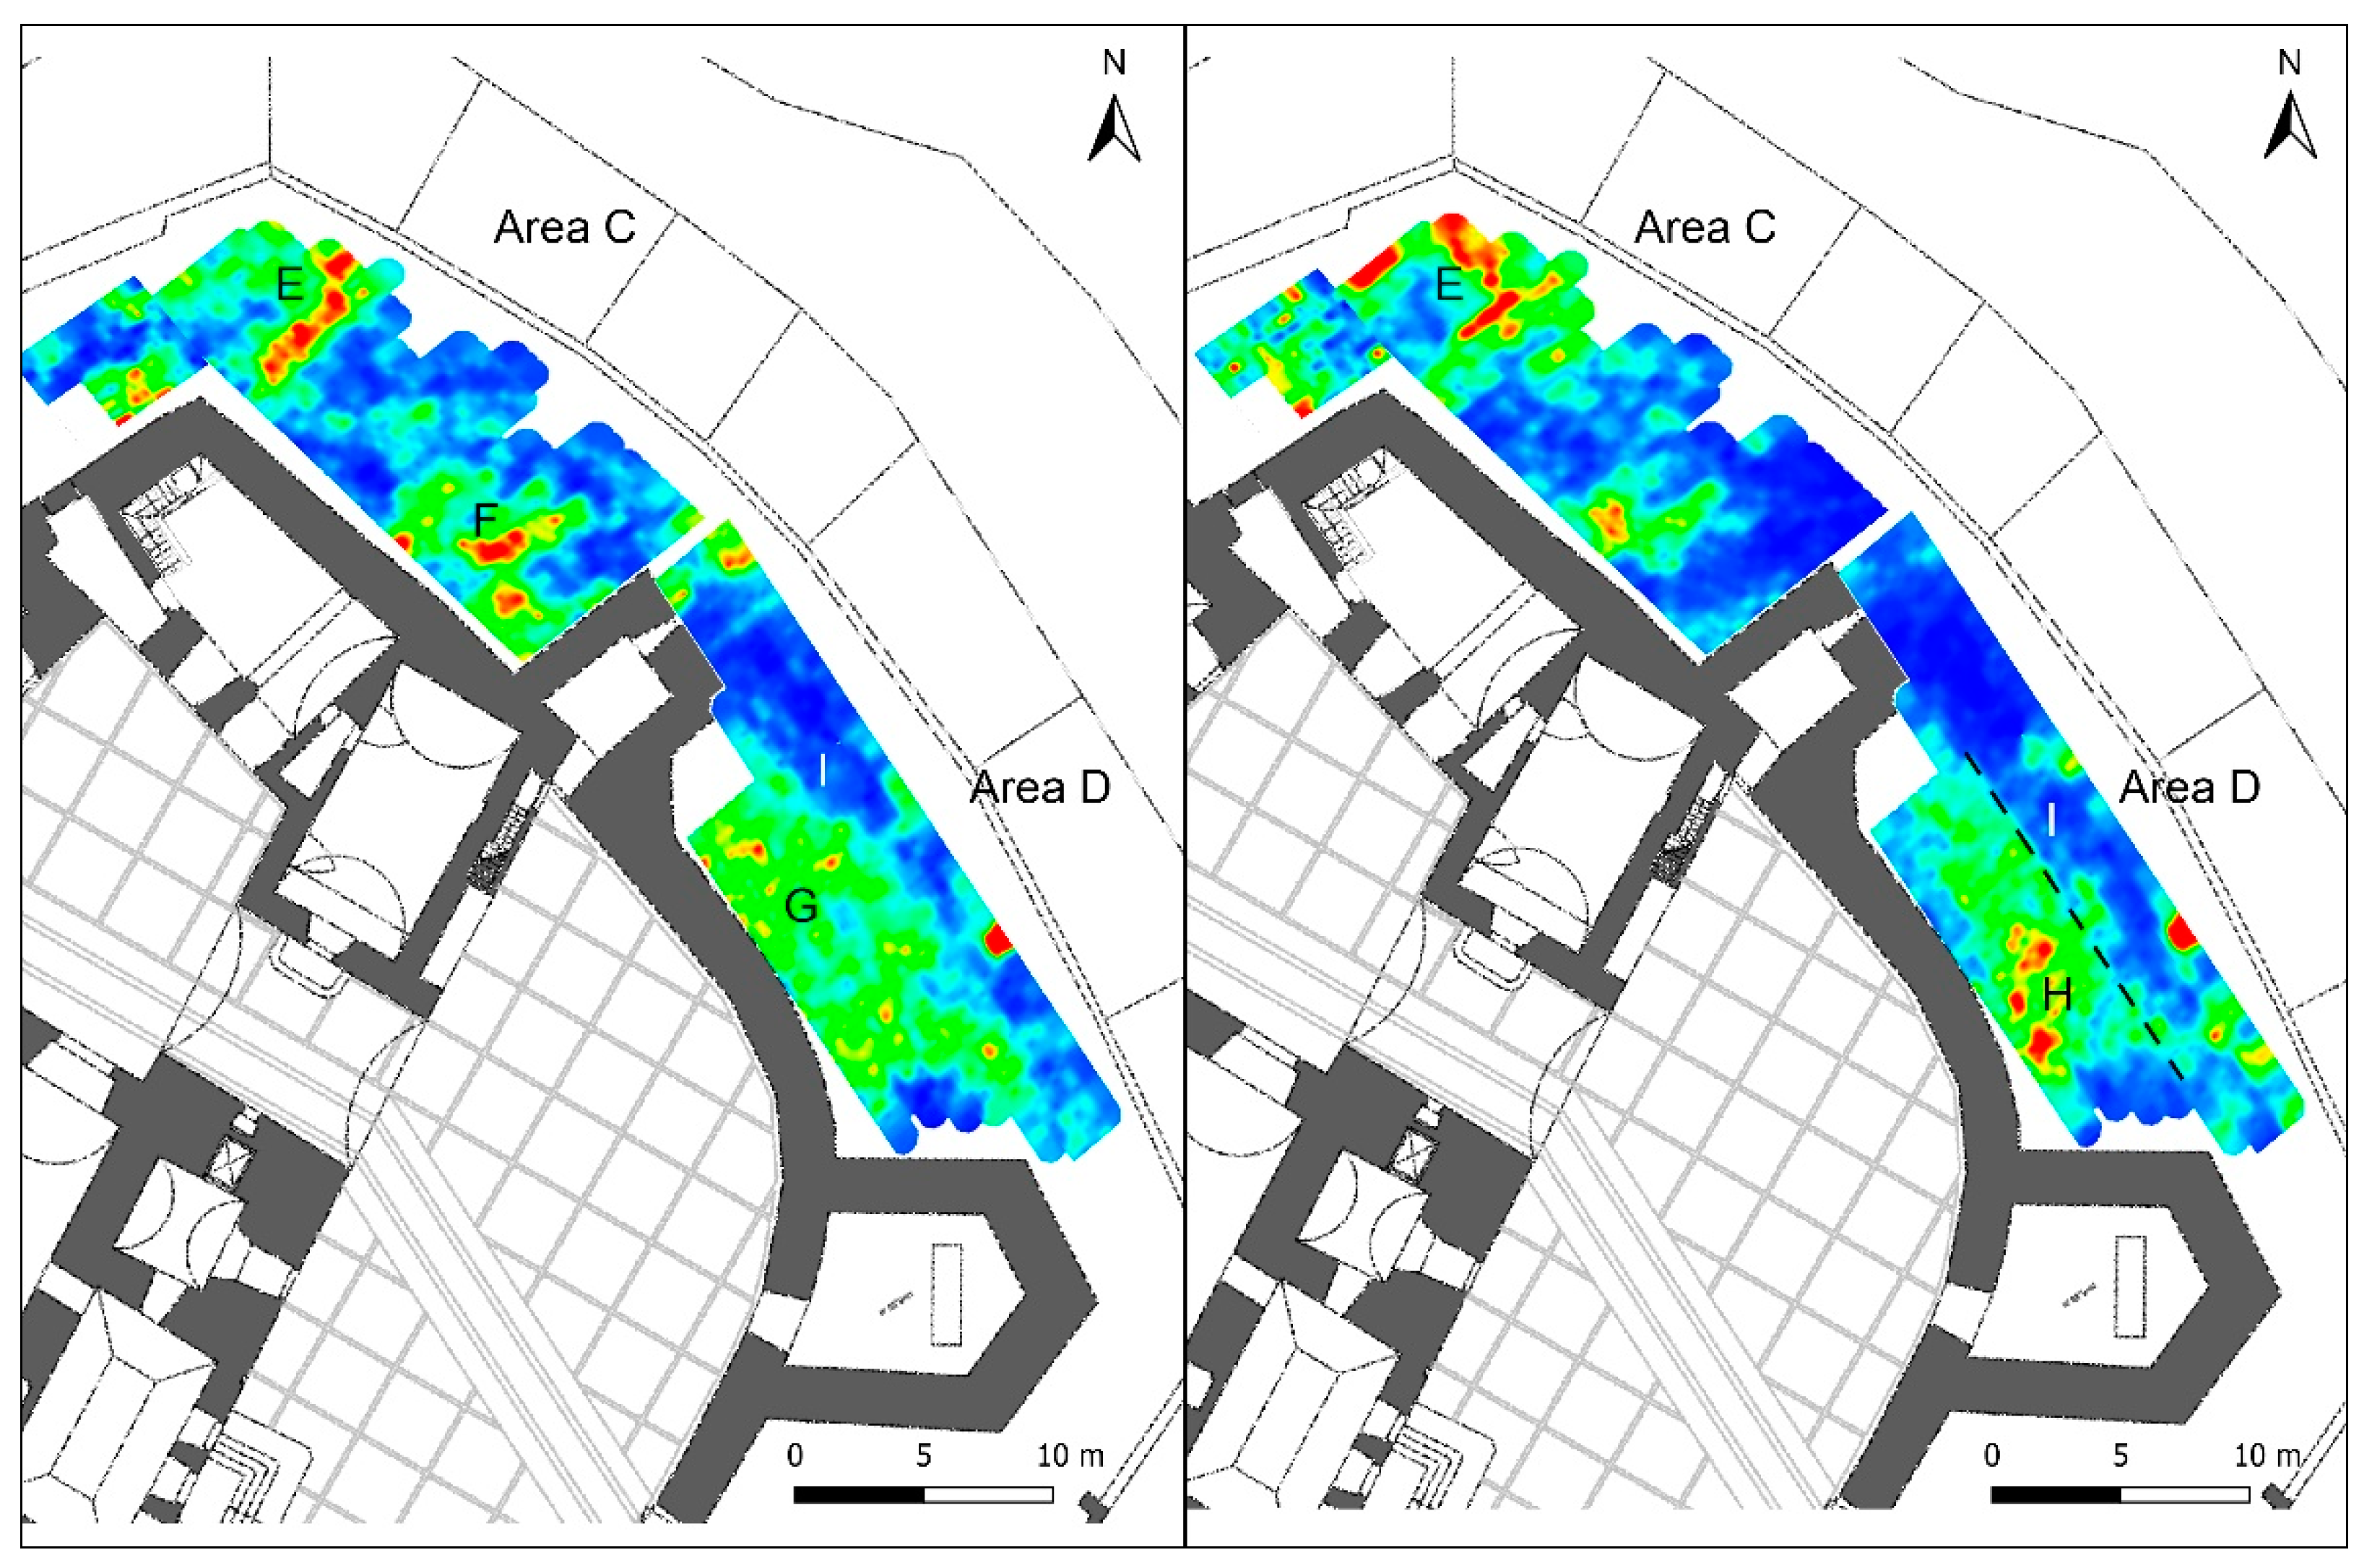
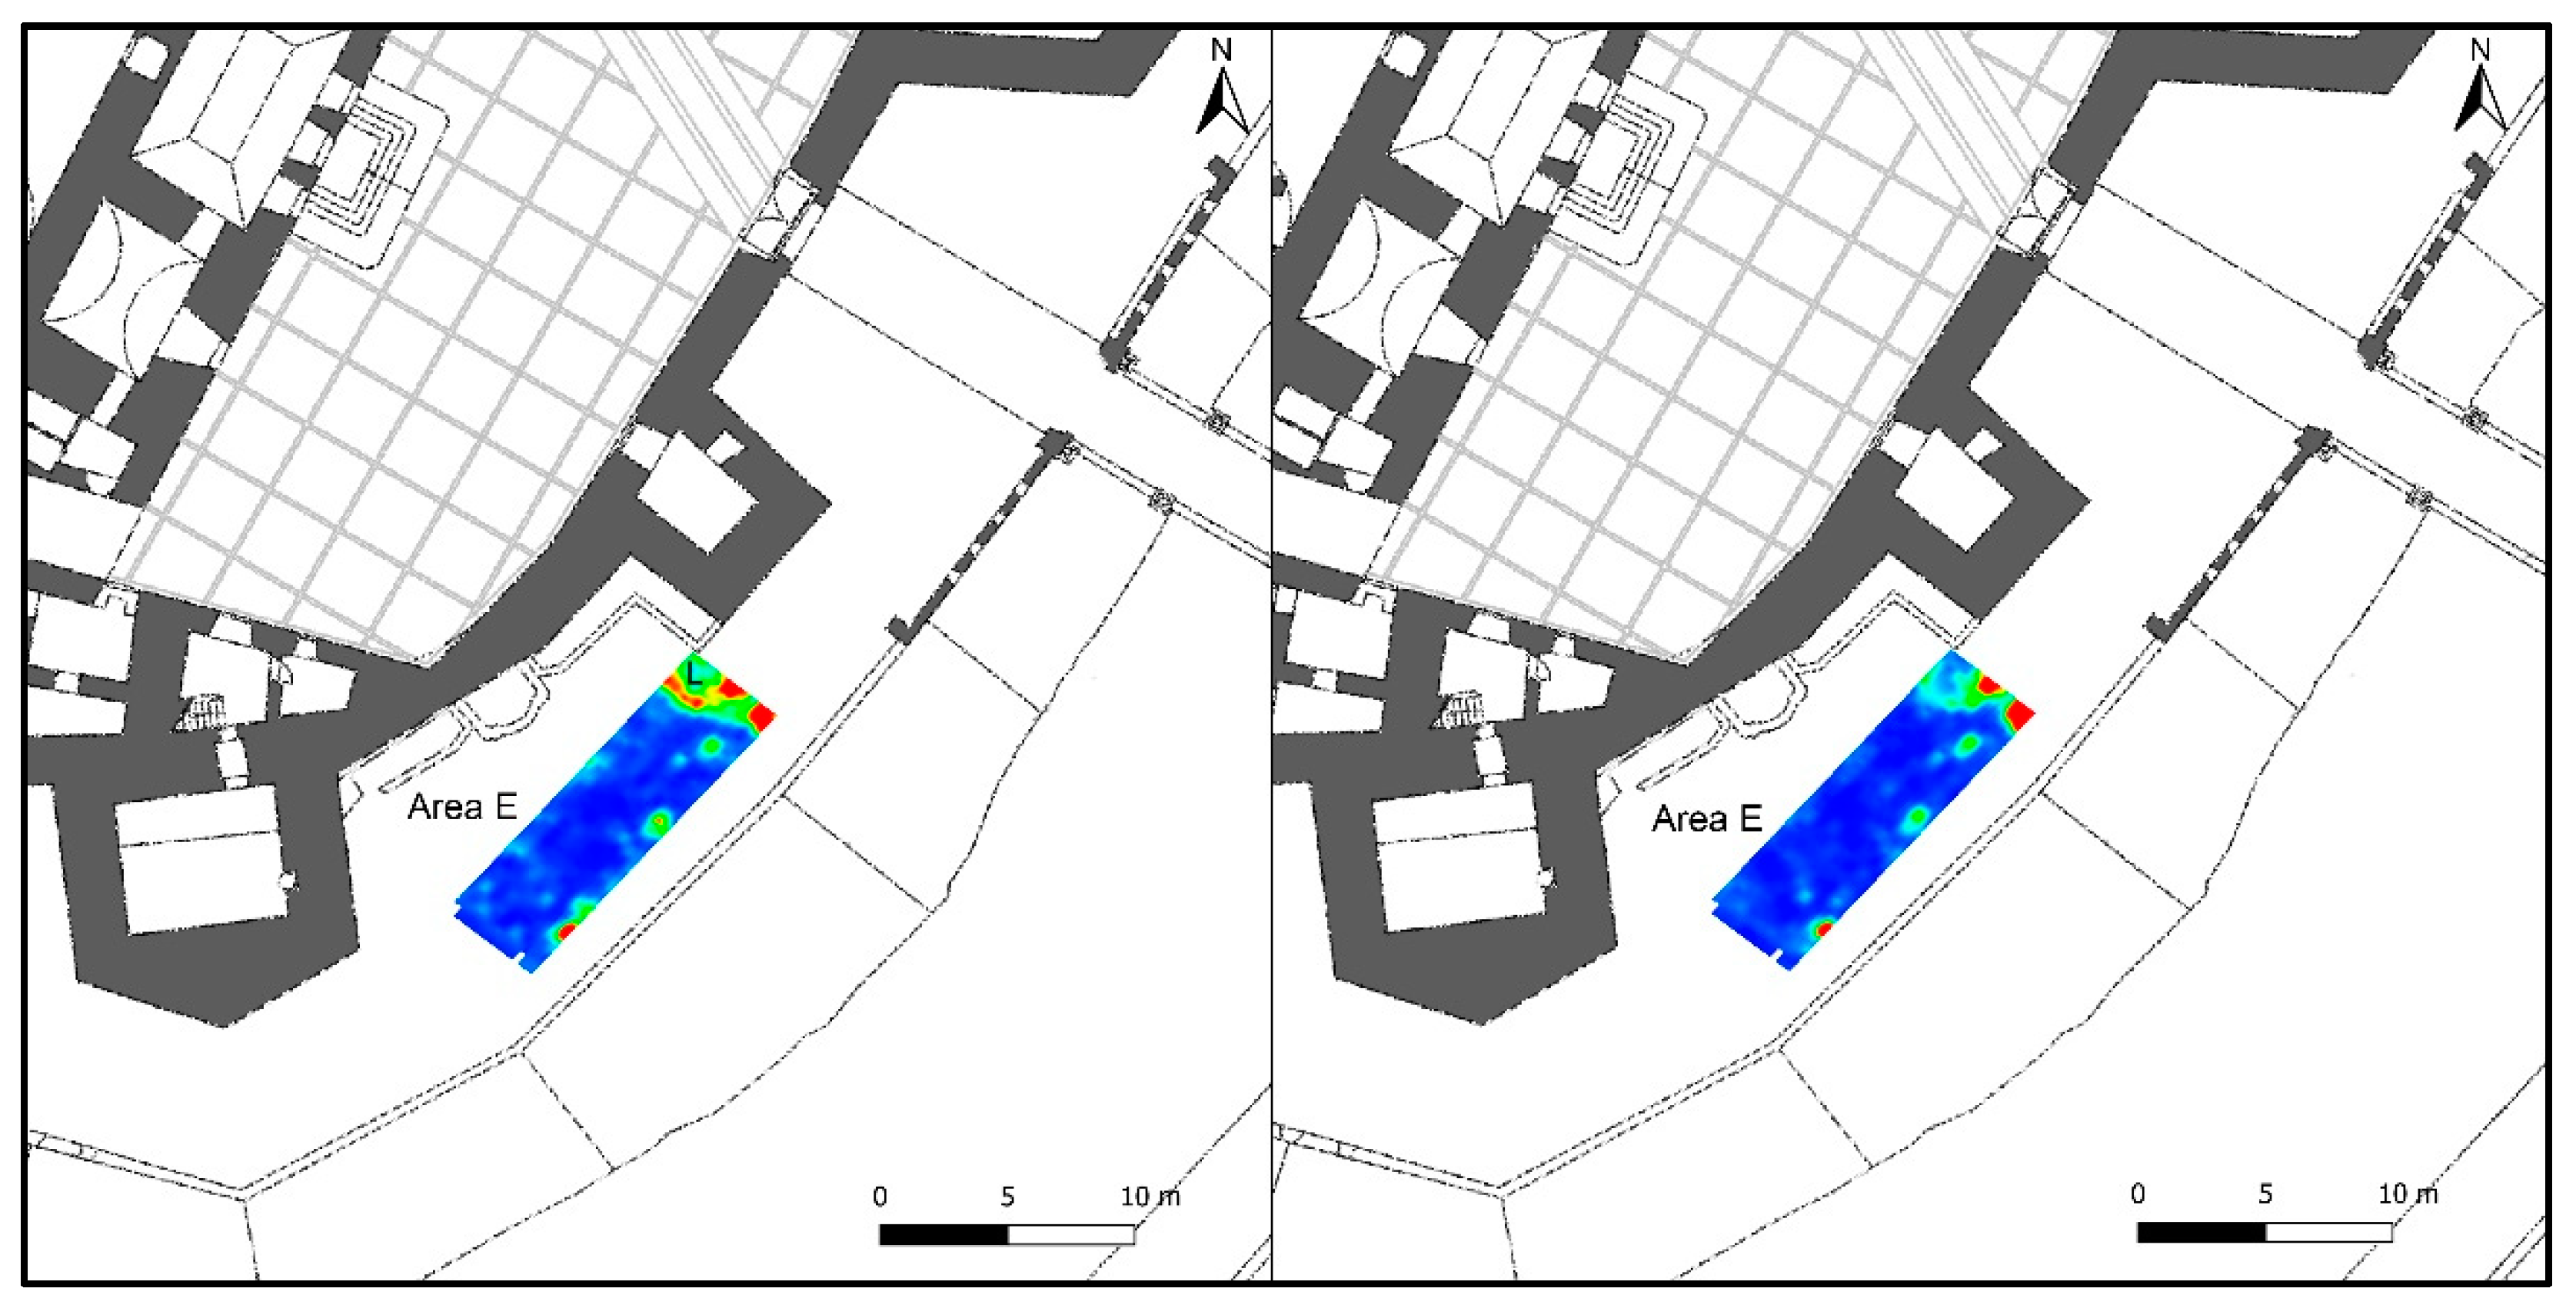
GPR measurements were performed with an IDS Ris Hi-mode system equipped with the dual band antenna at a nominal central frequency of 200–600 MHz. A grid of 0.25 m parallel spaced profiles was performed in the five investigated areas (A, B, C, D, E, for a total of 740 sqm). Each B-scan has a time window of 80 ns (600 MHz antenna) and 120 ns (200 MHz antenna), discretised using 512 samples. The processing of the GPR data consisted of zero timing, background removal, declipping, Kirchoff migration, and bandpass filter. This processing was implemented by means of the GPRSlice code [18]. An average electromagnetic (EM)-wave velocity equal to 0.085 m/ns was evaluated from the shape of the diffraction hyperbolas. Afterwards, the Hilbert transform was applied on the processed data to obtain horizontal depth–time slices. Each slice was retrieved by averaging the data within a time window Δt = 5 ns, which corresponds to a soil thickness of about 20 cm.
The ERT method allows the characterisation of soil from the point of view of the physical parameter electrical resistivity (ρ). The ERT method is based on the circulation of a stationary electric current (continuous or at very low frequency, so that the induction phenomena are negligible) in the subsoil. Material media, in fact, respond to a current flow in a different way, based on the value assumed by the physical parameter of resistivity. Typically, the resistivity that lithotypes offer to the circulation of electric current depends on the interstitial water content, the temperature, the gas content dissolved in the water, and the presence of free ions [16,17,19].
The estimation of the resistivity values is achieved by means of an electric quadripole consisting of two electrodes A and B, called current, and two electrodes M and N, called potential. Through the electrodes A and B, a current of known intensity I is sent into the subsoil, and through the electrodes M and N, the potential difference ΔV is measured. Taken together, the four electrodes constitute the measuring electrode device, which can present different geometries of arrangement on the ground, each characterised by a parameter K, which takes the name “geometric factor”. The relationship between the physical parameters’ electric current (I), potential difference (ΔV), and electric resistivity (ρ) is the well-known Ohm’s law: ρ = K ΔV/I [16,17,19].
By defining ΔV in volts, I in amperes and K in metres, the resistivity ρ is expressed in Ohm m. In reality, what is calculated is an apparent resistivity (ρa), i.e., it is a resistivity value due to the different contributions of the entire subsoil, which will be felt more or less strongly depending on the distance from the measuring device [16,17,19].
The ERT measurement resistivity data were collected using a Syscal Kid Switch device (IRIS Instruments, Orléans, France) supporting 24 electrodes with two reels of 55 m long connecting cable with 5 m maximum separation between the electrodes. The investigations only concerned the two areas corresponding to the entire surfaces of the Cortile degli Armigeri (ERT-1; 433 sqm) and Cortile del Mortorio (ERT-2; 597 sqm) (Figure 2). Special ERT arrays were used to investigate the whole courtyards. The electrodes were distributed in such a way as to assume a snake shape [16,17,19]. A dipole–dipole axial array was used. A roll-along acquisition mode was used. In the dipole–dipole array, the spacing between the current electrode pair, C2–C1, is given as “a”, which is the same as the distance between the potential electrode pair P1–P2. This array has another factor marked “n”, which is the ratio of the distance between the C1 and P1 electrodes to the C2–C1 (or P1–P2) dipole separation “a”. In this array, the “a” spacing is initially kept fixed and the “n” factor is increased from 1 to 2 to 3 until up to about 6 in order to increase the depth of investigation. The measurements usually start with a spacing of 1a between C1 and C2 (the electrodes of current) and between P1 and P2 (the electrodes of potential). The first sequence of measurements is made with a value of 1 for the n factor, followed by n = 2, while keeping the C1–C2 dipole pair spacing fixed at 1a. For successive measurements, the n spacing factor is increased to a maximum value of about 6. To increase the depth of investigation, the spacing of C1–C2 and P1–P2 is increased to 2a and another series of measurements with different values of n is made. The electrode initial separation for all arrays in the x and y directions was 1 m. The dipole–dipole array is very sensitive to horizontal changes in resistivity, and it is effective to map vertical structures as archaeological remains [19,20]. The investigated volumes were processed using the software ErtLab (http://www.geostudiastier.it, accessed on 1 April 2022) that makes use of the Finite Elements algorithm. The smoothness constrain method was used [19,20] with six iterations and an RMS error of 5%. The true resistivity model computed has an investigation depth of 10 m, which guarantees that the inverted true resistivity model is deeper than the expected archaeological structures.

3. Results

3.1. The “Cortile degli Armigeri”

Different GPR anomalies related to wall structures were detected in the Cortile degli Armigeri (area A). An anomalies, presumably relating to the structure complex or to more ancient masonry, were discovered in the area A between depths of 1.6–1.8 m and 2.6–2.8 m (Figure 3, C). Other anomalies were found in the southern part of the measured area, starting from 0.5–0.7 m (Figure 4, A) and increasing to 1.2 m deep. The deeper structures have been documented by GPR at a depth of approximately 2.6–3.0 m from the current level of the courtyard and with a slope to the west.
ERT measurements were also performed, but in this case, the prospecting included the entire area of Cortile degli Armigeri (ERT-1; 433 sq m). This geophysical method also highlighted the presence of anomalies characterised by high resistivity values compatible with the presence of buried structures in the area immediately east of the area investigated with the georadar (Figure 5, B); they were documented at between 0.5 and 2.0 m deep and perhaps the southernmost anomaly (C) may be related to part of those highlighted by the georadar measurements.

3.2. The “Cortile del Mortorio”

In the Cortile del Mortorio (area B), the GPR investigations were carried out in the south-easternmost sector of the courtyard (213 sqm). Some anomalies relating to wall structures can already be detected on a large portion of the investigated surface, at a shallow depth (0.3–0.5 m), immediately beneath the sixteenth-century paving that is partially visible on the surface. In the northern portion of the investigated area, between a depth of 0.6–0.8 m and 1.8–2.0 m, a concentration of anomalies, most probably related to wall structures, were identified (Figure 4, B). Other interesting anomalies pertinent to buried structures were then noted in the eastern portion of the southern sector of the investigated area. They are at a depth between 2.2–2.4 and 3.0 m (Figure 4, D), probably on the top of the bedrock, which in this portion of the courtyard appears to be 2.7–3.0 m deep.
The ERT measurements carried out in this courtyard (ERT-2; 597 sqm) documented anomalies with high resistivity values placed at depths between 0.5 and 3.0 m, compatible with those highlighted by GPR and indicative of potential buried wall structures (Figure 5, B and D). Furthermore, these ERT measurements have shown that there are no anomalies related to buried structures in the western part of the Cortile del Mortorio beyond a wall recently brought to light by archaeological excavations and that delimits to the west the area A investigated with GPR. On the other hand, anomalies with low resistivity values are noted, attributable to a not-very-compact filling soil.

3.3. External Wall Area

The GPR measurements also revealed the presence of buried structures in the area outside the walls (Figure 2), between these fortifications and the moat, in the whole north-eastern sector (C–D), and in a small portion of the southern sector (E).
In area C, very clear anomalies are detected close to the northernmost corner of the fortification, starting from 0.5–0.7 m (Figure 6) and up to 1.60–1.80 m deep. In the depth slices, these anomalies, which are related to possible wall structures, show a rather regular shape, especially in the deeper layers of the subsoil (1.50–1.80 m) and appear to enclose a rectangular space of 9 × 4 m (potentially an earlier tower) with a NE–SW orientation (Figure 7, E). Other anomalies (possibly wall structures) are visible in the same area, but a little further to the SE, at a depth between 0.7–0.8 m and 1.20–1.40 m (Figure 7, F).
In area D, two very different aspects of the subsoil are clearly highlighted and are constant at depths between 0.20 m and 1 m. The south-western strip of the area (specifically the sector between the two towers of the castle) shows a large anomaly with a rather homogeneous distribution (Figure 7, G); it seems to be attributable to layers of quite compact soil. In the same sector of this area, only some anomalies seem to have a significant concentration in the central part and at depths of 1 m (Figure 7, H). The north-eastern strip of the same area has a very different and more uniform appearance (Figure 7, I). It is most likely distinguished by the presence of very loose soil, which could fill a moat; in this regard, it is important to highlight that, at a depth of about 1 m, the limit between this anomaly and the anomaly named “G” is very regular (Figure 7, black dashed line).
In area E, the GPR measurements only highlighted the presence of anomalies at the north-eastern end of the investigated area, very close to a tower. The anomalies are related to possible wall structures placed at a depth between 0.90 and 1.30 m. In particular, they seem to define the corner of a quadrangular space (Figure 8, L).
Lastly, the measurements of two ERT single profiles, approximately 92 m long, were performed at top of the north-eastern sector of the external walls (ERT-3), just close to areas C and D, and along the longitudinal axis of the underlying moat (ERT-4) (Figure 2). The first one documented, in the middle, at a depth of about 2.5 m, very high resistivity values (Figure 9, A), higher than 11,500 ohms, corresponding to the likely presence of a natural void in the bedrock, according to the characteristics and the shape of the geophysical anomaly; in the remaining portion of the profile, there are anomalies suggestive of a somewhat fractured bedrock, filled with highly conductive materials. The ERT-4 profile also revealed that at the bottom of the moat, there is a layer of soil with a thickness ranging from 1 to 3 m, which covers the rocky bank (Figure 10, A).

4. Conclusions

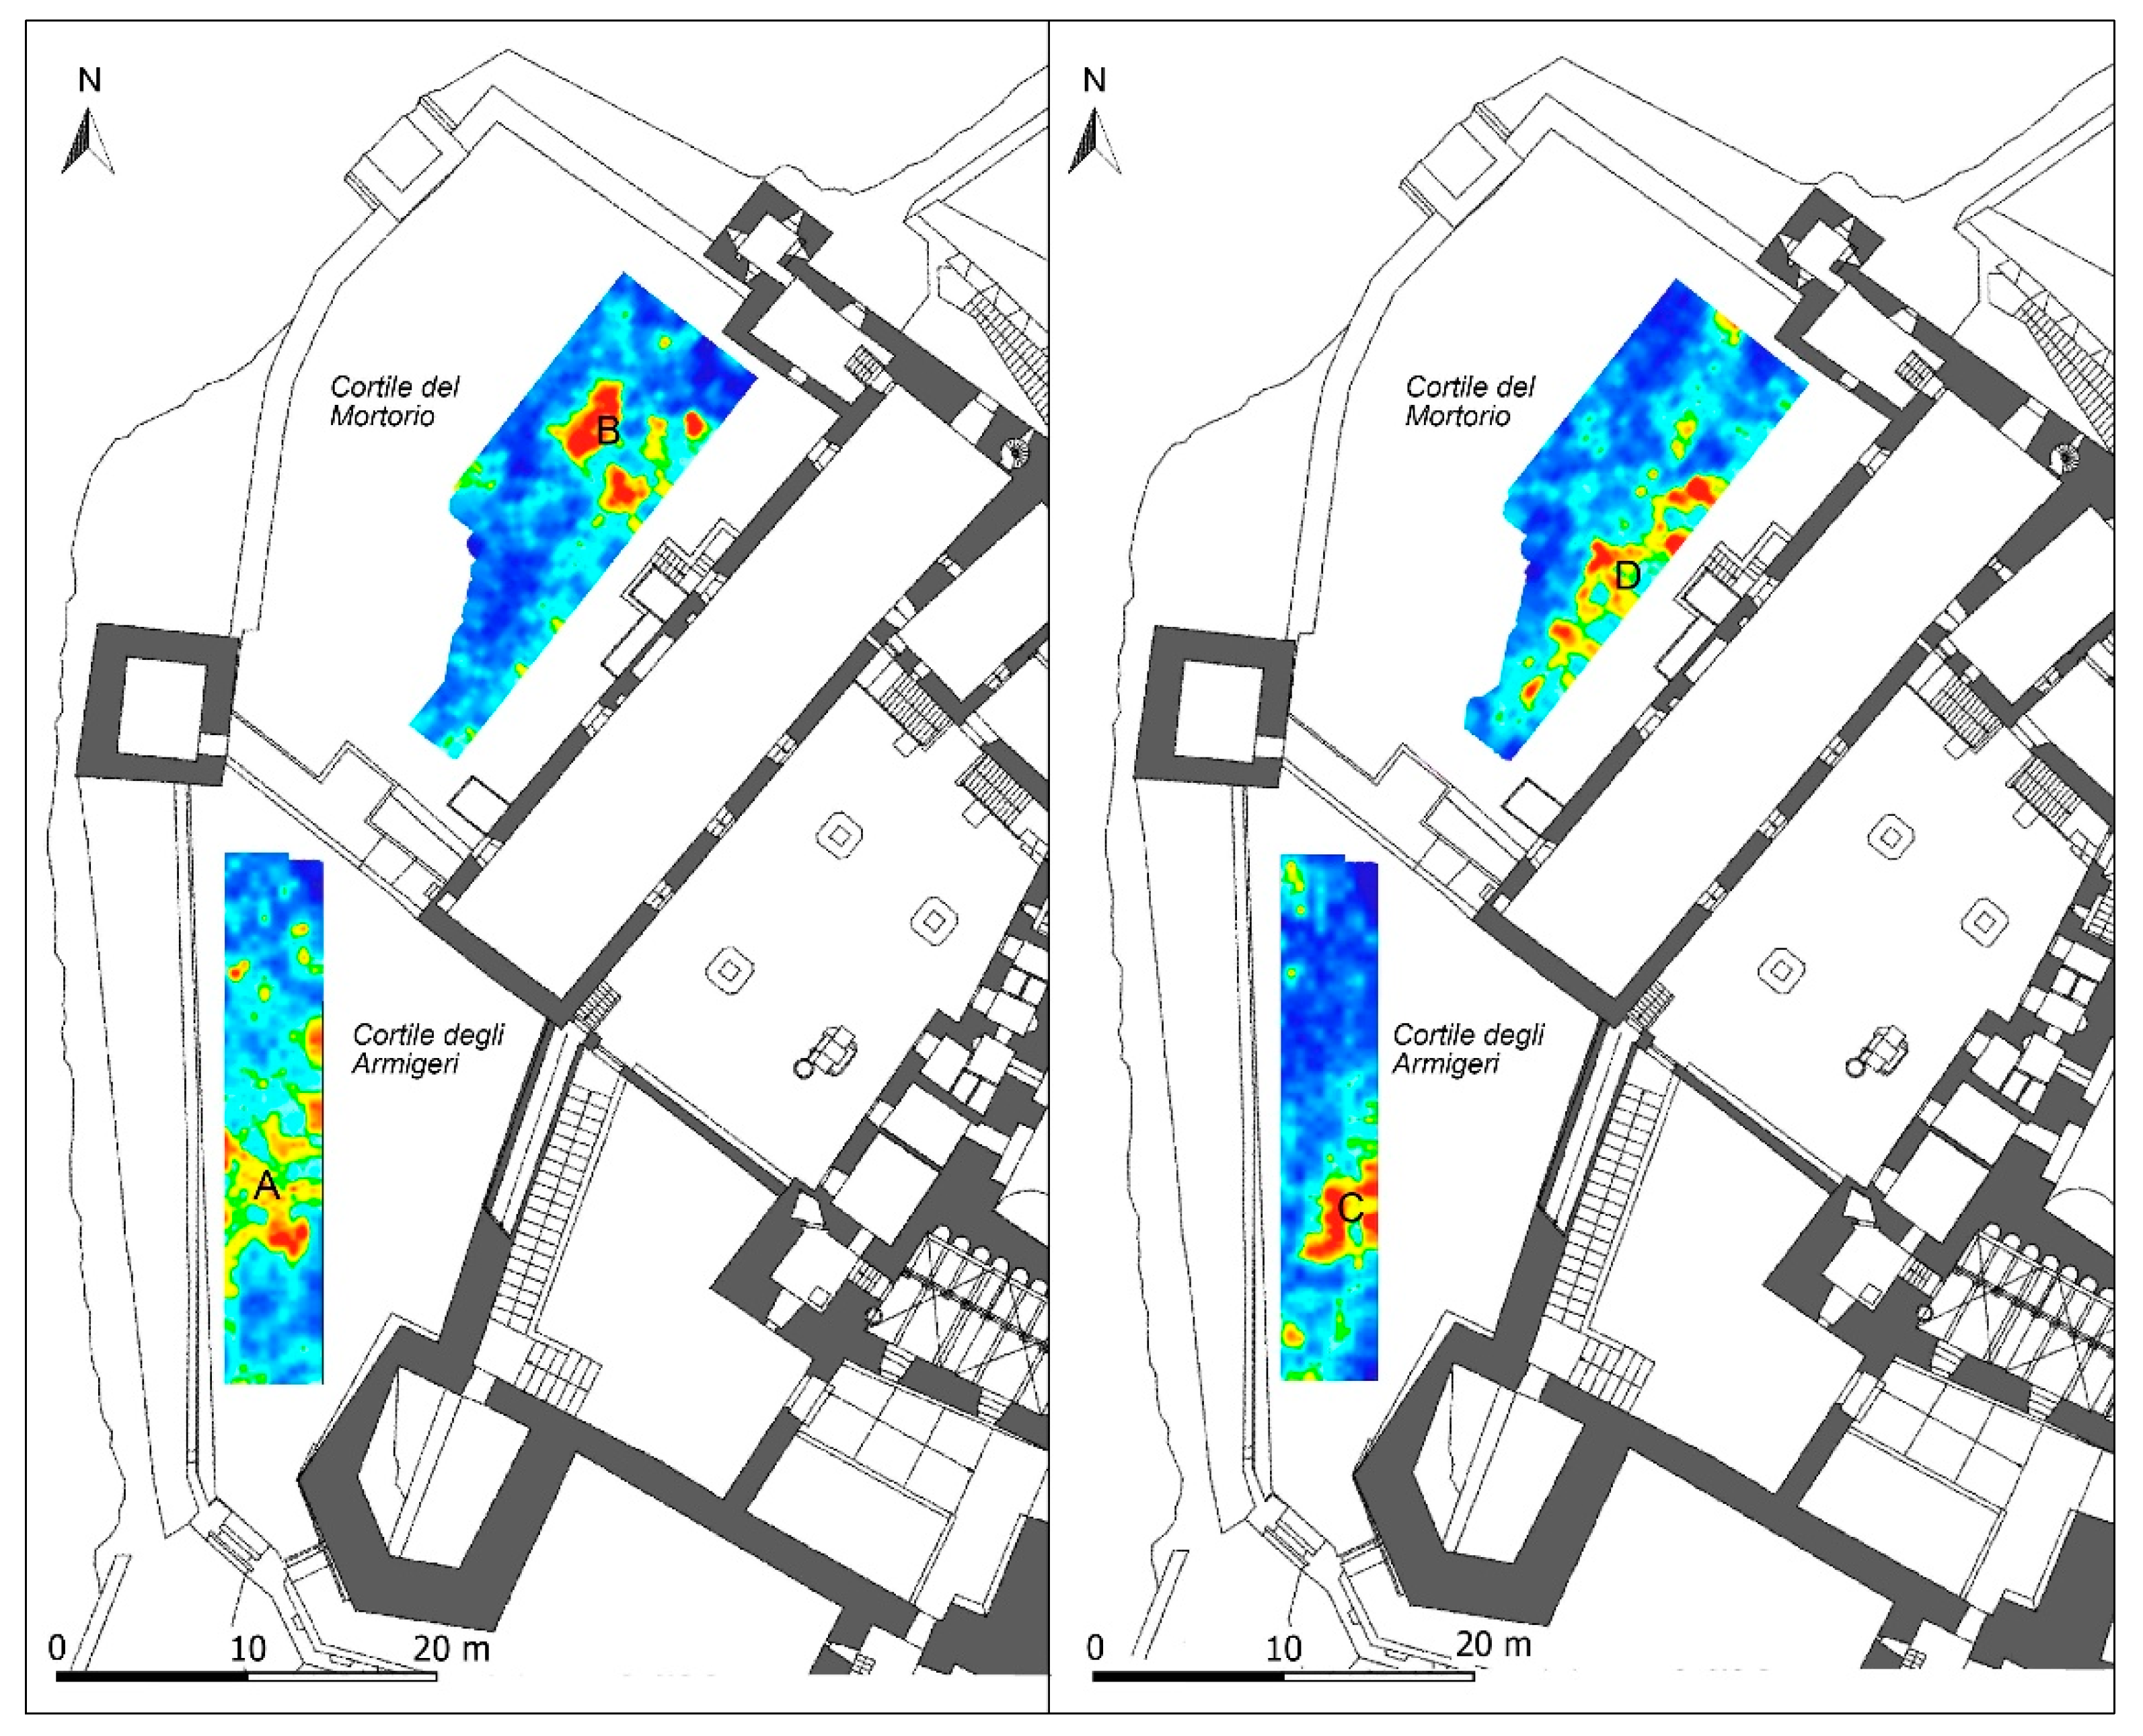
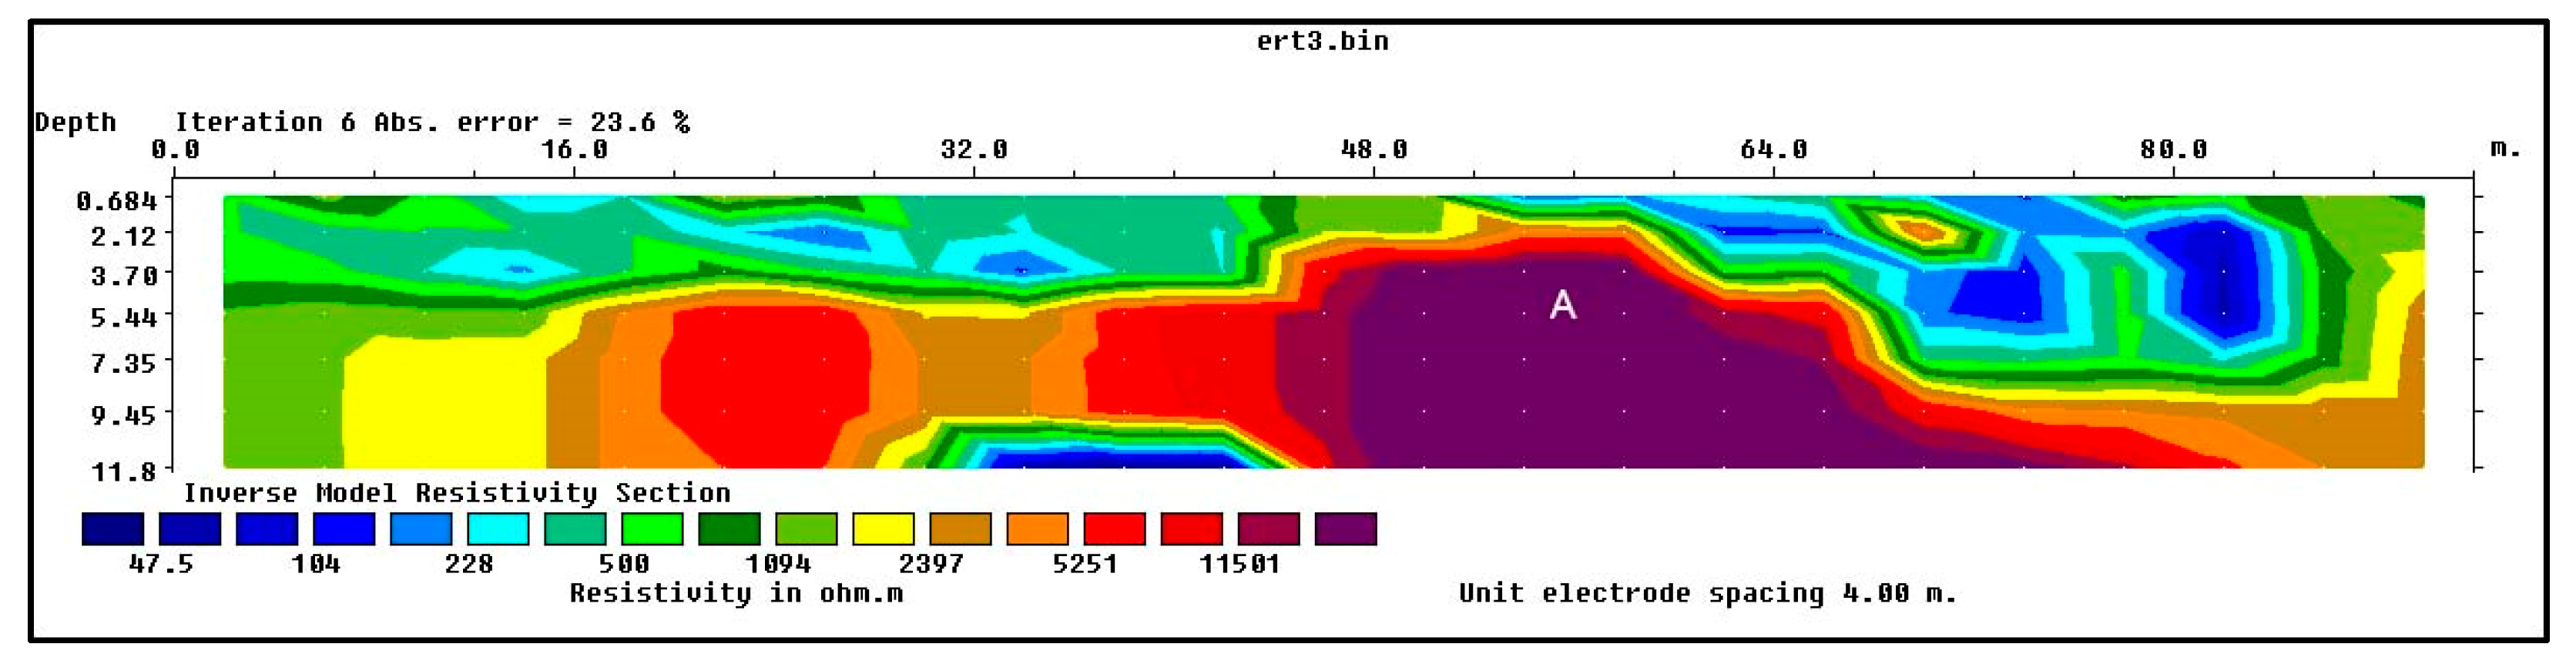
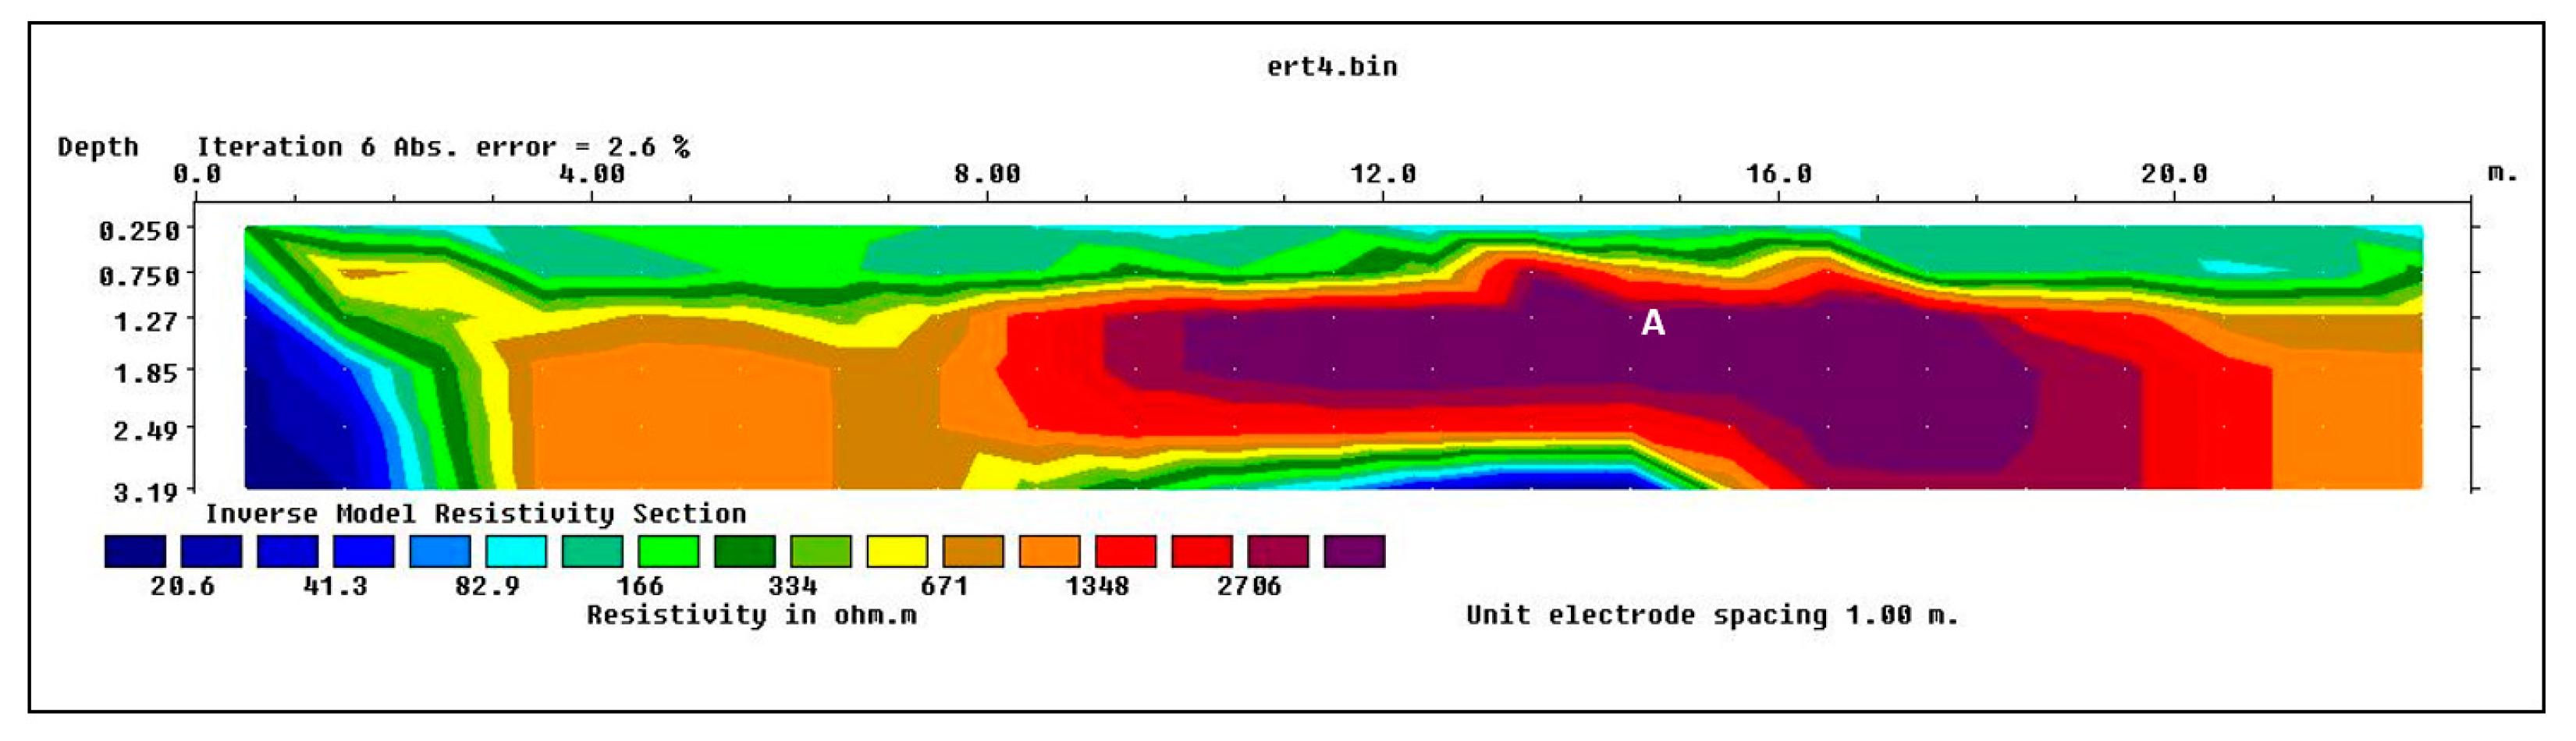
The results obtained by the GPR and ERT measurements carried out in the Castle of Melfi are presented in this paper. These integrated geophysical investigations were conducted inside the two courtyards located in the westernmost sector of the castle, the Cortile degli Armigeri and the Cortile del Mortorio, outside the main fortress on the north-eastern and south-eastern ramparts, and in the external moat. Additionally, two separate ERT profiles were measured on the north-eastern external wall area and in the underlying section of the moat, documenting the depth and characteristics of the bedrock.
This study demonstrated the potency of the combined geophysical methods for locating anomalies that could be attributed to anthropogenic features. The geophysical prospecting indicated the presence of anomalies in the first layers of the subsoil, but which overall persist to deeper levels beyond 1.50 m. They are pertinent to buried wall structures that can be linked to the medieval phases of the castle, the initial nucleus of which goes back to the Norman period with subsequent Frederick, Angevin, and Aragonese extensions. These preliminary results add value to the available bibliographic data on the castle and its various construction phases. The presence of possible wall structures below the courtyards suggest that the northern and eastern external areas are those with the greatest architectural transformations, perhaps because they are the only sectors already naturally defended and therefore not surrounded by a moat; it is possible that the moat represented a physical limit that prevented substantial transformations in the southern sector. Only the archaeological excavations that will take place soon will be able to explore these preliminary observations by giving specific information on the typology and chronology of the structures, thus developing a broader historical significance in the context of the site.

Author Contributions

Methodology, G.L., L.D.G. and D.F.B.; software, G.L.; validation, G.L. and G.S.; formal analysis, G.L., I.M., D.F.B., L.D.G., I.F., F.G. and G.S.; investigation, G.L., I.M., D.F.B., L.D.G., I.F., F.G. and G.S.; data curation, G.L.; writing—original draft preparation, I.M, G.L. and G.S.; visualisation, G.L., I.M., D.F.B., L.D.G., I.F., F.G. and G.S.; supervision, G.L. and G.S. All authors have read and agreed to the published version of the manuscript.

Funding

This research received no external funding.

Data Availability Statement

The data presented in this study are available on request from the corresponding author.

Acknowledgments

The authors thank the Direction the Museo Archeologico Nazionale del Vulture e Melfese “Massimo Pallottino” for the authorisation to carry out the geophysical investigations.

Conflicts of Interest

The authors declare no conflict of interest.

References

  1. Levita, M. Il Castello di Melfi: Storia e Architettura; Adda: Bari, Italy, 2008. [Google Scholar]
  2. Bellanova, J.; Calamita, G.; Catapano, I.; Ciucci, A.; Cornacchia, C.; Gennarelli, G.; Giocoli, A.; Fisangher, F.; Ludeno, G.; Morelli, G.; et al. GPR and ERT Investigations in Urban Areas: The Case-Study of Matera (Southern Italy). Remote Sens. 2020, 12, 1879. [Google Scholar] [CrossRef]
  3. Masini, N.; Capozzoli, L.; Chen, P.; Chen, F.; Romano, G.; Lu, P.; Tang, P.; Sileo, M.; Ge, Q.; Lasaponara, R. Towards an Operational Use of Geophysics for Archaeology in Henan (China): Methodological Approach and Results in Kaifeng. Remote Sens. 2017, 9, 809. [Google Scholar] [CrossRef]
  4. Deiana, R.; Previato, C. Geophysical Surveys for Archaeological Research in Urban Areas: The Case of the Roman Theatre in Padua. Heritage 2023, 6, 946–956. [Google Scholar] [CrossRef]
  5. Abudeif, A.M.; Abdel Aal, G.Z.; Masoud, M.M.; Mohammed, M.A. Geoarchaeological Investigation of Abydos Area Using Land Magnetic and GPR Techniques, El-Balyana, Sohag, Egypt. Appl. Sci. 2022, 12, 9640. [Google Scholar] [CrossRef]
  6. Wallner, M.; Doneus, M.; Kowatschek, I.; Hinterleitner, A.; Köstelbauer, F.; Neubauer, W. Interdisciplinary Investigations of the Neolithic Circular Ditch Enclosure of Velm (Lower Austria). Remote Sens. 2022, 14, 2657. [Google Scholar] [CrossRef]
  7. Milo, P.; Vágner, M.; Tencer, T.; Murín, I. Application of Geophysical Methods in Archaeological Survey of Early Medieval Fortifications. Remote Sens. 2022, 14, 2471. [Google Scholar] [CrossRef]
  8. Colica, E.; Antonazzo, A.; Auriemma, R.; Coluccia, L.; Catapano, I.; Ludeno, G.; D’Amico, S.; Persico, R. GPR Investigation at the Archaeological Site of Le Cesine, Lecce, Italy. Information 2021, 12, 412. [Google Scholar] [CrossRef]
  9. Stumpf, T.; Bigman, D.P.; Day, D.J. Mapping Complex Land Use Histories and Urban Renewal Using Ground Penetrating Radar: A Case Study from Fort Stanwix. Remote Sens. 2021, 13, 2478. [Google Scholar] [CrossRef]
  10. Maté-González, M.Á.; Sáez Blázquez, C.; Carrasco García, P.; Rodríguez-Hernández, J.; Fernández Hernández, J.; Vallés Iriso, J.; Torres, Y.; Troitiño Torralba, L.; Courtenay, L.A.; González-Aguilera, D.; et al. Towards a Combined Use of Geophysics and Remote Sensing Techniques for the Characterization of a Singular Building: “El Torreón” (the Tower) at Ulaca Oppidum (Solosancho, Ávila, Spain). Sensors 2021, 21, 2934. [Google Scholar] [CrossRef] [PubMed]
  11. Masini, N.; Leucci, G.; Vera, D.; Sileo, M.; Pecci, A.; Garcia, S.; López, R.; Holguín, H.; Lasaponara, R. Towards Urban Archaeo-Geophysics in Peru. The Case Study of Plaza de Armas in Cusco. Sensors 2020, 20, 2869. [Google Scholar] [CrossRef]
  12. Ristić, A.; Govedarica, M.; Pajewski, L.; Vrtunski, M.; Bugarinović, Ž. Using Ground Penetrating Radar to Reveal Hidden Archaeology: The Case Study of the Württemberg-Stambol Gate in Belgrade (Serbia). Sensors 2020, 20, 607. [Google Scholar] [CrossRef] [PubMed]
  13. Leucci, G.; Giorgi, L.D.; Ditaranto, I.; Giuri, F.; Ferrari, I.; Scardozzi, G. New Data on the Messapian Necropolis of Monte D’Elia in Alezio (Apulia, Italy) from Topographical and Geophysical Surveys. Sensors 2019, 19, 3494. [Google Scholar] [CrossRef]
  14. Joshi, M.; Prasobh, P.R.; Rajappan, S.; Rao, B.P.; Gond, A.; Misra, A.; Eldhose, K.; Nandakumar, V.; Tomson, J.K. Detection of soil pipes through remote sensing and electrical resistivity method: Insight from southern Western Ghats, India. Quat. Int. 2021, 575, 51–61. [Google Scholar] [CrossRef]
  15. Gurbuz, A.C.; Mc Clellan, J.H.; Scott, W.R., Jr. Compressive sensing of underground structures using GPR. Digit. Signal Process. 2012, 22, 66–73. [Google Scholar] [CrossRef]
  16. Leucci, G. Nondestructive Testing for Archaeology and Cultural Heritage: A Practical Guide and New Perspective; Springer: Berlin/Heidelberg, Germany, 2019. [Google Scholar]
  17. Leucci, G. Advances in Geophysical Methods Applied to Forensic Investigations: New Developments in Acquisition and Data Analysis Methodologies; Springer: Berlin/Heidelberg, Germany, 2020. [Google Scholar]
  18. Goodman, D. GPR Slice Version 7.0 Manual. 2013. Available online: www.gpr-survey.com (accessed on 1 April 2022).
  19. Loke, M.H. Tutorial: 2-D and 3-D Electrical Imaging Surveys. Geotomo Software. 2004. Available online: www.geoelectrical.com (accessed on 1 April 2022).
  20. Berge, J. Electrical resistivity tomography investigations on a paleoseismological trenching study. J. Appl. Geophys. 2014, 109, 162–174. [Google Scholar] [CrossRef]
Figure 1. Location of the castle in the city of Melfi.
Remotesensing 15 01019 g001
Figure 2. Location of the investigated areas in a detailed plan of the Castle of Melfi.
Remotesensing 15 01019 g002
Figure 3. Processed radar sections related to profile 8 acquired in area A: (a) 600 MHz antenna; (b) 200 MHz antenna.
Remotesensing 15 01019 g003
Figure 4. GPR slices from 600 MHz antenna at depths of 0.5–0.7 m (left) and 1.6–1.8 (right) in Cortile degli Armigeri, and 0.8–1.0 m (left) and 2.2–2.3 (right) in Cortile del Mortorio: (A, B, C and D: high amplitude anomalies).
Remotesensing 15 01019 g004
Figure 5. ERT slices at depths of 2 m (Cortile degli Armigeri) and 1 m (Cortile del Mortorio)—anomalies with the same target are named with the same letters as in Figure 4: B, C and D: high resistivity anomalies.
Remotesensing 15 01019 g005
Figure 6. Processed radar section acquired in area C (600 MHz antenna): E: high amplitude anomaly.
Remotesensing 15 01019 g006
Figure 7. GPR slices from 600 MHz antenna in the north-eastern external wall area: (left) depth of 0.7–0.8 m (areas C and D); (right) depths of 1.6–1.8 m (area C) and 1.0–1.1 m (area D): E, F, G, H and I are high amplitude anomalies.
Remotesensing 15 01019 g007
Figure 8. GPR slices from 600 MHz antenna at depths of 0.9–1.0 m (left) and 1.1–1.2 m (right) in the southern external wall area (area E): L is the high amplitude anomaly.
Remotesensing 15 01019 g008
Figure 9. ERT-3 profile: A is an high resistivity anomaly.
Remotesensing 15 01019 g009
Figure 10. ERT-4 profile; A is an high resistivity anomaly.
Remotesensing 15 01019 g010
Disclaimer/Publisher’s Note: The statements, opinions and data contained in all publications are solely those of the individual author(s) and contributor(s) and not of MDPI and/or the editor(s). MDPI and/or the editor(s) disclaim responsibility for any injury to people or property resulting from any ideas, methods, instructions or products referred to in the content.

