
Remote Sensing of Infrasound Signals of the “Voice of the Sea” during the Evolution of Typhoons

1
V.I. Il’ichev Pacific Oceanological Institute, Far Eastern Branch of the Russian Academy of Sciences (FEB RAS), 690041 Vladivostok, Russia
2
State Scientific Institution—Institute for Scientific Research of Aerospace Monitoring “AEROCOSMOS”, 105064 Moscow, Russia
*
Author to whom correspondence should be addressed.
Remote Sens. 2022, 14(24), 6289; https://doi.org/10.3390/rs14246289
Submission received: 11 November 2022
/
Revised: 8 December 2022
/
Accepted: 8 December 2022
/
Published: 12 December 2022
(This article belongs to the Section Ocean Remote Sensing)
Abstract
:The article presents summarized results of the study of registered periods of microseisms of the “voice of the sea” infrasound oscillations, generated due to the influence of wind of tropical cyclones (typhoons) passing in the Sea of Japan. We compared the recorded signals and how they correspond to the microseismic background in the wind wave range. Using satellite monitoring data, we verified and identified the groups of cyclones that excite the “voice of the sea” microseisms with approximately the same characteristics. We found that the bandwidth of the “voice of the sea” range and its central frequency, with the maximum amplitude in this frequency range, are approximately the same for typhoons (cyclones) propagating along the same routes. Wind speed also determines the central frequency of the “voice of the sea” range for a particular typhoon (tropical cyclone) propagation route.
1. Introduction
When processing the experimental data of laser strainmeters, obtained during Lionrock typhoon propagation over the Sea of Japan, the “voice of the sea” microseisms in the frequency range between 7 and 9 Hz [1] were discovered for the first time ever in the world. Hitherto, infrasound oscillations in this frequency range were found only in the atmosphere; they were discovered by Academician V.V. Shuleikin about a century ago [2]. As a result of the first observations of the “voice of the sea” microseisms, a question about the nature of such oscillations came up, especially since their registration by measuring instruments did not correlate with wind manifestations in the observation region, but coincided with the arrival of swell waves, with a natural delay [3]. Different authors carried out theoretical studies of their appearance mechanisms and proposed different variants of their generation [4,5]. Great interest in the occurrence of such infrasound waves is associated with the possible influence of powerful tropical cyclones on the psychophysical state of the human body. Since the process is quite global and can manifest itself in a region several days in advance, peculiarities of its generation can have a significant negative impact on entire inhabited regions. Carrying out further research on the “voice of the sea” microseisms physical origins, including those caused by typhoons, we found that their generation depends on meteorological and hydrological characteristics, and primarily on wind speed and magnitude of wind sea waves [6]. These characteristics can be obtained from satellite data. In recent years, significant progress has been made in the field of remote sensing of the Earth from space, including for the study and monitoring of dangerous systems such as tropical cyclones, which are called typhoons in the northwestern Pacific Ocean [7].
Satellite systems for Earth remote sensing allow the most complete monitoring of typhoons, which is especially important when solving problems in vast and hard-to-reach ocean areas, as well as with limited capabilities for direct measurements [7,8,9]. The importance of space methods for studying such catastrophic natural processes, such as typhoons, is fundamental, since the spatiotemporal variability and randomness of the process of their genesis, as well as the uncertainty of the motion trajectory, limit the use of ground-based methods. Advanced satellites, registering a system of mesoscale cyclonic clouds, make it possible to detect the origin of each process, identify the features of its evolution, reveal the prehistory of the emergence of hurricanes (typhoons), detail the stages of their development, determine the transition to deepening typhoons and find out signs of their extinction [7,9]. The use of satellite data to study typhoons makes it possible to characterize these catastrophic natural phenomena in the most complete way.
At the same time, satellite data in the visible range of the electromagnetic wave spectrum give us an idea of the dynamics of typhoon development, according to the structure of the cloud cover; IR data allow us to measure temperature, radar data make it possible to estimate ocean waves, and radiometric data in the microwave range provide information on humidity, wind strength, and temperature [7,10].
At present, a number of methods have been developed and successfully applied that can be used to analyze wind fields over the ocean, including storm winds. The most widespread among them are active sensing methods (radar imaging, laser sensing) and passive ones (microwave radiometry, infrared surveys, and surveys in the visible range) [7]. Among the remote methods developed recently, the following are notable: the method of remote spatial frequency spectrometry; all-weather radar methods, including the method of multi-frequency radiowave recording [11]. The use of these methods makes it possible to study various processes in the near-surface layer of the ocean, and, in particular, wind and wave fields.
The creation of a complete catalogue of tropical cyclones and tropical disturbances based on satellite data makes it possible to study in detail their climate-forming function [12,13,14]. Several typhoons, passing near the station where the system of laser strainmeters is located, were selected and studied based on such a catalogue.
Registration of the “voice of the sea” microseisms was carried out by the coastal system of laser strainmeters, located on the coast of the Gamow Peninsula in the southern part of the Primorsky Territory, Russian Federation, at 42°52.560′N, 132°48.643′E, at the Marine Experimental Station of the V.I. Il’ichev Pacific Oceanological Institute, Far Eastern Branch of Russian Academy of Sciences [15]. The system of laser strainmeters is a part of the laser interference measuring complex; the experimental data from which has been entered into the experimental database since 1994. Naturally, seismoacoustic signals of the “voice of the sea” range should have been recorded by the laser strainmeters even before we discovered them for the first time. Before performing this work, we set forth the task to search for manifestations of the “voice of the sea” microseisms in the records of the laser strainmeters, with a study of their statistical characteristics and the peculiarities of their excitation and dynamics. The study resulted in the discovery of a significant number of periods when the “voice of the sea” infrasound signal was generated in the Sea of Japan due to movement of tropical cyclones. The use of a system of laser strainmeters makes it possible to study the areas of infrasound signal generation, based on the method of amplitude modulation of mutually orthogonal systems [16,17].
When processing and analyzing large volumes of experimental data, we studied some peculiarities of the “voice of the sea” microseisms formation and development, which showed that they belong to Rayleigh-type waves. Hereafter, we will present a statistical sequence of the registration periods of the “voice of the sea” infrasound signals in the Far Eastern region of the Russian Federation.
2. Registration of Infrasound Oscillations
Trajectories of typhoons never repeat each other. The tracks of the majority of typhoons that originate in the Pacific Ocean have a reverse branch and parabolic characteristics. Some typhoons, when reaching the mainland, do not fill up, but turn to the northeast and move to the shores of Japan or cross the Korean Peninsula, while actively influencing the water area of the Sea of Japan. Sometimes, when crossing a long land area, such as the Korean Peninsula, a tropical cyclone that has lost its power is gaining it again as a result of resupply from the Sea of Japan surface, which warms up significantly in summer. However, world meteorological agencies, at the same time, stop defining a tropical cyclone as a typhoon, transferring it to the category of a tropical cyclone of up to hurricane power and not accounting for its increasing power, even for a short time.
Studying the archive data of the coastal laser strainmeters, we revealed new time periods of the “voice of the sea” microseisms existence. The study of manifestations of those signals was based on a time when typhoons actively influenced the Sea of Japan water area. As a result, we found a significant number of new time intervals when seismic instruments recorded the “voice of the sea” microseisms during typhoon passing. Figure 1 shows an integrated chart of the tracks of the studied typhoons, built on the basis of meteorological data from satellite monitoring.
For the detection of typhoons, data from geostationary satellites are most suitable, such as Electro-L, Resurs-P, Feng-Yun-2, Himawary-8, GOES-13, 15, 16 in the visible and near-IR range, which allow us to reveal track data: typhoon center coordinates, as well as to trace the entire life of the cyclone, determine its speed and features of the trajectory, and the turning point [7].
Data from Meteor-M, AURA, AQUA, TERRA, NOAA, SUOMI NPP, etc. satellites make it possible to obtain actual fields of the atmosphere and ocean physical parameters, such as ocean surface temperature (SST), content of water vapor in the atmosphere, wind speed field, precipitation field, pressure, cloud cover and type, etc. [4].
Table 1 summarizes the characteristics of the studied typhoons.
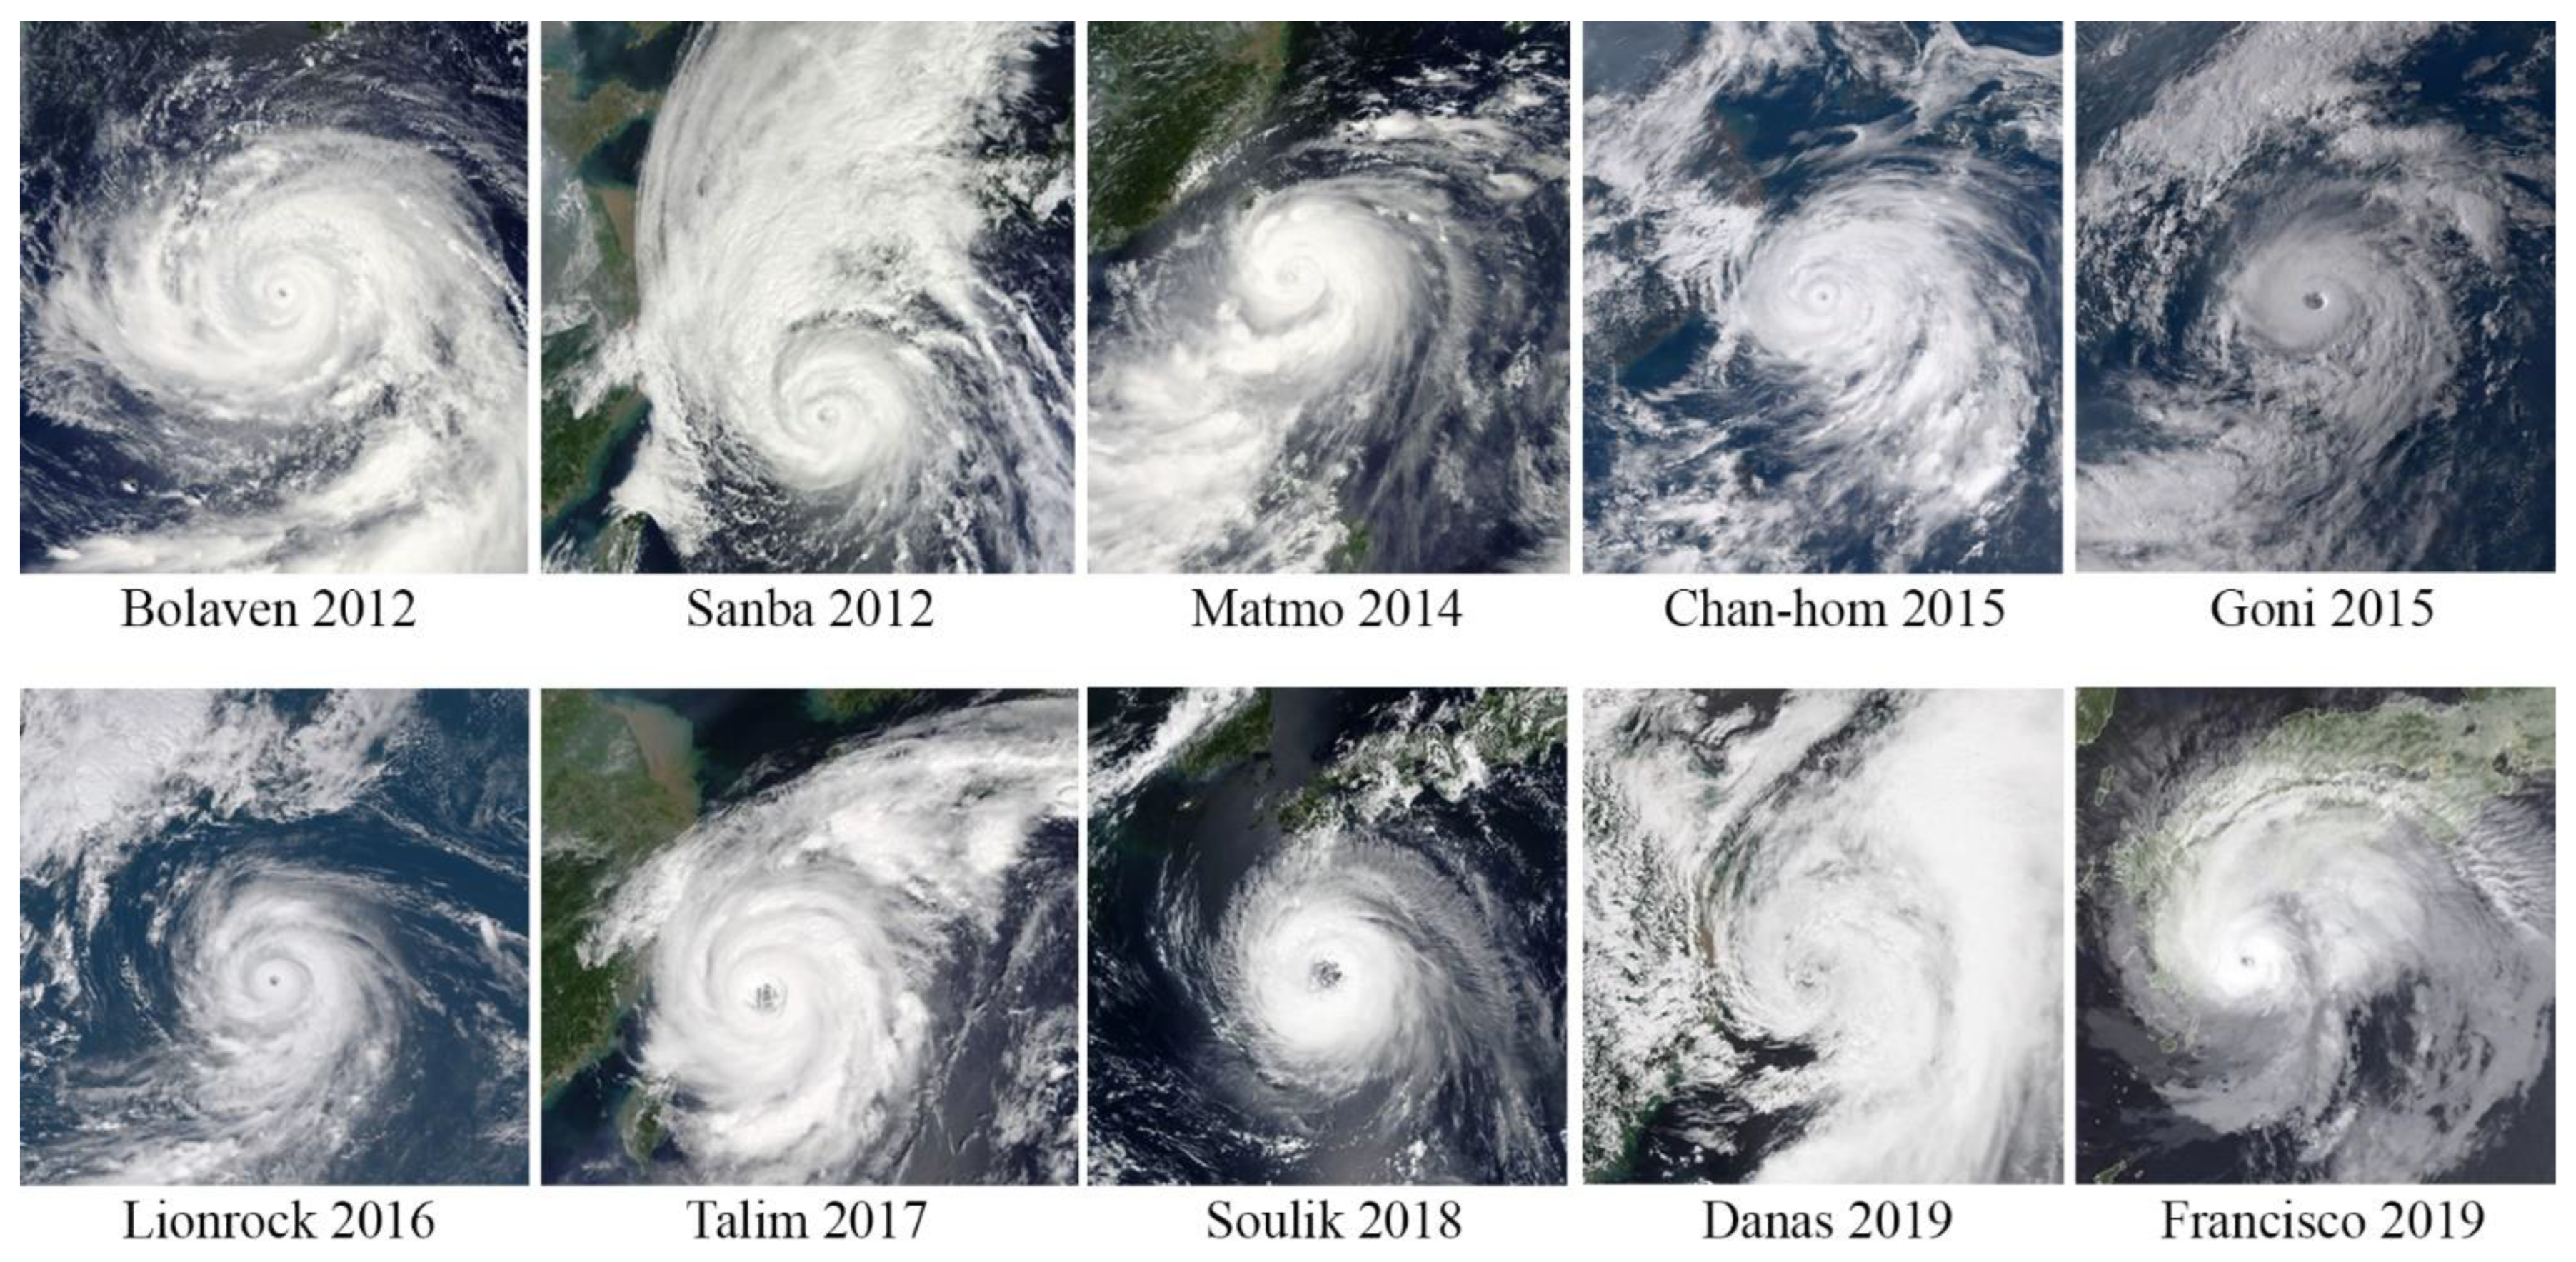
In the scheme, the track of each typhoon is indicated in its own color. Correspondence between the typhoon name and its color identification is in the figure legend, where the year and the sequence number of the typhoon in the corresponding year are also shown in brackets. The beginning of the trajectory of each typhoon’s center movement is indicated in the figure by text, corresponding to the date (day, month, year). The typhoon movement trajectory itself is divided by circles and filled circles, where a circle corresponds to 00:00 UTC of each subsequent day, and a color-filled circle corresponds to 12:00 UTC. We will describe the time of influence of each typhoon on the Sea of Japan water area in relation to each case of generation of the “voice of the sea” microseisms. As we can see from the integrated scheme, most of the typhoons that generate the “voice of the sea” microseisms moved over the Korean Peninsula with their subsequent exit into the Sea of Japan. At the same time, the microseisms’ origin is not conditioned by the complete location of the cyclone vortex in the water area, as, for example, the Bolaven typhoon. Some typhoons, such as Talim, moved along the western coast of the Japanese archipelago. Typhoons Goni and Lionrock (2015 and 2016), moving closer to the Japanese island of Honshu, changed direction to the northwest and entered the Primorsky Territory of Russia. Figure 2 shows images of the studied tropical cyclones obtained from the SUOMI NPP meteorological satellite.
2.1. Typhoon Lionrock
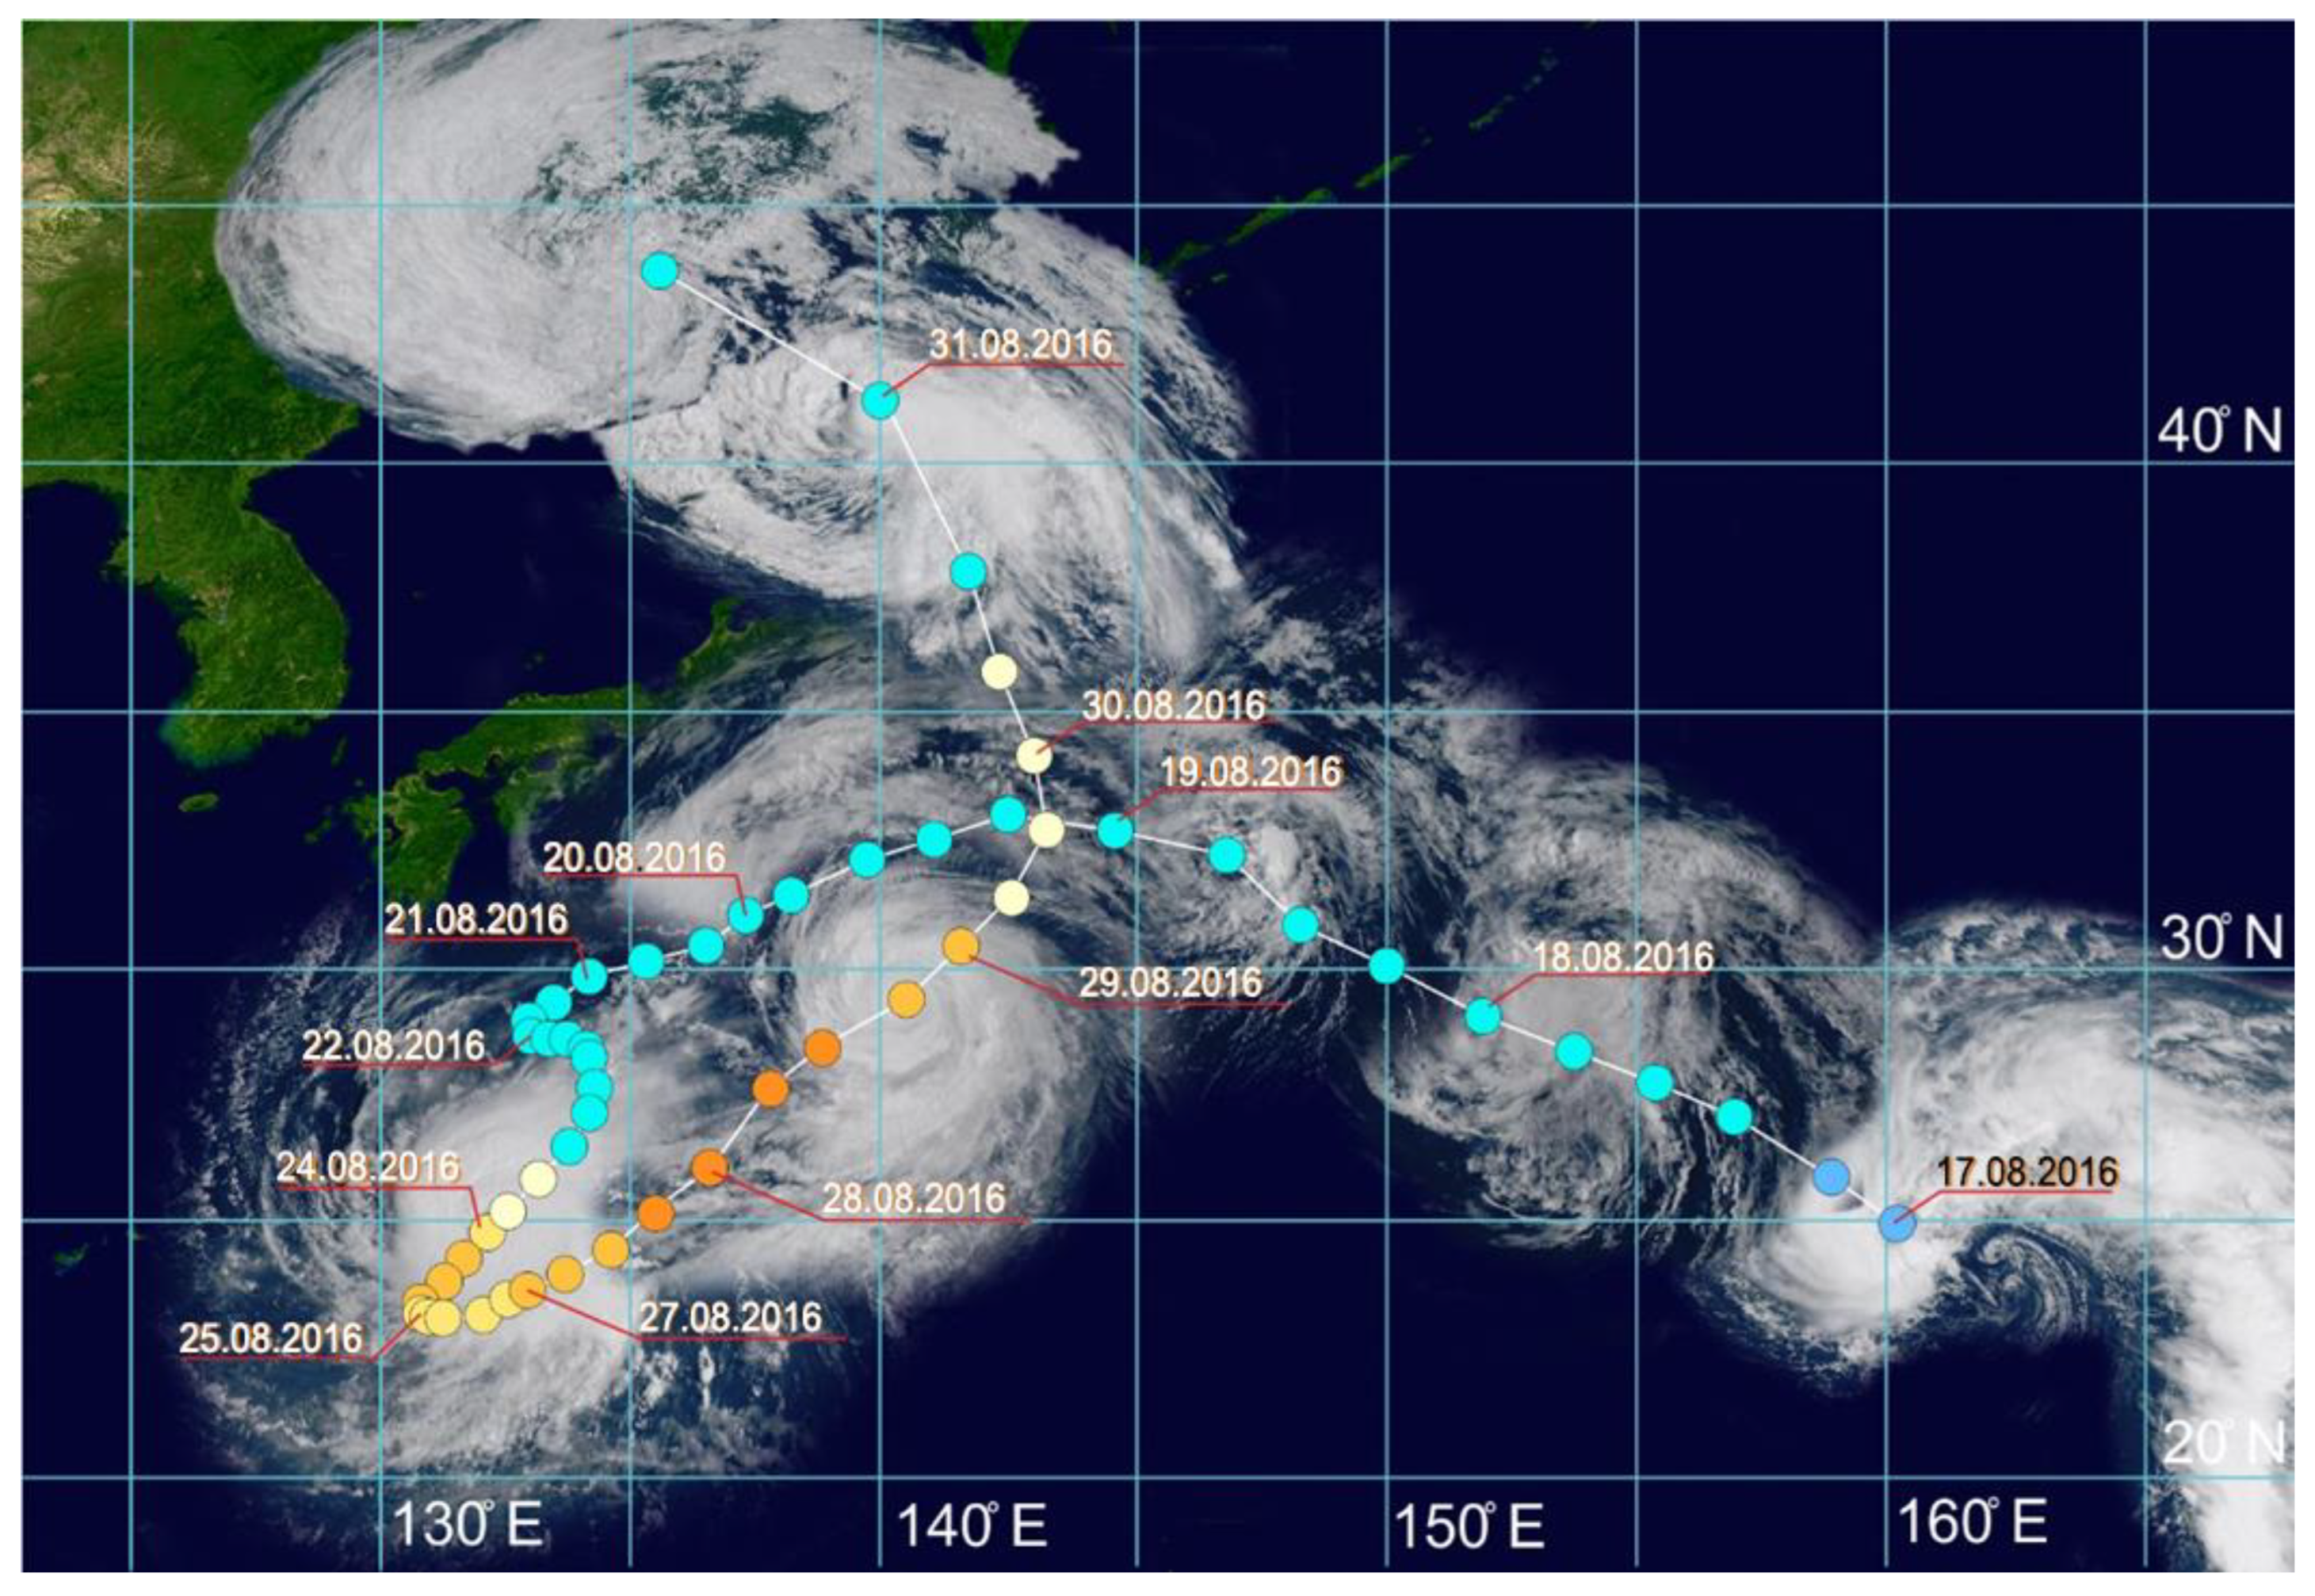
Figure 3 shows the trajectory of Typhoon Lionrock combined with images taken by the Himawari-8 satellite in the visible range.
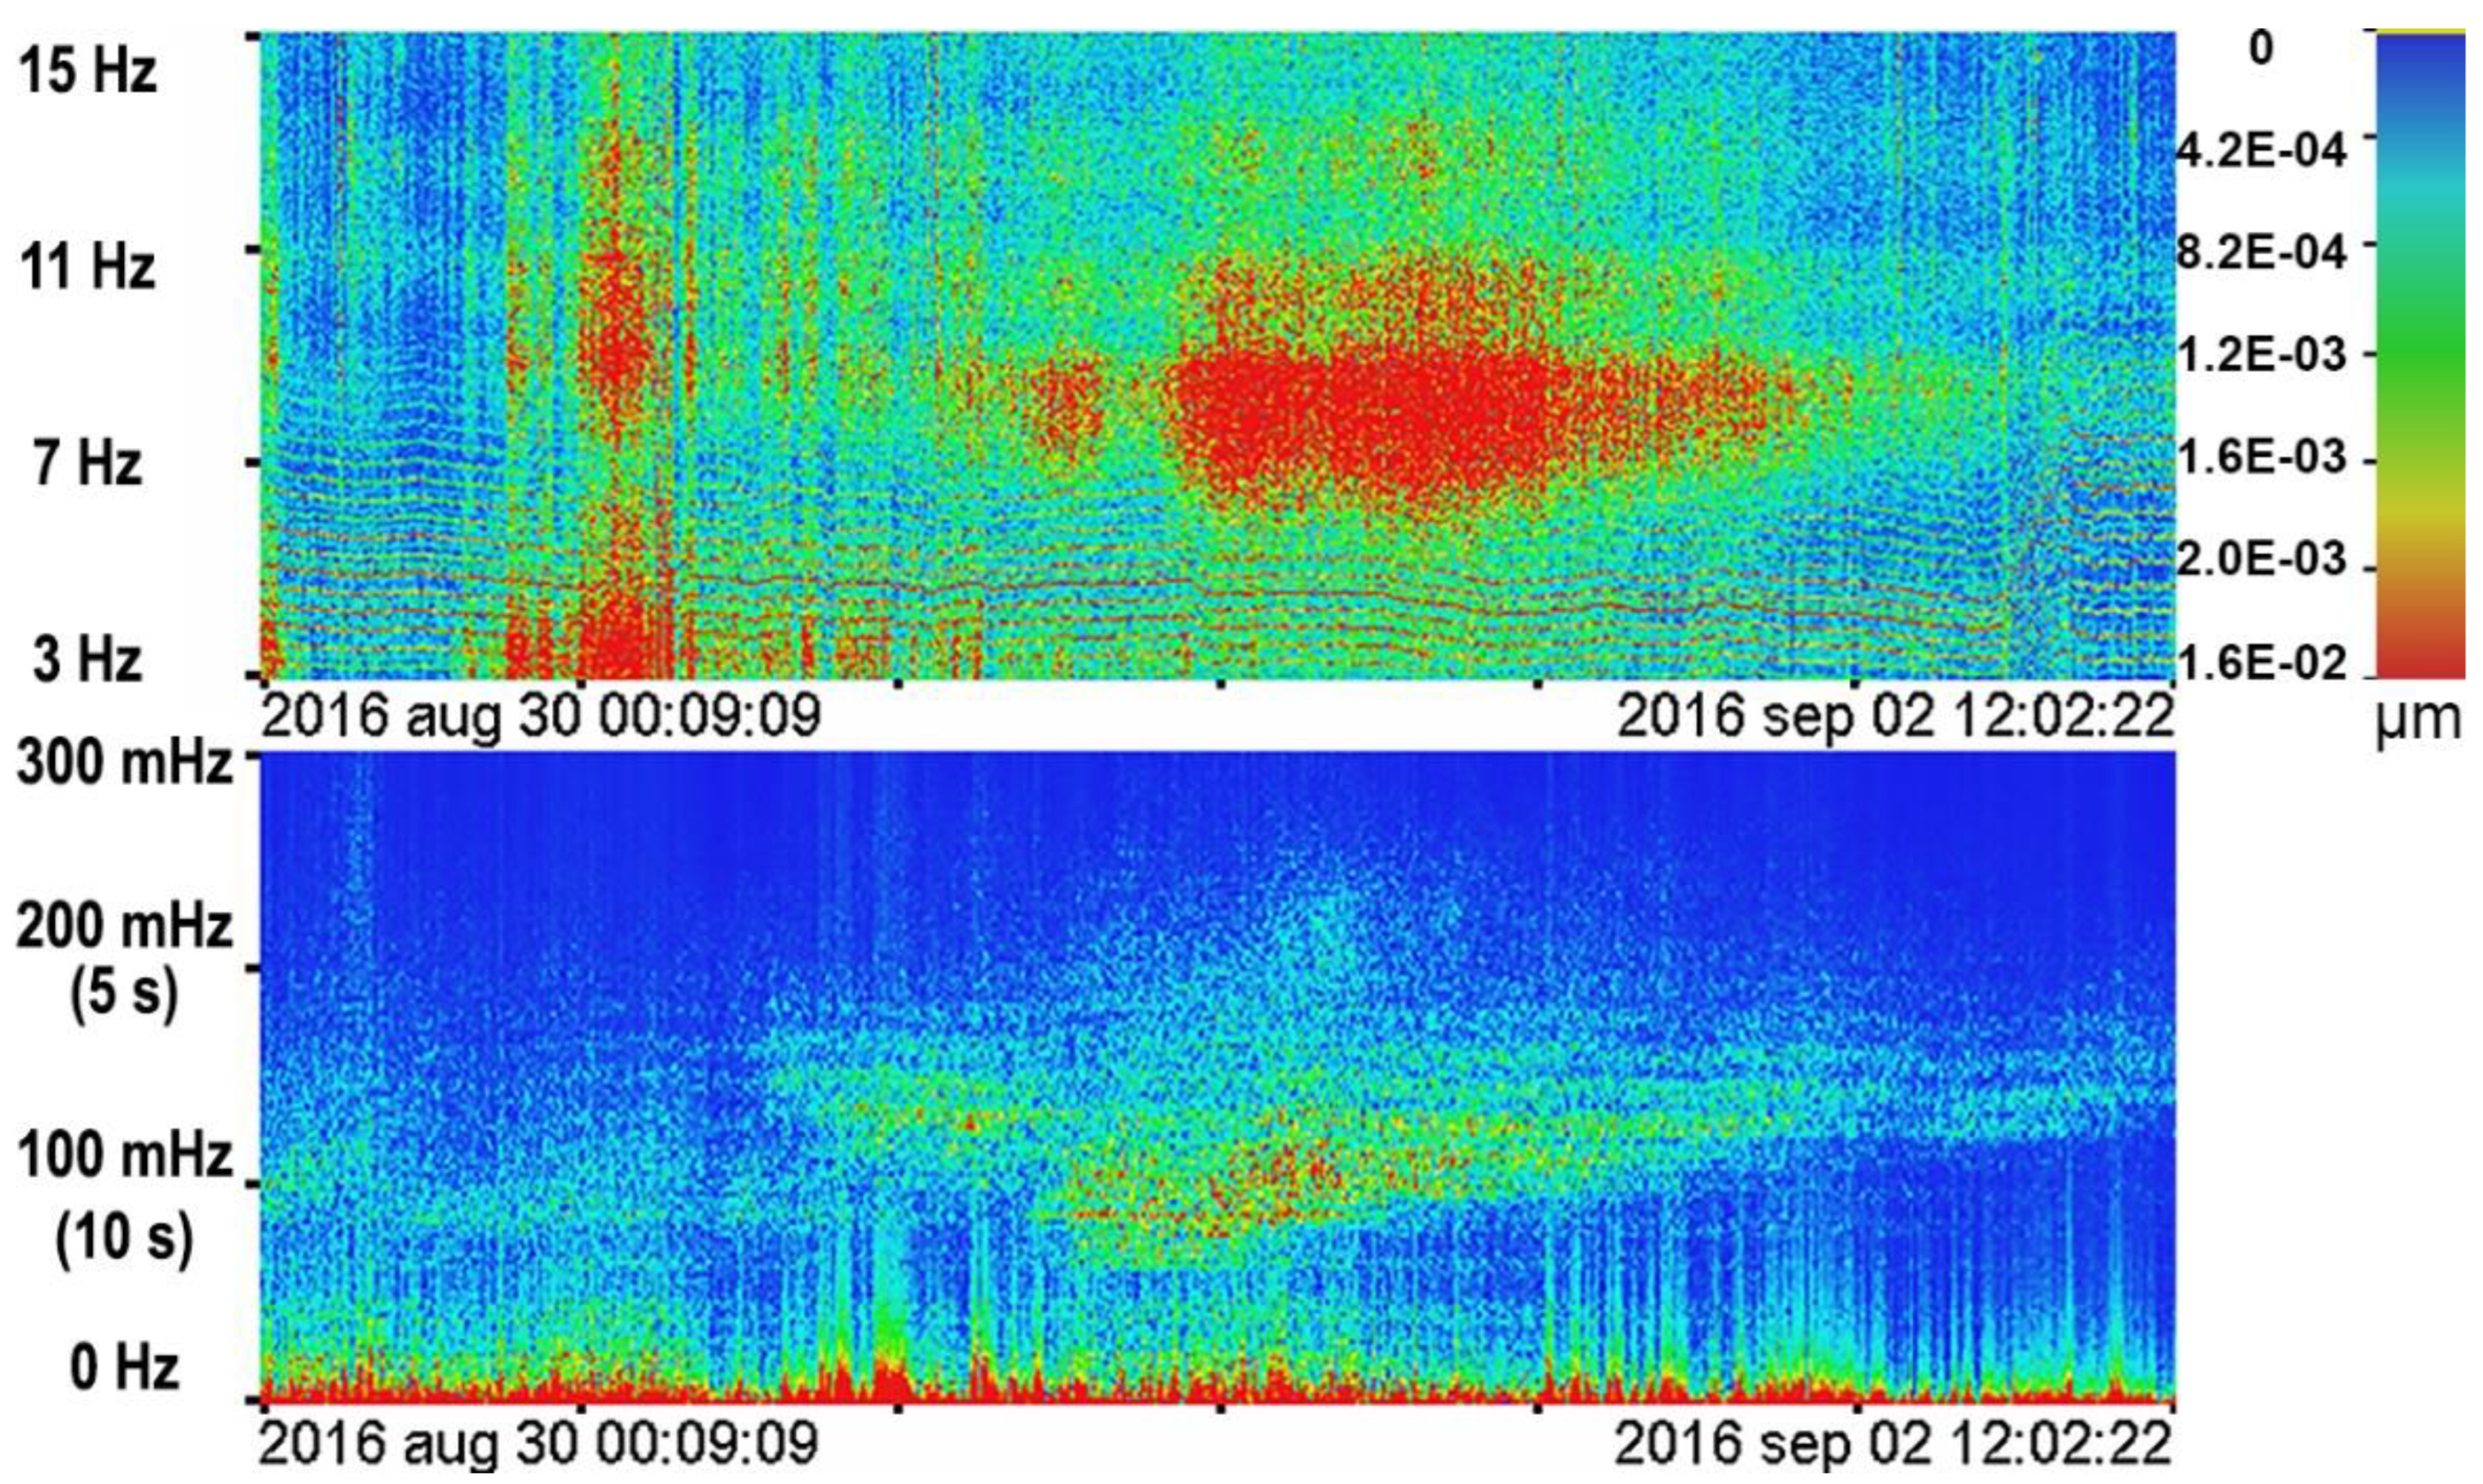
In the scheme in Figure 1, the trajectory of the typhoon is indicated in green. According to the scheme, the tropical cyclone entered the Sea of Japan on 30 August 2016, lived over it for a short time and, upon entering the Primorsky Territory, filled up quickly. Figure 4 shows dynamic spectrograms of synchronous records of the laser strainmeter in the ranges of the “voice of the sea” (6–11 Hz) and wind sea waves (2–20 s). It is important to note that in the data of the laser measurer of hydrosphere pressure variations [18], we do not observe any manifestations of the “voice of the sea” signal in the shelf zone of the Primorsky Territory. This testifies that the propagation of infrasound waves in this frequency range is in the Earth’s crust, not in water.
We identified powerful oscillations in the frequency range of about 6.5–8.5 Hz (with a central frequency of about 7.5 Hz) in the laser strainmeter record. The beginning of these powerful oscillations can be determined as of 31 August 2016 16:30 UTC, and their conditional end was on 2 September 2016 02:50 UTC. From the dynamic spectrogram in the range of wind sea waves, we can identify the onset of the arrival of sea waves with the largest period, which is approximately 15 s. Further, the period of sea waves gradually decreased to 7 s. The approximate beginning of these waves’ arrival was 31 August 16:20, and the conditional end was 2 September 10:15.
2.2. Typhoon Bolaven
Further research was aimed at searching for the “voice of the sea” microseisms in the records of the laser strainmeters for the past ten years. Let’s address the typhoon Bolaven, which formed on 19 August 2012, to the southwest of the Mariana Islands, that was the first candidate for the study. Figure 5 shows the trajectory of this typhoon. Synchronous dynamic spectrograms of the “voice of the sea” infrasound oscillations and wind waves are shown in Figure 6. The tabular data in Figure 6 show the characteristics of typhoon Bolaven, corresponding to certain time stamps when registering microseisms.
The development of infrasound oscillations in the range from 6.5 to 9.2 Hz began on 28 August 2012 at approximately 12:00 UTC (Figure 7a). At that time, the center of the typhoon was at the latitude of the measuring range—43°N, and the infrasound signal had peak frequency of 8.9 Hz. After that time, oscillations with central frequencies of 9.1 and 10.7 Hz were amplified. A typhoon vortex came to the Primorsky Territory (Russia). The powerful vortex tail of the typhoon was in the north of the Yellow Sea. The rarefied vortex tails of the typhoon were located over the Sea of Japan.
At about 22:00 (Figure 7b), after the relocation of strong wind field along the seacoast, powerful oscillations appeared in the frequency range of 6.5–9.3 Hz, with a central frequency of about 7.9 Hz. At this time, the typhoon vortex was strongly distributed over the mainland, capturing the north of the Primorsky Territory and the territories of China and Khabarovsk Territory. At the same time, the tails of the typhoon stretched over the eastern and northeastern water areas of the Sea of Japan.
The “voice of the sea” microseisms reached the largest in the frequency range amplitude at 06:00 UTC on August 29 (6.5–9.5 Hz, red core). The typhoon was over China, Mongolia, the Khabarovsk Territory. A slight influence of the cyclonic vortex was observed near Japan and in the north of the Sea of Japan (Figure 7c).
Oscillations in the range of 6.5–9.3 Hz decreased in intensity over time, and their frequency range also narrowed to 7.5–8.5 Hz. By 11:30 p.m. on 30 August they had faded almost completely. The typhoon moved to the Sea of Okhotsk.
The laser strainmeter confidently registered primary and secondary microseisms. Recording of primary microseisms with period of about 12 s started at about 23:00 on 28 August (Figure 7d), and their period gradually decreased to 5 s (20:30 on 30 August). Secondary microseisms with a period of about 6 s were confidently recorded by the laser strainmeter at about the same time (23:00 on 28 August). Gradually, their period and intensity decreased, and they were practically no longer registered at 00:30 on 30 August. At the same time, their period was about 4 s, and the period of primary microseisms was approximately 8 s.
2.3. Typhoon Sanba
Typhoon Sanba, whose track is indicated in Figure 1 in red, was the strongest typhoon of 2012. The development of the typhoon began on 10 September 2012 to the east of the Philippine Islands. The center of this typhoon passed over the eastern part of the Korean Peninsula and went straight to the city of Vladivostok, quickly filling up over the Primorsky Territory. Figure 8 shows the dynamic spectrograms of the laser strainmeter record during the period of typhoon influence on the water area of the Sea of Japan.
On 17 September, at approximately 23:30, powerful primary microseisms with a period of about 12 s and secondary microseisms with period of about 6 s appeared. Then their period decreased. At about 03:50 on 19 September secondary microseisms were already poorly distinguishable in the laser strainmeter record. At the same time, their period dropped to 4.2 s, while the period of primary microseisms at this time was approximately 8.5 s. Primary microseisms on the laser strainmeter record subsided at 07:30 on September 19. At the same time, their period became equal to about 7.5 s.
On 18 September at about 00:10, microseisms of the “voice of the sea” appeared, the frequency range at its maximum extended from 6 to 9.5 Hz, with a central frequency (in intensity) of 8.4 Hz. Oscillations of the “voice of the sea” microseisms strongly attenuated by 18:00 on 18 September and were weakly traced until 10:00 on 19 September with a central frequency of about 8.5 Hz. The location of the typhoon “eye” and the leading front remained almost unchanged. The rear part of the cyclone was located in the center of the Sea of Japan. At Shultz Cape, the wind was northeastern, 18–21 m/s (00:10). Then it became northwestern, 6–9 m/s (18 September 18:00) and northern, 3–4 m/s (19 September 10:00).
On 18 September at 18:00, the intensity of the central part of the “voice of the sea” microseisms began to subside. The typhoon’s vortex tail was located in the north of the Korean Peninsula, off the southern coast of the Primorsky Territory. On September 19 at 10:00, practically no “voice of the sea” microseisms were registered.
Thus, the time (18 September 00:10) of the “voice of the sea” microseisms occurrence almost coincided with the time (17 September 23:30) of arrival of primary microseisms with a maximum period of 12 s (secondary microseisms–6 s). At Shultz Cape, the wind speed was about 18–21 m/s. Microseisms of the “voice of the sea” strongly attenuated by 18:00 on 18 September. The wind, by this time, dropped to 6–9 m/s. Microseisms of the “voice of the sea” finally faded by 10:00 on September 19. At Shultz Cape, the wind speed dropped to 2–3 m/s. By 07:30 on 19 September the period of primary microseisms decreased to 7.5 s. Secondary microseisms were not visible.
2.4. Typhoon Matmo
Typhoon Matmo’s trajectory is shown in brown in Figure 1. The typhoon began forming on 16 July 2014. Moving quickly and passing over the territories of Taiwan and mainland China, the typhoon lost most of its energy. Nevertheless, having entered the water area of the Sea of Japan in the form of a tropical depression, the typhoon vortex formed again as a result of moving almost eastward over the water area of the Sea of Japan, lingering near the Japanese island of Hokkaido. Dynamic spectrograms of the manifestation of infrasound oscillations are shown in Figure 9.
In the spectrograms of disturbances generated by this typhoon, we observe the weakest manifestations of infrasound oscillations of the “voice of the sea”, which began to develop in the morning on 26 July 2014 at about 10:00 UTC and had approximately the same intensity throughout the entire time interval of its manifestation. The center of the typhoon during this period was in the Sea of Japan closer to Hokkaido Island at 45°N. The peak frequency was 8.2 Hz with a fairly narrow band of manifestation, from 7 to 8.7 Hz. The complete attenuation of the signal occurred on 26 July at 23:00 UTC.
2.5. Typhoon Chan-Hom
Typhoon Chan-hom was named the ninth typhoon of 2015. In the diagram of Figure 1, its trajectory is marked orange. The typhoon originated at the end of June 2015 near the Northern Mariana Islands. The typhoon reached the Primorsky Territory after losing its vortex structure, but there was still enough energy left to create strong wind waves in the Sea of Japan, which resulted in powerful infrasound oscillations. Figure 6 shows the dynamic spectrograms of laser strainmeter data during the influence of typhoon Chan-hom. Figure 10 shows the dynamic spectrograms of the laser strainmeter in the ranges of “voice of the sea” microseisms and wind waves.
On 11 July 2015 at 15:00, noise in the range of 1–2.5 Hz appeared in the spectrograms. The center of the typhoon was in the south of the Yellow Sea. The leading front of the typhoon occupied the Korean Peninsula and went to the south of the Primorsky Territory. At Shultz Cape, the wind was southern, 6–8 m/s. Within one day, the noise in the range of 1–2.5 Hz increased and expanded to the range of 1–4.5 Hz. During this time, the typhoon moved to the northern part of the Korean Peninsula. On 12 July at 17:20, the “eye” of the typhoon was located in the south of the Primorsky Territory. The Sea of Japan along the coast of the Korean Peninsula was not affected by it. At Shultz Cape, the wind was southeastern, 17–20 m/s.
On 13 July at 02:50, powerful microseisms of the “voice of the sea” appeared in the frequency range from 7 to 9 Hz. Further, the frequency range of the “voice of the sea” microseisms rapidly expanded to the range of 6–11 Hz (13 July, 06:00). On 14 July at 10:00, the frequency range of the “voice of the sea” microseisms decreased to 7–9 Hz. In this cyclone, the vortex re-formed in the northern part of the Sea of Japan.
On 13 July at about 03:00, primary microseisms with a period of about 7.2 s and secondary microseisms with a period of about 3.7 s were recorded by the laser strainmeter. Over time, their periods grew and on 13 July, at approximately 05:30, their periods became, respectively, 10.5 s and 5.3 s. They were confidently registered with unchanged periods until 20:00 on 13 July. Then, secondary microseisms disappeared in the spectrogram, and primary microseisms with period of about 10 s were traced until 04:30 on 14 July. By that time, their period had slightly dropped to 9.3 s.
Thus, the time (13 July, 02:50) of the “voice of the sea” microseisms occurrence, almost coincided with the time (13 September, 03:00) of arrival of primary microseisms with a maximum period of 7.2 s (secondary microseisms—3.7 s). At Shultz Cape, the wind speed was about 9–11 m/s. Then, the frequency range of the “voice of the sea” microseisms rapidly expanded to 6–11 Hz (06:00 13 July), which was associated with an increase in the periods of primary and secondary microseisms; their periods by 05:30 13 July became equal to 10.5 and 5.3 s, respectively. Secondary microseisms were no longer registered at about 20:00 on 13 July. Primary microseisms were confidently recorded by the laser strainmeter until 04:30 on 14 July. Microseisms of the “voice of the sea” disappeared at about 10:00 on 14 July.
On 14 July at 23:18 the weak background of the “voice of the sea” microseisms faded completely.
2.6. Typhoon Soulik
On 15 August 2018, the nineteenth typhoon, Soulik, formed. The typhoon gained significant power and, after passing through the Asia-Pacific region, meteorological services followed it almost to the coast of the United States. Movement of this typhoon was unique because it was followed by another typhoon, with which the Soulik typhoon entered the Sea of Japan almost simultaneously. Dynamic spectrograms of the manifestation of infrasound oscillations are shown in Figure 11.
Infrasound oscillations of the “voice of the sea” in the range of 6.5–9.5 Hz appeared in the signal spectrum at 18:00 on 24 August 2018. The maximum amplitude was fixed at the frequency of 7.5 Hz. At that time, the typhoon was already moving to the Sea of Japan, to the east of the measuring range. The signal reached its maximum at 22:00. The frequency range slightly expanded to 9.6 Hz. At the same time, the typhoon vortex was actively moving along the eastern coast of the Primorsky Territory, creating powerful wind pressure between its center and the coast.
Further movement of the typhoon vortex in the northern part of the Sea of Japan was characterized by gradual attenuation of infrasound oscillations. The general signal range reduced to 7–9.6 Hz. At the same time, the maximum shifted to the frequency of 8.5 Hz. Slight attenuation could be traced in the signal spectrum during the period of time when the typhoon vortex was moving towards the coast of Hokkaido Island. There it began to actively lose energy and decay. The infrasound signal faded around 20:00 on 25 August, while maintaining the frequency range.
During the entire time of registration of infrasound oscillations, microseisms of wind waves with a period of 5.3–5.6 s were recorded, developing at 00:00 on 24 August when the typhoon vortex entered the Sea of Japan from the Korean Peninsula. Attenuation of these microseisms occurred simultaneously with attenuation of the infrasound oscillations of the “voice of the sea” by 20:00 on 25 August 2018.
2.7. Typhoon Danas
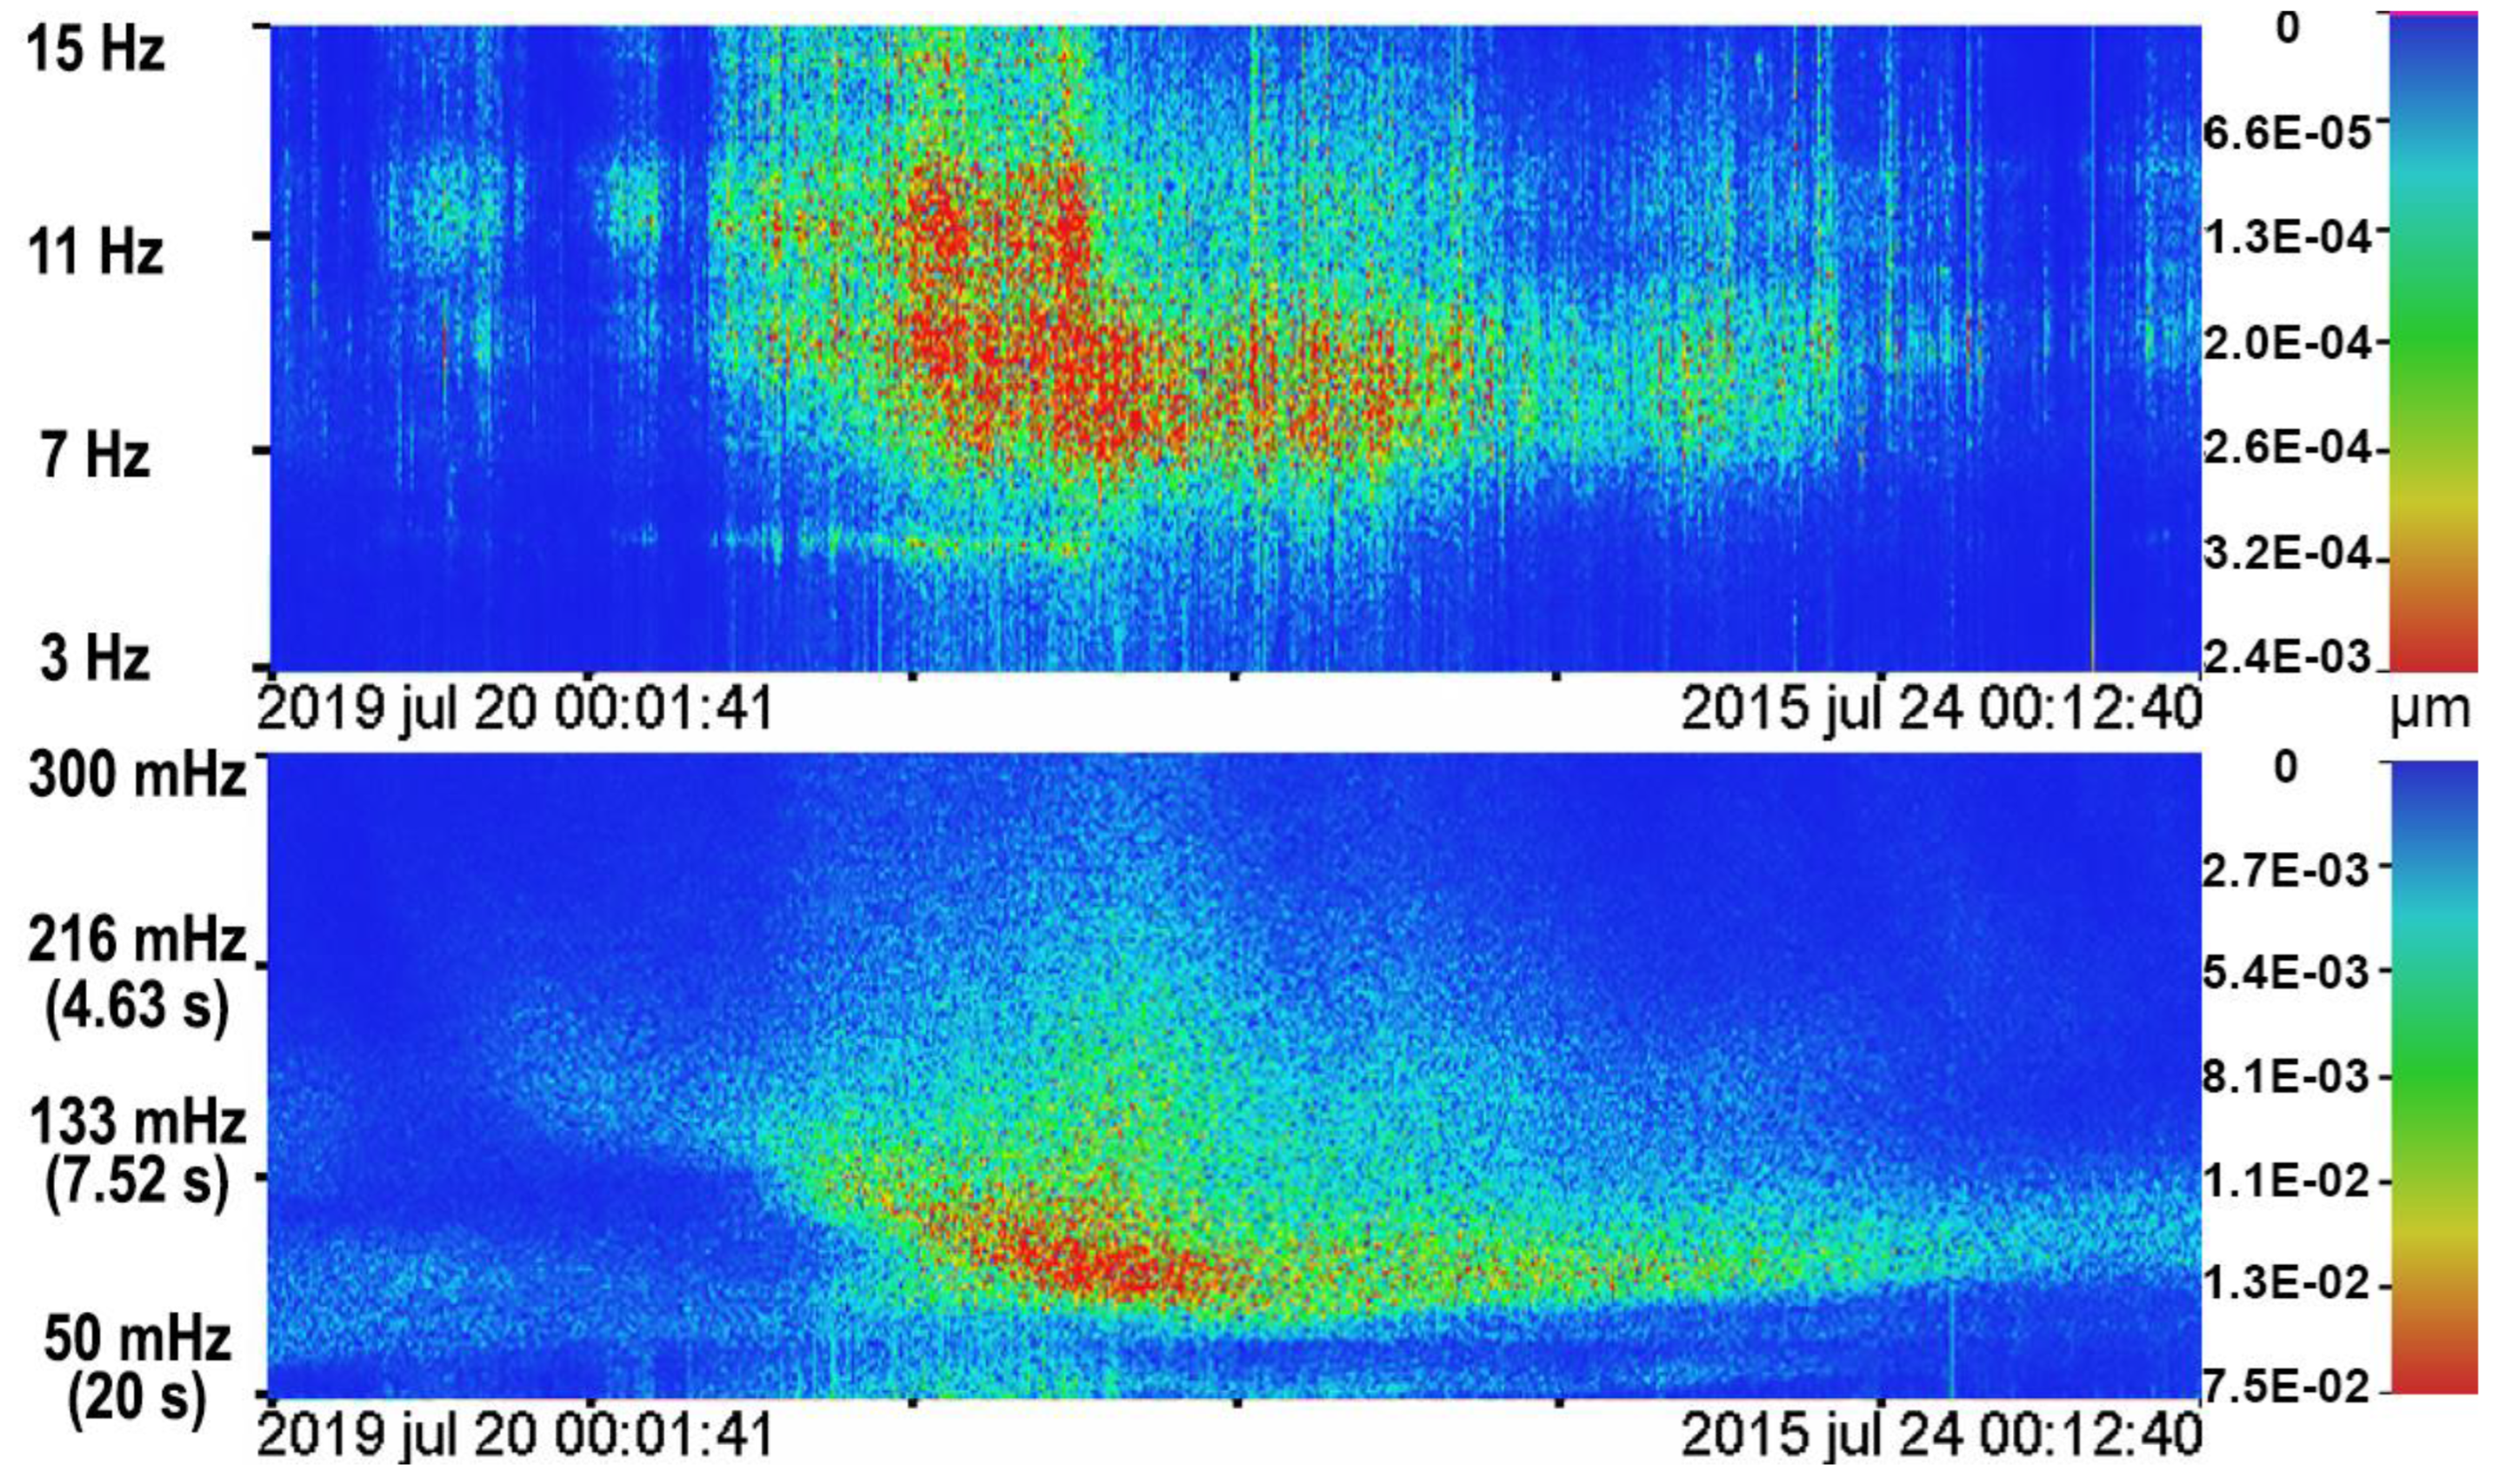
Typhoon Danas was given a name because the wind speed of the vortex exceeded 60 km/h, but meteorological agencies did not raise its level to the status of “typhoon”, leaving it in the tropical storm category. The typhoon originated on 11 July near the Mariana Islands and, passing over the Korean Peninsula, caused significant economic damage. Figure 12 shows the dynamic spectrograms of the laser deformograph in the “voice of the sea” microseismic and wind wave ranges.
The onset of manifestations of the “voice of the sea” caused by the Danas typhoon was observed in the spectrograms on 21 July 2019 at about 06:00 UTC; the peak frequency in this period was 8 Hz, and there was also a second peak frequency of about 11 Hz. The second signal disappeared when the wind influence ceased in the area of the measuring range. The center of the typhoon was over the Sea of Japan and moved to the northeast, towards Povorotny Cape. At this time, the zone of active wind pressure in the frontal region of the vortex had a significant impact on the shelf zone near Povorotny Cape.
The maximum oscillation amplitude was observed at 17:00 on 21 July 2019 and had two peak frequencies of approximately 8.5 and 11 Hz. The center of the typhoon was located near the southeastern coast of Primorye. Attenuation of the signal began at 10:00 on 22 July 2019. Over the next day, with the peak frequency of 8 Hz, the typhoon already lost the status of a hurricane and, as a tropical depression, continued to move northeast along the coast of the Primorsky Territory.
During the course of observation, microseisms of wind waves were also recorded. At the same time, several wave processes were also noticeable, associated both with wind waves coming from the open part of the Sea of Japan, and with the changing direction of their movement.
2.8. Typhoon Francisco
Typhoon Francisco was a comparatively minor tropical cyclone that became a tropical depression two days after its formation. On 7 August, when the cyclone passed over the Sea of Japan, it was already positioned as an extratropical cyclone. Figure 13 shows the dynamic spectrograms of the laser strainmeter in the ranges of the “voice of the sea” microseisms and wind wave manifestation.
The manifestations of the “voice of the sea” during the propagation of the Francisco typhoon were rather short-lived. They began at 20:00 UTC on 7 August 2019 and lasted for about 10 h. This was most likely due to the fact that the typhoon crossed the entire Sea of Japan in a day, following to the northeast from the Korean Peninsula. The peak frequency of infrasound oscillations of the “voice of the sea” during this time was 8.3 Hz.
2.9. Typhoon Goni
Typhoon Goni, which originated on 14 August 2015 east of the Mariana Islands, moved mainly in the westward direction and abruptly changed its direction of movement to the north on 21 August. After passing over the Sea of Japan, the cyclone crossed the coastline of the Primorsky Territory and rapidly moved inland, quickly stopping the wind effect on the Sea of Japan. Figure 14 shows a spectrogram of the “voice of the sea” infrasound signal resulting from the passage of the typhoon. At the same time, we were not able to distinguish microseismic fluctuations of the wind wave in the data, so the figure does not show a spectrogram of this range.
Development of the studied infrasound oscillations began in the morning of 26 August 2015, at about 4:00 UTC. The center of the typhoon during this period was located over the Sea of Japan and moved towards Povorotny Cape in the south of the Primorsky Territory. The peak frequency of the general oscillation range was 7.95 Hz.
The “voice of the sea” activity was the highest around 10:00 am UTC, with a peak frequency of approximately 8.05 Hz. The center of the typhoon was moving north. Attenuation began at 20:00 UTC, at the moment when the center of the typhoon entered the mainland zone of the Primorsky Territory.
2.10. Typhoon Talim
Talim was named the eighteenth typhoon in 2017. It was born on 6 September 2017. The trajectory of the typhoon did not directly affect the territory of the Primorsky Territory. After changing direction on 15 September 2017, the typhoon moved along the Japanese archipelago, capturing the waters of the Sea of Japan with the western part of the vortex. Figure 15 shows the dynamic spectrogram of the laser strainmeter in the area of infrasound oscillations of the “voice of the sea” during the movement of the Talim typhoon into the Sea of Japan.
The onset of the manifestations of the studied oscillations was at 05:00 on 18 September 2017. The center of the typhoon in this time interval was located over Hokkaido Island moving north, and its vortex currents had a significant impact on the Sea of Japan. The peak frequency was 8.9 Hz. The general range of infrasound oscillations was 7.6–10.5 Hz.
The strongest manifestations were observed at 13:00 UTC on 18 September 2017, with a peak frequency of 8.86 Hz. The center of the typhoon was located over the southern coast of Sakhalin Island and continued to move north. The rear of the typhoon continued to affect the northern part of the Sea of Japan. At the same time, the cyclone continued to draw in the atmospheric masses, which caused prevailing southwestern winds throughout the Sea of Japan water area.
Gradual attenuation of the manifestations of the “voice of the sea” was observed from 18:00 UTC on 18 September 2017 and continued until 12:00 on 19 September 2017.
3. Discussion of the Results
Exploring the spectra of signals from coastal laser strainmeters during the movement of tropical cyclones in the Sea of Japan, we found microseisms of the “voice of the sea” at frequencies in the range from 6 to 11 Hz. We assume that the range of oscillations and their central frequency depend on the wind speed of a tropical cyclone vortex and its trajectory. As a result of studying the archive data of the coastal laser strainmeter, we found a significant number of periods of excitation of infrasound signals in the “voice of the sea” range (from 6 to 11 Hz). We have looked at the ten most striking cases of the generation of such signals and their registration by the measuring complex.
The period of microseismic oscillations changes when the wind pressure field moves across the sea area. By the occurrence of the “voice of the sea” microseisms, there is no direct dependence of their variations on changes in the amplitude of primary and secondary microseisms. The correlation between the appearance and disappearance of the “voice of the sea” microseisms and the primary microseisms is preserved. Let us present a comparative Table 2, in which we indicate the duration of the infrasound signals of the “voice of the sea” recorded by the laser strainmeter. The table also shows the bandwidth of the recorded signal, with a separate indication of the change in frequency with maximum amplitude, during the influence of typhoons on the Sea of Japan.
Analyzing the data in the table, we can notice that the generation time of infrasound waves has quite long periods. Generation of a low-frequency signal for 10 h, as in the case of typhoons Goni and Francisco, can affect the environment. Typhoons such as Matmo, Goni and Francisco had rather low signal amplitudes, so the range of infrasound oscillations is in the band of about 1.5 Hz. Some ranges of infrasound oscillations reach a width of up to 4.5 Hz. If you pay attention to the pattern of typhoon movement in the region, you can see that two typhoons—Bolaven and Chan-Hom—from the above list passed east of the measuring range, affecting the Sea of Japan in the eastern part, where the southerly wind direction prevails. We can note that during the propagation of these typhoons, the average frequency of infrasound oscillations with maximum amplitude was 7.8 Hz. A number of typhoons: Danas, Francisco, Soulik, Matmo passed with their center to the east of the measuring range, completely influencing the northwestern part of the Sea of Japan with their vortex structure, moving along its coast to the northeast. For these typhoons, the average frequency with the dominant amplitude was about 8.3 Hz. The trajectory of the Sanba typhoon also approximately corresponded to the direction of movement of this group of cyclones, but this typhoon came out with its center in the area of the city of Vladivostok. The average frequency of infrasound signal with the maximum amplitude, generated by this typhoon, was 8.4 Hz. Two typhoons from the above list—Goni and Lionrock—approached the Far Eastern region of Russia from the west. At the same time, Goni typhoon was crossing the Sea of Japan for a day and a half, unlike the Lionrock typhoon which rapidly crossed the Sea of Japan from east to west. The average frequencies with the maximum amplitude for these typhoons were also close: 8 Hz during the influence of the Goni typhoon and 7.8 Hz during the influence of the Lionrock typhoon. The Talim typhoon, whose trajectory differs from the rest of the group, moved along the western coast of the Japanese Islands, influencing the water area of the Sea of Japan with the western part of the cyclonic vortex. As a result of its action, a signal was generated with a bandwidth of about 3 Hz and the maximum amplitude at the frequency of 8.8 Hz.
4. Conclusions
When registering oscillations of the Earth’s crust with a system of laser strainmeters, microseisms of the “voice of the sea” were detected in the range from 6 to 12 Hz. We studied the most powerful manifestations of microseisms of infrasound oscillations of the “voice of the sea” over the past ten years, on the basis of archive data from laser strainmeters. The studied infrasound oscillations of the “voice of the sea” have different frequency bands and different frequencies with the maximum signal amplitude, which depend on the trajectory of a typhoon and the force of wind affecting a water area. The time of typhoon impact on the sea area affects the frequency range of microseismic oscillation generation. In this case, the effect of wind in the area of the measuring ground influences only the manifestation of parasitic eigen oscillations of structures and blocks, located on the measuring range.
The prospects of seismoacoustic monitoring methods are due to the fact that the speed of signals resulting from the action of typhoons, and propagating in the earth’s crust, is much higher than the speed of oscillations and waves propagating in air and water, and also much higher than the speeds of tropical cyclones.
State-of-the-art technologies for collecting and processing satellite data will make it possible to determine the key characteristics of the environment in order to comprehensively monitor hazardous natural phenomena such as typhoons, aiming for mitigation and reduction of risk [6].
Combining methods of satellite monitoring of typhoons, and methods of seismoacoustic monitoring, is very effective and will make it possible to assess the critical parameters of the water and air environments in zones of active tropical cyclogenesis, based on the combined use of various satellite and ground-based data; this will contribute to the development of a unified system to observe typhoons, and the areas of their origin and development, and also provide more reliable warnings for these catastrophic processes.
Author Contributions
Conceptualization, writing—original draft preparation, investigation, work with graphic material—V.C. and G.D.; writing—original draft preparation, writing—review and editing—V.C. and G.D.; investigation, data analysis, comparative analysis—E.G.; systematization and analysis of satellite data—G.T. All authors have read and agreed to the published version of the manuscript.
Funding
The work was carried out with financial support of the project by the Russian Federation, represented by the Ministry of Science and Higher Education of the Russian Federation, the Agreement No. 075-15-2020-776.
Data Availability Statement
3rd Party Data. Restrictions apply to the availability of these data.
Conflicts of Interest
The authors declare no conflict of interest.
References
- Dolgikh, G.I.; Gusev, E.S.; Chupin, V.A. The Nature of the “Voice of the Sea”. Dokl. Earth Sci. Sect. 2018, 481, 912–915. [Google Scholar] [CrossRef]
- Shuleikin, V.V. On Sea Voice. C. R. Acad. Sci. USSR 1935, 3, 259. [Google Scholar]
- Dolgikh, G.; Chupin, V.; Gusev, E. Microseisms of the “Voice of the Sea”. IEEE Geosci. Remote Sens. Lett. 2020, 17, 750–754. [Google Scholar] [CrossRef]
- Perepelkin, V.G.; Kulichkov, S.N.; Chunchuzov, I.P.; Repina, I.A. On experience in recording the voice of the sea in the water area of the Black Sea. Izv. Atmos. Ocean. Phys. 2015, 51, 716–728. [Google Scholar] [CrossRef]
- Semenov, A.G. On “Voice of Sea” Generation Mechanism. Int. J. Geosci. 2013, 4, 116–128. [Google Scholar] [CrossRef] [Green Version]
- Dolgikh, G.I.; Chupin, V.A.; Gusev, E.S.; Timoshina, G.A. Cyclonic Process of the “Voice of the Sea” Microseism Generation and Its Remote Monitoring. Remote Sens. 2021, 13, 3452. [Google Scholar] [CrossRef]
- Bondur, V.G.; Krapivin, V.F. Space Monitoring of Tropical Cyclones. Mosc. Sci. World 2014, 16, 508. (In Russian) [Google Scholar]
- Eremenko, A.S.; Kachur, V.A. Calculation of pressure in tropical cyclones using satellite data. Rus. Meteorol. Hydrol. 2019, 44, 588–593. [Google Scholar] [CrossRef]
- Bondur, V.G.; Pulinets, S.A. Effect of Mesoscale Atmospheric Vortex Processes on the Upper Atmosphere and Ionosphere of the Earth. Izv. Atmos. Ocean. Phys. 2012, 48, 871–878. [Google Scholar] [CrossRef]
- Bondur, V.G.; Krapivin, V.F.; Savinyh, V.P. Monitoring i Prognozirovanie Prirodnyh Katastrof (Monitoring and Forecasting of the Natural Disasters); Nauchnyy MIR: Moscow, Russia, 2009; p. 692. (In Russian) [Google Scholar]
- Klemas, V. The Role of Remote Sensing in Predicting and Determining Coastal Storm Impacts. J. Coast. Res. 2009, 256, 1264–1275. [Google Scholar] [CrossRef] [Green Version]
- Savin, A.I.; Bondur, V.G. Scientific fundamentals of creation and diversification of the global aerospace systems. Atmos. Ocean. Opt. 2000, 13, 38–53. [Google Scholar]
- Bondur, V.G.; Pulinets, S.A.; Kim, G.A. Role of variations in galactic cosmic rays in tropical cyclogenesis: Evidence of Hurricane Katrina. Dokl. Earth Sci. Sect. 2008, 422, 1124–1128. [Google Scholar] [CrossRef]
- Sharkov, E.A.; Shramkov, Y.N.; Pokrovskaya, I.V. Increased water-vapor content in the atmosphere of tropical latitudes as a necessary condition for the genesis of tropical cyclones. Izv. Atmos. Ocean. Phys. 2012, 48, 900–908. [Google Scholar] [CrossRef]
- Dolgikh, G.I.; Kovalev, S.N.; Koren’, I.A.; Ovcharenko, V.V. A two-coordinate laser strainmeter. Izv. Phys. Solid Earth. 1998, 11, 76–81. [Google Scholar]
- Dolgikh, G.I.; Budrin, S.S.; Dolgikh, S.G.; Chupin, V.A. Direction finding of geospheric disturbances by laser strainmeters. Photonics 2021, 8, 656–665. [Google Scholar]
- Dolgikh, G.I.; Chupin, V.A.; Gusev, E.S. Research of the area of generation of high-frequency infrasound oscillations in the Sea of Japan, caused by typhoons. IEEE Geosci. Remote Sens. Lett. 2022, 19, 1000605. [Google Scholar] [CrossRef]
- Yakovenko, S.V.; Budrin, S.S.; Dolgikh, S.G.; Chupin, V.A.; Shvets, V.A. A hydrophysical laser-interference complex. Instrum. Exp. Tech. 2016, 59, 282–286. [Google Scholar] [CrossRef]
Figure 1.
Scheme of tracks of typhoons, the influence of which resulted in generation of microseisms of the “voice of the sea” infrasound oscillations. (Typhoon ID number in brackets).
Figure 1.
Scheme of tracks of typhoons, the influence of which resulted in generation of microseisms of the “voice of the sea” infrasound oscillations. (Typhoon ID number in brackets).

Figure 2.
Suomi NPP images of studied tropical cyclones.

Figure 3.
Typhoon Lionrock trajectory aligned with the images made by the “Himawari-8” satellite in the visible range.
Figure 3.
Typhoon Lionrock trajectory aligned with the images made by the “Himawari-8” satellite in the visible range.

Figure 4.
Dynamic spectrograms of laser strainmeter data during influence of Lionrock typhoon.

Figure 5.
Typhoon Bolaven trajectory aligned with the images made by the “Himawari-7” satellite in the infrared range. Red star—location of laser strainmeters.
Figure 5.
Typhoon Bolaven trajectory aligned with the images made by the “Himawari-7” satellite in the infrared range. Red star—location of laser strainmeters.

Figure 6.
Table of typhoon Bolaven characteristics (left) and dynamic spectrograms of laser strainmeter during its impact (right).
Figure 6.
Table of typhoon Bolaven characteristics (left) and dynamic spectrograms of laser strainmeter during its impact (right).

Figure 7.
MTSAT-2 images of the Bolaven tropical cyclone.

Figure 8.
Dynamic spectrograms of laser strainmeter data during influence of Sanba typhoon.

Figure 9.
Dynamic spectrograms of laser strainmeter data during influence of Matmo typhoon.

Figure 10.
Dynamic spectrograms of laser strainmeter data during influence of Chan-hom typhoon.

Figure 11.
Dynamic spectrograms of laser strainmeter data during influence of Soulik typhoon.

Figure 12.
Dynamic spectrograms of laser strainmeter data during influence of Danas typhoon.

Figure 13.
Dynamic spectrograms of laser strainmeter data during influence of Francisco typhoon.

Figure 14.
Dynamic spectrogram of laser strainmeter data during influence of Goni typhoon.

Figure 15.
Dynamic spectrogram of laser strainmeter data during influence of Talim typhoon.


Table 1.
Characteristics of typhoons.
| Typhoon Name (Year, Number) | Observation Time | Typhoon Lifetime | Minimum Pressure (hPa) | Maximam Wind (Knots) |
|---|---|---|---|---|
| Bolaven (2012 15) | 28.08.12–31.08.12 | 20.08.12–29.08.12 | 910 | 100 |
| Sanba (2012 16) | 17.09.12–20.0912 | 11.09.12–18.0912 | 900 | 110 |
| Matmo (2014 10) | 25.07.14–28.07.14 | 17.07.14–25.07.14 | 965 | 70 |
| Chan-hom (2015 9) | 12.07.15–14.07.15 | 30.06.15–13.07.15 | 935 | 90 |
| Goni (2015 15) | 26.08.15–26.08.15 | 14.08.15–25.08.15 | 930 | 100 |
| Lionrock (2016 10) | 30.08.16–02.09.16 | 21.08.16–30.09.16 | 940 | 90 |
| Talim (2017 18) | 18.09.17–19.09.17 | 19.09.17–17.09.17 | 935 | 95 |
| Soulik (2018 19) | 23.08.18–25.08.18 | 16.08.20–24.08.20 | 950 | 85 |
| Danas (2019 5) | 20.07.19–24.07.19 | 16.07.19–20.07.19 | 985 | 45 |
| Francisco (2019 8) | 07.08.19–08.08.19 | 02.08.19–07.08.19 | 970 | 70 |
Table 2.
Frequency characteristics of the infrasound signal “voice of the sea”.
| Typhoon (Sequence Number) | Frequency Range, Hz | Peak Frequency, Development, Hz | Peak Frequency, max. Amp., Hz | Peak Frequency, Attenuation, Hz | Signal Duration, h |
|---|---|---|---|---|---|
| Group 1 | |||||
| Bolaven (1215) | 6.5–9.3 | 7.90 | 7.72 | 7.86 | 29 |
| Chan-hom (1509) | 6.7–10.6 | 7.87 | 7.90 | 7.85 | 27 |
| Group 2 | |||||
| Danas (1905) | 6.1–10.6 | 8.0 | 8.5 | 8.0 | 34 |
| Francisco (1908) | 7.4–8.8 | 8.3 | 8.3 | 8.3 | 10 |
| Matmo (1410) | 7–8.7 | 8.20 | 8.30 | 8.27 | 14 |
| Soulik (1819) | 6.5–9.6 | 7.52 | 8.50 | 8.80 | 26 |
| Sanba (1216) | 6.3–9.4 | 8.4 | 8.5 | 8.4 | 25 |
| Group 3 | |||||
| Goni (1515) | 7.3–9.2 | 7.95 | 8.05 | 8.0 | 10 |
| Lionrock (1610) | 6.5–8.5 | 7.5 | 7.7 | 7.8 | 29 |
| Group 4 | |||||
| Talim (1718) | 7.6–10.5 | 8.95 | 8.86 | 8.75 | 30 |
Publisher’s Note: MDPI stays neutral with regard to jurisdictional claims in published maps and institutional affiliations. |
© 2022 by the authors. Licensee MDPI, Basel, Switzerland. This article is an open access article distributed under the terms and conditions of the Creative Commons Attribution (CC BY) license (https://creativecommons.org/licenses/by/4.0/).
Share and Cite
MDPI and ACS Style
Chupin, V.; Dolgikh, G.; Gusev, E.; Timoshina, G. Remote Sensing of Infrasound Signals of the “Voice of the Sea” during the Evolution of Typhoons. Remote Sens. 2022, 14, 6289. https://doi.org/10.3390/rs14246289
AMA Style
Chupin V, Dolgikh G, Gusev E, Timoshina G. Remote Sensing of Infrasound Signals of the “Voice of the Sea” during the Evolution of Typhoons. Remote Sensing. 2022; 14(24):6289. https://doi.org/10.3390/rs14246289
Chicago/Turabian StyleChupin, Vladimir, Grigory Dolgikh, Egor Gusev, and Galina Timoshina. 2022. "Remote Sensing of Infrasound Signals of the “Voice of the Sea” during the Evolution of Typhoons" Remote Sensing 14, no. 24: 6289. https://doi.org/10.3390/rs14246289
Note that from the first issue of 2016, this journal uses article numbers instead of page numbers. See further details here.