


Assessment of Grassland Degradation on the Tibetan Plateau Based on Multi-Source Data
by
 , , and
Shanshan Wang
1,
Lizhi Jia
2,*,
Liping Cai
1,
Yijia Wang
3,
Tianyu Zhan
3,
Anqi Huang
4 and
Donglin Fan
1 1
School of Geography and Tourism, Qufu Normal University, Rizhao 276800, China
2
Lhasa Plateau Ecosystem Research Station, Key Laboratory of Ecosystem Network Observation and Modeling, Institute of Geographic Sciences and Natural Resources Research, Chinese Academy of Sciences, Beijing 100101, China
3
Key Laboratory of Earth Surface Processes and Resource Ecology, Faculty of Geographical Science, Institute of Land Surface System and Sustainable Development, Beijing Normal University, Beijing 100875, China
4
School of Geographical Sciences, Nanjing University of Information Science and Technology, Nanjing 210044, China
*
Author to whom correspondence should be addressed.
Remote Sens. 2022, 14(23), 6011; https://doi.org/10.3390/rs14236011
Submission received: 24 October 2022
/
Revised: 15 November 2022
/
Accepted: 22 November 2022
/
Published: 27 November 2022
(This article belongs to the Special Issue Research on the Structure and Function of Forest and Grassland Based on Multi-Source Remote Sensing Data)
Abstract
:Grassland is one of the most widely distributed ecosystems on the Tibetan Plateau (TP) accounting for about 60% of the total area. The grassland degradation has spread throughout the TP, and the scope and degree are increasing. The inconsistency of multi-source data poses a great challenge to accurately obtaining information about grassland degradation on the TP. This study used five land cover products and six vegetation indexes to analyze the spatial-temporal change in grassland area and quality at the pixel level across the TP from 2000 to 2020. Then, 279 observed grassland degradation points that were collected from 86 published papers were used to verify the grassland degradation information. The grassland fusion product demonstrated that the grassland area increased by 8.84% from 2000 to 2020, and the rate of grassland degradation exceeded the rate of grassland greening during 2010–2020. The superimposed six vegetation indexes showed that 25.88% of the grassland quality has been degraded on the TP from 2000 to 2020. In Changdu City, Ganzi Tibetan Autonomous Prefecture, Gannan Tibetan Autonomous Prefecture, Yushu Tibetan Autonomous Prefecture, Aba Tibetan and Qiang Autonomous Prefecture, Rikaze City, Shannan City and Nagqu City, the grassland quality degraded by more than in 20% and the degraded grassland area exceeded 2000 km2. The observed grassland degradation points were mainly distributed in the northeastern and central parts of the TP. The consistency of six vegetation indexes with the observed grassland degradation points on the TP was 56.63%, with solar-induced chlorophyll fluorescence (SIF) being more effective than other vegetation indexes for monitoring grassland degradation on the TP. In general, the degradation of grassland on the TP has been a looming problem in recent decades.
1. Introduction
Grassland, covering about 40% of the earth’s terrestrial area, is an important part of the global terrestrial ecosystem [1]. Grassland is not only vital for supporting ecosystem functions, services, and livelihoods of millions of humans but also plays a key role in the conservation of biodiversity, climate regulation and global biogeochemical cycles [2,3]. However, grasslands have been severely degraded for decades due to frequent human activities and environmental changes [4,5]. At present, 39.06% of grasslands in the world have been degraded, of which nearly 5% experienced extreme degradation [6]. Grassland degradation not only causes huge environmental problems such as soil erosion and land desertification but also poses a great threat to the food, fodder, fuel and medicine that human beings rely on [7,8]. A series of problems brought about by grassland degradation will seriously affect the sustainable development of the pastoral area. Thus, grassland degradation has gradually become one of the key issues to be solved urgently [9].
The Tibetan Plateau (TP) is known as the “Roof of the World” and the “Third Pole of the Earth”. Due to its unique geographical location and altitude, the TP plays an important role in regulating climate and water resources in East Asia and even the Northern Hemisphere [10]. The grassland is the most widely distributed type of ecosystem on the TP, accounting for about 70% of the total area and providing a source of livelihood for more than 6 million herders [11]. The grassland of the TP is a treasured reservoir of biodiversity and a key carbon pool [12]. Due to the limitation of harsh environmental conditions, the TP grassland ecosystem is very sensitive to external disturbances [13]. Once the grassland on the TP is degraded, it will be difficult to recover [14,15]. Under the combined influence of potential factors such as overgrazing, climate change, permafrost and soil disturbance by small mammals, the grasslands of the TP face serious threats of degradation [16]. According to net primary productivity (NPP, NPP is the product of photosynthesis) data, nearly 38.8% of grasslands on the TP have been degraded from 2001 to 2013 [17]. Liu et al. found that 63% of the “Three-River Headwaters” region experienced grassland degradation from 2000 to 2016, and 2% of the region was at risk of desertification [18]. Grassland degradation is a process from quality degradation to area reduction, and the dynamic process of grassland degradation on the TP has not been well described and understood in previous studies. Therefore, a dynamic analysis of the TP grassland ecosystem from quality degradation to area reduction is necessary for grassland ecosystem restoration.
Field surveys and location monitoring are capable of obtaining accurate information on grassland degradation, while they are time-consuming and costly [19]. In recent years, remote sensing monitoring has been widely used as a cost-effective method for large-scale grassland degradation monitoring [20,21]. As satellite-based earth observation techniques improve and extraction algorithms develop, different land cover products and various vegetation indexes have emerged [22]. Meanwhile, the inconsistencies among land cover products increase the uncertainty of the study results [23,24]. Although many researchers using vegetation indexes to reflect the grassland degradation on the TP have been published, most studies only considered the degradation status of grassland under a single remote sensing vegetation index. There is still a high degree of uncertainty in monitoring and assessing grassland degradation using a single vegetation index. Meanwhile, the differences in sensors, classification systems and resolutions of different remote sensing products cause great inconsistencies among them, making it difficult to obtain accurate grassland degradation information [25]. For example, significant differences in global vegetation trends were found by comparing the NDVI from Terra (2001–2015) and EVI from Aqua Satellites (2003–2015) [26]. The analysis of NDVI with three different sensor systems showed that although the temporal consistency of all examined datasets increased after 2000 by using advanced platforms and sensors, the NDVI values remained different trends at both global and regional scales [27]. Therefore, it is of great significance to use multi-source remote sensing information combined with measured data to obtain more accurate grassland degradation information.
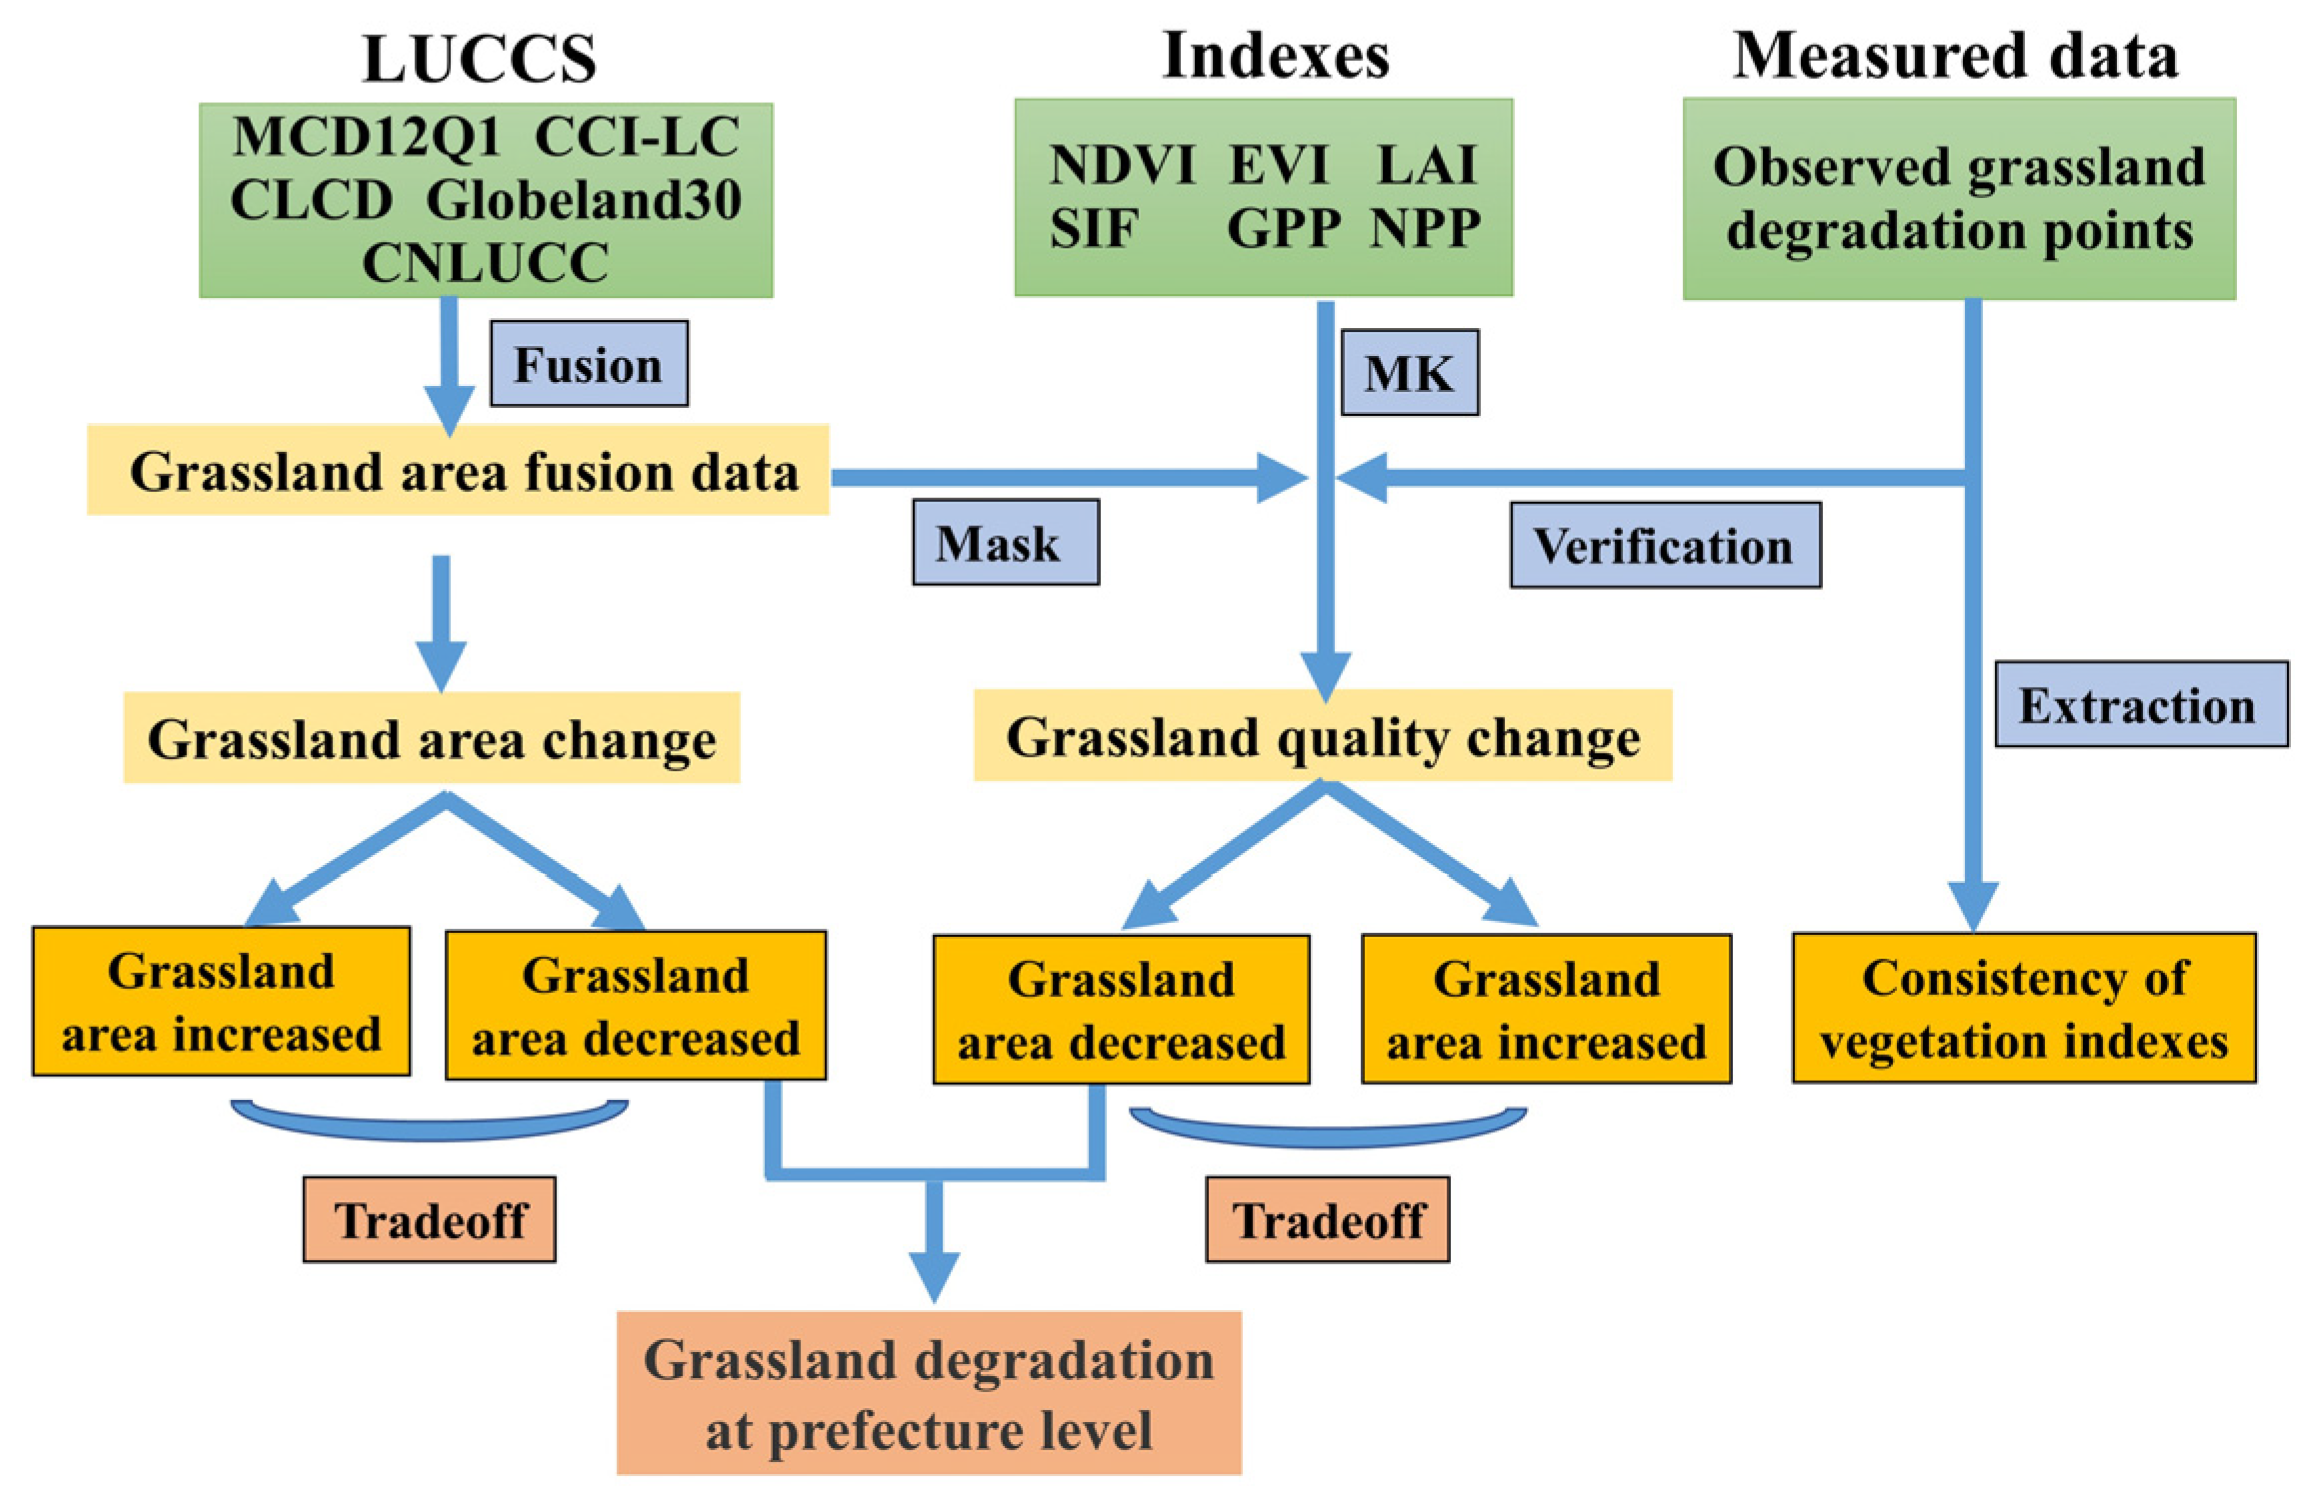
This aim of this article was to analyze long-time series of multi-source remote sensing products by spatial superposition and raster trending to assess the spatial-temporal distribution of grassland degradation across the TP and to test the accuracy of remote sensing indexes (Figure 1). The objectives of this study were to (1) assess spatial-temporal variations in grassland area based on multi-source land cover products at the pixel level across the TP; (2) evaluate spatial-temporal variations in grassland quality based on six vegetation indexes at the pixel level across the TP; (3) analysis the consistency of six vegetation indexes based on the observation points of grassland degradation on the TP.
2. Materials and Methods
2.1. Study Area
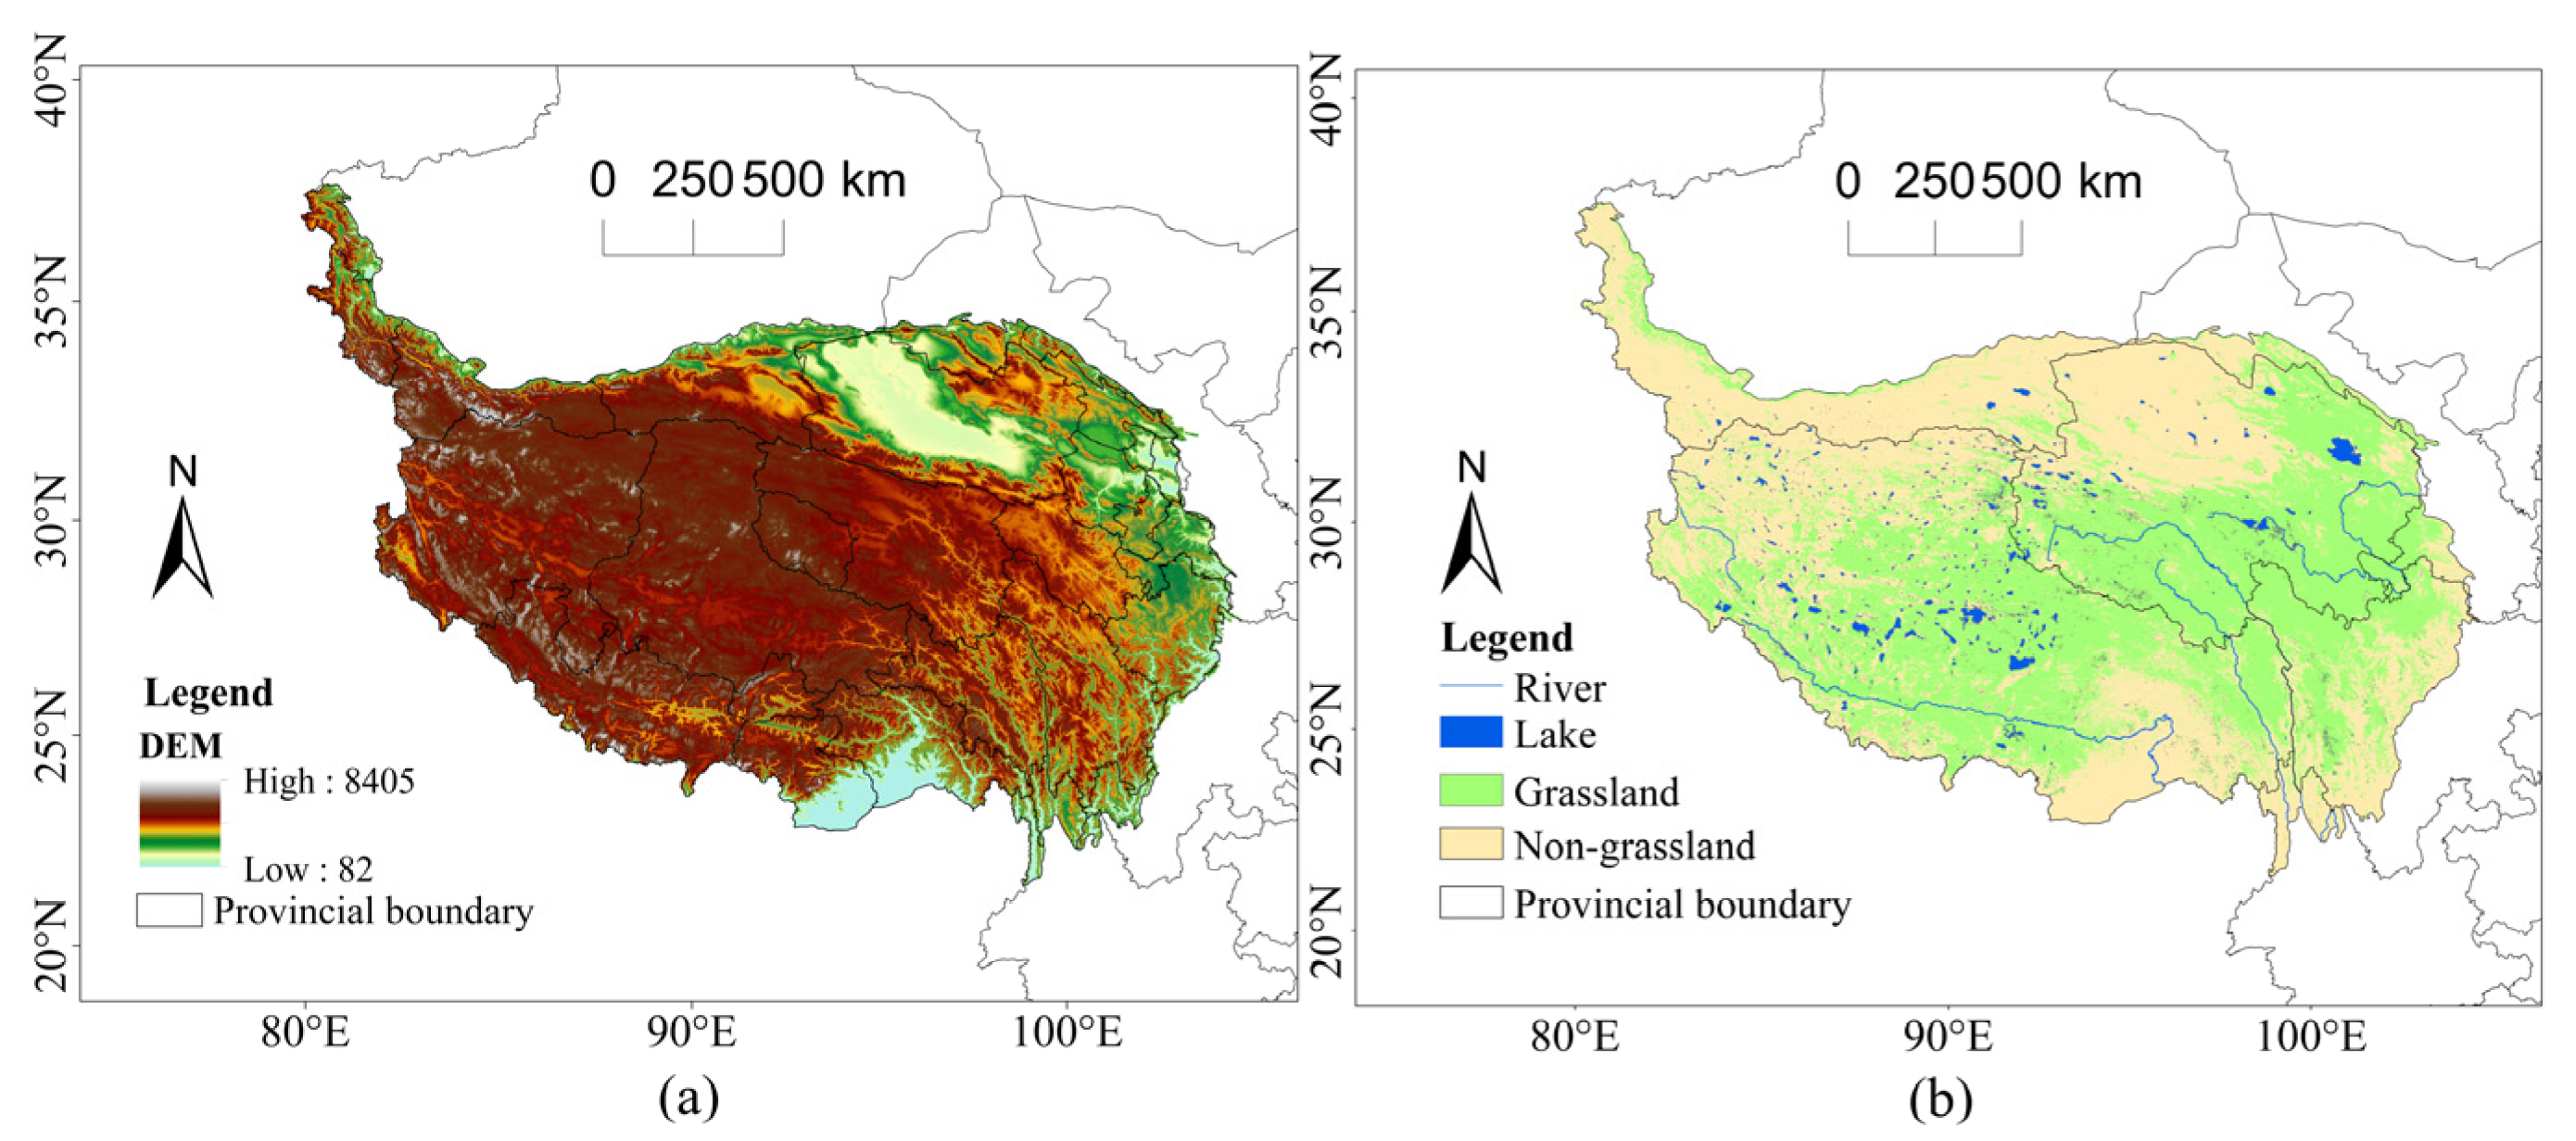
The TP is located in the south west of China (26°00′12″N ∼ 39°46′50″N, 73°18′52″E ∼ 104°46′59″E). As the largest plateau in China and the highest in the world, the TP has an average altitude of over 4000 m and a total area of about 2.5 million km2 (Figure 2a). The TP is surrounded by many mountain ranges, where Mount Qomolangma is the highest mountain in the world. In addition, the TP and its surrounding areas have the largest number of glaciers outside of the poles [28]. Therefore, the TP is the headwater of many major rivers in Asia such as the Yangtze River Yellow River, etc., and is known as the “Water Towers in Asia” (Figure 2b). The climate of TP is complex and diverse, mainly influenced by the interaction of the Indian monsoon and west wind, with limited influence from the East Asian monsoon, characterized by low temperatures, small annual differences in temperature, uneven precipitation, and strong solar radiation [29,30]. The annual mean temperature on the TP ranges from −2.2 °C to 0 °C, with the lowest temperature of −13.5 °C in January and the highest of 9.7 °C in July [31]. Precipitation is mainly concentrated from June to September, with annual average rainfall between 415 mm and 512 mm and the annual sunshine hours range from 2730 to 2915 h [32]. The TP is the highest plateau ecosystem in the world, including forests, grasslands and shrubland, etc., with nearly three-quarters of its surface covered with various grassland ecosystems (Figure 2b). Meanwhile, these grasslands are important pastures that play an important role in maintaining the ecology and structure of the TP [33].
2.2. Datasets
2.2.1. Land Cover Datasets
Moderate-resolution Imaging Spectroradiometer land cover (MCD12Q1) [34], the Climate Change Initiative Land Cover(CCI-LC) [35], the 30 m Global Land Cover (Globeland30) [36], the Multi-Period Land Use/Land Cover Remote Sensing Monitoring Database in China (CNLUCC) (https://www.resdc.cn/, accessed on 28 January 2021) and the China land cover dataset (CLCD) [37] were chosen to assess grassland changes on the TP (Table 1). The spatial resolutions of the above five land cover products range from 30 to 1000 m. The land cover classification system includes land cover types and land cover fractions. For example, Globeland30 divides land cover types into ten categories, and CCI-LC divides land cover types into 22 categories according to a land cover fraction [38].
2.2.2. Vegetation Index Datasets
Six vegetation index datasets were used to evaluate grassland degradation on the TP (Table 2). The spatial distribution dataset of monthly normalized difference vegetation index (NDVI) in China is based on continuous time series of SPOT/VEGETATION NDVI satellite remote sensing data (http://www.resdc.cn, accessed on 28 January 2021). NDVI has a significant linear correlation with vegetation cover and can be used to estimate grassland cover [39]. The enhanced vegetation index (EVI) minimizes canopy-soil variations and improves sensitivity to dense vegetation conditions. Compared with NDVI, the influence of clouds is reduced and it is more sensitive to vegetation canopy changes [40]. Leaf Area Index (LAI) is defined as half of the total green leaf area per unit of the flat ground area [41]. LAI was significantly correlated with the quality of the ecosystem [42]. Solar-induced chlorophyll fluorescence (SIF) is an indicator of the functional status of actual plant photosynthesis [43]. A global “OCO-2” SIF dataset (GOSIF) with a finer spatial resolution was developed for assessing terrestrial photosynthesis and ecosystem function [44]. NPP is a measure of net carbon and a vital parameter for ecological modeling [45]. Gross primary productivity (GPP) is the amount of energy that is produced at a given time by the major energy producers of the ecosystem in a particular area [46]. Since data for 2000–2020 for each vegetation index were not accurately available, only the available data were analyzed.
2.3. Methods
2.3.1. Data Pre-Processing
Due to the differences in the coordinate system, spatial resolution and classification system, the five land cover products, were preprocessed by transforming projections, unifying resolutions into 1 km resolution and merging grass classification systems (Table 3) [47]. Then the six vegetation remote sensing indexes were preprocessed. The annual data of NDVI, EVI and LAI were obtained by the summer (June to September) of the maximum value composites (MVC). NPP and GPP were obtained by composing the annual average [48].
2.3.2. Analysis of Grassland Area Change Based on Land Cover Products
Grassland area and spatial location on the TP were inconsistent among the five land cover products. To get a more accurate distribution of grassland on the TP, five land cover products were fused with 80% confidence (for each pixel, if three or more of the five land cover products are grassland, this pixel is determined to be grassland). After the five land cover products were overlaid, the areas where three and more products were grassland were screened to obtain grassland fusion products.
The pixels of non-grassland and grassland in 2000 were set to 0 and 1, respectively. The pixels of non-grassland and grassland in 2010 were set to 0 and 3, respectively. The raster calculator was used to superimpose the grassland pixels in 2000 and 2010. There are four results after superposition: 0 represents the conversion of non-grassland to non-grassland, 1 represents the conversion of grassland to non-grassland (degradation), 3 represents the conversion of non-grassland to grassland (greening), and 4 represents unchanged grassland. The areas of grassland degradation and greening on the TP were the areas of pixels 1 and 3, respectively. The same method was used to calculate the grassland degradation and greening area from 2010 to 2020 and 2000 to 2020.
2.3.3. Analysis of Changes in Grassland Quality Based on Vegetation Indexes
Overlaying the grassland fusion product in 2000, 2010 and 2020, the areas where grassland existed in all three years were selected as constant grassland areas. To exclude the interference of grassland area change, constant grassland area in 2000, 2010 and 2020 was used to analyze the quality change. The grassland quality change on the TP was classified into two aspects: vegetation greenness change and carbon sequestration capacity change. In this study, multiple indexes were used to assess the changes in grassland quality on the TP, among which NDVI, EVI and LAI represented vegetation greenness indexes, and SIF, NPP and GPP represented carbon sequestration capacity.
The Sen Trend and the Mann-Kendall trend significance test were combined to analyze the changing trend of the standard grassland on the TP over a long time series [49]. This method has been applied to drought and hydrological change analysis [50]. The Theil-Sen Median method is computationally efficient and effective in reducing the impact of errors and can be calculated by the following formula:
where is the trend of vegetation indexes, Median () represents the median value, i, j are time series, ,
represent the values of the pixel vegetation index at the time i and j, respectively, ∀ is a mathematical symbol that represents the “for all”.
When > 0, it means that the vegetation index in the pixel is on an upward trend; when β < 0, it means the vegetation index in the pixel is on a downward trend.
The Mann-Kendall (MK) test is a nonparametric test for time series trendiness that is unaffected by missing values and outliers. The measurements of this method do not need to obey a normal distribution and are suitable for significance testing of long time series. The test statistic S is calculated using the following formula:
where n is the number of data in the series, is the difference between vegetation indexes of adjacent years, and () is the sign function, which can be calculated as:
The trend test was performed using the test statistic Z. The Z value is calculated as:
where Var is calculated by the following formula:
The Z obeys the standard normal distribution. Under a given significance level (α = 0.05), when |Z| > 1.96, it means that the trend has passed the significance test with a reliability of 95%. The method for judging the significance of the trend is shown in Table 4.
2.3.4. Observed Grassland Degradation Points Collection
Datasets of degraded grassland points were collected from scientific articles from 2000 to 2020. Peer-reviewed journal articles in Chinese journals were collected from the Chinese Journals Database (CNKI), and international journals were collected from the ISI Web of Science and Google Scholar. The following keywords were used: “Qinghai-Tibet Plateau” or “Tibetan Plateau” and “grass” or “grassland”. To obtain datasets of grassland degradation points, we selected articles according to three criteria: (1) the degraded grassland was observed in the field; (2) the observed grassland degradation points were from 2000 to 2020; (3) the latitude and longitude of degraded grassland points were reported. The final database included 279 degraded grassland points from 86 published papers. Then, the observed grassland degradation points were used as verification points to verify the accuracy of the six vegetation indexes in reflecting grassland degradation. The higher the consistency between the remote sensing vegetation index and the observation point, the more accurately the remote sensing vegetation index can reflect the grassland degradation.
3. Results
3.1. The Grassland Area Analysis of the TP
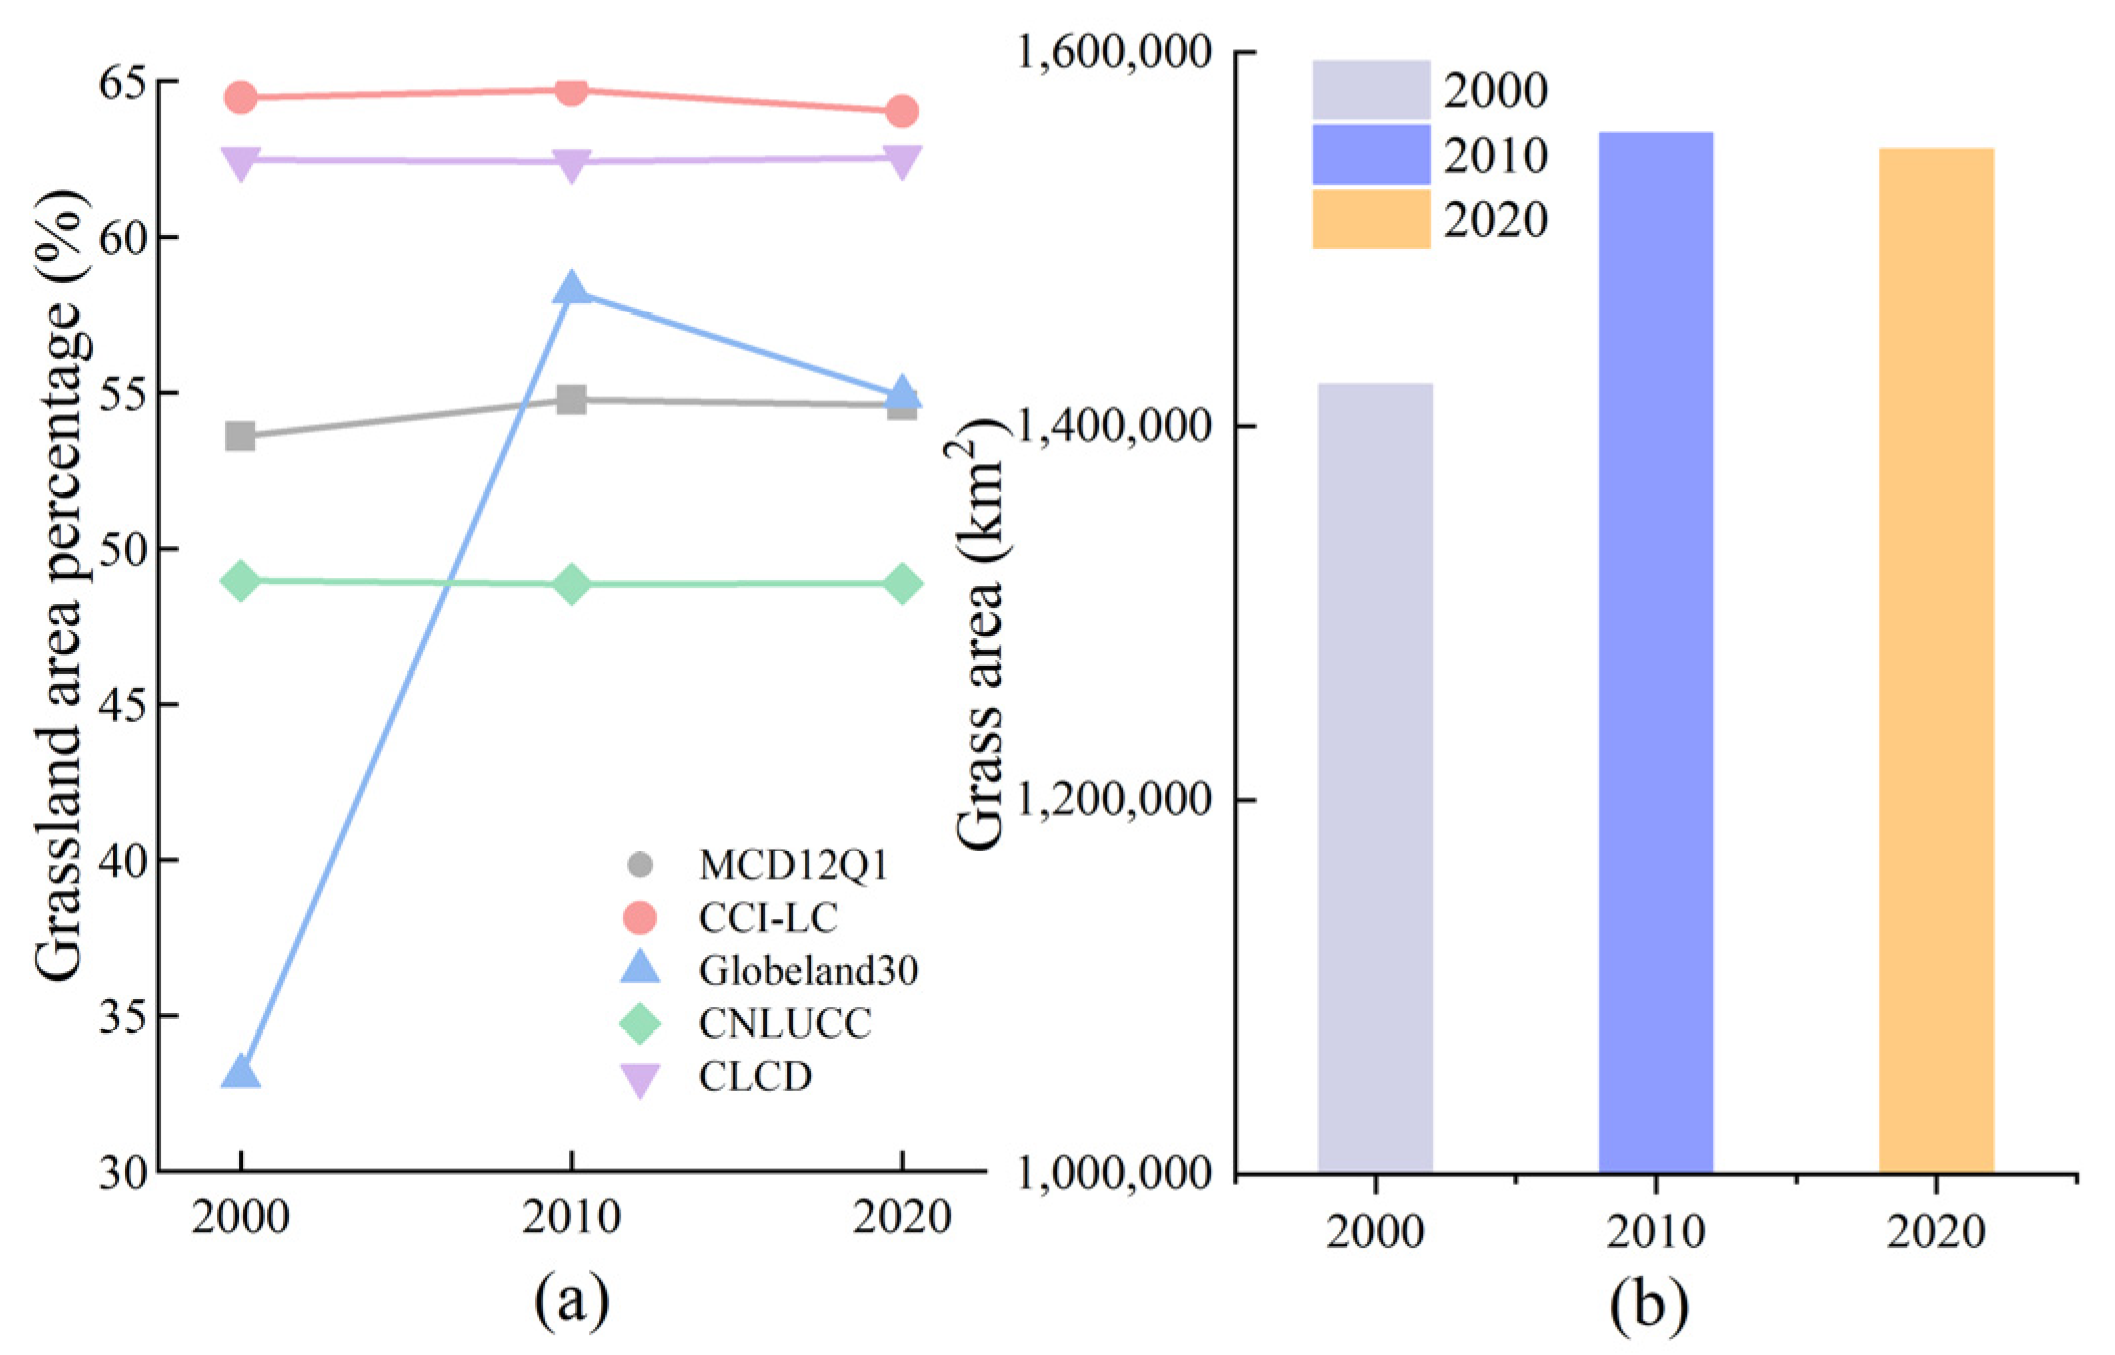
The percentages of grasslands on the TP varied among the five land cover products. The CCI-LC and CLCD demonstrated that the percentages of grassland area on the TP reached more than 60% from 2000 to 2020, while the percentages were about 50% and 45% for MCD12Q1 and CNLUCC, respectively. For Globaland30, the grassland area in 2000 only accounted for 33.08% of the TP, while the percentages exceeded 50% in 2010 and 2020 (Figure 3a).
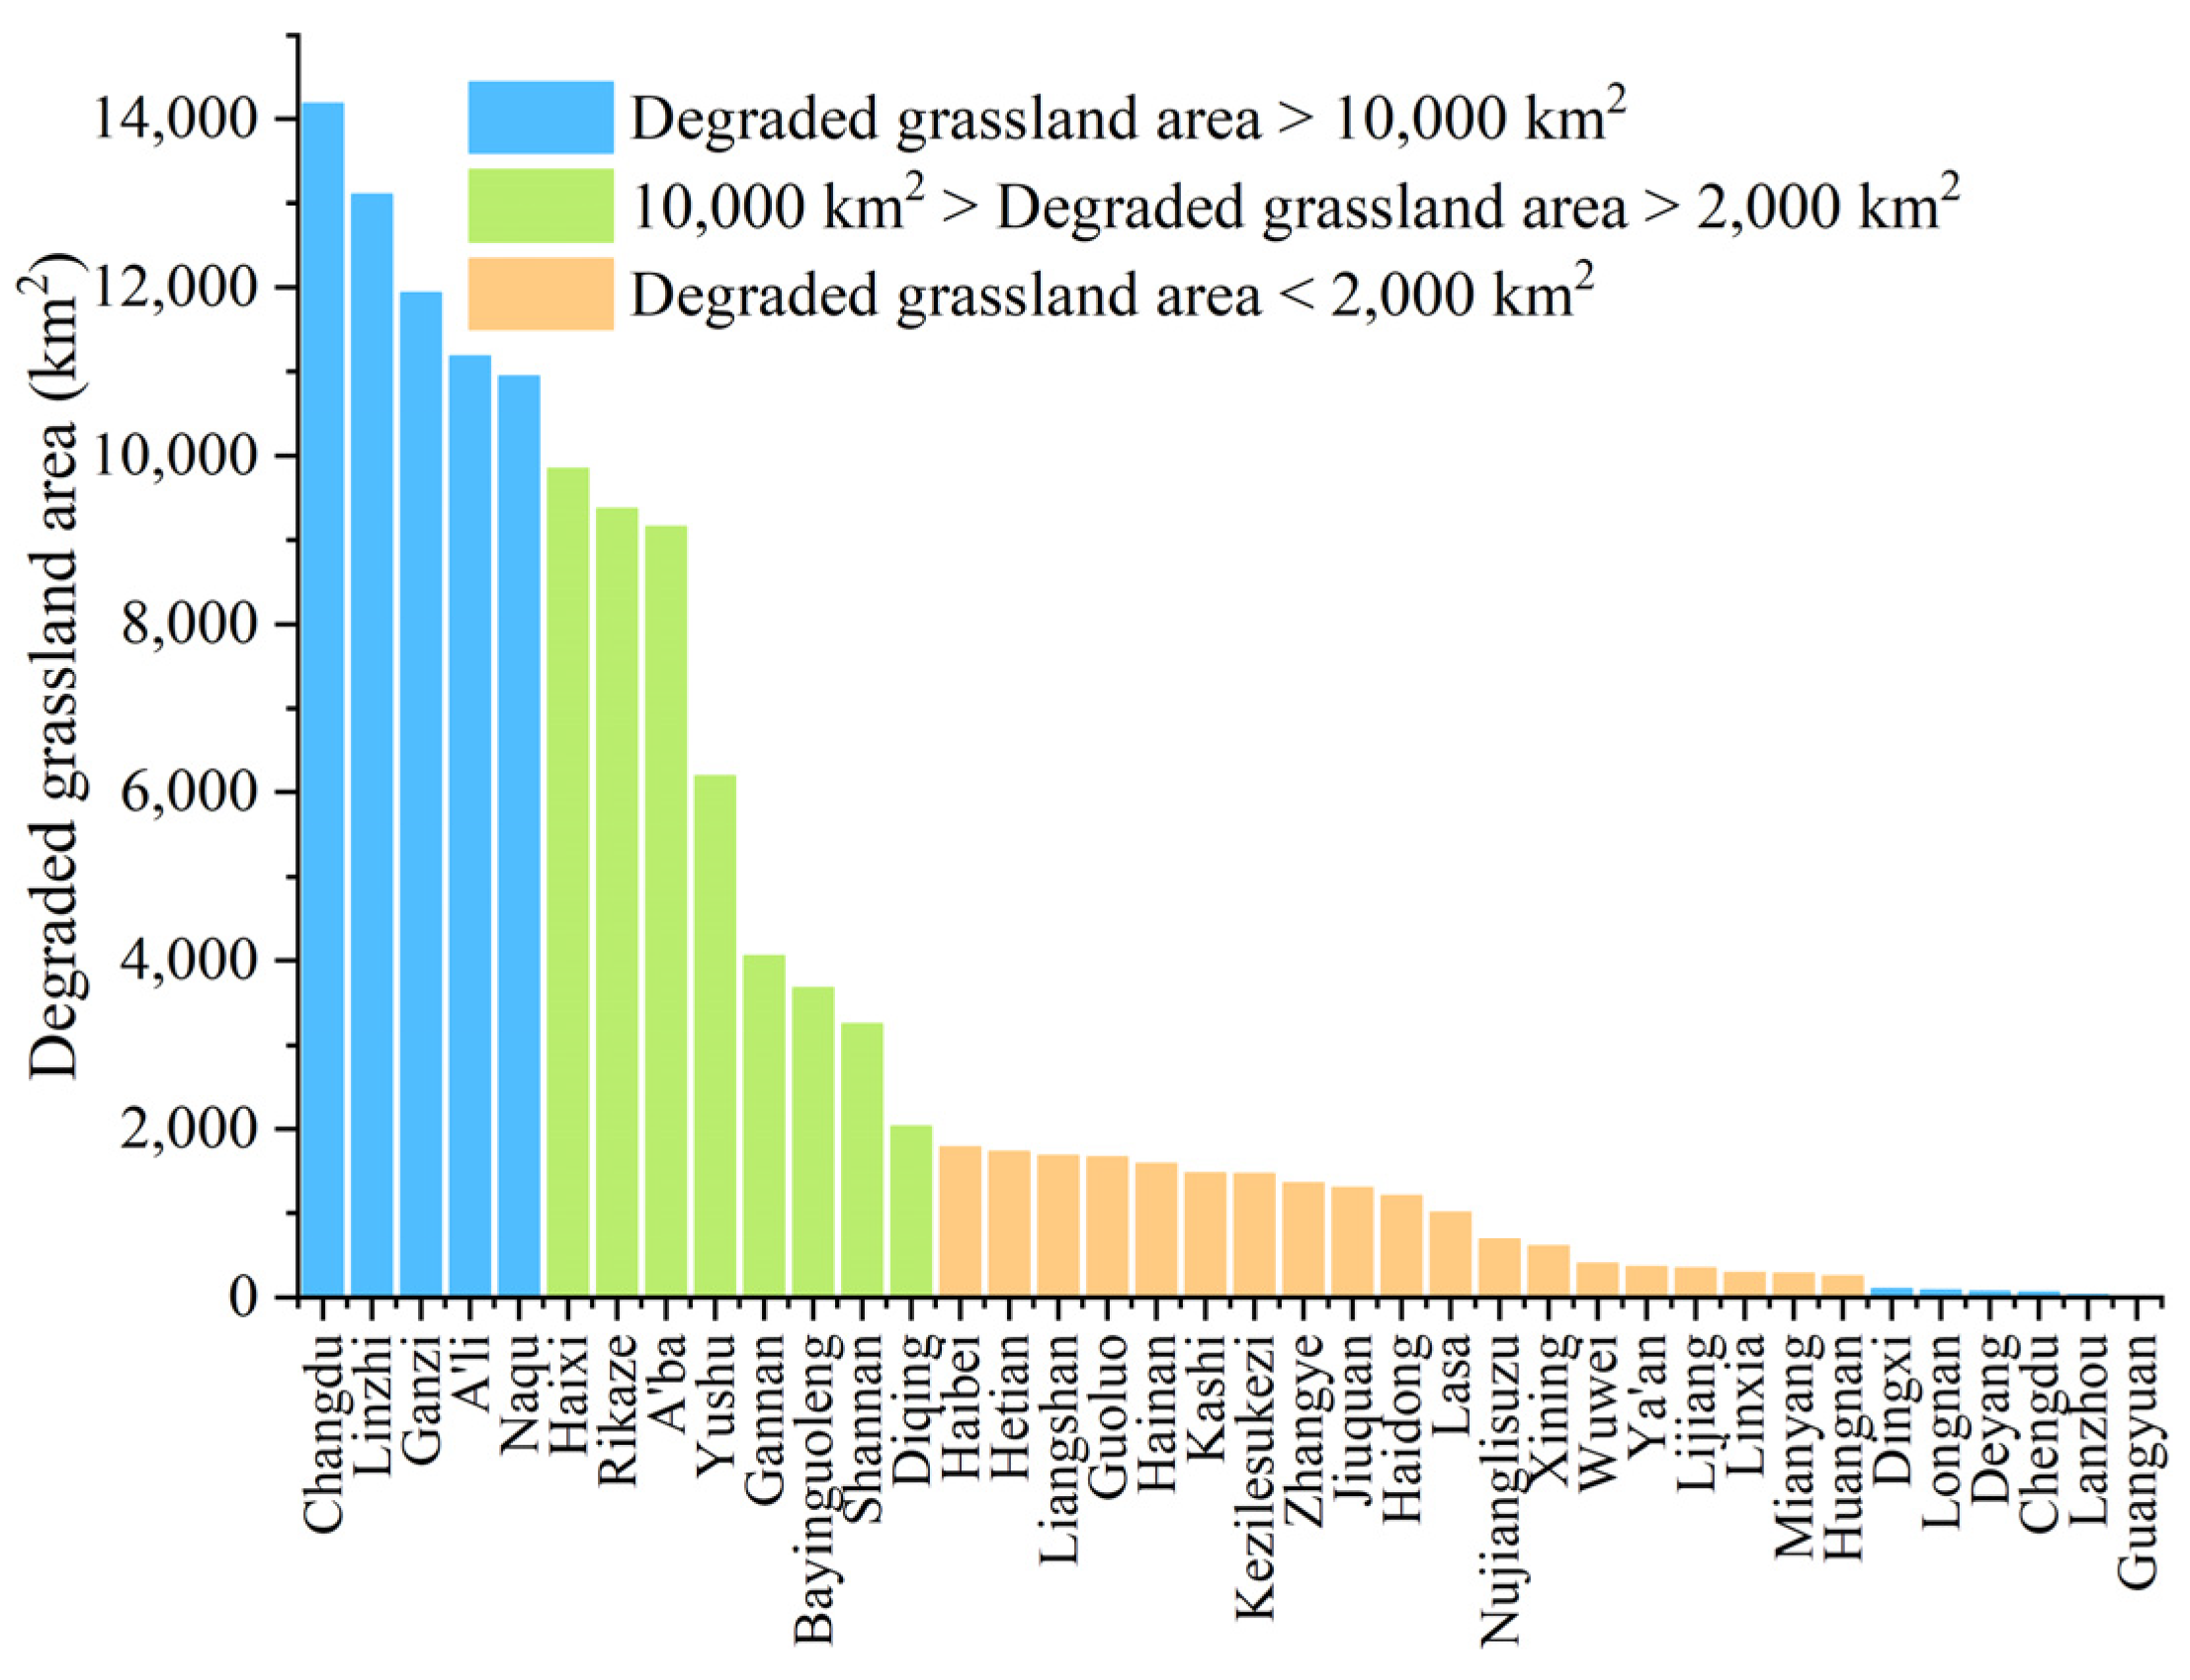
The five land cover products were superimposed to obtain a more accurate area of grassland degradation on the TP. The grassland fusion product showed that the percentages of grassland area on the TP in 2000, 2010 and 2020 were 55.16%, 60.40% and 60.15%, respectively. The grassland area increased by 9.43% from 2000 to 2010 and decreased by 0.54% from 2010 to 2020 (Figure 3b). Thus, the grassland area of the TP increased by 8.84% during the period from 2000 to 2020. From 2000 to 2010, the greening area of grassland (219,317 km2) was much larger than the degradation area (84,387 km2), which means that the grassland area has increased by 134,930 km2. While the grassland greening area has not been able to compensate for the degradation area, which has led to a decrease of 8,455 km2 of grassland on the TP from 2010 to 2020. The total degraded grassland area (mean values of grassland area change in five land cover products) on the TP reached 128,544.52 km2 from 2000 to 2020. Although the area of grassland was expanding from 2000 to 2020, the grassland greening rate is slowing down (from 219,317 km2/10a of 2000–2010 to 126,056 km2/10a of 2010–2020), while the grassland degradation rate is increasing (from 219,317 km2/10a of 2000–2010 to 126,056 km2/10a of 2010–2020). The rate of grassland degradation exceeded the rate of greening during 2010–2020. Regions with degraded grassland of more than 10,000 km2 included Changdu City, Linzhi City, Ganzi Tibetan Autonomous Prefecture, A’li Prefecture and Naqu City (Figure 4).
3.2. The Grassland Quality Analysis of the TP
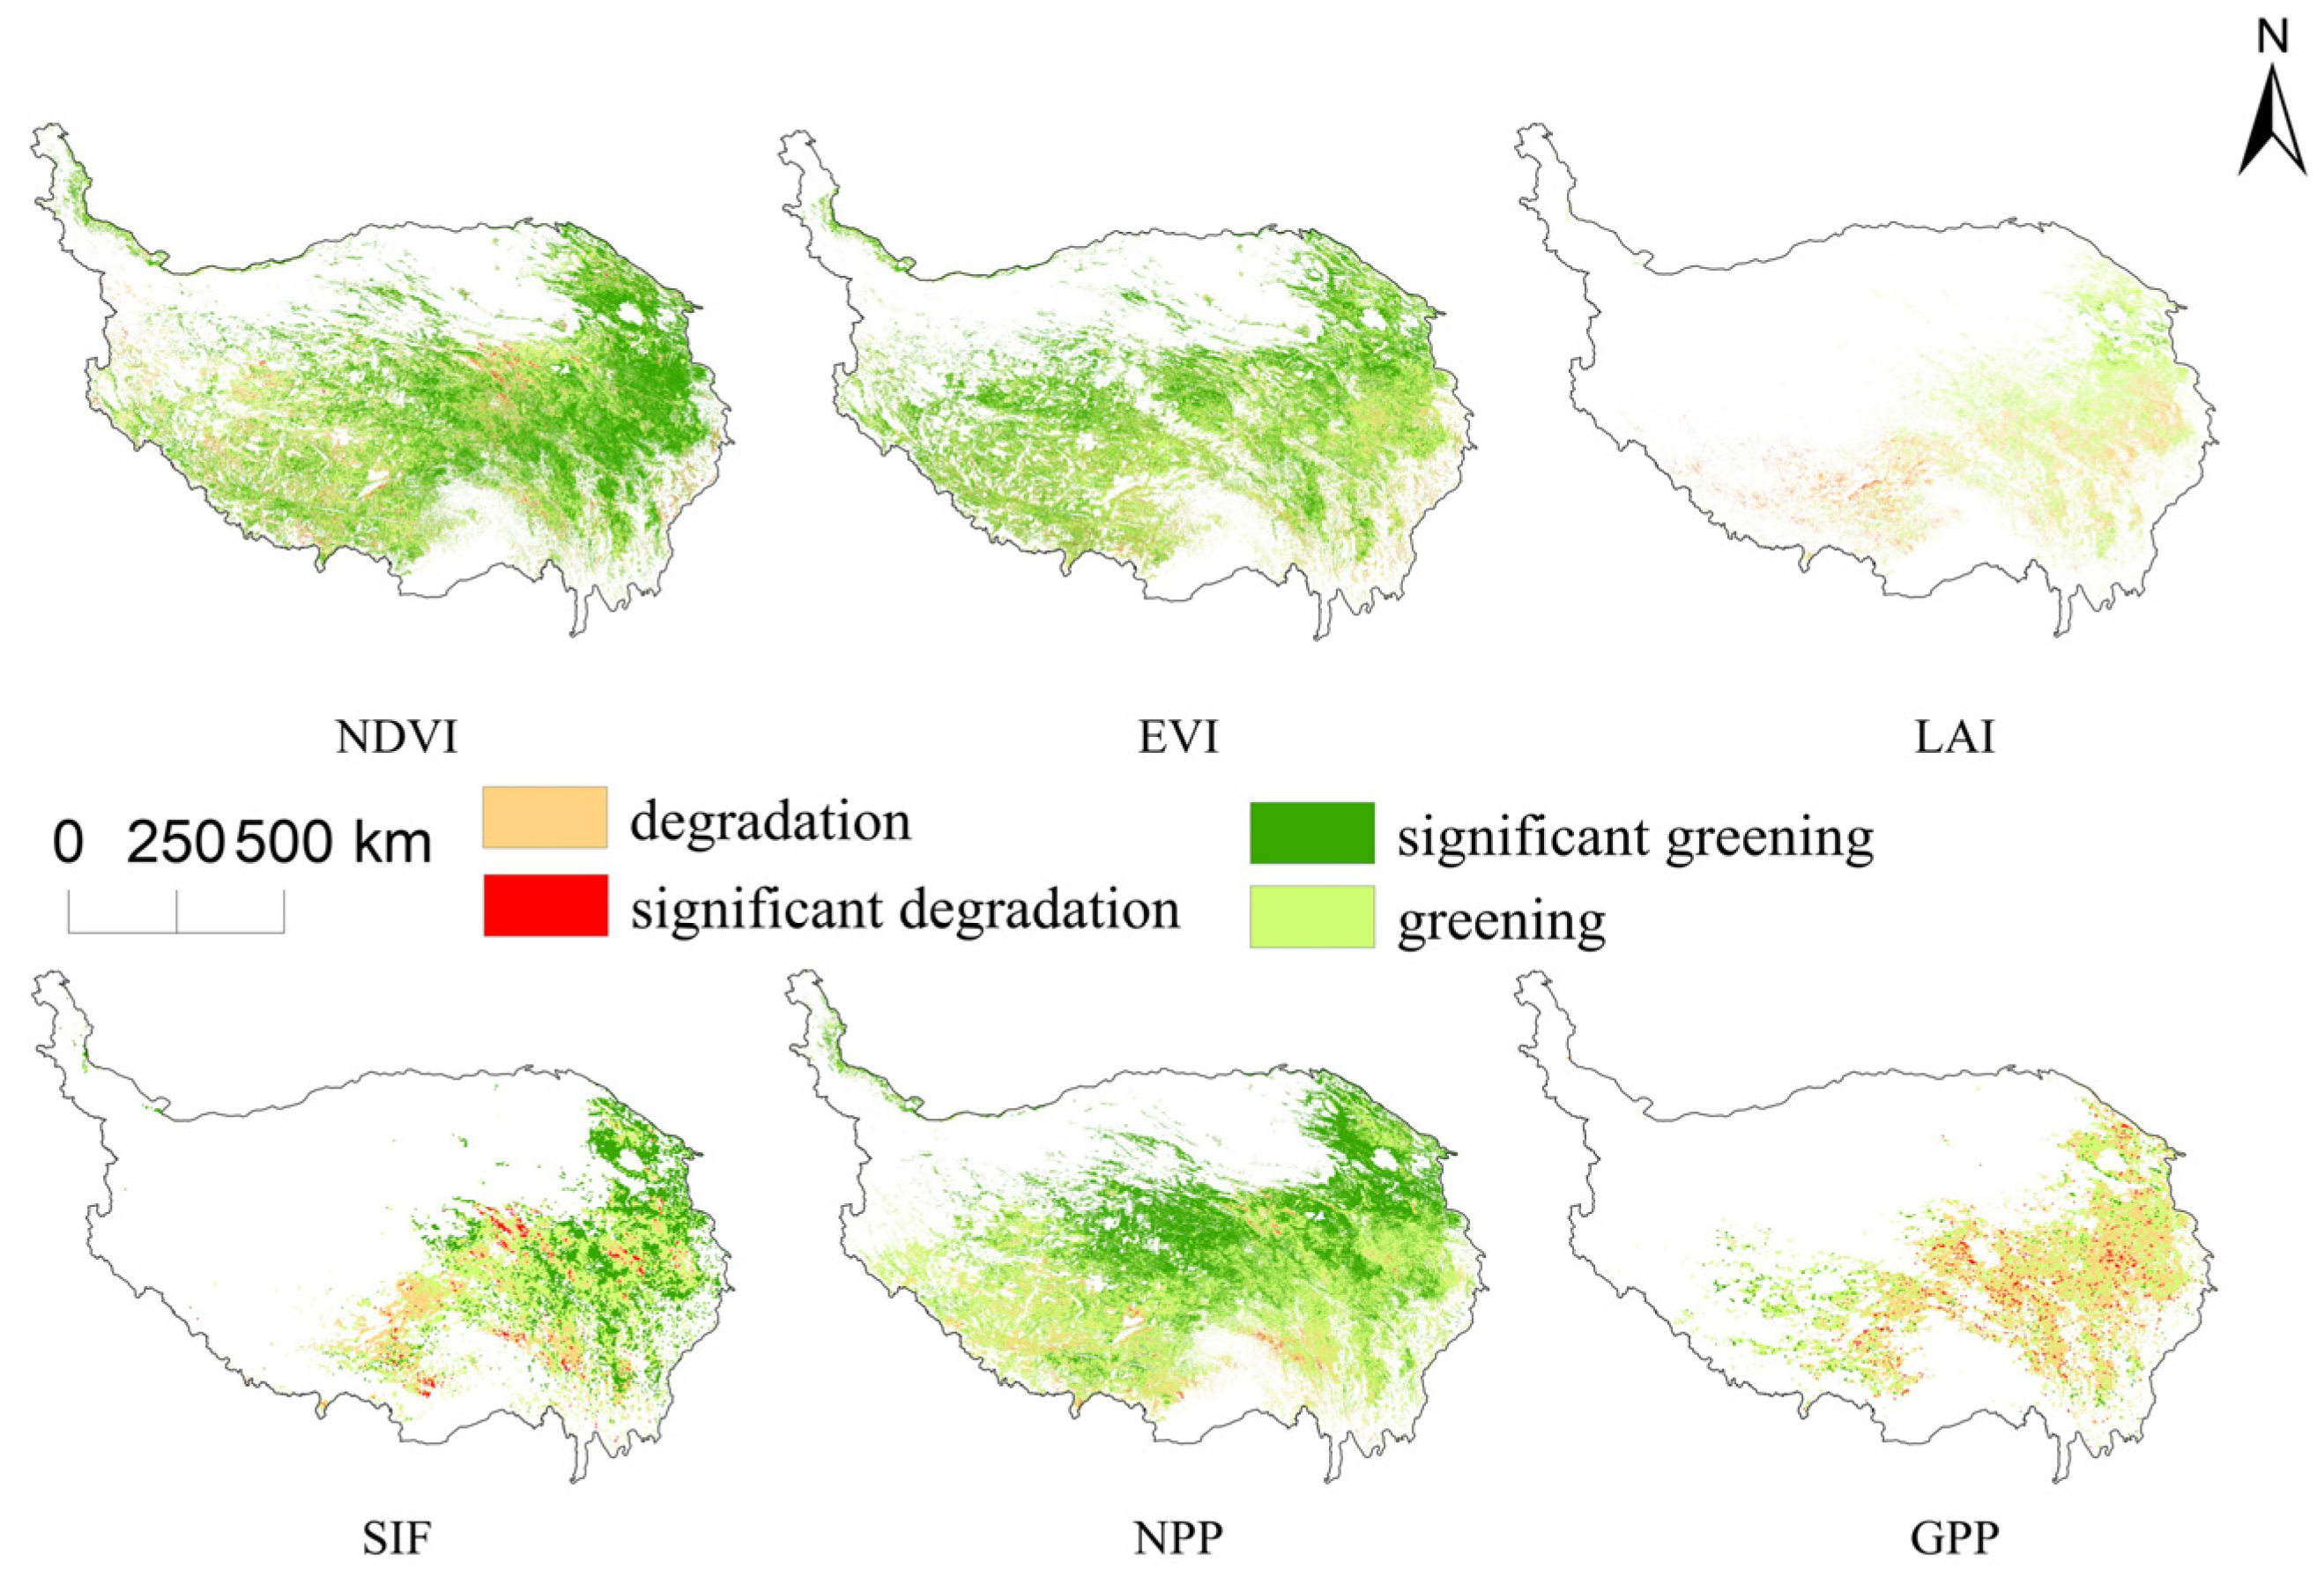
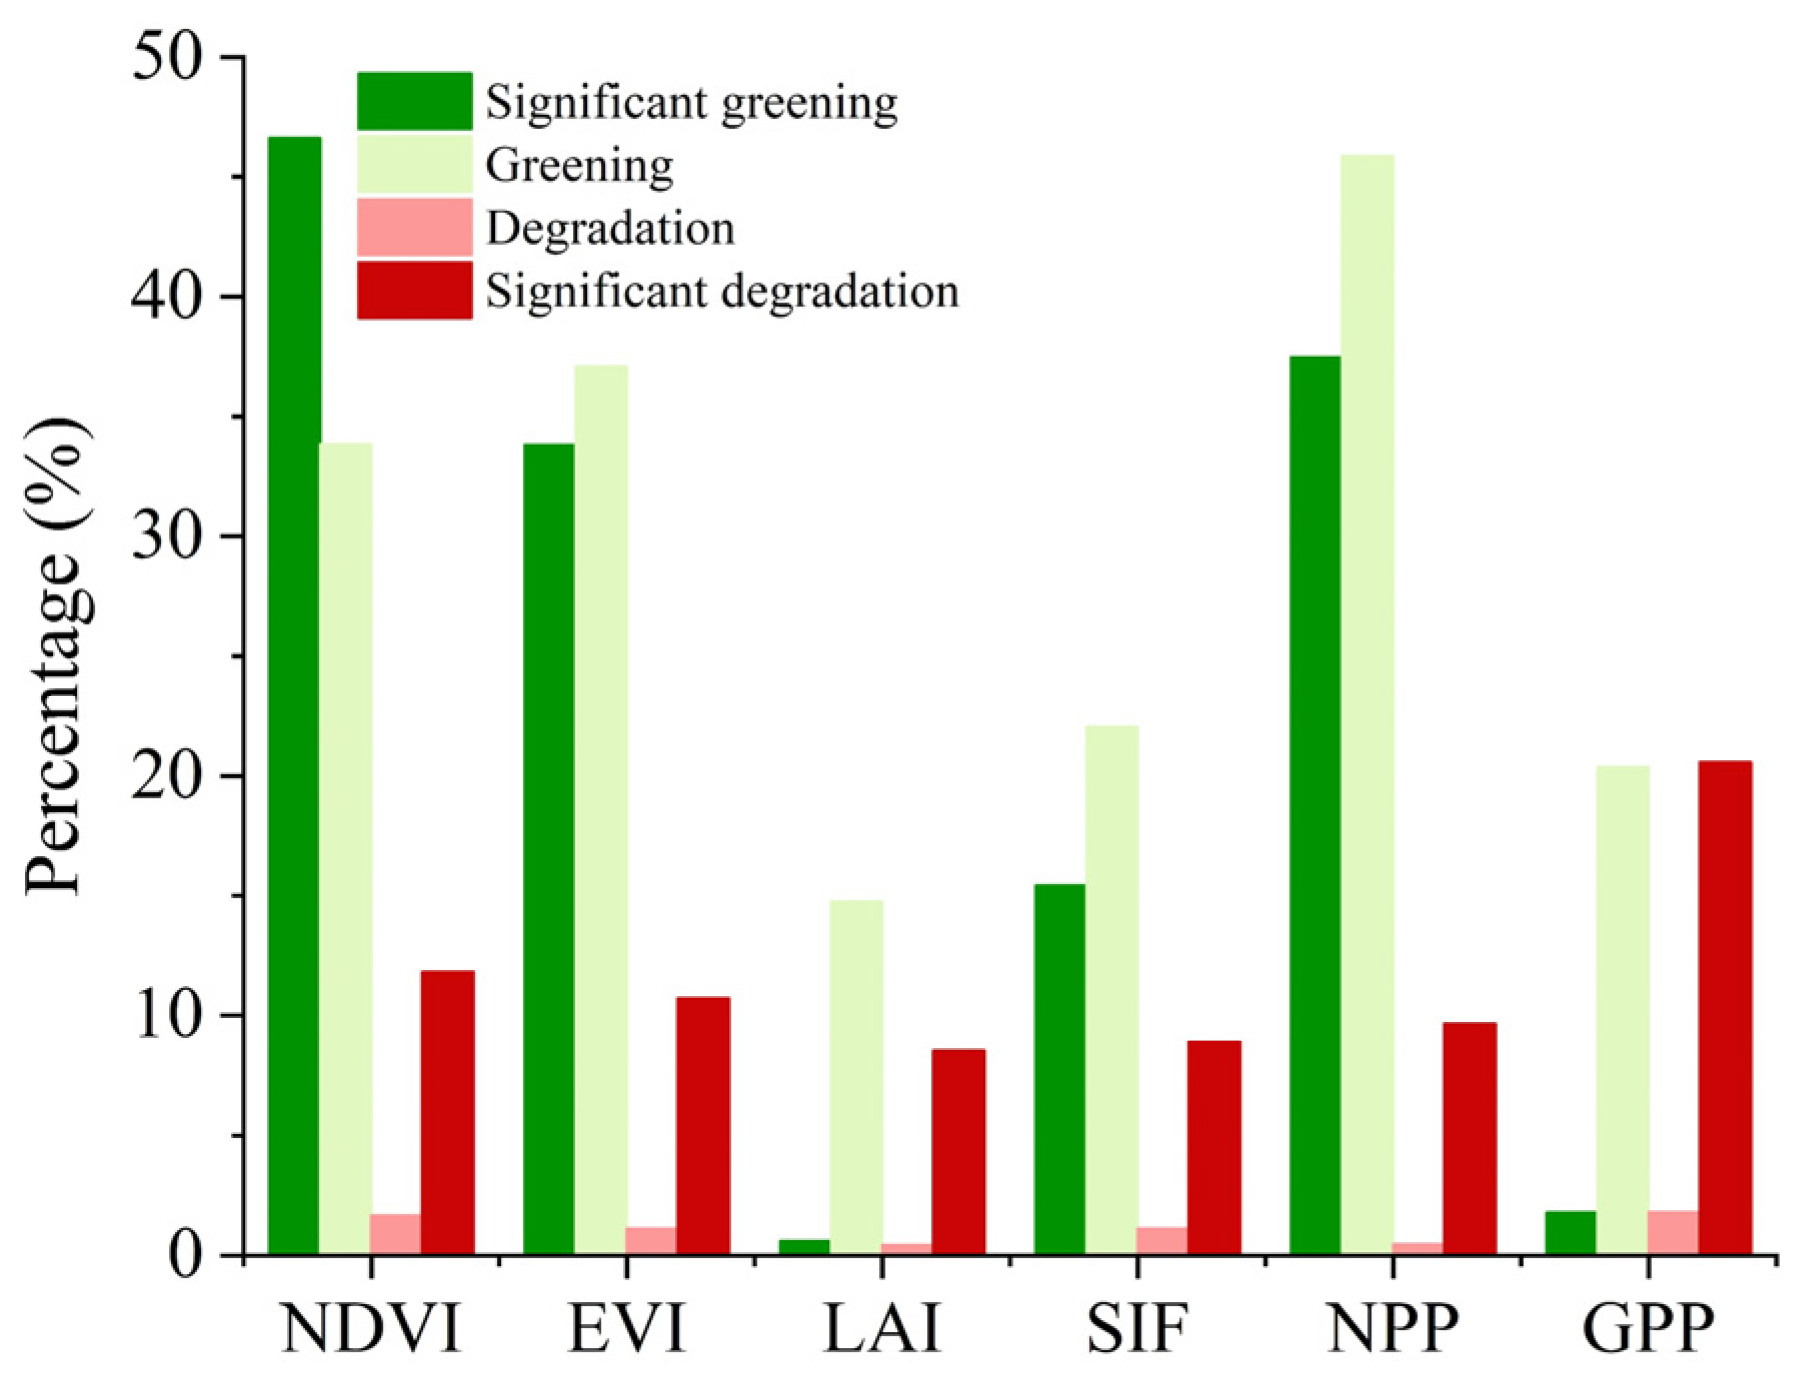
The six vegetation indexes had different descriptions of grassland quality degradation on the TP (Figure 5). Although the grassland greening of the TP showed an obvious trend, local grassland degradation still existed. The degraded grasslands were mainly distributed in the southwest, southeast, and south of the TP. As defined in Table 4, the grassland area with decreasing trend of NDVI, EVI, LAI, SIF, NPP and GPP data accounted for approximately 13.50%, 11.81%, 8.98%, 9.99%, 10.12% and 22.39% of the constant grassland area, respectively. Meanwhile, the grassland area with the increasing trend of NDVI, EVI, LAI, SIF, NPP and GPP data accounted for approximately 80.45%, 70.89%, 15.34%, 37.48%, 83.35% and 22.15% of the constant grassland area, respectively (Figure 6). Compared with the decline (14.65%) of grassland greenness (NDVI, EVI and LAI), the decline (17.03%) of grassland carbon sequestration capacity (SIF, NPP and GPP) on the TP was larger.
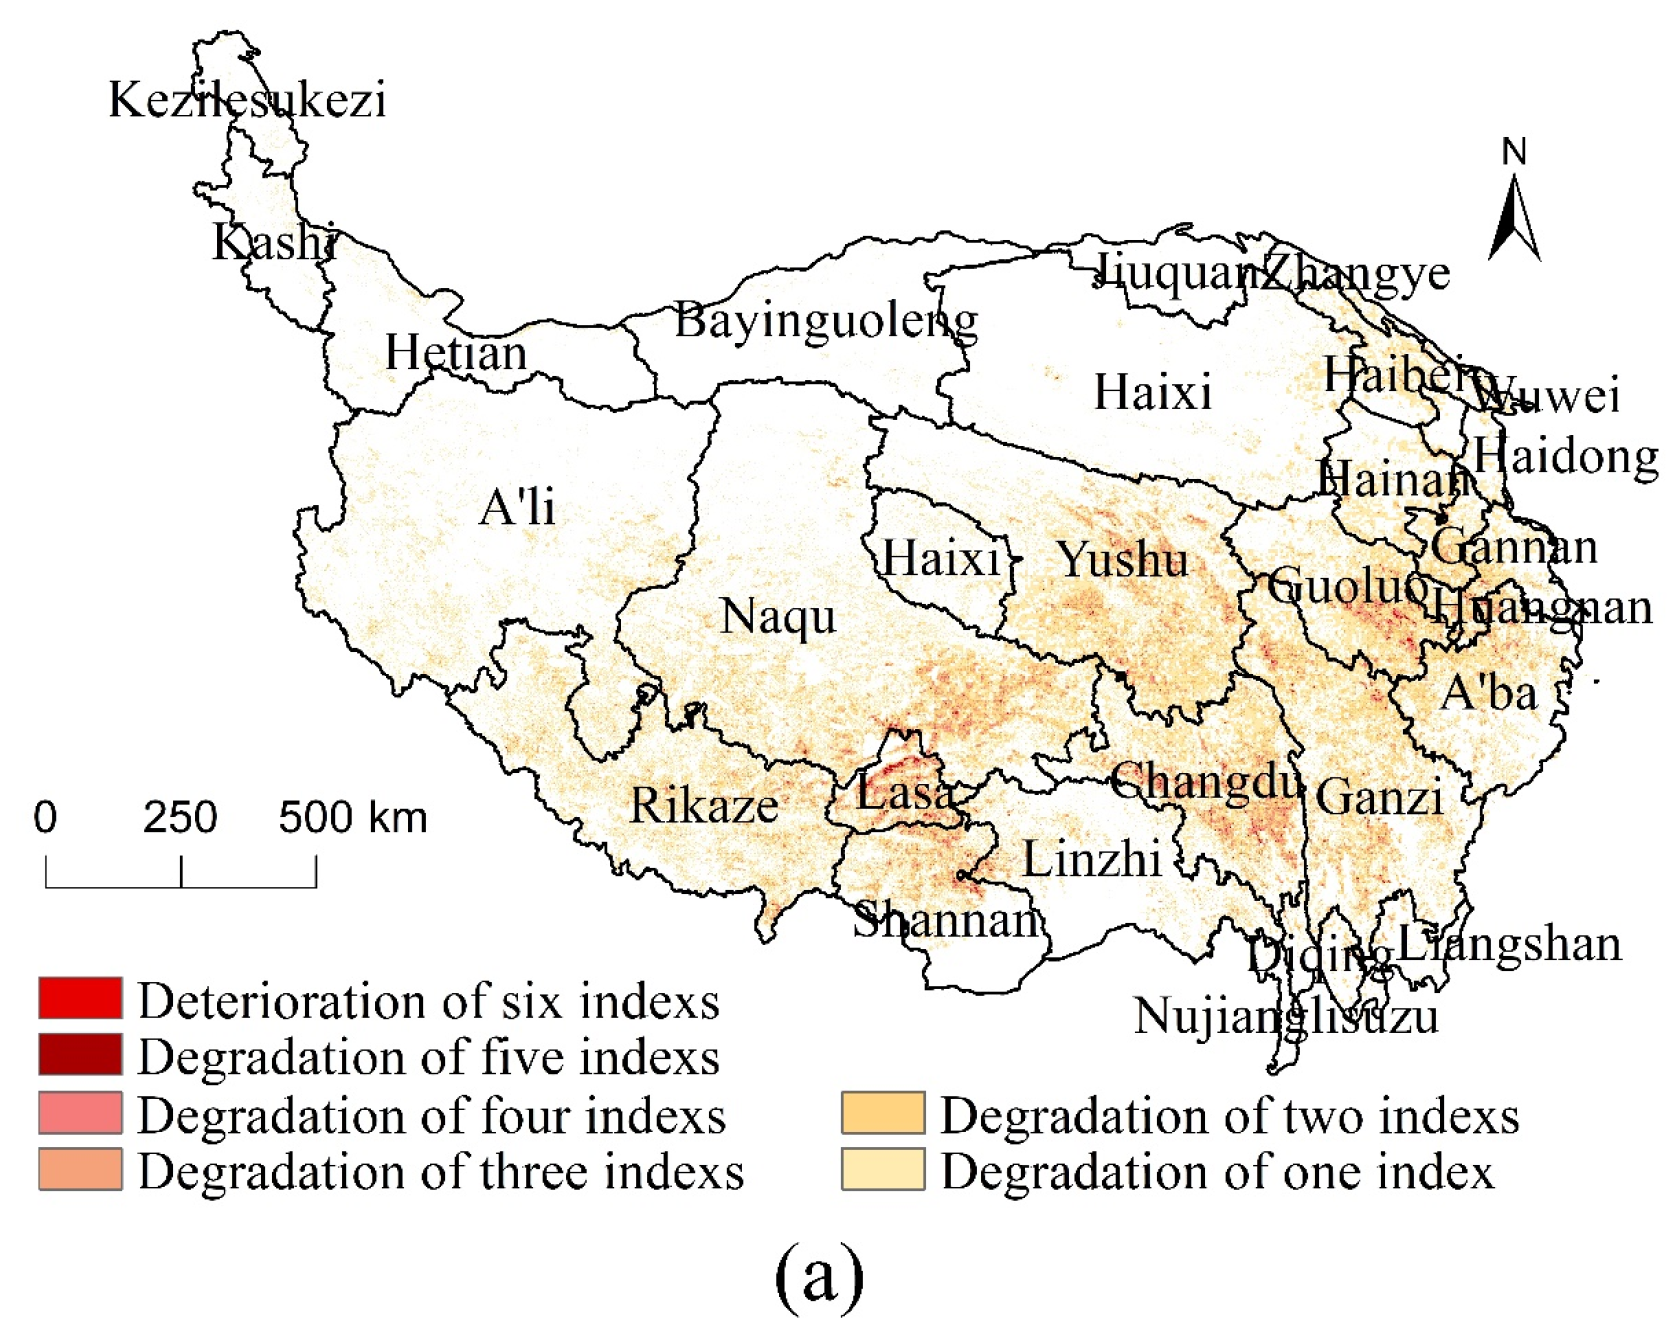
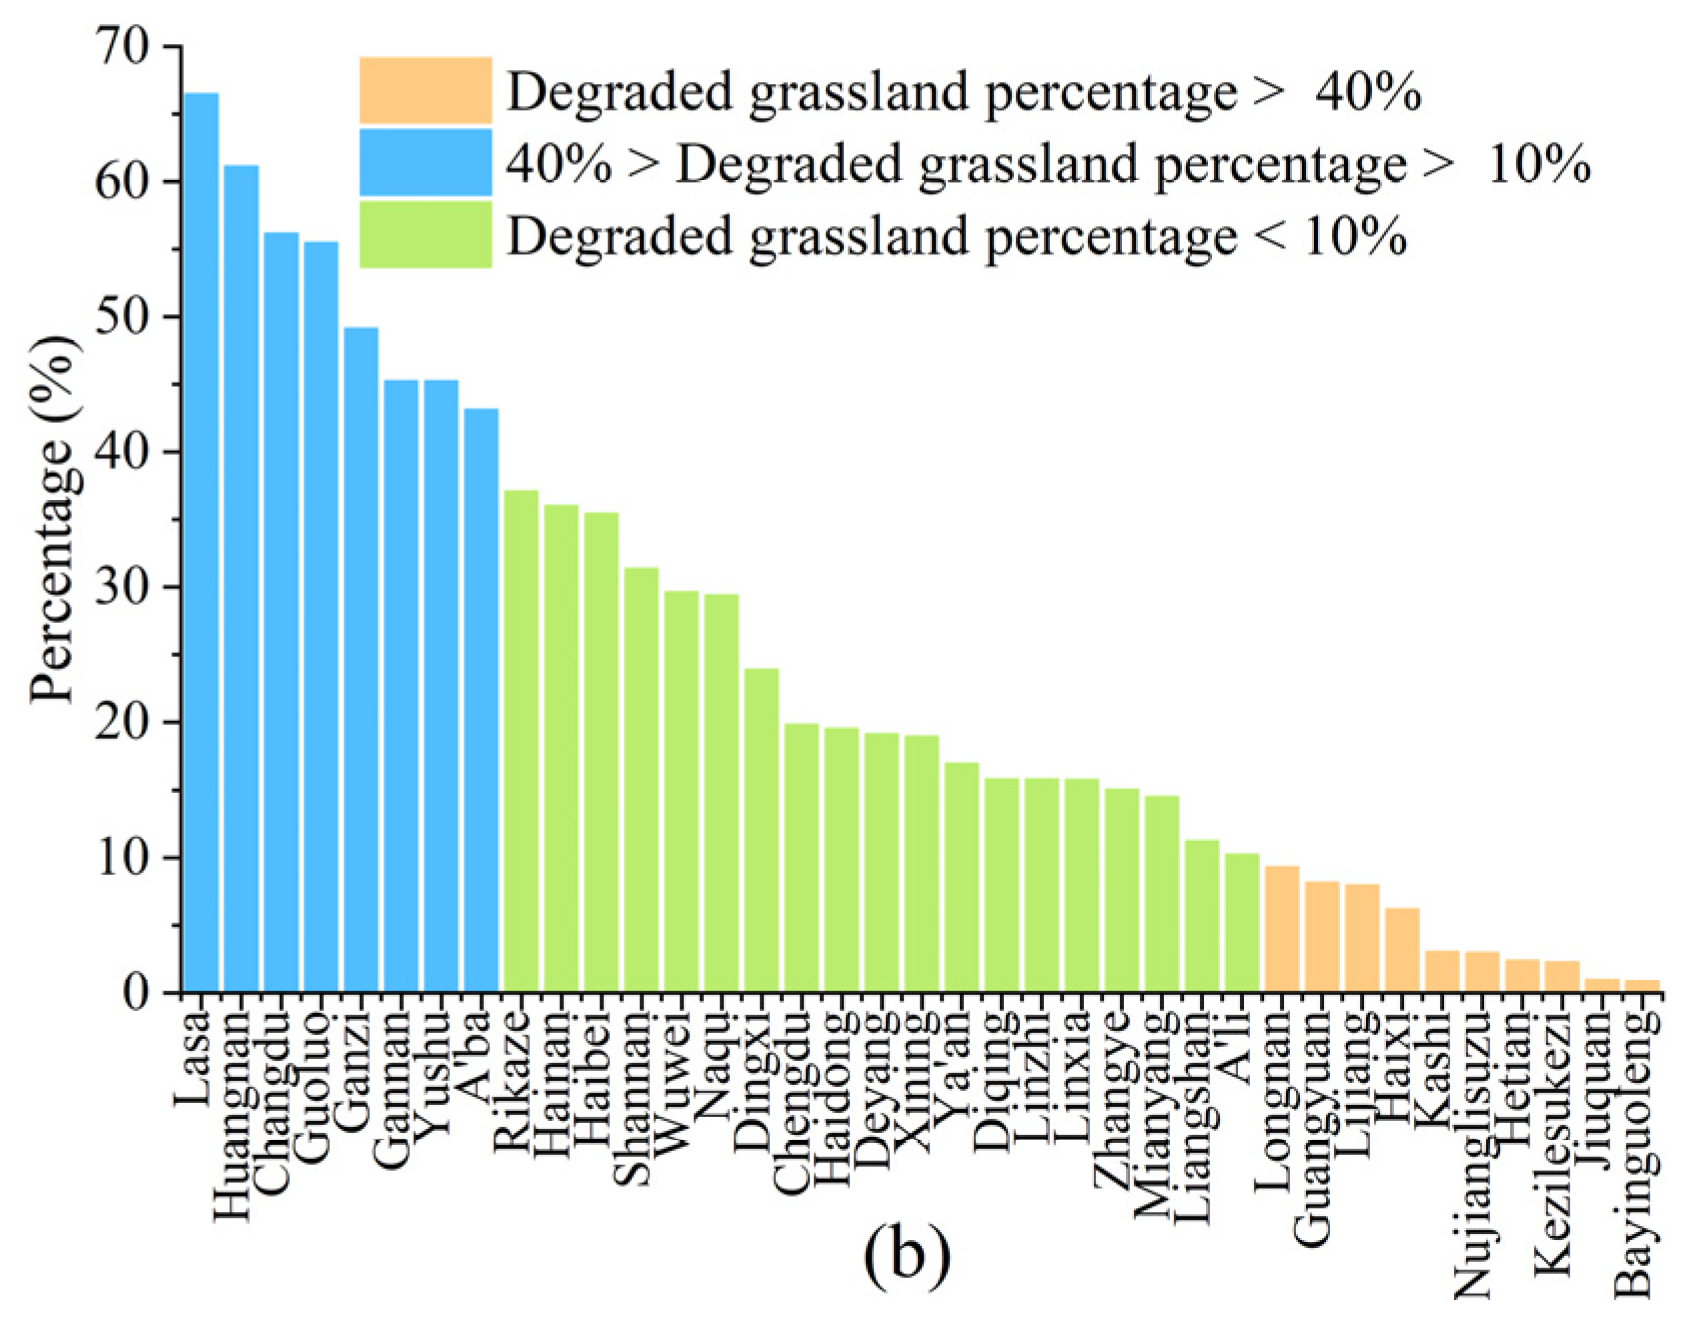
The superimposed six vegetation indexes showed that 25.88% of the grassland quality of the TP has been degraded (degradation showed by one or more indexes) from 2000 to 2020 (Figure 7a). The grassland degradation on the TP showed a considerable spatial heterogeneity distribution pattern. The grassland degradation phenomenon was more obvious in the southern and eastern TP than in the western and northern parts (Figure 7a). The percentage of degraded grassland also varies widely among prefecture-level cities (Figure 7b). Grassland degradation in Lasa City (66.47%) and Huangnan City (61.11%) reached more than 60% of the constant area grassland in the region. The percentages of grassland quality degradation in Changdu City and Guoluo Tibetan Autonomous Prefecture were 56.14% and 55.45%, respectively. The percentages of grassland quality degradation in Ganzi Tibetan Autonomous Prefecture, Gannan Tibetan Autonomous Prefecture, Yushu Tibetan Autonomous Prefecture and A’ba Tibetan and Qiang Autonomous Prefecture were between 40% and 50%.
3.3. The Observed Grassland Degradation Points
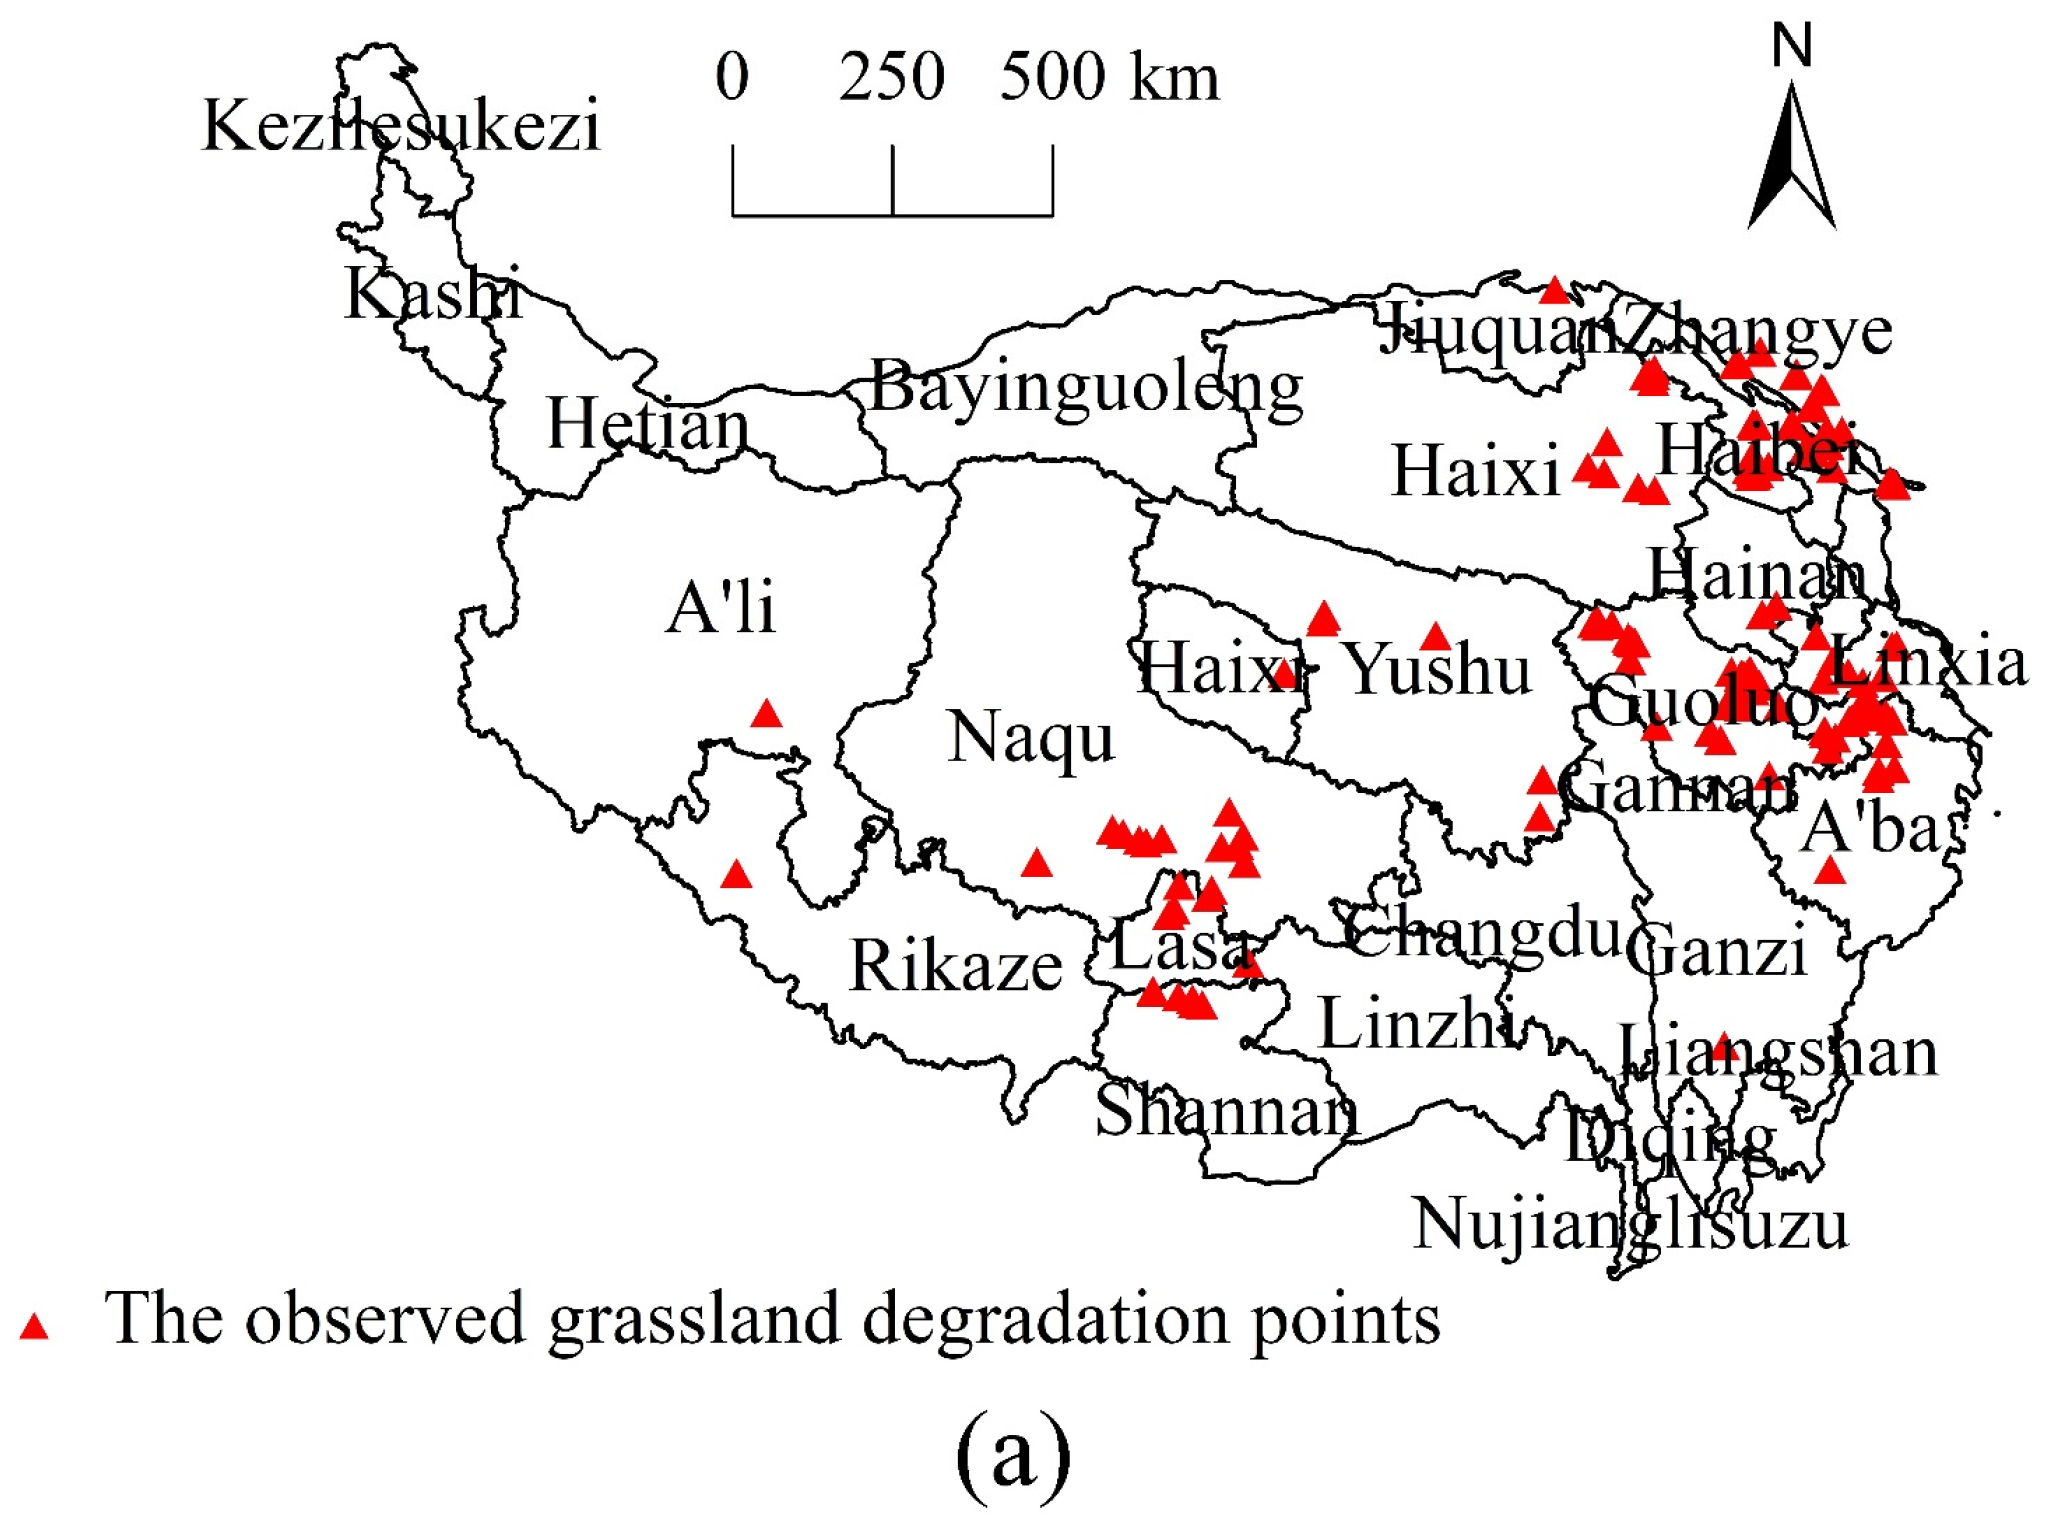
The observed grassland degradation points were mainly distributed in the northeastern and central parts of the TP (Figure 8a). Among them, Guoluo Tibetan Autonomous Prefecture has the largest number of observed degradation points, accounting for 44.35% of all observed degradation points. The number of degraded points in Haibei Tibetan Autonomous Prefecture and Yushu Tibetan Autonomous Prefecture accounted for 12.50% and 8.47%, respectively. Combining the data of the grassland degradation at the prefecture level on the TP, it was found that the grassland in Guoluo Tibetan Autonomous prefecture was seriously degraded, which was also proved by observed points. In addition, the southern part of the TP, where grassland degradation still needs to be monitored more intensively, such as Changdu City, Lasa City and Linzhi City.
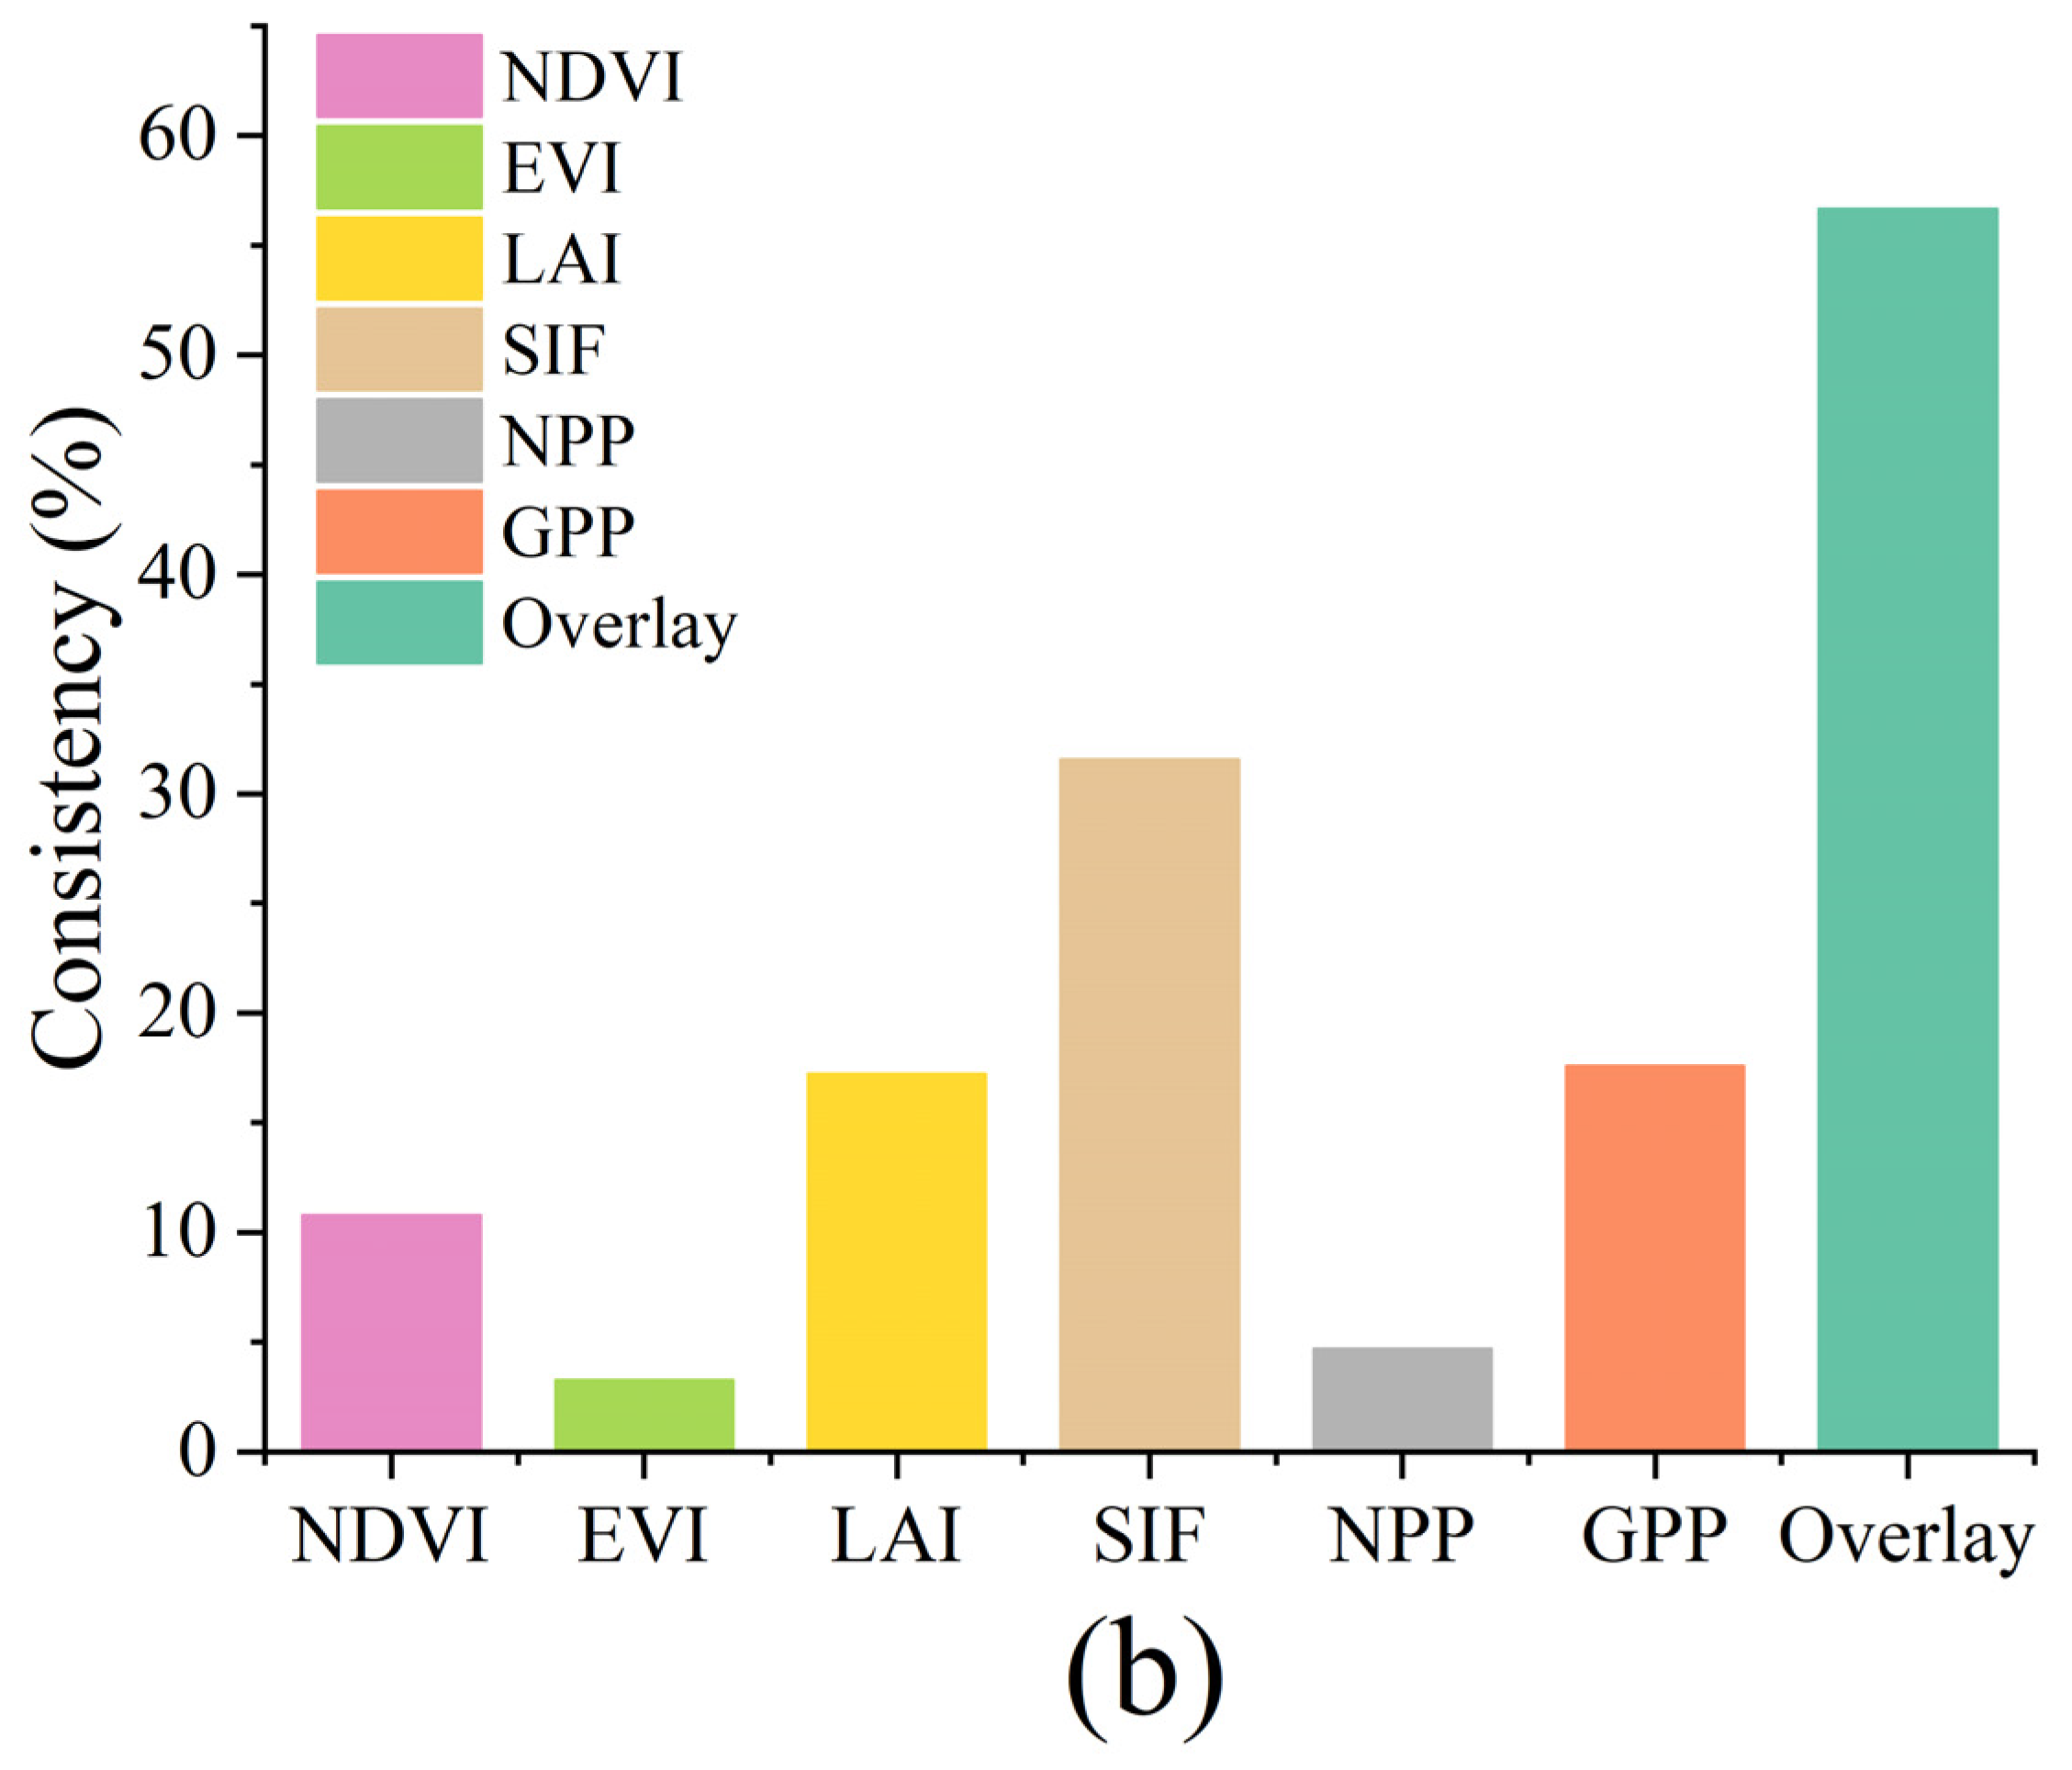
The consistency between the six vegetation indexes and the observed grassland degradation points varied greatly (4.66–31.54%) (Figure 8b). The consistency between the six vegetation indexes and the observed grassland degradation points is SIF (31.54%) > GPP (17.56%) > LAI (17.20%) > NDVI (10.75%) > NPP (4.66%) > EVI (3.23%). The consistency between the superimposed six vegetation indexes and the observed grassland degradation points of the TP is 56.63%.
4. Discussion
4.1. Grassland Area Change Analysis
Grassland area changes on the TP depend on the trade-off between the rate of grassland degradation and greening. After overlaying the five land cover products, the percentage of grassland area on the TP determined by three or more products is 55.16%, 60.40% and 60.15% in 2000, 2010 and 2020, respectively. The grassland area on the TP expanded from 2000 to 2010, because the area of grassland greening is much larger than the area of grassland degradation. From 2010 to 2020, the percentage of grassland area decreased slightly, and the degraded grassland area exceeded the green area, resulting in a net loss of 8455 km2 of grassland. The rate of grassland degradation has accelerated in the last decade and has outpaced the rate of grassland greening. The slope of NDVI decreased from 70.48% (2010–2019) to 62.11% (2000–2009), indicating a slowing trend of vegetation greening on the TP [51].
The trade-off between grassland degradation and greening is influenced by a combination of factors, and the same factor has different effects at different stages. As a major global greenhouse gas, elevated atmospheric CO2 concentration promotes photosynthesis, reduces vegetation stomatal conductance, and alleviates the water limitation of vegetation growth [52]. The impact of climate change on grassland greening on the TP is mainly achieved through warming because high-altitude vegetation is usually limited by low temperatures [53], while the relationship between warming and grassland greening is nonlinear [54]. Before reaching the optimum temperature for photosynthesis, the increase in temperature increases the greenness of vegetation, while beyond the optimum temperature, the photosynthesis of vegetation is weakened [55].
4.2. Grassland Quality Indexes Analysis
The consistencies between the six vegetation indicators and observed grassland degradation points were low and varied widely. These differences in consistency may be real or may be caused by the analysis process. During the pre-processing of the six vegetation indexes, the spatial resolution was unified at 1 km reducing the problem of mixed pixels as well as introducing errors. In addition, the six vegetation indexes represented the quality changes in constant grassland on the TP, and the observed points were sampled for grassland degradation on the TP. The consistency of the six vegetation indexes with observed points was underestimated when the observed sampling points were outside the constant grassland.
The vegetation indexes underestimated grassland degradation to some extent. Venom grass and shrub invasive grasslands are not monitored by vegetation indexes [56]. The six vegetation indexes with different ecological meanings reflect different degrees of grassland degradation. The NDVI, EVI and LAI represented vegetation greenness indexes, and the SIF, NPP and GPP represented carbon sequestration capacity. In this study, we found that the carbon sequestration capacity of grasslands on the TP declined more rapidly than greenness. Grassland degradation is the process of quality decline to area reduction. The decline of grassland carbon sequestration capacity is a reflection of the degradation of ecological functions. The decline in greenness is a symptom of degradation and the reduction in area is an extreme degradation of grassland.
4.3. Grassland Degradation Analysis
Grassland degradation on the TP is the result of a combination of multiple potential factors, which can be classified into environmental factors and anthropogenic factors. The alpine grassland ecosystem of TP has slower energy flow and material cycling rates than other ecosystems, which leads to a less resilient ecosystem [57]. Compared with other grassland types, alpine grasslands are more difficult to recover after being disturbed by external forces [58]. The average annual mean temperature on the TP has increased by 0.4 °C over the past half century, and annual precipitation has been increasing in most areas since the 1980s, with slight decreases in the southeast [59]. The combined effect of decreased precipitation and increased temperature on the TP has led to a reduction in soil water content, which is detrimental to grass growth on the southeastern of the TP [60]. Overgrazing affects community structures by altering the species composition of the TP, leading to biomass decline and triggering grassland degradation [61]. The activities of rodents are also an important cause of grassland degradation on the TP. In degraded grasslands, bare land provides favorable conditions for rodent digging, and rodent activity further accelerates degradation [62,63]. In addition, large-scale surface destruction such as mining and the construction of railroads are also important factors in the degradation of grasslands on the TP, which will take decades to recover [64].
The percentages of degraded grassland in Changdu City, Ganzi Tibetan Autonomous Prefecture, Gannan Tibetan Autonomous Prefecture, Yushu Tibetan Autonomous Prefecture, Aba Tibetan and Qiang Autonomous Prefecture, Rikaze City, Shannan City and Nagqu City were more than 20%, and the area of grassland degradation exceeded 2000 km2. Among them, other prefecture-level cities except for Changdu City are pastoral areas. With the increase in the number of livestock in pastoral areas, overgrazing has caused serious degradation of pasture on the TP. Irrational grazing behavior on the TP has further intensified grassland degradation. To reduce grassland degradation, the Chinese government privatized grasslands in the 1990s [65]. Changes in the land regime have reduced the mobility of pastures, allowing traditional grazing practices to be undermined by individual grazing [66]. In addition, to improve the living conditions of local people, the government has implemented a series of comprehensive measures, such as the establishment of settlements [67,68]. However, the grassland near the settlements has been severely degraded by trampling and nibbling [69].
5. Conclusions
Based on multi-source data, this study analyzed the grassland degradation on TP in terms of grassland area and grassland quality. Then, the grassland degradation information was verified with 279 grassland observation degradation points. During 2000–2020, the grassland area on the TP expanded, while the rate of grassland degradation exceeded the rate of greening during 2010–2020. Grassland quality degradation preceded grassland area degradation and was more pronounced. Grassland degradation was more severe in typical pastoralist prefectures than in non-pastoralist regions on the TP. The consistency between the observed grassland degradation points and the six vegetation indexes was 56.63% on the TP, and SIF was more effective than other vegetation indexes in monitoring grassland degradation. In summary, this study accurately obtained the spatial and temporal distribution of grassland area and quality changes and verified the consistency of the six indicators on the TP, providing a reference for the study of grassland degradation on the TP.
Author Contributions
Conceptualization, S.W. and L.J.; methodology, S.W., Y.W. and L.C.; validation, T.Z. and D.F.; data curation, S.W.; writing—original draft preparation, L.J. and S.W.; writing—review and editing, L.J., S.W. and A.H. All authors have read and agreed to the published version of the manuscript.
Funding
This work was supported by the Strategic Priority Research Program of the Second Tibetan Plateau Scientific Expedition and Research Program (No. 2019QZKK0405).
Data Availability Statement
Data sharing not applicable.
Acknowledgments
The author thanks Yanxu Liu for his assistance with conceptualization and Yunfeng Peng for his assistance with data acquisition.
Conflicts of Interest
The authors declare no conflict of interest.
References
- Kemp, D.R.; Guodong, H.; Xiangyang, H.; Michalk, D.L.; Fujiang, H.; Jianping, W.; Yingjun, Z. Innovative grassland management systems for environmental and livelihood benefits. Proc. Natl. Acad. Sci. USA 2013, 110, 8369–8374. [Google Scholar] [CrossRef] [PubMed] [Green Version]
- Ricard, M.F.; Viglizzo, E.F. Improving carbon sequestration estimation through accounting carbon stored in grassland soil. MethodsX 2020, 7, 100761. [Google Scholar] [CrossRef] [PubMed]
- Liu, S.; Zamanian, K.; Schleuss, P.-M.; Zarebanadkouki, M.; Kuzyakov, Y. Degradation of Tibetan grasslands: Consequences for carbon and nutrient cycles. Agric. Ecosyst. Environ. 2018, 252, 93–104. [Google Scholar] [CrossRef]
- Liu, Y.; Liu, H.; Chen, Y.; Gang, C.; Shen, Y. Quantifying the contributions of climate change and human activities to vegetation dynamic in China based on multiple indices. Sci. Total Environ. 2022, 838, 156553. [Google Scholar] [CrossRef] [PubMed]
- Gang, C.; Zhou, W.; Chen, Y.; Wang, Z.; Sun, Z.; Li, J.; Qi, J.; Odeh, I. Quantitative assessment of the contributions of climate change and human activities on global grassland degradation. Environ. Earth Sci. 2014, 72, 4273–4282. [Google Scholar] [CrossRef]
- Bardgett, R.D.; Bullock, J.M.; Lavorel, S.; Manning, P.; Schaffner, U.; Ostle, N.; Chomel, M.; Durigan, G.; Fry, E.L.; Johnson, D.; et al. Combatting global grassland degradation. Nat. Rev. Earth Environ. 2021, 2, 720–735. [Google Scholar] [CrossRef]
- Zhang, W.; Xue, X.; Peng, F.; You, Q.; Hao, A. Meta-analysis of the effects of grassland degradation on plant and soil properties in the alpine meadows of the Qinghai-Tibetan Plateau. Glob. Ecol. Conserv. 2019, 20, e00774. [Google Scholar] [CrossRef]
- Xie, H.; Zhang, Y.; Wu, Z.; Lv, T. A Bibliometric Analysis on Land Degradation: Current Status, Development, and Future Directions. Land 2020, 9, 28. [Google Scholar] [CrossRef] [Green Version]
- Burrell, A.L.; Evans, J.P.; De Kauwe, M.G. Anthropogenic climate change has driven over 5 million km2 of drylands towards desertification. Nat. Commun. 2020, 11, 3853. [Google Scholar] [CrossRef]
- Sha, Y.; Shi, Z.; Liu, X.; An, Z. Distinct impacts of the Mongolian and Tibetan Plateaus on the evolution of the East Asian monsoon. J. Geophys. Res. Atmospheres 2015, 120, 4764–4782. [Google Scholar] [CrossRef]
- Xiong, Q.; Xiao, Y.; Liang, P.; Li, L.; Zhang, L.; Li, T.; Pan, K.; Liu, C. Trends in climate change and human interventions indicate grassland productivity on the Qinghai–Tibetan Plateau from 1980 to 2015. Ecol. Indic. 2021, 129, 108010. [Google Scholar] [CrossRef]
- Zhou, T.; Hou, G.; Sun, J.; Zong, N.; Shi, P. Degradation shifts plant communities from S- to R-strategy in an alpine meadow, Tibetan Plateau. Sci. Total Environ. 2021, 800, 149572. [Google Scholar] [CrossRef]
- Liu, Y.; Lu, C. Quantifying Grass Coverage Trends to Identify the Hot Plots of Grassland Degradation in the Tibetan Plateau during 2000–2019. Int. J. Environ. Res. Public. Health 2021, 18, 416. [Google Scholar] [CrossRef]
- Cui, X.; Graf, H.-F. Recent land cover changes on the Tibetan Plateau: A review. Clim. Change 2009, 94, 47–61. [Google Scholar] [CrossRef] [Green Version]
- Buisson, E.; Archibald, S.; Fidelis, A.; Suding, K.N. Ancient grasslands guide ambitious goals in grassland restoration. Science 2022, 377, 594–598. [Google Scholar] [CrossRef]
- Zhang, Y.; Ganjurjav, H.; Dong, S.; Gao, Q. Excessive plant compensatory growth: A potential endogenous driver of meadow degradation on the Qinghai-Tibetan Plateau. Ecosyst. Health Sustain. 2020, 6, 1816500. [Google Scholar] [CrossRef]
- Wang, Z.; Zhang, Y.; Yang, Y.; Zhou, W.; Gang, C.; Zhang, Y.; Li, J.; An, R.; Wang, K.; Odeh, I.; et al. Quantitative assess the driving forces on the grassland degradation in the Qinghai–Tibet Plateau, in China. Ecol. Inform. 2016, 33, 32–44. [Google Scholar] [CrossRef]
- Liu, J.; Xu, X.; Shao, Q. Grassland degradation in the “Three-River Headwaters” region, Qinghai Province. J. Geogr. Sci. 2008, 18, 259–273. [Google Scholar] [CrossRef]
- Dashpurev, B.; Wesche, K.; Jäschke, Y.; Oyundelger, K.; Phan, T.N.; Bendix, J.; Lehnert, L.W. A cost-effective method to monitor vegetation changes in steppes ecosystems: A case study on remote sensing of fire and infrastructure effects in eastern Mongolia. Ecol. Indic. 2021, 132, 108331. [Google Scholar] [CrossRef]
- Piao, S.; Wang, X.; Park, T.; Chen, C.; Lian, X.; He, Y.; Bjerke, J.W.; Chen, A.; Ciais, P.; Tømmervik, H.; et al. Characteristics, drivers and feedbacks of global greening. Nat. Rev. Earth Environ. 2020, 1, 14–27. [Google Scholar] [CrossRef]
- Soubry, I.; Doan, T.; Chu, T.; Guo, X. A Systematic Review on the Integration of Remote Sensing and GIS to Forest and Grassland Ecosystem Health Attributes, Indicators, and Measures. Remote Sens. 2021, 13, 3262. [Google Scholar] [CrossRef]
- Gao, L.; Wang, X.; Johnson, B.A.; Tian, Q.; Wang, Y.; Verrelst, J.; Mu, X.; Gu, X. Remote sensing algorithms for estimation of fractional vegetation cover using pure vegetation index values: A review. ISPRS J. Photogramm. Remote Sens. 2020, 159, 364–377. [Google Scholar] [CrossRef]
- Cai, L.; Wang, S.; Jia, L.; Wang, Y.; Wang, H.; Fan, D.; Zhao, L. Consistency Assessments of the Land Cover Products on the Tibetan Plateau. IEEE J. Sel. Top. Appl. Earth Obs. Remote Sens. 2022, 15, 5652–5661. [Google Scholar] [CrossRef]
- Sun, W.; Ding, X.; Su, J.; Mu, X.; Zhang, Y.; Gao, P.; Zhao, G. Land use and cover changes on the Loess Plateau: A comparison of six global or national land use and cover datasets. Land Use Policy 2022, 119, 106165. [Google Scholar] [CrossRef]
- Zhang, X.; Liu, L.; Chen, X.; Gao, Y.; Xie, S.; Mi, J. GLC_FCS30: Global land-cover product with fine classification system at 30 m using time-series Landsat imagery. Earth Syst. Sci. Data 2021, 13, 2753–2776. [Google Scholar] [CrossRef]
- Zhang, Y.; Song, C.; Band, L.E.; Sun, G.; Li, J. Reanalysis of global terrestrial vegetation trends from MODIS products: Browning or greening? Remote Sens. Environ. 2017, 191, 145–155. [Google Scholar] [CrossRef] [Green Version]
- Tian, F.; Fensholt, R.; Verbesselt, J.; Grogan, K.; Horion, S.; Wang, Y. Evaluating temporal consistency of long-term global NDVI datasets for trend analysis. Remote Sens. Environ. 2015, 163, 326–340. [Google Scholar] [CrossRef]
- Zhang, G.; Yao, T.; Xie, H.; Wang, W.; Yang, W. An inventory of glacial lakes in the Third Pole region and their changes in response to global warming. Glob. Planet. Change 2015, 131, 148–157. [Google Scholar] [CrossRef]
- Wang, Y.; Fu, B.; Liu, Y.; Li, Y.; Feng, X.; Wang, S. Response of vegetation to drought in the Tibetan Plateau: Elevation differentiation and the dominant factors. Agric. For. Meteorol. 2021, 306, 108468. [Google Scholar] [CrossRef]
- Pan, T.; Zou, X.; Liu, Y.; Wu, S.; He, G. Contributions of climatic and non-climatic drivers to grassland variations on the Tibetan Plateau. Ecol. Eng. 2017, 108, 307–317. [Google Scholar] [CrossRef]
- Chen, H.; Zhu, Q.; Peng, C.; Wu, N.; Wang, Y.; Fang, X.; Gao, Y.; Zhu, D.; Yang, G.; Tian, J.; et al. The impacts of climate change and human activities on biogeochemical cycles on the Qinghai-Tibetan Plateau. Glob. Change Biol. 2013, 19, 2940–2955. [Google Scholar] [CrossRef]
- Immerzeel, W.W.; Quiroz, R.A.; de Jong, S.M. Understanding precipitation patterns and land use interaction in Tibet using harmonic analysis of SPOT VGT-S10 NDVI time series. Int. J. Remote Sens. 2005, 26, 2281–2296. [Google Scholar] [CrossRef]
- Wang, L.; Yu, X.; Xu, C.; Jing, Y.; Song, M. Grazing by Tibetan Sheep Enhances Soil Bacterial and Fungal Diversity in Cold Season Pastures of Alpine Meadows on the Northern Qinghai–Tibetan Plateau. J. Soil Sci. Plant Nutr. 2022, 22, 2434–2456. [Google Scholar] [CrossRef]
- Sulla-Menashe, D.; Friedl, M.A. User Guide to Collection 6 MODIS Land Cover (MCD12Q1 and MCD12C1) Product; USGS: Reston, VA, USA, 2018. [Google Scholar]
- Li, W.; MacBean, N.; Ciais, P.; Defourny, P.; Lamarche, C.; Bontemps, S.; Houghton, R.A.; Peng, S. Gross and net land cover changes in the main plant functional types derived from the annual ESA CCI land cover maps (1992–2015). Earth Syst. Sci. Data 2018, 10, 219–234. [Google Scholar] [CrossRef] [Green Version]
- Chen, J.; Chen, J.; Liao, A.; Cao, X.; Chen, L.; Chen, X.; He, C.; Han, G.; Peng, S.; Lu, M.; et al. Global land cover mapping at 30m resolution: A POK-based operational approach. ISPRS J. Photogramm. Remote Sens. 2015, 103, 7–27. [Google Scholar] [CrossRef] [Green Version]
- Yang, J.; Huang, X. The 30 m annual land cover dataset and its dynamics in China from 1990 to 2019. Earth Syst. Sci. Data 2021, 13, 3907–3925. [Google Scholar] [CrossRef]
- Wang, H.; Cai, L.; Wen, X.; Fan, D.; Wang, Y. Land cover change and multiple remotely sensed datasets consistency in China. Ecosyst. Health Sustain. 2022, 8, 2040385. [Google Scholar] [CrossRef]
- Jin, K.; Wang, F.; Zong, Q.; Qin, P.; Liu, C.; Wang, S. Spatiotemporal differences in climate change impacts on vegetation cover in China from 1982 to 2015. Environ. Sci. Pollut. Res. 2022, 29, 10263–10276. [Google Scholar] [CrossRef]
- Vijith, H.; Dodge-Wan, D. Applicability of MODIS land cover and Enhanced Vegetation Index (EVI) for the assessment of spatial and temporal changes in strength of vegetation in tropical rainforest region of Borneo. Remote Sens. Appl. Soc. Environ. 2020, 18, 100311. [Google Scholar] [CrossRef]
- Chen, J.M.; Black, T.A. Defining leaf area index for non-flat leaves. Plant Cell Environ. 1992, 15, 421–429. [Google Scholar] [CrossRef]
- Liu, Y.; Liu, R.; Chen, J.M. Retrospective retrieval of long-term consistent global leaf area index (1981–2011) from combined AVHRR and MODIS data. J. Geophys. Res. Biogeosci. 2012, 117, G04003. [Google Scholar] [CrossRef]
- Li, X.; Xiao, J.; He, B.; Altaf Arain, M.; Beringer, J.; Desai, A.R.; Emmel, C.; Hollinger, D.Y.; Krasnova, A.; Mammarella, I.; et al. Solar-induced chlorophyll fluorescence is strongly correlated with terrestrial photosynthesis for a wide variety of biomes: First global analysis based on OCO-2 and flux tower observations. Glob. Change Biol. 2018, 24, 3990–4008. [Google Scholar] [CrossRef] [PubMed]
- Yang, X.; Tang, J.; Mustard, J.F.; Lee, J.-E.; Rossini, M.; Joiner, J.; Munger, J.W.; Kornfeld, A.; Richardson, A.D. Solar-induced chlorophyll fluorescence that correlates with canopy photosynthesis on diurnal and seasonal scales in a temperate deciduous forest. Geophys. Res. Lett. 2015, 42, 2977–2987. [Google Scholar] [CrossRef]
- Field, C.B.; Randerson, J.T.; Malmström, C.M. Global net primary production: Combining ecology and remote sensing. Remote Sens. Environ. 1995, 51, 74–88. [Google Scholar] [CrossRef] [Green Version]
- Li, X.; Xiao, J.; Fisher, J.B.; Baldocchi, D.D. ECOSTRESS estimates gross primary production with fine spatial resolution for different times of day from the International Space Station. Remote Sens. Environ. 2021, 258, 112360. [Google Scholar] [CrossRef]
- Gao, Y.; Liu, L.; Zhang, X.; Chen, X.; Mi, J.; Xie, S. Consistency Analysis and Accuracy Assessment of Three Global 30-m Land-Cover Products over the European Union using the LUCAS Dataset. Remote Sens. 2020, 12, 3479. [Google Scholar] [CrossRef]
- Holben, B.N. Characteristics of maximum-value composite images from temporal AVHRR data. Int. J. Remote Sens. 1986, 7, 1417–1434. [Google Scholar] [CrossRef]
- Sun, B.; Li, Z.; Gao, Z.; Guo, Z.; Wang, B.; Hu, X.; Bai, L. Grassland degradation and restoration monitoring and driving forces analysis based on long time-series remote sensing data in Xilin Gol League. Acta Ecol. Sin. 2017, 37, 219–228. [Google Scholar] [CrossRef]
- Ali, R.; Kuriqi, A.; Abubaker, S.; Kisi, O. Long-Term Trends and Seasonality Detection of the Observed Flow in Yangtze River Using Mann-Kendall and Sen’s Innovative Trend Method. Water 2019, 11, 1855. [Google Scholar] [CrossRef] [Green Version]
- Chen, J.; Yan, F.; Lu, Q. Spatiotemporal Variation of Vegetation on the Qinghai–Tibet Plateau and the Influence of Climatic Factors and Human Activities on Vegetation Trend (2000–2019). Remote Sens. 2020, 12, 3150. [Google Scholar] [CrossRef]
- He, M.; Piao, S.; Huntingford, C.; Xu, H.; Wang, X.; Bastos, A.; Cui, J.; Gasser, T. Amplified warming from physiological responses to carbon dioxide reduces the potential of vegetation for climate change mitigation. Commun. Earth Environ. 2022, 3, 160. [Google Scholar] [CrossRef]
- Wani, I.A.; Khan, S.; Verma, S.; Al-Misned, F.A.; Shafik, H.M.; El-Serehy, H.A. Predicting habitat suitability and niche dynamics of Dactylorhiza hatagirea and Rheum webbianum in the Himalaya under projected climate change. Sci. Rep. 2022, 12, 1–18. [Google Scholar] [CrossRef]
- Yang, L.; Guan, Q.; Lin, J.; Tian, J.; Tan, Z.; Li, H. Evolution of NDVI secular trends and responses to climate change: A perspective from nonlinearity and nonstationarity characteristics. Remote Sens. Environ. 2021, 254, 112247. [Google Scholar] [CrossRef]
- Gao, Q.; Zhu, W.; Schwartz, M.W.; Ganjurjav, H.; Wan, Y.; Qin, X.; Ma, X.; Williamson, M.A.; Li, Y. Climatic change controls productivity variation in global grasslands. Sci. Rep. 2016, 6, 26958. [Google Scholar] [CrossRef] [Green Version]
- Wang, H.; Liu, H.; Huang, N.; Bi, J.; Ma, X.; Ma, Z.; Shangguan, Z.; Zhao, H.; Feng, Q.; Liang, T.; et al. Satellite-derived NDVI underestimates the advancement of alpine vegetation growth over the past three decades. Ecology 2021, 102, e03518. [Google Scholar] [CrossRef]
- Dong, S.; Shang, Z.; Gao, J.; Boone, R.B. Enhancing sustainability of grassland ecosystems through ecological restoration and grazing management in an era of climate change on Qinghai-Tibetan Plateau. Agric. Ecosyst. Environ. 2020, 287, 106684. [Google Scholar] [CrossRef]
- Gao, X.; Dong, S.; Xu, Y.; Wu, S.; Wu, X.; Zhang, X.; Zhi, Y.; Li, S.; Liu, S.; Li, Y.; et al. Resilience of revegetated grassland for restoring severely degraded alpine meadows is driven by plant and soil quality along recovery time: A case study from the Three-river Headwater Area of Qinghai-Tibetan Plateau. Agric. Ecosyst. Environ. 2019, 279, 169–177. [Google Scholar] [CrossRef]
- Wang, Y.; Lv, W.; Xue, K.; Wang, S.; Zhang, L.; Hu, R.; Zeng, H.; Xu, X.; Li, Y.; Jiang, L.; et al. Grassland changes and adaptive management on the Qinghai–Tibetan Plateau. Nat. Rev. Earth Environ. 2022, 3, 668–683. [Google Scholar] [CrossRef]
- Wang, C.; Wang, J.; Zhang, F.; Yang, Y.; Luo, F.; Li, Y.; Li, J. Stability response of alpine meadow communities to temperature and precipitation changes on the Northern Tibetan Plateau. Ecol. Evol. 2022, 12, e8592. [Google Scholar] [CrossRef]
- Lin, L.; Cao, G.; Xu, X.; Li, C.; Fan, B.; Li, B.; Lan, Y.; Si, M.; Dai, L. Changes and Relationships between Components in the Plant-Soil System and the Dominant Plant Functional Groups in Alpine Kobresia Meadows Due to Overgrazing. Diversity 2022, 14, 183. [Google Scholar] [CrossRef]
- Qian, D.; Li, Q.; Fan, B.; Lan, Y.; Cao, G. Characterization of the spatial distribution of plateau pika burrows along an alpine grassland degradation gradient on the Qinghai–Tibet Plateau. Ecol. Evol. 2021, 11, 14905–14915. [Google Scholar] [CrossRef] [PubMed]
- Li, J.; Li, X.; Gao, J.; Kazhaocairang; Ma, G.; Qi, X. Micro-scale fragmentation of the alpine meadow landscape on the Qinghai-Tibet Plateau under external disturbances. CATENA 2021, 201, 105220. [Google Scholar] [CrossRef]
- Wang, P.; Lassoie, J.P.; Morreale, S.J.; Dong, S.; Wang, P.; Lassoie, J.P.; Morreale, S.J.; Dong, S. A critical review of socioeconomic and natural factors in ecological degradation on the Qinghai-Tibetan Plateau, China. Rangel. J. 2015, 37, 1–9. [Google Scholar] [CrossRef]
- Chu, L.; Hou, M.; Jiang, Z. How does the fragmentation of pasture affect grassland ecology?—Evidence from typical pastoral areas in China. Ecol. Indic. 2022, 136, 108701. [Google Scholar] [CrossRef]
- Yang, M.; Dong, S.; Dong, Q.; Xu, Y.; Zhi, Y.; Liu, W.; Zhao, X. Trade-offs in ecological, productivity and livelihood dimensions inform sustainable grassland management: Case study from the Qinghai-Tibetan Plateau. Agric. Ecosyst. Environ. 2021, 313, 107377. [Google Scholar] [CrossRef]
- Bryan, B.A.; Gao, L.; Ye, Y.; Sun, X.; Connor, J.D.; Crossman, N.D.; Stafford-Smith, M.; Wu, J.; He, C.; Yu, D.; et al. China’s response to a national land-system sustainability emergency. Nature 2018, 559, 193–204. [Google Scholar] [CrossRef]
- Hua, T.; Zhao, W.; Pereira, P. Opinionated Views on Grassland Restoration Programs on the Qinghai-Tibetan Plateau. Front. Plant Sci. 2022, 13, 861200. [Google Scholar] [CrossRef]
- Cao, J.; Adamowski, J.F.; Deo, R.C.; Xu, X.; Gong, Y.; Feng, Q. Grassland Degradation on the Qinghai-Tibetan Plateau: Reevaluation of Causative Factors. Rangel. Ecol. Manag. 2019, 72, 988–995. [Google Scholar] [CrossRef]
Figure 1.
Flowchart of this study.

Figure 2.
Information of altitude and grassland on the TP (a) location and elevation of the TP (b) grassland and water bodies of the TP.
Figure 2.
Information of altitude and grassland on the TP (a) location and elevation of the TP (b) grassland and water bodies of the TP.

Figure 3.
Percentage of grassland area on the TP (a) the area of grassland in five land cover products (b) the area of grassland in the grassland fusion product.
Figure 3.
Percentage of grassland area on the TP (a) the area of grassland in five land cover products (b) the area of grassland in the grassland fusion product.

Figure 4.
Degraded grassland area in TP prefecture-level cities.

Figure 5.
Spatial distribution of quality changes of six indexes of grassland on the TP.

Figure 6.
Percentage of grassland quality change under six indexes on the TP.

Figure 7.
Degradation of grassland on the TP displayed by multiple indexes: (a) spatial distribution of multiple indexes of grassland quality change at the prefecture level; (b) the percentage of degraded grassland in TP prefecture-level cities.
Figure 7.
Degradation of grassland on the TP displayed by multiple indexes: (a) spatial distribution of multiple indexes of grassland quality change at the prefecture level; (b) the percentage of degraded grassland in TP prefecture-level cities.


Figure 8.
Distribution of observed grassland degradation points (a) and their spatial consistency with six remote sensing indexes (b).
Figure 8.
Distribution of observed grassland degradation points (a) and their spatial consistency with six remote sensing indexes (b).


Table 1.
Basic information on five land cover datasets.
| MCD12Q1 | CCI-LC | Globeland30 | CNLUCC | CLCD | |
|---|---|---|---|---|---|
| Spatial Resolution (m) | 500 | 300 | 30 | 1000 | 30 |
| Sensor | MODIS | MERIS Full and Reduced Resolution/SPOT VGT | Landsat-TM, ETM7, HJ-1A/b/ | Landsat-TM/ETM+/OLI | Landsat-TM/ETM+/OLI |
| Classification Technique | Supervised classification | Unsupervised classification | Supervised classification | Supervised classification | Supervised classification |
| Classification Scheme | IGBP (17 classes) | UN-LCC (22 classes) | (10 classes) | (9 classes) | (9 classes) |
| Period of data acquisition | 2001–2019 | 1992–2020 | 2000, 2010, 2020 | 2000, 2005, 2010, 2015, 2018, 2020 | 1985, 1990–2020 |
| Institution | National Aeronautics and Space Administration (NASA) | European Space Agency (ESA) | National Geomatics Center of China (NGCC) | Institute of Geographic Sciences and Natural Resources Research (IGSNRR) | Wuhan University |
| Source | https://ladsweb.modaps.eosdis.nasa.gov/, accessed on 11 September 2020 | https://www.esa-landcover-cci.org/, accessed on 28 January 2021 | http://www.globeland30.com, accessed on 28 January 2021 | http://www.resdc.cn/Datalist1.aspx?, accessed on 28 January 2021 | https://zenodo.org/record/4417810#.YaseP7lBwdX, accessed on 28 January 2021 |
Table 2.
Basic information on six vegetation index datasets.
| NDVI | EVI | LAI | SIF | NPP | GPP | |
|---|---|---|---|---|---|---|
| Spatial Resolution (m) | 30 | 250 | 500 | 0.05° | 500 | 0.05° |
| Period of data acquisition | 2000–2018 | 2000–2020 | 2002–2020 | 2001–2020 | 2001–2020 | 2000–2018 |
| Institution | Institute of Geographic Sciences and Natural Resources Research (IGSNRR) | National Aeronautics and Space Administration (NASA) | National Aeronautics and Space Administration (NASA) | Earth Systems Research Center University of New Hampshire (UNH) | National Aeronautics and Space Administration (NASA) | Geographic Sciences and Natural Resources Research (IGSNRR) |
| Source | https://www.resdc.cn/DOI/doi.aspx?DOIid=50, accessed on 28 January 2021 | https://lpdaac.usgs.gov/products/mod13q1v061/, accessed on 5 February 2021 | https://lpdaac.usgs.gov/products/mcd15a3hv061/, accessed on 5 February 2021 | http://data.globalecology.unh.edu/data/GOSIF_v2/, accessed on 6 February 2021 | https://lpdaac.usgs.gov/products/mod17a3hgfv006/, accessed on 7 February 2021 | http://www.resdc.cn/data.aspx?DATAID=254, accessed on 15 February 2021 |
Table 3.
Grassland Classification consolidation scheme.
| MCD12Q1 | Globeland30 | CCI-LC | CNLUCC | CLCD |
|---|---|---|---|---|
| 8 Woody Savannas 9 Savannas 10 Grasslands | 30 Grassland | 110 Mosaic herbaceous cover (>50%)/tree and shrub (<50%) 130 Grassland | 31 High-coverage grass32 Medium-coverage grassland 33 Low-coverage grassland | 4 Grassland |
Table 4.
Mann-Kendall test trend categories.
| β | Z | Trend Features |
|---|---|---|
| β > 0 | 1.96 < |Z| | significant greening |
| 0 < |Z| ≤ 1.96 | greening | |
| β = 0 | Z | no change |
| β < 0 | 0 < |Z| ≤ 1.96 | degradation |
| 1.96 < |Z| | significant degradation |
Publisher’s Note: MDPI stays neutral with regard to jurisdictional claims in published maps and institutional affiliations. |
© 2022 by the authors. Licensee MDPI, Basel, Switzerland. This article is an open access article distributed under the terms and conditions of the Creative Commons Attribution (CC BY) license (https://creativecommons.org/licenses/by/4.0/).
Share and Cite
MDPI and ACS Style
Wang, S.; Jia, L.; Cai, L.; Wang, Y.; Zhan, T.; Huang, A.; Fan, D. Assessment of Grassland Degradation on the Tibetan Plateau Based on Multi-Source Data. Remote Sens. 2022, 14, 6011. https://doi.org/10.3390/rs14236011
AMA Style
Wang S, Jia L, Cai L, Wang Y, Zhan T, Huang A, Fan D. Assessment of Grassland Degradation on the Tibetan Plateau Based on Multi-Source Data. Remote Sensing. 2022; 14(23):6011. https://doi.org/10.3390/rs14236011
Chicago/Turabian StyleWang, Shanshan, Lizhi Jia, Liping Cai, Yijia Wang, Tianyu Zhan, Anqi Huang, and Donglin Fan. 2022. "Assessment of Grassland Degradation on the Tibetan Plateau Based on Multi-Source Data" Remote Sensing 14, no. 23: 6011. https://doi.org/10.3390/rs14236011
Note that from the first issue of 2016, this journal uses article numbers instead of page numbers. See further details here.