
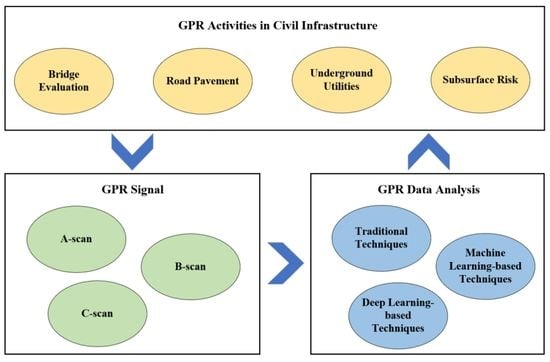
Review of GPR Activities in Civil Infrastructures: Data Analysis and Applications

School of Automation, Central South University, Changsha 410083, China
*
Author to whom correspondence should be addressed.
Remote Sens. 2022, 14(23), 5972; https://doi.org/10.3390/rs14235972
Submission received: 24 October 2022
/
Revised: 17 November 2022
/
Accepted: 21 November 2022
/
Published: 25 November 2022
(This article belongs to the Special Issue Review of Application Areas of GPR)
Abstract
:Ground penetration radar (GPR) technology has received in-depth analysis and rapid development in the field of civil engineering. GPR data analysis is one of the basic and challenging problems in this field. This research aims to conduct a comprehensive survey of the progress from 2015 to the present in GPR scanning tasks. More than 130 major publications are cited in this research covering different aspects of the research, including advanced data processing methods and a wide variety of applications. First, it briefly introduces the data collection of the GPR system and discusses the signal complexity in simulated/real scenes. Then, it reviews the main signal processing techniques used to interpret the GPR data. Subsequently, the latest GPR surveys are considered and divided according to four application domains, namely bridges, road pavements, underground utilities, and urban subsurface risks. Finally, the survey discusses the open challenges and directions for future research.
1. Introduction
Interpreting the useful information gained from the existing infrastructures is the main task of civil researchers. Labeling, mapping, and diagnosing subsurface-embedded elements and unpredictable risks are indispensable aspects of this work. As a typical non-destructive testing (NDT) technique, ground-penetrating radar (GPR) has been widespread in this domain [1,2] due to its several advantages: first, easy-to-use data collection and real-time interface display can quickly provide feedback information about the subsurface conditions; second, the centimeter-level image resolution can be obtained by adjusting its system bandwidth. GPR sends electromagnetic (EM) pulses into the belowground medium by a transmitter and collects the reflected signal by a receiver. Based on the analysis of reflected signal strength and time difference of reception, this instrument can be used to infer the relevant underground conditions and gather useful information [3,4].
GPR first appeared in the realm of geosciences in mid-1950s. After about 40 years, the emergence of many powerful GPR data analysis techniques has given rise to a further increase in civil activities. Subsequently, huge progress in digital computing capabilities led to the spread of GPR applications in recent years. Milestones in GPR data analysis over the past decades are listed in Figure 1. Research on GPR data analysis in the late 1990s and the early 2000s mainly focused on neural network (NN) [5,6], multilayer perceptron (MLP) [7], and Hough transform [8,9]. After that time, the machine learning (ML) algorithms achieved advanced results in GPR data interpretation, such as genetic algorithm (GA) [10], Viola-Jones [11], and support vector machine (SVM) [12]. Recently, some research on integrated systems [13,14,15] has been developed to automatically detect and fit the GPR characteristics. After 2015, the capability of deep learning (DL) technology has been explored even in cross-disciplines, which promotes GPR analysis from a small-scale manual process to an automatic interpretation even with large amounts of data. Much research focus has been on DL methods for GPR feature representation and classification, such as the improved CNN [16,17], Faster R-CNN [18], Convolutional SVM (CSVM) [19], Mixed deepCNN [20], Mask R-CNN [21], Residual CNN, and Bi-LSTM model [22]. But still, interpretation of these data is still very empirical and largely depends on the judgment of researchers. Much effort is required to explore effective processing solutions for GPR data to provide operators and decision-makers with easy-to-interpret images [3]. Indeed, with the advanced and targeted solutions, the quality of available GPR information can be significantly improved [23]. Moreover, none of the published surveys provides an extensive survey over the recent 6 years. Given recent developments, we believe that there is a need for an updated survey, motivating this present work.
A thorough review and survey of existing work will help make more progress in GPR data analysis. Our goal is to outline its core tasks and key challenges, to summarize the performance of GPR signal complexity, to define categories of data processing methods, and to provide a review of GPR applications. Based on the different forms of GPR data, the data processing literature is divided into three types: A-scan-based, B-scan-based, and C-scan-based. The transmitting antenna (T antenna) emits EM waves at a fixed position, and the receiving antenna (R antenna) receives the echo and forms a 1-D signal, called A-scan. The T/R antenna moves equidistantly in a certain direction, and a 2-D dataset is formed by superimposing multiple consecutive A-scans, namely B-scan. The GPR scans target in the form of multiple parallel lines, and a series of B-scans is gathered and sequenced consecutively to form C-scan data. Figure 2 can visually show the relationship between the scan data and the measurement position. Furthermore, according to the different feature extraction forms, the B-scan-based methods are divided into traditional-based, ML-based, and DL-based.
Even though the current research in GPR data analysis has made numerous achievements, the automated interpretation of GPR data still faces some challenges that are difficult to solve: (1) There exists the matching inconsistency between GPR features and deep models; (2) The construction of DL model and parametric analysis depends heavily on a large amount of dataset; (3) Many factors in the on-site environment have unpredictable impacts on data analysis and increase their complexity; (4) Integrating multiple NDT technologies for underground target detection will lead to incompatibility among them.
The remainder of this paper is organized as follows. Section 2 discusses the major signal processing techniques, wherein the main results achieved by DL techniques are highlighted. Section 3 provides an overview of the latest achievements in the following fields: bridges, roads and pavements, surface utilities, and risks. Section 4 discusses the future prospects and draws conclusions.
2. GPR Data Processing in Civil Infrastructure
2.1. A-Scan Processing
This section discusses the advanced studies on the A-scan data processing in civil surveys. Indeed, A-scan processing technique is often used to avoid generating additional noises and enhance the target signals. For instance, the work [24] removed the direct current (DC) bias from each A-scan signal in order to avoid complex noises, and thus increase the visibility of buried plastic pipes. Benedetto et al. [25] summarized the main A-scan signal processing methods used in road surveys, as well as provided the strategies about how to select and use the proper processing technique based on the data quality and the survey purposes.
Existing works have been reported in [26,27] to evaluate changes of material properties. In fact, the essential properties will change or evolve over time due to several factors such as dry brickwork, or steel corrosion, etc. The collected A-scan data were recorded and analyzed to learn the internal changes of the material. To provide rich information about the progress of bridge deck deterioration, the study in [28] interpreted time-series GPR data based on a correlation coefficient between A-scans. The generated map could clearly show deterioration progression between the two consecutive scans.
Facing the challenge of object detection task, some research also focuses on the interpretation of the features extracted from A-scan data or their energy analysis to determine whether A-scan implies target information, for example, comparing the A-scan energy with and without a buried object [29], or with and without background removal [30]. When it is observed that the former signal is not similar to the latter signal, it can be inferred that there may be buried objects.
2.2. Target Identification from B-Scan Image
Many advanced methods try to interpret the collected B-scan data. B-scan data processing is mainly divided into three parts: (1) data preprocessing and denoising; (2) hyperbolic features extraction for locating target; and (3) geometric characteristics estimation (e.g., depth, size, EM wave velocity). Many studies have focused on the task 2 to conduct the localization and identification of underground targets in civil infrastructure. Based on the ways of feature extraction, the task 2 can be further divided into traditional-based, ML-based, DL-based. The flow diagram of task 2 is given in Figure 3.
2.2.1. Image-Based Interpretation Methods
Image-based interpretations first extracts features from GPR images, and then analyzes the geometrical characteristics from these features. The traditional feature extraction methods mainly include edge detection, image segmentation, LS, and Hough transform.
The echo feature appears as a hyperbolic shape on the GPR image, with alternating bright (high intensity) and dark (low intensity) edges. Naturally, edge detection methods can be considered for extracting hyperbolic targets. The authors [31] conducted the Canny edge detection method with the image matrix and the computed threshold as inputs. To effectively segment the intersecting hyperbolas, the study [32] mimicked the falling motion of a raindrop and introduced a new drop-flow algorithm to detect GPR signatures and decompose them into feature components in B-scans. In addition, Hough Transform is also a typical hyperbolic recognition method [11,33]. These methods initially locate the potential position of targets, and then the Hough transform is implemented to accurately identify hyperbolic signatures and find the apexes of the targets in the restricted region. To localize the target region, the study [11] utilized the trained cascade of classifiers and applied it to all input images to obtain the region containing the hyperbolic target. The work [33] calculated the normalized variance of the amplitude component to locate the target reflections. However, the Hough transform has a limited ability to reconstruct the hyperbolic signatures due to its high computation cost when facing large amounts of data. Moreover, when encountering multiple intersecting hyperbolic features, the Hough transform is difficult to set the parameter space threshold. Unlike the Hough transform, the LS method can be used to search and distinguish the quadratic curve in GPR images. Windsor et al. [34] proposed an overlapping target segmentation method, which used the traditional LS algorithm to assist in estimating the target (position, depth, radius, or speed). This method has a fast calculation speed, but the matching template depends on a large amount of prior knowledge, which limits its wide application.
Image segmentation algorithms are another vital category used to extract GPR target features. These segmented hyperbolic signatures are then integrated with advanced computer vision methods to detect targets automatically. This category does not require prior knowledge and includes two categories: traditional threshold segmentation and state-of-the-art cluster segmentation:
- Threshold segmentation is the most common method. It can enhance image features and shape pattern features, and eliminate most of the background interference in GPR images, which can be reflected in [35]. Based on this, the amount of calculation for subsequent processing can be greatly reduced.
- Recently, cluster algorithms are operated in GPR image to classify points into different point clusters. The authors [13] proposed a column connection clustering (C3), which scanned the binary map in columns to extract coordinate point sets for clustering and split the GPR images into several parts. Intuitively, the hyperbola in the GPR image has a downward opening, which is a key feature for identifying hyperbola. However, the above C3 algorithm does not consider this important feature. The work [14] developed the open-scan clustering algorithm (OSCA), which makes use of the downward opening feature to make up for the deficiencies of the C3 algorithm. OSCA scans pre-processed binary images line by line, not only using pixel connections, but also clustering through opening information. However, many complex situations are not considered by the OSCA and certain non-target clustering may not be eliminated. Then, the DCSE algorithm was proposed in [15] to solve the above three situations, which collects the downward openings by implementing rule-based searching strategies. The first-round searches for all openings and sets thresholds to eliminate irregular areas. Based on this, the openings are re-searched and marked in the second round. The image-based interpretation method is more flexible and can adjust the corresponding sequence of steps or add restrictions according to different application scenarios. It can assist the target area positioning method and can adapt to various application scenarios.
2.2.2. Machine Learning-Based Techniques
ML is often integrated with the extracted features to predict classification results. The common algorithms include SVM, BP neural network, Naïve Bayes classifier, GA, and so forth.
At present, some scholars have systematically compared the impact of different feature expression methods on discriminant performance [36], and provided guidance suggestions on how to effectively extract training and test samples [37]. Maas et al. [11] applied the face detection framework, namely Viola-Jones, to the location recognition of the hyperbolic signature. This framework works well for simple hyperbolic patterns. The Haar-like wavelet features are extracted as the input of the adaboost-based cascaded classifier. This method eliminates many preprocessing steps, but relies heavily on the reliability and comprehensiveness of the sample. Some studies [38,39] have designed genetic algorithm (GA)-based schemes to identify the linear and hyperbolic features of underground objects in binary images. Based on these identified features, Harkat et al. [39] further classified candidate patches into positive/negative samples by a neural network radial basis function (RBF) classifier. The success of techniques such as [12,40] illustrate the potential for histogram of oriented gradient (HOG) feature extraction combined with SVM technique to develop algorithms for effective and efficient object detection. With additional research, other techniques, such as ANN, may also play a vital role to perform the task. Qing Dou et al. [13] manually select positive/negative samples after clustering GPR target hyperbola, and then calculate two normalized cross-correlation values of the hyperbola, which are fed into the three-layer perception NN for further filtering the target. In work [41], the feature vector extracted from GPR training samples was decomposed into the principal components (PCs) for training a BP-ANN model. In [42], a multilayer perceptron (MLP) was implemented for classifying bridge rebars in Region of Interest (RoI).
The ML model can achieve a pretty trade-off between accuracy and speed when facing a small-scale dataset. However, a large-scale GPR data may limit its efficacy in classification results. That is because the input features of ML model are manually extracted, which depends on expertise and is error-prone.
2.2.3. Deep Learning-Based Techniques
Lately, DL theory has demonstrated its wide applications in classification, recognition, and segmentation [43,44], which lays a foundation for its application in GPR discipline. Unlike ML, which requires pre-designed features, DL networks can directly learn the feature representation from radargrams, even in complex scenes.
The CNN model eliminates the need for researchers to spend too much effort on describing the hyperbolic characteristics. By constructing positive/negative sample sets, the CNN model is able to distinguish the hyperbolic morphology and clutter characteristics. At present, some scholars have proposed the CNN-based detection algorithm for analyzing GPR data [16,17,45], and a large number of experiments have confirmed that CNN can extract and classify the complicated features. Although CNN can make a suitable distinction between targets and clutter features, the localization of the RoI before classification step still depends on other techniques.
The latest strategy for learning and distinguishing features is based on deep object detection or segmentation models [15,20,21,46]. The authors [15] proposed an automatic method based on the trained faster region CNN (Faster R-CNN) [47] to first detect target regions, and then used the transfer learning method to improve the stability. Zhang et al. [20] proposed the mixed deep CNN that consists of both ResNet50 and YOLO v2 networks to assess deterioration conditions of bridges. Based on the understanding of the advanced instance segmentation model, Hou et al. [21] enhanced the performance of Mask R-CNN [48] to further segment GPR signatures, wherein a new loss computation, is developed and incorporated in Mask R-CNN to minimize the discrepancy between the predicted bounding box (Bbox) and the real Bbox in the training phase. To better present the latest research, Figure 4 draws diagram to highlight some significant deep models and algorithms.
2.3. C-Scan Processing
In most cases, the applications of GPR target detection approaches met in the literature depend on B-scans data, and rarely directly on C-scans. As a result, some information might be misinterpreted through this process. To address this important issue, it is necessary to perform this task on C-scans for providing richer information.
Researchers and practitioners have focused on the automated schemes using C-scans. The authors [49] originally developed a novel concept, 3-D S-transform, for creating 3-D patterns of sinkholes in geological structures based on C-scans. In 2015, Klęsk et al. [50] proposed a ML-based approach to efficiently analyze the C-scans. The boosted decision trees are selected as the detector, where the 3-D Haar-like features are customized as the input of detector. In 2018, Klęsk et al., [51] extended the previous research and extracted 3-D variant features from integral images. Taking raw 3-D GPR data as input, the work [52] designed a 3-D model that highlights underground structure and visualizes the location of buried target.
The DL technique also conducts this task based on 3-D data. The studies respectively exploited a deep CNN framework in [53] and used an integrated model of CNN and recurrent neural networks (RNN) in [54] to classify subsurface targets by analyzing both B-scan and C-scan data. In fact, these approaches are directly executed on the B-scan data, not on the C-scan volume. These B-scan data are obtained from the processing and conversion of C-scans. To address this issue, Khudoyarov et al. [55] developed a 3-D CNN model directly operating on 3-D data. Each small 3-D block including the desired target is picked and segmented from the full-sized C-scans. These segmented blocks are then fed into the 3-D deep model for training, and the trained model enables the recognition of the new 3-D data. For further study, in 2020, the authors [56] established a CNN model that uses AlexNet [57] as a baseline and is enhanced by the transfer learning technique. This model directly uses 3-D data for subsurface cavity detection.
3. GPR Applications in Civil Infrastructure: State of the Art
3.1. Bridge Application
Bridge management mainly concerns condition rating and mapping modeling. First, the condition evaluation of a bridge deck usually focuses on cracks, rebar corrosion, structural integrity, component recognition, and poor compaction. Second, the rebar mapping of a concrete bridge concerns the object detection, position estimation, and shape visualization.
3.1.1. Application in Condition Evaluation
By comparing the related computation values of the rebar reflection amplitudes to corrosion quantities, the corrosion degree of a bridge deck is estimated in the recent works [28,58,59,60,61,62]. Table 1 gives some examples of these works. For example, the relevant parameters obtained from [59] included direct coupling amplitude, wave velocity in concrete cover depth, and reflected signal amplitude. The work in [60] measured two parameters: relative permittivity of concrete and EM wave attenuation of rebars. However, the above methods only use the amplitude information of reflected signals, and the incomplete use of GPR information could lead to a limited visualization of true conditions. The integration with other techniques, such SVM classifier integrated with image processing [12], synthetic aperture focusing technique (SAFT) [63], can be exploited to visualize the corrosion regions. Previous studies in [64,65] introduced an integrated framework for predicting and analyzing deterioration based on visual inspection and GPR evaluation results. A case study was conducted in [66] to study the use of GPR surveys in conjunction with unmanned aerial photogrammetry and infrared (IR) thermography analyses to help assess bridge degradation.
Some research has been contributed to the automated task of crack detection based on the ML method [67,68]. The work in [67] used ML classification first, followed by a curve fitting method to further identify crack areas from noisy backgrounds. The study in [68] applied ML to a constructed Gaussian regression model based on the formation of crack damage resulting from different influential factors. In addition, the integration of IR and GPR technologies was also explored in [69,70] to enhance defect detection. IR photography was used here for measuring the temperature changes of the bridge deck, and GPR was used to record signal attenuation.
Recent studies also focus on achieving a structural integrity evaluation for bridges. Both works in [71,72] used an integrated model of GPR and interferometric synthetic aperture radar (InSAR) to assess displacement level of the bridge structure. InSAR can initially identify RoI, while GPR can further detect attenuation sources. The research in [73] concerned the development of a ML algorithm, called gradient boosting, for the full depth condition assessment. Using the EM properties (permittivity and conductivity) as characteristic parameters to simulate concrete conditions with different quality level. Narazaki et al. [74] investigated and recognized the bridge component after earthquakes in an automatic manner. This work exploited a DL semantic segmentation framework that consists of 45 convolutional layers.
3.1.2. Application in Mapping Rebar
Mapping the location and dimension of rebars in concrete bridge can be critical for assessing the structure and state of reinforced concrete (RC). Figure 5 shows some scene pictures of field applications. The model proposed in [75] demonstrated that the combination of sparse blind deconvolution (SBD) and full-waveform inversion (FWI) can estimate rebar diameters and obtain a sparse representation of the subsurface reflectivity series. In recent works, some techniques, such as the limited and simplified hyperbolic summation (LSHS) [76], CNN [45], GA [38], MLP [42], and SVM [12], have been developed for automated rebar classification, laying the foundation for next target location mapping. Some works about this topic are listed in Table 1.

Table 1.
Some examples of the latest GPR works in bridge applications.
| References | Study Scope | GPR Types | Center Frequency | Field Data Source |
|---|---|---|---|---|
| Dinh et al. (2015) [28] | Deterioration progression | GSSI ground-coupled radar | 1.5 GHZ | Two data collected in 2008 and 2013 from a bridge deck in New Jersey, U.S. (built in 1978) |
| Rhee et al. (2019) [60] | Deteriorated depth | GSSI air-coupled radar | 1 GHZ | ‘J’ bridge in Korea (built in 1998) |
| Kaur et al. (2015) [12] | Rebar detection and localization; deterioration map generation | GSSI SIR-20 | \ | \ |
| Dinh et al. (2019) [63] | Produce an amplitude map to present location of rebar and corrosive area | GSSI | 1.5 GHZ | Four data sets collected in: (1) July 2013 from the Elkton Bridge in the U.S. (built in 1973); (2) August 2013 from Pequea Bridge in the U.S. (built in 1970); (3) 2014 from Bridge X in Canada (built in 1966); (4) Bridge Y in Canada |
| Okazaki et al. (2020) [68] | Crack formation and propagation | \ | \ | The data collected from 2005 to 2015 from 1688 bridges in Japan |
| Jazayeri et al. (2019) [75] | Rebar diameter estimation; concrete permittivity and conductivity estimation | GSSI ground-coupled GPR system | 1, 2.6 GHZ | \ |
| Wang et al. (2020) [38] | Rebar detection | ProEx RAMAC | 500, 800, 1000, 1600 MHZ | The data collected from Ci Er mountain expressway tunnel in Hebei, China |
| Asadi et al. (2020) [42] | Rebar detection | GSSI | \ | The authors published an open-source GPR dataset collected from bridge deck (https://github.com/PouriaAI/GPR-Detection, accessed on 20 December 2021). |
3.2. Road Pavement Assessment
GPR road application involves the distressing diagnosis of existing roads and quality control surveys in road projects.
3.2.1. Distress Detection
Road pavements are subject to traffic and temperature variations, resulting in distresses, such as reflection cracks, defects, or potholes, shortening their lifeline. Early diagnosis of these distresses allows proper maintenance and rehabilitation. Some of the literature is summarized in Table 2.
Many technologies have been used for pavement distress detection [77,78,79,80]. The work in [79] detected the cracks under different widths and proved that the signal shape of GPR is not affected by width. The EM wave velocity in underground media was estimated in [80] to detect the damaged parts, even the thin cracks can be found. Literature [81] designed a detector based on the analysis of the reflected signals of potholes and estimated the corresponding position and dimension. Lagüela et al. [82] studied the joint use of GPR, IR thermography and terrestrial laser scanning (TLS), and tested them in a road next to the sea for a comprehensive assessment of pathologies.
Some studies exploited the DL method to identify distress on GPR data. Tong et al. [83] applied two different CNNs framework, multi-stage CNN and cascaded CNN, to automate the classification of road defects. The results proved the cascaded CNN outperforms the multi-stage CNN. The network model developed in [84] deepened multilayer perceptrons in CNN to extract low-level features first, and then these features were grouped into high-level features. The network directly uses GPR signals as input data to identify and classify the type of distress, and evaluate the locations and sizes. Gao et al. [85] developed an object detection model to detect distress. The model was optimized using both the new anchor scales and DL tricks such as stochastic pooling.
Table 2.
Some examples for road distress detection based on GPR.
| References | Study Scope | GPR Types | Center Frequency | Field Data Source |
|---|---|---|---|---|
| Rasol et al. (2020) [78] | Cracks detection; pavement assessment | \ | 1.6 GHZ | \ |
| Fernandes et al. (2017) [79] | Pavement cracks detection | Ground-coupled GPR system | 1.6 GHZ | \ |
| Yi et al. (2018) [80] | Airport pavement inspection; damage detection | YAKUMO array GPR System [86] | 1.5 GHZ | The data sets acquired at an examined airport taxiway. |
| Li et al. (2016) [81] | Pothol detection | GPR (MALÅ, Sweden) | 800 MHz | \ |
| Lagüela et al. (2018) [82] | Damage detection in paving | MALÅ RAMAC system | 500, 800 MHZ | The data sets collected from an esplanade area. |
| Tong et al. (2018) [83] | Subgrade defects classification; highway assessment | Air-coupled GPR called OKO GPR | 300, 500, 900 MHZ | \ |
| Tong et al. (2020) [84] | Pavement distress detection | OKO-2 GPR system | 300, 600, 900 MHz | The data sets collected from four highways in Heilongjiang with an overall length of 27,820 m. |
| Gao et al. (2020) [85] | Pavement distress detection | LTD-2000 air-coupled GPR | 300, 500, 900 MHz | \ |
3.2.2. Quality Control
Effective quality assurance and control inspections of road pavements is taking priority nowadays. The works [87,88] evaluated and analyzed the frequency spectrum of GPR signals, and thus to provide an accurate judgment of the internal conditions of pavement materials. For most studies, the acquired data from asphalt layer of road pavement are interpreted into the relevant input, such as thickness [89,90,91,92,93,94], permittivity [89,95], moduli [96], interface roughness [97], or stiffness [98], for flexible pavements assessment. Among them, asphalt layer thickness is the most relevant input. To estimate the thickness, De Coster et al. [90] exploited the GPR full-wave inversion and straight-ray methods, and the study [91] applied the Common Mid-Point (CMP) method. A case study in [92] was investigated to differentiate the asphalt pavement layers and map their variable thickness. In addition, the multiple signal classification (MUSIC) method was conducted in [93] to increase the resolution of 3-D GPR signals for improving the evaluation performance of asphalt overlay thickness, and used in [97] to compute time delay for assessing interface roughness. In addition, GPR applications also demonstrates its ability to monitor the density change during the compaction of asphalt pavement. To extract density information without the effect of surface moisture, some works [99,100,101] were investigated on pavement to remove the surface moisture and predict the density profile of asphalt concrete (AC) pavement.
3.3. Underground Utilities Survey
It is vital to clearly survey underground pipelines when the underground space of an old urban area is rebuilt and expanded. GPR is usually used to locate utilities, determine their diameters, and assess water leakage.
3.3.1. Utilities Positioning and Mapping
Underground utility mapping is an important technology for extracting underground information, which can provide an effective man-machine interaction for safe excavation.
Before locating underground utilities, some preprocessing methods are required, such as background removal algorithm [102] and pipes visibility increase [24]. Existing studies [53,103,104,105,106,107,108] have been implemented for positioning and mapping utilities. In [105], the interpretation and comparison of the raw B-scans associated with the different pipe zone and three different GPR system frequencies have allowed us to detect the hyperbola signatures of the buried pipes. The study [107] about the visualization of urban utilities was conducted based on the integrated model of GPR and robotic terrestrial positioning system (TPS). In [108], a smooth 3-D curve with location and depth information was obtained to intuitively visualize the direction of buried cables. After locating underground pipelines, the interpretation of GPR data is also very vital for city planning. For example, the diameter prediction of utilities filled with lossy media [109], the depth and radius estimation of plastic pipe [110], and the size and condition prediction of drainage pipes [111]. Some examples can be found in Table 3.
S. Li et al. have contributed to this research from 2015 to 2020 [32,112,113,114]. In 2015 [112], an integrated system with GPR, a global positioning system (GPS), and geographical information system (GIS) were developed for mapping subsurface pipelines. Next year, to estimate the buried depth and radius of utilities, the authors [113] proposed a novel hyperbola equation to model GPR raw data based on the incorporation of the relative angles between buried utilities and GPR scanning trajectories. In 2018, to further effectively segment the intersecting hyperbolas, the research [32] mimicked the motion of a raindrop falling and introduced a new drop-flow scheme to identify and segment GPR signatures into feature components in B-scans. In 2020 [114], the state of pipes (presence/absence) can be inferred by fusing the evidence from heterogeneous sources based on the Dempster–Shafer evidence theory.
3.3.2. Water Leakage Detection
Leakage detection in a buried water pipe is a crucial issue as underground pipes become aged. Many studies have used GPR as an effective tool because its EM wave is highly sensitive to the water in the soil. For example, the work [115] reviewed two measure means: GPR and IR camera, to detect and locate water leakage in pipeline networks. GPR is first used to locate buried utilities, followed by the IR technique for subtle leakage collection. In addition to these two techniques, the study [116] also considered an additional technique, acoustic detectors, for the environment with high soil moisture and to make up for the inadequate operational capabilities of GPR and IR in the same environment. By detecting the water leak from the pipes buried in a sand box [117], the work compared the collected data with different patterns and diagnosed if there is leakage issue. In [118], the authors measured the changes in EM wave velocity and wave reverberation to sense an integrated water leakage. The comparative results proved leakages could be identified most clearly in the 600 MHz GPR.
3.4. Urban’s Subsurface Risks
Urban areas often face road safety problems caused by sudden road cave-ins, which seriously threatens people’s life and property safety. In order to prevent road collapse accidents, extensive research has been carried out. Some examples of literature are listed in Table 4.
3.4.1. Void Risk
Void disease caused by construction quality and external loads contributes to the failure of RC structures. The authors [119] proposed a void-detection algorithm using the target echoes data collected from railways. Based on the typical target echo models of rebar and void, a horizontal filter was constructed to identify the void diseases and eliminate the interference of rebar echoes. The study [120] identifies voids based on the SVM classifier, using features vectors composed of discrete cosine transform (DCT) coefficients as input. The authors [121] established a database of void patterns of both C-scans and B-scans, wherein voids were automatically located from C-scans and verified from corresponding B-scans. A novel framework based on multi-sensors (such as unmanned aerial vehicles (UAV)) and GPR was proposed. Both works in [122,123] exploited GPR data to detect voids in disaster areas, with the purpose of providing related information to rescue potential victims buried/trapped in ruined buildings.
3.4.2. Sinkhole Risk
The sinkhole is located beneath a street and has led to the demolition of buildings. This section considers the current literature on sinkhole occurrence through the deployment of GPR. Solutions have been grasped; preventative planning based on early detection is among the most effective available solutions [49,124]. The literature [49] first developed the concept of 3-D S-transform, which allowed the study of 3-D GPR data, and was used to look for sinkholes in geological structures. Sevil et al. [124] conducted a sinkhole investigation by analyzing and comparing data gathered by several different strategies: trenching, GPR technique, electrical resistivity tomography (ERT), and high-precision leveling. The combination of common methods can provide the key information for specific sinkholes.
3.4.3. Cavity Risk
Ground cavity configurations, including depth, roof shape, and length, are the main factors affecting the risk of ground sinkholes. Much research has focused on urban cavity detection using 3-D GPR data. A case study was achieved based on the 3-D GPR mapping, which provided most of the identified cavities [125]. In addition, the tailored CNN-based cavity detection techniques were studied in [56,126]. The authors [126] established an underground cavity detection network (UcNet) to decrease underground cavity misclassification, and the study [56] developed a CNN framework that was based on the pre-trained AlexNet and enhanced by the transfer learning technique. Some additional techniques, such as instantaneous phase analysis [127] and domain reflectometry [128], also were integrated with the GPR technique to estimate the status of the cavity. The study [127] visualized and distinguished the hidden cavities from other underground objects such as buried pipes and manholes. The work [128] developed a novel time domain reflectometry-based penetrometer system to accurately estimate the relative permittivity of the ground at different depths.
Table 4.
Some examples of the latest GPR works in urban risk applications.
| References | Study Scope | GPR Types | Center Frequency | Field Data Source |
|---|---|---|---|---|
| Yang et al. (2019) [119] | Void disease identification | RIS-K2 system | 2 GHZ, 900 MHZ | The data collected in 2015 from CRTS-II slab ballastless, Shijiazhuang Tiedao University. |
| Luo et al. (2020) [121] | Subsurface voids identification | GSSI SIR-4000 | 400, 900 MHZ | The data collected from a seawall platform in Tai O, Hong Kong. |
| Qin et al. (2016) [120] | Voids identification | \ | 400 MHZ | \ |
| Sevil et al. (2017) [124] | Sinkhole mapping | RIS system | 40, 100, 200 MHZ | 7 common offset GPR profiles were acquired in the sinkhole site: one along the street in April 2013, six in March 2017, three along the street, and three across the street and the trench. |
| Garcia-Garcia et al. (2017) [125] | Cavity mapping | GSSI SIR-3000 | 400 MHZ | The data collected on road area (7 m × 42 m) situated in Torrente, Spanish. |
| Kang et al. (2020) [56] | Underground cavity detection | GEOSCOPE MK IV30 system | 200–3000 MHZ | The data obtained from a total of 13 km of urban roads in 17 different regions in Seoul, South Korea. |
| Park et al. (2018) [127] | Underground objects (cavity, pipe, manhole) detection and classification | DXG1820 GPR antenna | 1.6 GHZ, 200–3000 MHZ | The data collected on urban road area (0.7 km) near subway station in Seoul, South Korea. |
| Hong et al. (2018) [128] | Estimate the ground cavity configurations | GSSI SIR-3000 | 270 MHZ | \ |
4. Discussion and Conclusions
This section includes a comprehensive discussion of GPR data analysis techniques and future perspectives, as shown in Figure 6.
4.1. Comprehensive Discussion of GPR Data Analysis Techniques
At present, a large amount of data analysis techniques have been carried out on the GPR target detection task. However, the existing research work still relies on manual work, and the challenges brought by the complex instability of subsurface scenes have not been fully solved. The main challenges of the data analysis techniques in the GPR field are summarized as follows:
4.1.1. Lack of Effective Signature Extraction Strategies in Complex Scenarios
Most of the existing work assumes obtaining high-quality GPR simulation data under ideal scenarios and relies on these data to perform tasks related to subsurface target detection, localization, and parameter evaluation. The task effectiveness depends on the quality of the data, which largely determines the simplicity of the subsequent processing steps and the correctness of the evaluation results. However, in a complex environment, consistent, high-quality data and high-performance results are not always available, which may lead to serious misjudgment of the perception of underground targets. In addition, many underground structures, irregular target distribution, unknown target size, depth information, and complex underground media conditions greatly limit the automatic real-time development of large-scale target recognition systems. As the dielectric constant of underground fillings is highly related to weather conditions, the surrounding environment, and emergencies, the reflected ground penetrating radar signal is too weak or even invisible, which may lead to the omission of target objects under the conditions of high surface water content, diverse fillings, and corrosion of buried objects.
It is of great research value to deeply understand the attributes of the target itself, especially to distinguish the characteristics between target and non-target. It is necessary to design an effective feature extraction strategy for GPR target detection in complex situations. In this way, not only all target features can be completely extracted from the whole GPR image, but they can also not be interfered with by adjacent or overlapping targets so as to obtain effective, high-quality data.
4.1.2. Lack of Customized Deep Models for Different Types of Target Signatures
First, the DL technique can be used for most image-related tasks, but radar images are different from conventional images, and the internal architecture of the deep model is not closely related to the attributes of the radar map and the target features. Therefore, directly applying the deep models to GPR data analysis may ignore useful information, resulting in their redundant processing. In addition, the synthetic aperture length of GPR is much larger than the target size, so the rising and falling edges of the hyperbolic feature of the target in GPR imaging are steep; that is to say, the vertical and horizontal proportions of the rising and falling edges are large, which leads to the area where the hyperbolic features of the target are located. The proportion of pixels in the whole GPR image is very small, showing typical small target characteristics. When the conventional depth model is applied to the detection of these small target features, it is easy to cause the loss and missed detection of dense small targets.
Therefore, it is necessary to design a specific target detection model to match the input features of each target type. Since the features extracted by the deep model are non-intuitive and difficult to interpret, how to design an effective model for specific applications in specific scenarios and focus on exploring and interpreting the internal structure of the deep model is a challenging and meaningful research problem.
4.2. Future Perspective
This paper provided an overview of the states of research on employing the GPR technique in the civil engineering world. As a comprehensive overview of GPR data analysis and processing, this paper has analyzed the complexity of GPR signals, summarized the popular A/B/C-scan processing methods, provided some structural categories according to the feature extraction style, and discussed the advanced applications for the civil infrastructure. Although significant progress has been made, the following discussion identifies some promising directions for exploratory research.
4.2.1. Matching Consistency between GPR Feature and Deep Model
In practical operation, multiple factors such as the changes in radar parameters, the complexity of the underground medium, or the non-uniform movement of the T/R antenna will cause the target characteristics to be distorted in the image domain. It is necessary to design the corresponding DL model that enables matching each type of input feature to complete the target recognition process. Since the features extracted by DL models are non-intuitive and difficult to explain, it is still a challenge to design matching models for certain application-oriented problems. Future research can focus on the exploration and interpretation of the internal structure of the DL model so as to expand its application scope.
4.2.2. Reduced Dependence on Large Amounts of Data
DL-based GPR analysis has not kept pace with the rapid progress in other fields, partially due to the unavailability of a large-scale radar database. Therefore, there is an important need for a high-quality, large-scale GPR dataset, which will greatly promote radar data analysis. However, in many applications, only a limited number of annotated training data are available, or it is too expensive to collect labeled training data. Possible research could be to develop the learnable multi-dimensional descriptors that require modest training data or to explore effective transfer learning.
4.2.3. Impact of Multiple Factors on Data Analysis
Several factors, such as material, condition, and environment, must be considered while performing GPR data analysis. For example, for bridge applications, these factors include the condition of the asphalt concrete overlay and its material properties and moisture, deck structure, and extent of deterioration. For road pavement applications, these factors include reflection cracks, defects distribution, potholes, moisture, and cavity existence. For underneath utilities survey, these factors include materials, the extent of deterioration, corrosion, and water leakage. For subsurface risks, these factors concern cavity depth, roof shape, and length. Further research is needed to study the impacts of these factors individually and the impacts of the combination of multiple of these factors.
4.2.4. Integrated NDT Technologies
Some studies integrated results from GPR and other high-performance NDTs for supporting various subsurface conditions. Future research to complete the integration task needs to concern: (1) Selecting the technologies to integrate for specific conditions; (2) Evaluating the number of technologies to integrate according to the functions that need to be implemented; (3) Automatically integrating results of multiple technologies into one output, instead of separately integrating results collected from multiple technologies.
4.3. Literature Review Comparison
4.4. Paper Selection Strategy
A search strategy for identifying relevant literature must be developed. This review paper follows the PRISMA method (https://www.prisma-statement.org/Default.aspx, accessed on 24 March 2020). This includes selecting search terms and appropriate databases and deciding on inclusion and exclusion criteria. This search work lasted from May 2019 to June 2022, and the publications were retrieved from the most recognized international scientific citation indexing services. This work used two reviewers to select articles.
First, three databases are utilized to search references: (1) Web of Science (due date: 06/2022) (https://www.webofscience.com/, accessed on 2 April 2020); (2) Elsevier (due date: 05/2022) (https://www.sciencedirect.com/, accessed on 17 March 2020); (3) IEEE/IET Electronic Library (due date: 03/2022) (https://ieeexplore.ieee.org/, accessed on 29 December 2020). Second, search terms can be words or phrases that are directly related to the research question of each subsection. Third, a strategy is required to narrow the search range and point out indeed relevant literature. Criteria that are considered and used are: (1) the year of publications is limited in recent years from 2015 to 2022, except for some classical literature; (2) the type of articles focuses on scholarly journals, top-level computation conference proceedings, and books; (3) the language of articles is limited to English.
Author Contributions
Conceptualization, F.H.; methodology, F.H.; formal analysis, X.F.; investigation, X.R.; resources, X.R.; writing—original draft preparation, F.H.; writing—review and editing, X.R.; visualization, F.H.; supervision, X.F. and H.Z.; funding acquisition, X.F. and H.Z. All authors have read and agreed to the published version of the manuscript.
Funding
This research was funded by the National Natural Science Foundation of China (nos. 62203475) and the Natural Science Foundation of Hunan Province (nos. 2021JJ30878).
Data Availability Statement
Not applicable.
Acknowledgments
Thanks are due to Guangyan Cui from Beijing Jiaotong University, for assistance with the visualization.
Conflicts of Interest
The authors declare no conflict of interest.
Abbreviations
| Abbreviation | Description |
| AC | Asphalt Concrete |
| Bbox | Bounding Box |
| Bi-LSTM | Bi-Directional Long Short-Term Memory |
| BP | Back Propagation |
| C3 | Column Connection Clustering |
| CMP | Common Mid-Point |
| DC | Direct Current |
| DCSE | Double Cluster Seeking Estimate |
| DCT | Discrete Cosine Transform |
| DL | Deep Learning |
| EM | Electromagnetic |
| ERT | Electrical Resistivity Tomography |
| FWI | Full-Waveform Inversion |
| GA | Genetic Algorithm |
| GIS | Geographical Information System |
| GPR | Ground Penetrating Radar |
| GPS | Global Positioning System |
| HOG | Histogram of Oriented Gradient |
| IEEE | Institute of Electrical and Electronics Engineers |
| IET | The Institution of Engineering and Technology |
| InSAR | Interferometric Synthetic Aperture Radar |
| IR | Infrared |
| LS | Least Squares |
| LSHS | Limited and Simplified Hyperbolic Summation |
| ML | Machine Learning |
| MLP | Multilayer Perceptron |
| MUSIC | Multiple Signal Classification |
| NDT | Non-Destructive Testing |
| NN | Neural Network |
| ANN | Artificial Neural Network |
| BP-ANN | Back Propagation-Artificial Neural Network |
| CNN | Convolutional Neural Networks |
| DeepCNN | Deep Convolutional Neural Networks |
| RNN | Recurrent Neural Networks |
| R-CNN | Region-CNN |
| Faster R-CNN | Faster Region-CNN |
| Mask R-CNN | Mask Region-CNN |
| OSCA | Open-Scan Clustering Algorithm |
| PCs | Principal Components |
| PRISMA | Preferred Reporting Items for Systematic Reviews and Meta-Analyses |
| R antenna | Receiving antenna |
| T antenna | Transmitting antenna |
| RBF | Radial Basis Function |
| RC | Reinforced Concrete |
| ResNet50 | Residual Network 50 |
| RoI | Region of Interest |
| SAFT | Synthetic Aperture Focusing Technique |
| SBD | Sparse Blind Deconvolution |
| SVM | Support Vector Machine |
| CSVM | Convolutional SVM |
| TLS | Terrestrial Laser Scanning |
| TPS | Terrestrial Positioning System |
| UAV | Unmanned Serial Vehicles |
| UcNet | Underground Cavity Detection Network |
| YOLO v2 | You Only Look Once Version 2 |
| 1-D | One-Dimensional |
| 2-D | Two-Dimensional |
| 3-D | Three-Dimensional |
References
- Lai, W.W.-L.; Derobert, X.; Annan, P. A review of Ground Penetrating Radar application in civil engineering: A 30-year journey from Locating and Testing to Imaging and Diagnosis. Ndt E Int. 2018, 96, 58–78. [Google Scholar]
- Gizzi, F.T.; Leucci, G. Global research patterns on ground penetrating radar (GPR). Surv. Geophys. 2018, 39, 1039–1068. [Google Scholar] [CrossRef]
- Daniels, D. Ground Penetrating Radar; The Institution of Electrical Engineers: London, UK, 2004. [Google Scholar]
- Slob, E.; Sato, M.; Olhoeft, G. Surface and borehole ground-penetrating-radar developments. Geophys. 2010, 75, 75A103–75A120. [Google Scholar] [CrossRef] [Green Version]
- Molyneaux, T.; Millard, S.; Bungey, J.; Zhou, J. Radar assessment of structural concrete using neural networks. NDT E Int. 1995, 28, 281–288. [Google Scholar] [CrossRef]
- Gamba, P.; Lossani, S. Neural detection of pipe signatures in ground penetrating radar images. IEEE Trans. Geosci. Remote Sens. 2000, 38, 790–797. [Google Scholar] [CrossRef]
- Shaw, M.R.; Millard, S.G.; Molyneaux, T.C.K.; Taylor, M.J.; Bungey, J.H. Location of steel reinforcement in concrete using ground penetrating radar and neural networks. NDT E Int. 2005, 38, 203–212. [Google Scholar] [CrossRef]
- Capineri, L.; Grande, P.; Temple, J.A.G. Advanced image-processing technique for real-time interpretation of ground-penetrating radar images. Int. J. Imaging Syst. Technol. 1998, 9, 51–59. [Google Scholar] [CrossRef]
- Borgioli, G.; Capineri, L.; Falorni, P.; Matucci, S.; Windsor, C.G. The Detection of Buried Pipes from Time-of-Flight Radar Data. IEEE Trans. Geosci. Remote Sens. 2008, 46, 2254–2266. [Google Scholar] [CrossRef]
- Pasolli, E.; Melgani, F.; Donelli, M. Automatic Analysis of GPR Images: A Pattern-Recognition Approach. IEEE Trans. Geosci. Remote Sens. 2009, 47, 2206–2217. [Google Scholar] [CrossRef]
- Maas, C.; Schmalzl, J. Using pattern recognition to automatically localize reflection hyperbolas in data from ground penetrating radar. Comput. Geosci. 2013, 58, 116–125. [Google Scholar] [CrossRef]
- Kaur, P.; Dana, K.J.; Romero, F.A.; Gucunski, N. Automated GPR rebar analysis for robotic bridge deck evaluation. IEEE Trans. Cybern. 2015, 46, 2265–2276. [Google Scholar] [CrossRef] [PubMed]
- Dou, Q.; Wei, L.; Magee, D.R.; Cohn, A.G. Real-time hyperbola recognition and fitting in GPR data. IEEE Trans. Geosci. Remote Sens. 2016, 55, 51–62. [Google Scholar] [CrossRef] [Green Version]
- Zhou, X.; Chen, H.; Li, J. An automatic GPR B-scan image interpreting model. IEEE Trans. Geosci. Remote Sens. 2018, 56, 3398–3412. [Google Scholar] [CrossRef]
- Lei, W.; Hou, F.; Xi, J.; Tan, Q.; Xu, M.; Jiang, X.; Liu, G.; Gu, Q. Automatic hyperbola detection and fitting in GPR B-scan image. Autom. Constr. 2019, 106, 102839. [Google Scholar] [CrossRef]
- Besaw, L.E.; Stimac, P.J. Deep convolutional neural networks for classifying GPR B-scans. In Proceedings of the Detection and Sensing of Mines, Explosive Objects, and Obscured Targets XX. International Society for Optics and Photonics, Baltimore, MD, USA, 20–24 April 2015. [Google Scholar]
- Bralich, J.; Reichman, D.; Collins, L.M.; Malof, J.M. Improving convolutional neural networks for buried target detection in ground penetrating radar using transfer learning via pretraining. In Proceedings of the Detection and Sensing of Mines, Explosive Objects, and Obscured Targets XXII. International Society for Optics and Photonics, Anaheim, CA, USA, 9–13 April 2017. [Google Scholar]
- Pham, M.-T.; Lefèvre, S. Buried Object Detection from B-Scan Ground Penetrating Radar Data Using Faster-RCNN. In Proceedings of the IEEE International Geoscience and Remote Sensing Symposium, Valencia, Spain, 22–27 July 2018. [Google Scholar]
- Ozkaya, U.; Melgani, F.; Bejiga, M.B.; Seyfi, L.; Donelli, M. GPR B Scan Image Analysis with Deep Learning Methods. Measurement 2020, 165, 107770. [Google Scholar] [CrossRef]
- Zhang, J.; Yang, X.; Li, W.; Zhang, S.; Jia, Y. Automatic detection of moisture damages in asphalt pavements from GPR data with deep CNN and IRS method. Autom. Constr. 2020, 113, 103119. [Google Scholar] [CrossRef]
- Hou, F.; Lei, W.; Li, S.; Xi, J.; Xu, M.; Luo, J. Improved Mask R-CNN with distance guided intersection over union for GPR signature detection and segmentation. Autom. Construction. 2021, 121, 103414. [Google Scholar] [CrossRef]
- Özkaya, U.; Öztürk, Ş.; Melgani, F.; Seyfi, L. Residual CNN+Bi-LSTM model to analyze GPR B scan images. Autom. Constr. 2021, 123, 103525. [Google Scholar] [CrossRef]
- Jol, H.M. Ground Penetrating Radar Theory and Applications; Elsevier: Amsterdam, The Netherlands, 2008. [Google Scholar]
- Zhang, W.; Hao, T.; Chang, Y.; Zhao, Y. Time-frequency analysis of enhanced GPR detection of RF tagged buried plastic pipes. Ndt E Int. 2017, 92, 88–96. [Google Scholar] [CrossRef]
- Benedetto, A.; Tosti, F.; Ciampoli, L.B.; D’Amico, F. An overview of ground-penetrating radar signal processing techniques for road inspections. Signal Process. 2017, 132, 201–209. [Google Scholar] [CrossRef]
- Lai, W.; Kind, T.; Wiggenhauser, H. Using ground penetrating radar and time–frequency analysis to characterize construction materials. NDT E Int. 2011, 44, 111–120. [Google Scholar] [CrossRef]
- Lai, W.-L.; Kind, T.; Wiggenhauser, H. Frequency-dependent dispersion of high-frequency ground penetrating radar wave in concrete. NDT E Int. 2011, 44, 267–273. [Google Scholar] [CrossRef]
- Dinh, K.; Zayed, T.; Romero, F.; Tarussov, A. Method for analyzing time-series GPR data of concrete bridge decks. J. Bridge Eng. 2015, 20, 04014086. [Google Scholar] [CrossRef]
- Yoldemir, A.B.; Sezgin, M. A least squares approach to buried object detection using ground penetrating radar. IEEE Sens. J. 2010, 11, 1337–1341. [Google Scholar] [CrossRef]
- Gurbuz, A.C. Determination of background distribution for ground-penetrating radar data. IEEE Geosci. Remote Sens. Lett. 2011, 9, 544–548. [Google Scholar] [CrossRef]
- Mertens, L.; Persico, R.; Matera, L.; Lambot, S. Automated detection of reflection hyperbolas in complex GPR images with no a priori knowledge on the medium. IEEE Trans. Geosci. Remote Sens. 2015, 54, 580–596. [Google Scholar] [CrossRef]
- Yuan, C.; Li, S.; Cai, H.; Kamat, V.R. GPR signature detection and decomposition for mapping buried utilities with complex spatial configuration. J. Comput. Civ. Eng. 2018, 32, 04018026. [Google Scholar] [CrossRef]
- Qiao, L.; Qin, Y.; Ren, X.; Wang, Q. Identification of buried objects in GPR using amplitude modulated signals extracted from multiresolution monogenic signal analysis. Sens. 2015, 15, 30340–30350. [Google Scholar] [CrossRef] [PubMed]
- Windsor, C.G.; Capineri, L.; Falorni, P. A data pair-labeled generalized Hough transform for radar location of buried objects. IEEE Geosci. Remote Sens. Lett. 2013, 11, 124–127. [Google Scholar] [CrossRef]
- Jiao, L.; Ye, Q.; Cao, X.; Huston, D.; Xia, T. Identifying concrete structure defects in GPR image. Measurement 2020, 160, 107839. [Google Scholar] [CrossRef]
- Sakaguchi, R.; Morton, K.D.; Collins, L.M.; Torrione, P.A. A comparison of feature representations for explosive threat detection in ground penetrating radar data. IEEE Trans. Geosci. Remote Sens. 2017, 55, 6736–6745. [Google Scholar] [CrossRef]
- Reichman, D.; Collins, L.M.; Malof, J.M. On choosing training and testing data for supervised algorithms in ground-penetrating radar data for buried threat detection. IEEE Trans. Geosci. Remote Sens. 2017, 56, 497–507. [Google Scholar] [CrossRef]
- Wang, Y.; Cui, G.; Xu, J. Semi-automatic detection of buried rebar in GPR data using a genetic algorithm. Autom. Constr. 2020, 114, 103186. [Google Scholar] [CrossRef]
- Harkat, H.; Ruano, A.; Ruano, M.; Bennani, S. GPR target detection using a neural network classifier designed by a multi-objective genetic algorithm. Appl. Soft Comput. 2019, 79, 310–325. [Google Scholar] [CrossRef]
- Bordón, P.; Bonomo, N.; Martinelli, P. Automatic detection of pipe-flange reflections in GPR data sections using supervised learning. J. Appl. Geophys. 2019, 170, 103856. [Google Scholar] [CrossRef]
- Zhang, J.; Zhang, C.; Lu, Y.; Zheng, T.; Dong, Z.; Tian, Y.; Jia, Y. In-situ recognition of moisture damage in bridge deck asphalt pavement with time-frequency features of GPR signal. Constr. Build. Mater. 2020, 244, 118295. [Google Scholar] [CrossRef]
- Asadi, P.; Gindy, M.; Alvarez, M.; Asadi, A. A computer vision based rebar detection chain for automatic processing of concrete bridge deck GPR data. Autom. Constr. 2020, 112, 103106. [Google Scholar] [CrossRef]
- Chen, J.; Lu, W.; Yuan, L.; Wu, Y.; Xue, F. Estimating construction waste truck payload volume using monocular vision. Resour. Conserv. Recycl. 2022, 177, 106013. [Google Scholar] [CrossRef]
- Chen, J.; Li, S.; Liu, D.; Lu, W. Indoor camera pose estimation via style-transfer 3D models. Comput.-Aided Civ. Infrastruct. Eng. 2021, 37, 335–353. [Google Scholar] [CrossRef]
- Dinh, K.; Gucunski, N.; Duong, T.H. An algorithm for automatic localization and detection of rebars from GPR data of concrete bridge decks. Autom. Constr. 2018, 89, 292–298. [Google Scholar] [CrossRef]
- Kim, N.; Kim, K.; An, Y.-K.; Lee, H.-J.; Lee, J.-J. Deep learning-based underground object detection for urban road pavement. Int. J. Pavement Eng. 2018, 21, 1638–1650. [Google Scholar] [CrossRef]
- Ren, S.; He, K.; Girshick, R.; Sun, J. Faster R-CNN: Towards real-time object detection with region proposal networks. IEEE Trans. Pattern Anal. Mach. Intell. 2017, 39, 1137–1149. [Google Scholar] [CrossRef] [PubMed] [Green Version]
- He, K.; Gkioxari, G.; Dollar, P.; Girshick, R. Mask R-CNN. In Proceedings of the IEEE International Conference on Computer Vision, Venice, Italy, 22–29 October 2017. [Google Scholar]
- Szymczyk, P.; Szymczyk, M. Non-destructive building investigation through analysis of GPR signal by S-transform. Autom. Constr. 2015, 55, 35–46. [Google Scholar] [CrossRef]
- Klesk, P.; Godziuk, A.; Kapruziak, M.; Olech, B. Fast analysis of C-scans from ground penetrating radar via 3-D Haar-like features with application to landmine detection. IEEE Trans. Geosci. Remote Sens. 2015, 53, 3996–4009. [Google Scholar] [CrossRef]
- Klęsk, P.; Kapruziak, M.; Olech, B. Statistical moments calculated via integral images in application to landmine detection from Ground Penetrating Radar 3D scans. Pattern Anal. Appl. 2018, 21, 671–684. [Google Scholar] [CrossRef] [Green Version]
- Pereira, M.; Burns, D.; Orfeo, D.; Zhang, Y.; Jiao, L.; Huston, D.; Xia, T. 3-D Multistatic Ground Penetrating Radar Imaging for Augmented Reality Visualization. IEEE Trans. Geosci. Remote Sens. 2020, 58, 5666–5675. [Google Scholar] [CrossRef]
- Kim, N.; Kim, S.; An, Y.-K.; Lee, J.-J. A novel 3D GPR image arrangement for deep learning-based underground object classification. Int. J. Pavement Eng. 2019, 22, 740–751. [Google Scholar] [CrossRef]
- Moalla, M.; Frigui, H.; Karem, A.; Bouzid, A. Application of Convolutional and Recurrent Neural Networks for Buried Threat Detection Using Ground Penetrating Radar Data. IEEE Trans. Geosci. Remote Sens. 2020, 58, 7022–7034. [Google Scholar] [CrossRef]
- Khudoyarov, S.; Kim, N.; Lee, J.-J. Three-dimensional convolutional neural network–based underground object classification using three-dimensional ground penetrating radar data. Struct. Health Monit. 2020, 19, 1884–1893. [Google Scholar] [CrossRef]
- Kang, M.-S.; Kim, N.; Lee, J.J.; An, Y.-K. Deep learning-based automated underground cavity detection using three-dimensional ground penetrating radar. Struct. Health Monit. 2020, 19, 173–185. [Google Scholar] [CrossRef]
- Krizhevsky, A.; Sutskever, I.; Hinton, G.E. Imagenet classification with deep convolutional neural networks. In Proceedings of the The Twenty-sixth Annual Conference on Neural Information Processing Systems (NIPS), Stateline, NV, USA, 3–8 December 2012. [Google Scholar]
- Martino, N.; Maser, K.; Birken, R.; Wang, M. Quantifying bridge deck corrosion using ground penetrating radar. Res. Nondestruct. Eval. 2016, 27, 112–124. [Google Scholar] [CrossRef]
- Pashoutani, S.; Zhu, J. Ground Penetrating Radar Data Processing for Concrete Bridge Deck Evaluation. J. Bridge Eng. 2020, 25, 04020030. [Google Scholar] [CrossRef]
- Rhee, J.-Y.; Choi, J.-J.; Kee, S.-H. Evaluation of the depth of deteriorations in concrete bridge decks with asphalt overlays using air-coupled GPR: A case study from a pilot bridge on Korean expressway. Int. J. Concr. Struct. Mater. 2019, 13, 23. [Google Scholar] [CrossRef] [Green Version]
- Dinh, K.; Gucunski, N.; Kim, J.; Duong, T.H. Understanding depth-amplitude effects in assessment of GPR data from concrete bridge decks. NDT E Int. 2016, 83, 48–58. [Google Scholar] [CrossRef]
- Dinh, K.; Gucunski, N.; Kim, J.; Duong, T.H. Method for attenuation assessment of GPR data from concrete bridge decks. NDT E Int. 2017, 92, 50–58. [Google Scholar] [CrossRef]
- Dinh, K.; Gucunski, N.; Zayed, T. Automated visualization of concrete bridge deck condition from GPR data. NDT E Int. 2019, 102, 120–128. [Google Scholar] [CrossRef]
- Alsharqawi, M.; Zayed, T.; Dabous, S.A. Integrated condition rating and forecasting method for bridge decks using Visual Inspection and Ground Penetrating Radar. Autom. Constr. 2018, 89, 135–145. [Google Scholar] [CrossRef]
- Ghodoosi, F.; Bagchi, A.; Zayed, T.; Hosseini, M.R. Method for developing and updating deterioration models for concrete bridge decks using GPR data. Autom. Constr. 2018, 91, 133–141. [Google Scholar] [CrossRef]
- Biscarini, C.; Catapano, I.; Cavalagli, N.; Ludeno, G.; Pepe, F.A.; Ubertini, F. UAV Photogrammetry, Infrared Thermography and GPR for Enhancing Structural and Material Degradation Evaluation of the Roman Masonry Bridge of Ponte Lucano in Italy. NDT E Int. 2020, 115, 102287. [Google Scholar] [CrossRef]
- Prasanna, P.; Dana, K.J.; Gucunski, N.; Basily, B.B.; La, H.M.; Lim, R.S.; Parvardeh, H. Automated crack detection on concrete bridges. IEEE Trans. Autom. Sci. Eng. 2014, 13, 591–599. [Google Scholar] [CrossRef]
- Okazaki, Y.; Okazaki, S.; Asamoto, S.; Chun, P. Applicability of machine learning to a crack model in concrete bridges. Comput.-Aided Civ. Infrastruct. Eng. 2020, 35, 775–792. [Google Scholar] [CrossRef]
- Dabous, S.A.; Yaghi, S.; Alkass, S.; Moselhi, O. Concrete bridge deck condition assessment using IR Thermography and Ground Penetrating Radar technologies. Autom. Constr. 2017, 81, 340–354. [Google Scholar] [CrossRef]
- Dabous, S.A.; Feroz, S. Condition monitoring of bridges with non-contact testing technologies. Autom. Constr. 2020, 116, 103224. [Google Scholar] [CrossRef]
- Alani, A.M.; Tosti, F.; Bianchini Ciampoli, L.; Gagliardi, V.; Benedetto, A. An integrated investigative approach in health monitoring of masonry arch bridges using GPR and InSAR technologies. NDT E Int. 2020, 115, 102288. [Google Scholar] [CrossRef]
- D’Amico, F.; Gagliardi, V.; Bianchini Ciampoli, L.; Tosti, F. Integration of InSAR and GPR techniques for monitoring transition areas in railway bridges. NDT E Int. 2020, 115, 102291. [Google Scholar] [CrossRef]
- Imani, F.S. Comprehensive Full-Depth Condition Assessment of Reinforced Concrete Bridge Decks Using Ground Penetrating Radar. Ph.D. Thesis, Rutgers The State University of New Jersey, School of Graduate Studies, New Brunswick, NJ, USA, 2019. [Google Scholar]
- Narazaki, Y.; Hoskere, V.; Hoang, T.A.; Fujino, Y.; Sakurai, A.; Spencer, B.F., Jr. Vision-based automated bridge component recognition with high-level scene consistency. Comput.-Aided Civ. Infrastruct. Eng. 2020, 35, 465–482. [Google Scholar] [CrossRef]
- Jazayeri, S.; Kruse, S.; Hasan, I.; Yazdani, N. Reinforced concrete mapping using full-waveform inversion of GPR data. Constr. Build. Mater. 2019, 229, 117102. [Google Scholar] [CrossRef]
- Dinh, K.; Gucunski, N.; Duong, T.H. Migration-based automated rebar picking for condition assessment of concrete bridge decks with ground penetrating radar. NDT E Int. 2018, 98, 45–54. [Google Scholar] [CrossRef]
- Rasol, M.; Pérez-Gracia, V.; Solla, M.; Pais, J.C.; Fernandes, F.M.; Santos, C. An experimental and numerical approach to combine Ground Penetrating Radar and computational modelling for the identification of early cracking in cement concrete pavements. NDT E Int. 2020, 115, 102293. [Google Scholar] [CrossRef]
- Rasol, M.; Pérez-Gracia, V.; Fernandes, F.M.; Pais, J.C.; Santos-Assunçao, S.; Santos, C.R.; Sossa, V. GPR laboratory tests and numerical models to characterize cracks in cement concrete specimens, exemplifying damage in rigid pavement. Measurement 2020, 158, 107662. [Google Scholar] [CrossRef]
- Fernandes, F.M.; Pais, J.C. Laboratory observation of cracks in road pavements with GPR. Constr. Build. Mater. 2017, 154, 1130–1138. [Google Scholar] [CrossRef]
- Yi, L.; Zou, L.; Takahashi, K.; Sato, M. High-resolution velocity analysis method using the ℓ-1 norm regularized least-squares method for pavement inspection. IEEE J. Sel. Top. Appl. Earth Obs. Remote Sens. 2018, 11, 1005–1015. [Google Scholar] [CrossRef]
- Li, S.; Yuan, C.; Liu, D.; Cai, H. Integrated processing of image and GPR data for automated pothole detection. J. Comput. Civ. Eng. 2016, 30, 04016015. [Google Scholar] [CrossRef]
- Lagüela, S.; Solla, M.; Puente, I.; Prego, F.J. Joint use of GPR, IRT and TLS techniques for the integral damage detection in paving. Constr. Build. Mater. 2018, 174, 749–760. [Google Scholar] [CrossRef]
- Tong, Z.; Gao, J.; Zhang, H. Innovative method for recognizing subgrade defects based on a convolutional neural network. Constr. Build. Mater. 2018, 169, 69–82. [Google Scholar] [CrossRef]
- Tong, Z.; Yuan, D.; Gao, J.; Wei, Y.; Dou, H. Pavement-distress detection using ground-penetrating radar and network in networks. Constr. Build. Mater. 2020, 233, 117352. [Google Scholar] [CrossRef]
- Gao, J.; Yuan, D.; Tong, Z.; Yang, J.; Yu, D. Autonomous pavement distress detection using ground penetrating radar and region-based deep learning. Measurement 2020, 164, 108077. [Google Scholar] [CrossRef]
- Sato, M. Array GPR “Yakumo” and its application to archaeological survey and environmental studies. In Proceedings of the XXXIth URSI General Assembly and Scientific Symposium (URSI GASS), Beijing, China, 16–23 August 2014. [Google Scholar]
- Rodés, J.P.; Pérez-Gracia, V.; Martínez-Reguero, A. Evaluation of the GPR frequency spectra in asphalt pavement assessment. Constr. Build. Mater. 2015, 96, 181–188. [Google Scholar] [CrossRef] [Green Version]
- Pedret Rodes, J.; Reguero, A.M.; Perez-Gracia, V. GPR Spectra for Monitoring Asphalt Pavements. Remote Sens. 2020, 12, 1749. [Google Scholar] [CrossRef]
- Guo, C.; Zhao, L.; Chen, Y.; Li, W.; Liu, R.C. Extraction of the pavement permittivity and thickness from measured ground-coupled GPR data using a ground-wave technique. IEEE Geosci. Remote Sens. Lett. 2017, 14, 399–403. [Google Scholar] [CrossRef]
- De Coster, A.; Van der Wielen, A.; Grégoire, C.; Lambot, S. Evaluation of pavement layer thicknesses using GPR: A comparison between full-wave inversion and the straight-ray method. Constr. Build. Mater. 2018, 168, 91–104. [Google Scholar] [CrossRef]
- Marecos, V.; Fontul, S.; Solla, M.; de Lurdes Antunes, M. Evaluation of the feasibility of Common Mid-Point approach for air-coupled GPR applied to road pavement assessment. Measurement 2018, 128, 295–305. [Google Scholar] [CrossRef]
- Khamzin, A.K.; Varnavina, A.V.; Torgashov, E.V.; Anderson, N.L.; Sneed, L.H. Utilization of air-launched ground penetrating radar (GPR) for pavement condition assessment. Constr. Build. Mater. 2017, 141, 130–139. [Google Scholar] [CrossRef]
- Zhao, S.; Al-Qadi, I.L. Super-resolution of 3-D GPR signals to estimate thin asphalt overlay thickness using the XCMP method. IEEE Trans. Geosci. Remote Sens. 2018, 57, 893–901. [Google Scholar] [CrossRef]
- Plati, C.; Loizos, A.; Gkyrtis, K. Integration of non-destructive testing methods to assess asphalt pavement thickness. NDT E Int. 2020, 115, 102292. [Google Scholar] [CrossRef]
- Eskelinen, P.; Pellinen, T. Comparison of different radar technologies and frequencies for road pavement evaluation. Constr. Build. Mater. 2018, 164, 888–898. [Google Scholar] [CrossRef]
- Plati, C.; Georgouli, K.; Cliatt, B.; Loizos, A. Incorporation of GPR data into genetic algorithms for assessing recycled pavements. Constr. Build. Mater. 2017, 154, 1263–1271. [Google Scholar] [CrossRef]
- Sun, M.; Le Bastard, C.; Pinel, N.; Wang, Y.; Li, J.; Pan, J.; Yu, Z. Estimation of time delay and interface roughness by GPR using modified MUSIC. Signal Process. 2017, 132, 272–283. [Google Scholar] [CrossRef]
- Tosti, F.; Ciampoli, L.B.; D’Amico, F.; Alani, A.M.; Benedetto, A. An experimental-based model for the assessment of the mechanical properties of road pavements using ground-penetrating radar. Constr. Build. Mater. 2018, 165, 966–974. [Google Scholar] [CrossRef]
- Wang, S.; Al-Qadi, I.L.; Cao, Q. Factors Impacting Monitoring Asphalt Pavement Density by Ground Penetrating Radar. NDT E Int. 2020, 115, 102296. [Google Scholar] [CrossRef]
- Shangguan, P.; Al-Qadi, I.; Coenen, A.; Zhao, S. Algorithm development for the application of ground-penetrating radar on asphalt pavement compaction monitoring. Int. J. Pavement Eng. 2016, 17, 189–200. [Google Scholar] [CrossRef]
- Fernandes, F.M.; Fernandes, A.; Pais, J. Assessment of the density and moisture content of asphalt mixtures of road pavements. Constr. Build. Mater. 2017, 154, 1216–1225. [Google Scholar] [CrossRef]
- Atef, A.; Harbi, H.; Rashed, M. Adaptive boxcar background filtering for real-time GPR utility detection. Arab. J. Geosci. 2018, 11, 10. [Google Scholar] [CrossRef]
- Prego, F.; Solla, M.; Puente, I.; Arias, P. Efficient GPR data acquisition to detect underground pipes. NDT E Int. 2017, 91, 22–31. [Google Scholar] [CrossRef]
- Metwaly, M. Application of GPR technique for subsurface utility mapping: A case study from urban area of Holy Mecca, Saudi Arabia. Measurement 2015, 60, 139–145. [Google Scholar] [CrossRef]
- Sagnard, F.; Norgeot, C.; Derobert, X.; Baltazart, V.; Merliot, E.; Derkx, F.; Lebental, B. Utility detection and positioning on the urban site Sense-City using Ground-Penetrating Radar systems. Measurement 2016, 88, 318–330. [Google Scholar] [CrossRef] [Green Version]
- Hoarau, Q.; Ginolhac, G.; Atto, A.; Nicolas, J. Robust adaptive detection of buried pipes using GPR. Signal Process. 2017, 132, 293–305. [Google Scholar] [CrossRef] [Green Version]
- Šarlah, N.; Podobnikar, T.; Ambrožič, T.; Mušič, B. Application of Kinematic GPR-TPS Model with High 3D Georeference Accuracy for Underground Utility Infrastructure Mapping: A Case Study from Urban Sites in Celje, Slovenia. Remote Sens. 2020, 12, 1228. [Google Scholar] [CrossRef] [Green Version]
- Jiang, G.; Zhou, X.; Li, J.; Chen, H. A Cable-Mapping Algorithm Based on Ground-Penetrating Radar. IEEE Geosci. Remote Sens. Lett. 2019, 16, 1630–1634. [Google Scholar] [CrossRef]
- Zhang, P.; Guo, X.; Muhammat, N.; Wang, X. Research on probing and predicting the diameter of an underground pipeline by GPR during an operation period. Tunn. Undergr. Space Technol. 2016, 58, 99–108. [Google Scholar] [CrossRef]
- Zhou, X.; Chen, H.; Hao, T. Efficient detection of buried plastic pipes by combining GPR and electric field methods. IEEE Trans. Geosci. Remote Sens. 2019, 57, 3967–3979. [Google Scholar] [CrossRef]
- Zhao, S.; Al-Qadi, I. Pavement drainage pipe condition assessment by GPR image reconstruction using FDTD modeling. Constr. Build. Mater. 2017, 154, 1283–1293. [Google Scholar] [CrossRef]
- Li, S.; Cai, H.; Kamat, V.R. Uncertainty-aware geospatial system for mapping and visualizing underground utilities. Autom. Constr. 2015, 53, 105–119. [Google Scholar] [CrossRef]
- Li, S.; Cai, H.; Abraham, D.M.; Mao, P. Estimating features of underground utilities: Hybrid GPR/GPS approach. J. Comput. Civ. Eng. 2016, 30, 04014108. [Google Scholar] [CrossRef]
- Cai, J.; Jeon, J.; Cai, H.; Li, S. Fusing Heterogeneous Information for Underground Utility Map Generation Based on Dempster-Shafer Theory. J. Comput. Civ. Eng. 2020, 34, 04020013. [Google Scholar] [CrossRef]
- Atef, A.; Zayed, T.; Hawari, A.; Khader, M.; Moselhi, O. Multi-tier method using infrared photography and GPR to detect and locate water leaks. Autom. Constr. 2016, 61, 162–170. [Google Scholar] [CrossRef]
- Awwad, A.; Yahyia, M.; Albasha, L.; Mortula, M.; Ali, T. Communication Network for Ultrasonic Acoustic Water Leakage Detectors. IEEE Access 2020, 8, 29954–29964. [Google Scholar] [CrossRef]
- Lai, W.W.; Chang, R.K.; Sham, J.F.; Pang, K. Perturbation mapping of water leak in buried water pipes via laboratory validation experiments with high-frequency ground penetrating radar (GPR). Tunn. Undergr. Space Technol. 2016, 52, 157–167. [Google Scholar] [CrossRef]
- Cheung, B.W.Y.; Lai, W.W.L. Field validation of water-pipe leakage detection through spatial and time-lapse analysis of GPR wave velocity. Near Surf. Geophys. 2019, 17, 231–246. [Google Scholar] [CrossRef]
- Yang, Y.; Zhao, W. Curvelet transform-based identification of void diseases in ballastless track by ground-penetrating radar. Struct. Control. Health Monit. 2019, 26, e2322. [Google Scholar] [CrossRef]
- Qin, Y.; Huang, C. Identifying underground voids using a GPR circular-end bow-tie antenna system based on a support vector machine. Int. J. Remote Sens. 2016, 37, 876–888. [Google Scholar] [CrossRef]
- Luo, T.X.; Lai, W.W. GPR pattern recognition of shallow subsurface air voids. Tunn. Undergr. Space Technol. 2020, 99, 103355. [Google Scholar] [CrossRef]
- Chen, J.; Li, S.; Liu, D.; Li, X. AiRobSim: Simulating a Multisensor Aerial Robot for Urban Search and Rescue Operation and Training. Sensors 2020, 20, 5223. [Google Scholar] [CrossRef] [PubMed]
- Hu, D.; Li, S.; Chen, J.; Kamat, V.R. Detecting, locating, and characterizing voids in disaster rubble for search and rescue. Adv. Eng. Inform. 2019, 42, 100974. [Google Scholar] [CrossRef]
- Sevil, J.; Gutiérrez, F.; Zarroca, M.; Desir, G.; Carbonel, D.; Guerrero, J.; Linares, R.; Roqué, C.; Fabregat, I. Sinkhole investigation in an urban area by trenching in combination with GPR, ERT and high-precision leveling. Mantled evaporite karst of Zaragoza city, NE Spain. Eng. Geol. 2017, 231, 9–20. [Google Scholar] [CrossRef]
- Garcia-Garcia, F.; Valls-Ayuso, A.; Benlloch-Marco, J.; Valcuende-Paya, M. An optimization of the work disruption by 3D cavity mapping using GPR: A new sewerage project in Torrente (Valencia, Spain). Constr. Build. Mater. 2017, 154, 1226–1233. [Google Scholar] [CrossRef] [Green Version]
- Kang, M.-S.; Kim, N.; Im, S.B.; Lee, J.-J.; An, Y.-K. 3D GPR Image-based UcNet for Enhancing Underground Cavity Detectability. Remote Sens. 2019, 11, 2545. [Google Scholar] [CrossRef] [Green Version]
- Park, B.; Kim, J.; Lee, J.; Kang, M.-S.; An, Y.-K. Underground object classification for urban roads using instantaneous phase analysis of Ground-Penetrating Radar (GPR) Data. Remote Sens. 2018, 10, 1417. [Google Scholar] [CrossRef] [Green Version]
- Hong, W.-T.; Lee, J.-S. Estimation of ground cavity configurations using ground penetrating radar and time domain reflectometry. Nat. Hazards 2018, 92, 1789–1807. [Google Scholar] [CrossRef]
- Xiang, Z.; Rashidi, A.; Ou, G.G. States of practice and research on applying GPR technology for labeling and scanning constructed facilities. J. Perform. Constr. Facil. 2019, 33, 03119001. [Google Scholar] [CrossRef]
- Benedetto, A.; Tosti, F.; Ciampoli, L.B.; D’Amico, F. GPR applications across engineering and geosciences disciplines in Italy: A review. IEEE J. Sel. Top. Appl. Earth Obs. Remote Sens. 2016, 9, 2952–2965. [Google Scholar] [CrossRef]
Figure 1.
The evolution of GPR data analysis methods over the past decades [5,6,7,8,9,10,11,12,13,14,15,16,17,18,19,20,21,22].

Figure 2.
GPR data display. (a) A-scan; (b) B-scan; (c) C-scan.

Figure 3.
The diagram of target interpretation from GPR B-scans.


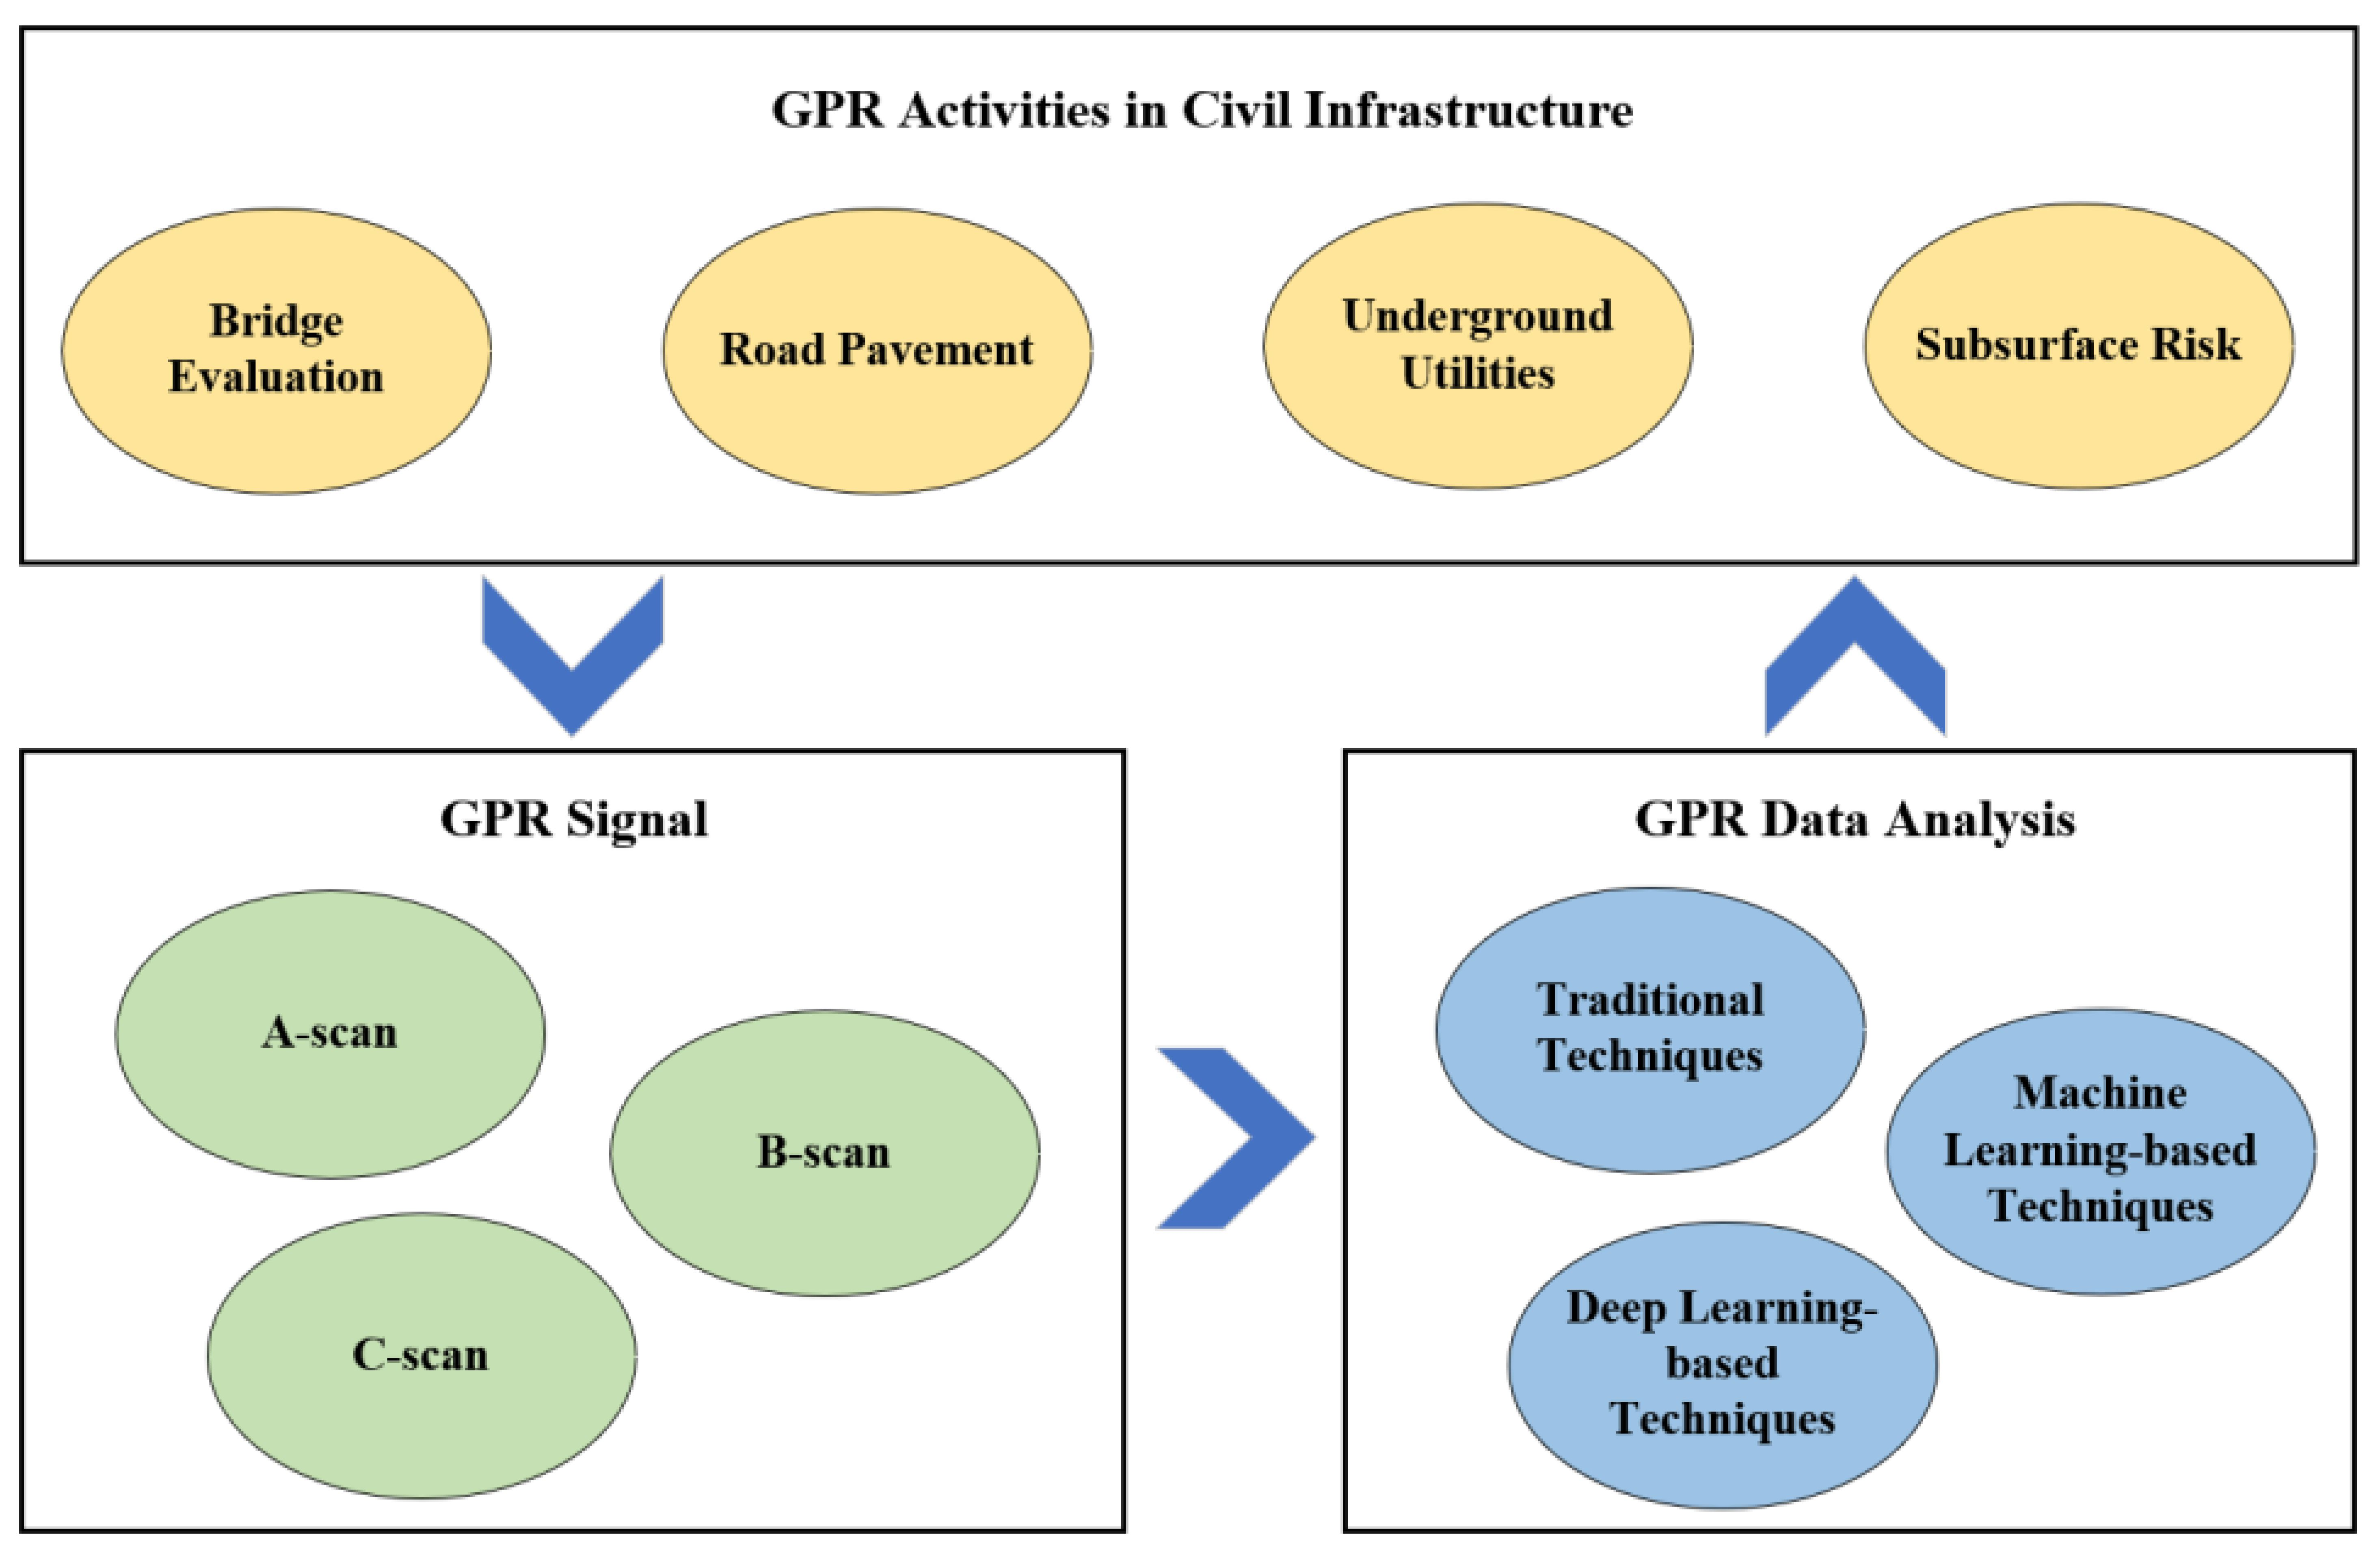
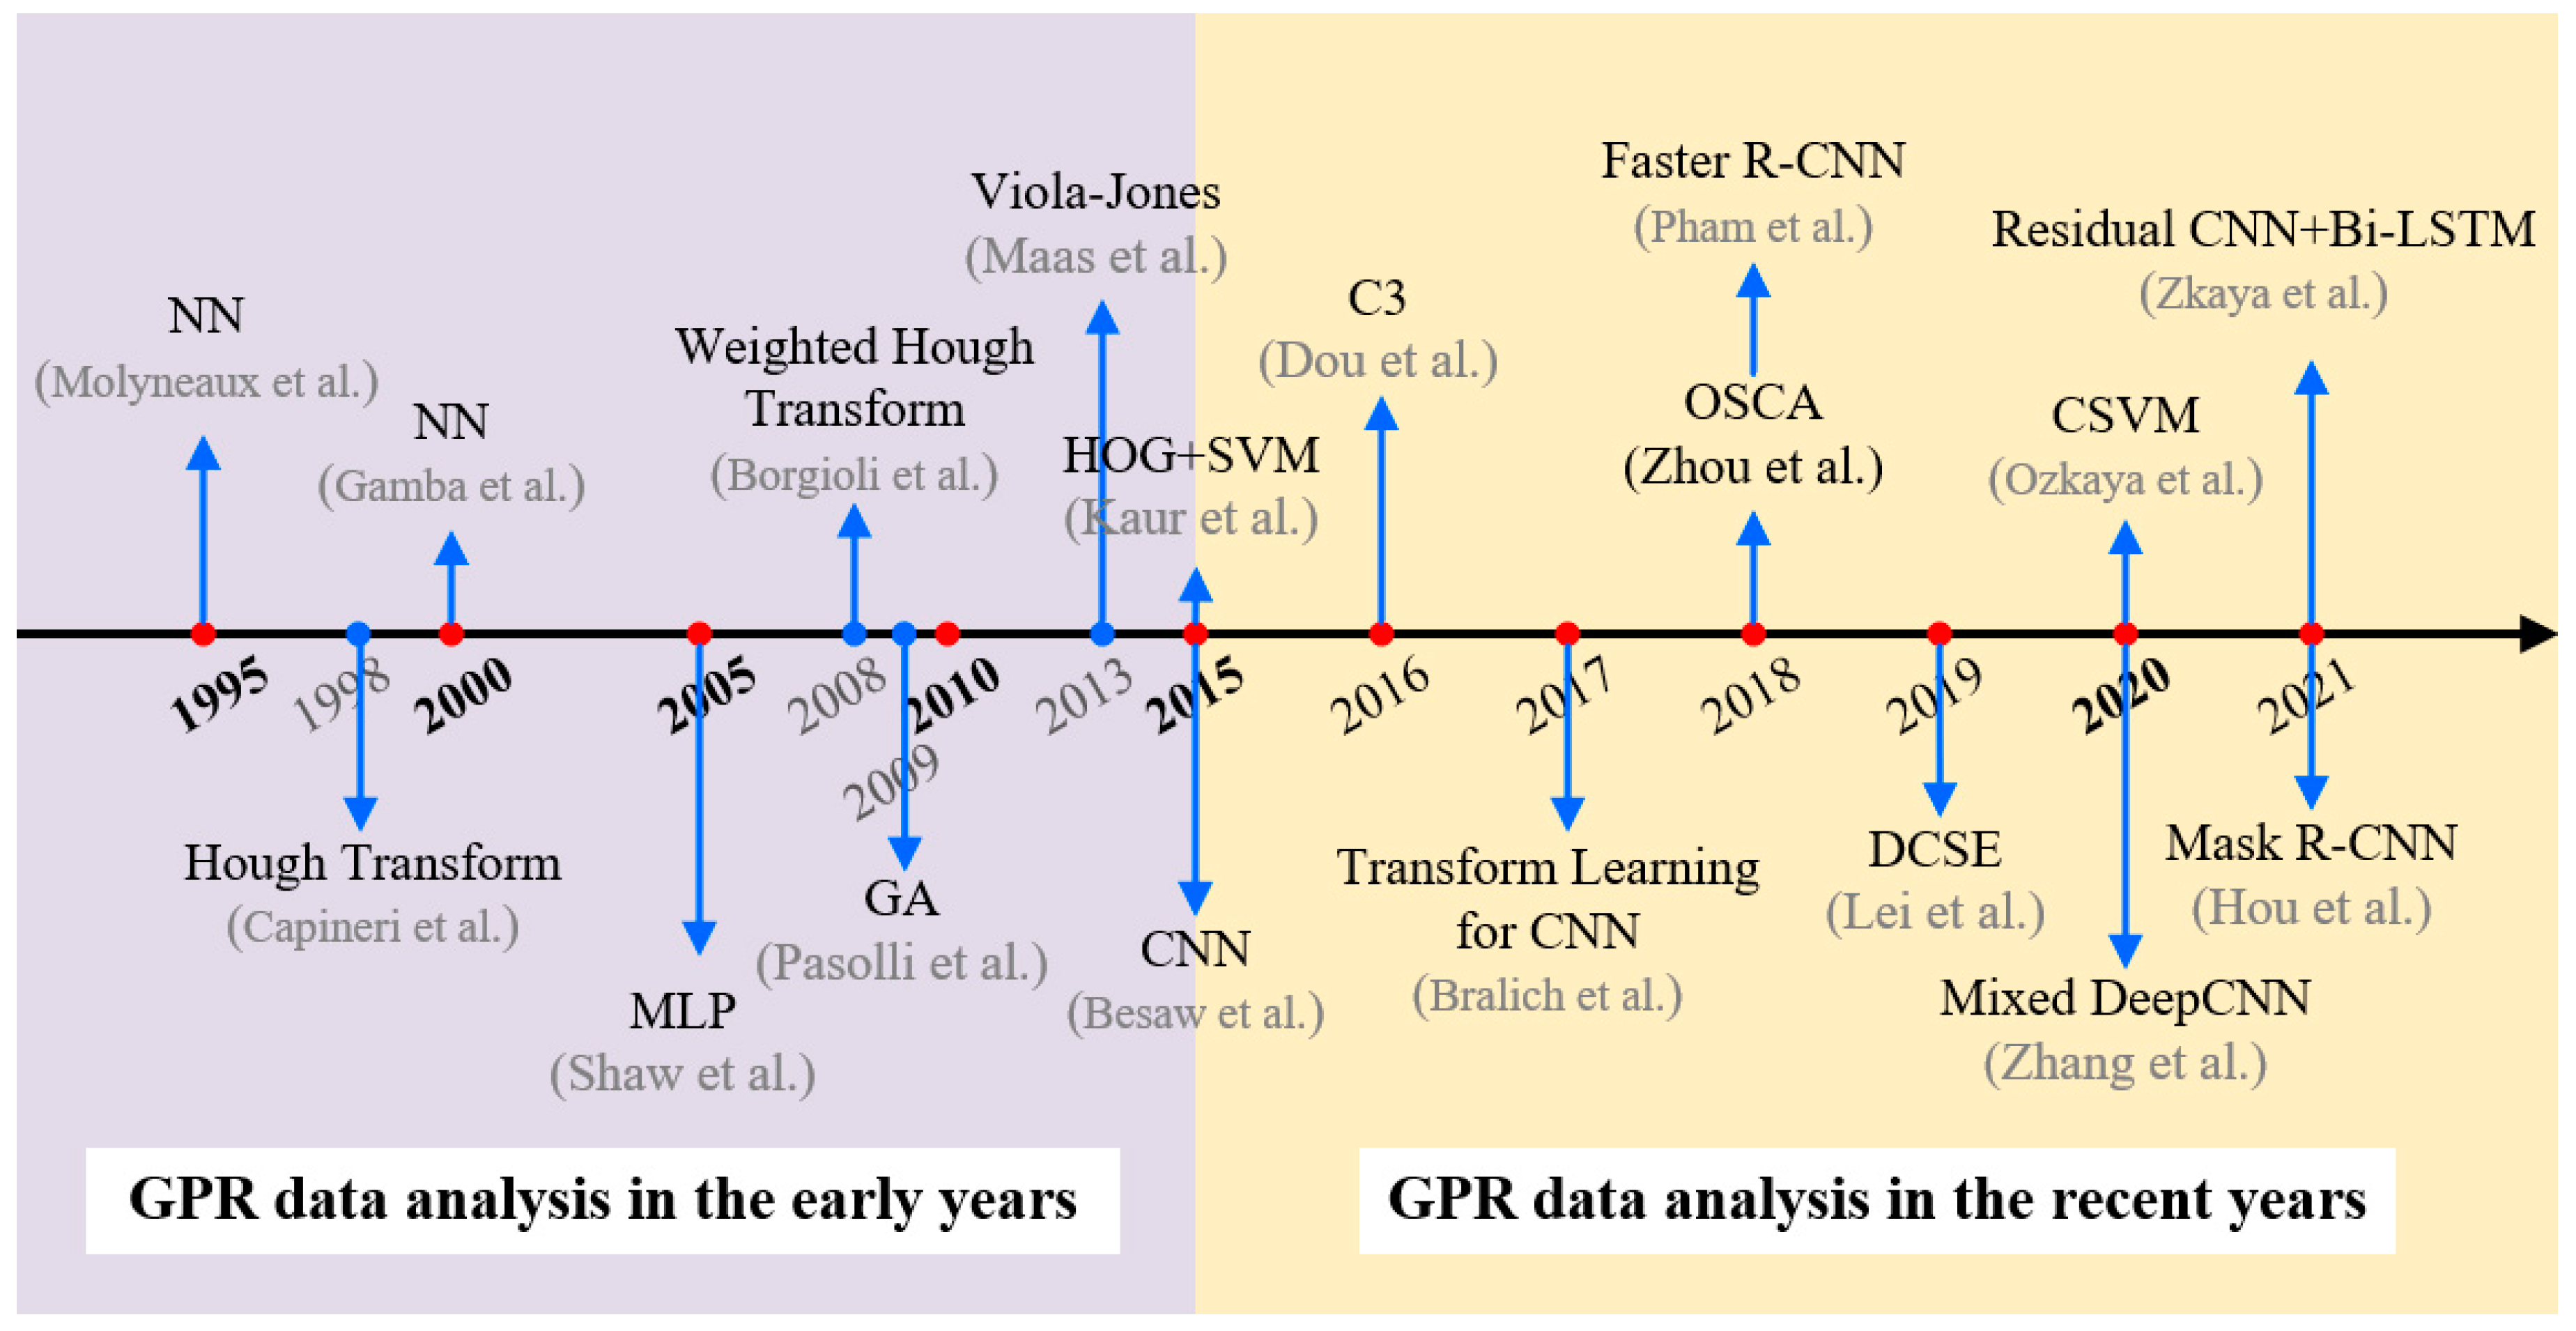
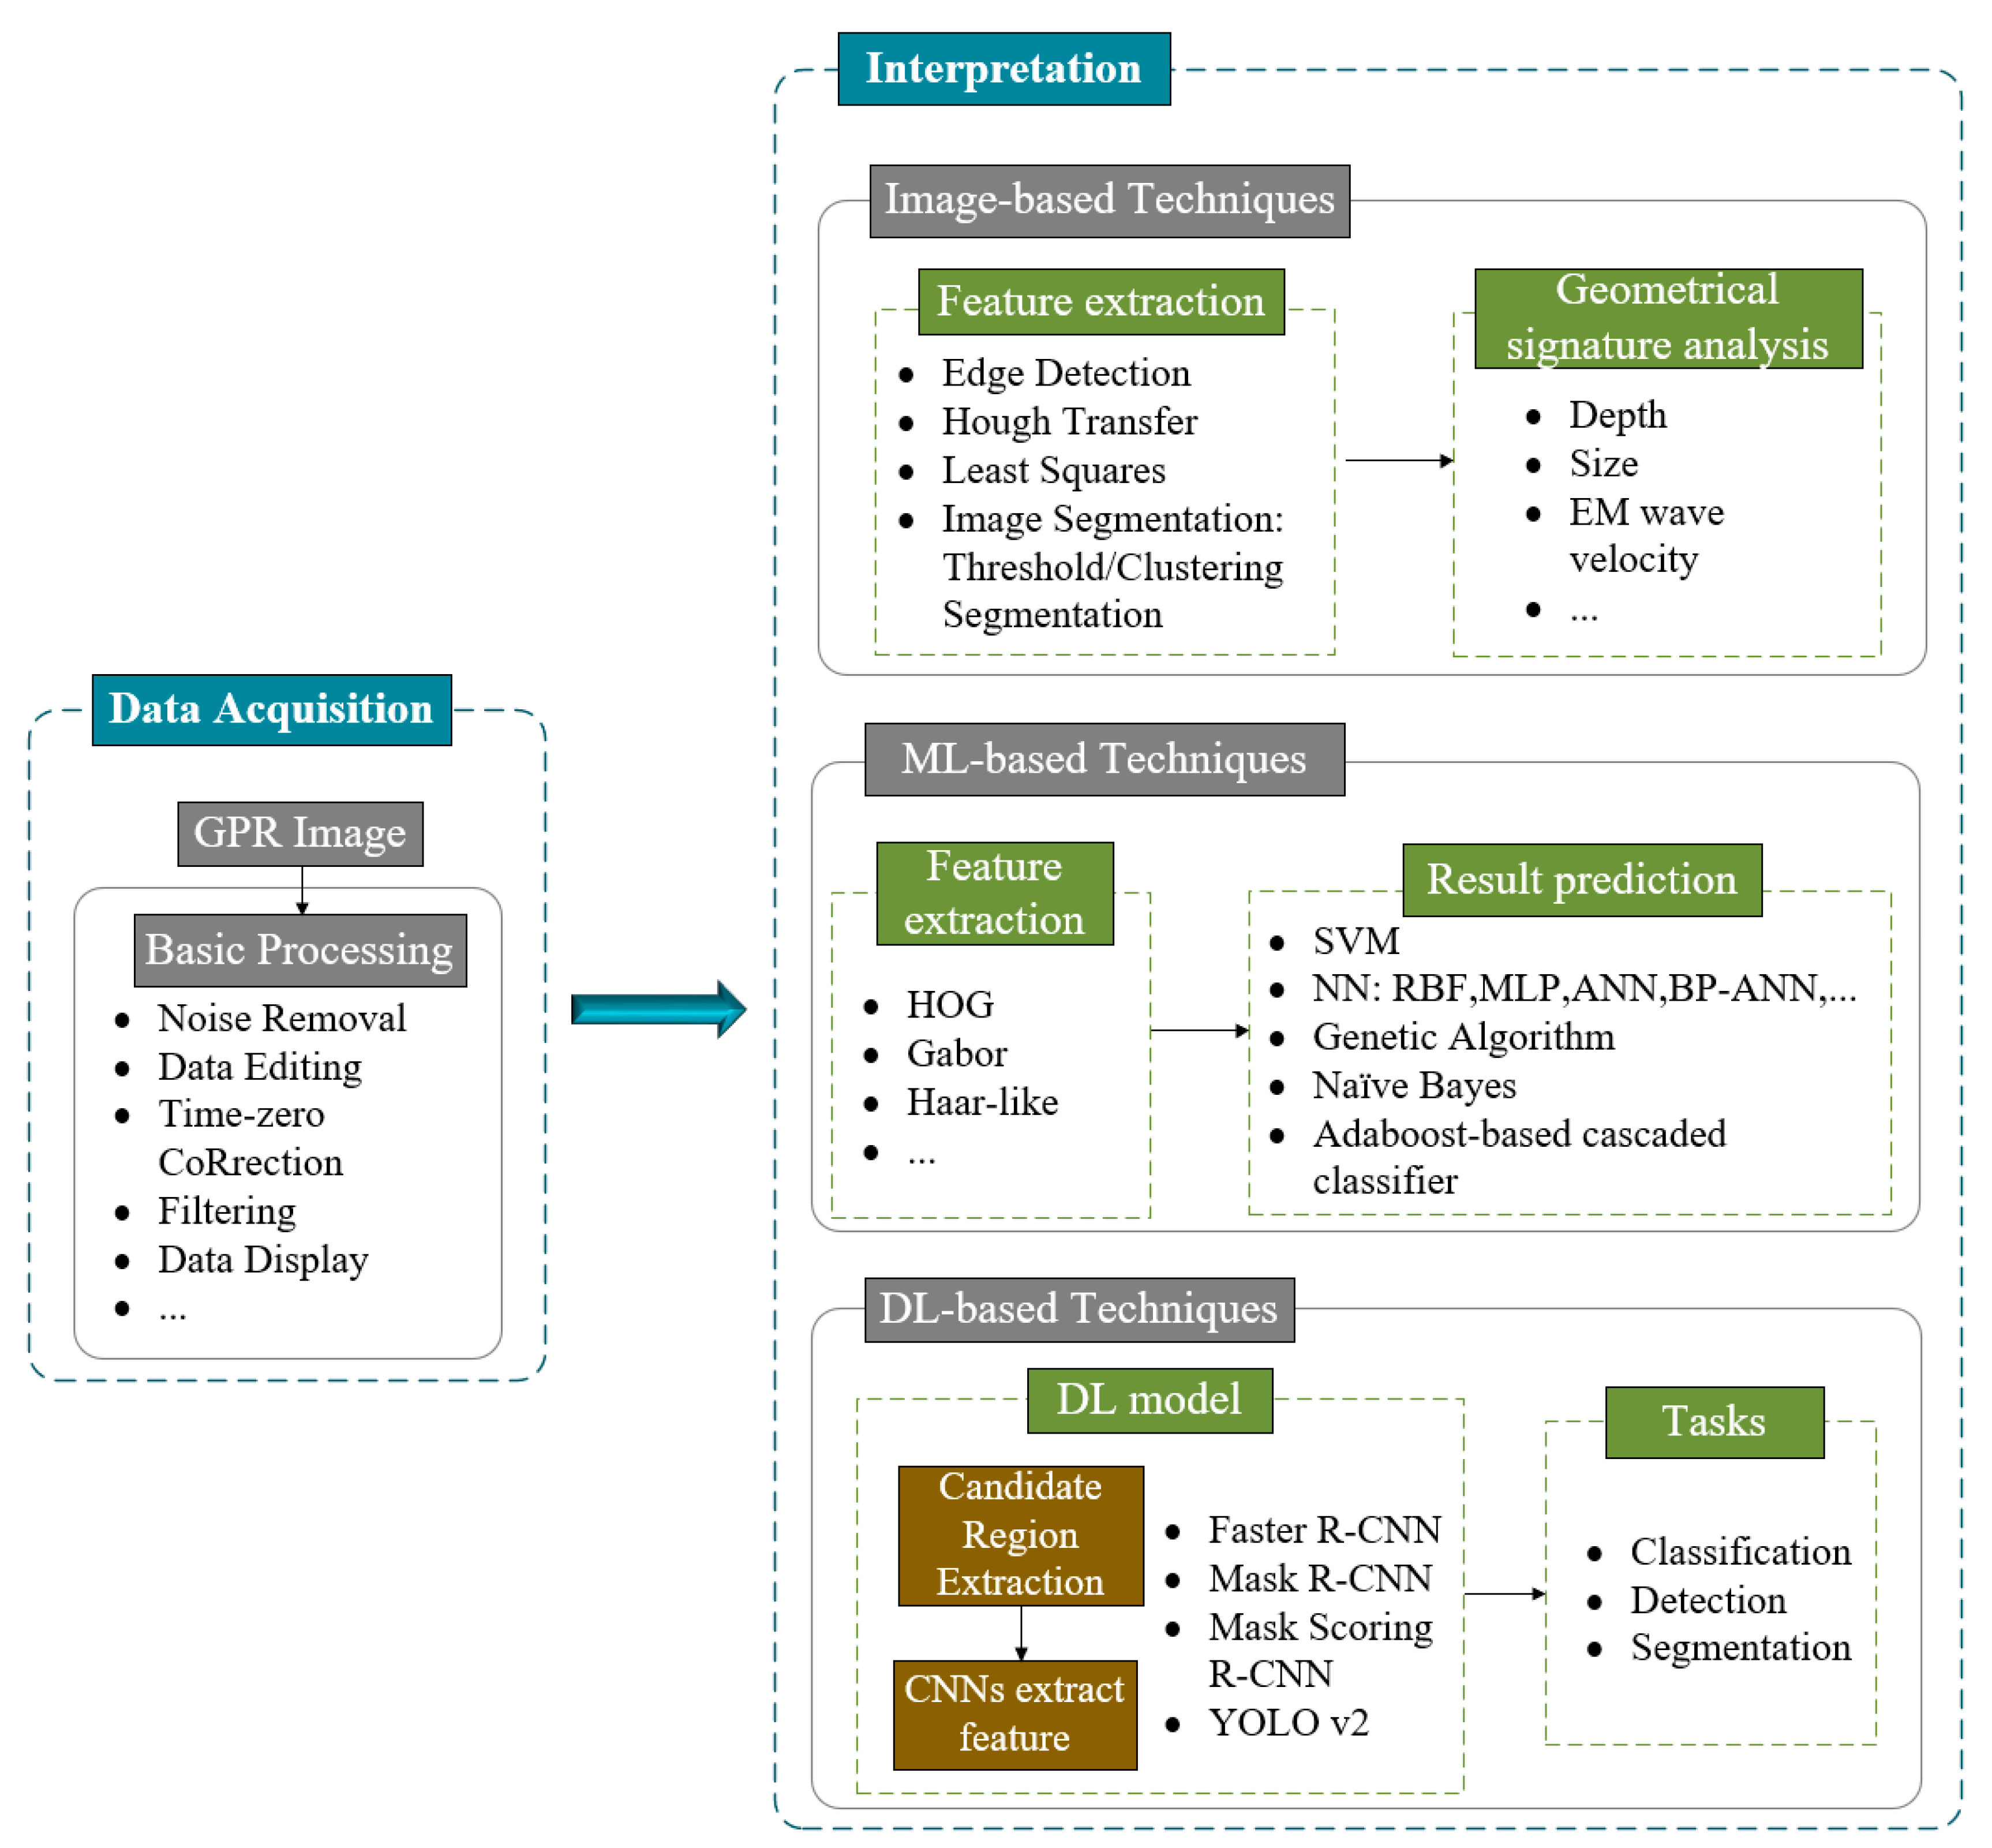
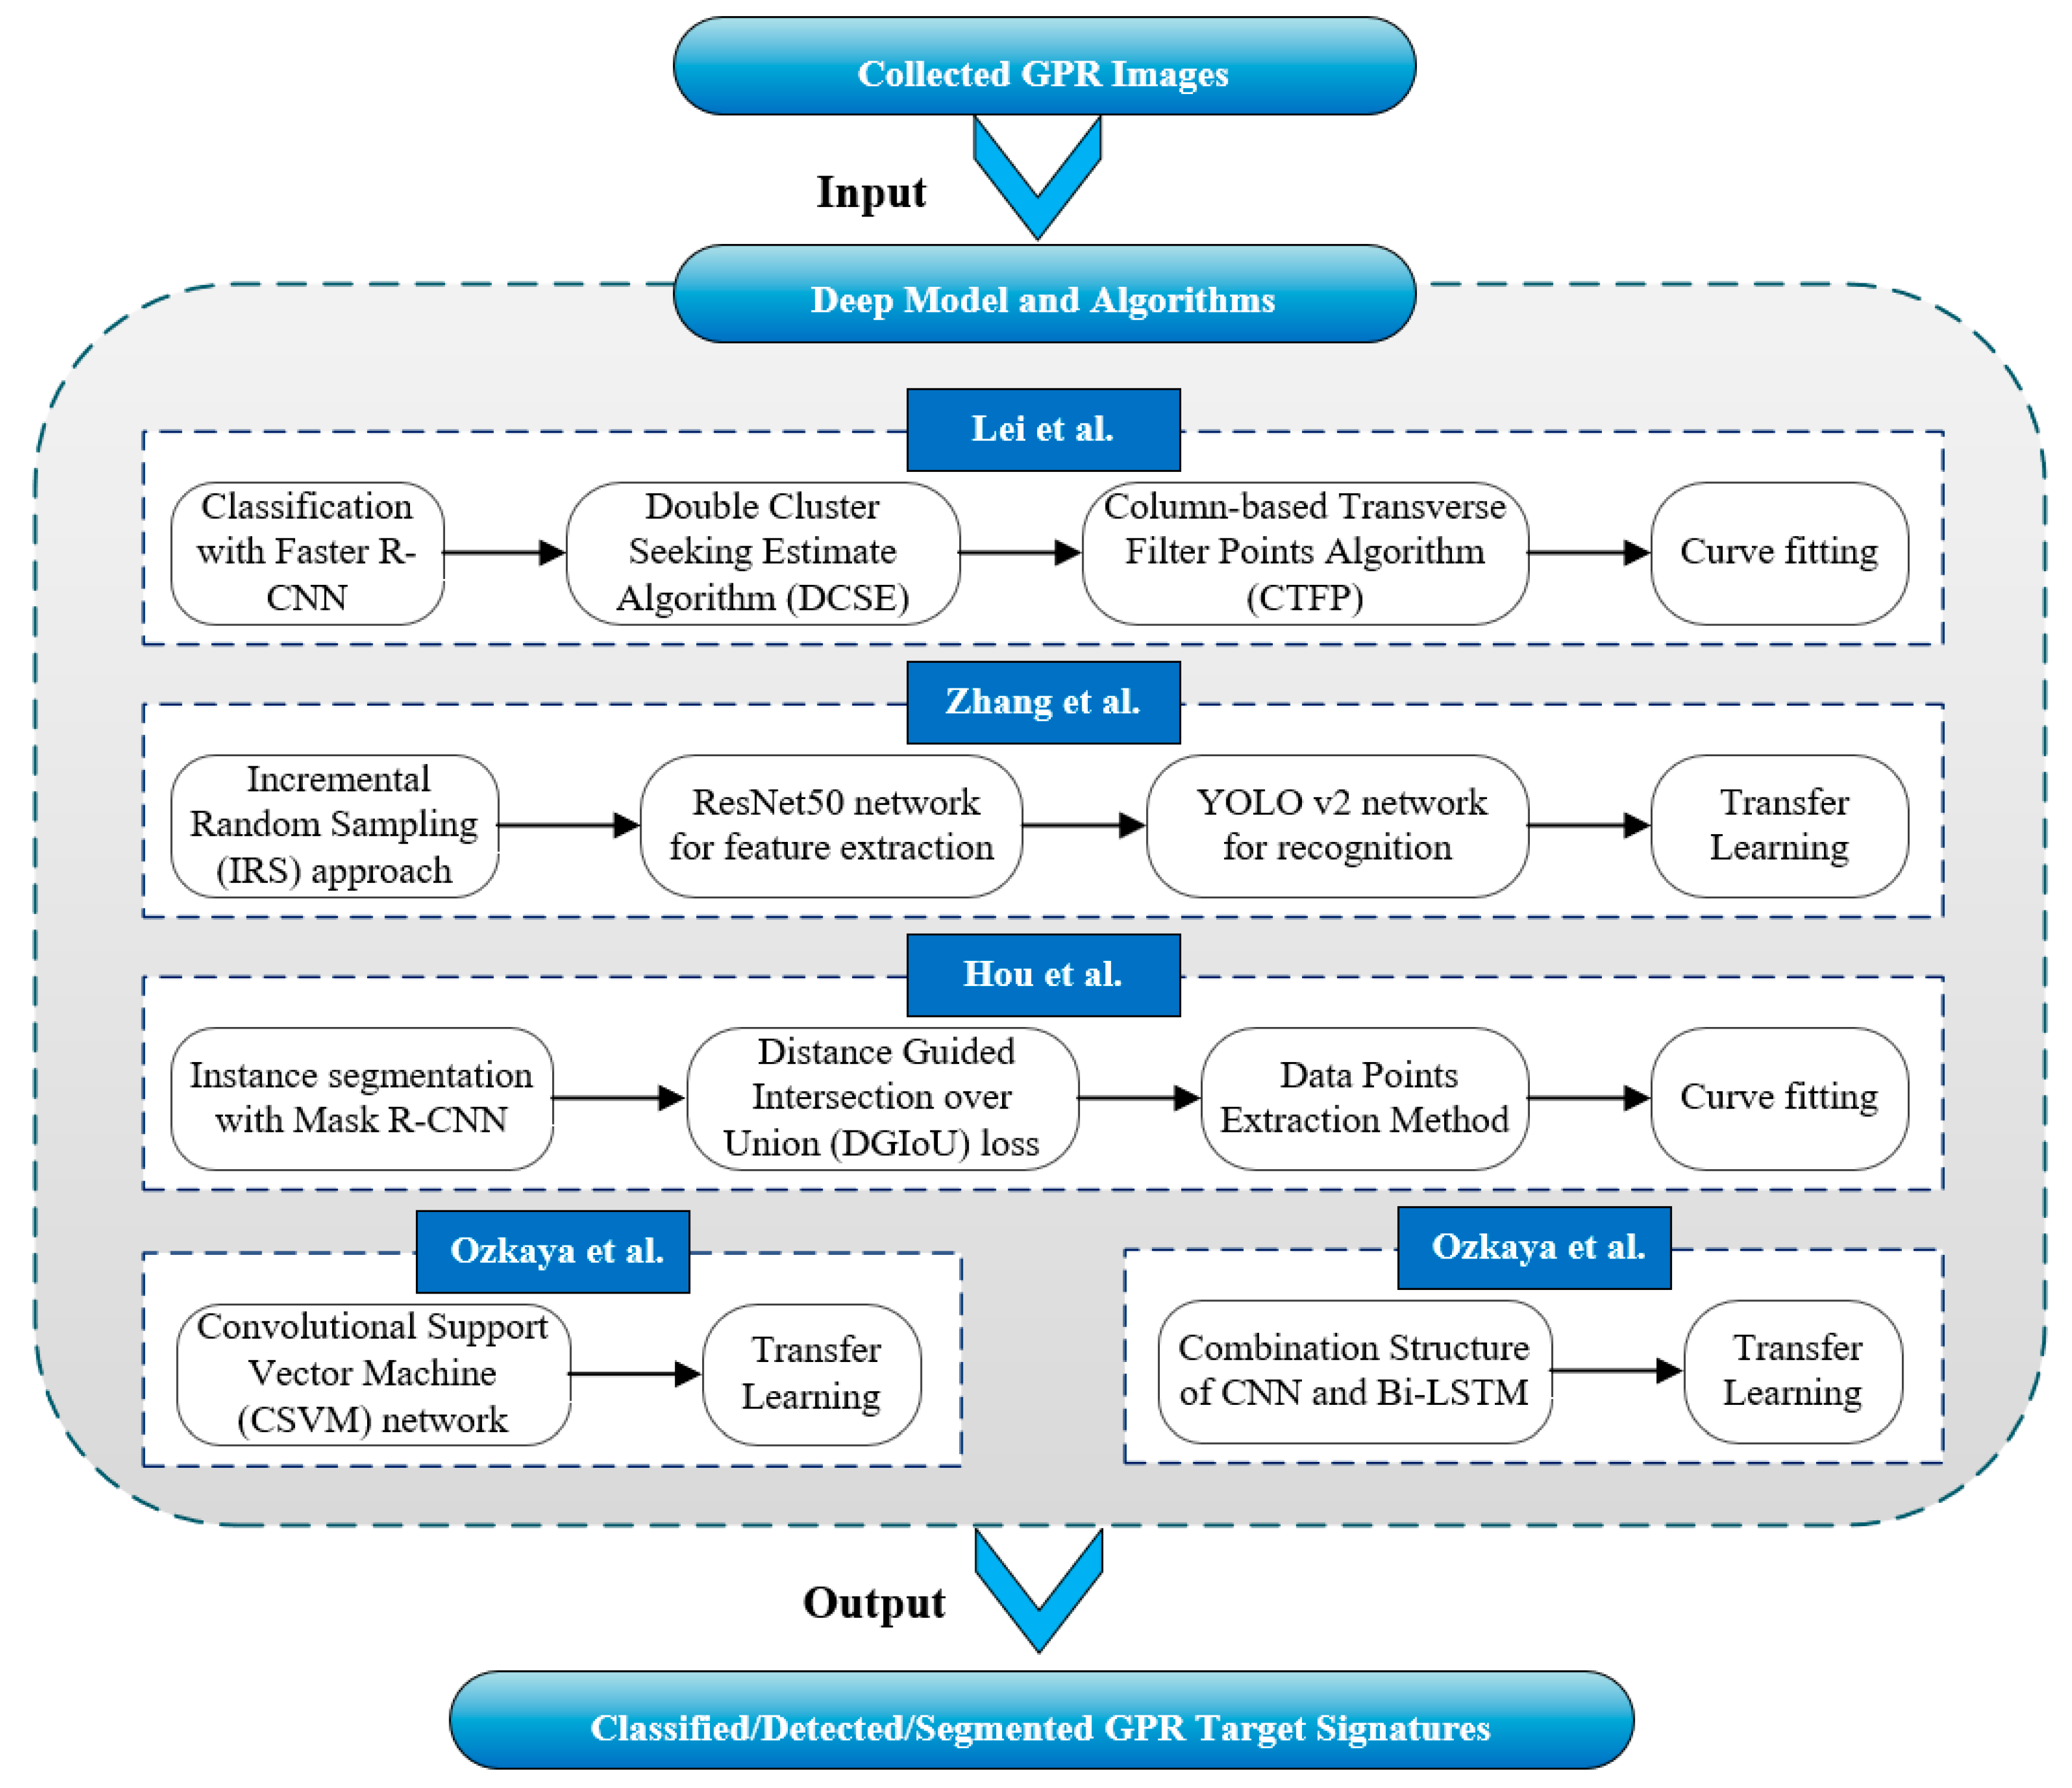
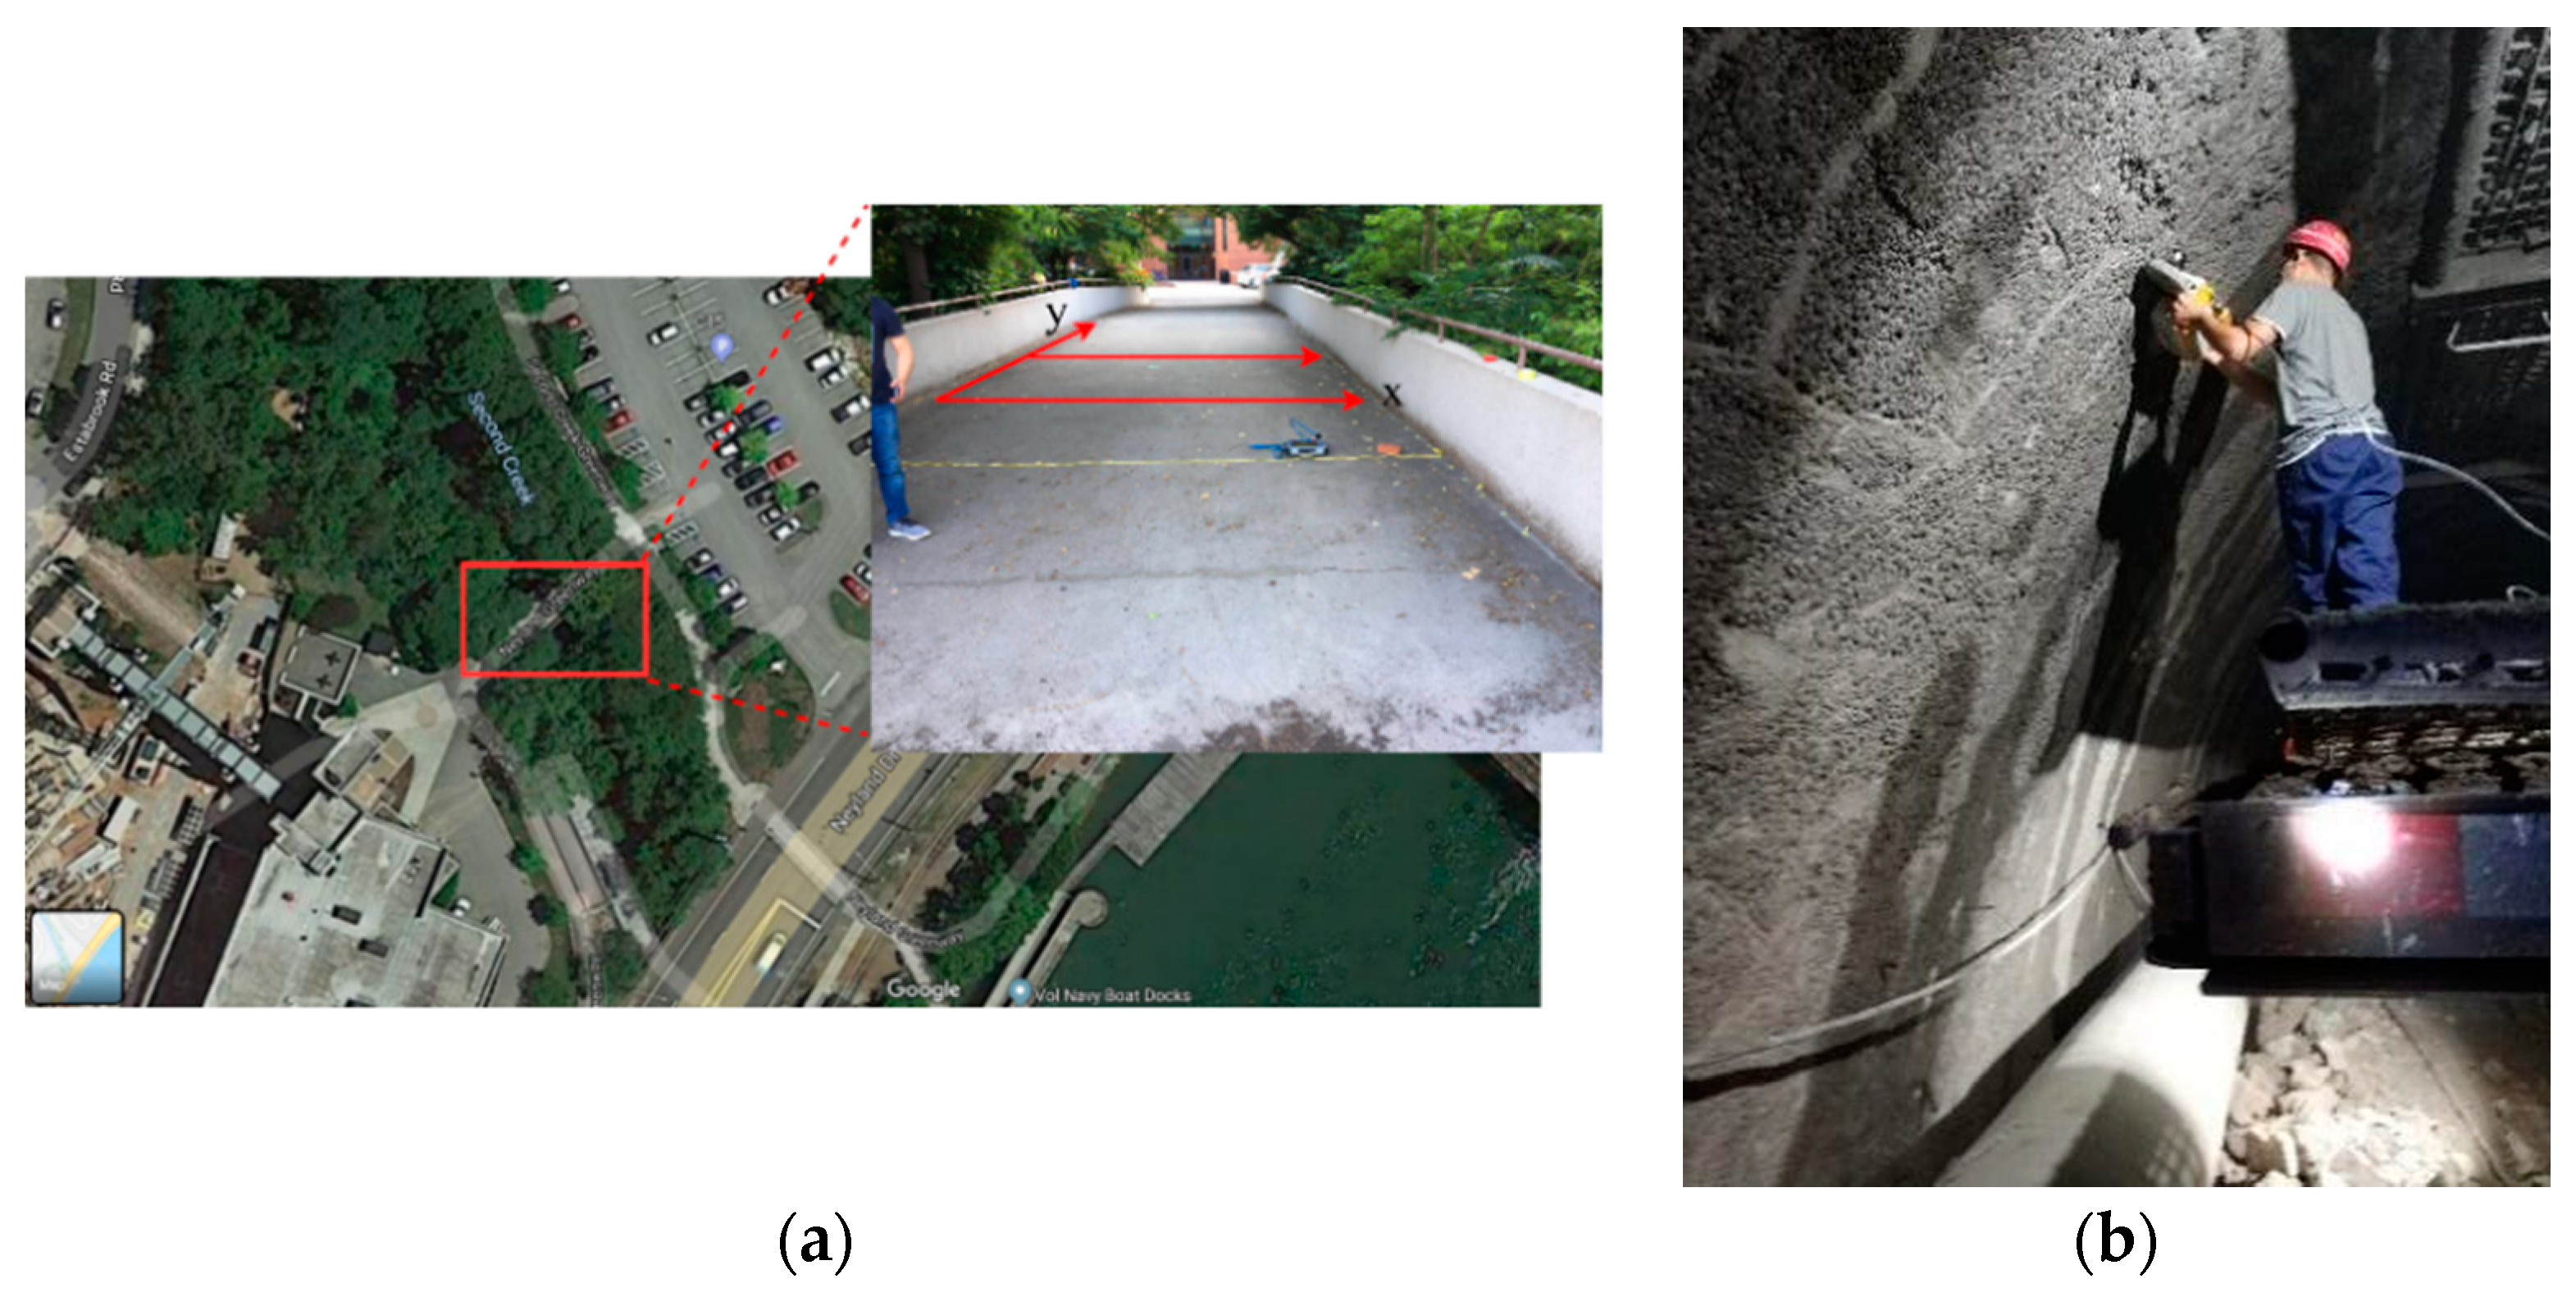
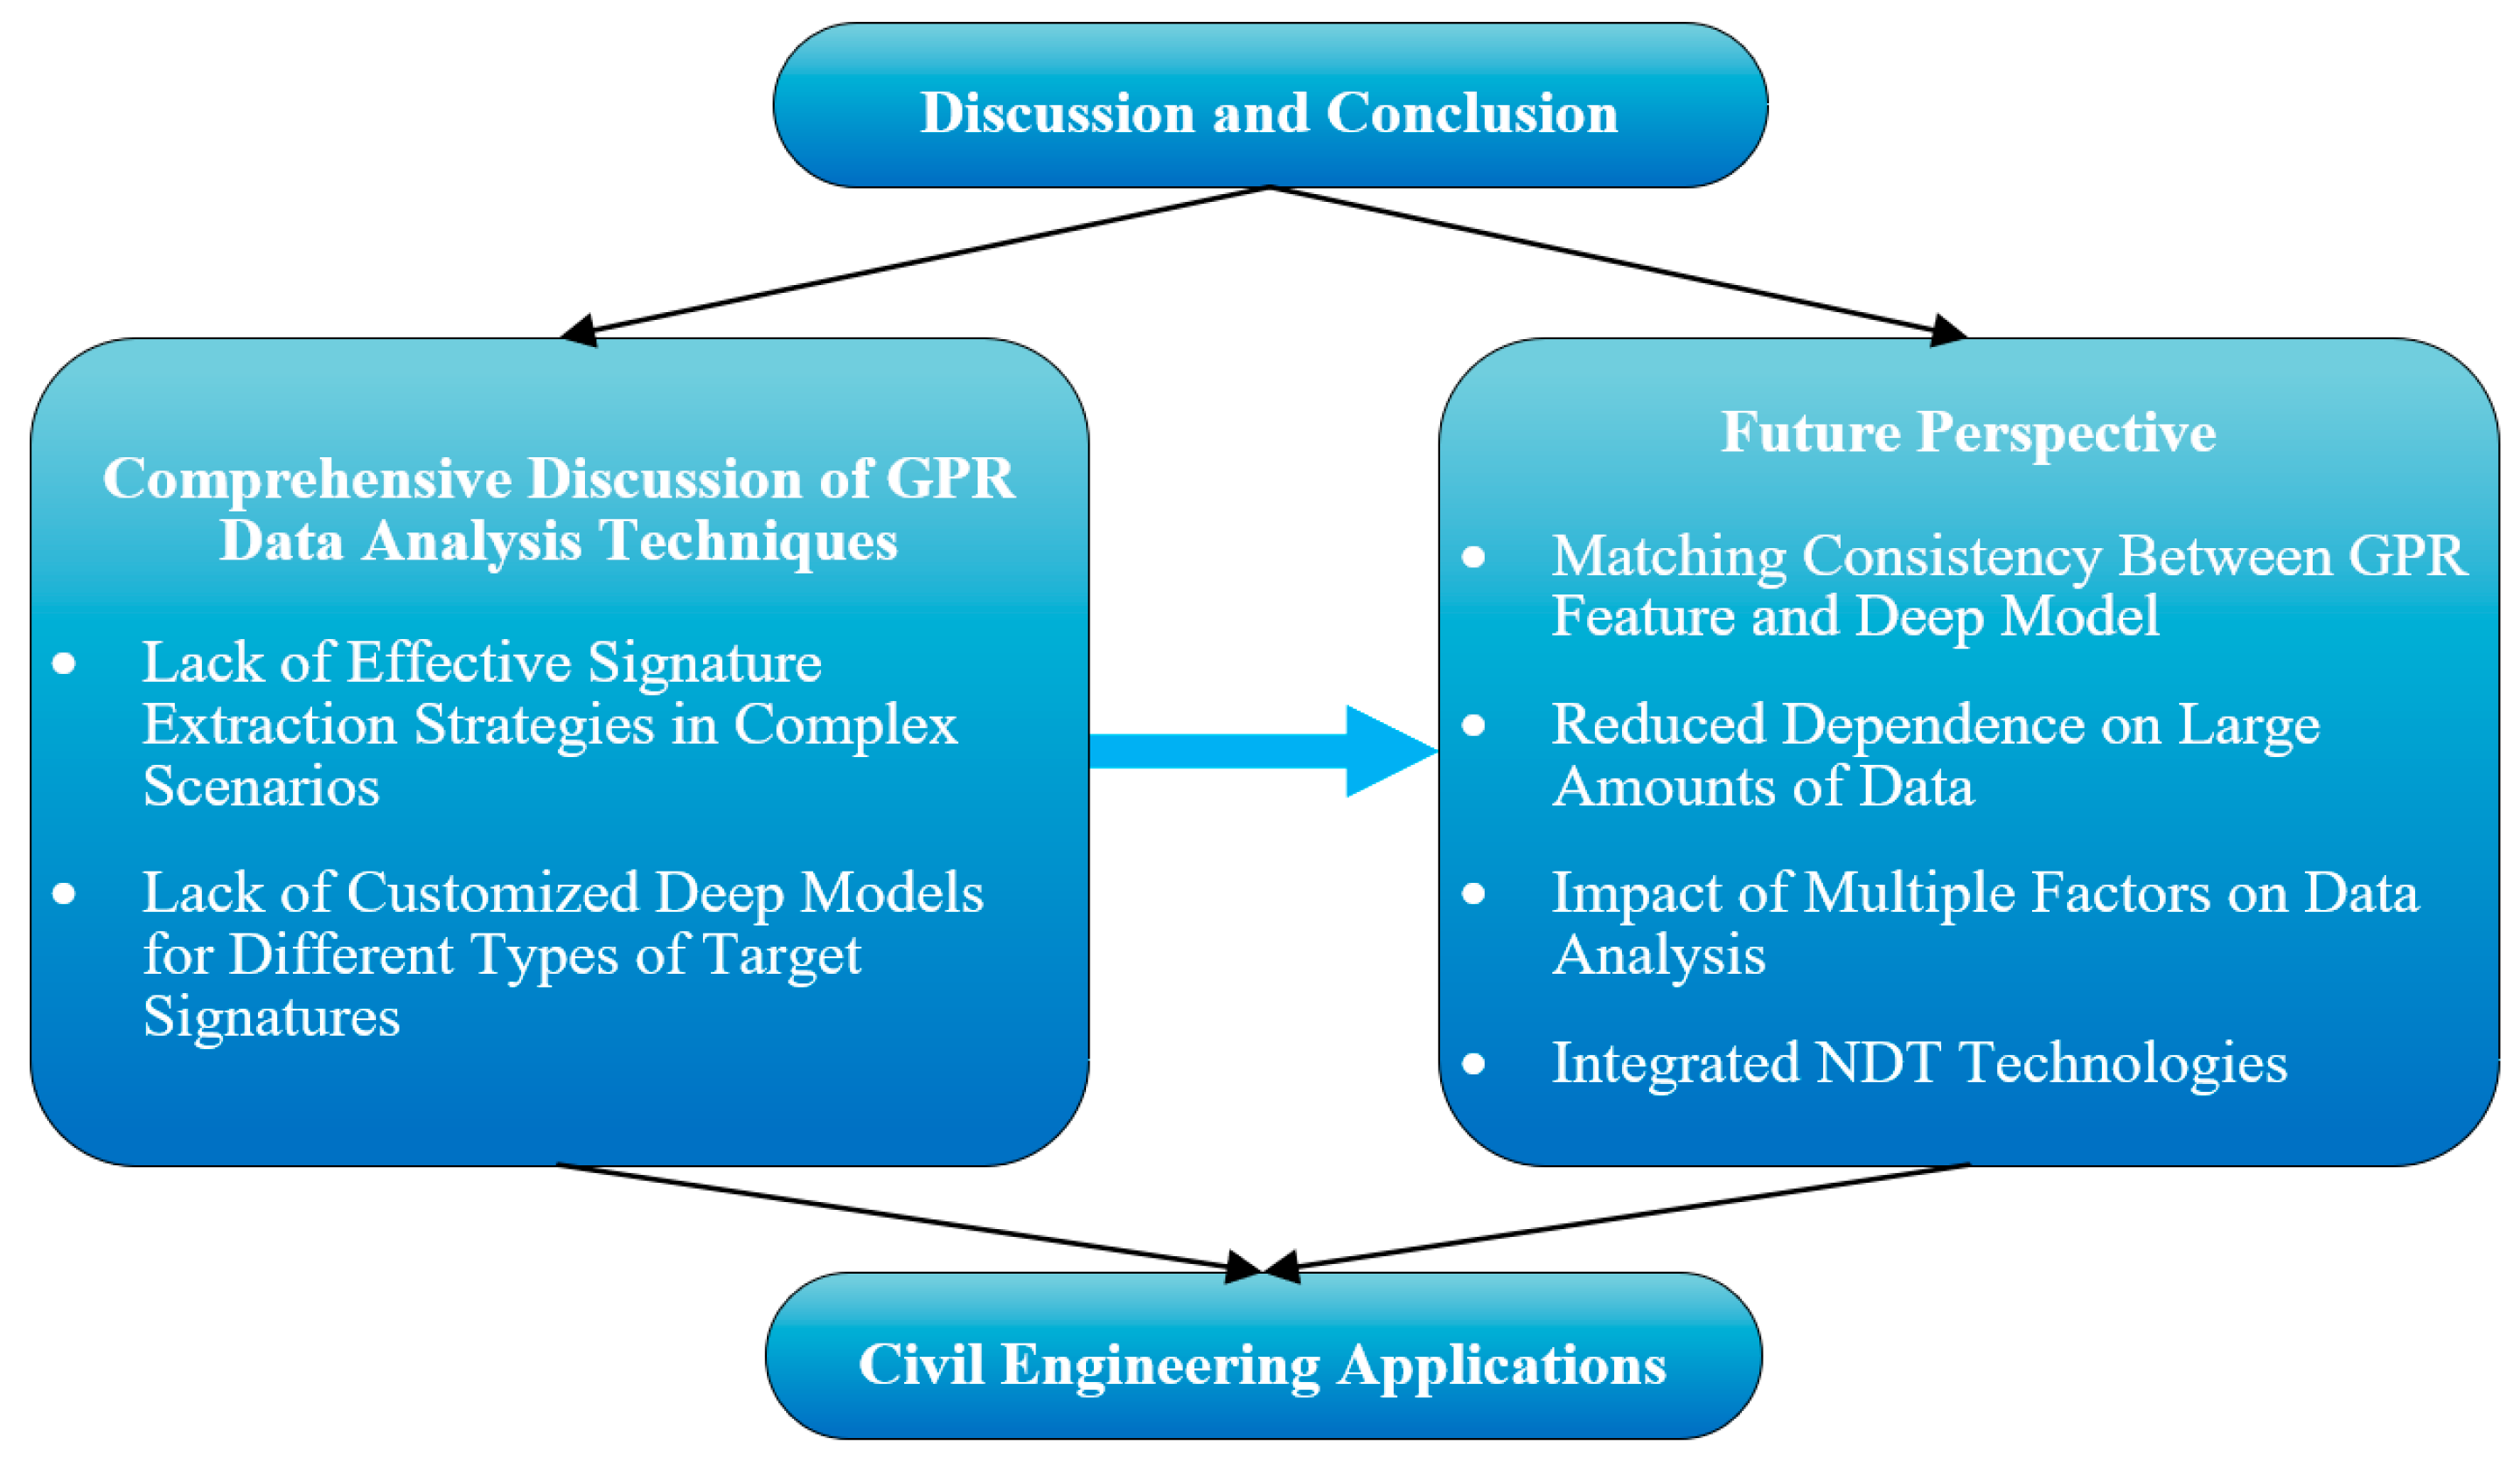
Figure 5.
Examples of field application scenarios. (a) concrete bridge rebar scanning; (b) tunnel rebar mesh scanning.
Figure 5.
Examples of field application scenarios. (a) concrete bridge rebar scanning; (b) tunnel rebar mesh scanning.

Figure 6.
Diagram of discussion and conclusion.

Table 3.
Some examples of the latest GPR works in mapping underground utilities.
| References | Study Scope | GPR Types | Center Frequency | Field Data Source |
|---|---|---|---|---|
| Kim et al. (2019) [53] | Classify cavity, pipe, manhole | Step-frequency GPR system | 500 to 1800 MHz | The data collected from urban roads in Seoul, South Korea |
| Prego et al. (2017) [103] | Buried pipes detection | \ | 500 MHZ, 800 MHZ, 1 GHZ, 2.3 GHZ | \ |
| Metwaly et al. (2015) [104] | Locating and imaging the subsurface utilities | GSSI SIR 3000 | 400 MHZ | The data collected from Al-Sulimania bridge in Holy Mecca |
| Sagnard et al. (2016) [105] | Pipe detection; dielectric measurement | GSSI SIR 3000 | 500,900,1600 MHz | \ |
| Jiang et al. (2019) [108] | Buried cables mapping | GSSI SIR 30 | 200 MHZ | \ |
| Zhou et al. (2019) [110] | Plastic pipe detection | GSSI SIR 30 | 200, 400 MHZ | \ |
| Yuan et al. (2018) [32] | Underground utilities identification | \ | 300 MHZ, 1.5 GHZ | \ |
| Li et al. (2015) [112] | 3-D underground utility mapping | MALA GPR system | 800 MHZ | \ |
| Li et al. (2016) [113] | Utility localization; depth and radius estimation | \ | 400, 500, 800, 900 MHZ | Examples 1–4 are taken from the study by Ristic et al. (2009); examples 5–8 are based on experiments conducted in West Lafayette, Indiana |
| Cai et al. (2020) [114] | Mapping underground utility | MALA ProEx GPR System | 800 MHZ | \ |
Table 5.
Comparison between GPR review works.
| References | Study Field | Site | Study Period | Various Applications | Signal Processing |
|---|---|---|---|---|---|
| Lai et al. (2018) [1] | Civil engineering | \ | 1986–2016 | Building, road pavement, tunnel liners, geology, underground utilities, concrete properties, and corrosion | \ |
| Xiang et al. (2019) [129] | Constructed facilities | \ | \ | Building, road pavement, underground utilities, 3-D reconstruction, archeology, mineral exploration, geology | Postprocessing (data trace editing, noise removal, convert time domain to depth scale, migration); interpretation (neural network, multi-agent system, data fusion, drop-flow algorithm) |
| Benedetto et al. (2017) [25] | Road engineering | \ | \ | Road inspection | Basic processing (data editing, time-zero correction); A-scan processing (zero offset removal, band pass filtering, time-varying gain, resolution improvement); B-scan processing (background removal, velocity analysis) |
| Benedetto et al. (2016) [130] | Engineering, Geoscience | Italy | \ | Structures and hydraulics, transport infrastructures (road, railway, airport, bridge, tunnel), underground utilities, geology and environment, archeology, glaciology, demining, and public safety | \ |
| Ours | Civil engineering | \ | 2015–2020 | Bridge, road pavement, underground utilities, urban subsurface risks (void, sinkhole, cavity) | A-scan processing (noise removal, resolution enhancement, object detection, material property analysis); B-scan processing (image-, ML-, DL-target identification); C-scan processing (3-D reconstruction, target recognition) |
Publisher’s Note: MDPI stays neutral with regard to jurisdictional claims in published maps and institutional affiliations. |
© 2022 by the authors. Licensee MDPI, Basel, Switzerland. This article is an open access article distributed under the terms and conditions of the Creative Commons Attribution (CC BY) license (https://creativecommons.org/licenses/by/4.0/).
Share and Cite
MDPI and ACS Style
Hou, F.; Rui, X.; Fan, X.; Zhang, H. Review of GPR Activities in Civil Infrastructures: Data Analysis and Applications. Remote Sens. 2022, 14, 5972. https://doi.org/10.3390/rs14235972
AMA Style
Hou F, Rui X, Fan X, Zhang H. Review of GPR Activities in Civil Infrastructures: Data Analysis and Applications. Remote Sensing. 2022; 14(23):5972. https://doi.org/10.3390/rs14235972
Chicago/Turabian StyleHou, Feifei, Xiyue Rui, Xinyu Fan, and Hang Zhang. 2022. "Review of GPR Activities in Civil Infrastructures: Data Analysis and Applications" Remote Sensing 14, no. 23: 5972. https://doi.org/10.3390/rs14235972
Note that from the first issue of 2016, this journal uses article numbers instead of page numbers. See further details here.