

Rainfall Consistency, Variability, and Concentration over the UAE: Satellite Precipitation Products vs. Rain Gauge Observations


1
Department of Civil and Environmental Engineering, College of Engineering, United Arab Emirates University, Al Ain, Abu Dhabi 15551, United Arab Emirates
2
National Water and Energy Center, United Arab Emirates University, Al Ain, Abu Dhabi 15551, United Arab Emirates
3
Department of Electrical and Computer Engineering, Colorado State University, Fort Collins, CO 80523, USA
*
Author to whom correspondence should be addressed.
Remote Sens. 2022, 14(22), 5827; https://doi.org/10.3390/rs14225827
Submission received: 14 September 2022
/
Revised: 7 November 2022
/
Accepted: 15 November 2022
/
Published: 17 November 2022
(This article belongs to the Special Issue Satellite Microwave Remote Sensing for Severe Storms Detection)
Abstract
:Recent advancements in remote sensing have led to the development of several useful technologies that would significantly improve our understanding of atmospheric sciences. The ability to identify atmospheric conditions and determine the possibility and intensity of rainfall over a specific location represents one of the most important advantages. However, the use of remote sensing to measure precipitation in arid regions has revealed significant disparities due to a mixture of climatic and terrestrial factors. The objective of this study is to assess the precipitation consistency, variability, and concentration over the UAE using four multi-satellite remote sensing products, namely CHIRPS, CMORPH, GPM-IMERG, and the PERSIANN-CDR, considering daily rainfall data from 50 rain gauges for the period from 2004 through 2020. The study area is divided into various geomorphological regions to assess the accuracy of the products in different regions. Results reveal that the products with a finer spatial resolution such as CHIRPS and CMORPH are better in terms of annual and daily average values. CHIRPS and GPM-IMERG demonstrated better POD values of 0.80 and 0.78, respectively, while CMORPH and the PERSIANN-CDR showed POD values of 0.72 and 0.44, respectively. The correlation and error estimate analysis showed that the performance of different products varies in each region. The PERSIANN-CDR registered the highest correlation of 0.8 for the East Coast, while for other regions it could not correlate well. IMERG and CHIRPS were able to exhibit a good correlation value (up to 0.8) with the gauge observations. Precipitation concentration and variability analysis revealed that GPM-IMERG represents a better alternative to gauge data. It is concluded that multiple hydro-climatological measures should be utilized to assess the effectiveness of satellite products and select the best product for specific studies.
1. Introduction
Accurate assessment of precipitation is vital to manage water resources and understand hydrological processes. Precipitation is one of the fundamental elements of the planetary energy cycle [1,2] and a key input for all climatological models that are used to forecast natural calamities including floods, landslides, and droughts [3,4]. Moreover, hydrological cycles and energy distributions are significantly influenced by spatial distribution, duration, and precipitation concentration [5,6]. Therefore, almost all hydrological investigations primarily require precipitation information with high spatio-temporal resolution. The most imperative task for carrying out any hydrological analysis is the collection of precipitation data and the quality check of rainfall products [7,8,9]. Rain gauges (in situ measurements) and remote sensing techniques, including commercial microwave links, satellite sensors, and ground-based weather radars, are the most frequently used approaches to estimate precipitation [10,11,12,13]. Comparing their accuracy with other sensors and rain gauges offer direct rainfall readings and can be considered ground truths for most hydrological and climatological studies. The under-estimation of heavy precipitation, owing to splashing, is one of the many measurement issues that affect all types of gauges. Other issues include instrument errors and external influences such as wind, precipitation, evaporation, and observer mistakes. Additionally, gauge readings are point values rather than aerial readings, so they are incapable of characterizing the spatial variations in precipitation. Ground-based weather radars monitor a broad area in real time while estimating precipitation at high spatio-temporal resolutions as compared to rain gauges [14,15,16,17]. Radars are essentially available over land, in areas where rain gauges are typically widely distributed. Additionally, it might be challenging to translate the radar reflectance at a particular height and distance from the radar into a precise precipitation estimation. Drop size distribution, melting precipitation, low-level precipitation, attenuation, surface impacts, beam blockage, or beam-filling issues are only a few of the concerns [18]. Furthermore, due to cost and lack of technological expertise, radar networks are not available in many areas. Contrary to weather radars, satellite precipitation products offer an alternative to quickly estimate near-global precipitation. Recent satellite-based precipitation products have high geographical and temporal resolutions for measuring precipitation [19,20,21]. They blend IR pictures with passive microwave data to create precipitation estimates at high resolutions. Many researchers have carried out extensive investigations to evaluate and validate satellite-based precipitation products because of their enormous potential [1,2,3,7,8,22,23,24,25]. However, limited research was conducted to confirm their effectiveness in semi-arid and arid regions and in areas with challenging topography [26,27,28]. With advancements in spatial and temporal resolution, the performance of space-born precipitation products has enhanced substantially. High-quality rainfall estimates have been obtained over the past two decades by NASA’s Tropical Rainfall Measuring Mission (TRMM) Multi-Satellite Precipitation Analysis (TMPA) [19]. TRMM data were used to build many cutting-edge products, including several iterations of TRMM and Artificial Neural Networks-based (PERSIANN) products [24]. Ashouri et al. (2015) developed and distributed the PERSIANN-Climate Data Record (PERSIANN-CDR) for long-term hydro-climatic change studies, with approximately 40 years (1983 to current) of daily precipitation data coverage. The 60°N–60°S latitude range is covered by the 0.25° spatial resolution of the PERSIANN-CDR. The gauge-adjusted Global Satellite Mapping of Precipitation (GSMaP), developed by the Japan Exploration Agency’s Earth Observation Research Center (EORC), is another global product [29,30,31]. The Integrated Multi-Satellite Retrievals (IMERG) for the Global Precipitation Mission (GPM) and the Climate Prediction Center (CPC) MORPHing (CMORPH) approach are two of the most widely used multi-satellite sensor precipitation products [2,23,25]. With information from geostationary satellite IR data combined with estimates of precipitation generated from microwave observations, the CMORPH employs morphing algorithms to retrieve the areal precipitation. The CMORPH, which has an 8 × 8-km grid resolution and spans the years 1998 to present, includes the whole combined periods of the TRMM and GPM. Global precipitation estimates are provided by the GPM in almost real time; however, periodically, the data stream is interrupted. Operating in low Earth orbit (LEO), the GPM Core Observatory satellite carries two instruments for measuring worldwide precipitation and serves as a reference for other GPM satellites in the constellation. The primary goal of the mission is to improve available precipitation products by extending the visit period and improving the algorithms to retrieve the precipitation. From raw data to precipitation rates, the GPM offers a range of outputs at different levels. It was put into operation in 2014 and it offers IMERG rainfall products with a temporal resolution of 30 min and a spatial precision of 0.1° × 0.1°.
According to validation and verification assessments, the correctness of recent satellite rainfall products differs spatially and is influenced by the hydro-climatic parameters of the area. For instance, Shen et al. [32] found that CMORPH performed better than both TRMM 3B42 and PERSIANN in capturing the spatial and temporal precipitation patterns in China. CMORPH was demonstrated to depict the spatial distribution of rainfall across Indonesia with the least accuracy when compared to other satellite-based products [33]. The results of a study by Ghajarnia [34] across the Urmia Basin in Iran were in agreement with those of Wehbe et al. [21]. They asserted that a previous edition of CMORPH (v0.1) was not very successful in creating a meaningful connection with rain gauges in the United Arab Emirates (UAE). It was further discovered that near the Yangtze River in China, CMORPH showed the highest correlation with the rain gauge network among all the precipitation products [35]. Additionally, CMORPH provided the highest accuracy among other products over Italy’s Adige Basin [36].
To achieve advancements in satellite precipitation products’ algorithms, a preliminary validation of these products for a particular region is necessary. To advance the standards in operational analysis and validation methods for satellite precipitation products, the International Precipitation Working Group (IPWG) was founded in 2006 [37]. Since then, efforts have been made to validate satellite precipitation products in several regions of the world, including Africa [38], Asia [39,40], Australia [41], Europe [42], North America [43], South America [44], and the Middle East [21,22,45,46]. These investigations demonstrated that there are regional variations in the performance of these products. The understanding of the performance of satellite-based precipitation products in a given region is, therefore, crucial. Moreover, since water resources are directly influenced by changes in rainfall regimes, spatio-temporal analysis of rainfall becomes vital, as argued by many researchers [47,48,49,50,51,52,53].
The UAE is situated in an arid region with rare precipitation events. Water management and surface water harvesting plans in the UAE need to be based on accurate measurements and assessment of precipitation. Due to the country’s substantial temporal and spatial variability, as well as the randomness and scarcity of precipitation events, the assessment of rainfall across the UAE is challenging [54]. It is vital to have a better understanding of rainfall variability and pattern to improve rainwater harvesting and develop plans for flash flood risk mitigation. Remotely sensed precipitation data in arid regions have not been extensively studied. Adeyewa and Nakamura [55] attempted to correlate rainfall data from the TRMM with rain gauge observations in five climate zones in Africa: savanna, tropical wet, semiarid, arid, and the South Atlantic Ocean. They found that during dry seasons when rainfall is low, satellite bias was higher across drier regions. Four remote sensing satellite products were studied by [38] in African dry regions. It was concluded that sub-cloud evaporation was the main reason for the over-estimation of satellite data. Sultana and Nasrollahi [56] used information from 29 rain gauges to evaluate high-resolution global rainfall products, including PERSIANN, TRMM, and CMORPH, for the eastern and western regions of Saudi Arabia. They performed daily and monthly assessments of the satellite data using a spatial resolution of 0.25° and found that the projected rainfalls were not accurate during dry seasons. However, better results were achieved during wet seasons. Similarly, the PERSIANN-CDR and CHIRPS were analyzed in a semi-arid subtropical climatic region by Anjum et al. [57]. They deduced that on all seasonal scales, CHIRPS was better than the PERSIANN-CDR.
More recently, several researchers have utilized satellite-based precipitation products to assess rainfall regimes over the UAE. For instance, Wehbe et al. [21] calibrated four products (GPCC, TRMM, WM, CMORPH) over the UAE using rainfall data from 2000 to 2010. They performed spatial analysis of the products’ consistency in comparison with land use and topography of the country. Mahmoud et al. [45] compared early, late, and final run products of GPM-IMERG over the UAE for a period of 3 years (2015–2017) and reported that the final run product outperformed its counterparts in statistical and qualitative analysis. CMORPH and GPM-IMERG products were further analyzed by [22], who found that both products are equally good at filling spatial gaps in rainfall observation over the UAE. They utilized the gauge rainfall observations from 2010–2018 to perform analysis at various temporal scales. A similar study was conducted by [58] while exploiting three satellite precipitation products over 18 gauge stations across the UAE. The study included a variety of statistical analyses and concluded that these products can significantly complement station-based data to develop intensity duration frequency curves in dry regions.
All the available studies either used limited data for the rainfall analysis or considered few gauge stations for spatial comparison. Moreover, the main focus of previous studies was devoted to the statistical comparison between gauge records and satellite products and to check the consistency of the products. However, the UAE encompasses different geomorphological regions. These regions have not been adequately investigated for precipitation extreme indices, concentration, and variability.
Unlike others, this study considers four distinct regions in the UAE based on geomorphological characteristics. The precipitation concentration and diversity analysis for the satellite precipitation products are performed for the different regions. The UAE usually receives intense rainfall with a shorter duration. Therefore, the knowledge of precipitation extremes becomes substantial to adequately understand precipitation regimes in the country. To recognize precipitation extremes, multiple extreme precipitation indices were calculated for the gauge data and the results were compared with satellite data. In addition, precipitation concentration and variability analysis for the selected satellite products were conducted. Long-term daily rainfall data (2004–2020) from 50 rain gauges covering the UAE were used to perform a comparison with the daily measurements of four satellite precipitation products, namely, GPM-IMERG, CMORPH, CHIRPS, and the PERSIANN-CDR. Apart from the statistical analysis, and to judge the accuracy and consistency of remote sensing products, various qualitative and quantitative analyses were conducted including precipitation extreme indices, concentration, and variability using well-known indices.
2. Materials and Methods
2.1. Study Area
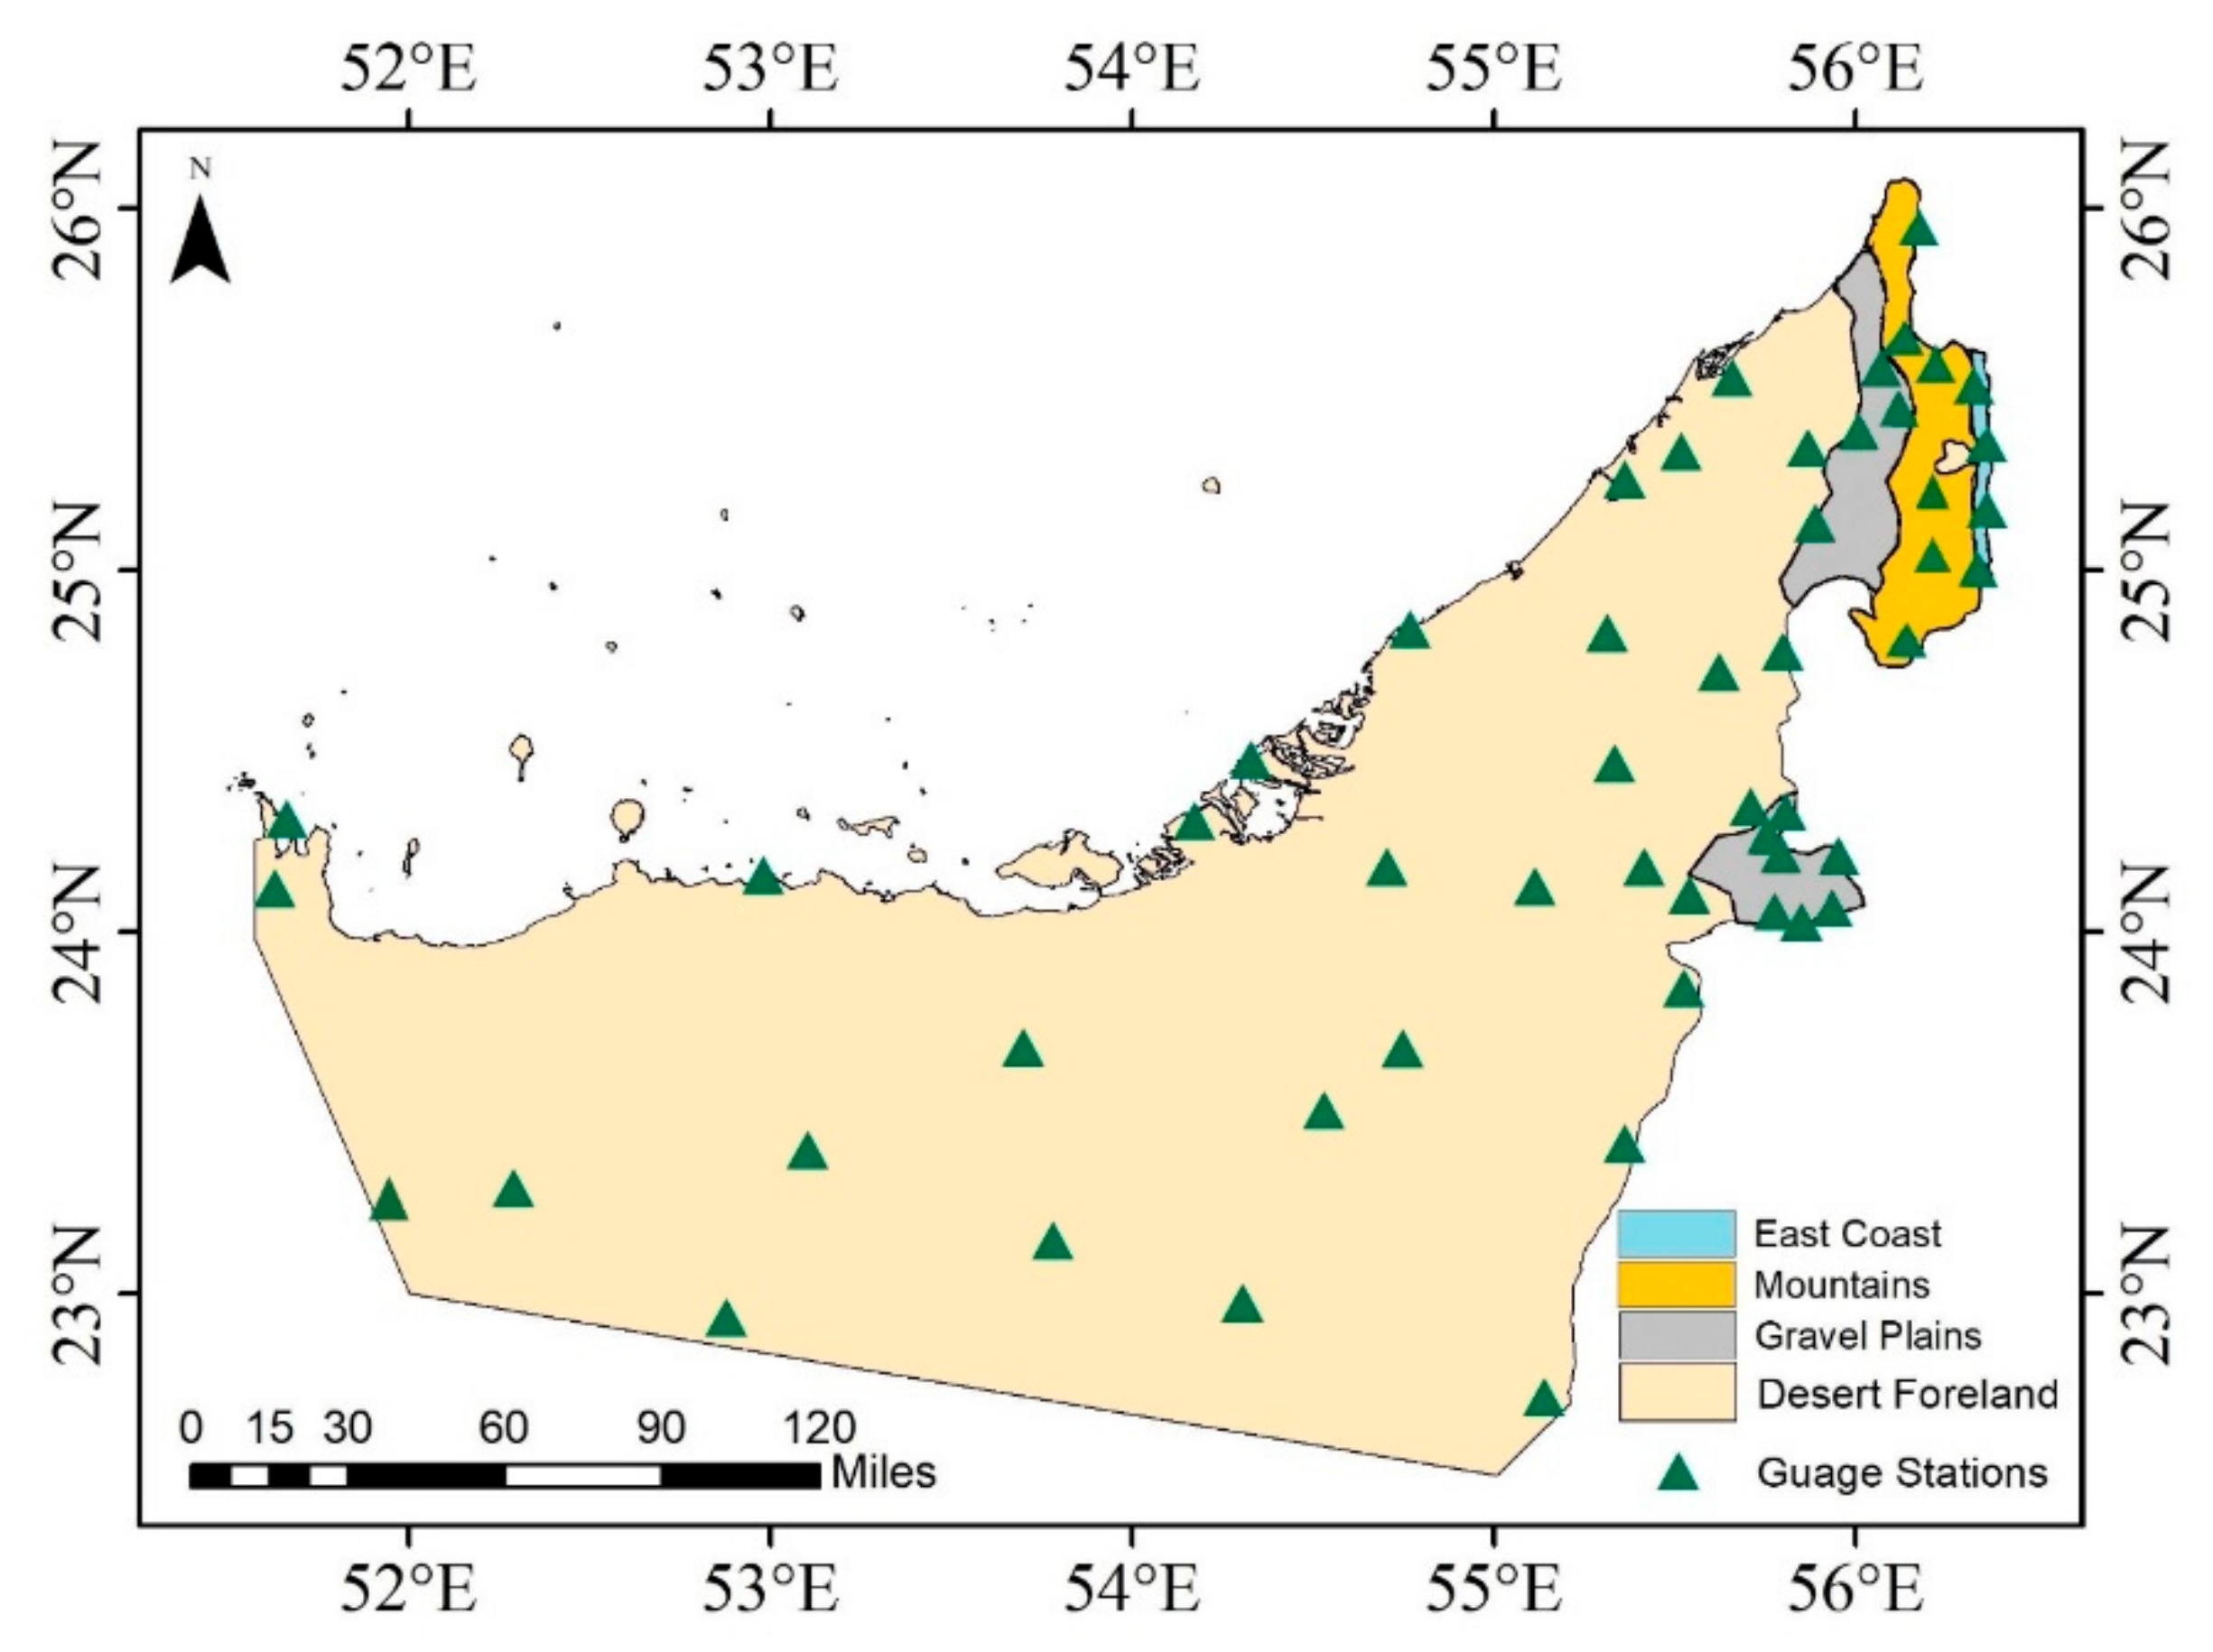
The United Arab Emirates (UAE) is considered to conduct the comparison of satellite precipitation products and rain gauge observations (Figure 1). The country occupies the southeastern part of the Arabian Peninsula (51°–57°E, 22°–26°N) and is classified as a semi-arid to arid country. It has a 740 km long coastal stretch along the Arabian Gulf and Gulf of Oman [21]. The country consists of seven emirates and has boundaries with other Gulf Cooperation Council (GCC) Counties that include Saudi Arabia and Oman to the southwest and northeast of the UAE, respectively, in addition to Bahrain, Kuwait, and Qatar. The country experiences moderate winters and extreme summers with a maximum average monthly temperature of 40.3 °C. Humid southeasterly winds prevail during summer which results in humidity levels as high as 95%. The western parts of the country are mostly flat, while the northeast area has a mountainous terrain with a maximum height of 1800 m above mean sea level (alms). According to the geomorphology of the area, the UAE is broadly classified into East Coast (EC) which lies along the Gulf of Oman, Mountains (M), Gravel Plains (GP), and Desert Foreland (DF) (Figure 1). The water year spans from October to September, while the rainy season is from late November to early April. Several researchers [54,59,60] reported that the country faced a plunging shift in annual rainfall in 1999. The average annual rainfall ranges from 80 mm in the Desert Foreland areas to 140 mm on the East Coast and Mountains.
2.2. In Situ Data
Daily precipitation data from 50 rain gauges covering the study area were collected for the period 2004–2020 (Figure 1). The data were provided by the National Center of Meteorology (NCM), UAE. The gauges electronically report rainfall observations which are automatically logged into a central database. The NCM verifies the accuracy of the datasets and daily and monthly gauge accumulations are the typical distribution formats for rain gauges. All the stations used in this study are inland and none of the marine stations were utilized. Station-based statistical metrics based on monthly and annual rainfall data are presented in Table A1 and Table A2 respectively.
2.3. GPM-IMERG
The Global Precipitation Measurement (GPM) is a multinational satellite mission. It offers 3-hourly global measurements of snow and precipitation. The Integrated Multi-satellite Retrievals for GPM (IMERG) algorithm, which combines information from all passive-microwave devices in the GPM constellation, provides rainfall estimates in multiple runs. The Late run product has a 14-h delay, while the Early run product offers data that are practically real-time with a 4-h latency. Since the Final run product utilizes gauge information and has a latency period of two months post-observation, it is considered the most accurate version. The spatio-temporal resolutions of the IMERG Final run product are 0.1° × 0.1° and 30 min. To produce rainfall data, IMERG calibrates, combines, and appends satellite-based microwave estimates with infrared (IR) satellite estimations [23]. In this study, IMERG Final run is used. Additional details of the IMERG and other GPM products can be found in [5,23,25].
2.4. CMORPH
The two products offered by CMORPH are CMORPH (V0.x) and CMORPH (V1.0). CMORPH (V1.0) reduces the significant inhomogeneity generated by the changing algorithm in CMORPH-V0.x. The most recent edition of the product contains data from 1998 to present, while the earlier version covers the years 2002 to 2018. Bias-corrected precipitation products are also included in CMPORPH-V1.0 along with the raw, satellite-only precipitation estimates. The CMORPH precipitation data used in this study was acquired from the National Oceanic and Atmospheric Administration (NASA) Climate Prediction Center (CPC) [61]. The downloaded data have a spatial resolution of 8 × 8 km and a temporal resolution of 30 min.
2.5. PERSIANN-CDR
The PERSIANN-CDR (Precipitation Estimation from Remotely Sensed Information using Artificial Neural Networks-Climate Data Record) product, was developed by the Center for Hydrometeorology and Remote Sensing (CHRS) at the University of California, Irvine (UCI). It computes rainfall estimates at every 0.25° × 0.25° pixel using neural network function classifier techniques. When independent rainfall estimates are available, the updating of the network parameters is made by an adaptive training function. Based on geostationary infrared imagery, the PERSIANN system was eventually expanded to make use of both infrared and daytime visible information. To provide worldwide rainfall, the PERSIANN algorithm is based on geostationary longwave infrared images. The global range of the rainfall product is 60°S to 60°N. The PERSIANN-CDR belongs to the PERSIANN family. Detailed information about the product can be found in [24]. In this study, the PERSIANN-CDR product is used to analyze the changes and trends in daily precipitation, particularly extreme precipitation events.
2.6. CHIRPS
An extensive 35+ year quasi-global precipitation record is available from the Climate Hazards Group InfraRed Precipitation with Station data (CHIRPS). For trend analysis and seasonal drought monitoring, CHIRPS creates a gridded rainfall time series utilizing in-house climatology, CHPclim, 0.05° resolution satellite imagery, and in situ station data. The data span 50°S–50°N (and all longitudes) and are available from 1981 to present. CHIRPS has shown promising results in terms of low bias and operational monitoring in various studies [62,63]. In this study, 5 × 5 km daily data were obtained from the Climate Hazard Center of UC Santa Barbara. Table 1 briefly lists the satellite precipitation data sets utilized in this study.
2.7. Methodology
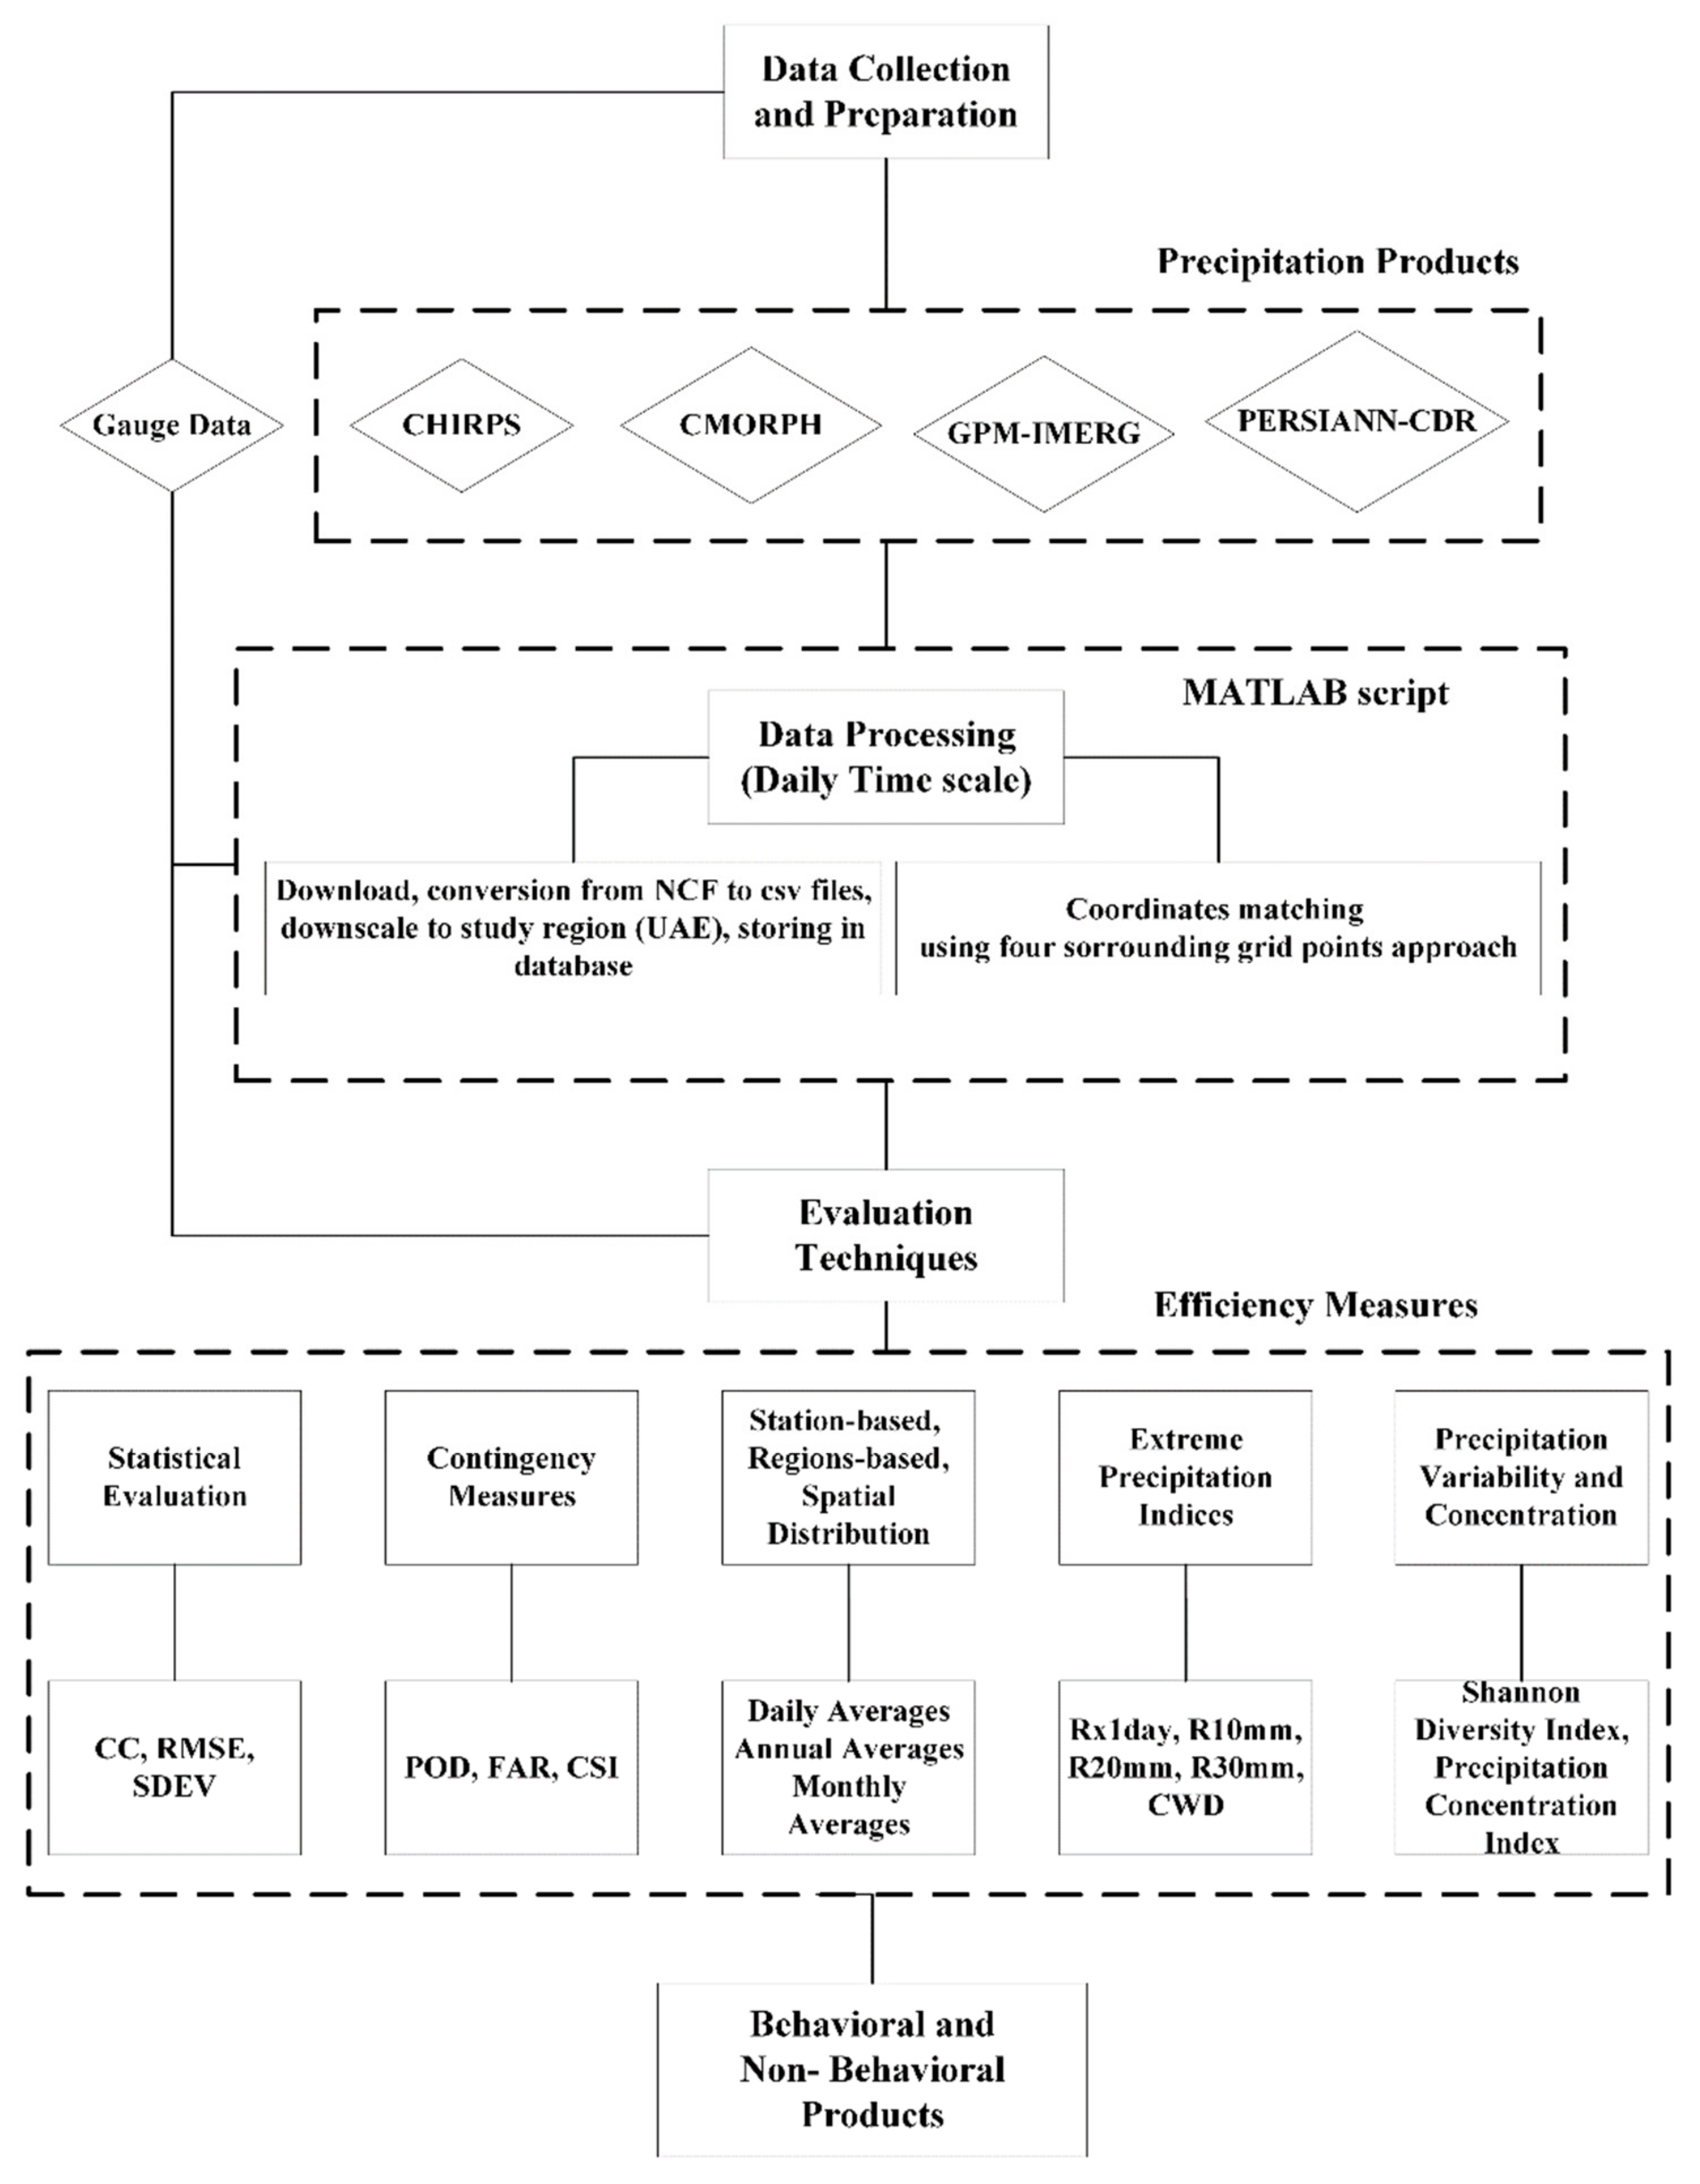
The current study involves several steps to accurately estimate the consistency of the selected satellite precipitation products and analyze rainfall characteristics in the UAE. The process starts with the acquisition of daily ground observations from the National Center of Meteorology (NCM) of the UAE. The matching time series of the satellite precipitation products were then downloaded through various sources (Table 1) and extracted at the gauge locations. The methodological framework is represented in Figure 2.
2.8. Data Acquisition
Rainfall data were acquired from NCM from 2004–2020 on daily basis. For coordinates-based analysis, the exact coordinates of the gauge stations were acquired from NCM [64]. A total of 50 stations covering the four geomorphological regions of the UAE were considered. The EC region has the least number of gauge stations (4), while DF region has the maximum number of stations (28) due to its larger area (Figure 1). The GP and M regions have 12 and 6 gauge stations, respectively. The data from the satellite products are usually available in NetCDF (Network Common Data Form), HDF (Hierarchical Data Format), OpeNDAP (Open-source Project for a Network Data Access Protocol), or GeoTIFF (Georeferenced Tagged Image File Format). The data were downloaded in NetCDF format for all the selected precipitation products based on the respective grids. The data were downloaded using the MATLAB program.
2.9. Selection of the Grid Coordinates
The selection of grid coordinates, based on locations of gauges, is considered the most vital step to ensure reliable results. The process was programmed in MATLAB to precisely select the neighboring grid coordinates containing the gauge location. The code performs the following operations: (1) selecting the grid containing the gauge and recording the rainfall measurements for the four surrounding grid points; (2) taking the weighted average of the four nearest neighboring grid points and comparing it with the gauge rainfall data; (3) alternatively, selecting the single grid point if the gauge location is within a predefined threshold distance from the nearest grid. Since the weighted average approach was applied while selecting four neighboring grid points, the grid point closest to the gauge location receives the highest weightage for the average calculations. However, if the distance of any grid point is small enough that it surpasses the pre-defined threshold, that grid point would receive the full weightage of 1 and the contribution from the rest of the three grid points becomes practically null. However, the overall percentage of these single-gridded matched points was not more than 10–20% for all the products. In other related studies, the grid points were selected based on the minimum distance from the gauge location only [45]. This would equally under-estimate or over-estimate the actual rainfall. In this study, the weighted average of four neighboring points was better calculated to acquire more reliable matching rainfall data.
2.10. Interpolation Technique
To compare point-based rain gauge data with grid-based satellite remote sensing data, spatial interpolation or simple averaging approaches were used. However, due to interpolation algorithms, rain gauge densities, systematic errors, and other factors, the interpolated data may have some uncertainties. Therefore, a rigorous and precise method was required to compare gauge-based vs. satellite precipitation products. Inverse Distance Weighting (IDW) is a widely used method in the literature and is recognized as one of the standard spatial interpolation procedures [65,66,67]. IDW uses the average of all sample data points in the neighboring cells to predict the value in a particular cell. More weight is assigned to the points that are closer to the center of the cell being predicted during the averaging process. Therefore, the IDW interpolation technique was utilized due to its robustness and ease of use.
2.11. Performance Measures
The performance of the satellite products to accurately detect rainfall is assessed through various statistical performance measures. Prior studies categorized these measures based on contingency estimates, error estimates, and correlation consistency between the observed and estimated rainfall values [24,27,68,69,70,71].
Contingency measures are vital to reveal the correctness of the products in identifying rainfall events. Prominent contingency measures include, among others, Probability of Detection (POD), False Alarm Ratio (FAR), and Critical Success Index (CSI). Table 2 provides the basis for the formulation of the three mentioned measures.
Based on Table 2, the three contingency measures can be formulated as:
where POD stands for correctly detected events out of total events; FAR stands for falsely reported events out of all warnings; and CSI stands for correctly detected events out of all warned and unwarned events. All the above measures have a value ranging from 0–1. POD is perfect at value 1 and FAR is perfect at zero value. A value of 1 for CSI also portrays the best value. Similarly, Root Mean Square Error (RMSE), Pearson Correlation Coefficient (CC) [72], and Standard Deviation (SD) are used to quantify the accuracy and agreement of the products with the observed values. These measures are described in Equations (4)–(6).
where xi and yi denote the gauge rainfall and satellite rainfall estimates, respectively, while and are their mean values. Similarly, represents the population standard deviation and xi denotes each value from the population, and n is the size of the whole population. The Pearson Correlation, which can vary from −1 to 1, illustrates the statistical relationship between variables. Whereas 0 indicates no linear correlation, −1 implies a full negative linear correlation, and 1 indicates a total positive linear correlation. RMSE tends to reveal the average error of the products in assessing the observed precipitation.
2.12. Precipitation Extreme Indices
A determined value that can be used to characterize the status and changes in the climate system is known as a climate index. It helps understand the precipitation and temperature extreme patterns over time. Climate indices are also referred to as annual or monthly statistics of weather and are very helpful for a comprehensive understanding of regional climatic trends. Moreover, spatial trends in precipitation extreme indices are imperative to study the changes in rainfall characteristics [47]. The R software package was utilized to summarize the selected indices over the UAE and to analyze how the satellite products behave in comparison to gauge data. To check the extremes in precipitation values, various precipitation indices were calculated to show the maximum one-day and yearly values along with the number of days when a specific threshold rainfall amount was surpassed [73,74]. The indices are explained in Table 3 with formulas based on monthly or yearly statistics of predicted and observed climatic data.
2.13. Precipitation Concentration Index (PCI)
The uneven spatial and temporal distribution of precipitation, aggravated by climate change, has recently received significant attention. More extreme weather events, such as floods and droughts, are likely to occur due to precipitation frequency, concentration, and variability. Especially, the variation in precipitation concentration has an impact on ecosystems, human health, and the environment. For instance, floods are likely to occur when wet days account for a higher percentage of annual precipitation. Similarly, intense rainstorms may trigger flash floods, landslides, and water accumulation in urban areas. Statistical indices, including Concentration Index (CI) and Precipitation Concentration Index (PCI) based on daily and monthly precipitation data, were developed to investigate the concentration of precipitation and demonstrate the changing weight of seasonal precipitation variations. The Precipitation Concentration Index (PCI) was conceived and established by [75,76] and was utilized at the annual and seasonal scales by various researchers [49,70]. The precipitation can be considered as regularly distributed (PCI < 10), moderately concentrated (PCI = 10–15), having irregular distribution (PCI = 16–20), and exhibiting severe irregular distribution when the PCI value is above 20 [76]. Moreover, the temporal analysis of the PCI values also demonstrates the decrease or increase in the temporal trend in precipitation concentration. The PCI was derived for rain gauge and satellite observations to determine the concentration at the yearly scales. The following formula was used to compute the seasonal and yearly precipitation concentrations.
where pi denotes the rainfall amount in ith month.
2.14. Precipitation Variability
To study the variability in precipitation within a year and assess the evenness of total annual precipitation, various diversity indices are used [77]. The precipitation pattern and the seasonality in precipitation can be detected through these indices in a decadal period. The Shannon Diversity Index [78] is one of the most used diversity indices and has been effectively utilized for rainfall variability analysis [77,79,80,81]. The Shannon Diversity Index of any gauge station can be calculated by considering the monthly proportion of precipitation and multiplying it with the natural log of itself.
where xi denotes the monthly proportion of precipitation and D is the Shannon Diversity Index. Generally, the value of Shannon Diversity Index ranges from 1.5 to 3.5. However, for the rainfall variability analysis, it can be standardized to be within the range of 0–1 by dividing by the natural log of 12. Moreover, the zero monthly values were replaced by a small number of 0.01 to refrain from systematic errors as the negative logarithm of zero is undefined.
3. Results
3.1. Spatial and Temporal Precipitation Distribution
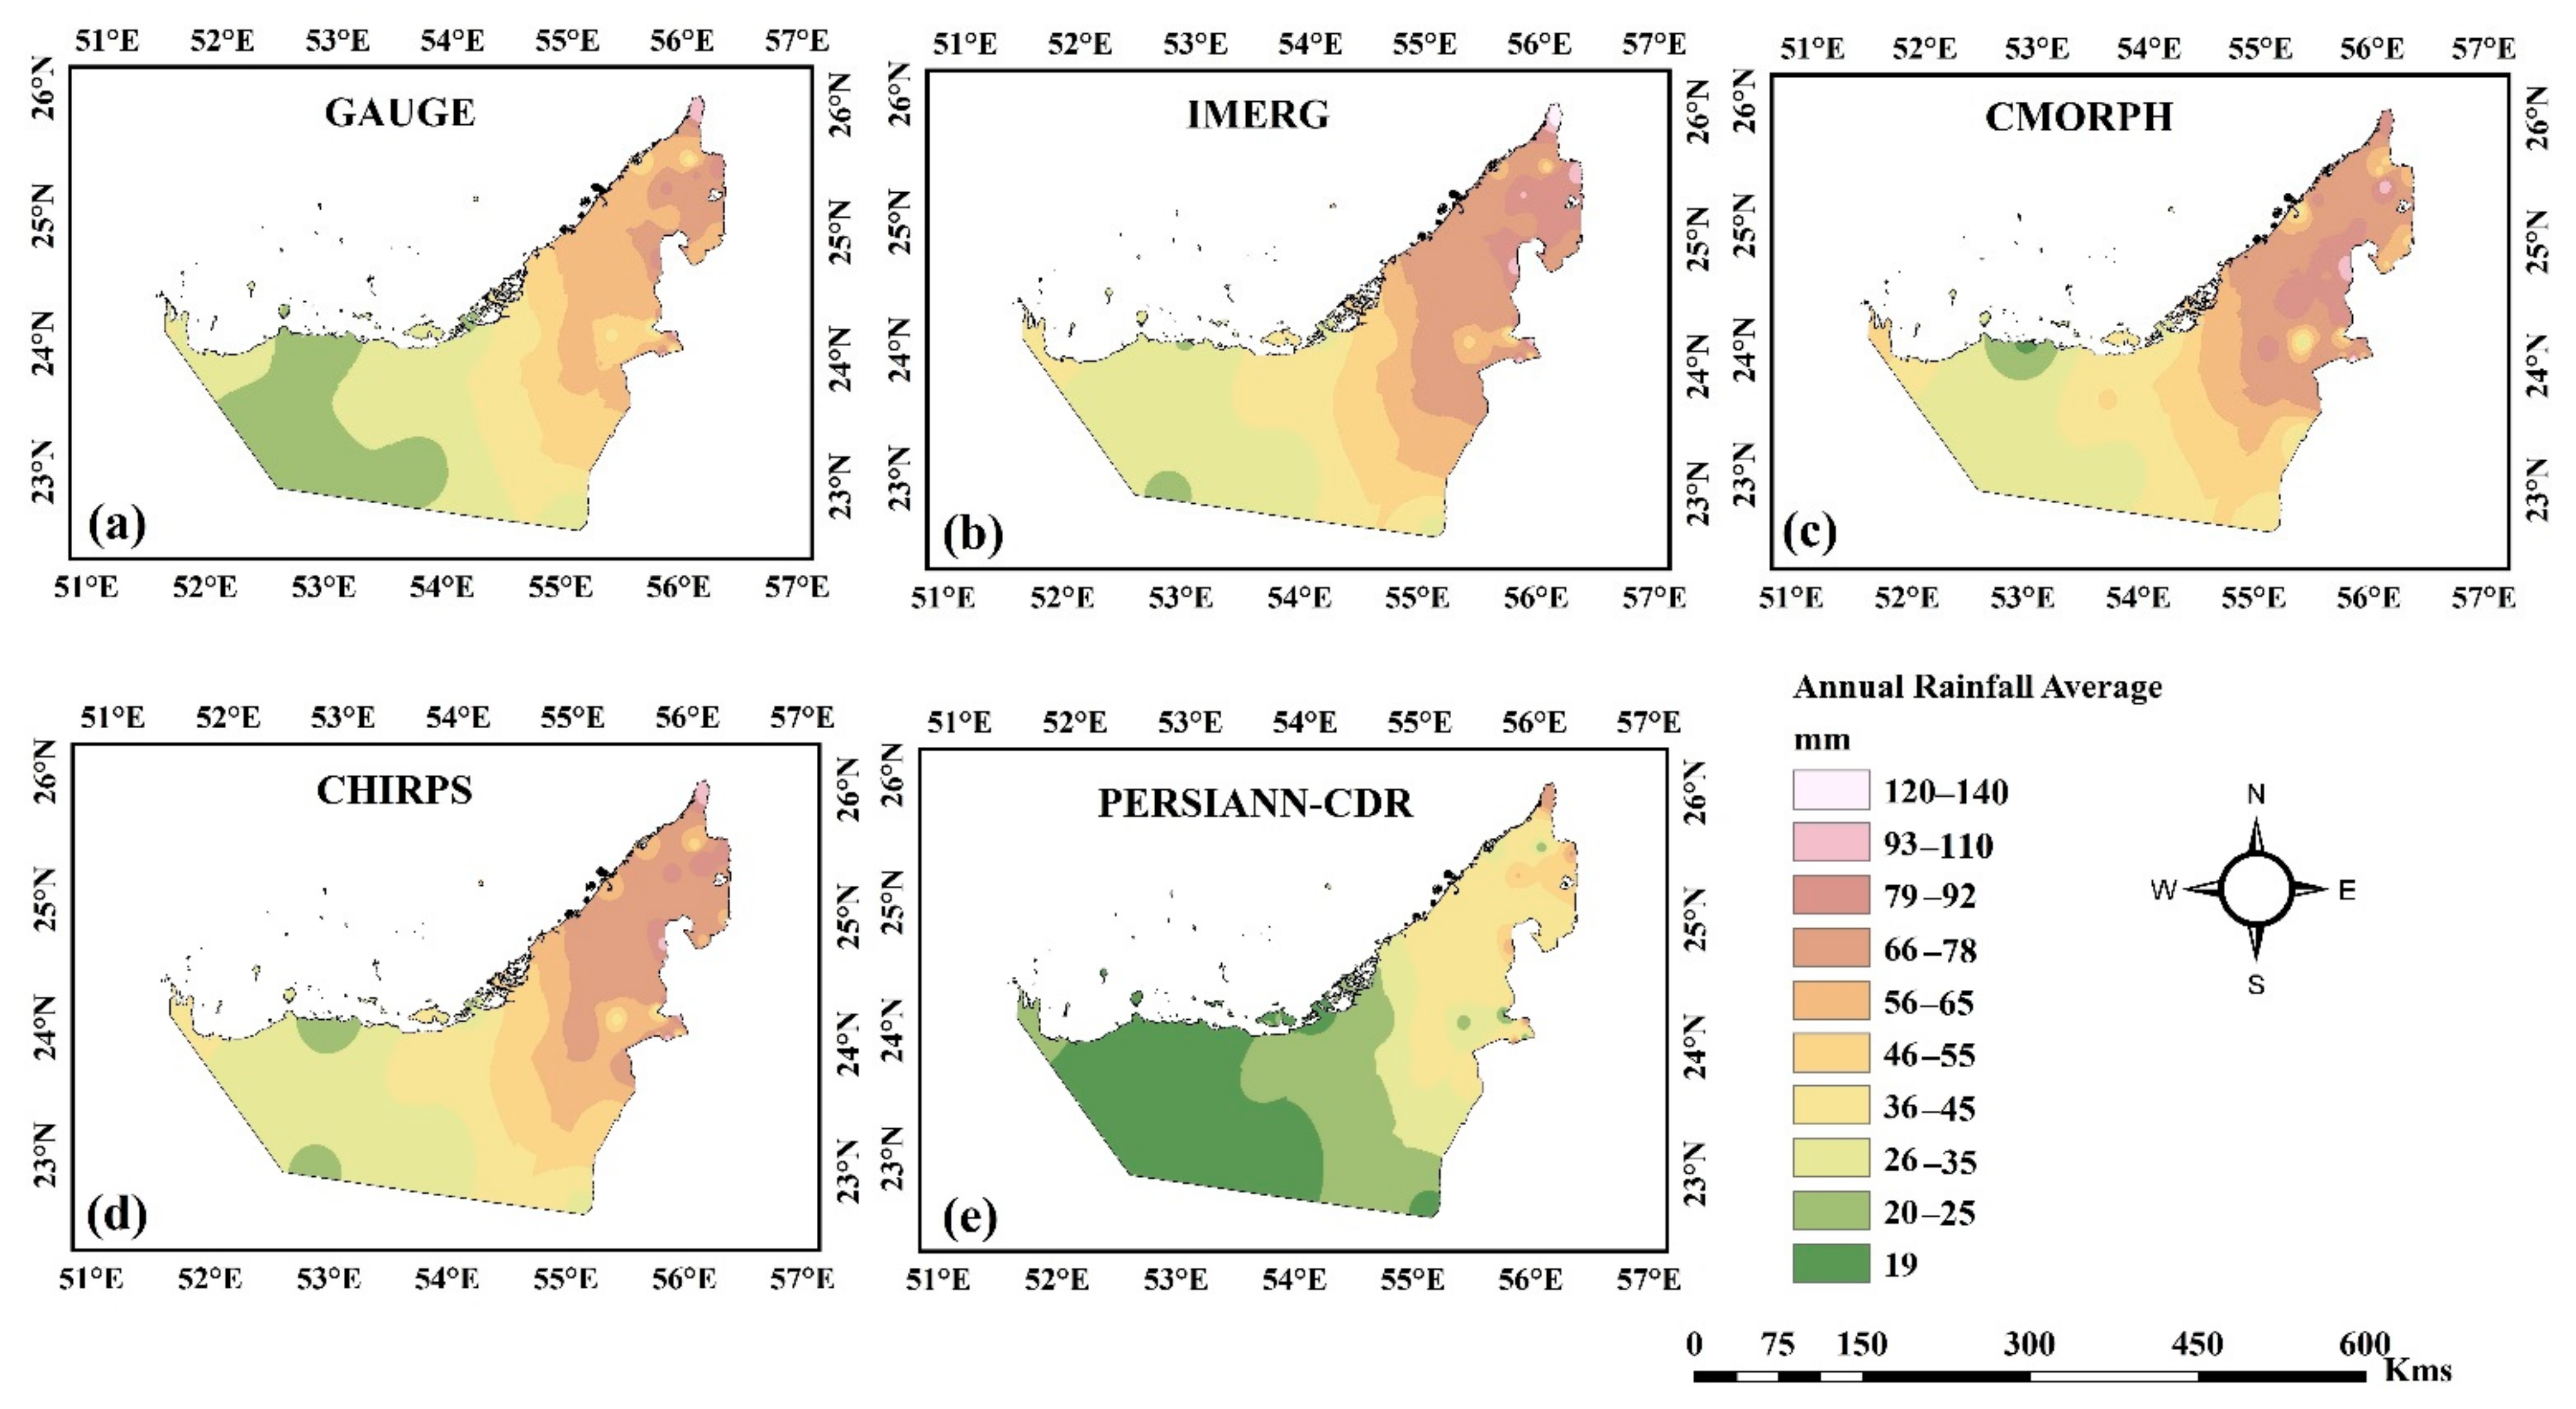
Based on satellite products, the annual average rainfall distribution over the UAE showed a consistent geographical pattern with the gauge data. (Figure 3). However, the plots also show over- and under-estimation in the average rainfall. The observed rainfall or gauge data subplot indicates that the highest average rainfall value lies in the range of 93–110 based on the data of 17 years and 50 gauge stations covering the country (Figure 3a). Higher values of average annual rainfall occur mostly in the East Coast (EC), Mountains (M), and some parts of the Al-Ain region. The western part, which largely lies in the Desert Foreland (DF), receives the least rainfall throughout the year.
Although the spatial distribution of all satellite products follows an analogous pattern with the gauge data, the number of lower and higher average annual values differs significantly. Almost all the products over-estimated the gauge data except the PERSIANN-CDR, which displayed a substantial under-estimation. The highest value of the average annual rainfall was shown by the CMORPH product, where it reached up to 146 mm, whereas IMERG and CHIRPS provided 133 and 123 mm, respectively. The under-estimation of the PERSIANN-CDR product can be ascribed to its relatively coarse spatial resolution as compared to other products. This behavior of the PERSIANN-CDR was also reported by [21].
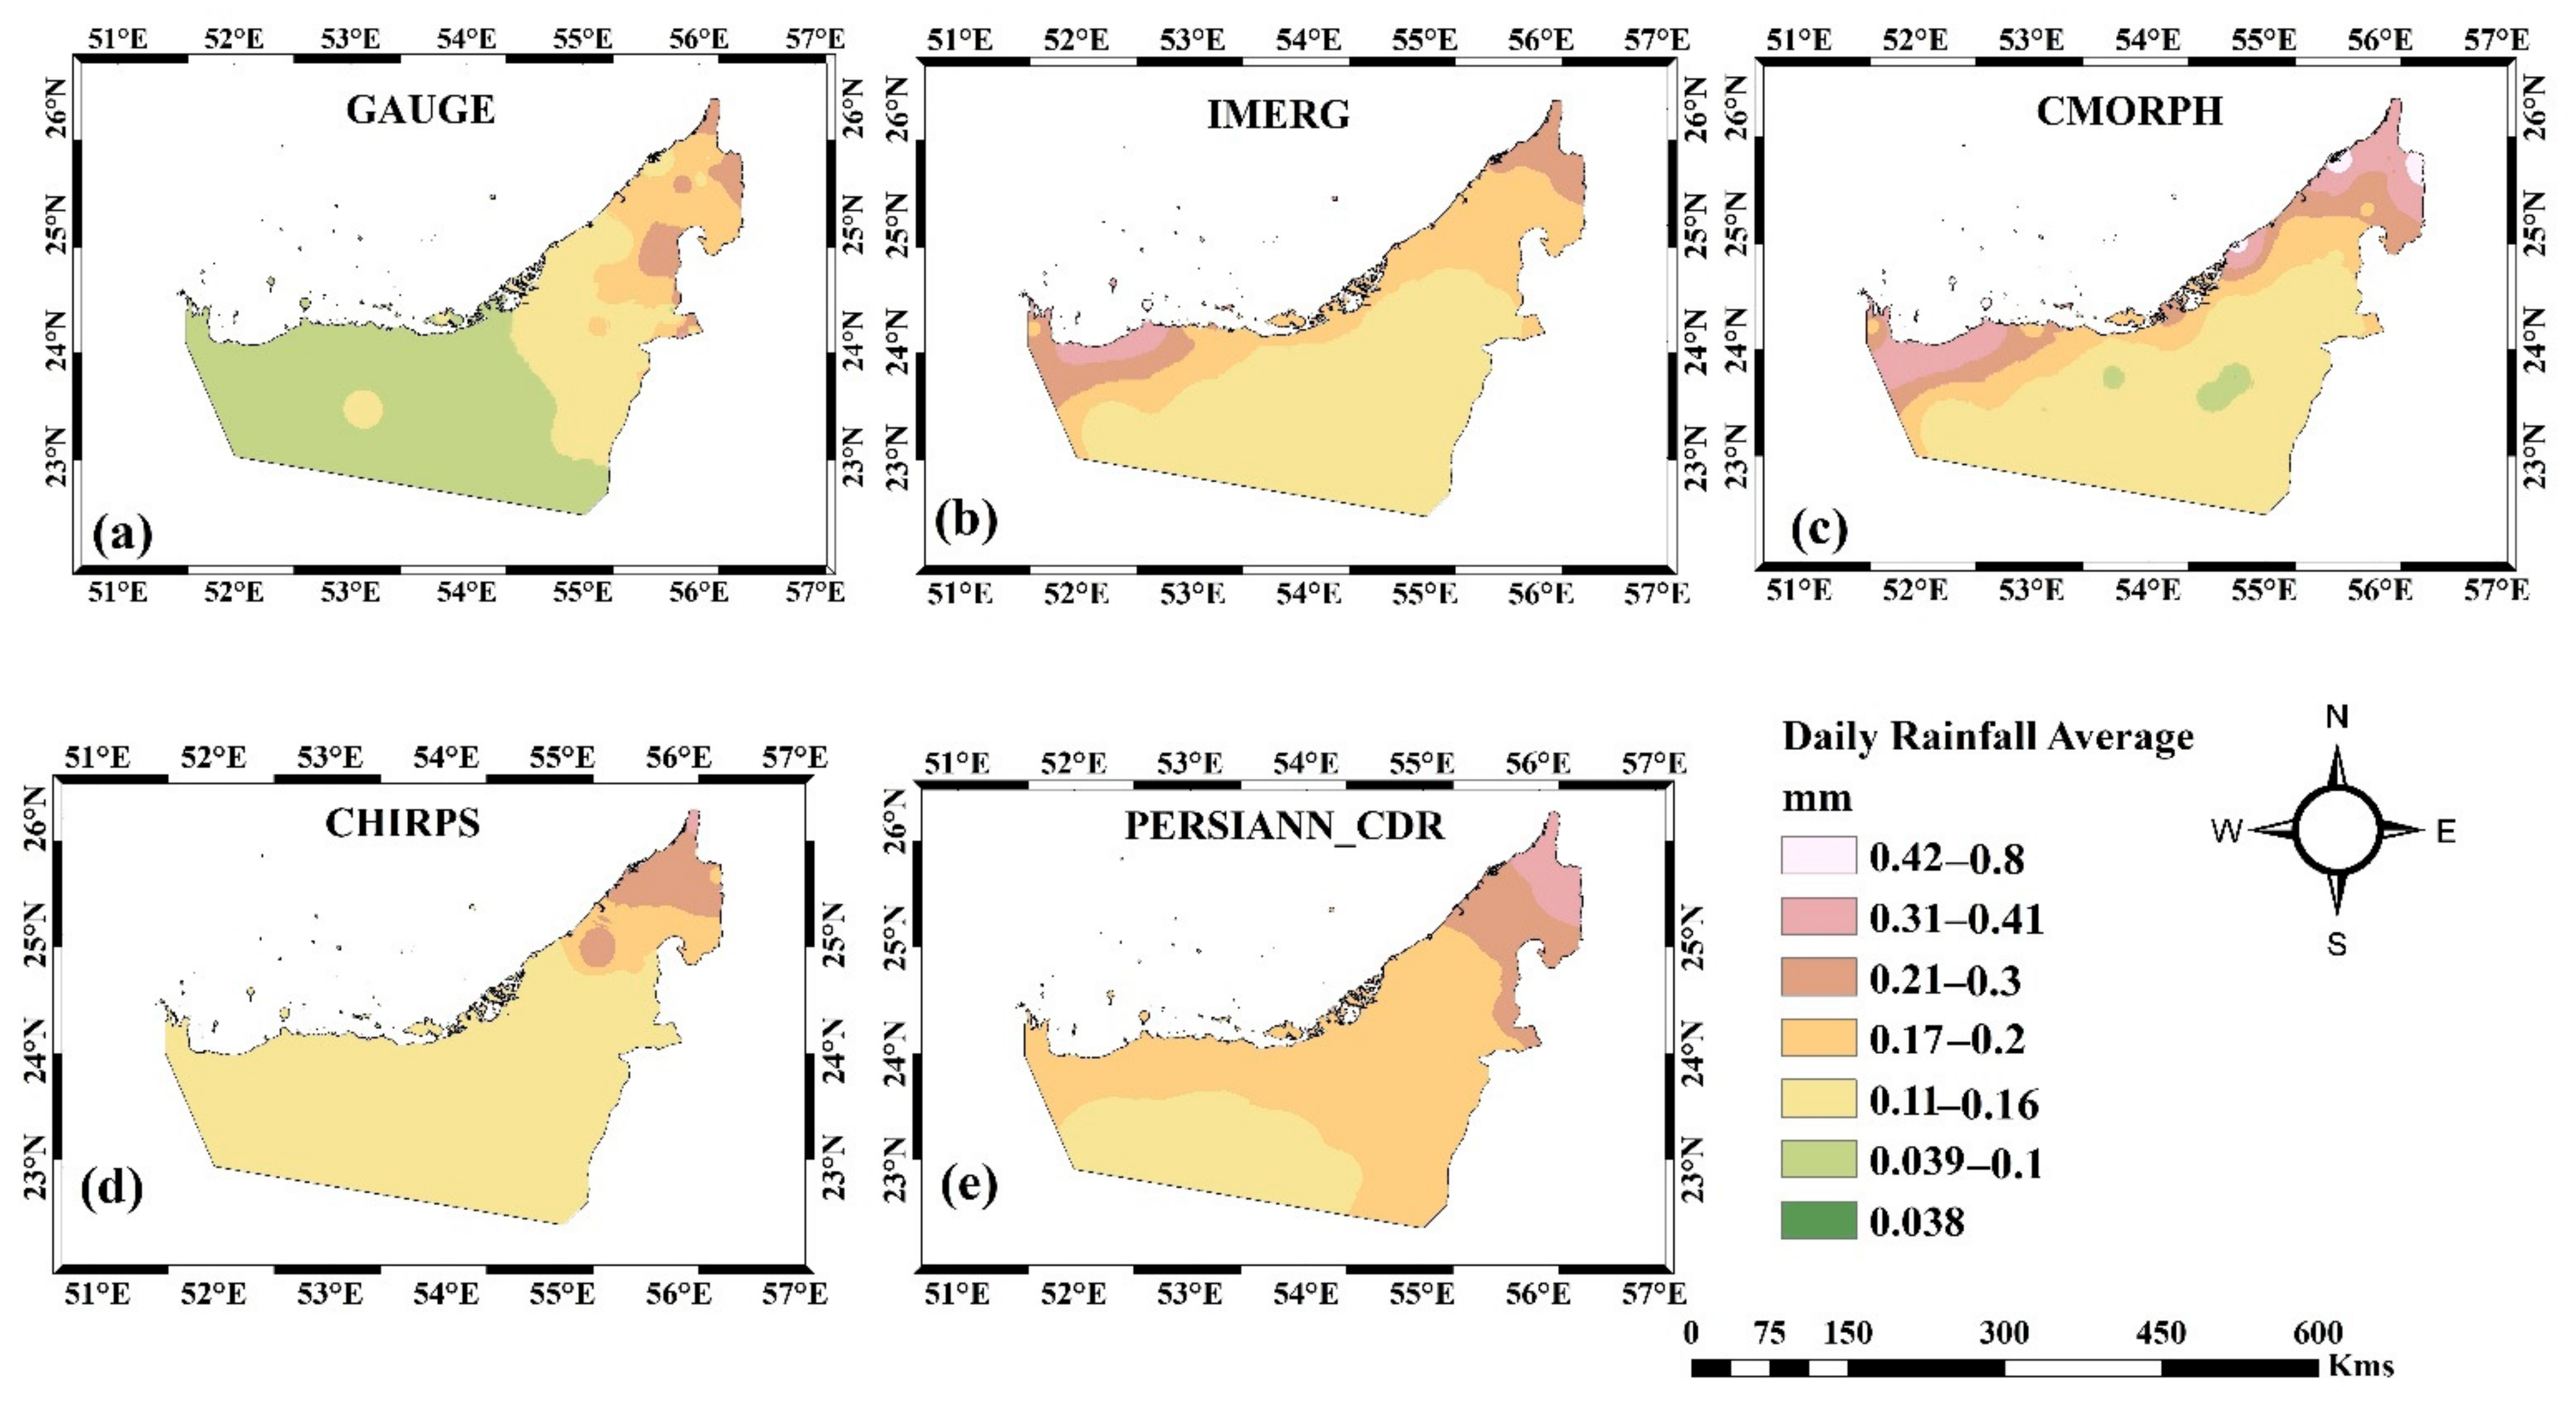
Figure 4 represents the daily average rainfall comparison between the products and gauge values. The spatial plots are delineated to further elaborate the over- and under-estimation of the products. Very low daily averages reflect the maximum number of dry days in the country. The gauge data (Figure 4a) displays the daily average rainfall in the range of 0.1–0.48. The western part of the Abu Dhabi emirate shows very low values for daily average rainfall with an increase in the northern emirates and mountainous regions. Almost all the products over-estimated the daily average rainfall in the western region of Abu Dhabi. IMERG and CMORPH (Figure 4b,c) have even shown relatively higher daily averages in some western coastal regions which could not be captured by the other two products. CHIRPS showed an average value of less than 0.2 in most of the country’s stations, except in the northeastern mountains, where it exhibited values ranging between 0.2 and 0.3. The relatively higher values of daily averages in the East Coast and Mountains areas, depicted by gauge data, were successfully captured by almost all the products.
All the products, including rain gauges, showed a steady pattern in the areal average monthly rainfall as shown in Figure 5. According to rain gauge data, Jan–March were the wettest months in the analysis of the previous 17 water years. Summer months are usually dry and all the products were consistent with the gauge data during the summer months. CMORPH and GPM-IMERG showed increased monthly averages which were expected as represented in the annual average rainfall plots. Figure 5 shows the comparison between rainfall values among rain gauge and four satellite products at mean monthly scales.
3.2. Comparative Analysis of the Products
3.2.1. Statistical Performance
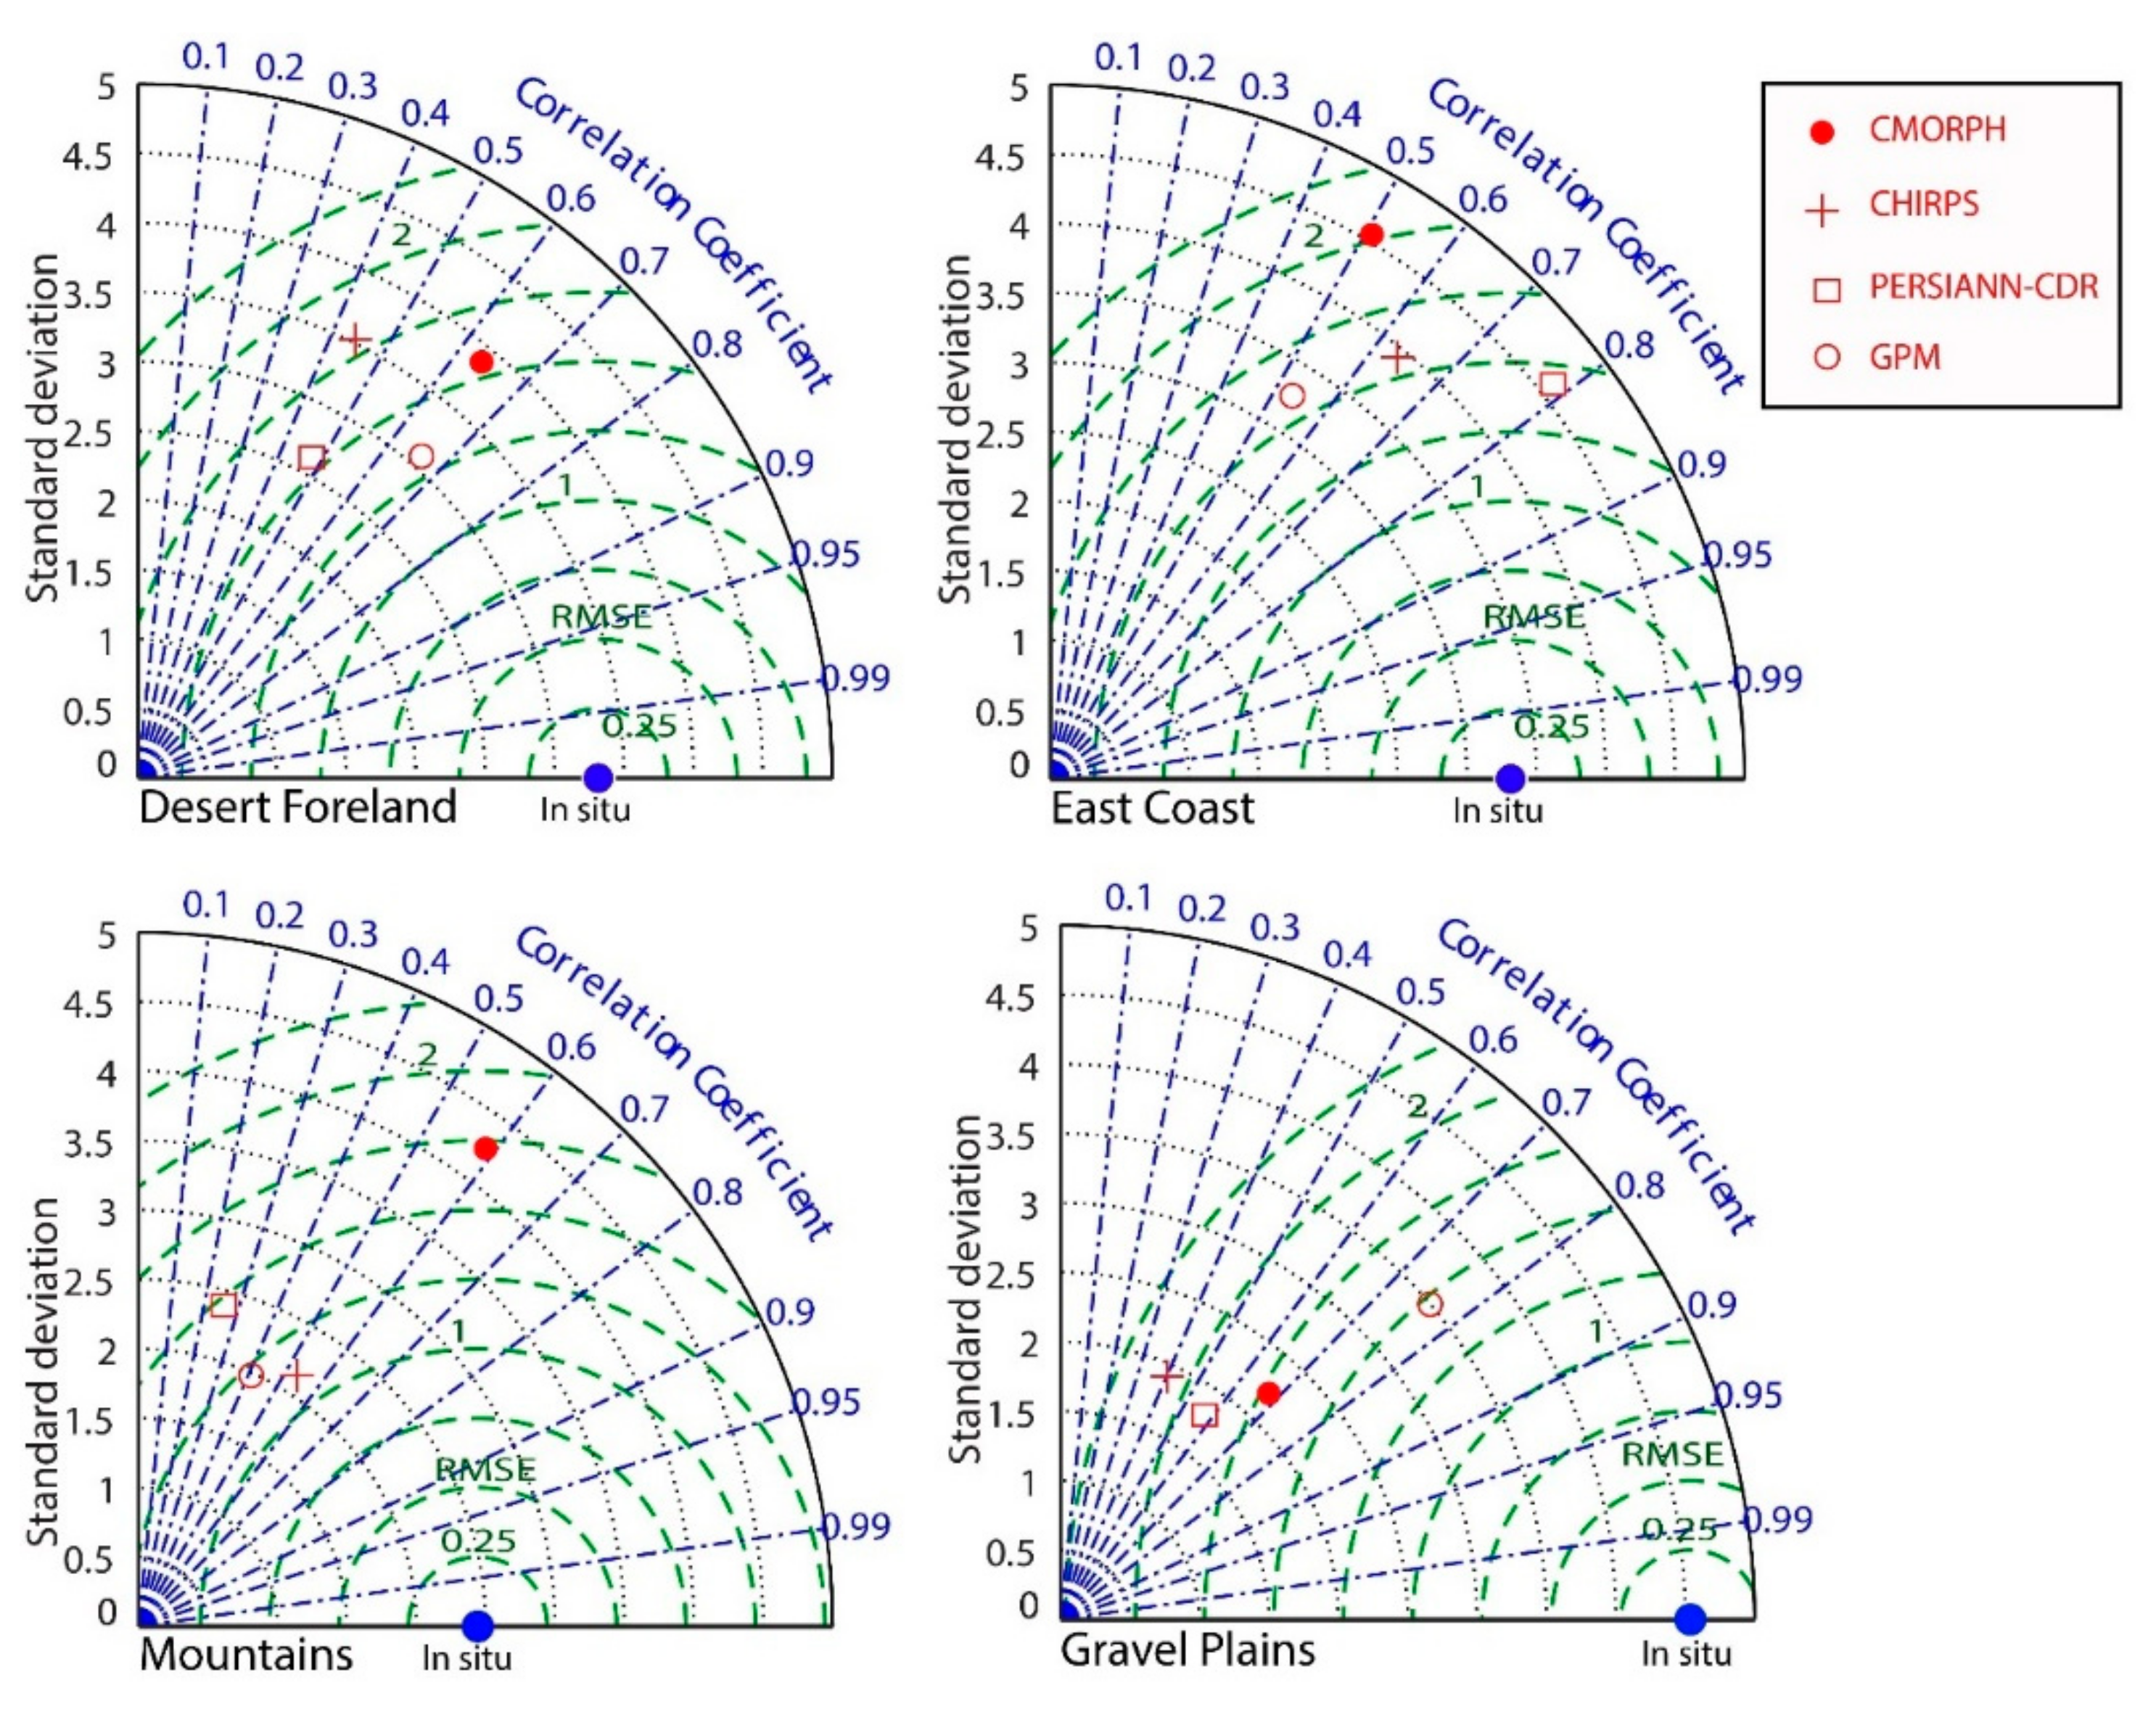
A Taylor diagram [82] provides an effective method for summarizing multiple statistical tools in a single figure to showcase the statistical performance of prediction models. Figure 6 is developed by calculating CC, RMSE, and Standard Deviation (SD) to assess the performance of satellite products over different regions of the UAE.
Four different plots were developed for the four climatological regions. GPM-IMERG showed the highest CC in the Gravel Plains, while in the Mountain area, it showed the lowest value of 0.4. CMORPH showed the best agreement with the gauge data in the Gravel Plains in line with GPM-IMERG and the least agreement on the East Coast. Similar behavior was shown by CMORPH in the Desert Foreland and Mountains where the CC values were above 0.6. However, on the East Coast, the CMORPH product exhibited the lowest CC value of 0.5. Contrarily, the PERSIANN-CDR was the best among all the products on the East Coast, although it underperformed in terms of quantitative analysis for those regions. This might be attributed to the strong post-processing methodological framework in the development of CDR products.
CHIRPS performed equally well in all regions except the East Coast, where it was slightly better than CMORPH and GPM. RMSE values were between 1 and 2 mm for all products in the Desert Foreland and East Coast. For the other two regions, the values were slightly higher than 2 mm. Overall, GPM-IMERG showed the least error among all products. The statistical performance measures indicated that GPM-IMERG and CMORPH are comparatively better in terms of correlation and prediction errors with the gauge observations.
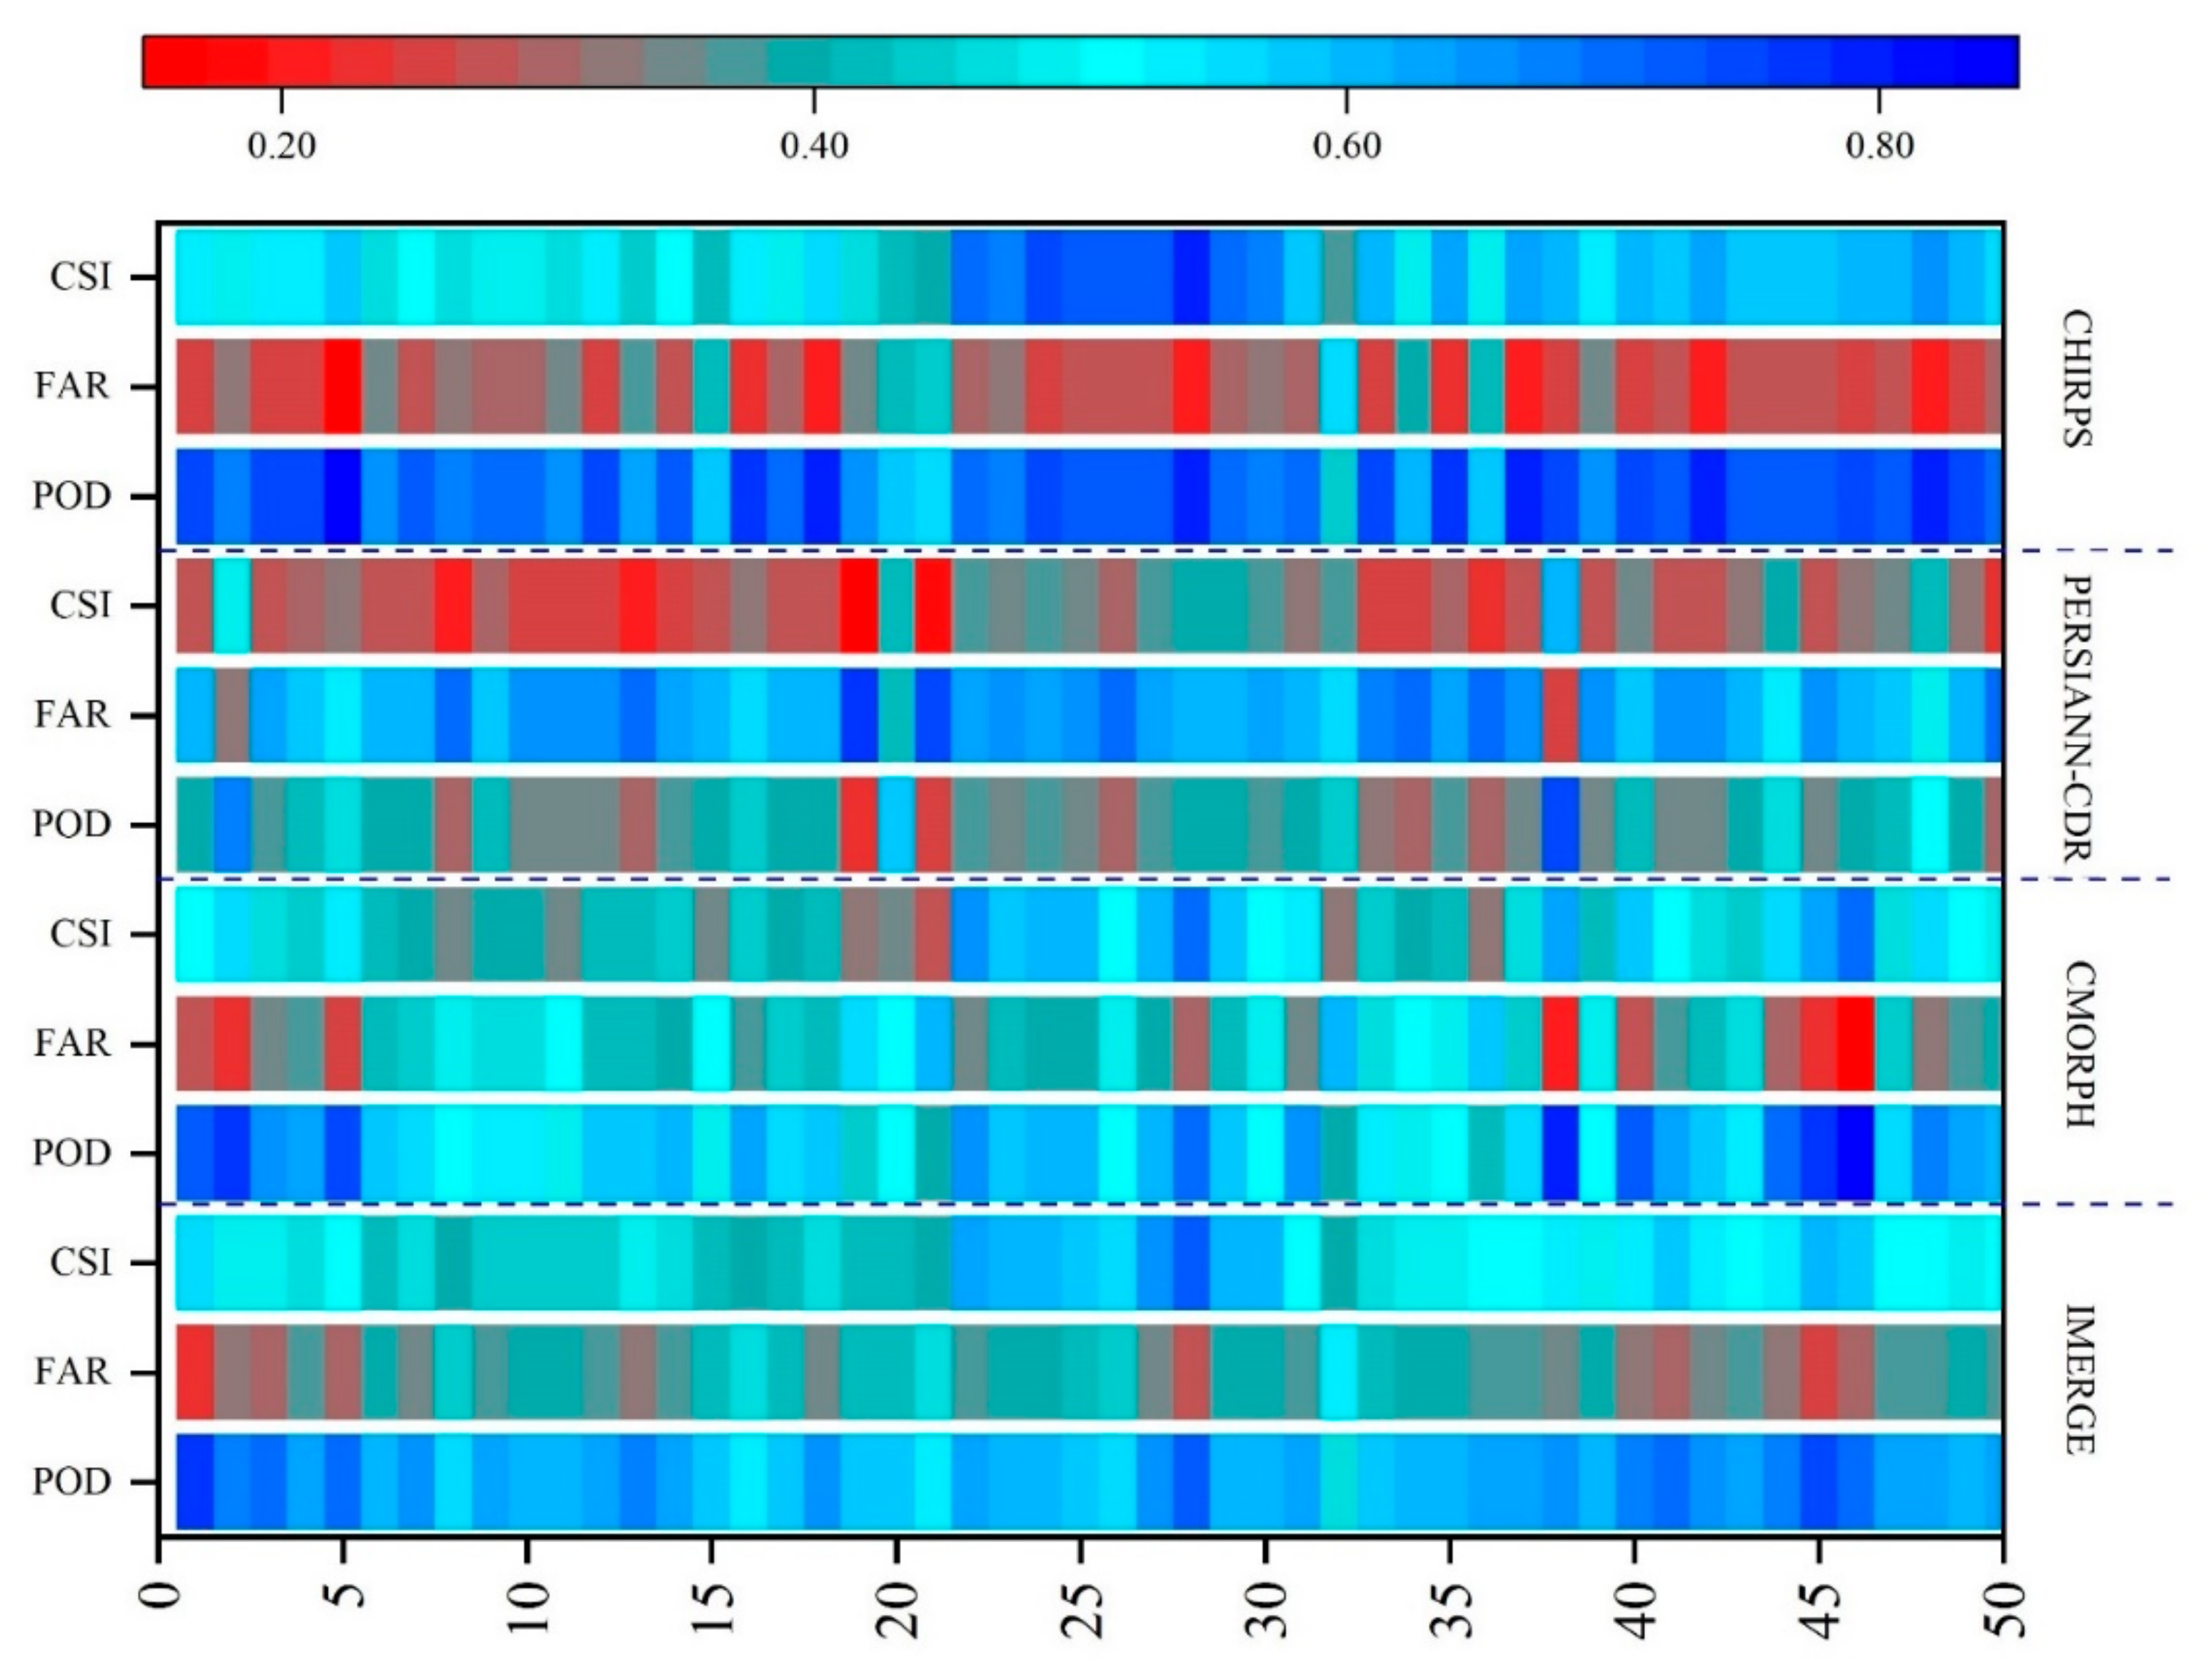
3.2.2. Detection Accuracy
The most common contingency measures were utilized to examine the efficacy of the products in capturing rainfall events. POD, FAR, and CSI were calculated based on Equations (1)–(3) and Table 2. POD describes the ability of the model to capture the real event as recorded by the gauge (Hit), whereas FAR is the probability of detecting a false event that has not been recorded by the rain gauges. Figure 7 shows the spatial distribution of the POD, FAR, and CSI across the UAE. The GPM-IMERG product successfully captured the actual rainfall events; however, the numbers were relatively low as compared to previous studies, where IMERG exhibited comparatively high values of POD [69,71]. This might be associated with the averaging effect as the time series data in the current study are longer than those of previous studies. The FAR value for GPM-IMERG was generally similar for most of the stations with an overall good CSI value ranging from 0.5 to 0.7.
CMORPH presented a wider range of POD values, with the best correlation for northeastern stations. The range of FAR for CMORPH was also wider as compared to IMERG. Again, CHIRPS provided the best POD values in almost all stations, reaching a maximum value of 0.9, while FAR values were substantially lower with most stations having values in the range of 0 to 0.2. Moreover, the PERSIANN-CDR displayed lower values of POD indicating that the product failed to capture true events as compared to other products. As a result, FAR values were also high for the PERSIANN-CDR. CSI values of all products were between 0.4 and 0.6, except the PERSIANN-CDR, which showed a value of less than 0.3 for most stations.
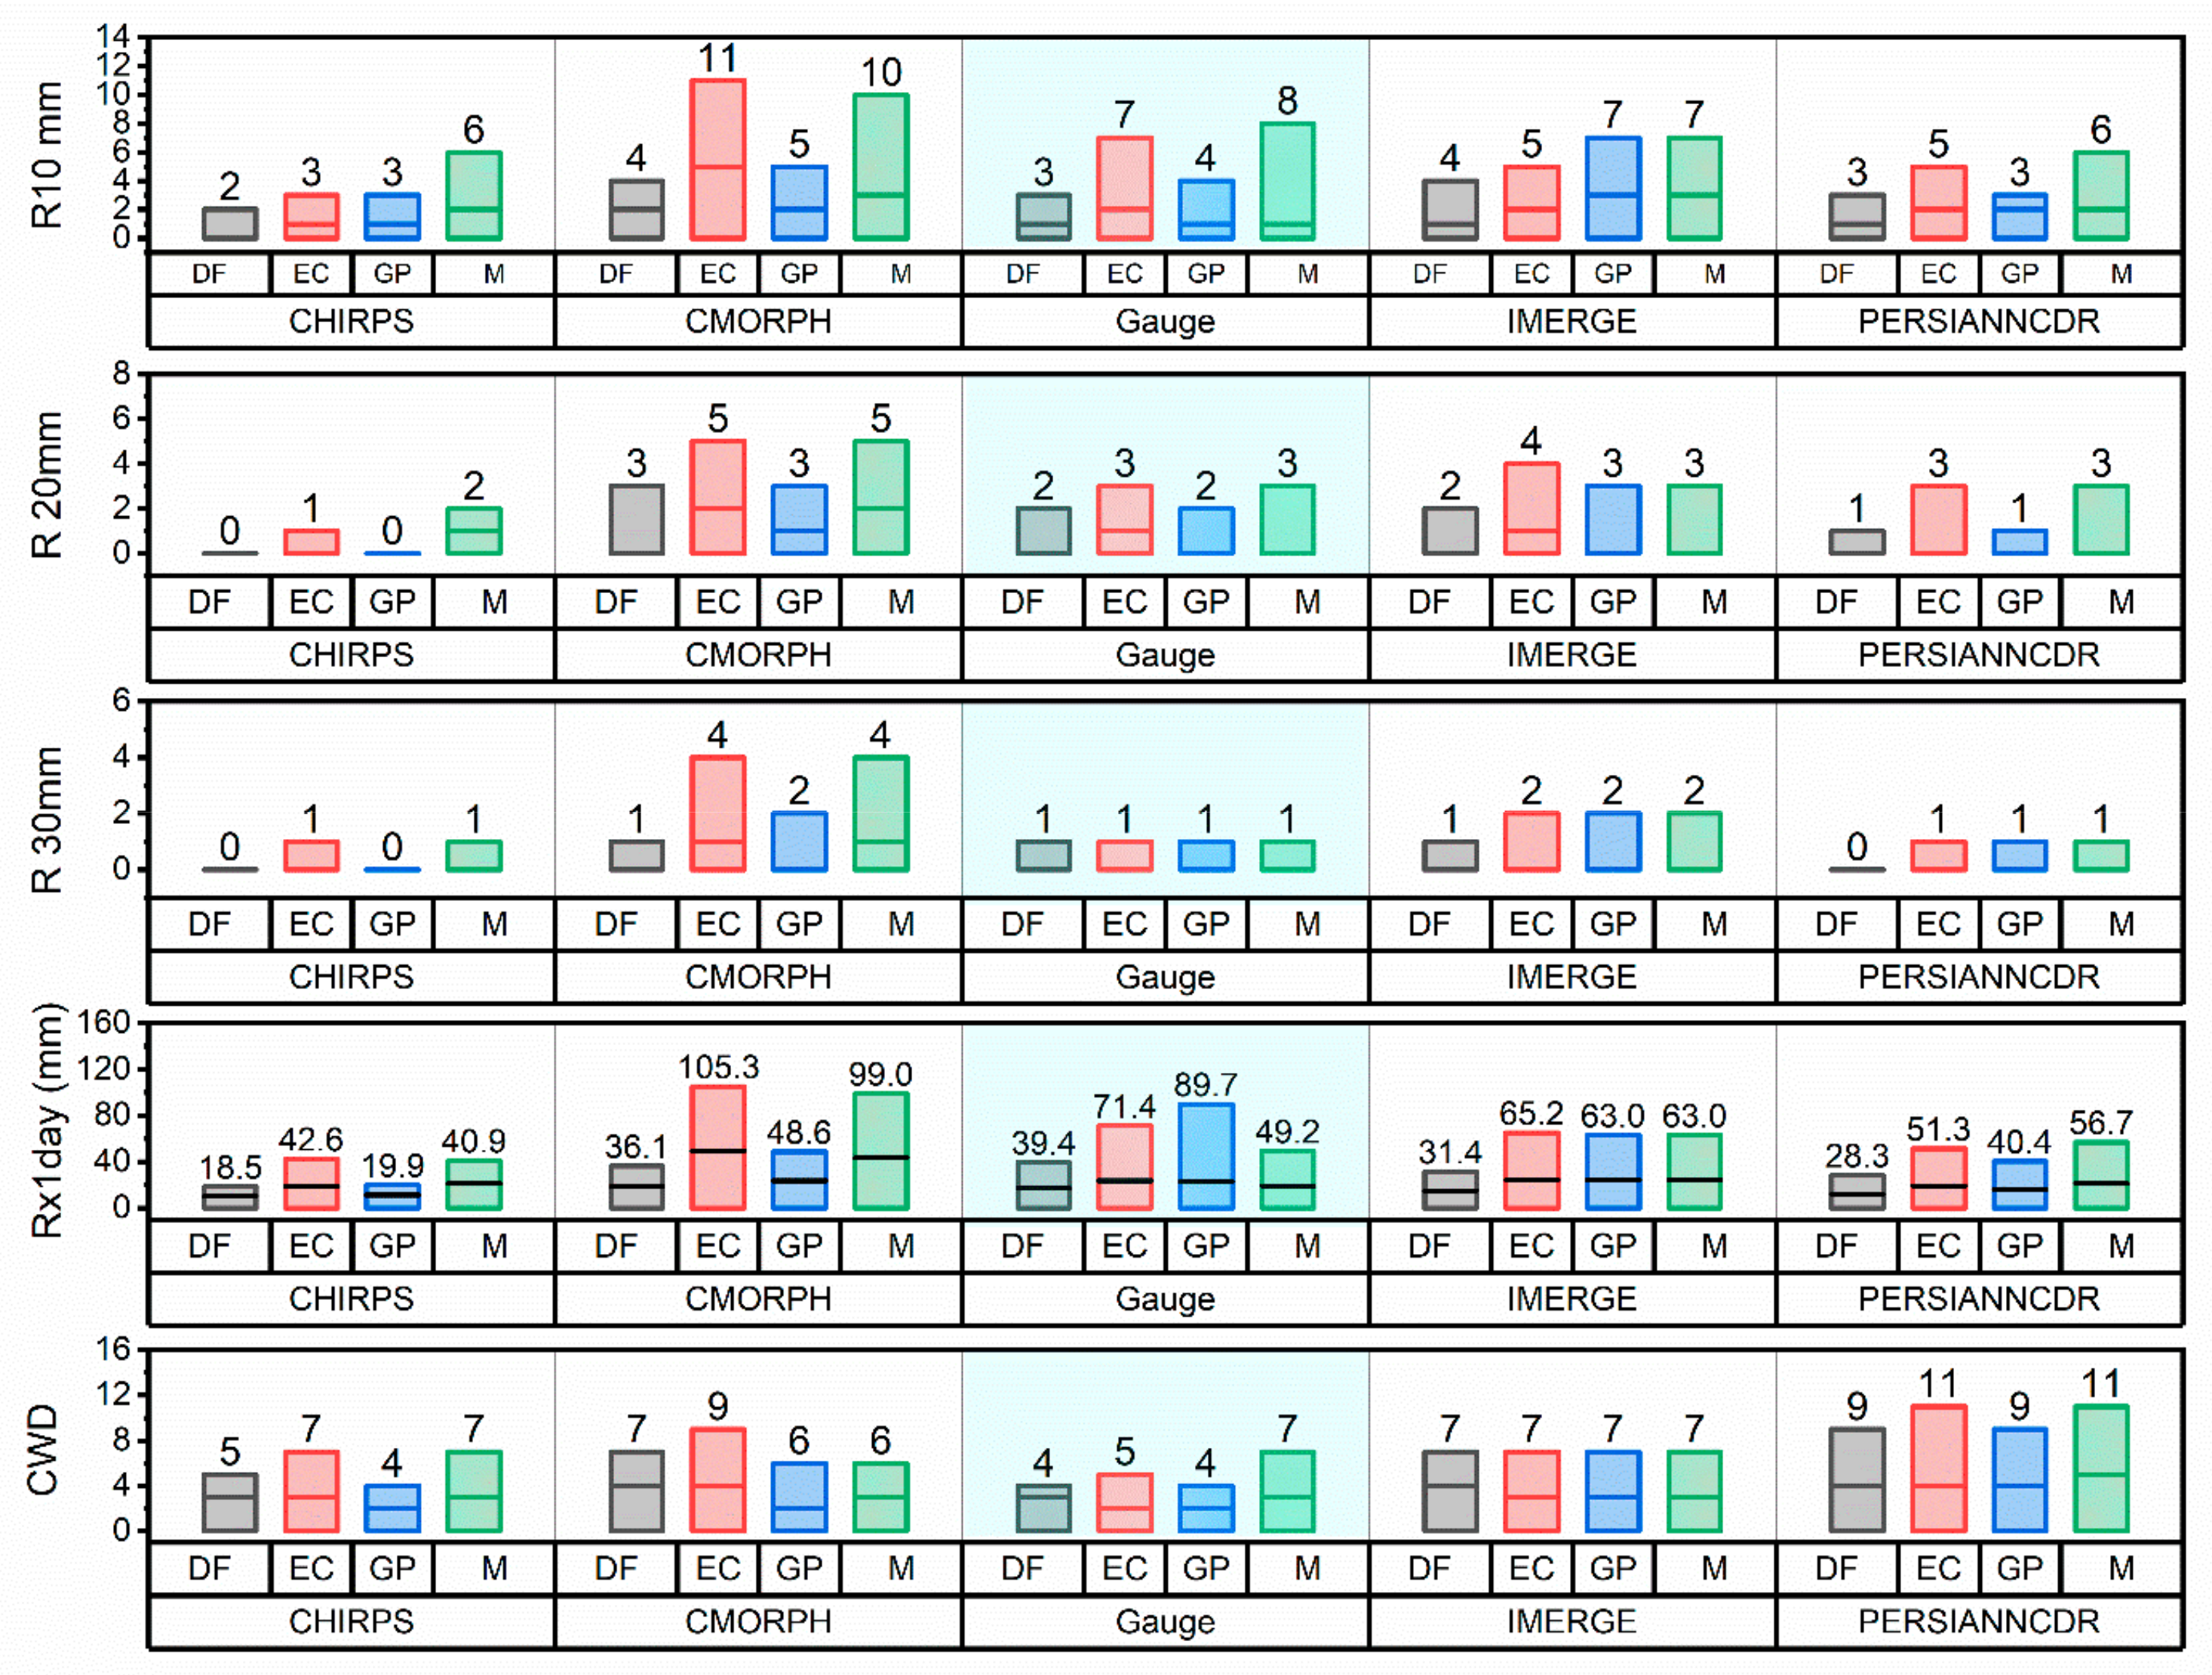
3.3. Rainfall Analysis Based on Climate Indices
The analysis was carried out based on the four climatological regions. Figure 8 maps the results of the five precipitation indices for rain gauges and satellite products. The figure reveals that CMORPH surpasses its counterparts in all five indices, especially on the East Coast and Mountains. However, IMERG is comparatively consistent with the gauge results. The results for the gauge rainfall data reveal that all regions have very few days with rainfall amounts of more than 20–30 mm. The products agreed with the gauges except for CHIRPS which under-estimated all indices. It should be noted that the spatial and temporal averaging of rainfall data might reflect relatively lower values for all the indices. The daily maximum average value in a year was observed in Gravel Plains for the gauge data, followed by East Coast. IMERG provided comparatively close measurements to the gauge values for Rx1 day analysis. The mountainous region experienced the maximum consecutive wet days (7), followed by the East Coast. For this index, the PERSIANN-CDR over-estimated and recorded CWD as high as 11 on the East Coast and Mountains. CHIRPS provided almost similar values as of the gauge data for CWD.
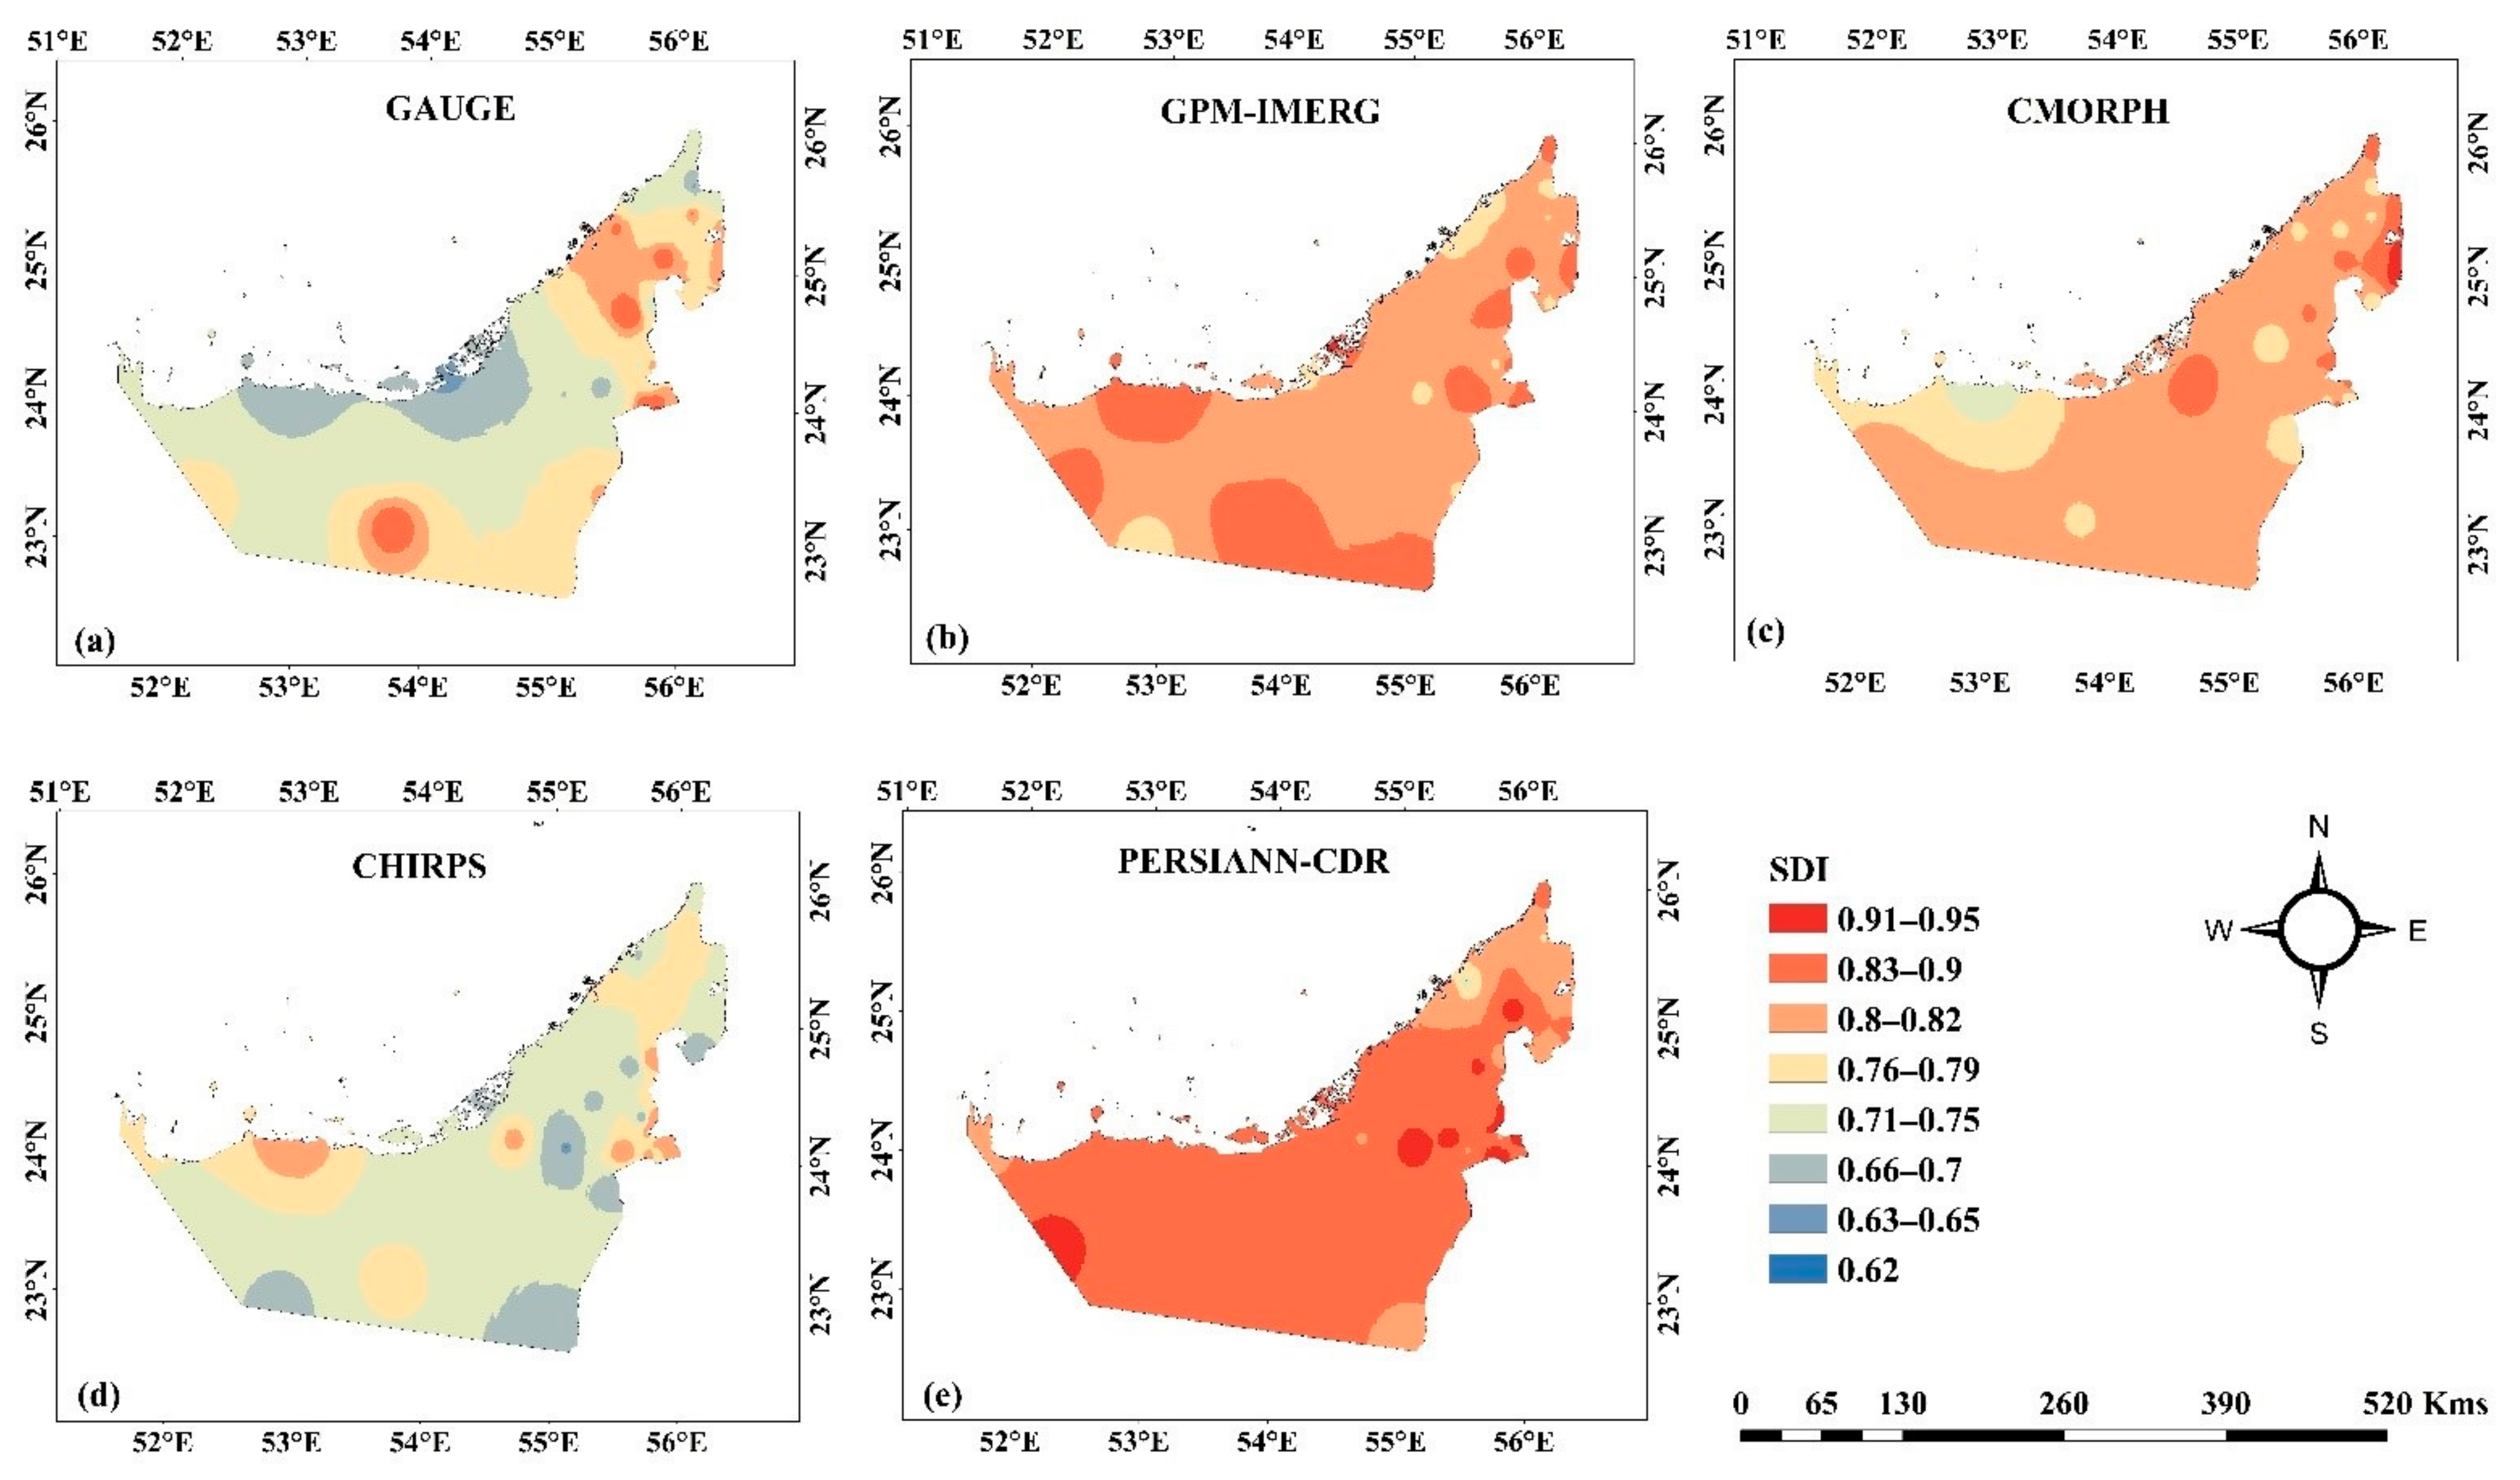
3.4. Precipitation Variability
The Shannon Diversity Index was utilized to identify the evenness or precipitation variability over the UAE for the period 2004–2020. For the months having zero precipitation, the value was replaced with a small value (0.01) to avoid mathematical errors as the formula takes the logarithmic of the monthly rainfall values. The range of the Shannon index usually lies between 1.5 and 3.5. However, after standardization, it ranges between 0 and 1. A high index value shows a high precipitation variability and vice versa.
Figure 9 shows the spatial distribution of the precipitation variability over the UAE for gauge rainfall and satellite products. First, the ranges for all the plots reveal that the UAE experiences high variability of rainfall across the country. The lowest index value was higher than 0.6 for all products and gauge data. Interestingly, all products were consistent for the upper value of the index as compared to gauge data. IMERG, CMORPH, and CHIRPS exhibited spatial evenness in rainfall variability, whereas the PERSIANN-CDR showed higher variability, approaching a value of 0.9. However, the value of the index decreases rapidly in the northern mountainous region. CHIRPS showed the highest variability in the Al-Ain region and for some gauges located in the western area. All products displayed maximum rainfall variability in the Al-Ain region, most of the western area, and in some cases, the East Coast as well. IMERG, CMORPH, and the PERSIANN-CDR over-estimated the concentration values and the index was mostly higher than 0.75. It can be inferred that most of the products performed well in the variability analysis with some exceptions. For example, the lower index values were only captured well by CHIRPS.
3.5. Precipitation Concentration Index (PCI)
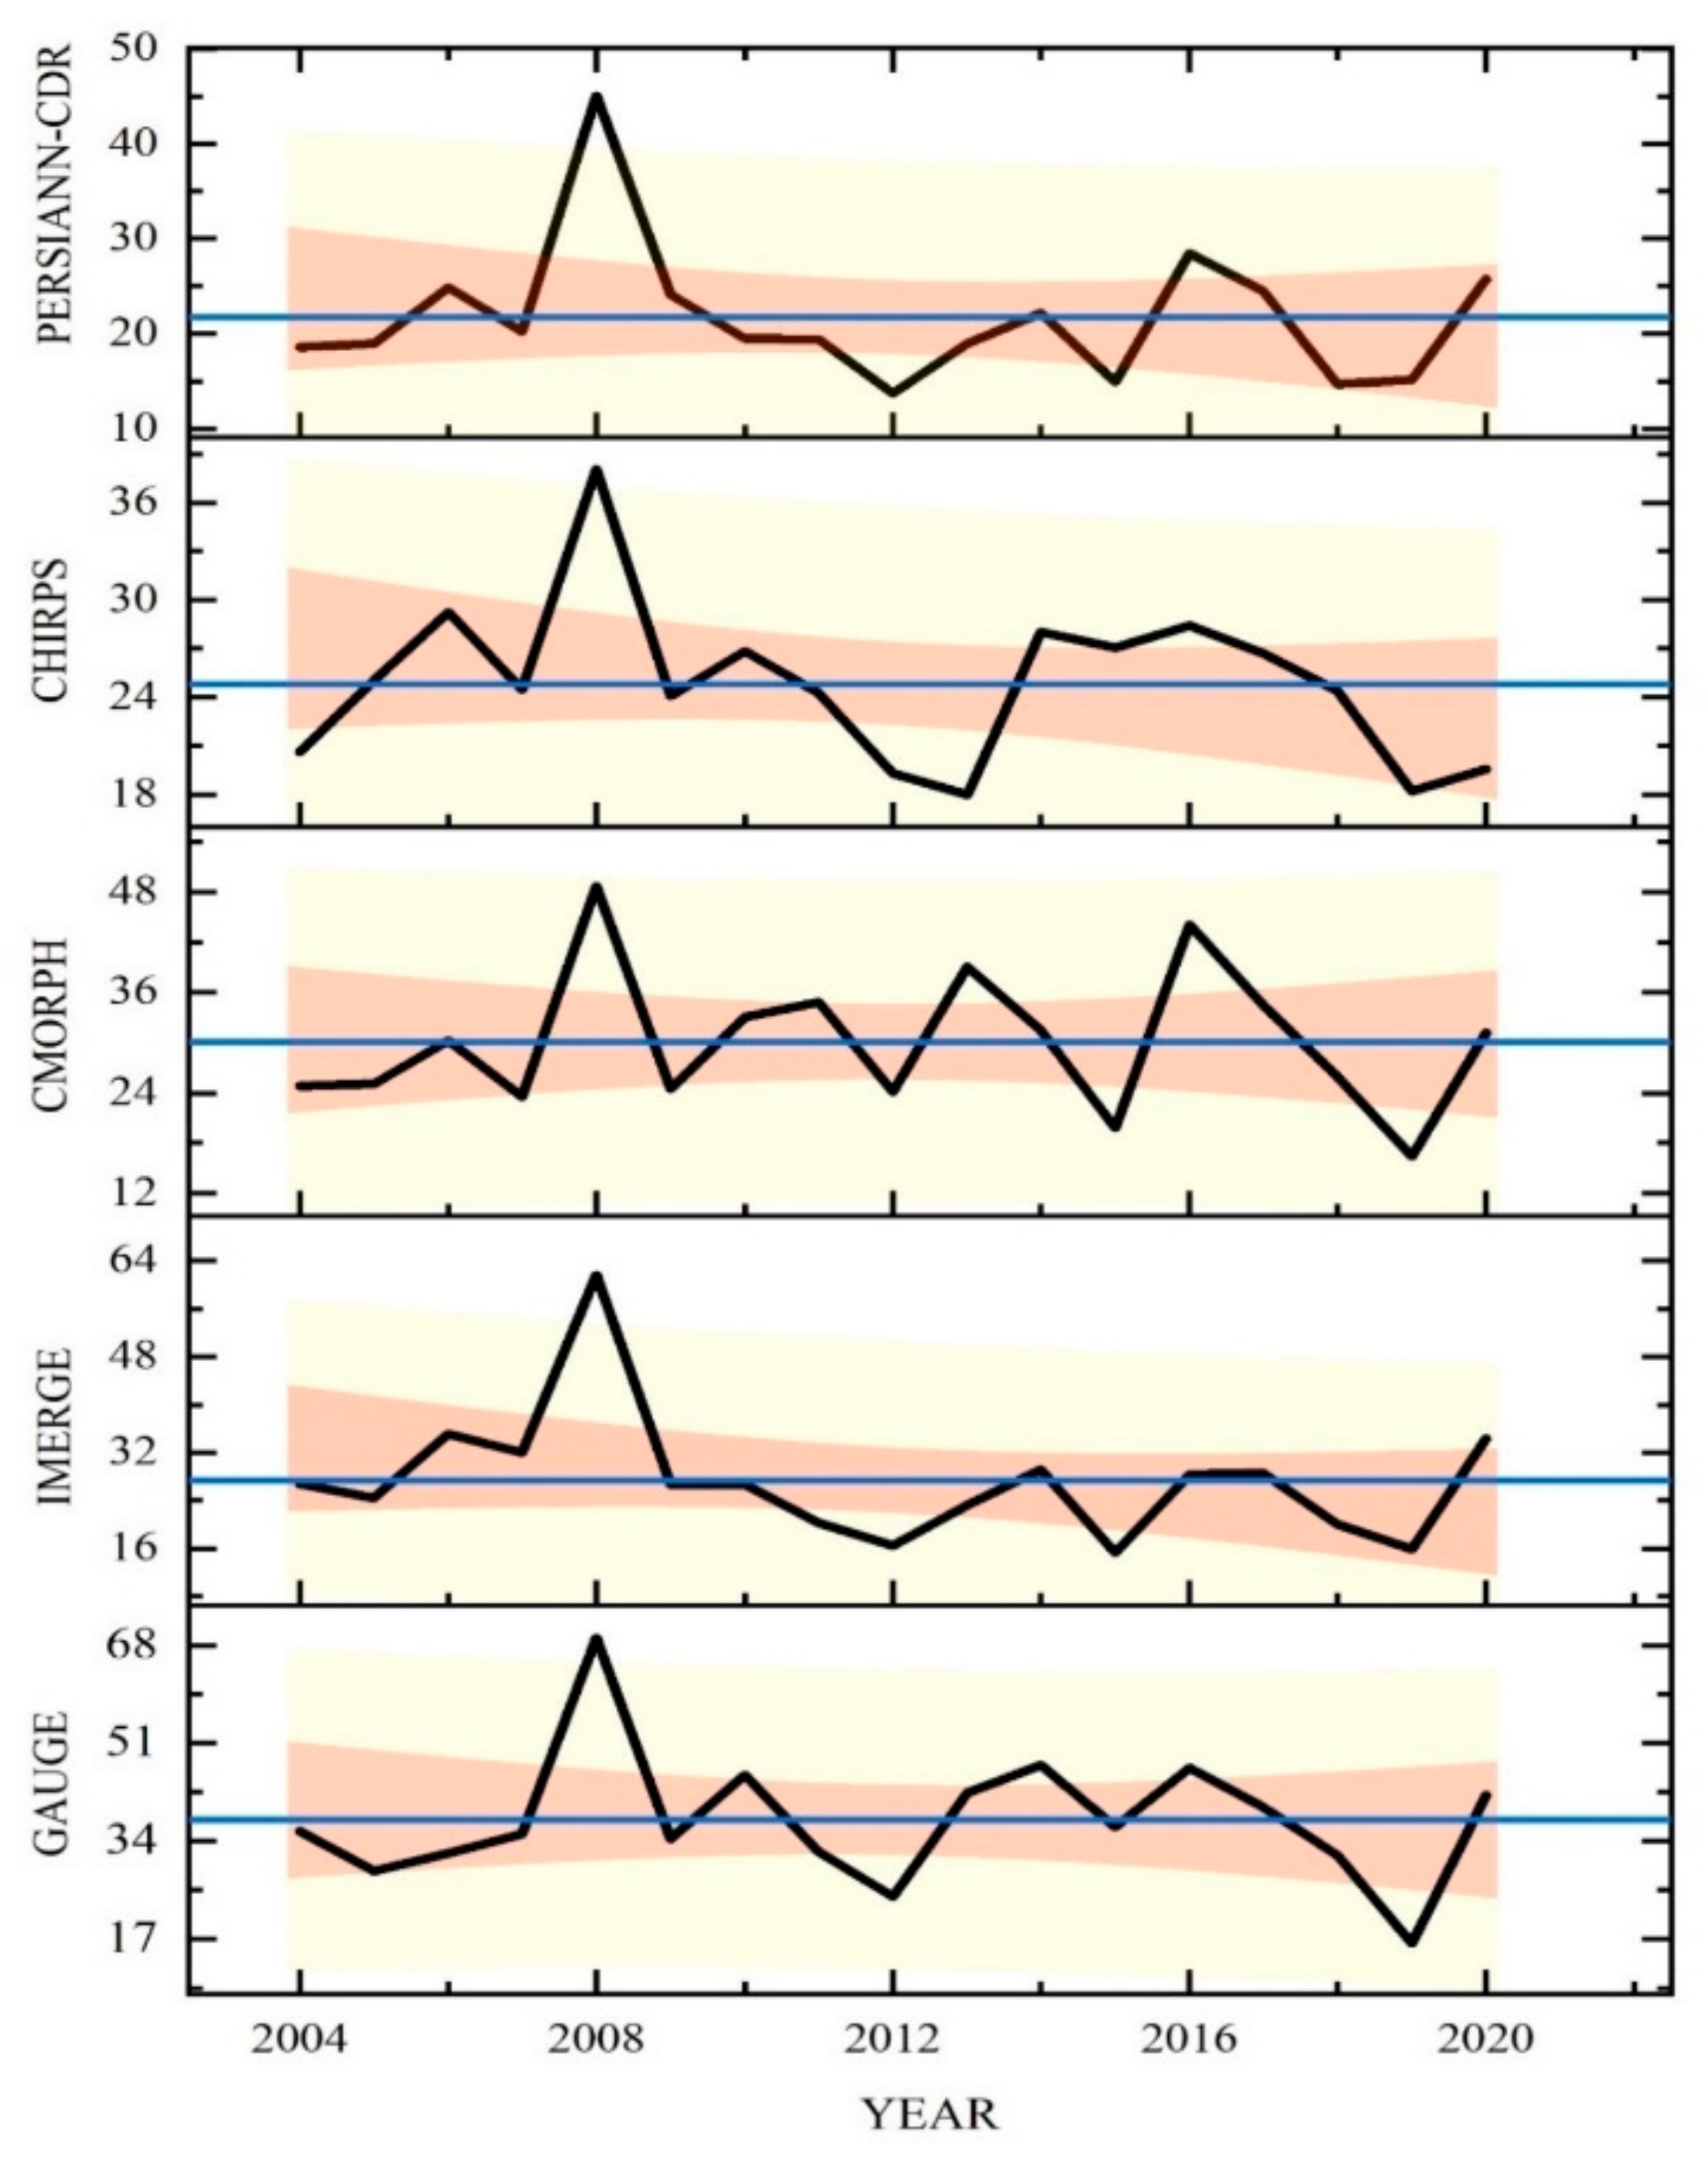
The Precipitation Concentration Index provides a useful tool to analyze temporal rainfall distribution [83,84,85]. The results for the PCI are represented in Figure 10. The figure shows a visual comparison between rain gauge data and satellite products. It can be observed that the rainfall concentration in the UAE is extremely irregular, according to the ranges defined by [76]. Overall, the satellite products are consistent with in situ observations, with some exemptions in a few years (2010 and 2015). Except for CMORPH, the confidence bands of all the products displayed a decreasing trend during the study duration, which is in agreement with the gauge observation. The gauge observations depict that the year 2008 showed an extremely irregular precipitation distribution with the highest PCI value. Interestingly, this behavior was captured by all products; however, the PCI values were relatively lower than the gauge PCI. In terms of temporal trend and PCI values, the IMERG product closely followed the gauge PCI values. The other three products exhibited lower PCI values as compared to gauge data. The wide yellowish bands in Figure 10 represent the maximum/minimum value of the PCI which could ever occur based on rainfall data used in calculating the PCI. IMERG and gauge showed similar PCI values throughout the study period, while CHIRPS displayed relatively low PCI values as compared to its counterparts. Overall, the studied products could provide promising results while analyzing the precipitation concentration in the UAE.
4. Discussions
The discrepancies between measured rainfall data at gauge stations and satellite products may come from different scales [86,87]. While satellite precipitation products represent an average estimate of the specific pixel’s or grid’s precipitation, the rainfall gauge station provides a point estimate [88]. Due to the large regional variability of rainfall, this disparity in the spatial scale of the data constitutes a significant contributor to discrepancies between the estimations of satellite products and ground observations [1]. This hypothesis may provide an argument for the better performance of products with comparatively higher spatial resolution. For instance, in the present study, the highest-resolution product was CHIRPS, having a 5 × 5 km spatial resolution, followed by CMORPH and GPM-IMERG, having an 8 × 8 km and 10 × 10 km spatial resolution, respectively, while the PERSIANN-CDR has a 25 × 25 km spatial resolution. This prognosis becomes true when the total annual average rainfall maps (Figure 3) are analyzed for all products. CHIRPS provided a much closer spatial distribution to the gauge data, while the PERSIANN-CDR performed the least. The daily averaged maps showed discrepancies, as seen in Figure 4, where both CMORPH and IMERG over-estimated the gauge data in most parts of the country. CHIRPS showed over-estimation only in the eastern part of the Abu Dhabi emirate, while it under-estimated the rainfall in the western part of the country. Figure 3 and Figure 4 demonstrate that CHIRPS, CMORPH, and IMERG performed better on annual scales rather than daily scales. This can be ascribed to the fact that as the data accumulate on the temporal scale, the extent of error becomes marginalized [28] and, therefore, the performance of the products becomes reasonable at higher temporal scales.
Similarly, monthly average rainfall revealed a good match of all products with gauge data (Figure 5). However, in February, the PERSIANN-CDR was equally on par with the gauge data, while all the other products over-estimated the monthly average. The summer months were almost consistent in terms of rainfall quantity, which signifies that all the four products are efficient in capturing low rain (especially during July–September). Overall, the products yielded higher values than the gauge data for wet months, except for the PERSIANN-CDR. Some researchers also characterized the best precipitation products for each month [68]; however, this can only be viable to marginalize the products based on months for particular gauge stations. The generalization of this hypothesis is not feasible, as the purpose of identifying the best suitable alternative products to gauge data is usually to develop long-term databases.
The comparison of statistical measures including correlation coefficient and RMSE (Figure 6) over the four different climatological regions of the UAE revealed the performance of all the products. In the Desert Foreland part, which comprises the largest portion of the country’s area and the maximum number of gauge stations, IMERG was better in terms of error measurement, while CMORPH and IMERG showed the best correlation coefficient. For Gravel Plains and Mountains, IMERG and CMORPH performed well, while CHIRPS and the PERSIANN-CDR did not provide good rainfall estimates. The PERSIANN-CDR displayed the best agreement with the gauge data on the East Coast, showing a correlation coefficient close to 0.8. CMORPH was the least performing, with a value of 0.5.
The product’s efficiency in capturing events is usually measured with various contingency measures [19,42,71], which include the Probability of Detection (POD), False Alarm Ratio (FAR), and Critical Success Index (CSI). Average values, as well as station-based values of these measures, are important in understanding the event-capturing ability of these products. Figure 7 indicates that CHIRPS, CMORPH, and IMERG were best at capturing the events. Although it is not necessarily true that higher POD values should yield lower FAR values and vice versa, the FAR values for almost all the stations were relatively low for CHIRPS followed by CMORPH and IMERG. This can again be associated with the finer resolution of these three products that enabled them to capture the true events. The PERSIANN-CDR missed many localized events owing to its coarser resolution as compared to the other products. Therefore, the contingency measures confirm the correlation between the products’ resolutions and their accuracy.
Previous investigations focused on the consistency analysis of satellite products by exploiting various statistical measures and only discussed the trend analysis of the products [21,58,69,71]. In this study, climate indices, Precipitation Concentration Index, and Shannon Diversity Index were incorporated to thoroughly examine the performance of the selected products. The findings of all five precipitation indicators were plotted over various geographic areas and for gauge and satellite products, as seen in Figure 8. CMORPH outperformed its counterparts, particularly in the East Coast and Mountains. IMERG, however, was more consistent with the gauge results. The gauge data revealed very few days with a rainfall intensity higher than 20 to 30 mm. All products displayed a similar trend except for CHIRPS, which under-estimated all indices. It should be noted that all the indicators may have provided significantly lower values because of the spatial and temporal averaging of rainfall data. Gravel Plains had the highest daily average value over a year for the gauge data, trailed by the East Coast. The gauge values for the Rx1 day analysis and the IMERG products were relatively close. The East Coast followed the Mountains region had the highest consecutive wet days (seven). The PERSIANN-CDR over-stated this index and recorded CWD in the East Coast and Mountains as high as 11. The values from CHIRPS were almost identical to those from the CWD gauge. In terms of five selected climate indices, IMERG performed better than the other products.
The results of the Shannon Diversity Index and the Precipitation Concentration Index further classify the products as behavioral or non-behavioral. Figure 9 shows that the ranges of all the plots in the UAE varies greatly across the region. The lowest index value for all the products and gauge data was higher than 0.6. Contrary to gauge observations, all the products exhibited consistency for the upper index value. The geographic evenness of rainfall variability was shown by IMERG, CMORPH, and CHIRPS, but the PERSIANN-CDR exhibited more variability, with a value close to 0.9. The Desert Foreland and Mountain regions, however, had a sharp interface, and the value of the index was lower in the northern Mountain region. In a few gauges located in the western region and Al-Ain region, CHIRPS revealed the largest variability. Overall, the products showed precipitation evenness in agreement with the gauge data, except for the north-western part of Abu Dhabi, where the satellite products showed relatively higher variability as compared to the gauge data. Temporal distribution of precipitation provides useful information to assess the long-term trends and seasonal precipitation [85]. The results of PCI present the temporal variation in rainfall concentrations. The PCI analysis revealed that IMERG displayed the temporal distribution of the precipitation concentration with a minimum error as compared to gauge values. The highest PCI values were observed in the year 2008, which was captured accordingly by all the products. CMORPH, CHIRPS, and the PERSIANN CDR under-estimated the highest value. Figure 10 showed a declining trend in PCI values which was closely imitated by the products as well. Hence, the results indicated that while the selected precipitation products can be utilized for precipitation concentration analysis, IMERG provides better results for the case of the UAE.
5. Conclusions
Unlike other investigations, this study considered a four-grid-point neighboring weighted average approach to extract the satellite precipitation corresponding to the gauge station and accounted for the spatial heterogeneity of the study area. The extreme precipitation indices were calculated and analyzed for the UAE to study the ability of the satellite products in simulating precipitation extremes. In addition, the precipitation diversity and concentration were analyzed explicitly to better understand the precipitation regimes.
Four satellite precipitation products, namely GPM-IMERG, CMORPH, CHIRPS, and the PERSIANN-CDR, were considered to evaluate their effectiveness in capturing rainfall consistency, variability, and concentration over the UAE. The records of 17 years of daily data (2004–2020) were utilized for the analysis over the whole country by using rainfall data from 50 gauge stations as ground truth references. Various statistical, contingency, and precipitation indices were calculated to determine the satellite precipitation product performance over various domains. In addition to the daily analysis, the products were investigated on monthly and annual scales to further validate their performance.
The CC and RMSE results revealed that CHIRPS performed equally well in all regions, except for the East Coast, where it performed slightly better than CMORPH and IMERG. Following GPM-IMERG, CMORPH demonstrated the best consistency in the Gravel Plains and the least agreement in the East Coast. A similar agreement was seen in the Mountains and Desert Foreland, where the correlation was between 0.5 and 0.7. The RMSE values of all products for Desert Foreland and East Coast products ranged from 1 mm to 2 mm, while the RMSE values for the other two regions were slightly greater than 2 mm. Overall, GPM-IMERG had the lowest error rate of all the products in most of the regions. As a result, GPM-IMERG and CMORPH are deemed to be superior in terms of correlation and prediction errors. CHIRPS showed the highest POD values, followed by IMERG and CMORPH, while PERSIANN-CDR demonstrated the least POD values. Similarly, CSI values for all the stations was between 0.4 and 0.6, except the PERSIANN-CDR, which showed much smaller CSI values (less than 0.2 for most stations). The False Alarm Ratio was the least for CHIRPS and similar for the other three products.
The analysis of extreme precipitation indices revealed that GPM-IMERG was better in capturing the Rx1 day, R10 mm, and R20 mm, while it over-estimated the extreme index of R30 mm. In terms of consecutive wet days (CWD), CHIRPS provided similar results with the gauge data, while the PERSIANN-CDR over-estimated the CWD. For almost all the five indices, CMORPH was over-estimating rainfall as compared to the gauge data. The results for the precipitation variability and concentration revealed that both IMERG and CHIRPS performed better than the other products in displaying the spatial evenness of the rainfall and the temporal variation.
Previous studies did not discuss at length the post-processing of a satellite-based data set. The focus remained on their accuracy based on spatial and temporal resolution. However, each product is unique in terms of the techniques and processes used for post-processing. Although the CHIRPS product has the finest spatial resolution and CMORPH produces half-hourly estimates, IMERG demonstrated promising ability, especially in analyzing the rainfall evenness and precipitation concentration variation. Therefore, it is suggested that the studies focusing on satellite precipitation products should thoroughly investigate their applicability to various hydro-climatological measures in addition to finding their correlation, error measures, and overall trend.
The finer temporal and spatial resolution of the remote sensing satellite products can augment the ground observations for various hydro-climatological studies. One of the major limitations of satellite products is the availability of a limited temporal domain. Detailed statistical analysis should be carried out when longer records are available for these products. The overall applicability of these products is promising for arid regions, apart from the apparent over-estimation, especially for low rainfalls. The results of the study can be utilized to perform hydro-climatological forecasts and develop sustainable policies which were otherwise limited due to the unavailability of dense rain gauge stations in dry and regions. The future aspects of this study are to minimize the bias from satellite products by incorporating information from various climatic parameters, such as temperature and humidity, and to develop a consistent, grid-based, and long-term rainfall database for the study area.
Author Contributions
Conceptualization, F.B. and M.A.; methodology, F.B.; software, F.B.; validation, M.A., H.C., and M.S.; formal analysis, F.B. and M.A.; investigation, H.C. and F.B.; resources, M.A. and M.S.; data curation, F.B. and M.S.; writing—original draft preparation, F.B., M.A., and M.S.; writing—review and editing, M.S. and H.C.; visualization, F.B. and H.C.; supervision, M.S. and H.C.; funding acquisition, M.S. All authors have read and agreed to the published version of the manuscript.
Funding
This research work has been funded by National Water and Energy Center of United Arab Emirates University, Al Ain, UAE (Project fund code G00003559).
Data Availability Statement
The satellite data used in the research were obtained from the respective websites of the satellite products, which is publicly available. The rain gauge observations were obtained from the National Center of Meteorology (NCM) of the UAE and cannot be provided publicly.
Acknowledgments
The first author acknowledges the College of Graduate Studies of United Arab Emirates University for providing a graduate fellowship to conduct PhD research. The authors also acknowledge National Center of Meteorology (NCM) of the UAE for providing the rain gauges data.
Conflicts of Interest
The authors declare no conflict of interest.
Appendix A

Table A1.
Station-based rainfall statistics based on total monthly rainfall values for the study area for the selected time period (2011–2020).
Table A1.
Station-based rainfall statistics based on total monthly rainfall values for the study area for the selected time period (2011–2020).
| Stations | Mean | SE Mean | StDev | Var | CoefVar | Min | Q1 | Median | Q3 | Max | Range | IQR | Skewness | Kurtosis |
|---|---|---|---|---|---|---|---|---|---|---|---|---|---|---|
| Abu Al Abyad | 48.2 | 18.4 | 63.7 | 4061.7 | 132.13 | 0.0 | 0.0 | 20.6 | 89.6 | 194.6 | 194.6 | 89.6 | 1.33 | 1.09 |
| Abu Al Bukhoosh | 52.9 | 20.1 | 69.6 | 4838.6 | 131.37 | 0.0 | 0.0 | 12.8 | 127.7 | 187.0 | 187.0 | 127.7 | 1.00 | −0.59 |
| Abu Dhabi | 56.9 | 22.5 | 77.9 | 6064.5 | 136.79 | 0.0 | 0.0 | 19.5 | 121.9 | 216.8 | 216.8 | 121.9 | 1.23 | 0.13 |
| Al Ain | 62.5 | 24.2 | 83.7 | 7012.0 | 133.89 | 1.8 | 16.1 | 22.4 | 91.5 | 255.4 | 253.6 | 75.4 | 1.75 | 1.88 |
| Al Aryam | 27.8 | 12.1 | 42.0 | 1761.6 | 150.84 | 0.0 | 0.0 | 7.9 | 48.4 | 126.8 | 126.8 | 48.4 | 1.63 | 1.83 |
| Al Faqa | 140.4 | 33.7 | 116.8 | 13,631.3 | 83.14 | 25.0 | 41.0 | 101.9 | 237.0 | 354.0 | 329.0 | 196.1 | 0.92 | −0.47 |
| Al Jazeera B.G | 30.7 | 11.1 | 38.4 | 1473.1 | 125.15 | 0.0 | 7.5 | 18.8 | 31.6 | 133.8 | 133.8 | 24.1 | 2.14 | 4.69 |
| Al Malaiha | 86.0 | 24.7 | 85.5 | 7304.7 | 99.33 | 8.8 | 25.4 | 52.9 | 140.4 | 283.3 | 274.5 | 115.1 | 1.37 | 1.22 |
| Al Qattara | 36.0 | 12.4 | 43.0 | 1846.3 | 119.25 | 1.8 | 8.8 | 23.8 | 34.4 | 143.5 | 141.7 | 25.5 | 1.95 | 3.22 |
| Al Shiweb | 125.3 | 49.4 | 171.0 | 29,254.2 | 136.55 | 5.1 | 17.8 | 42.0 | 179.6 | 569.2 | 564.1 | 161.8 | 1.94 | 3.62 |
| Alarad | 89.6 | 30.0 | 104.0 | 10,808.2 | 115.99 | 8.6 | 17.6 | 57.0 | 97.4 | 305.0 | 296.4 | 79.8 | 1.66 | 1.65 |
| Alfoah | 115.6 | 45.1 | 156.1 | 24,355.3 | 135.01 | 0.0 | 12.2 | 57.2 | 163.8 | 491.3 | 491.3 | 151.6 | 1.78 | 2.37 |
| Al Gheweifat | 57.7 | 16.4 | 56.9 | 3232.8 | 98.53 | 0.0 | 0.0 | 62.0 | 105.9 | 161.7 | 161.7 | 105.9 | 0.35 | −1.14 |
| Al Khazna | 80.1 | 35.5 | 122.8 | 15,091.9 | 153.31 | 0.0 | 1.1 | 29.9 | 137.2 | 410.8 | 410.8 | 136.1 | 2.06 | 4.53 |
| Alqlaa | 51.1 | 16.1 | 55.9 | 3126.6 | 109.37 | 3.8 | 12.5 | 16.1 | 110.3 | 165.1 | 161.3 | 97.8 | 1.05 | −0.33 |
| Alquaa | 71.0 | 21.6 | 75.0 | 5619.8 | 105.56 | 5.4 | 13.5 | 25.8 | 133.0 | 210.8 | 205.4 | 119.5 | 0.86 | −0.83 |
| Al Wathbah | 60.5 | 23.4 | 81.2 | 6588.9 | 134.15 | 0.0 | 0.0 | 30.9 | 93.8 | 253.4 | 253.4 | 93.8 | 1.60 | 1.94 |
| Al Tawiyen | 39.2 | 15.7 | 54.4 | 2958.7 | 138.79 | 0.0 | 3.5 | 18.9 | 45.5 | 162.6 | 162.6 | 42.1 | 1.77 | 2.05 |
| Bu Hamrah | 56.9 | 21.8 | 75.4 | 5682.7 | 132.58 | 0.0 | 0.0 | 23.5 | 121.5 | 226.4 | 226.4 | 121.5 | 1.27 | 0.78 |
| Das Island | 53.7 | 26.3 | 91.2 | 8321.7 | 169.82 | 0.0 | 2.6 | 20.0 | 34.3 | 253.0 | 253.0 | 31.7 | 1.97 | 2.44 |
| Damsa | 38.4 | 16.8 | 58.3 | 3399.5 | 151.67 | 0.0 | 0.0 | 14.2 | 50.8 | 166.9 | 166.9 | 50.8 | 1.66 | 1.66 |
| Dhudna | 135.3 | 48.5 | 168.0 | 28,233.6 | 124.18 | 0.0 | 0.4 | 59.7 | 294.7 | 495.1 | 495.1 | 294.3 | 1.24 | 0.35 |
| Falaj Al Moalla | 117.6 | 39.0 | 135.3 | 18,293.0 | 114.98 | 0.0 | 1.7 | 93.4 | 180.1 | 394.8 | 394.8 | 178.4 | 1.20 | 0.51 |
| Hamim | 52.2 | 16.9 | 58.5 | 3426.1 | 112.17 | 0.0 | 1.0 | 27.1 | 96.5 | 173.0 | 173.0 | 95.6 | 0.98 | −0.11 |
| Hatta | 92.0 | 27.8 | 96.2 | 9263.5 | 104.58 | 1.1 | 8.2 | 49.3 | 175.3 | 293.2 | 292.1 | 167.0 | 0.88 | −0.25 |
| Jabal Hafeet | 85.5 | 21.1 | 73.2 | 5354.6 | 85.62 | 2.1 | 27.4 | 63.2 | 137.2 | 248.1 | 246.0 | 109.9 | 1.03 | 0.62 |
| Jabal Jais | 153.7 | 52.5 | 182.0 | 33,105.9 | 118.40 | 0.0 | 0.9 | 112.8 | 228.3 | 526.4 | 526.4 | 227.4 | 0.98 | 0.02 |
| Jabal Mebreh | 84.9 | 35.0 | 121.2 | 14,683.4 | 142.67 | 0.0 | 1.2 | 24.2 | 165.2 | 376.5 | 376.5 | 164.0 | 1.52 | 1.80 |
| Khatam Al Shaklah | 149.3 | 47.9 | 166.0 | 27,564.8 | 111.18 | 0.0 | 24.1 | 94.9 | 225.1 | 551.0 | 551.0 | 201.0 | 1.52 | 2.08 |
| Madinat Zayed | 46.3 | 17.0 | 58.9 | 3467.6 | 127.19 | 0.0 | 1.6 | 27.0 | 76.8 | 191.2 | 191.2 | 75.1 | 1.58 | 2.34 |
| Manama | 44.0 | 14.5 | 50.1 | 2512.2 | 113.87 | 0.0 | 0.0 | 26.1 | 90.0 | 123.1 | 123.1 | 90.0 | 0.55 | −1.42 |
| Makassib | 72.7 | 21.5 | 74.3 | 5525.2 | 102.30 | 8.5 | 21.6 | 41.8 | 130.5 | 248.9 | 240.4 | 108.9 | 1.49 | 1.61 |
| Masafi | 97.4 | 31.1 | 107.7 | 11,603.8 | 110.57 | 1.5 | 15.6 | 39.8 | 206.9 | 295.0 | 293.5 | 191.3 | 1.00 | −0.67 |
| Mezaira | 54.5 | 13.1 | 45.4 | 2061.9 | 83.36 | 0.6 | 15.8 | 49.2 | 70.6 | 157.1 | 156.5 | 54.8 | 1.01 | 1.20 |
| Mezyed | 107.3 | 23.3 | 80.6 | 6494.7 | 75.10 | 13.6 | 47.2 | 95.9 | 135.1 | 301.2 | 287.6 | 87.9 | 1.28 | 1.98 |
| Mukhariz | 75.3 | 20.3 | 70.5 | 4965.9 | 93.56 | 19.8 | 26.1 | 43.4 | 91.7 | 262.5 | 242.7 | 65.6 | 1.98 | 4.21 |
| Owtaid | 62.2 | 18.7 | 64.7 | 4181.5 | 103.93 | 0.1 | 10.4 | 54.4 | 88.6 | 237.1 | 237.0 | 78.2 | 1.89 | 4.80 |
| Qarnen | 41.5 | 15.7 | 54.3 | 2948.6 | 130.82 | 0.0 | 0.0 | 16.8 | 80.0 | 153.6 | 153.6 | 80.0 | 1.16 | 0.16 |
| Raknah | 91.4 | 32.5 | 112.6 | 12,673.4 | 123.22 | 1.5 | 9.4 | 46.3 | 200.6 | 315.5 | 314.0 | 191.3 | 1.24 | −0.06 |
| Ras Ghanadah | 58.3 | 21.7 | 75.1 | 5635.9 | 128.75 | 0.0 | 0.0 | 19.3 | 102.2 | 213.2 | 213.2 | 102.2 | 1.11 | 0.12 |
| Ras Musherib | 25.19 | 8.95 | 31.02 | 962.07 | 123.13 | 0.00 | 0.00 | 8.85 | 47.90 | 96.30 | 96.30 | 47.90 | 1.22 | 0.92 |
| Rowdah | 72.6 | 29.8 | 103.3 | 10,663.2 | 142.17 | 6.4 | 17.6 | 30.0 | 74.2 | 327.2 | 320.8 | 56.7 | 2.02 | 3.11 |
| Saih Al Salem | 66.1 | 24.8 | 85.9 | 7379.2 | 130.04 | 0.0 | 2.3 | 42.7 | 93.9 | 286.4 | 286.4 | 91.6 | 1.80 | 3.33 |
| Sir Bani Yas | 46.4 | 14.9 | 51.7 | 2674.6 | 111.36 | 0.0 | 0.1 | 22.3 | 108.3 | 116.8 | 116.8 | 108.2 | 0.42 | −1.93 |
| Sir Bu Nair | 45.3 | 16.7 | 58.0 | 3366.4 | 128.01 | 0.0 | 0.0 | 7.0 | 104.4 | 143.5 | 143.5 | 104.4 | 0.79 | −1.21 |
| Swiehan | 92.1 | 32.7 | 113.2 | 12,823.3 | 123.01 | 1.0 | 13.0 | 29.4 | 131.5 | 345.4 | 344.4 | 118.6 | 1.51 | 1.35 |
| Um Azimul | 38.4 | 11.1 | 38.5 | 1483.8 | 100.40 | 0.0 | 0.5 | 33.7 | 69.5 | 112.2 | 112.2 | 69.0 | 0.69 | −0.63 |
| Um Ghafa | 57.3 | 17.6 | 60.9 | 3711.3 | 106.38 | 1.7 | 8.4 | 33.3 | 104.8 | 168.1 | 166.4 | 96.4 | 1.01 | −0.37 |
| Umm Al Quwain | 65.9 | 23.3 | 80.8 | 6522.8 | 122.49 | 0.0 | 2.3 | 22.7 | 140.6 | 231.4 | 231.4 | 138.3 | 0.99 | −0.32 |
| Yasat | 37.8 | 13.8 | 47.7 | 2271.7 | 126.23 | 0.0 | 0.0 | 19.1 | 73.7 | 134.9 | 134.9 | 73.7 | 1.04 | −0.07 |
Appendix B
Table A2.
Station-based rainfall statistics based on total annual rainfall values for the study area for the selected time period (2011–020).
Table A2.
Station-based rainfall statistics based on total annual rainfall values for the study area for the selected time period (2011–020).
| Stations | Mean | StDev | Var | CoefVar | Min | Q1 | Med | Q3 | Max | Range | IQR | Skewness | Kurtosis |
|---|---|---|---|---|---|---|---|---|---|---|---|---|---|
| Abu Al Abyad | 34.04 | 37.28 | 1389.91 | 109.54 | 0.00 | 2.80 | 19.40 | 64.75 | 126.40 | 126.40 | 61.95 | 1.08 | 0.56 |
| Abu Al Bukhoosh | 37.3 | 42.4 | 1794.2 | 113.44 | 0.0 | 3.2 | 13.6 | 71.4 | 146.2 | 146.2 | 68.2 | 1.24 | 1.10 |
| Abu Dhabi | 39.9 | 44.6 | 1985.0 | 111.70 | 0.0 | 6.0 | 21.0 | 69.9 | 157.6 | 157.6 | 63.9 | 1.46 | 1.68 |
| Al Ain | 44.1 | 54.4 | 2960.9 | 123.31 | 0.0 | 1.7 | 30.2 | 62.5 | 194.6 | 194.6 | 60.8 | 1.84 | 3.25 |
| Al Aryam | 19.58 | 24.77 | 613.47 | 126.52 | 0.00 | 0.30 | 7.80 | 42.60 | 65.80 | 65.80 | 42.30 | 1.01 | −0.63 |
| Al Faqa | 98.5 | 69.7 | 4863.6 | 70.81 | 0.4 | 41.3 | 96.7 | 169.0 | 222.6 | 222.2 | 127.7 | 0.51 | −1.04 |
| Al Jazeera B.G | 21.64 | 23.73 | 563.18 | 109.66 | 0.00 | 0.00 | 12.60 | 41.05 | 77.80 | 77.80 | 41.05 | 0.94 | 0.13 |
| Al Malaiha | 60.2 | 56.0 | 3137.9 | 93.09 | 0.0 | 16.5 | 42.8 | 103.9 | 203.8 | 203.8 | 87.4 | 1.27 | 1.20 |
| Al Qattara | 24.84 | 37.78 | 1426.96 | 152.07 | 0.00 | 0.30 | 6.60 | 38.40 | 136.40 | 136.40 | 38.10 | 2.02 | 4.13 |
| Al Shiweb | 88.0 | 85.1 | 7236.0 | 96.61 | 0.2 | 25.9 | 60.8 | 134.3 | 327.2 | 327.0 | 108.4 | 1.47 | 2.63 |
| Alarad | 62.6 | 61.7 | 3807.6 | 98.54 | 0.0 | 15.9 | 44.6 | 86.1 | 208.9 | 208.9 | 70.2 | 1.55 | 2.00 |
| Alfoah | 81.2 | 76.8 | 5891.0 | 94.52 | 0.2 | 18.0 | 75.8 | 106.8 | 286.8 | 286.6 | 88.8 | 1.39 | 2.09 |
| Al Gheweifat | 40.7 | 41.4 | 1715.3 | 101.67 | 0.0 | 5.0 | 25.4 | 78.3 | 128.9 | 128.9 | 73.3 | 0.87 | −0.47 |
| Al Khazna | 56.12 | 38.92 | 1514.91 | 69.35 | 0.00 | 22.50 | 50.60 | 88.90 | 134.60 | 134.60 | 66.40 | 0.38 | −0.67 |
| Alqlaa | 35.9 | 52.6 | 2766.9 | 146.59 | 0.2 | 2.2 | 13.4 | 50.1 | 166.2 | 166.0 | 47.9 | 1.88 | 2.73 |
| Alquaa | 49.9 | 68.0 | 4628.7 | 136.28 | 0.0 | 2.8 | 22.4 | 67.5 | 223.2 | 223.2 | 64.7 | 1.65 | 1.72 |
| Al Wathbah | 42.7 | 42.2 | 1781.7 | 98.84 | 0.0 | 3.2 | 24.6 | 79.6 | 121.9 | 121.9 | 76.4 | 0.75 | −0.85 |
| Al Tawiyen | 26.55 | 35.65 | 1270.70 | 134.25 | 0.00 | 1.90 | 17.80 | 39.20 | 139.80 | 139.80 | 37.30 | 2.25 | 5.99 |
| Bu Hamrah | 40.1 | 54.6 | 2977.0 | 135.95 | 0.4 | 6.8 | 16.2 | 64.2 | 219.8 | 219.4 | 57.4 | 2.47 | 7.26 |
| Das Island | 37.8 | 63.6 | 4041.3 | 168.02 | 0.0 | 0.0 | 9.6 | 54.9 | 238.2 | 238.2 | 54.9 | 2.35 | 5.85 |
| Damsa | 27.11 | 36.45 | 1328.84 | 134.48 | 0.00 | 0.00 | 5.40 | 63.30 | 101.00 | 101.00 | 63.30 | 1.08 | −0.42 |
| Dhudna | 91.9 | 94.6 | 8941.6 | 102.93 | 2.0 | 16.1 | 59.8 | 157.5 | 285.3 | 283.3 | 141.4 | 1.06 | −0.03 |
| Falaj Al Moalla | 82.5 | 86.1 | 7419.9 | 104.43 | 0.6 | 25.5 | 58.0 | 112.0 | 303.0 | 302.4 | 86.5 | 1.77 | 2.68 |
| Hamim | 35.5 | 43.3 | 1876.4 | 121.88 | 0.0 | 6.2 | 14.6 | 55.5 | 158.0 | 158.0 | 49.3 | 1.75 | 2.92 |
| Hatta | 61.2 | 62.2 | 3874.1 | 101.66 | 0.0 | 10.1 | 43.2 | 105.0 | 208.9 | 208.9 | 94.9 | 1.08 | 0.40 |
| Jabal Hafeet | 59.0 | 61.4 | 3764.5 | 104.00 | 0.0 | 14.3 | 50.4 | 85.1 | 246.0 | 246.0 | 70.8 | 1.95 | 4.70 |
| Jabal Jais | 108.4 | 128.5 | 1614.7 | 118.51 | 0.0 | 17.0 | 58.0 | 174.8 | 461.6 | 461.6 | 157.8 | 1.67 | 2.39 |
| Jabal Mebreh | 58.8 | 86.5 | 7490.6 | 147.29 | 0.0 | 0.2 | 15.2 | 83.1 | 252.2 | 252.2 | 82.9 | 1.53 | 1.06 |
| Khatam Al Shaklah | 103.7 | 91.5 | 8380.6 | 88.25 | 0.0 | 18.3 | 81.8 | 168.8 | 305.7 | 305.7 | 150.5 | 0.71 | −0.28 |
| Madinat Zayed | 31.58 | 29.05 | 843.80 | 91.98 | 0.00 | 8.30 | 24.00 | 50.90 | 109.40 | 109.40 | 42.60 | 1.28 | 1.82 |
| Manama | 30.89 | 39.22 | 1538.44 | 126.96 | 0.00 | 3.45 | 13.00 | 56.45 | 143.80 | 143.80 | 53.00 | 1.77 | 3.16 |
| Makassib | 48.8 | 57.1 | 3264.9 | 117.19 | 0.4 | 10.8 | 21.0 | 89.9 | 206.9 | 206.5 | 79.1 | 1.56 | 2.31 |
| Masafi | 68.71 | 38.95 | 1516.83 | 56.69 | 0.00 | 40.20 | 61.60 | 104.90 | 124.80 | 124.80 | 64.70 | −0.45 | −0.92 |
| Mezaira | 35.1 | 59.4 | 3530.8 | 169.12 | 0.0 | 5.4 | 15.4 | 26.6 | 200.8 | 200.8 | 21.2 | 2.42 | 4.88 |
| Mezyed | 74.14 | 36.91 | 1362.05 | 49.78 | 28.00 | 39.96 | 61.80 | 113.26 | 127.58 | 99.59 | 73.30 | 0.27 | −1.62 |
| Mukhariz | 51.0 | 95.6 | 9140.6 | 187.62 | 0.0 | 5.6 | 18.6 | 36.4 | 347.0 | 347.0 | 30.8 | 2.63 | 6.33 |
| Owtaid | 42.22 | 38.15 | 1455.34 | 90.35 | 0.00 | 13.35 | 28.60 | 54.10 | 131.00 | 131.00 | 40.75 | 1.35 | 1.37 |
| Qarnen | 29.28 | 27.37 | 748.95 | 93.48 | 0.00 | 5.50 | 17.00 | 55.15 | 79.10 | 79.10 | 49.65 | 0.69 | −0.98 |
| Raknah | 64.1 | 59.2 | 3509.7 | 92.47 | 0.0 | 20.8 | 56.4 | 81.3 | 232.2 | 232.2 | 60.5 | 1.51 | 3.08 |
| Ras Ghanadah | 41.0 | 53.9 | 2905.1 | 131.44 | 0.0 | 3.7 | 19.0 | 63.3 | 185.5 | 185.5 | 59.6 | 1.75 | 2.42 |
| Ras Musherib | 17.30 | 20.25 | 409.95 | 117.04 | 0.00 | 1.95 | 4.60 | 34.45 | 63.10 | 63.10 | 32.50 | 1.04 | −0.15 |
| Rowdah | 51.2 | 61.7 | 3809.1 | 120.51 | 0.0 | 2.2 | 29.2 | 68.6 | 230.0 | 230.0 | 66.4 | 1.79 | 3.48 |
| Saih Al Salem | 46.4 | 61.9 | 3831.0 | 133.51 | 2.2 | 8.8 | 20.8 | 68.4 | 242.9 | 240.7 | 59.6 | 2.33 | 6.02 |
| Sir Bani Yas | 32.32 | 41.08 | 1687.58 | 127.09 | 0.00 | 2.35 | 16.60 | 51.50 | 132.80 | 132.80 | 49.15 | 1.47 | 1.24 |
| Sir Bu Nair | 31.88 | 32.83 | 1078.00 | 102.98 | 0.00 | 5.60 | 17.80 | 67.95 | 92.20 | 92.20 | 62.35 | 0.79 | −0.95 |
| Swiehan | 64.7 | 55.7 | 3105.0 | 86.06 | 0.0 | 10.9 | 55.8 | 101.2 | 192.1 | 192.1 | 90.3 | 0.76 | 0.01 |
| Um Azimul | 26.38 | 28.92 | 836.36 | 109.62 | 0.00 | 4.50 | 14.60 | 57.70 | 84.70 | 84.70 | 53.20 | 1.00 | −0.61 |
| Um Ghafa | 37.9 | 50.5 | 2551.6 | 133.18 | 0.0 | 0.7 | 21.0 | 58.3 | 165.5 | 165.5 | 57.6 | 1.64 | 1.94 |
| Umm Al Quwain | 46.5 | 49.2 | 2424.0 | 105.97 | 0.0 | 10.0 | 32.6 | 58.8 | 177.4 | 177.4 | 48.8 | 1.63 | 2.47 |
| Yasat | 26.64 | 34.97 | 1223.16 | 131.31 | 0.00 | 3.90 | 6.40 | 44.15 | 108.00 | 108.00 | 40.25 | 1.48 | 1.16 |
References
- Haile, A.T.; Yan, F.; Habib, E. Accuracy of the CMORPH Satellite-Rainfall Product over Lake Tana Basin in Eastern Africa. Atmos. Res. 2015, 163, 177–187. [Google Scholar] [CrossRef] [Green Version]
- Kim, J.; Han, H. Evaluation of the CMORPH High-Resolution Precipitation Product for Hydrological Applications over South Korea. Atmos. Res. 2021, 258, 105650. [Google Scholar] [CrossRef]
- Eini, M.R.; Rahmati, A.; Piniewski, M. Hydrological Application and Accuracy Evaluation of PERSIANN Satellite-Based Precipitation Estimates over a Humid Continental Climate Catchment. J. Hydrol. Reg. Stud. 2022, 41, 101109. [Google Scholar] [CrossRef]
- Prakash, S. Performance Assessment of CHIRPS, MSWEP, SM2RAIN-CCI, and TMPA Precipitation Products across India. J. Hydrol. 2019, 571, 50–59. [Google Scholar] [CrossRef]
- Hou, A.Y.; Kakar, R.K.; Neeck, S.; Azarbarzin, A.A.; Kummerow, C.D.; Kojima, M.; Oki, R.; Nakamura, K.; Iguchi, T. The Global Precipitation Measurement Mission. Bull. Am. Meteorol. Soc. 2014, 95, 701–722. [Google Scholar] [CrossRef]
- Stagl, J.; Mayr, E.; Koch, H.; Hattermann, F.F.; Huang, S. Effects of Climate Change on the Hydrological Cycle in Central and Eastern Europe. In Managing Protected Areas in Central and Eastern Europe Under Climate Change; Rannow, S., Neubert, M., Eds.; Advances in Global Change Research; Springer: Dordrecht, The Netherlands, 2014; pp. 31–43. ISBN 978-94-007-7960-0. [Google Scholar]
- Cavalcante, R.B.L.; da Silva Ferreira, D.B.; Pontes, P.R.M.; Tedeschi, R.G.; da Costa, C.P.W.; de Souza, E.B. Evaluation of Extreme Rainfall Indices from CHIRPS Precipitation Estimates over the Brazilian Amazonia. Atmos. Res. 2020, 238, 104879. [Google Scholar] [CrossRef]
- López-Bermeo, C.; Montoya, R.D.; Caro-Lopera, F.J.; Díaz-García, J.A. Validation of the Accuracy of the CHIRPS Precipitation Dataset at Representing Climate Variability in a Tropical Mountainous Region of South America. Phys. Chem. Earth A/B/C 2022, 127, 103184. [Google Scholar] [CrossRef]
- Nawaz, M.; Iqbal, M.F.; Mahmood, I. Validation of CHIRPS Satellite-Based Precipitation Dataset over Pakistan. Atmos. Res. 2021, 248, 105289. [Google Scholar] [CrossRef]
- Gragnani, G.L.; Colli, M.; Tavanti, E.; Caviglia, D.D. Advanced Real-Time Monitoring of Rainfall Using Commercial Satellite Broadcasting Service: A Case Study. Sensors 2021, 21, 691. [Google Scholar] [CrossRef]
- Han, L.; Zhang, J.; Chen, H.; Zhang, W.; Yao, S. Towards the Predictability of a Radar-Based Nowcasting System for Different Precipitation Systems. IEEE Geosci. Remote Sens. Lett. 2022, 19, 1005705. [Google Scholar] [CrossRef]
- Huang, H.; Zhao, K.; Fu, P.; Chen, H.; Chen, G.; Zhang, Y. Validation of Precipitation Measurements from the Dual-Frequency Precipitation Radar Onboard the GPM Core Observatory Using a Polarimetric Radar in South China. IEEE Trans. Geosci. Remote Sens. 2022, 60, 4104216. [Google Scholar] [CrossRef]
- Ochoa-Rodriguez, S.; Wang, L.-P.; Willems, P.; Onof, C. A Review of Radar-Rain Gauge Data Merging Methods and Their Potential for Urban Hydrological Applications. Water Resour. Res. 2019, 55, 6356–6391. [Google Scholar] [CrossRef]
- Chandrasekar, V.; Chen, H. A Machine Learning Approach to Derive Precipitation Estimates at Global Scale Using Space Radar and Ground-Based Observations. In Proceedings of the IGARSS 2020—2020 IEEE International Geoscience and Remote Sensing Symposium 2020, Waikoloa, HI, USA, 26 September–2 October 2020; pp. 5376–5379. [Google Scholar]
- Han, L.; Zhao, Y.; Chen, H.; Chandrasekar, V. Advancing Radar Nowcasting through Deep Transfer Learning. IEEE Trans. Geosci. Remote Sens. 2022, 60, 4100609. [Google Scholar] [CrossRef]
- Ji, L.; Xu, W.; Chen, H.; Chen, H. Identification of Convective Precipitation Feature Observed by Trmm/Gpm Pr Using a Revised Unsupervised Clustering Proposal. In Proceedings of the 2021 IEEE International Geoscience and Remote Sensing Symposium IGARSS, Brussels, Belgium, 11–16 July 2021; pp. 370–371. [Google Scholar]
- Zhang, J.; Chen, H.; Han, L. An investigation of a probabilistic nowcast system for dual-polarization radar applications. In Proceedings of the IGARSS 2020-2020 IEEE International Geoscience and Remote Sensing Symposium, Waikoloa, HI, USA, 26 September–2 October 2020; pp. 5294–5297. [Google Scholar] [CrossRef]
- Prigent, C. Precipitation Retrieval from Space: An Overview. Comptes Rendus Geosci. 2010, 342, 380–389. [Google Scholar] [CrossRef]
- Jiang, S.; Zhou, M.; Ren, L.; Cheng, X.; Zhang, P. Evaluation of Latest TMPA and CMORPH Satellite Precipitation Products over Yellow River Basin. Water Sci. Eng. 2016, 9, 87–96. [Google Scholar] [CrossRef] [Green Version]
- Wang, Q.; Xia, J.; She, D.; Zhang, X.; Liu, J.; Zhang, Y. Assessment of Four Latest Long-Term Satellite-Based Precipitation Products in Capturing the Extreme Precipitation and Streamflow across a Humid Region of Southern China. Atmos. Res. 2021, 257, 105554. [Google Scholar] [CrossRef]
- Wehbe, Y.; Ghebreyesus, D.; Temimi, M.; Milewski, A.; Al Mandous, A. Assessment of the Consistency among Global Precipitation Products over the United Arab Emirates. J. Hydrol. Reg. Stud. 2017, 12, 122–135. [Google Scholar] [CrossRef]
- Ji, H.; Peng, D.; Gu, Y.; Liang, Y.; Luo, X. Evaluation of multiple satellite precipitation products and their potential utilities in the Yarlung Zangbo River Basin. Sci. Rep. 2022, 12, 1–15. [Google Scholar] [CrossRef]
- Huffman, G.; Bolvin, D.; Braithwaite, D.; Hsu, K.-L.; Joyce, R.; Kidd, C.; Nelkin, E.J.; Sorooshian, S.; Tan, J.; Xie, P. NASA Global Precipitation Measurement (GPM) Integrated Multi-SatellitE Retrievals for GPM (IMERG); Global Precipitatoin Measurement; NASA: Washington, DC, USA, 2018; pp. 1–29. [Google Scholar]
- Nguyen, P.; Ombadi, M.; Sorooshian, S.; Hsu, K.; AghaKouchak, A.; Braithwaite, D.; Ashouri, H.; Thorstensen, A.R. The PERSIANN Family of Global Satellite Precipitation Data: A Review and Evaluation of Products. Hydrol. Earth Syst. Sci. 2018, 22, 5801–5816. [Google Scholar] [CrossRef]
- Tan, J.; Huffman, G.J.; Bolvin, D.T.; Nelkin, E.J. IMERG V06: Changes to the Morphing Algorithm. J. Atmos. Ocean. Technol. 2019, 36, 2471–2482. [Google Scholar] [CrossRef]
- Chen, Y.; Duan, J.; An, J.; Liu, H.; Görsdorf, U.; Berger, F.H. Satellite Estimates and Subpixel Variability of Rainfall in a Semi-Arid Grassland. Atmos. Ocean. Sci. Lett. 2021, 14, 100055. [Google Scholar] [CrossRef]
- Mahmoud, M.T.; Al-Zahrani, M.A.; Sharif, H.O. Assessment of Global Precipitation Measurement Satellite Products over Saudi Arabia. J. Hydrol. 2018, 559, 1–12. [Google Scholar] [CrossRef]
- Rincón-Avalos, P.; Khouakhi, A.; Mendoza-Cano, O.; la Cruz, J.L.-D.; Paredes-Bonilla, K.M. Evaluation of Satellite Precipitation Products over Mexico Using Google Earth Engine. J. Hydroinform. 2022, 24, jh2022122. [Google Scholar] [CrossRef]
- Ashouri, H.; Hsu, K.-L.; Sorooshian, S.; Braithwaite, D.K.; Knapp, K.R.; Cecil, L.D.; Nelson, B.R.; Prat, O.P. PERSIANN-CDR: Daily Precipitation Climate Data Record from Multisatellite Observations for Hydrological and Climate Studies. Bull. Am. Meteorol. Soc. 2015, 96, 69–84. [Google Scholar] [CrossRef] [Green Version]
- Liu, C.-Y.; Aryastana, P.; Liu, G.-R.; Huang, W.-R. Assessment of Satellite Precipitation Product Estimates over Bali Island. Atmos. Res. 2020, 244, 105032. [Google Scholar] [CrossRef]
- Wang, H.; Zang, F.; Zhao, C.; Liu, C. A GWR Downscaling Method to Reconstruct High-Resolution Precipitation Dataset Based on GSMaP-Gauge Data: A Case Study in the Qilian Mountains, Northwest China. Sci. Total Environ. 2022, 810, 152066. [Google Scholar] [CrossRef] [PubMed]
- Shen, Y.; Xiong, A.; Wang, Y.; Xie, P. Performance of High-Resolution Satellite Precipitation Products over China. J. Geophys. Res. Atmos. 2010, 115, D2. [Google Scholar] [CrossRef]
- Vernimmen, R.R.E.; Hooijer, A.; Mamenun; Aldrian, E.; van Dijk, A.I.J.M. Evaluation and Bias Correction of Satellite Rainfall Data for Drought Monitoring in Indonesia. Hydrol. Earth Syst. Sci. 2012, 16, 133–146. [Google Scholar] [CrossRef] [Green Version]
- Ghajarnia, N.; Liaghat, A.; Arasteh, P.D. Comparison and Evaluation of High Resolution Precipitation Estimation Products in Urmia Basin-Iran. Atmos. Res. 2015, 158–159, 50–65. [Google Scholar] [CrossRef]
- Yang, Y.; Wu, J.; Bai, L.; Wang, B. Reliability of Gridded Precipitation Products in the Yellow River Basin, China. Remote Sens. 2020, 12, 374. [Google Scholar] [CrossRef] [Green Version]
- Duan, Z.; Liu, J.; Tuo, Y.; Chiogna, G.; Disse, M. Evaluation of Eight High Spatial Resolution Gridded Precipitation Products in Adige Basin (Italy) at Multiple Temporal and Spatial Scales. Sci. Total Environ. 2016, 573, 1536–1553. [Google Scholar] [CrossRef] [PubMed] [Green Version]
- Kidd, C.; Ferraro, R.; Turk, J.; Bauer, P.; Levizzani, V.; Ebert, E.; Janowiak, J.; Gruber, A. The International Precipitation Working Group; EUMETSAT: Amsterdam, The Netherlands, 2007; Available online: https://www-cdn.eumetsat.int/files/2020-04/pdf_conf_p50_s1_03_kidd_v.pdf (accessed on 29 October 2022).
- Dinku, T.; Ceccato, P.; Grover-Kopec, E.; Lemma, M.; Connor, S.J.; Ropelewski, C.F. Validation of Satellite Rainfall Products over East Africa’s Complex Topography. Int. J. Remote Sens. 2007, 28, 1503–1526. [Google Scholar] [CrossRef]
- Yin, Z.-Y.; Zhang, X.; Liu, X.; Colella, M.; Chen, X. An Assessment of the Biases of Satellite Rainfall Estimates over the Tibetan Plateau and Correction Methods Based on Topographic Analysis. J. Hydrometeorol. 2008, 9, 301–326. [Google Scholar] [CrossRef]
- Faiz, M.A.; Liu, D.; Tahir, A.A.; Li, H.; Fu, Q.; Adnan, M.; Zhang, L.; Naz, F. Comprehensive Evaluation of 0.25° Precipitation Datasets Combined with MOD10A2 Snow Cover Data in the Ice-Dominated River Basins of Pakistan. Atmos. Res. 2020, 231, 104653. [Google Scholar] [CrossRef]
- Peña-Arancibia, J.L.; van Dijk, A.I.J.M.; Renzullo, L.J.; Mulligan, M. Evaluation of Precipitation Estimation Accuracy in Reanalyses, Satellite Products, and an Ensemble Method for Regions in Australia and South and East Asia. J. Hydrometeorol. 2013, 14, 1323–1333. [Google Scholar] [CrossRef] [Green Version]
- Stampoulis, D.; Anagnostou, E.N. Evaluation of Global Satellite Rainfall Products over Continental Europe. J. Hydrometeorol. 2012, 13, 588–603. [Google Scholar] [CrossRef]
- Tian, Y.; Peters-Lidard, C.D.; Choudhury, B.J.; Garcia, M. Multitemporal Analysis of TRMM-Based Satellite Precipitation Products for Land Data Assimilation Applications. J. Hydrometeorol. 2007, 8, 1165–1183. [Google Scholar] [CrossRef]
- Elgamal, A.; Reggiani, P.; Jonoski, A. Impact Analysis of Satellite Rainfall Products on Flow Simulations in the Magdalena River Basin, Colombia. J. Hydrol. Reg. Stud. 2017, 9, 85–103. [Google Scholar] [CrossRef]
- Boluwade, A. Spatial-temporal assessment of satellite-based rainfall estimates in different precipitation regimes in water-scarce and data-sparse regions. Atmosphere 2020, 11, 901. [Google Scholar] [CrossRef]
- Safa, G.; Najiba, C.; El Houda, B.N.; Monji, H.; Soumaya, A.; Kamel, Z. Assessment of Urban Groundwater Vulnerability in Arid Areas: Case of Sidi Bouzid Aquifer (Central Tunisia). J. Afr. Earth Sci. 2020, 168, 103849. [Google Scholar] [CrossRef]
- Venkata Rao, G.; Venkata Reddy, K.; Srinivasan, R.; Sridhar, V.; Umamahesh, N.V.; Pratap, D. Spatio-Temporal Analysis of Rainfall Extremes in the Flood-Prone Nagavali and Vamsadhara Basins in Eastern India. Weather Clim. Extrem. 2020, 29, 100265. [Google Scholar] [CrossRef]
- Men, B.; Wu, Z.; Liu, H.; Tian, W.; Zhao, Y. Spatio-Temporal Analysis of Precipitation and Temperature: A Case Study Over the Beijing–Tianjin–Hebei Region, China. Pure Appl. Geophys. 2020, 177, 3527–3541. [Google Scholar] [CrossRef]
- Eris, E.; Cavus, Y.; Aksoy, H.; Burgan, H.I.; Aksu, H.; Boyacioglu, H. Spatiotemporal Analysis of Meteorological Drought over Kucuk Menderes River Basin in the Aegean Region of Turkey. Appl Clim. 2020, 142, 1515–1530. [Google Scholar] [CrossRef]
- Aydin, O.; Raja, N.B. Spatial-Temporal Analysis of Precipitation Characteristics in Artvin, Turkey. Appl Clim. 2020, 142, 729–741. [Google Scholar] [CrossRef]
- Tan, M.L.; Zhang, F.; Juinn, C.; Derek, C.; Yu, K.H.; Shaharudin, S.M.; Chan, N.W.; Asyirah, A.R. Spatio-Temporal Analysis of Precipitation, Temperature and Drought from 1985 to 2020 in Penang, Malaysia. Water Supply 2022, 22, 4757–4768. [Google Scholar] [CrossRef]
- Aksu, H.; Cetin, M.; Aksoy, H.; Yaldiz, S.G.; Yildirim, I.; Keklik, G. Spatial and Temporal Characterization of Standard Duration-Maximum Precipitation over Black Sea Region in Turkey. Nat. Hazards 2022, 111, 2379–2405. [Google Scholar] [CrossRef]
- Aksu, H.; Cavus, Y.; Aksoy, H.; Akgul, M.A.; Turker, S.; Eris, E. Spatiotemporal Analysis of Drought by CHIRPS Precipitation Estimates. Appl Clim. 2022, 148, 517–529. [Google Scholar] [CrossRef]
- Sherif, M.; Almulla, M.; Shetty, A.; Chowdhury, R.K. Analysis of Rainfall, PMP and Drought in the United Arab Emirates. Int. J. Climatol. 2014, 34, 1318–1328. [Google Scholar] [CrossRef]
- Adeyewa, Z.D.; Nakamura, K. Validation of TRMM Radar Rainfall Data over Major Climatic Regions in Africa. J. Appl. Meteorol. Climatol. 2003, 42, 331–347. [Google Scholar] [CrossRef]
- Sultana, R.; Nasrollahi, N. Evaluation of Remote Sensing Precipitation Estimates over Saudi Arabia. J. Arid Environ. 2018, 151, 90–103. [Google Scholar] [CrossRef]
- Anjum, M.N.; Irfan, M.; Waseem, M.; Leta, M.K.; Niazi, U.M.; ur Rahman, S.; Ghanim, A.; Mukhtar, M.A.; Nadeem, M.U. Assessment of PERSIANN-CCS, PERSIANN-CDR, SM2RAIN-ASCAT, and CHIRPS-2.0 Rainfall Products over a Semi-Arid Subtropical Climatic Region. Water 2022, 14, 147. [Google Scholar] [CrossRef]
- Hussein, K.A.; Alsumaiti, T.S.; Ghebreyesus, D.T.; Sharif, H.O.; Abdalati, W. High-Resolution Spatiotemporal Trend Analysis of Precipitation Using Satellite-Based Products over the United Arab Emirates. Water 2021, 13, 2376. [Google Scholar] [CrossRef]
- Murad, A.A. An Overview of Conventional and Non-Conventional Water Resources in Arid Region: Assessment and Constrains of the United Arab Emirates (UAE). J. Water Resour. Prot. 2010, 2, 181–190. [Google Scholar] [CrossRef] [Green Version]
- Ouarda, T.B.M.J.; Charron, C.; Niranjan Kumar, K.; Marpu, P.R.; Ghedira, H.; Molini, A.; Khayal, I. Evolution of the Rainfall Regime in the United Arab Emirates. J. Hydrol. 2014, 514, 258–270. [Google Scholar] [CrossRef] [Green Version]
- Joyce, R.J.; Janowiak, J.E.; Arkin, P.A.; Xie, P. CMORPH: A Method That Produces Global Precipitation Estimates from Passive Microwave and Infrared Data at High Spatial and Temporal Resolution. J. Hydrometeorol. 2004, 5, 487–503. [Google Scholar] [CrossRef]
- Funk, C.; Peterson, P.; Landsfeld, M.; Pedreros, D.; Verdin, J.; Shukla, S.; Husak, G.; Rowland, J.; Harrison, L.; Hoell, A.; et al. The Climate Hazards Infrared Precipitation with Stations—A New Environmental Record for Monitoring Extremes. Sci. Data 2015, 2, 150066. [Google Scholar] [CrossRef] [Green Version]
- Harrison, L.; Landsfeld, M.; Husak, G.; Davenport, F.; Shukla, S.; Turner, W.; Peterson, P.; Funk, C. Advancing Early Warning Capabilities with CHIRPS-Compatible NCEP GEFS Precipitation Forecasts. Sci. Data 2022, 9, 375. [Google Scholar] [CrossRef]
- NCM.AE. Available online: https://www.ncm.ae/?lang=ar (accessed on 29 October 2022).
- Ryu, S.; Song, J.J.; Kim, Y.; Jung, S.-H.; Do, Y.; Lee, G. Spatial Interpolation of Gauge Measured Rainfall Using Compressed Sensing. Asia Pac. J. Atmos. Sci. 2021, 57, 331–345. [Google Scholar] [CrossRef] [Green Version]
- Chen, F.-W.; Liu, C.-W. Estimation of the Spatial Rainfall Distribution Using Inverse Distance Weighting (IDW) in the Middle of Taiwan. Paddy Water Environ. 2012, 10, 209–222. [Google Scholar] [CrossRef]
- Yang, X.; Xie, X.; Liu, D.L.; Ji, F.; Wang, L. Spatial Interpolation of Daily Rainfall Data for Local Climate Impact Assessment over Greater Sydney Region. Adv. Meteorol. 2015, 2015, e563629. [Google Scholar] [CrossRef] [Green Version]
- Abd Elhamid, A.M.I.; Eltahan, A.M.H.; Mohamed, L.M.E.; Hamouda, I.A. Assessment of the Two Satellite-Based Precipitation Products TRMM and RFE Rainfall Records Using Ground Based Measurements. Alex. Eng. J. 2020, 59, 1049–1058. [Google Scholar] [CrossRef]
- Alsumaiti, T.S.; Hussein, K.; Ghebreyesus, D.T.; Sharif, H.O. Performance of the CMORPH and GPM IMERG Products over the United Arab Emirates. Remote Sens. 2020, 12, 1426. [Google Scholar] [CrossRef]
- Faiz, M.A.; Liu, D.; Fu, Q.; Sun, Q.; Li, M.; Baig, F.; Li, T.; Cui, S. How Accurate Are the Performances of Gridded Precipitation Data Products over Northeast China? Atmos. Res. 2018, 211, 12–20. [Google Scholar] [CrossRef]
- Mahmoud, M.T.; Hamouda, M.A.; Mohamed, M.M. Spatiotemporal Evaluation of the GPM Satellite Precipitation Products over the United Arab Emirates. Atmos. Res. 2019, 219, 200–212. [Google Scholar] [CrossRef]
- Benesty, J.; Chen, J.; Huang, Y.; Cohen, I. Pearson Correlation Coefficient. In Noise Reduction in Speech Processing; Cohen, I., Huang, Y., Chen, J., Benesty, J., Eds.; Springer Topics in Signal Processing; Springer: Berlin/Heidelberg, Germany, 2009; pp. 1–4. ISBN 978-3-642-00296-0. [Google Scholar]
- Alexander, L.V.; Fowler, H.J.; Bador, M.; Behrangi, A.; Donat, M.G.; Dunn, R.; Funk, C.; Goldie, J.; Lewis, E.; Rogé, M.; et al. On the Use of Indices to Study Extreme Precipitation on Sub-Daily and Daily Timescales. Environ. Res. Lett. 2019, 14, 125008. [Google Scholar] [CrossRef]
- De Luis, M.; Gonzalez-Hidalgo, J.C.; Raventos, J.; Sanchez, J.R.; Cortina, J. Distribución Espacial de La Concentración y Agresividad de La Lluvia En El Territorio de La Comunidad Valenciana. Cuatern. Geomorfol. 1997, 11, 33–44. [Google Scholar]
- Oliver, J.E. Monthly Precipitation Distribution: A Comparative Index. Prof. Geogr. 1980, 32, 300–309. [Google Scholar] [CrossRef]
- Faiz, M.A.; Liu, D.; Fu, Q.; Wrzesiński, D.; Muneer, S.; Khan, M.I.; Li, T.; Cui, S. Assessment of Precipitation Variability and Uncertainty of Stream Flow in the Hindu Kush Himalayan and Karakoram River Basins of Pakistan. Meteorol. Atmos. Phys. 2019, 131, 127–136. [Google Scholar] [CrossRef]
- Shannon, C.E. A Mathematical Theory of Communication. Bell Syst. Tech. J. 1948, 27, 379–423. [Google Scholar] [CrossRef] [Green Version]
- Bronikowski, A.; Webb, C. Appendix: A Critical Examination of Rainfall Variability Measures Used in Behavioral Ecology Studies. Behav. Ecol. Sociobiol. 1996, 39, 27–30. [Google Scholar] [CrossRef]
- Chapungu, L.; Nhamo, L.; Gatti, R.C.; Chitakira, M. Quantifying Changes in Plant Species Diversity in a Savanna Ecosystem Through Observed and Remotely Sensed Data. Sustainability 2020, 12, 2345. [Google Scholar] [CrossRef] [Green Version]
- Joseph, S.; Anitha, K.; Srivastava, V.K.; Reddy, C.S.; Thomas, A.P.; Murthy, M.S.R. Rainfall and Elevation Influence the Local-Scale Distribution of Tree Community in the Southern Region of Western Ghats Biodiversity Hotspot (India). Int. J. For. Res. 2012, 2012, e576502. [Google Scholar] [CrossRef] [Green Version]
- Taylor, K.E. Summarizing Multiple Aspects of Model Performance in a Single Diagram. J. Geophys. Res. Atmos. 2001, 106, 7183–7192. [Google Scholar] [CrossRef]
- Li, C.; Zhang, H.; Singh, V.P.; Fan, J.; Wei, X.; Yang, J.; Wei, X. Investigating Variations of Precipitation Concentration in the Transitional Zone between Qinling Mountains and Loess Plateau in China: Implications for Regional Impacts of AO and WPSH. PLoS ONE 2020, 15, e0238709. [Google Scholar] [CrossRef] [PubMed]
- Michiels, P.; Gabriels, D.; Hartmann, R. Using the Seasonal and Temporal Precipitation Concentration Index for Characterizing the Monthly Rainfall Distribution in Spain. CATENA 1992, 19, 43–58. [Google Scholar] [CrossRef]
- Zhang, K.; Yao, Y.; Qian, X.; Wang, J. Various Characteristics of Precipitation Concentration Index and Its Cause Analysis in China between 1960 and 2016. Int. J. Climatol. 2019, 39, 4648–4658. [Google Scholar] [CrossRef]
- Da Motta Paca, V.H.; Espinoza-Dávalos, G.E.; Moreira, D.M.; Comair, G. Variability of Trends in Precipitation across the Amazon River Basin Determined from the CHIRPS Precipitation Product and from Station Records. Water 2020, 12, 1244. [Google Scholar] [CrossRef]
- Pereira Filho, A.J.; Vemado, F.; Vemado, G.; Gomes Vieira Reis, F.A.; do Carmo Giordano, L.; Cerri, R.I.; dos Santos, C.C.; Sampaio Lopes, E.S.; Gramani, M.F.; Ogura, A.T.; et al. A Step towards Integrating CMORPH Precipitation Estimation with Rain Gauge Measurements. Adv. Meteorol. 2018, 2018, e2095304. [Google Scholar] [CrossRef]
- De Almeida, C.T.; Delgado, R.C.; de Oliveira Junior, J.F.; Gois, G.; Cavalcanti, A.S. Avaliação das Estimativas de Precipitação do Produto 3B43-TRMM do Estado do Amazonas. Floresta Ambiente 2015, 22, 279–286. [Google Scholar] [CrossRef]
- De Moraes Cordeiro, A.L.; Blanco, C.J.C. Assessment of Satellite Products for Filling Rainfall Data Gaps in the Amazon Region. Nat. Resour. Model. 2021, 34, e12298. [Google Scholar] [CrossRef]
Figure 1.
The study area including the geomorphological regions and locations of rain gauges.

Figure 2.
Flow chart of the implemented methodology.

Figure 3.
Annual average rainfall distribution for gauge (a) and satellite products (b–e).

Figure 4.
Average daily rainfall distribution for the gauge observation (a), IMERG (b), CMORPH (c), CHIRPS (d), PERSIANN-CDR (e).
Figure 4.
Average daily rainfall distribution for the gauge observation (a), IMERG (b), CMORPH (c), CHIRPS (d), PERSIANN-CDR (e).

Figure 5.
Mean monthly rainfall for gauge and remote sensing products.

Figure 6.
Taylor diagram depicting the performance of satellite products based on selected statistical measures over four climatological regions. The hollow circles represent the GPM-IMERG product while the solid circles represent the CMORPH product. Similarly, plus sign and hollow squares represent CHIRPS and PERSIANN-CDR, respectively.

Figure 7.
Heat map showing the contingency measures for each product. The X-axis shows the number of stations. POD stands for Probability of Detection, FAR denotes False Alarm Ratio, and CSI represents Critical Success Index.
Figure 7.
Heat map showing the contingency measures for each product. The X-axis shows the number of stations. POD stands for Probability of Detection, FAR denotes False Alarm Ratio, and CSI represents Critical Success Index.

Figure 8.
Results of climate indices analysis based on the products and the climatological regions (DF = Desert Foreland, EC = East Coast, GP = Gravel Plains, M = Mountains). CWD is consecutive wet days, Rx1day is the maximum one-day precipitation in millimeters in the given period, and R10, R20, and R30 are the annual count of days when rainfall was greater than 10, 20, and 30 mm, respectively.

Figure 9.
Precipitation variability distribution over UAE for the period of 2004–2020. Plots (b–e) represent the four satellite products while plot (a) shows the precipitation variability of rain gauge observations.
Figure 9.
Precipitation variability distribution over UAE for the period of 2004–2020. Plots (b–e) represent the four satellite products while plot (a) shows the precipitation variability of rain gauge observations.

Figure 10.
Precipitation Concentration Index (PCI) distribution over the study period for different satellite products and rain gauge observations over UAE. Thick continuous black line = PCI, straight blue line = mean value, light brown band = confidence band, yellowish wider band = prediction band.

Table 1.
Details of the utilized remotely sensed satellite precipitation products with their spatial and temporal resolutions and source.
Table 1.
Details of the utilized remotely sensed satellite precipitation products with their spatial and temporal resolutions and source.
| GPM-IMERG | CMORPH | CHIRPS | PERSIANN-CDR | |
|---|---|---|---|---|
| Source | NASA | NOAA | CHC, UCB | CHRS, UCI |
| Spatial Distribution | 10 × 10 km | 8 × 8 km | 5 × 5 km | 25 × 25 km |
| Temporal Distribution | Daily | Half-Hourly | Daily | Daily |
| Data Availability | 2000-Present | 1998-Present | 1981-Present | 2000-Present |
| Span | 60°S–60°N | 60°S–60°N | 50°S–50°N | 60°S–60°N |
Table 2.
Criteria for defining the contingency measures.
| Ground Observations | Satellite Estimates | ||
| Yes | No | ||
| Yes | A = Hits (Accurate forecasts) | B = Miss (Missed/unwarned events) | |
| No | C = False Alarm (Wolf Cry) | D = Correct No (Usually, we ignore this as rare event) | |
Table 3.
Climate indices and their definition (additional details: www.climdex.org (accessed on 3 July 2022)).
Table 3.
Climate indices and their definition (additional details: www.climdex.org (accessed on 3 July 2022)).
| Indices | Symbology | Units |
|---|---|---|
| Rx1 day | Maximum 1-day precipitation over a given period | mm |
| R10 mm | Yearly days count when | days |
| Rainfall ≥ 10 mm | ||
| R20 mm | Yearly days count when | days |
| Rainfall ≥ 20 mm | ||
| R30 mm | Yearly days count when | days |
| Rainfall ≥ 30 mm | ||
| CWD | The maximum length of the wet spell. | days |
| Max number of continuous days when Rainfall ≥ 1 mm |
Publisher’s Note: MDPI stays neutral with regard to jurisdictional claims in published maps and institutional affiliations. |
© 2022 by the authors. Licensee MDPI, Basel, Switzerland. This article is an open access article distributed under the terms and conditions of the Creative Commons Attribution (CC BY) license (https://creativecommons.org/licenses/by/4.0/).
Share and Cite
MDPI and ACS Style
Baig, F.; Abrar, M.; Chen, H.; Sherif, M. Rainfall Consistency, Variability, and Concentration over the UAE: Satellite Precipitation Products vs. Rain Gauge Observations. Remote Sens. 2022, 14, 5827. https://doi.org/10.3390/rs14225827
AMA Style
Baig F, Abrar M, Chen H, Sherif M. Rainfall Consistency, Variability, and Concentration over the UAE: Satellite Precipitation Products vs. Rain Gauge Observations. Remote Sensing. 2022; 14(22):5827. https://doi.org/10.3390/rs14225827
Chicago/Turabian StyleBaig, Faisal, Muhammad Abrar, Haonan Chen, and Mohsen Sherif. 2022. "Rainfall Consistency, Variability, and Concentration over the UAE: Satellite Precipitation Products vs. Rain Gauge Observations" Remote Sensing 14, no. 22: 5827. https://doi.org/10.3390/rs14225827
Note that from the first issue of 2016, this journal uses article numbers instead of page numbers. See further details here.