
Big Geospatial Data and Data-Driven Methods for Urban Dengue Risk Forecasting: A Review


Key Laboratory of Land Surface Pattern and Simulation, Institute of Geographic Sciences and Natural Resources Research, Chinese Academy of Sciences, Beijing 100101, China
*
Author to whom correspondence should be addressed.
Remote Sens. 2022, 14(19), 5052; https://doi.org/10.3390/rs14195052
Submission received: 10 July 2022
/
Revised: 8 September 2022
/
Accepted: 6 October 2022
/
Published: 10 October 2022
(This article belongs to the Special Issue Applications of Remote Sensing for One Health)
Abstract
:With advancements in big geospatial data and artificial intelligence, multi-source data and diverse data-driven methods have become common in dengue risk prediction. Understanding the current state of data and models in dengue risk prediction enables the implementation of efficient and accurate prediction in the future. Focusing on predictors, data sources, spatial and temporal scales, data-driven methods, and model evaluation, we performed a literature review based on 53 journal and conference papers published from 2018 to the present and concluded the following. (1) The predominant predictors include local climate conditions, historical dengue cases, vegetation indices, human mobility, population, internet search indices, social media indices, landscape, time index, and extreme weather events. (2) They are mainly derived from the official meteorological agency satellite-based datasets, public websites, department of health services and national electronic diseases surveillance systems, official statistics, and public transport datasets. (3) Country-level, province/state-level, city-level, district-level, and neighborhood-level are used as spatial scales, and the city-level scale received the most attention. The temporal scales include yearly, monthly, weekly, and daily, and both monthly and weekly are the most popular options. (4) Most studies define dengue risk forecasting as a regression task, and a few studies define it as a classification task. Data-driven methods can be categorized into single models, ensemble learning, and hybrid learning, with single models being further subdivided into time series, machine learning, and deep learning models. (5) Model evaluation concentrates primarily on the quantification of the difference/correlation between time-series observations and predicted values, the ability of models to determine whether a dengue outbreak occurs or not, and model uncertainty. Finally, we highlighted the importance of big geospatial data, data cloud computing, and other deep learning models in future dengue risk forecasting.
1. Introduction
Dengue fever is a mosquito-borne viral infectious disease mainly transmitted by Aedes aegypti and Aedes albopictus and is distributed in tropical and sub-tropical urban and semi-urban areas worldwide. Approximately 390 million dengue virus infections are reported annually, and more than half of the world’s population is at risk of dengue [1,2].
Dengue risk forecasting remains an important basis for dengue prevention and control due to the lack of an effective vaccine. Establishing efficient and accurate dengue risk forecasts can help policymakers to implement strategies for dengue prevention and control, and the rational allocation of public health resources. Moreover, climate change and urbanization will shift the burden of dengue to other regions, highlighting the urgent need for dengue risk forecasting in the future [3], and continued investment is necessary to prevent the resurgence of dengue, highlighting the importance of accurate and timely dengue surveillance tools [4].
In real-world applications, achieving dengue prediction requires the consideration of different risk predictors, data sources, models, evaluation indices of model performance, and spatial and temporal scales, which is a multidisciplinary task integrating remote sensing, geographic information systems (GIS), epidemiology, and artificial intelligence. It should also consider different forecast targets, such as dengue cases, incidence rates, occurrence, peak time, and peak intensity. Understanding the current state of dengue risk prediction will enable the implementation of efficient and accurate dengue risk forecasting in the future. Previous literature reviews have primarily focused on the models for dengue risk mapping [5], dengue landscape factors and data sources [6,7], machine learning for dengue diagnosis, spatio-temporal analysis of epidemics, control strategy evaluation [8], and real-world data used in dengue management [9]. Only one literature review summarized the process of dengue risk forecasting based on the publications from 2001 to 2017 and described the key aspects of dengue risk forecasting, including the available dengue epidemiological datasets, direct and indirect dengue factors, data preparation and representation, risk modeling, and evaluation [10]. In recent years, with the advancements in big geospatial data and artificial intelligence, an increasing amount of geospatial data (e.g., remote sensing images, ready-to-use products from satellite images, and meteorological reanalysis data) and new models, especially deep learning models, are being used to promote dengue risk forecasting (Figure 1).
In this context, this study aims to create an inventory of recent studies of dengue risk forecasting in terms of predictors and data sources, spatial and temporal scales, data-driven models, and evaluation metrics, and then discuss the potential of big geospatial data and deep learning for dengue risk forecasting. Such information would help to guide future dengue risk prediction by providing more attention to geospatial big data, cloud computing, and different deep learning models, which can improve the accuracy and timeliness of dengue risk prediction.
This review is divided into four sections. The first section provides a concise introduction to the review’s purpose. The second section describes the systematic literature selection process and the current status of dengue risk forecasting. The third section discusses the potential of big geospatial data and deep learning in future dengue risk forecasting. The fourth section concludes with our findings and their implications.
2. Methods and Materials
2.1. General Framework of Dengue Risk Forecasting
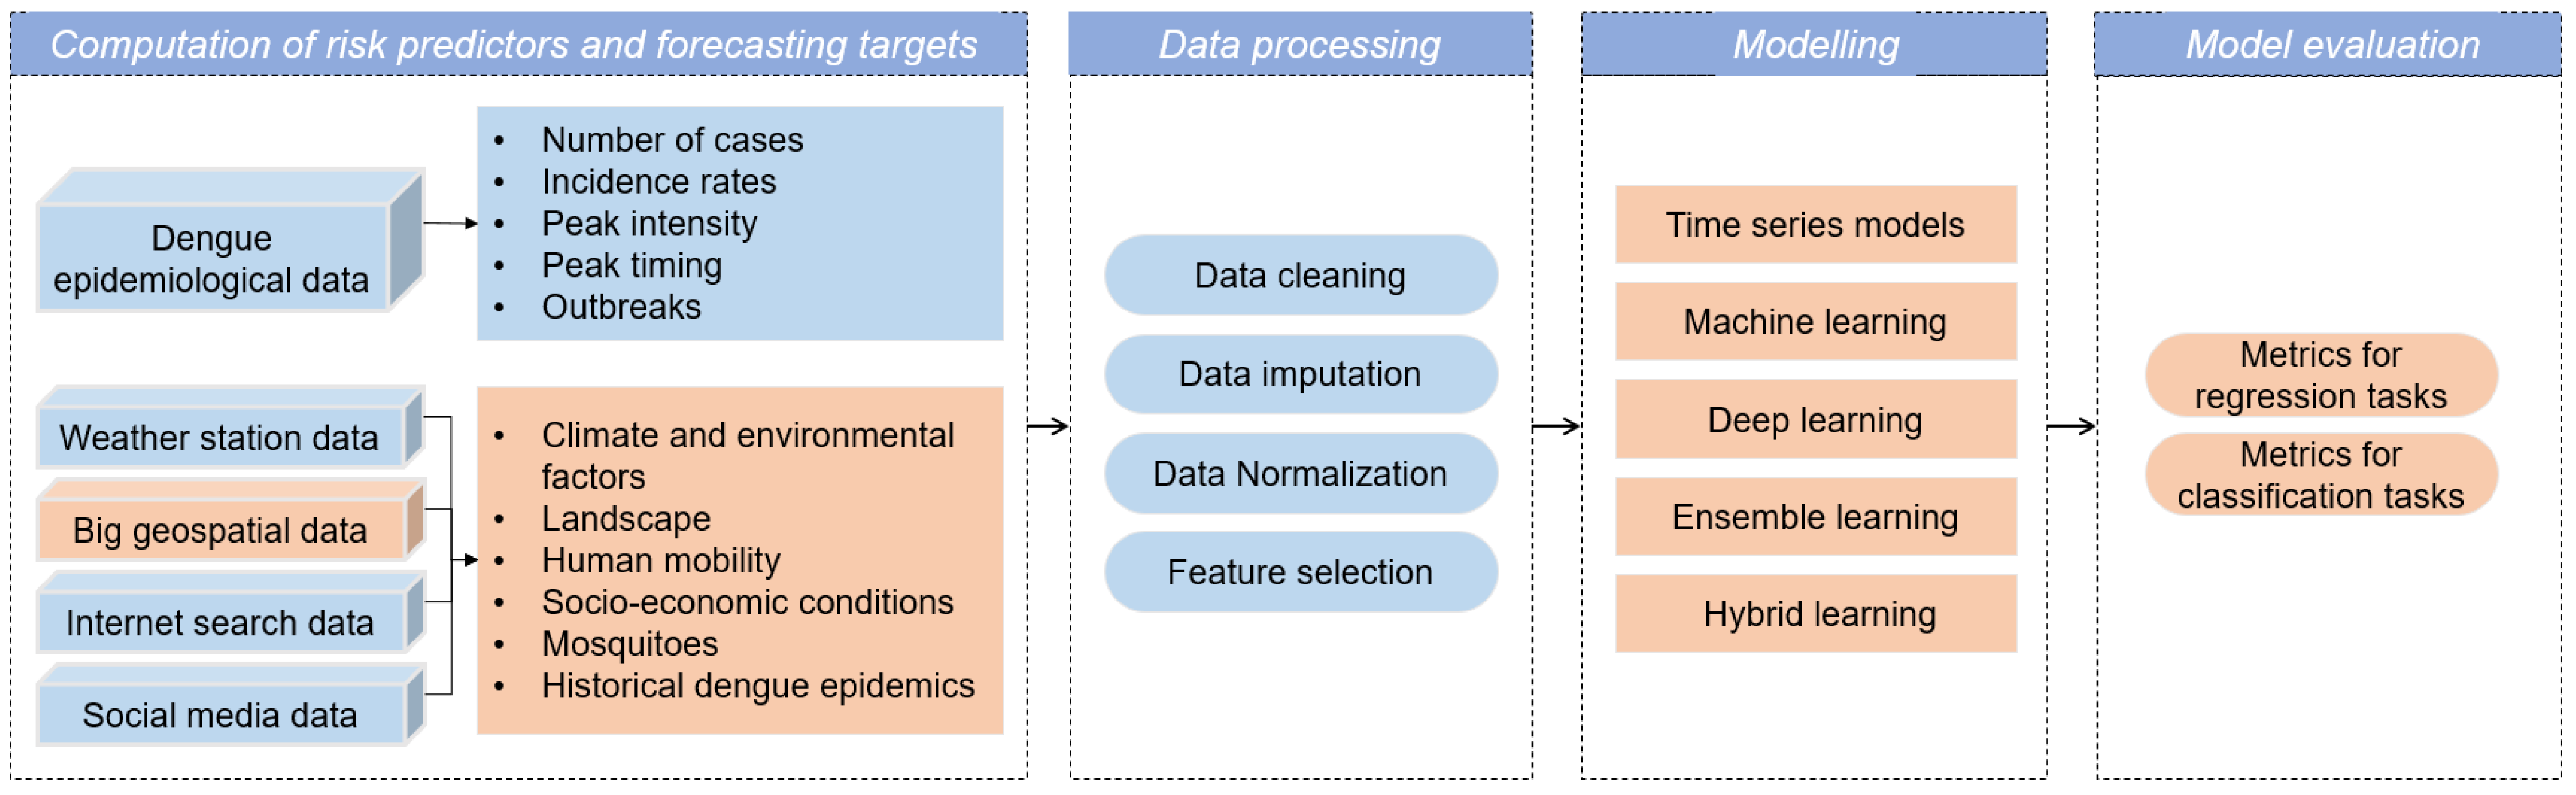
Dengue risk forecasting often consists of the computation of risk predictors and forecast targets, data preprocessing, modeling, and model evaluation metrics (Figure 2). In this review, we focused on the application of big geospatial data, data-driven modeling, and model evaluation.
2.2. Literature Selection and Information Analysis
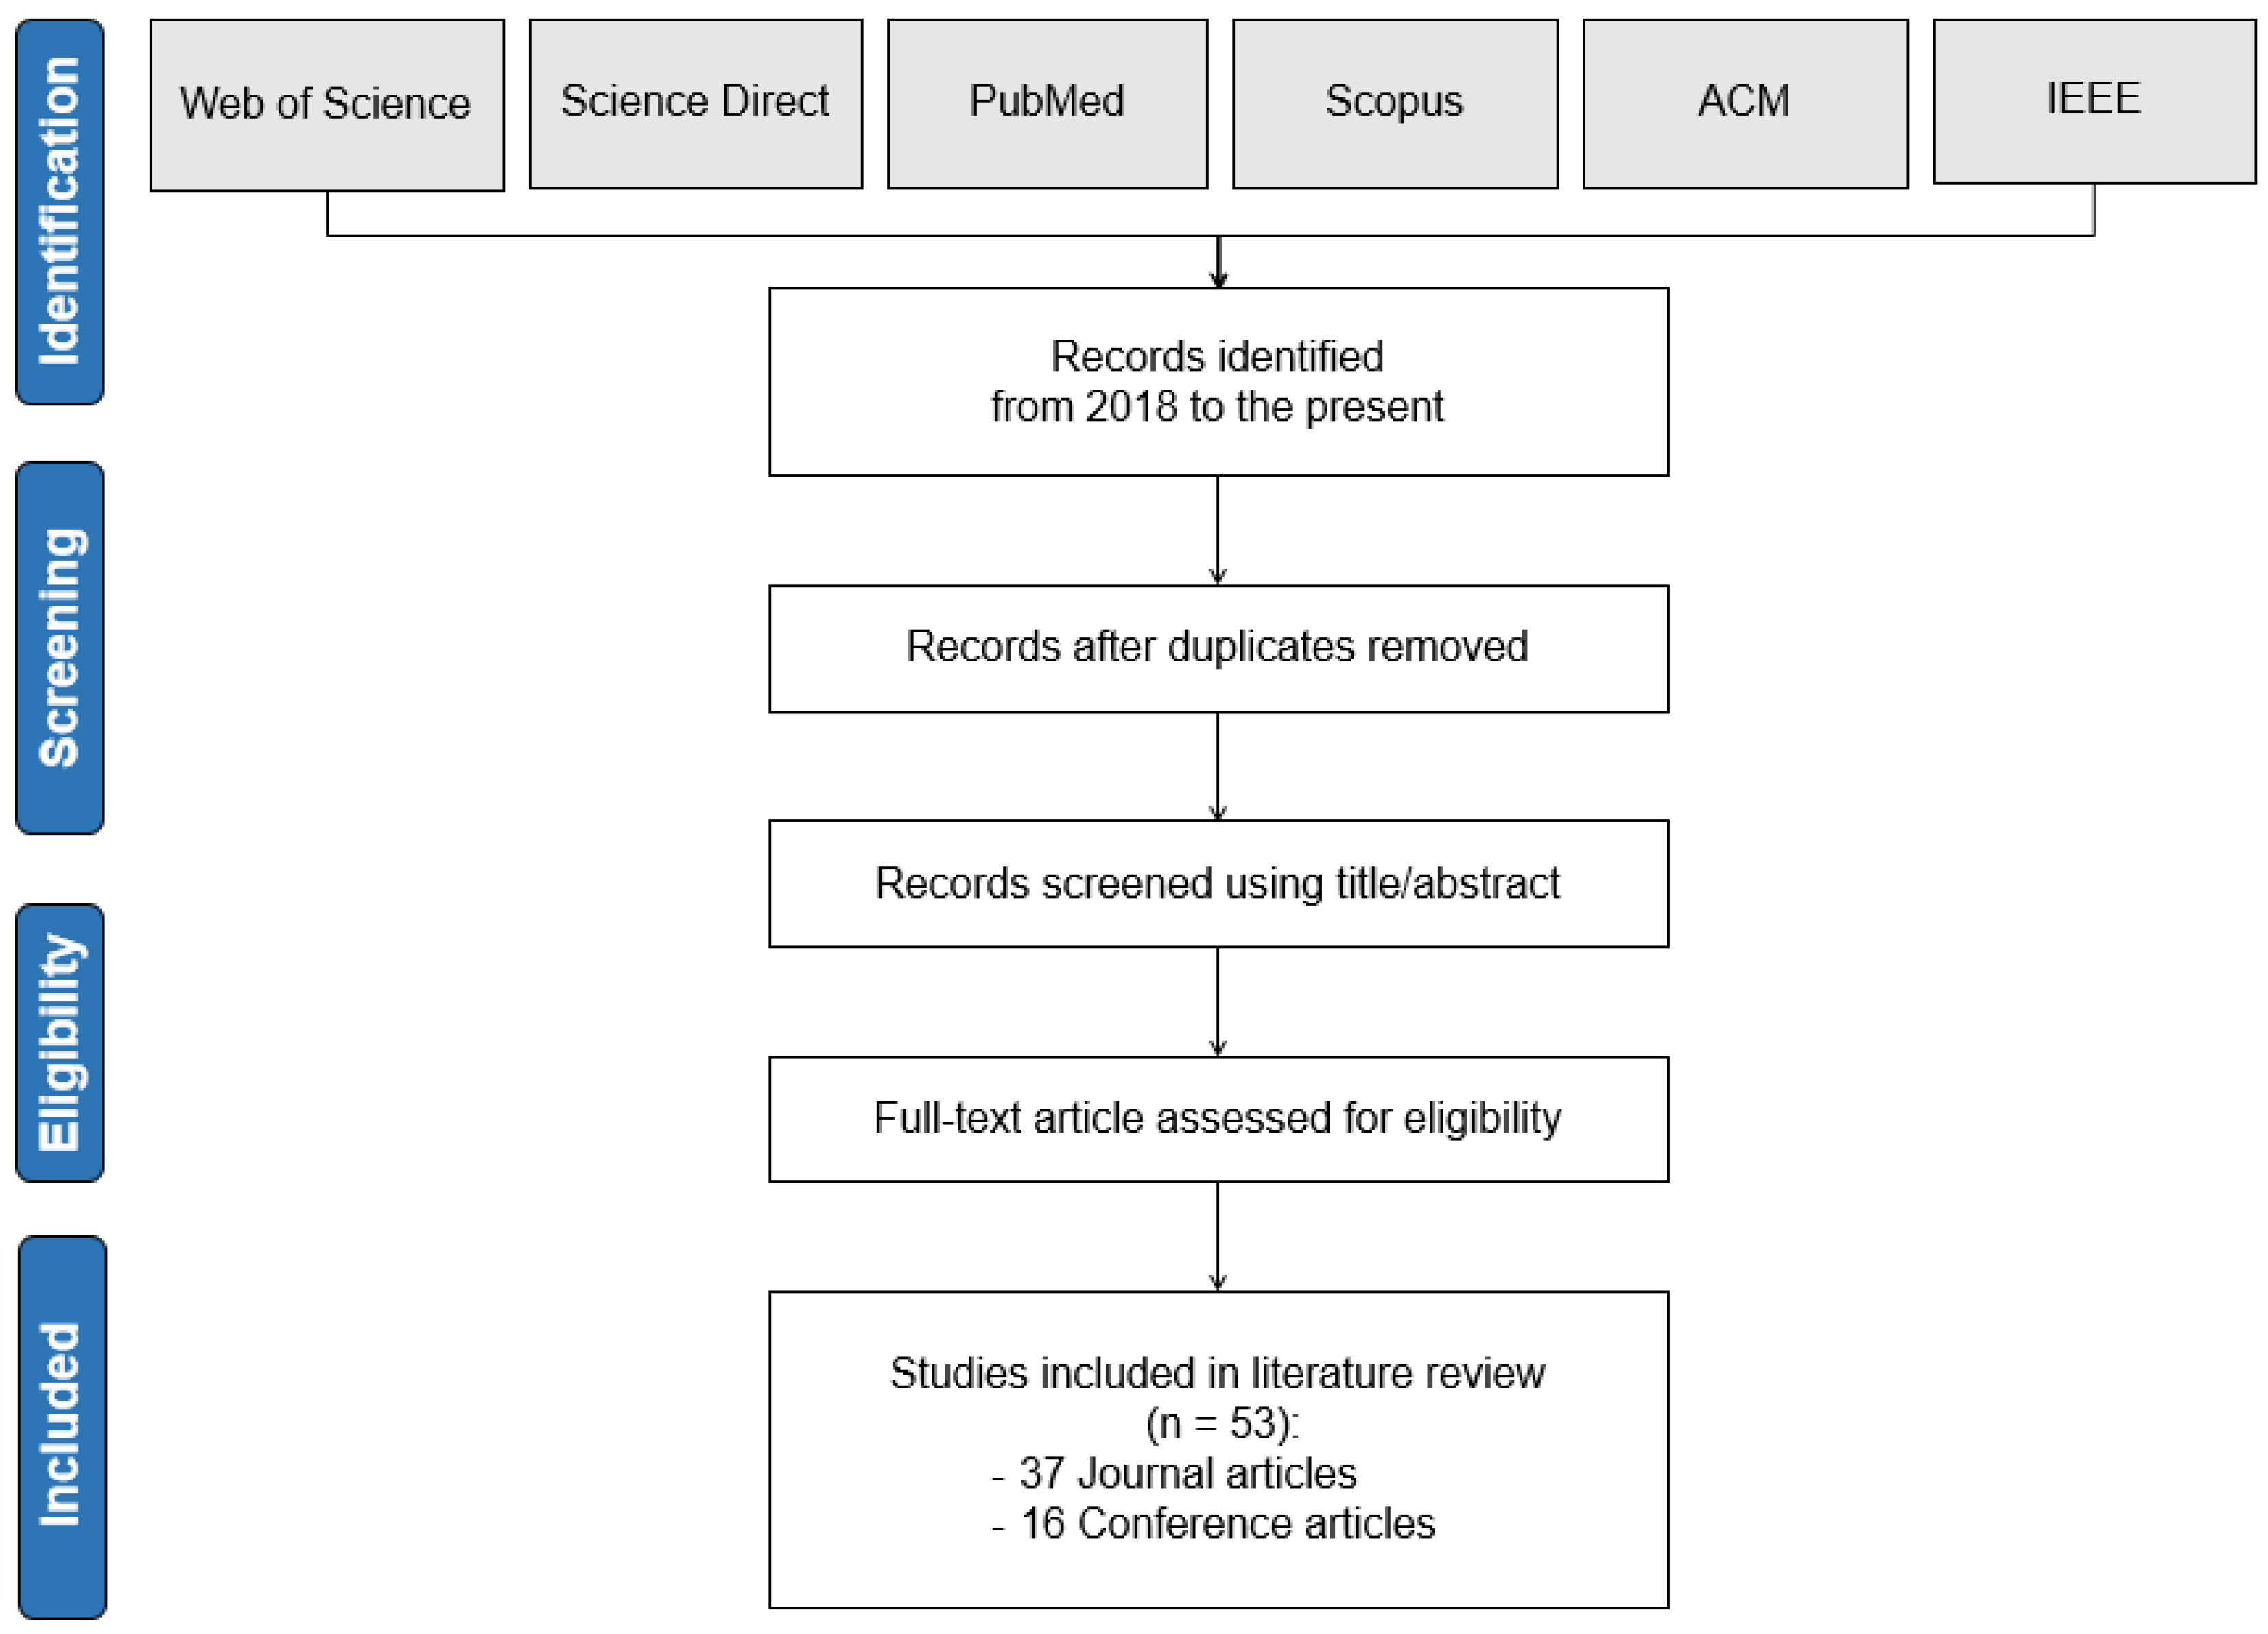
The process of literature selection was guided by the Preferred Reporting Items for the Systematic Reviews and Meta-Analyses (PRISMA) statement [11], as presented in Figure 3. Using the logical structure "dengue AND (predict* OR forecast*)", a broad search was defined. From 2018 to the present, we conducted searches in the following databases: Web of Science, Science Direct, MEDLINE (PubMed), Scopus, the ACM digital library, and IEEE Xplore. Here, we utilized the ACM digital library and IEEE Xplore, two high-quality literature databases in engineering, technology, and computing, to identify the data-driven models (such as time series, machine learning, and deep learning models) in dengue risk forecasting. The queries were limited to titles, abstracts, and keywords, and only English-language journals and conference articles were considered. Using the EndNote software, all records were merged and duplicates were eliminated. Then, we examined the title and abstract of each record to select relevant articles. For example, a paper with a title “Weekly dengue forecasts in Iquitos, Peru; San Juan, Puerto Rico; and Singapore” was included. Lastly, a full-text screening was conducted using the following criteria: (1) the paper focused on the dengue risk forecasting in the human population; (2) the paper considered the number of cases, incidence rates, outbreaks, peak time, and peak intensity as forecasting targets; (3) the paper identified specific risk predictors; and (4) the paper constructed data-driven models, forecasted the dengue risk at given spatial and temporal scales, and evaluated the model performance. Figure 3 depicts the literature selection procedure. A total of 53 articles, including 37 journal articles and 16 conference papers, were included in this review [12,13,14,15,16,17,18,19,20,21,22,23,24,25,26,27,28,29,30,31,32,33,34,35,36,37,38,39,40,41,42,43,44,45,46,47,48,49,50,51,52,53,54,55,56,57,58,59,60,61,62,63,64]. We manually extracted the information for each article including an ID number, authors and published year, spatial and temporal scales, risk predictors and data sources, forecasting targets, data-driven models, and evaluation metrics (Table A1).
2.3. Data Analysis
In order to comprehend the predominant predictors and data sources, we mapped the co-occurrence of the keywords of predictors and data sources using the VOSviewer software (V1.6.8), a tool for constructing and visualizing bibliometric networks. We also counted the number of spatial scales and temporal scales to understand the commonly used spatio-temporal units of dengue risk prediction. Finally, different data-driven models and evaluation metrics were classified and described to help science and society to better understand their differences.
3. Current Status of Dengue Risk Forecasting
3.1. Dengue Predictors and Data Sources
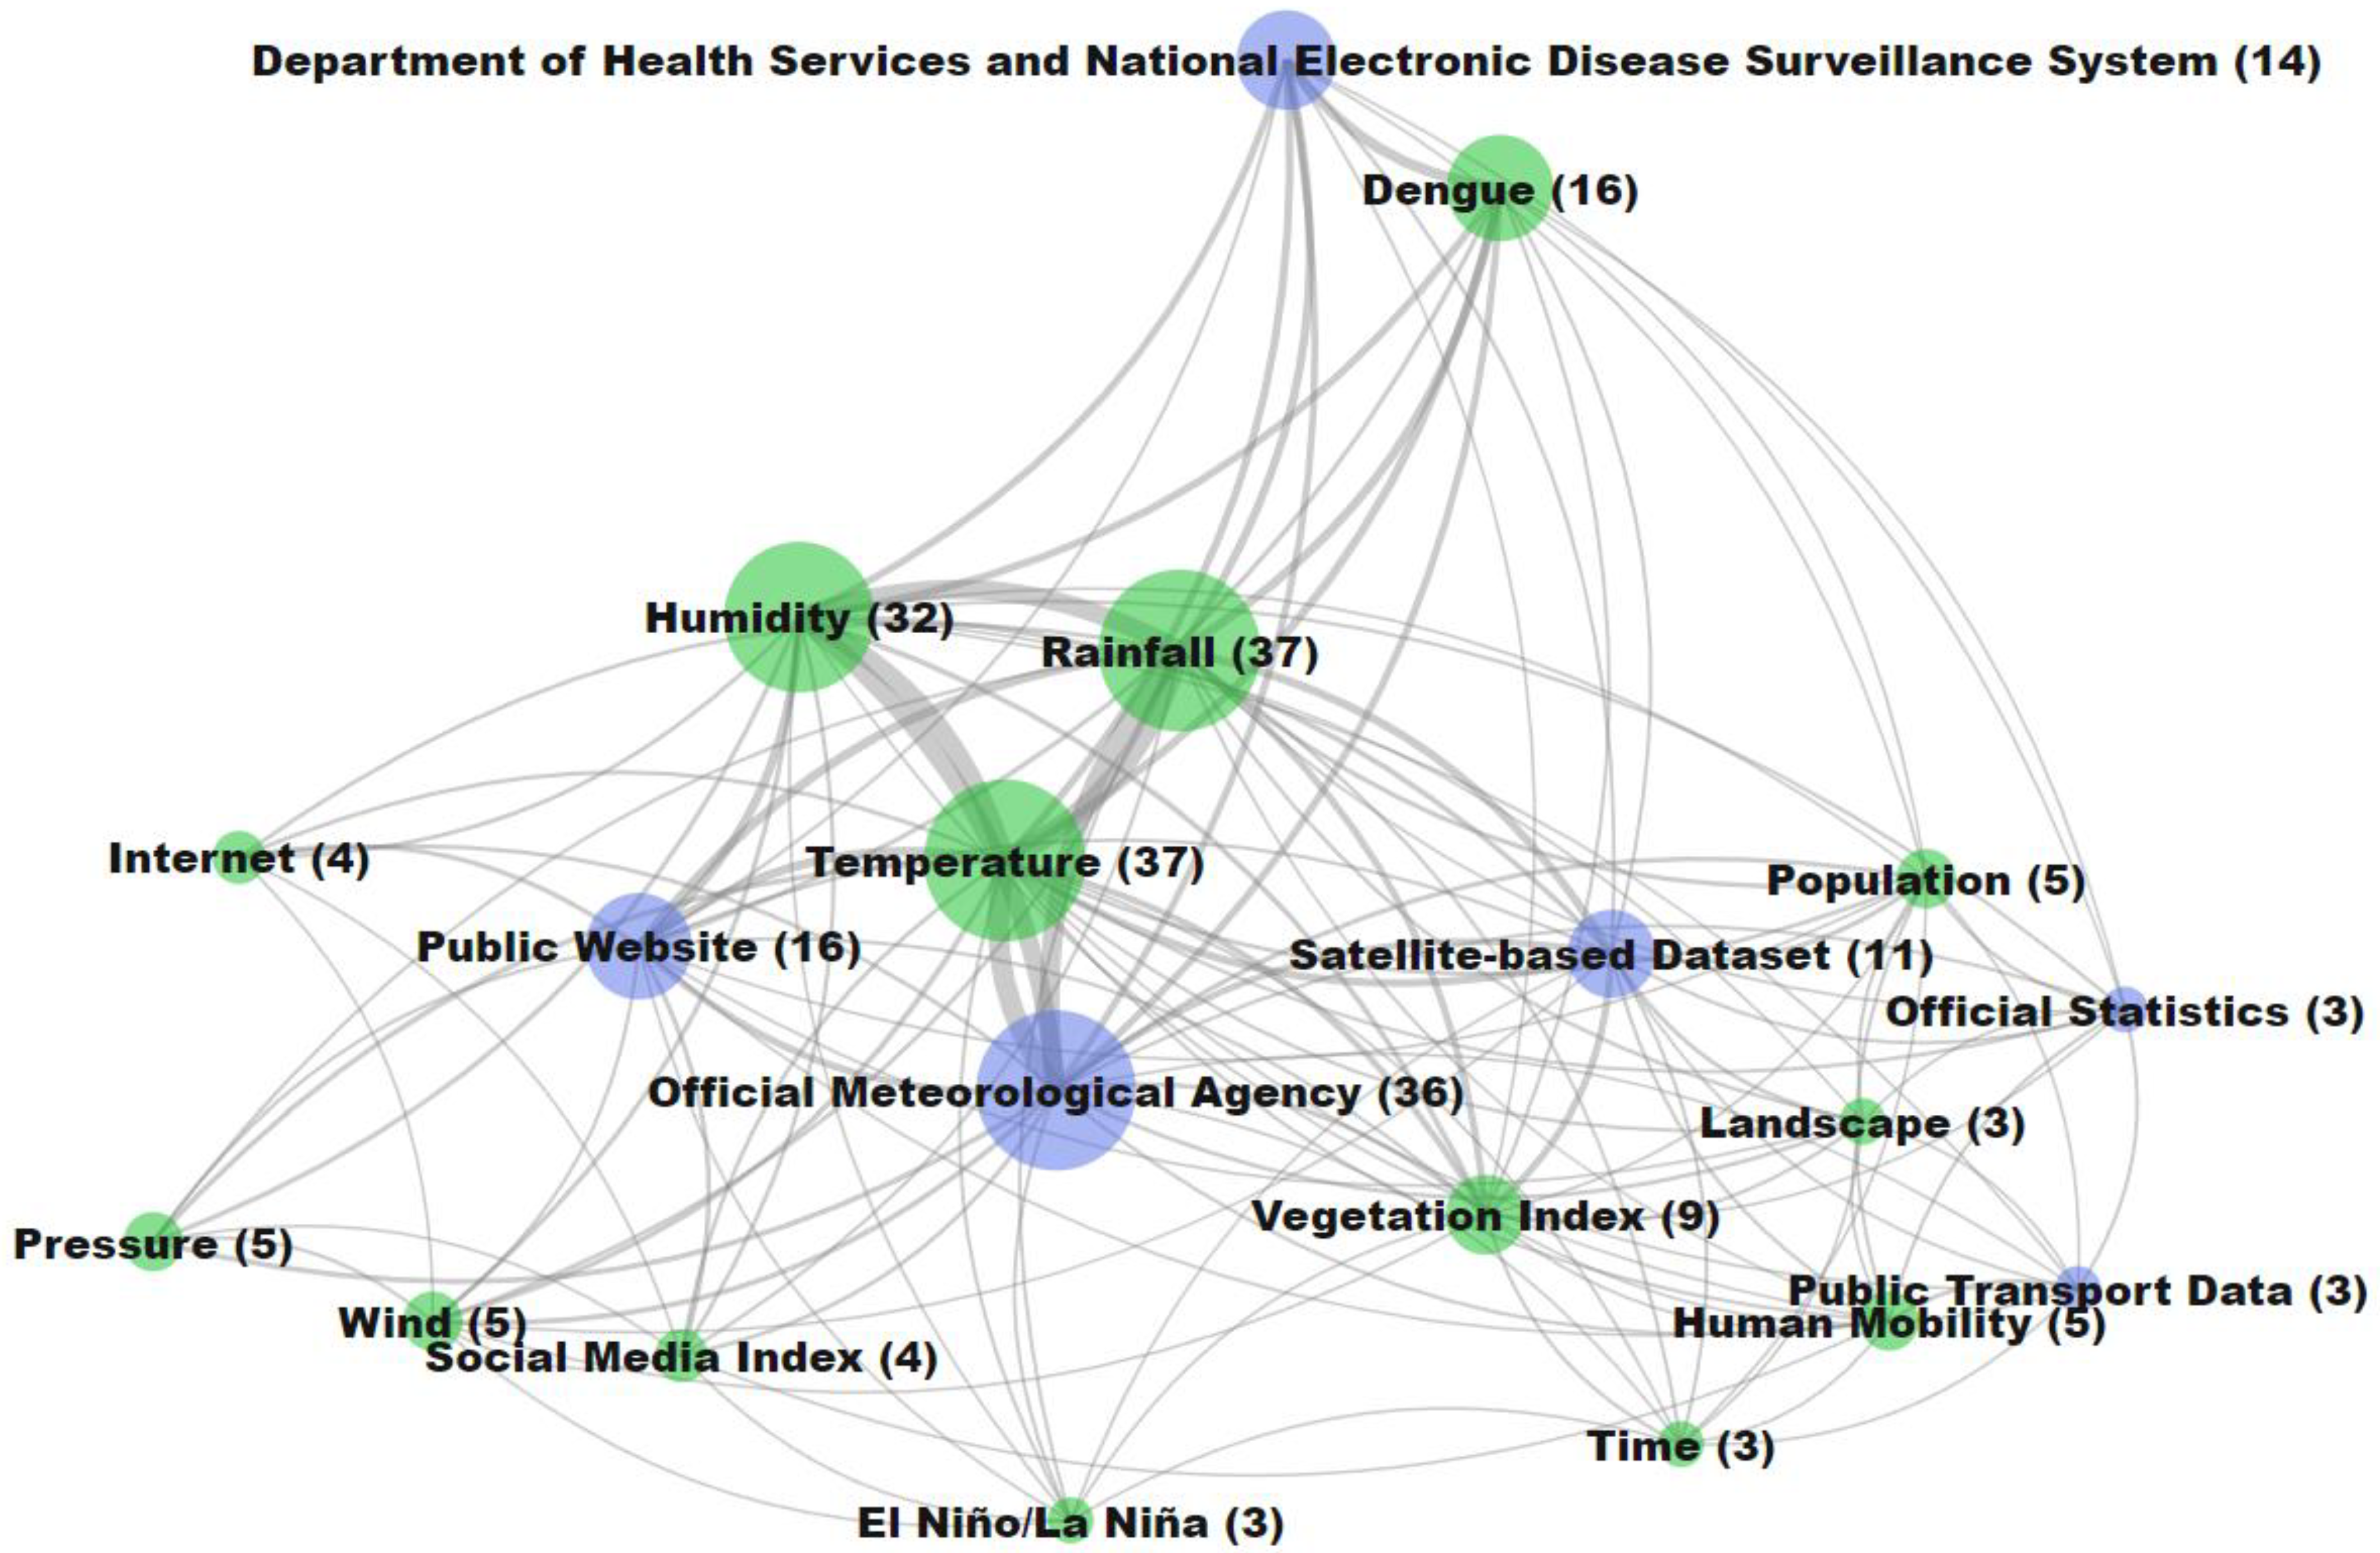
Figure 4 presents the co-occurrence map of predominant dengue predictors and data sources listed in Table A1, which highlights the significance of local climate conditions (e.g., temperature, rainfall, humidity, pressure, and wind), historical time series of dengue cases, vegetation index, human mobility, population, internet search index, social media index, landscape, time index, and extreme weather events (e.g., El Niño and La Niña) in recent studies of dengue risk forecasting. In addition to the common dengue risk predictors, other factors have also been mentioned in dengue risk forecasting, such as the economic index [23], education index [23], air quality [18], sunshine index [50,64], and mosquito biting rate [36].
Different types of predominant dengue predictors play different roles in dengue risk forecasting, which are explained in detail below:
- ➢
- ➢
- Historical time series of dengue cases are becoming increasingly important for future dengue risk prediction as they can provide the temporal characteristics of the dengue transmission of the specific study area: the important basis for future dengue transmission [12,16]. In addition, the time series of dengue cases in a typical dengue epidemic area can be used as one of the covariates for risk forecasting in its neighboring cities due to the proximity of the two cities and the spatial and temporal relationship between the dengue epidemics in the two cities [16,67];
- ➢
- ➢
- ➢
- ➢
- Internet search indices (e.g., the Baidu search index and Google search index) were utilized for dengue tracking as they are widely accessible worldwide, and represent the real-time attention of the population to a popular event, providing it strong potential to supplement current epidemiological methods [9,27,69];
- ➢
- Social media indices, mainly including tweet counts and Sina Weibo posts, were widely used for dengue risk forecasting as social media has become the key communication tool for governments, organizations, and individuals to disseminate valuable information to the public during dengue epidemics. In addition, individual users can also post their concerns and awareness of the dengue epidemics [29];
- ➢
- ➢
- ➢
- Extreme weather events (e.g., El Niño and La Niña) can drive climate variability at both seasonal and inter-annual intervals [21].
Many types of data sources were used to identify the above dengue risk predictors in previous studies, mainly including data from the official meteorological agency, satellite-based datasets, public websites, department of health services and national electronic diseases surveillance systems, official statistics, and public transport datasets (Figure 4 and Table A1).
- ➢
- The official meteorological agencies provide data collected from meteorological stations that are mainly used for identifying local climatic factors;
- ➢
- Satellite-based datasets, including multi-source remote sensing images and ready-to-use products, can be used for computing the local climate factors (e.g., temperature and rainfall) and vegetation indices;
- ➢
- Public websites, such as search engines and social media sites, can provide internet search indices and social media indices;
- ➢
- Both the department of health services and the national electronic diseases surveillance systems (e.g., the Brazilian Notifiable Diseases Information System (SINAN) and the nowcasting surveillance system of arboviruses in Brazil, namely, infodengue [68]) provide historical dengue cases. It should be noted that some dengue projects (e.g., NOAA dengue forecasting project [69]) can also provide historical dengue epidemiological data;
- ➢
- Official statistics provide data related to population density and building age in recent studies of dengue risk forecasting;
- ➢
- Public transport data, such as bus transportation data and incoming and outgoing travel volumes, were used to characterize human mobility.
3.2. Spatial and Temporal Scales
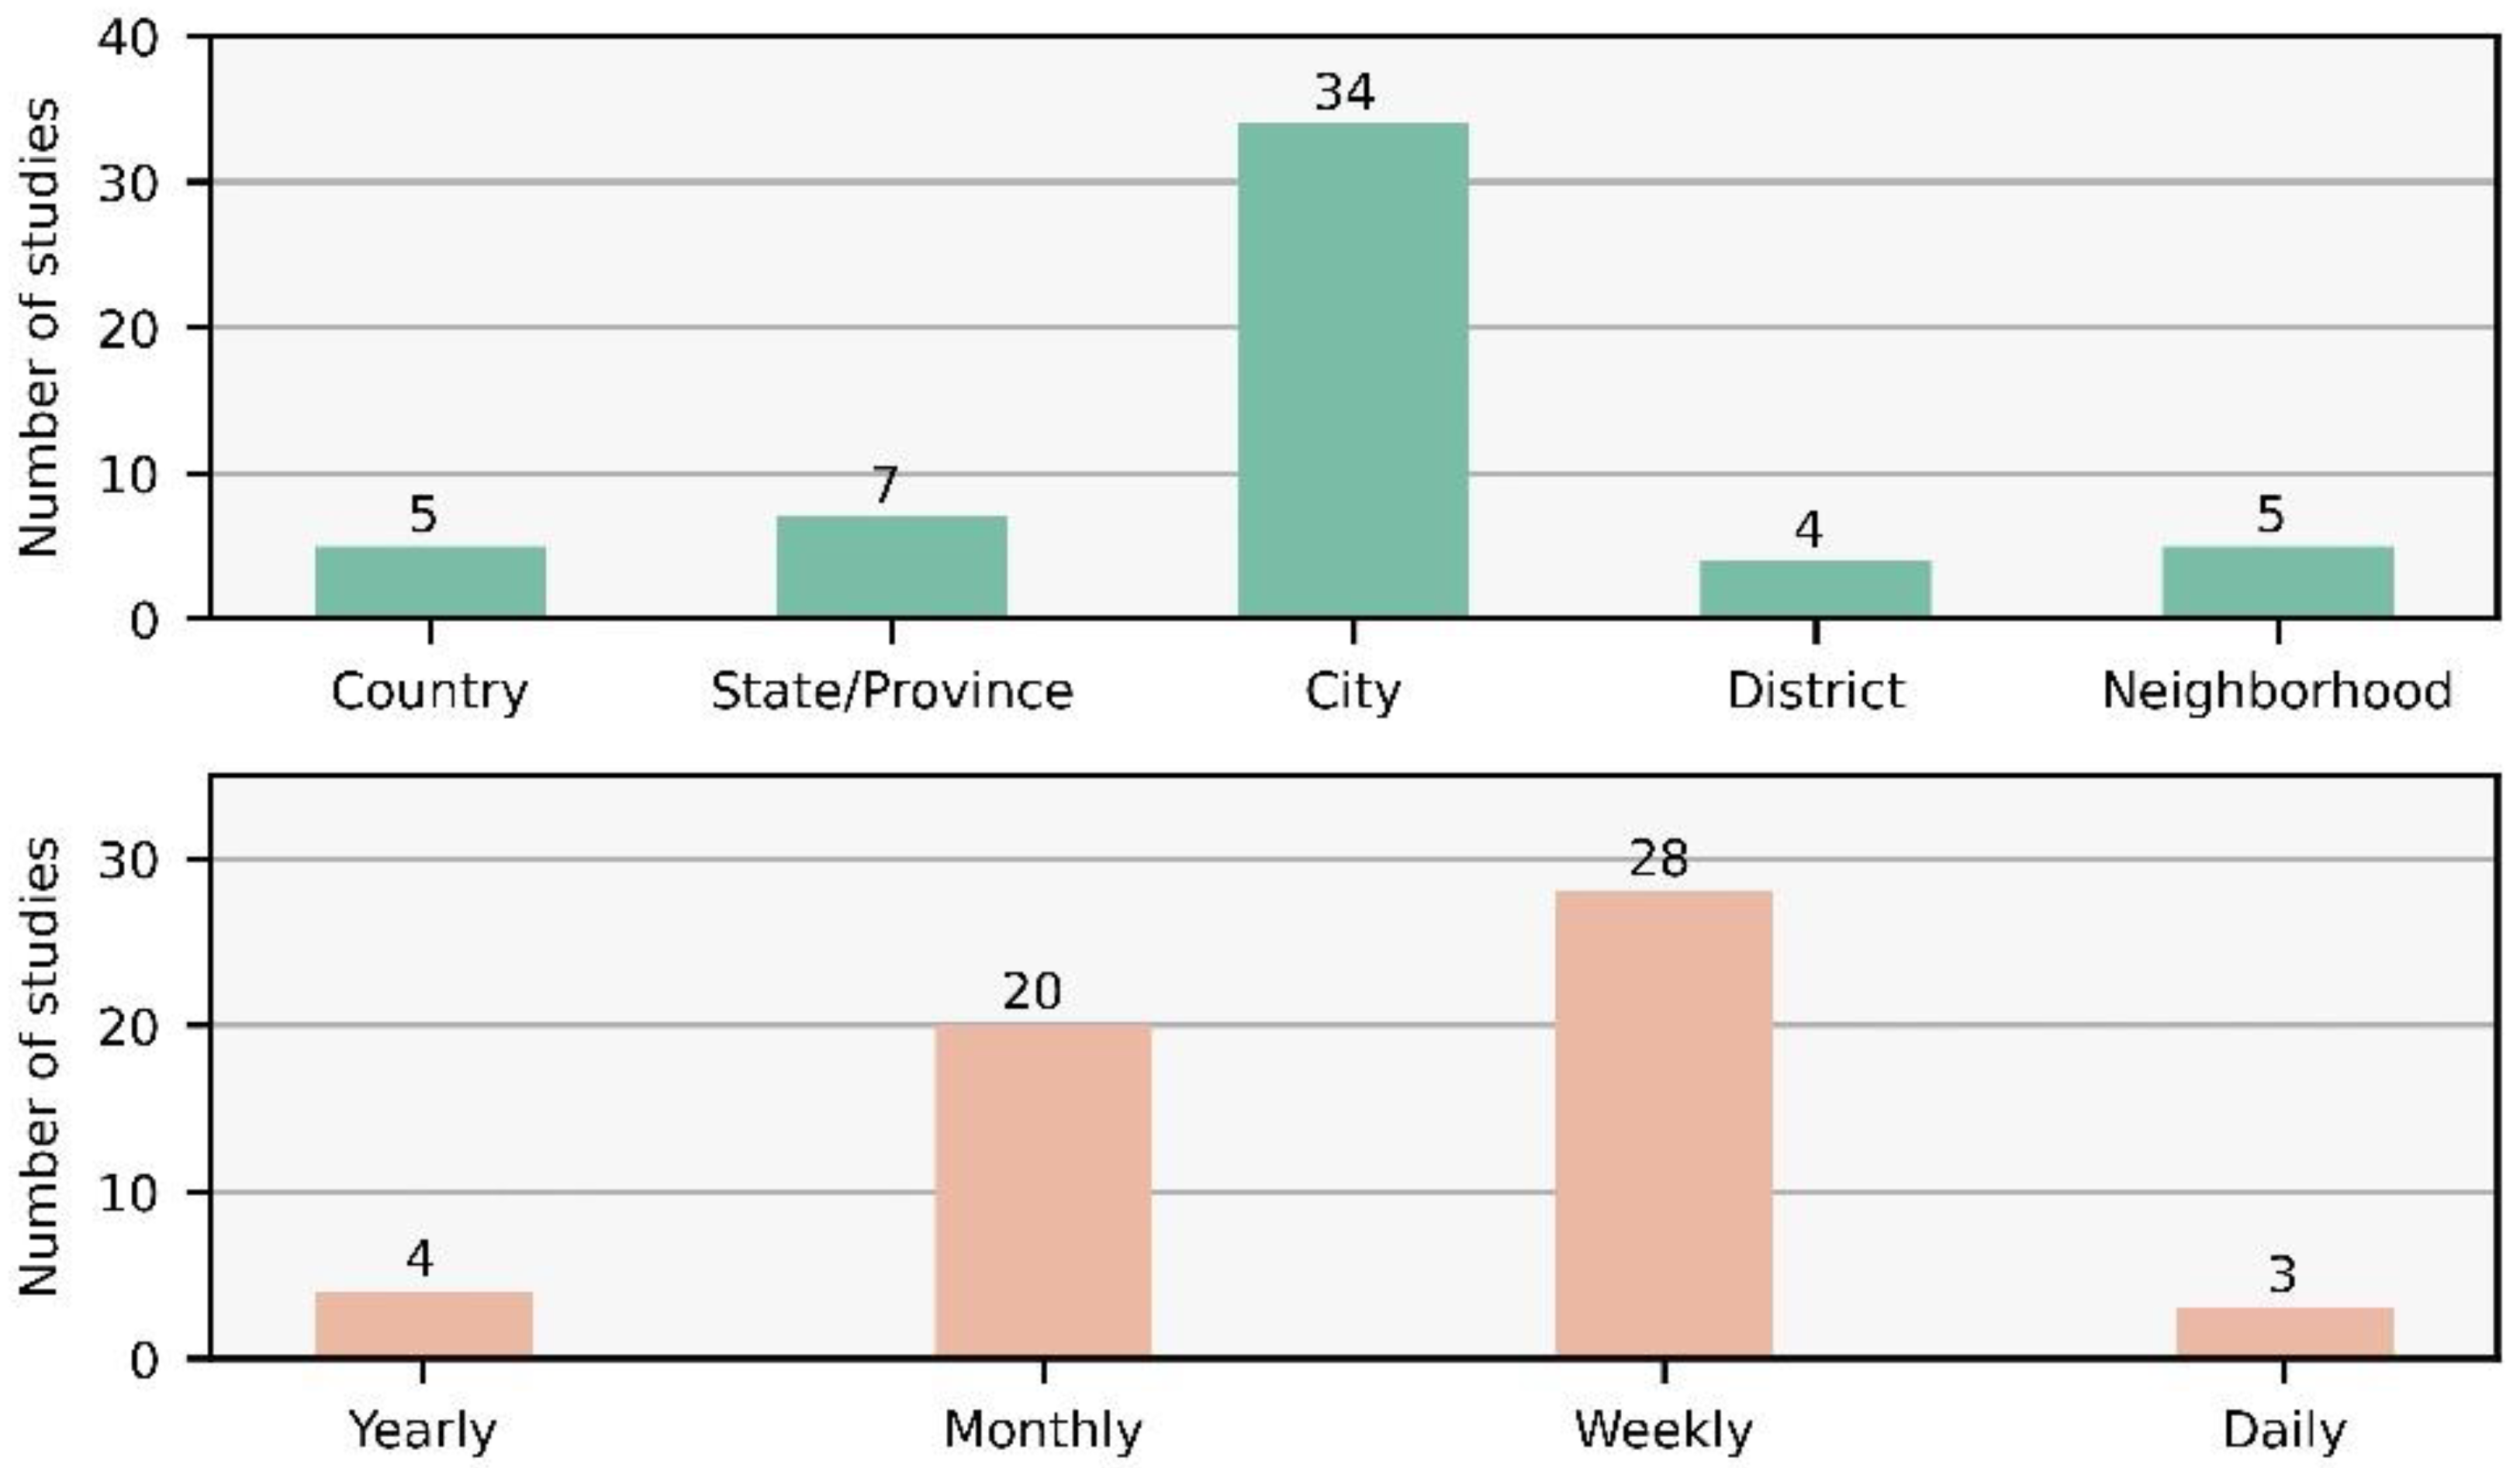
Recent studies have predicted the dengue risk at different spatial scales, such as country-level, state/ province-level, city-level, district-level, and neighborhood-level, and different temporal scales, including yearly, monthly, weekly, and daily (Figure 5). The spatial scale that has received the most attention is the city-level, while the popular temporal scales are monthly and weekly. The availability of dengue epidemiological data probably affects the selection of spatial and temporal scales in dengue risk prediction. Most studies mainly obtained dengue epidemiological data (i.e., cases or incidence rates) from the department of health services, national electronic disease surveillance systems, published articles [70], and dengue forecasting projects [68,69], which are often provided at the spatial scale of a city or state/province; thus, there is a value for each week or each month. Multi-source data of dengue risk predictors need to be downscaled in space and time to match the spatial and temporal scales of epidemiological data. Notably, the state/province-level and city-level dengue risk forecasting models are often used to provide an early warning signal (EWS), whereas the fine-grained intra-urban forecasts (e.g., district-level and neighborhood-level) enable one to predict the areas with higher dengue risk, facilitating the precise implementation of prevention and control strategies [17,25]; however, dengue data sparsity at the intra-city level in some study areas makes data-driven risk prediction difficult [17,43].
3.3. Models
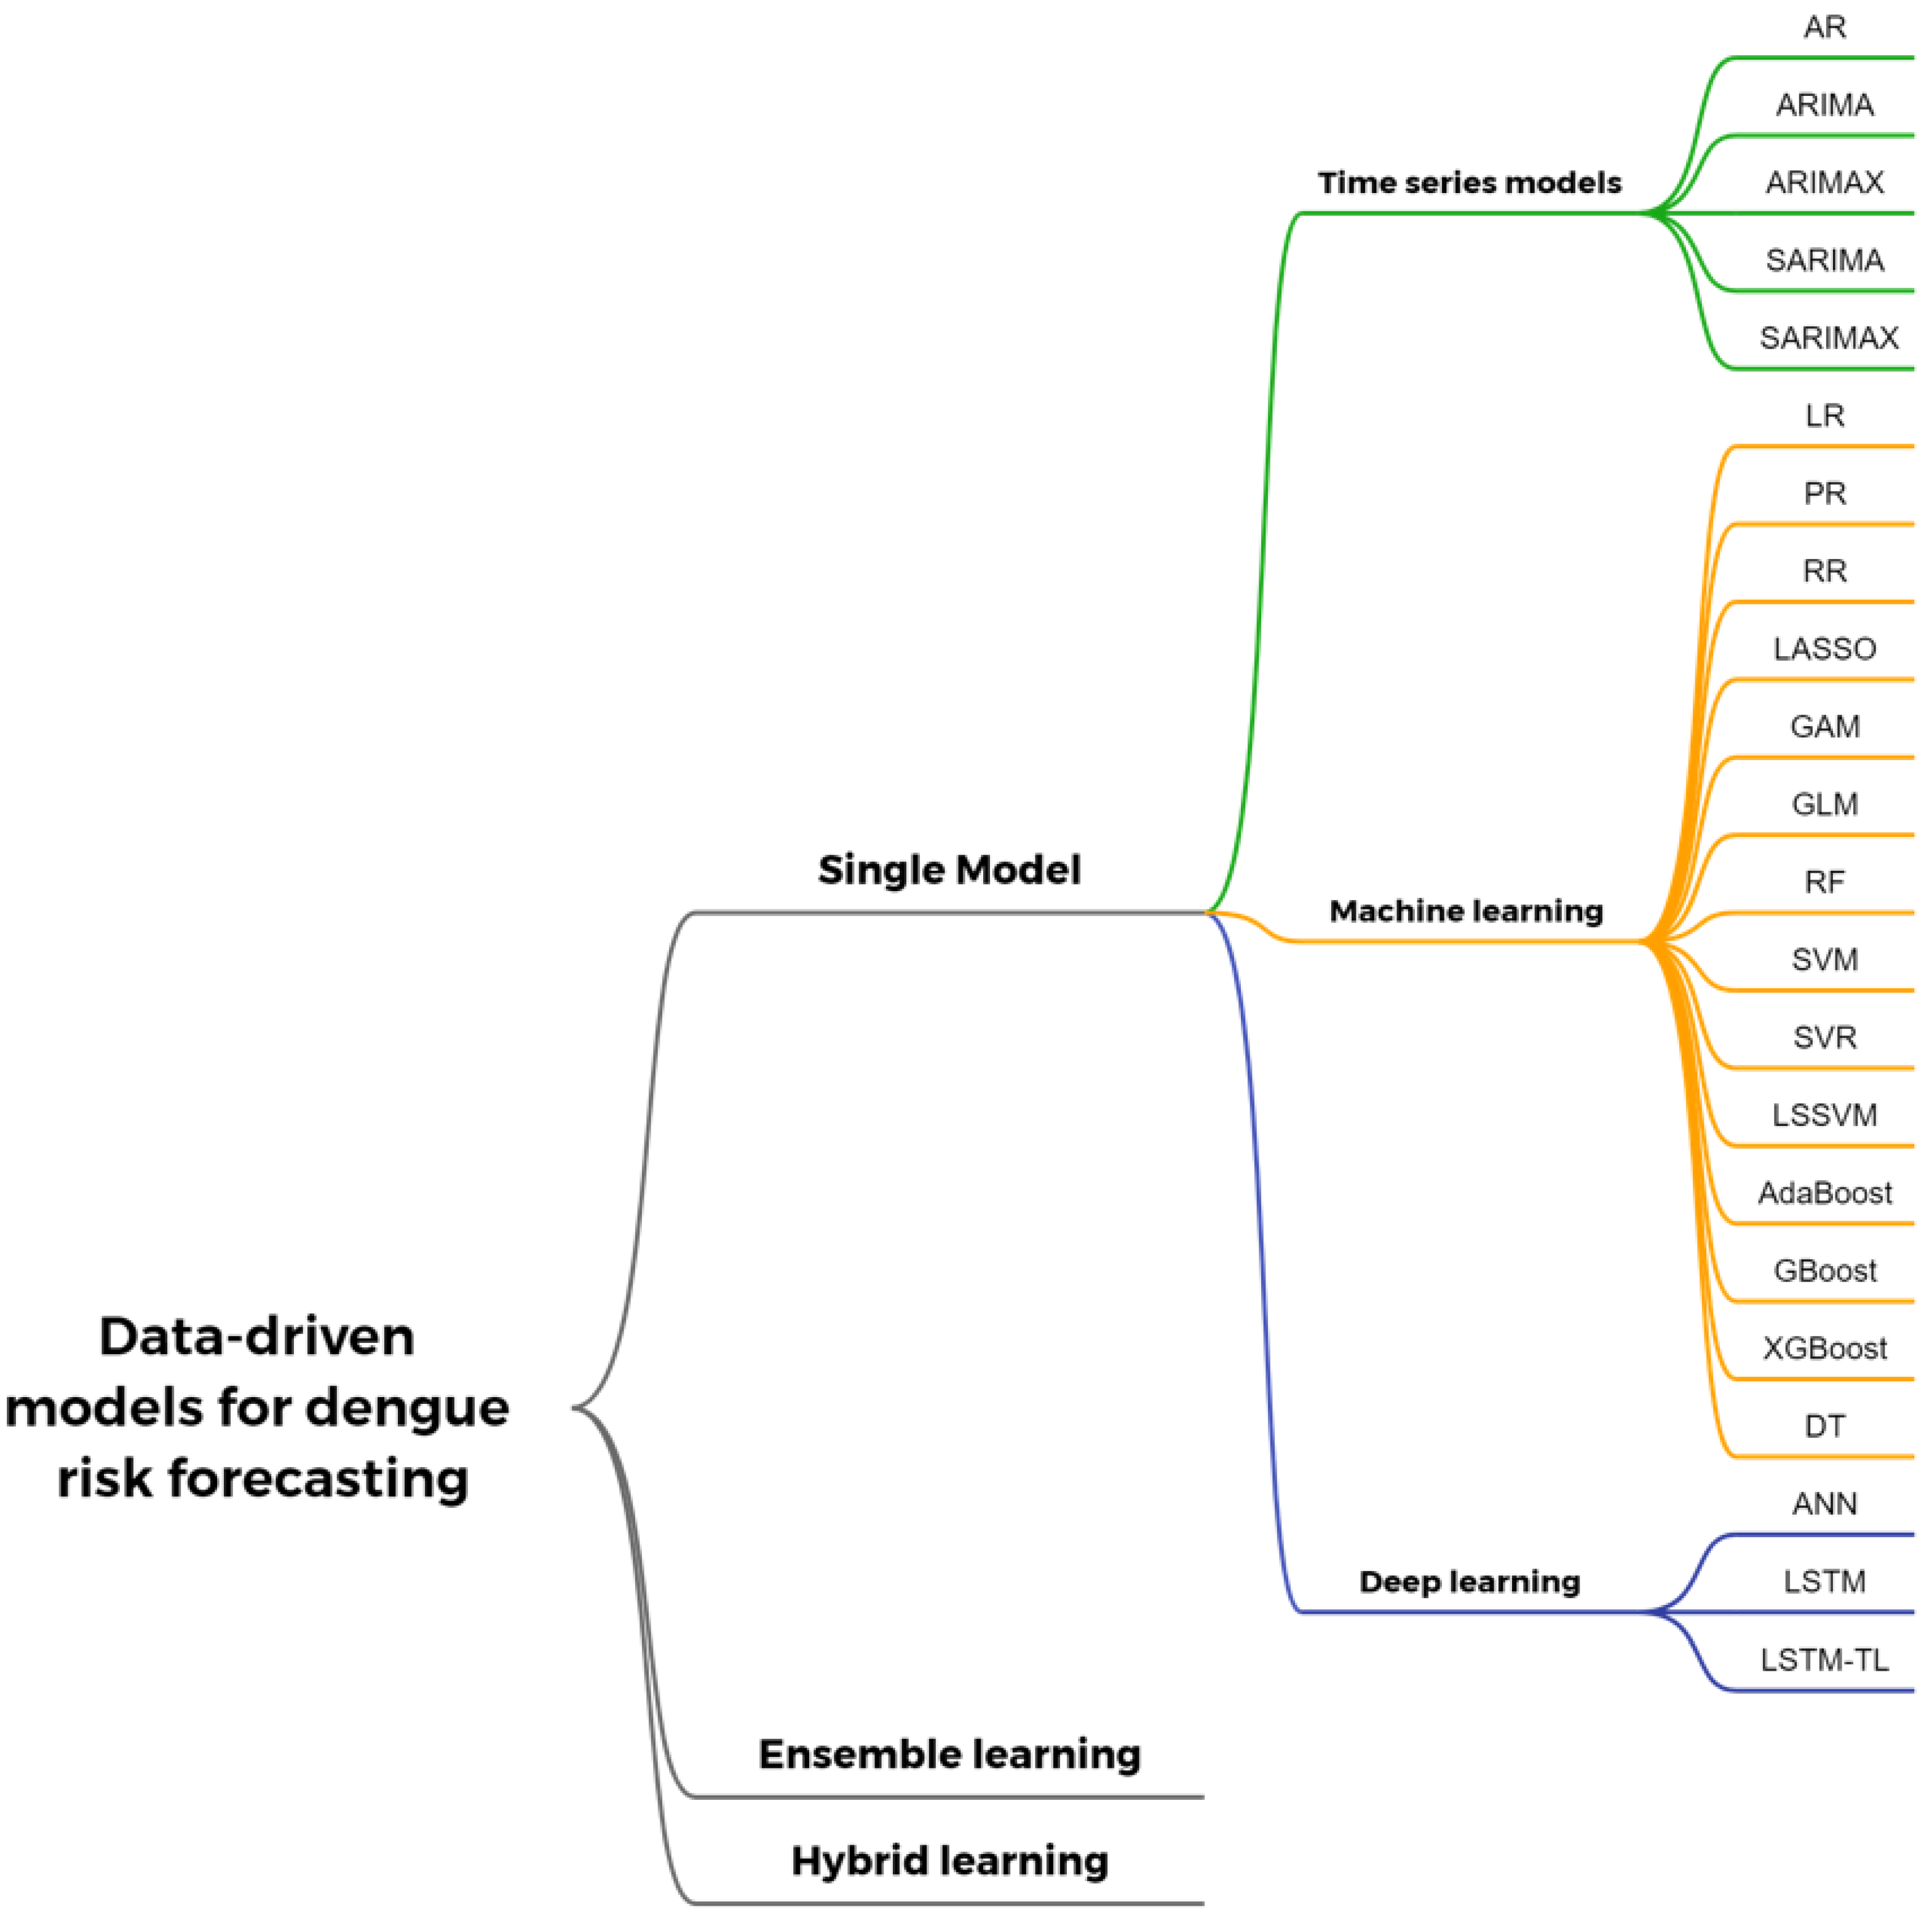
The popular data-driven methods for dengue risk forecasting can be categorized into three groups: (1) single-model forecasting approaches; (2) ensemble learning; and (3) hybrid learning (Figure 6). Single-model forecasting approaches use time series, machine learning, and deep learning models to predict the dengue transmission risk separately. Moreover, they use computed model evaluation metrics and they compare the predictive performance of models. Both ensemble learning and hybrid learning combine the strengths of multiple models for improving the accuracy of dengue risk prediction. The principle of ensemble learning is not model coupling, but rather the best possible combination of the predicted results from two or more base models via different approaches. The training and evaluation of different models are implemented separately or sequentially. In contrast, hybrid learning couples two or more single models or combines data manipulation algorithms with models, and then realizes the model initialization through parameter optimization. Detailed information to this end is presented below.
3.3.1. Time Series Models
The time series methods for dengue risk forecasting include the auto regression (AR), the autoregressive integrated moving average model (ARIMA), autoregressive integrated moving average eXogenous variable models (ARIMAX), the seasonal integrated moving average model (SARIMA), and seasonal autoregressive integrated moving average with eXogenous factors (SARIMAX). ARIMA is a linear model that forecasts dengue risk using only historical dengue time series while being stationary (i.e., the mean and variance of dengue time series are independent of time). It includes AR, moving average (MA), and integration (I). To construct an ARIMA, the first step is to transform the non-stationary dengue data series into a stationary time series using d-order differencing. Then, the orders of the AR model (p) and MA model (q) are determined using ordinary least squares by analyzing the autocorrelation (OLS). Moreover, ARIMAX, SARIMA, and SARIMAX are a variation of ARIMA, which could add external variables, a seasonal component of historical dengue time series, and both of them to ARIMA. In real applications, ARIMA, ARIMAX, SARIMA, and SARIMAX are often used as the benchmark for evaluating the performance of other models [12,23,24,25,37,45,53].
3.3.2. Machine Learning Approaches
Diverse machine learning models are used in dengue risk forecasting that convert the prediction of future dengue cases into a linear or non-linear regression task (Figure 6), including linear regression (LR), Poisson regression (PR), ridge regression (RR), the least absolute shrinkage and selection operator (LASSO), the generalized additive model (GAM), the generalized linear model (GLM), random forest (RF), support vector machine (SVM), support vector regression (SVR), least square support vector machines (LSSVM), adaptive boosting (AdaBoost), gradient boosting (Gboost), decision tree (DT), and eXtreme gradient boosting (XGBoost). In addition, a few studies consider the identification of dengue outbreaks as forecast targets (Table A1), which identifies the outbreaks using machine learning models [13,62] or determines the outbreaks based on the predicted dengue cases [25].
3.3.3. Deep Learning Approaches
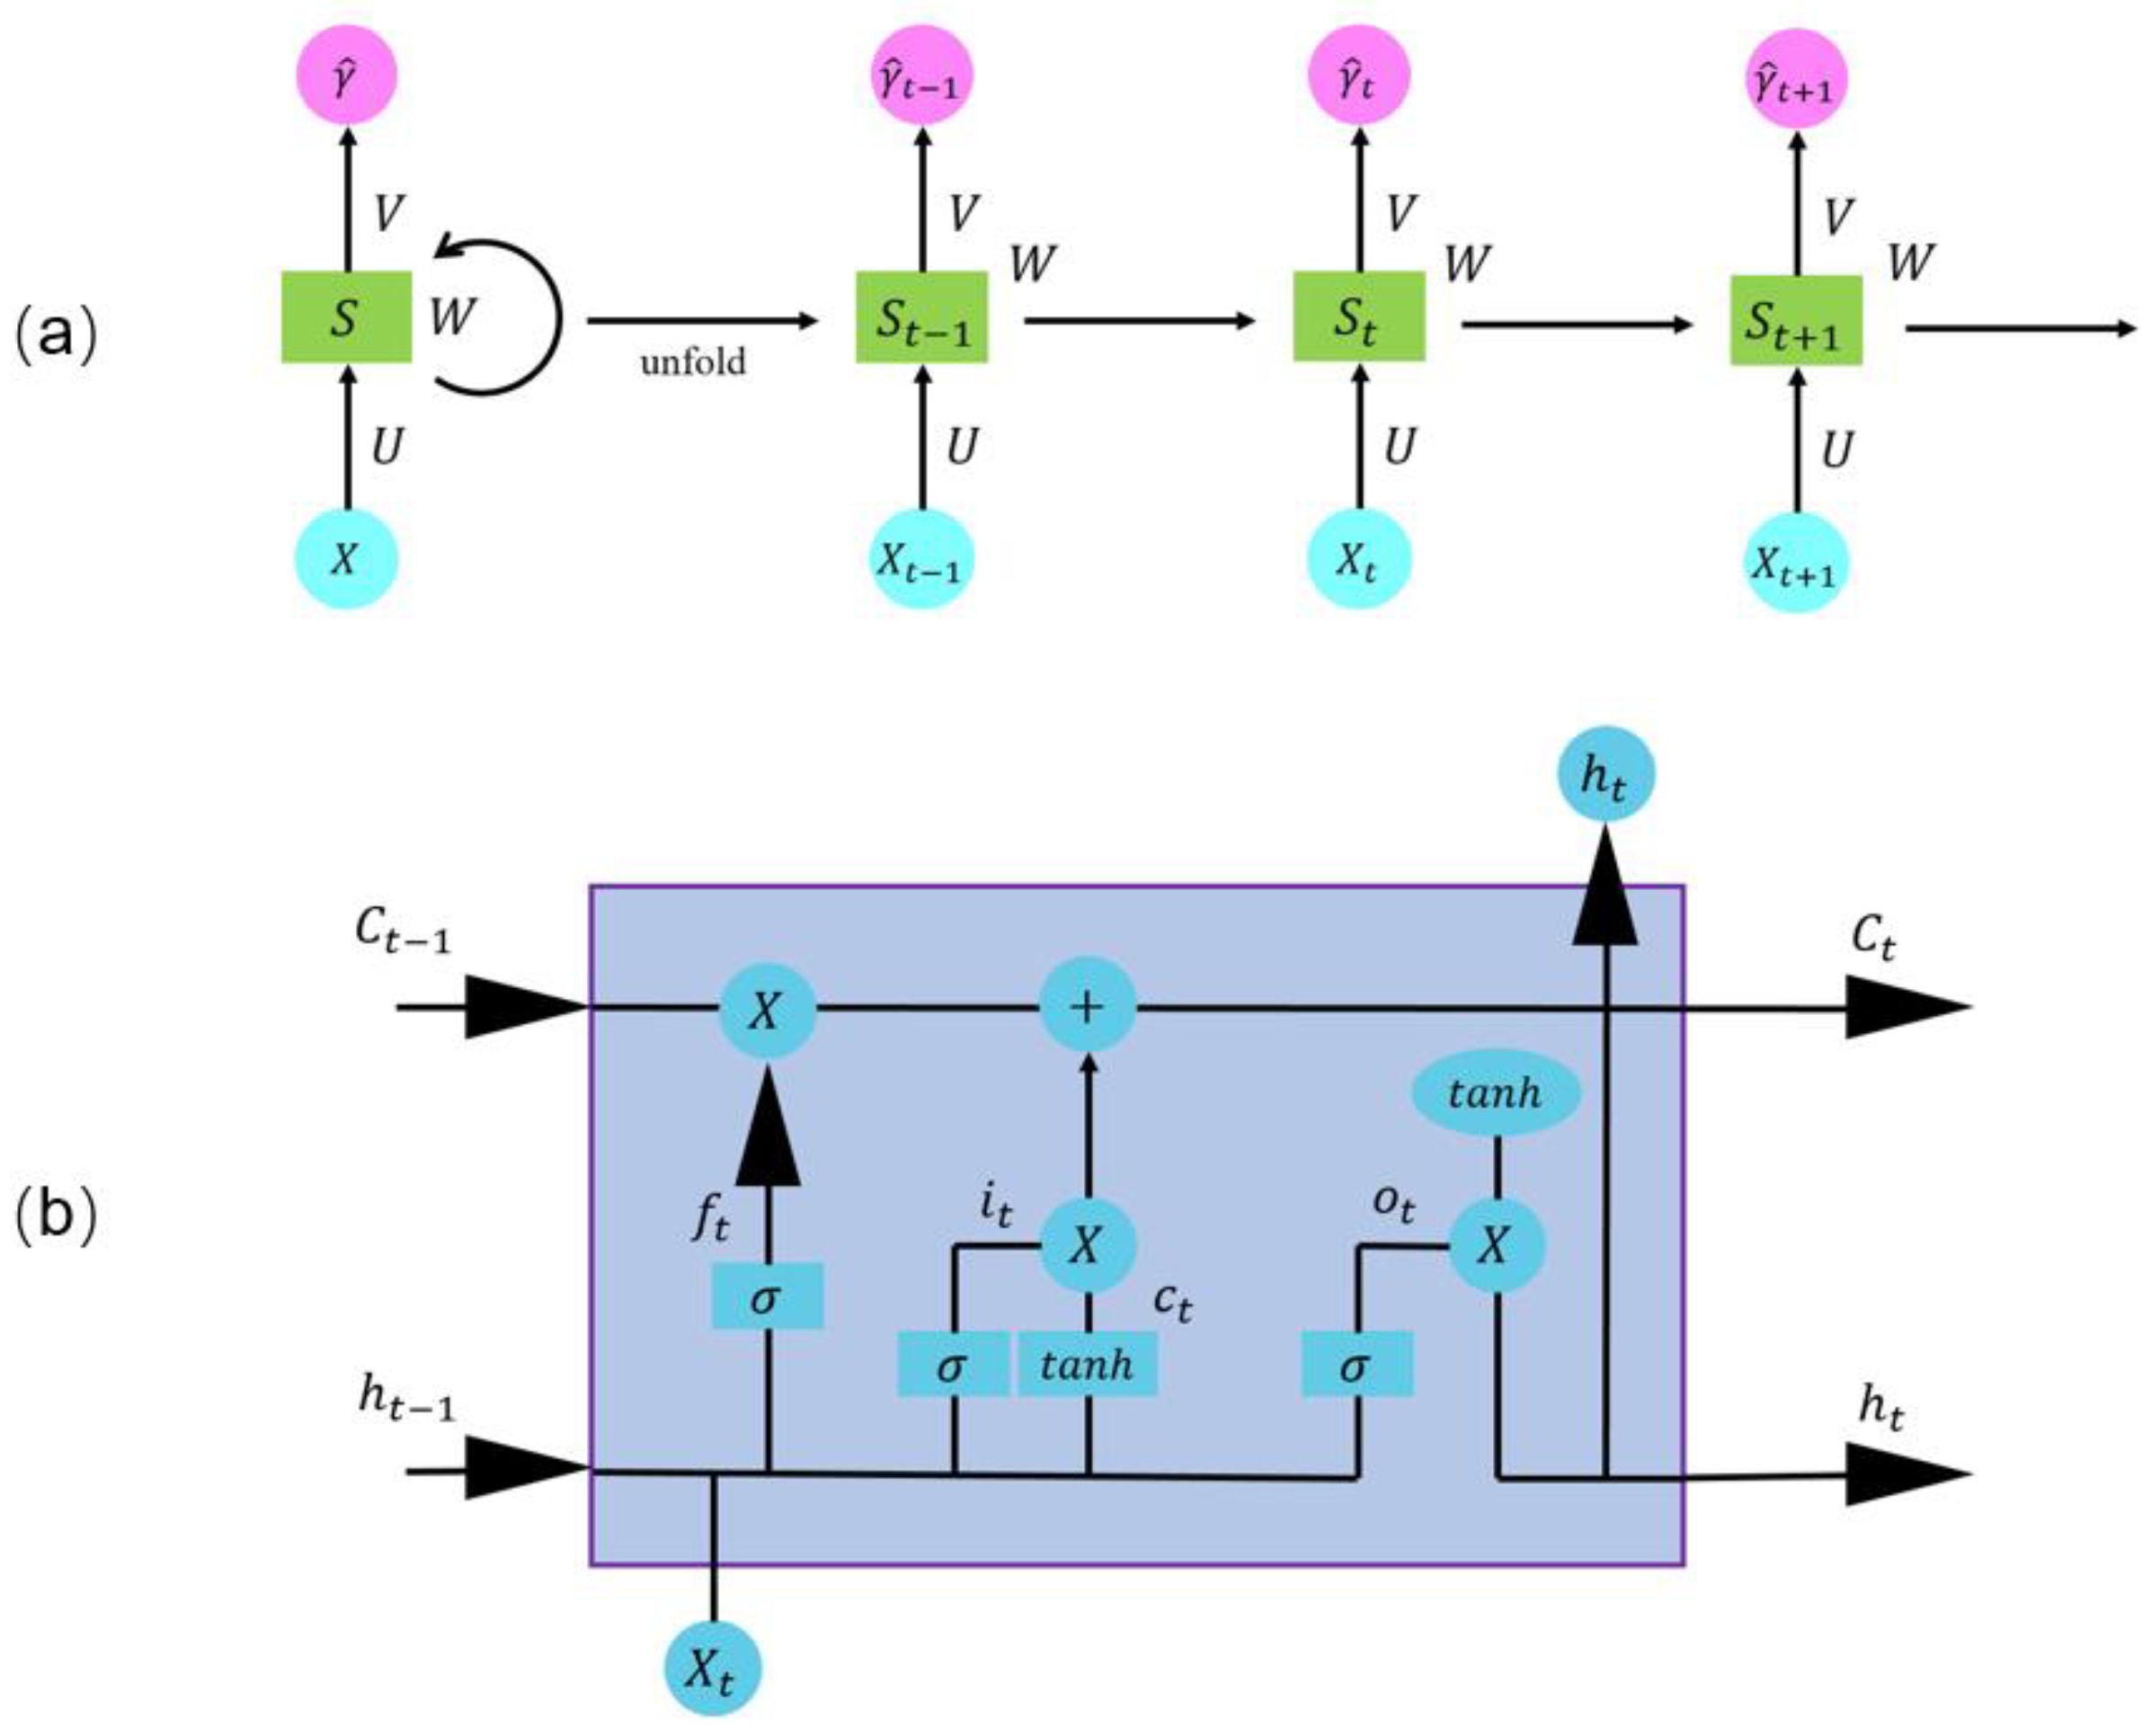
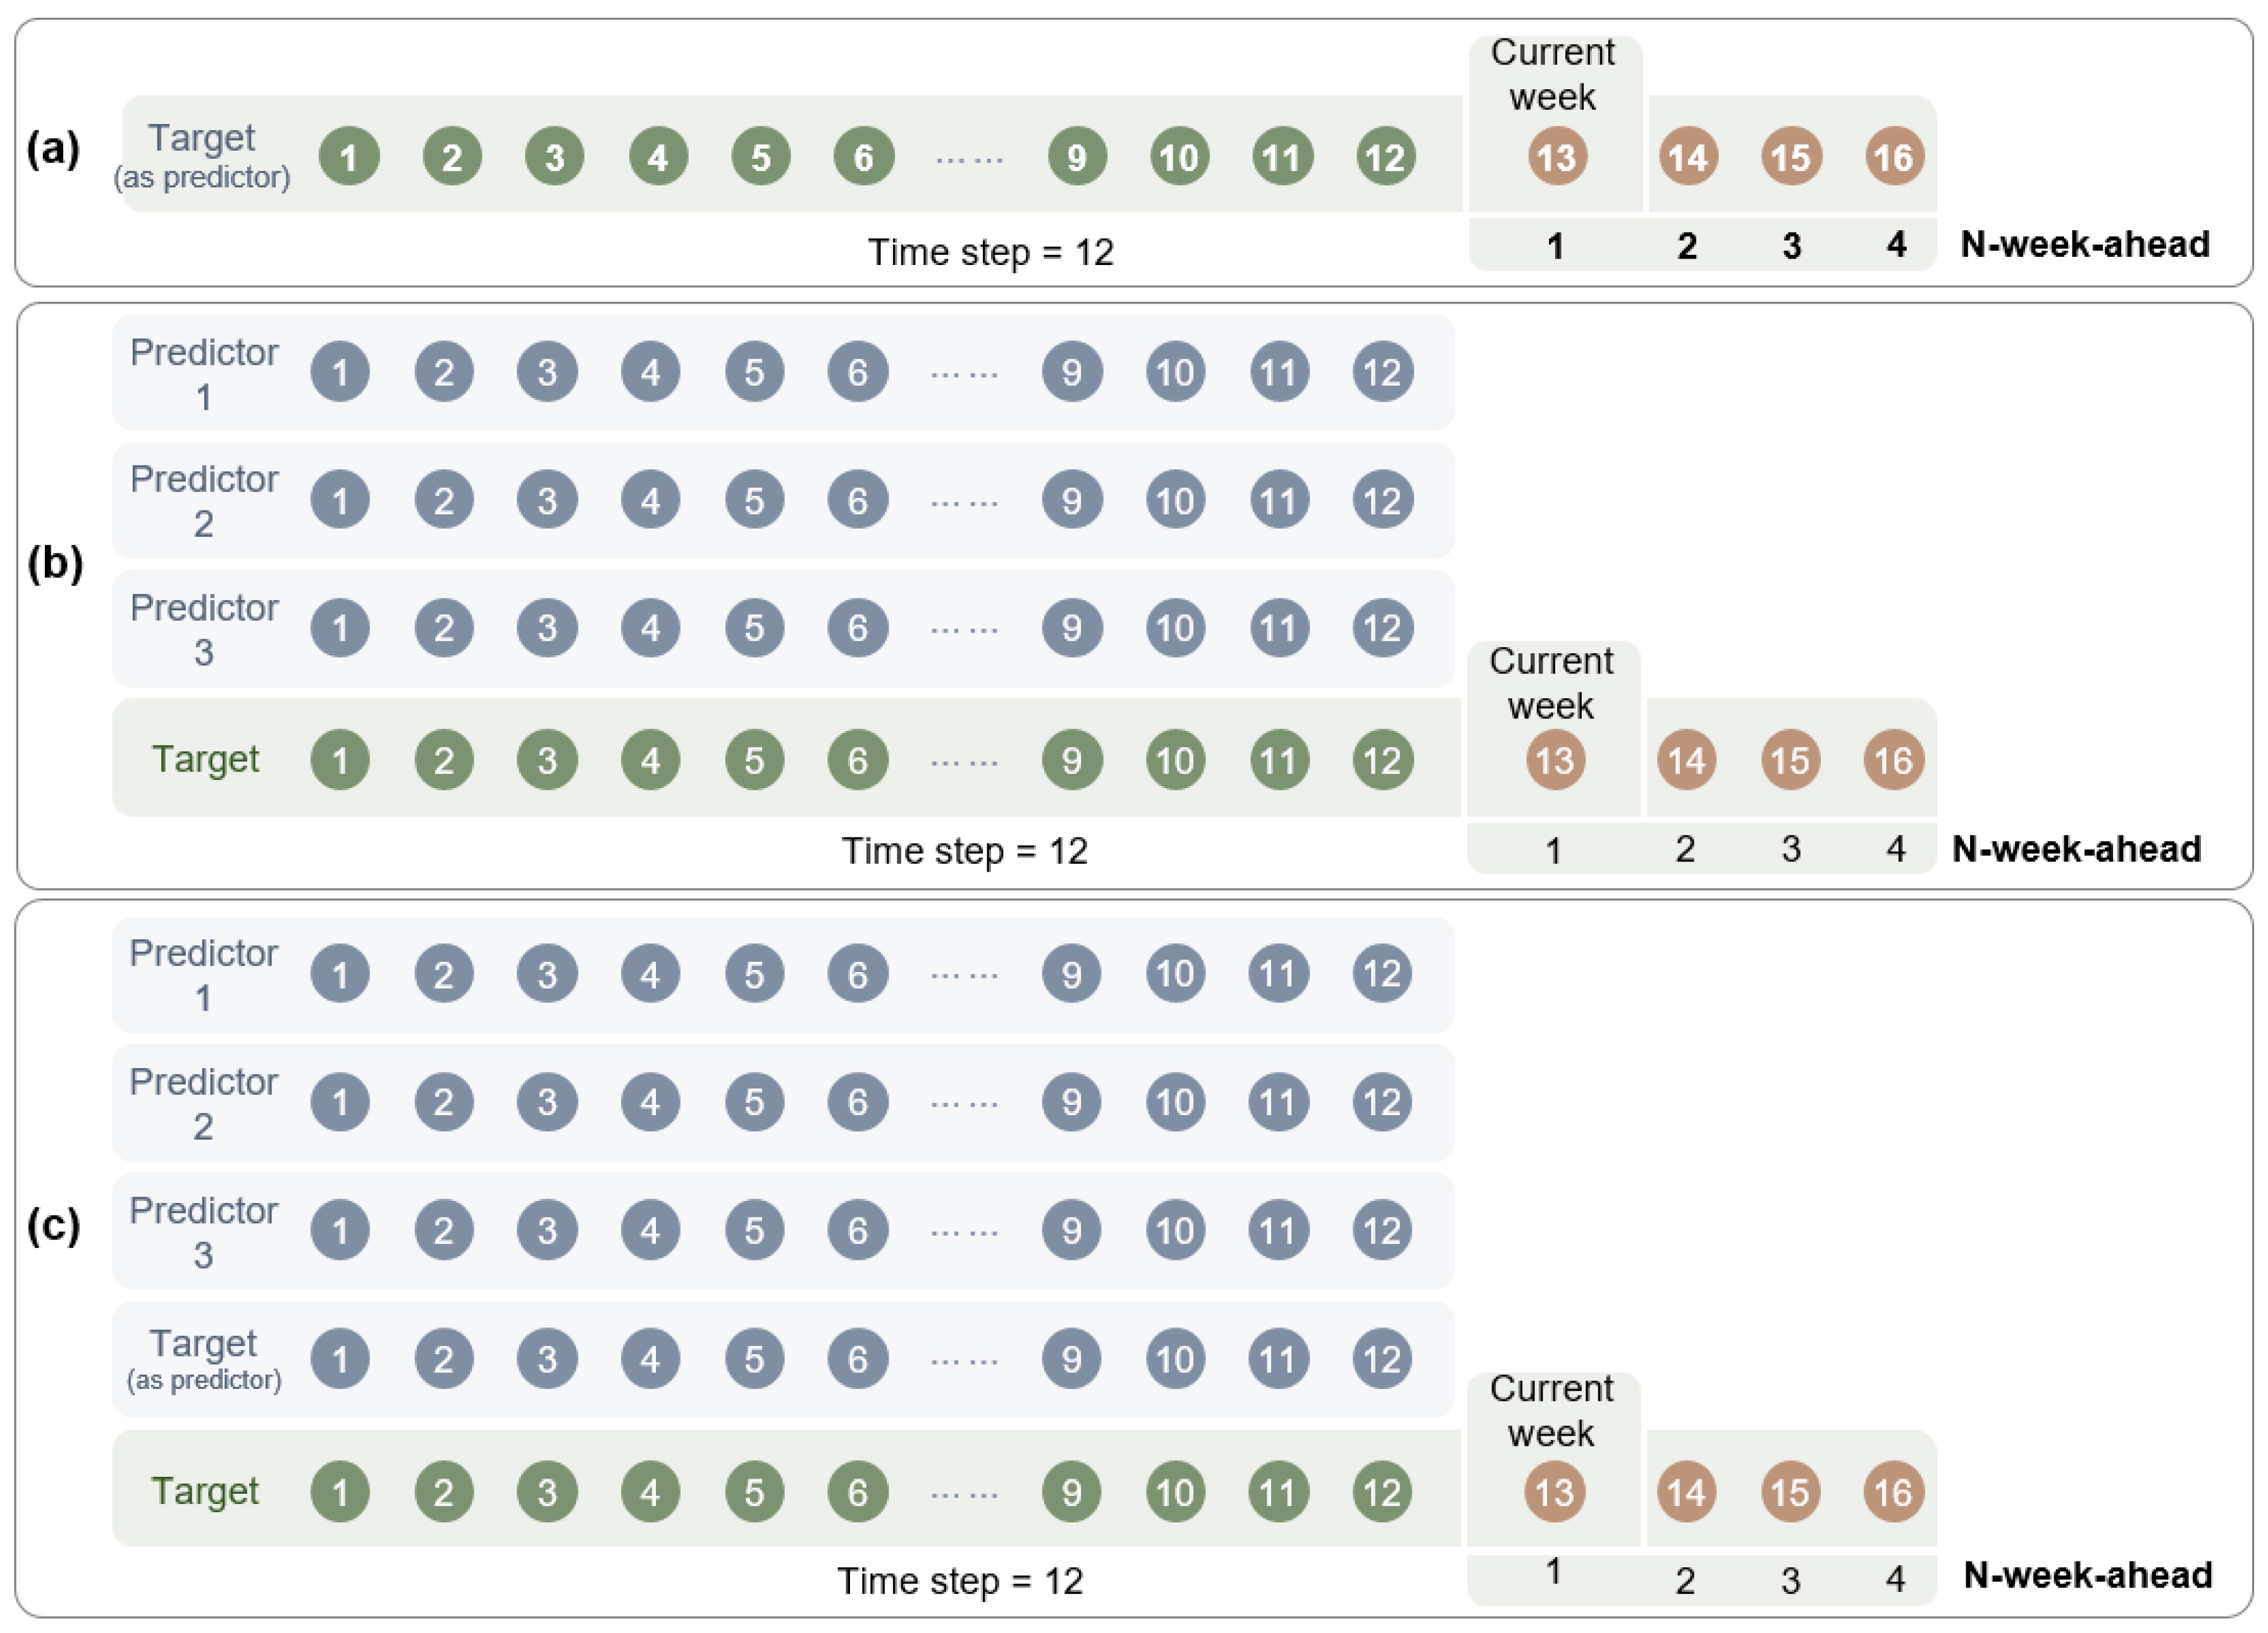
Compared with time series and machine learning methods, the use of deep learning models is still limited in recent studies of dengue risk forecasting. Deep learning models include artificial neural networks (ANN) [23,30,38,44,53], convolutional neural network (CNN) [64], long–short-term memory (LSTM) [12,14,16,25,45,64], LSTM with transfer learning (LSTM-TL) [16,61], LSTM with attention mechanism (LSTM-AT) [64], and transformer [64]. LSTM-TL enables the transfer of a pre-trained LSTM model from one study area to another area if the two areas have comparable climatic and environmental conditions and dengue epidemics [16,67]. In fact, LSTM become popular in dengue risk forecasting due to its good performance and high practicality [12,16,64]. It is an RNN architecture (Figure 7a) and can automatically identify the characteristics of long-term trends and short-term fluctuations of time series via an input gate, an output gate, and a forget gate (Figure 7b) [71]. It is not susceptible to gradient vanishing and gradient explosion and is therefore capable of learning non-linear relationships from long sequences of data [72]. It can adjust how long the time series of predictors (i.e., the time step in Figure 8) is used to explore the non-linear relationship between predictors and forecast targets [16]. Additionally, it permits implementing N-week-ahead prediction (i.e., the prediction in advance of dengue epidemics) by considering different time lags between predictors and forecast targets, and defining multiple scenarios to analyze the role of historical dengue cases (Figure 8a), external factors (Figure 8b), and both of them in dengue risk forecasting [12] (Figure 8c).
3.3.4. Ensemble Learning
Ensemble learning combines the forecasting results from a set of single models to generate the outcomes of interest using different algorithms, such as bagging, boosting, random subspace, and stacked generalization. This acts to reduce the bias and variance from single models and to improve the accuracy of forecasting [73]. The robust performance of ensemble learning can be explained by the fact that every single model learns different features from time-series sets, while the aggregated model learns all of the useful features learned by the single models [73].
In recent years, ensemble learning has been applied to dengue risk forecasting [27,37,39,53]. Specifically, Guo et al. (2019) developed an ensemble penalized regression algorithm (EPRA) for the near real-time forecasting of dengue occurrence and outbreaks, which includes model training, validation, evaluation, and aggregation. EPRA compiled the results of five penalties using the bagging method and iterative random sampling [27]. Buczak et al. (2018) incorporated three single models with different predictors (i.e., analogue models with dengue and climate data, additive seasonal Holt–Winters models with or without wavelet smoothing, and simple historical models) into an ensemble model [37]. Rangarajan et al. (2019) used the additive seasonal Holt–Winters model in dengue case forecasting, creating multiple models by varying the input parameters (e.g., the seasonal length, error measure metrics, and the ending month of the training set), and then combining them by weighting the forecasts from single models to achieve the best performance [39].
3.3.5. Hybrid Learning
Hybrid learning often employs two single models and effectively combines them using optimization algorithms based on the additive relationship between linear and non-linear time series components, and there are typically three hybrid learning structures: parallel, series, and parallel-series [74]. Parallel hybrid learning provides a combination of different forecasts, and the relative effectiveness of each forecast (i.e., a component weight) is determined by selecting a specific weighting algorithm, and the weighted forecasts are combined using linear or non-linear functions. Series hybrid learning decomposes the time series into linear and non-linear components, models them using linear and non-linear models, and combines various forecasts for the final predictions. Parallel-series hybrid learning utilizes the strengths of both parallel and series structures by combining them [74].
Among them, series hybrid learning has shown promise in dengue risk forecasting. For instance, Chakraborty et al. (2019) proposed a series of hybrid models (i.e., ARIMA-SVM, ARIMA-ANN, ARIMA-LSTM, and ARIMA-NNAR) by combining ARIMA with machine learning and deep learning models utilizing a series structure [30]. AI models are used to handle the residual values between actual data and forecast results, while ARIMA is used to model the linear tendency. These proposed models are evaluated on three dengue time-series sets, and the hybrid model has superior performance and reduces model uncertainty in inferential statistics and time series [30].
3.4. Evaluation Metrics
Model evaluation in dengue risk prediction primarily involves the following aspects (Table A1): (1) Quantifying the variance/correlation between time-series observations and predicted values (e.g., MSE, RMSE, MAE, RMAE, MAPE, MSLE, RRSE, RMSPE, Pearson correlation, and R2); (2) Assessing the ability to identify whether the disease outbreak occurs (e.g., confusion matrix, accuracy, ROC, MCC, precision, and sensitivity); (3) and Indicating the uncertainty of model performance (e.g., p-value and confidence interval). It should be noted that the dropout method can be used to generate the forecast intervals for deep learning models, and then indicate the uncertainty of model performance. For example, our previous study generated many forecasts by randomly dropping a fixed percentage of units and calculating the maximum, minimum, and mean of many forecasts to produce the predicted interval based on the fixed parameters of LSTM and testing set [12].
4. Discussion
We identified the current status of dengue risk forecasting in terms of the predictors and data sources, data-driven models, spatial and temporal scales, and evaluation metrics, based on 53 papers published from 2018 to the present. Focusing on the development of big geospatial data and deep learning, and the need for fine-grained prediction of dengue risk, we explored the potential of big geospatial data, cloud computing, and deep learning in future dengue risk forecasting in the following discussion.
4.1. Potentials of Big Geospatial Data in Identification of More Dengue Risk Predictors
The majority of current dengue risk forecasting studies predict the number of cases or incidence rates at given spatial scales, mainly using time series of temperature, precipitation, humidity, pressure, wind, and vegetation predictors. Some publicly available geospatial data facilitate the identification of these factors (Figure 4). Other factors, such as hydrological, landscape, and socio-economic factors, affecting dengue transmission risk remain limited in risk prediction. The impact of these factors on dengue transmission is evident, especially in Southeast Asia, which is a typical dengue region with intense urban sprawl, a dense population, diverse landscape types, and suitable climate conditions. For example, river-level proved to be strongly related to dengue risk because rivers were shown to act as breeding sites for Aedes mosquitoes in Dhaka, Bangladesh [75]. Landscape factors proved to have a strong influence on increasing sensitivity to the occurrence of Aedes mosquitoes [76]. Urban landscape types (e.g., residential, commercial, industrial, slum, construction sites, and trees) can be considered as proxies for the number of mosquito breeding and resting sites and Aedes–human encounters [6], and urbanization favors the spread of dengue by creating new breeding and resting sites and increasing the likelihood of Aedes–human encounters. Additionally, dengue transmission is significantly related to the Gross Domestic Product (GDP) in Guangzhou, China [77].
These factors provide us with more detailed spatial information on the breeding and resting sites of mosquitoes and their identification requires multi-source geospatial data. A recent study used pixel-level satellite image segmentation to identify various urban landscape factors (i.e., buildings, roads, trees, cropland, waterways, and standing water), computed the percentage of each factor per township, and integrated both the deep landscape features and temporal features of climate factors into a time series susceptible infected recovered (TSIR) model to forecast dengue outbreaks. Liu et al. (2021) used a pre-trained CNN to extract features from street-view images of Baidu Maps to represent the physical environment’s suitability for mosquito breeding, which was combined with meteorological factors to predict dengue risk [17]. Moreover, some ready-to-use geospatial data related to socio-economic factors have been published, such as the gridded global GDP datasets at 5 arc-min resolution for 1990, 2000, and 2015 [78,79]. These studies highlight the importance of different geospatial data types in future dengue risk forecasting, which focuses on identifying accurate spatial features and improving the accuracy of dengue risk prediction by integrating both spatial and temporal features in modeling.
4.2. Potential of Geospatial Data Cloud Computing in Dengue Risk Prediction
The effective use of big geospatial data is complicated due to the volume and velocity requirements of big geospatial data, the diversity of datasets and resolutions, and the variety of data analysis methods [5,80,81]. In recent years, the emergence of free-to-use cloud computing platforms for big geospatial data, such as Google Earth Engine (GEE), has provided unprecedented opportunities for dengue risk forecasting [82]. First, the GEE platform hosts a large number of remote sensing images from various sensors (e.g., MODIS, Landsat 4, Landsat 5, Landsat 7, Landsat 8, Sentinel-1, and Sentinel-2), global scale ready-to-use datasets on multiple topics (e.g., vegetation indices, impervious surface, population density, land surface temperature, and meteorological reanalysis), and a variety of algorithms (e.g., image preprocessing, image composite and visual interpretation, feature extraction, machine learning, and deep learning models) [83,84]. Table 1 illustrates a selection of global-scale big geospatial data that enables the identification of dengue climate and environment at different spatial and temporal scales and the definition of the predominate area of dengue transmission by creating a buffer zone with a fixed size (e.g., the fight range of Aedes mosquitoes) around the impervious surface. Second, it is able to divide the big geospatial data and use multiple computers to process them in parallel to produce the predictors according to the spatial and temporal scales required for the dengue prediction task. Third, it allows external raster and vector data to be uploaded and can provide additional predictors for dengue risk forecasting. A recent literature review on the application of the GEE platform indicates that it has great potential for multiple applications, such as land cover and land use mapping, and climate change, urban, and habitat mapping [85]. However, its applications in public health are still limited, and only two studies have used GEE in the identification of factors driving disease to date. Frake et al. (2020) used GEE to identify multiple driving factors of malaria [86], and our previous study demonstrated the capability of GEE in identifying dengue climate and environmental factors on a weekly scale [12]. Therefore, future research should focus more on big geospatial data cloud computing to build a multi-scales dataset of dengue risk predictors and achieve accurate and timely risk predictions.
4.3. Potentials of Deep Learning Models in Dengue Risk Forecasting
Diverse CNN-based very high resolution (VHR) image segmentation enables the accurate identification of landscape elements in the deep learning community, and diverse CNN models (e.g., U-Net and DeeplabV3+) have been developed in recent years [85]. Integrating CNN-based urban landscape maps and open-source urban data (e.g., Point-of-Interests (POI) data) enables the identification of building types (such as residences, institutions, commercial areas, and urban villages/slums) [87,88]. This information could be useful to characterize the likelihood of human–Aedes encounters and enhance dengue risk forecasting. Another potential of deep learning may be the provision of new architectures that can adapt to various forecast scenarios. The majority of studies focus on dengue risk forecasting at large spatial scales, and forecasting dengue risk within cities at finer spatial scales remains limited (Figure 5). As a result of the spatial heterogeneity of landscape and socio-demographic conditions, for instance, dengue risk frequently varies across a city, and forecasting dengue risk in a city at finer spatial scales (e.g., the neighborhood-level or grid-level) is more significant for precise prevention and control. In this situation, convolutional Long–Short-Term Memory (ConvLSTM) is a viable option that can effectively predict the sequential evolution of spatial patterns by learning the relationships between time and space.
4.4. Limitations of the Use of Big Geospatial Data and Deep Learning in Dengue Risk Forecasting
Even with important advancements in big geospatial data cloud computing and data-driven methods, developing accurate, timely, and effective dengue risk models remains challenging. For example, other factors affecting dengue transmission, such as the cycle of four dengue serotypes (i.e., DENV 1–4) [89], population immune status [89], and mosquito population [90,91], are often difficult to quantify. In addition, the number of dengue cases is also affected by the accuracy of the local disease surveillance system and the awareness of dengue fever among the populace [92]. As a result of the possibility of error in the disease surveillance procedure, dengue epidemiological data contain substantial noise, which has an impact on the ability of models in dengue risk forecasting.
5. Conclusions
This study examined the use of big geospatial data in the identification of dengue risk predictors and data-driven methods for dengue risk forecasting. We identified the commonly used predictors and data sources; the spatial and temporal scales; data-driven methods, including time series, machine learning, deep learning, ensemble learning, and hybrid learning; and model evaluation metrics in contemporary dengue risk forecasting. The potential of big geospatial data cloud computing and deep learning for future dengue risk forecasting was then explored in detail. This review produced timely and essential information regarding dengue risk forecasting, which will help future dengue risk forecasting tasks and the risk forecasting of other arboviral diseases, such as Zika and Chikungunya.
Author Contributions
Conceptualization, methodology, data analyses, original draft preparation and reviewing the bibliography: Z.L. Funding acquisition and reviewing the manuscript: J.D. All authors have read and agreed to the published version of the manuscript.
Funding
This study was supported by the Key Research Program of Frontier Sciences (QYZDB-SSW-DQC005) of the Chinese Academy of Sciences (CAS), the Strategic Priority Research Program (XDA19040301) of the CAS, and the Institute of Geographic Sciences and Natural Resources Research of the CAS (E0V00110YZ).
Conflicts of Interest
The authors declare no conflict of interest.
Appendix A

Table A1.
Article ID (J: journal article, C: conference paper), authors, publication year, spatial scales, temporal scales, types of predictors, types of data sources, models, evaluation metrics, and types of tasks (R: regression, C: classification) used in the selected journal and conference articles.
| ID | Authors | Year | Spatial Scales | Temporal Scales | Types of Predictors | Types of Data Sources | Models | Evaluation Metrics | Task |
|---|---|---|---|---|---|---|---|---|---|
| J1 | Li et al. [12] | 2022 | City-level | Weekly | Temperature | Satellite-based dataset | ARIMA LSTM | RMSE MAE | R |
| Rainfall | |||||||||
| Vegetation index | |||||||||
| Humidity | |||||||||
| Dengue | Department of health services and national electronic disease surveillance system | ||||||||
| C2 | Pham et al. [13] | 2018 | City-level | Daily | Temperature | Official meteorological agency | LR DT LSTM | RMSE MAE | R, C |
| Rainfall | |||||||||
| Humidity | |||||||||
| Wind | |||||||||
| Vegetation index | Satellite-based dataset | ||||||||
| J3 | Mussumeci et al. [14] | 2020 | City-level | Weekly | Temperature | Official meteorological agency | LASSO RF LSTM | MSE MSLE | R |
| Temperature | |||||||||
| Humidity | |||||||||
| Pressure | |||||||||
| Social media index | Public website | ||||||||
| C4 | Saleh et al. [15] | 2021 | City-level | Weekly | Rainfall | Public website | SVR LSTM | R2RMSEMAEMSE | R |
| Humidity | |||||||||
| Temperature | |||||||||
| Temperature | |||||||||
| Vegetation index | Satellite-based dataset | ||||||||
| J5 | Xu et al. [16] | 2020 | City-level | Monthly | Pressure | Official meteorological agency | GAM SVR GBM BPNN LSTM LSTM-TL | RMSE RRSE | R |
| Temperature | |||||||||
| Rainfall | |||||||||
| Humidity | |||||||||
| J6 | Liu et al. [17] | 2021 | Town-level | Weekly | Landscape | Public website | MLP SVM | Pearson correlation Hit rate | R, C |
| Temperature | Official meteorological agency | ||||||||
| Rainfall | |||||||||
| Population | Satellite-based dataset | ||||||||
| C7 | Chovatiya et al. [18] | 2019 | City-level | Monthly | Humidity | Public website | LSTM | RMSE | R |
| Temperature | |||||||||
| Pressure | |||||||||
| Rainfall | Official meteorological agency | ||||||||
| Air quality | |||||||||
| C8 | Mustaffa et al. [19] | 2018 | City-level | Weekly | Rainfall | Official meteorological agency | Hybrid FPA-LSSVM | MSE RMSPE | R |
| Temperature | |||||||||
| Humidity | |||||||||
| J9 | Liu et al. [20] | 2019 | City-level | Monthly | Temperature | Official meteorological agency | GAMM GAM | RMSE | R |
| Humidity | |||||||||
| Rainfall | |||||||||
| Internet | Public website | ||||||||
| J10 | Carvajal et al. [21] | 2018 | City-level | Weekly | Temperature | Official meteorological agency | GAM SARIMA RF GB | RMSEMAE | R |
| Rainfall | |||||||||
| Humidity | |||||||||
| Wind | |||||||||
| El Niño/La Niña | Official meteorological agency | ||||||||
| Social media index | Public website | ||||||||
| J11 | Appice et al. [22] | 2020 | State-level | Monthly | Temperature | Official meteorological agency | VAR ARIMA AutoTiC-NN M5 SVR kNN | RMSE Cluster analysis | R |
| J12 | Zhao et al. [23] | 2020 | Country-level/state-level | Weekly | Vegetation index | Satellite-based dataset | ARIMA RF ANN | MAE RMAE | R |
| Landscape | |||||||||
| Rainfall | |||||||||
| Population | Official meteorological agency | ||||||||
| Economic index | |||||||||
| Educational index | |||||||||
| Time | — | ||||||||
| J13 | Benedum et al. [24] | 2020 | City-level | Weekly | Dengue | Department of health services and national electronic disease surveillance system | PR Logistic regression ARIMA SARIMA RF | nMAE MCC | R, C |
| Population | Official Statistics | ||||||||
| Temperature | Official meteorological agency | ||||||||
| Humidity | |||||||||
| Rainfall | Satellite-based dataset | ||||||||
| J14 | Bomfim et al. [25] | 2020 | Neighborhood-level | Weekly | Human mobility | Public transport data | ARIMA LSTM | Precision Recall F-score MAE RMSE | R, C |
| Time | — | ||||||||
| J15 | Withanage et al. [26] | 2018 | District-level | Monthly | Rainfall | Official meteorological agency | LR | RMSE MAE MAPE PSS | R |
| Temperature | |||||||||
| Humidity | |||||||||
| Dengue | Department of health services and national electronic disease surveillance system | ||||||||
| J16 | Guo et al. [27] | 2019 | City-level | Weekly | Temperature | Official meteorological agency | Ensemble learning | RMSE MAE Pearson correlation | R |
| Humidity | |||||||||
| Rainfall | |||||||||
| Internet | Public website | ||||||||
| Social media index | |||||||||
| J17 | Fakhruddin et al. [28] | 2019 | City-level | Weekly | Rainfall | Official meteorological agency | GLM | MSE R2 Adjusted R2 p-value | R |
| Humidity | |||||||||
| J18 | Ramadona et al. [29] | 2019 | Neighborhood-level | Monthly | Social media index | Public website | PR | BIC R2 SRMSE | R |
| Human mobility | |||||||||
| J19 | Chakraborty et al. [30] | 2019 | City-level, Country-level | Weekly/monthly | Dengue | Public website | ARIMA ANN NNAR Hybrid ARIMA-ANN Hybrid ARIMA-NNAR | RMSE MAE SMAPE | R |
| J20 | Cortes et al. [31] | 2018 | City-level | Monthly | Dengue | Department of health services and national electronic disease surveillance system | ARIMA SARIMA | Comparison | R |
| J21 | Jayaraj et al. [32] | 2019 | District-level | Monthly | Temperature | Official meteorological agency | PR SARIMA SARIMAX | AIC MAE MSE | R |
| Humidity | |||||||||
| Rainfall | |||||||||
| C22 | Tanawi et al. [33] | 2021 | City-level | Weekly | Humidity | Official meteorological agency | SVR | RMSE MAE | R |
| Rainfall | |||||||||
| Temperature | |||||||||
| Dengue | Department of health services and national electronic disease surveillance system | ||||||||
| J23 | Findlater et al. [34] | 2019 | Country-level | Yearly | Human mobility | Public transport data | NBR | unknown | R |
| Population | Official Statistics | ||||||||
| J24 | Bal et al. [35] | 2020 | City-level | Monthly | Temperature | Official meteorological agency | Zero-inflated PR | Comparison, CI | R |
| Humidity | |||||||||
| Rainfall | |||||||||
| Dengue | Department of health services and national electronic disease surveillance system | ||||||||
| J25 | Cheng et al. [36] | 2020 | City-level | Daily | Temperature | Official meteorological agency | AR | MAE RMSE | R |
| Humidity | |||||||||
| Mosquito index | Unknown | ||||||||
| J26 | Buczak et al. [37] | 2018 | City-level | Weekly | Temperature | Satellite-based dataset | Ensemble learning SARIMA | MAE | R |
| Rainfall | |||||||||
| Vegetation index | |||||||||
| J27 | Polwiang [38] | 2020 | City-level | Monthly | Humidity | Official meteorological agency | PR ARIMA ANN | Correlation coefficient MAE RMSE MAPE | R |
| Temperature | |||||||||
| Rainfall | |||||||||
| J28 | Rangarajan et al. [39] | 2019 | Country-level | Weekly | Internet | Public website | ARLR AR LASSO Ensemble learning, Naïve method | RMSE MAE MAPE | R |
| J29 | Gabriel et al. [40] | 2019 | City-level | Monthly | Dengue | Department of health services and national electronic disease surveillance system | SARIMA | Comparison | R |
| J30 | Yuan et al. [41] | 2019 | Province-level | Yearly/weekly | Temperature | Official meteorological agency | PR | MSE | R |
| Rainfall | |||||||||
| J31 | Zhu et al. [42] | 2019 | Province-level | Weekly | Temperature | Official meteorological agency | Probit regression | Correlation Coefficient | R |
| Pressure | |||||||||
| Humidity | |||||||||
| Wind | |||||||||
| J32 | Chen et al. [43] | 2018 | Neighborhood-level | Weekly | Human mobility | Public transport data | LASSO | RMSE, ROC | R, C |
| Landscape | Official Statistics | ||||||||
| Humidity | Official meteorological agency | ||||||||
| Temperature | |||||||||
| Vegetation index | Satellite-based dataset | ||||||||
| J33 | Shashvat et al. [44] | 2019 | City-level | Monthly | Rainfall | Official meteorological agency | LR ANN SVR ARIMA Ensemble learning | RMSE MSE MAE | R |
| Humidity | |||||||||
| J34 | Valencia et al. [45] | 2021 | City-level | Weekly | Temperature | Official meteorological agency | SARIMA SARIMAXLSTM | RMSE MAPE | R |
| Humidity | |||||||||
| Rainfall | |||||||||
| C35 | Mishra et al. [46] | 2019 | City-level | Weekly | Rainfall | Official meteorological agency | LR SVR NN XGBoost BR GBR | MAE | R |
| Vegetation index | Satellite-based dataset | ||||||||
| C36 | Nan et al. [47] | 2018 | City-level | Daily | Temperature | Official meteorological agency | XGBoost RF LASSO AdaBoost SVM LR Gboost RR | RMSE MAE R2 | R |
| Pressure | |||||||||
| Wind | |||||||||
| J37 | Liu et al. [48] | 2020 | Town-level | Weekly | Temperature | Official meteorological agency | SVM LASSO ANN | Pearson correlation Hit Rate | R, C |
| Rainfall | |||||||||
| Population | Satellite-based dataset | ||||||||
| Human mobility | China Mobile Telecommunications Company | ||||||||
| C38 | Kurnianingsih et al. [49] | 2020 | Province-level | Yearly | Others | Official meteorological agency | LSTM | MAE RMSE | R |
| El Niño/La Niña | |||||||||
| J39 | Puengpreeda et al. [50] | 2020 | Province-level | Weekly | Internet | Public website | LASSO RR RF AdaBoost Extra-Trees | MSE MAE R2 | R |
| Rainfall | Official meteorological agency | ||||||||
| Humidity | |||||||||
| Sunshine Index | |||||||||
| Temperature | |||||||||
| Wind | |||||||||
| J40 | Shashvat et al. [51] | 2021 | City-level | Monthly | Rainfall | Public website | ES ARIMA | MAE AIC BIC MASE | R |
| Humidity | |||||||||
| C41 | Mustaffa et al. [52] | 2019 | City-level | Monthly | Rainfall | Public website | Hybrid FPA-LSSVM, Hybrid MFO-LSSVM, Hybrid GWO-LSSVM | RMSPE, MSE | R |
| Temperature | |||||||||
| Humidity | |||||||||
| J42 | Baquero et al. [53] | 2018 | City-level | Monthly | Temperature | Official meteorological agency | GAM ANN SARIMA Ensemble model | RMSE | R |
| Humidity | |||||||||
| Rainfall | |||||||||
| C43 | Anggraeni et al. [54] | 2019 | City-level | Weekly | Dengue | Department of health services and national electronic disease surveillance system | Hybrid Fuzzy-ARIMA | MSE SMAPE | R |
| C44 | Baker et al. [55] | 2021 | City-level | Weekly | Temperature | Public website | MLR PR NBM NB DT SVM kNN AdaBoost Ensemble learning | MAE | R |
| Rainfall | |||||||||
| Humidity | |||||||||
| Vegetation index | |||||||||
| Dengue | |||||||||
| J45 | Chakraborty et al. [56] | 2020 | Country-level | Weekly | Rainfall | Official meteorological agency | GP GAM ARIMA RF | RMSE MAD | R |
| Humidity | |||||||||
| Temperature | |||||||||
| C46 | Saptarini et al. [57] | 2018 | City-level | Monthly | Rainfall | Official meteorological agency | Hybrid GA-ERNN | MSE | R |
| Humidity | |||||||||
| Temperature | |||||||||
| Sea level | |||||||||
| C47 | Kerdprasop et al. [58] | 2020 | City-level | Monthly | Time | — | ANN MLR GLM LR SVR CART CHAID Ensemble learning | Correlation coefficient | R |
| Rainfall | Satellite-based dataset | ||||||||
| Vegetation index | |||||||||
| Temperature | |||||||||
| El Niño/La Niña | |||||||||
| C48 | Raju et al. [59] | 2019 | State-level | Monthly | Dengue | Department of health services and national electronic disease surveillance system | LR KR SVR | MAE, MSE | R |
| Rainfall | Official meteorological agency | ||||||||
| Temperature | |||||||||
| Humidity | |||||||||
| C49 | Thiruchelvam et al. [60] | 2021 | District-level | Weekly | Temperature | Official meteorological agency | ARIMAX, LSE | MSE AIC | R |
| Humidity | |||||||||
| Rainfall | |||||||||
| Dengue | Department of health services and national electronic disease surveillance system | ||||||||
| C50 | Jayasani et al. [61] | 2021 | District-level | Monthly | Rainfall | Official meteorological agency | LSTM LSTM-TL VAR | RMSE MAD | R |
| Dengue | Department of health services and national electronic disease surveillance system | ||||||||
| Temperature | Public website | ||||||||
| Humidity | |||||||||
| J51 | Stolerman et al. [62] | 2019 | City-level | Yearly | Rainfall | Official meteorological agency | SVM | Accuracy | C |
| Temperature | |||||||||
| Dengue | Department of health services and national electronic disease surveillance system | ||||||||
| J52 | Koh et al. [63] | 2018 | City-level | Weekly | Dengue | Department of health services and national electronic disease surveillance system | AR Bayesian NN | MSE | R |
| Rainfall | Public website | ||||||||
| J53 | Nguyen et al. [64] | 2022 | Province-level | Monthly | Rainfall | Official meteorological agency | PR SVR XGBoost SARIMA CNN Transformer LSTM LSTM-AT | MAE RMSE Accuracy Precision Sensitivity Specificity | R, C |
| Temperature | |||||||||
| Humidity | |||||||||
| Sunshine Index | |||||||||
| Evaporation |
AR: Autoregression; ARIMA: autoregressive integrated moving average model; ARIMAX: auto-regressive integrated moving average eXogenous variable models; SARIMA: seasonal integrated moving average model; SARIMAX: seasonal autoregressive integrated moving average with eXogenous factors; LR: linear regression; MLR: multiple linear regression; PR: Poisson regression; RR: ridge regression; LASSO: least absolute shrinkage and selection operator; GAM: generalized additive model; GLM: generalized linear model; RF: random forest; SVM: support vector machine; SVR: support vector regression; LSSVM: least square support vector machines; AdaBoost: adaptive boosting; Gboost: gradient boosting; DT: decision tree; and XGBoost: eXtreme Gradient boosting; GBM: gradient boosting machine; GAMM: generalized additive mixed model; VAR: vector auto regression; kNN: k-Nearest neighbors; NBR: negative binomial regression; Zero-inflated PR: zero-inflated Poisson regression; ARLR: autoregressive likelihood ratio method; BR: bagging regressor; ES: exponential smoothing; MLR: multiple linear regression; NBM: negative binomial regression; NB: naïve Bayes; GP: Gaussian process; CART: classification and regression tree; CHAID: chi-squared automatic interaction detection; KR: kernel ridge; AutoTiC-NN: autoencoding-based time series clustering with nearest neighbor; NN: neural networks; ANN: artificial neural networks; RNN: recurrent neural network; LSTM: long–short-term memory; LSTM-TL: LSTM with transfer learning; LSTM-AT: LSTM with attention mechanism; CNN: convolutional neural network.
References
- Bhatt, S.; Gething, P.W.; Brady, O.J.; Messina, J.P.; Farlow, A.W.; Moyes, C.L.; Drake, J.M.; Brownstein, J.S.; Hoen, A.G.; Sankoh, O.; et al. The global distribution and burden of dengue. Nature 2013, 496, 504–507. [Google Scholar] [CrossRef] [Green Version]
- Shepard, D.S.; Undurraga, E.A.; Halasa, Y.A.; Stanaway, J.D. The global economic burden of dengue: A systematic analysis. Lancet Infect. Dis. 2016, 16, 935–941. [Google Scholar] [CrossRef]
- Ryan, S.J.; Carlson, C.J.; Mordecai, E.A.; Johnson, L.R. Global expansion and redistribution of Aedes-borne virus transmission risk with climate change. PLoS Negl. Trop. Dis. 2019, 13, e0007213. [Google Scholar] [CrossRef] [Green Version]
- Yang, S.; Kou, S.C.; Lu, F.; Brownstein, J.S.; Brooke, N.; Santillana, M. Advances in using Internet searches to track dengue. PLoS Comput. Biol. 2017, 13, e1005607. [Google Scholar] [CrossRef] [PubMed] [Green Version]
- Louis, V.R.; Phalkey, R.; Horstick, O.; Ratanawong, P.; Wilder-Smith, A.; Tozan, Y.; Dambach, P. Modeling tools for dengue risk mapping—A systematic review. Int. J. Health Geogr. 2014, 13, 50. [Google Scholar] [CrossRef] [Green Version]
- Marti, R.; Li, Z.; Catry, T.; Roux, E.; Mangeas, M.; Handschumacher, P.; Gaudart, J.; Tran, A.; Demagistri, L.; Faure, J.-F.; et al. A Mapping Review on Urban Landscape Factors of Dengue Retrieved from Earth Observation Data, GIS Techniques, and Survey Questionnaires. Remote Sens. 2020, 12, 932. [Google Scholar] [CrossRef] [Green Version]
- Zhu, Q.; Chen, J.; Shi, D.; Zhu, L.; Bai, X.; Duan, X.; Liu, Y. Learning Temporal and Spatial Correlations Jointly: A Unified Framework for Wind Speed Prediction. IEEE Trans. Sustain. Energy 2020, 11, 509–523. [Google Scholar] [CrossRef]
- Hoyos, W.; Aguilar, J.; Toro, M. Dengue models based on machine learning techniques: A systematic literature review. Artif. Intell. Med. 2021, 119, 102157. [Google Scholar] [CrossRef]
- Sylvestre, E.; Joachim, C.; Cécilia-Joseph, E.; Bouzillé, G.; Campillo-Gimenez, B.; Cuggia, M.; Cabié, A. Data-driven methods for dengue prediction and surveillance using real-world and Big Data: A systematic review. PLoS Negl. Trop. Dis. 2022, 16, e0010056. [Google Scholar] [CrossRef]
- Siriyasatien, P.; Chadsuthi, S.; Jampachaisri, K.; Kesorn, K. Dengue Epidemics Prediction: A Survey of the State-of-the-Art Based on Data Science Processes. IEEE Access 2018, 6, 53757–53795. [Google Scholar] [CrossRef]
- Liberati, A.; Altman, D.G.; Tetzlaff, J.; Mulrow, C.; Gøtzsche, P.C.; Ioannidis, J.P.A.; Clarke, M.; Devereaux, P.J.; Kleijnen, J.; Moher, D. The PRISMA statement for reporting systematic reviews and meta-analyses of studies that evaluate healthcare interventions: Explanation and elaboration. BMJ 2009, 339, b2700. [Google Scholar] [CrossRef] [Green Version]
- Li, Z.; Gurgel, H.; Xu, L.; Yang, L.; Dong, J. Improving Dengue Forecasts by Using Geospatial Big Data Analysis in Google Earth Engine and the Historical Dengue Information-Aided Long Short Term Memory Modeling. Biology 2022, 11, 169. [Google Scholar] [CrossRef]
- Pham, D.N.; Aziz, T.; Kohan, A.; Nellis, S.; Jamil, J.b.A.; Khoo, J.J.; Lukose, D.; AbuBakar, S.; Sattar, A.; Ong, H.H. How to Efficiently Predict Dengue Incidence in Kuala Lumpur. In Proceedings of the 2018 Fourth International Conference on Advances in Computing, Communication & Automation (ICACCA), Subang Jaya, Malaysia, 26–28 October 2018; pp. 1–6. [Google Scholar]
- Mussumeci, E.; Codeco Coelho, F. Large-scale multivariate forecasting models for Dengue—LSTM versus random forest regression. Spat. Spatio-Temporal Epidemiol. 2020, 35, 100372. [Google Scholar] [CrossRef]
- Saleh, A.Y.; Baiwei, L. Dengue Prediction Using Deep Learning with Long Short-Term Memory. In Proceedings of the 2021 1st International Conference on Emerging Smart Technologies and Applications (eSmarTA), Sana’a, Yemen, 10–12 August 2021; pp. 1–5. [Google Scholar]
- Xu, J.; Xu, K.; Li, Z.; Meng, F.; Tu, T.; Xu, L.; Liu, Q. Forecast of Dengue Cases in 20 Chinese Cities Based on the Deep Learning Method. Int. J. Environ. Res. Pub. Health 2020, 17, 453. [Google Scholar] [CrossRef] [Green Version]
- Liu, K.; Yin, L.; Zhang, M.; Kang, M.; Deng, A.-P.; Li, Q.-L.; Song, T. Facilitating fine-grained intra-urban dengue forecasting by integrating urban environments measured from street-view images. Infect. Dis. Poverty 2021, 10, 40. [Google Scholar] [CrossRef] [PubMed]
- Chovatiya, M.; Dhameliya, A.; Deokar, J.; Gonsalves, J.; Mathur, A. Prediction of Dengue using Recurrent Neural Network. In Proceedings of the 2019 3rd International Conference on Trends in Electronics and Informatics (ICOEI), Tirunelveli, India, 23–25 April 2019; pp. 926–929. [Google Scholar]
- Mustaffa, Z.; Sulaiman, M.H.; Emawan, F.; Yusof, Y.; Mohsin, M.F.M. Dengue Outbreak Prediction: Hybrid Meta-heuristic Model. In Proceedings of the 2018 19th IEEE/ACIS International Conference on Software Engineering, Artificial Intelligence, Networking and Parallel/Distributed Computing (SNPD), Busan, Korea, 27–29 June 2018; pp. 271–274. [Google Scholar]
- Liu, D.; Guo, S.; Zou, M.; Chen, C.; Deng, F.; Xie, Z.; Hu, S.; Wu, L. A dengue fever predicting model based on Baidu search index data and climate data in South China. PLoS ONE 2019, 14, e0226841. [Google Scholar] [CrossRef] [Green Version]
- Carvajal, T.M.; Viacrusis, K.M.; Hernandez, L.F.T.; Ho, H.T.; Amalin, D.M.; Watanabe, K. Machine learning methods reveal the temporal pattern of dengue incidence using meteorological factors in metropolitan Manila, Philippines. BMC Infect. Dis. 2018, 18, 183. [Google Scholar] [CrossRef]
- Appice, A.; Gel, Y.R.; Iliev, I.; Lyubchich, V.; Malerba, D. A Multi-Stage Machine Learning Approach to Predict Dengue Incidence: A Case Study in Mexico. IEEE Access 2020, 8, 52713–52725. [Google Scholar] [CrossRef]
- Zhao, N.; Charland, K.; Carabali, M.; Nsoesie, E.O.; Maheu-Giroux, M.; Rees, E.; Yuan, M.; Garcia Balaguera, C.; Jaramillo Ramirez, G.; Zinszer, K. Machine learning and dengue forecasting: Comparing random forests and artificial neural networks for predicting dengue burden at national and sub-national scales in Colombia. PLoS Negl. Trop. Dis. 2020, 14, e0008056. [Google Scholar] [CrossRef]
- Benedum, C.M.; Shea, K.M.; Jenkins, H.E.; Kim, L.Y.; Markuzon, N. Weekly dengue forecasts in Iquitos, Peru; San Juan, Puerto Rico; and Singapore. PLoS Negl. Trop. Dis. 2020, 14, e0008710. [Google Scholar] [CrossRef]
- Bomfim, R.; Pei, S.; Shaman, J.; Yamana, T.; Makse, H.A.; Andrade, J.S., Jr.; Lima Neto, A.S.; Furtado, V. Predicting dengue outbreaks at neighbourhood level using human mobility in urban areas. J. R. Soc. Interface 2020, 17, 20200691. [Google Scholar] [CrossRef]
- Withanage, G.P.; Viswakula, S.D.; Nilmini Silva Gunawardena, Y.I.; Hapugoda, M.D. A forecasting model for dengue incidence in the District of Gampaha, Sri Lanka. Parasites Vectors 2018, 11, 262. [Google Scholar] [CrossRef]
- Guo, P.; Zhang, Q.; Chen, Y.; Xiao, J.; He, J.; Zhang, Y.; Wang, L.; Liu, T.; Ma, W. An ensemble forecast model of dengue in Guangzhou, China using climate and social media surveillance data. Sci. Total Environ. 2019, 647, 752–762. [Google Scholar] [CrossRef]
- Fakhruddin, M.; Putra, P.S.; Wijaya, K.P.; Sopaheluwakan, A.; Satyaningsih, R.; Komalasari, K.E.; Mamenun; Sumiati; In-dratno, S.W.; Nuraini, N.; et al. Assessing the interplay between dengue incidence and weather in Jakarta via a clustering integrated multiple regression model. Ecol. Complex. 2019, 39, 100768. [Google Scholar] [CrossRef]
- Ramadona, A.L.; Tozan, Y.; Lazuardi, L.; Rocklöv, J. A combination of incidence data and mobility proxies from social media predicts the intra-urban spread of dengue in Yogyakarta, Indonesia. PLoS Negl. Trop. Dis. 2019, 13, e0007298. [Google Scholar] [CrossRef] [Green Version]
- Chakraborty, T.; Chattopadhyay, S.; Ghosh, I. Forecasting dengue epidemics using a hybrid methodology. Phys. A Stat. Mech. Appl. 2019, 14, 121266. [Google Scholar] [CrossRef]
- Cortes, F.; Turchi Martelli, C.M.; Arraes de Alencar Ximenes, R.; Montarroyos, U.R.; Siqueira Junior, J.B.; Gonçalves Cruz, O.; Alexander, N.; Vieira de Souza, W. Time series analysis of dengue surveillance data in two Brazilian cities. Acta Trop. 2018, 182, 190–197. [Google Scholar] [CrossRef]
- Jayaraj, V.J.; Avoi, R.; Gopalakrishnan, N.; Raja, D.B.; Umasa, Y. Developing a dengue prediction model based on climate in Tawau, Malaysia. Acta Trop. 2019, 197, 105055. [Google Scholar] [CrossRef]
- Tanawi, I.N.; Vito, V.; Sarwinda, D.; Tasman, H.; Hertono, G.F. Support Vector Regression for Predicting the Number of Dengue Incidents in DKI Jakarta. Procedia Comput. Sci. 2021, 179, 747–753. [Google Scholar] [CrossRef]
- Findlater, A.; Moineddin, R.; Kain, D.; Yang, J.; Wang, X.; Lai, S.; Khan, K.; Bogoch, I.I. The use of air travel data for predicting dengue importation to China: A modelling study. Travel Med. Infect. Dis. 2019, 31, 101446. [Google Scholar] [CrossRef]
- Bal, S.; Sodoudi, S. Modeling and prediction of dengue occurrences in Kolkata, India, based on climate factors. Int. J. Biometeorol. 2020, 64, 1379–1391. [Google Scholar] [CrossRef]
- Cheng, Y.C.; Lee, F.J.; Hsu, Y.T.; Slud, E.V.; Hsiung, C.A.; Chen, C.H.; Liao, C.L.; Wen, T.H.; Chang, C.W.; Chang, J.H.; et al. Real-time dengue forecast for outbreak alerts in Southern Taiwan. PLoS Negl. Trop. Dis. 2020, 14, e0008434. [Google Scholar] [CrossRef] [PubMed]
- Buczak, A.L.; Baugher, B.; Moniz, L.J.; Bagley, T.; Babin, S.M.; Guven, E. Ensemble method for dengue prediction. PLoS ONE 2018, 13, e0189988. [Google Scholar] [CrossRef] [PubMed] [Green Version]
- Polwiang, S. The time series seasonal patterns of dengue fever and associated weather variables in Bangkok (2003—2017). BMC Infect. Dis. 2020, 20, 208. [Google Scholar] [CrossRef] [Green Version]
- Rangarajan, P.; Mody, S.K.; Marathe, M. Forecasting dengue and influenza incidences using a sparse representation of Google trends, electronic health records, and time series data. PLoS Comput. Biol. 2019, 15, e1007518. [Google Scholar] [CrossRef] [Green Version]
- Gabriel, A.F.B.; Alencar, A.P.; Miraglia, S.G.E.K. Dengue outbreaks: Unpredictable incidence time series. Epidemiol. Infect. 2019, 147, e116. [Google Scholar] [CrossRef] [PubMed] [Green Version]
- Yuan, H.-Y.; Wen, T.-H.; Kung, Y.-H.; Tsou, H.-H.; Chen, C.-H.; Chen, L.-W.; Lin, P.-S. Prediction of annual dengue incidence by hydro-climatic extremes for southern Taiwan. Int. J. Biometeorol. 2019, 63, 259–268. [Google Scholar] [CrossRef]
- Zhu, B.; Wang, L.; Wang, H.; Cao, Z.; Zha, L.; Li, Z.; Ye, Z.; Zhang, J.; Song, H.; Sun, Y. Prediction model for dengue fever based on interactive effects between multiple meteorological factors in Guangdong, China (2008–2016). PLoS ONE 2019, 14, e0225811. [Google Scholar] [CrossRef] [Green Version]
- Chen, Y.; Ong, J.H.Y.; Rajarethinam, J.; Yap, G.; Ng, L.C.; Cook, A.R. Neighbourhood level real-time forecasting of dengue cases in tropical urban Singapore. BMC Med. 2018, 16, 129. [Google Scholar] [CrossRef] [Green Version]
- Shashvat, K.; Basu, R.; Bhondekar, P.A.; Kaur, A. An ensemble model for forecasting infectious diseases in India. Trop Biomed. 2019, 36, 822–832. [Google Scholar]
- Navarro Valencia, V.; Díaz, Y.; Pascale, J.M.; Boni, M.F.; Sanchez-Galan, J.E. Assessing the Effect of Climate Variables on the Incidence of Dengue Cases in the Metropolitan Region of Panama City. Int. J. Environ. Res. Public Health 2021, 18, 12108. [Google Scholar] [CrossRef] [PubMed]
- Mishra, V.K.; Tiwari, N.; Ajaymon, S.L. Dengue Disease Spread Prediction Using Twofold Linear Regression. In Proceedings of the 2019 IEEE 9th International Conference on Advanced Computing (IACC), Tiruchirappalli, India, 13–14 December 2019; pp. 182–187. [Google Scholar]
- Nan, J.; Liao, X.; Chen, J.; Chen, X.; Chen, J.; Dong, G.; Liu, K.; Hu, G. Using Climate Factors to Predict the Outbreak of Dengue Fever. In Proceedings of the 2018 7th International Conference on Digital Home (ICDH), Guilin, China, 30 November–1 December 2018; pp. 213–218. [Google Scholar]
- Liu, K.; Zhang, M.; Xi, G.; Deng, A.; Song, T.; Li, Q.; Kang, M.; Yin, L. Enhancing fine-grained intra-urban dengue forecasting by integrating spatial interactions of human movements between urban regions. PLoS Negl. Trop. Dis. 2020, 14, e0008924. [Google Scholar] [CrossRef]
- Kurnianingsih; Wirasatriya, A.; Lazuardi, L.; Kubota, N.; Ng, N. IOD and ENSO-Related Time Series Variability and Forecasting of Dengue and Malaria Incidence in Indonesia. In Proceedings of the 2020 International Symposium on Community-centric Systems (CcS), Tokyo, Japan, 23–26 September 2020; pp. 1–8. [Google Scholar]
- Puengpreeda, A.; Yhusumrarn, S.; Sirikulvadhana, S. Weekly Forecasting Model for Dengue Hemorrhagic Fever Outbreak in Thailand. EJ 2020, 24, 71–87. [Google Scholar] [CrossRef]
- Shashvat, K.; Basu, R.; Bhondekar, A.P. Application of time series methods for dengue cases in North India (Chandigarh). J. Public Health 2021, 29, 433–441. [Google Scholar] [CrossRef]
- Mustaffa, Z.; Sulaiman, M.H.; Mohsin, M.F.M.; Yusof, Y.; Ernawan, F.; Rosli, K.A.M. An Application of Hybrid Swarm Intelligence Algorithms for Dengue Outbreak Prediction. In Proceedings of the 2019 IEEE Jordan International Joint Conference on Electrical Engineering and Information Technology (JEEIT), Amann, Jordan, 9–11 April 2019; pp. 731–735. [Google Scholar]
- Baquero, O.S.; Santana, L.M.R.; Chiaravalloti-Neto, F. Dengue forecasting in São Paulo city with generalized additive models, artificial neural networks and seasonal autoregressive integrated moving average models. PLoS ONE 2018, 13, e0195065. [Google Scholar] [CrossRef]
- Anggraeni, W.; Abdillah, A.; Pujiadi; Trikoratno, L.T.; Wibowo, R.P.; Purnomo, M.H.; Sudiarti, Y. Modelling and Forecasting the Dengue Hemorrhagic Fever Cases Number Using Hybrid Fuzzy-ARIMA. In Proceedings of the 2019 IEEE 7th International Conference on Serious Games and Applications for Health (SeGAH), Kyoto, Japan, 5–7 August 2019; pp. 1–8. [Google Scholar]
- Baker, Q.B.; Faraj, D.; Alguzo, A. Forecasting Dengue Fever Using Machine Learning Regression Techniques. In Proceedings of the 2021 12th International Conference on Information and Communication Systems (ICICS), Valencia, Spian, 24–26 May 2021; pp. 157–163. [Google Scholar]
- Chakraborty, A.; Chandru, V. A robust and non-parametric model for prediction of dengue incidence. arXiv 2020, arXiv:2008.03943. [Google Scholar] [CrossRef]
- Saptarini, N.G.A.P.H.; Dillak, R.Y.; Pakan, P.D. Dengue Haemorrhagic Fever Outbreak Prediction using Elman Levenberg Neural Network and Genetic Algorithm. In Proceedings of the 2018 2nd East Indonesia Conference on Computer and Information Technology (EIConCIT), Makassar, Indonesia, 6–7 November 2018; pp. 188–191. [Google Scholar]
- Kerdprasop, N.; Kerdorasop, K.; Chuaybamroong, P. A Multi-criteria Scheme to Build Model Ensemble for Dengue Infection Case Estimation. In Proceedings of the 2020 International Conference on Decision Aid Sciences and Application (DASA), Sakheer, Bahrain, 8–9 November 2020; pp. 214–218. [Google Scholar]
- Ganapathi Raju, N.V.; Krishna, P.G.; Manognya, K.; Raj Kiran, G.S.S.; Rohit, P.; Likhith, K. Evolution of predictive model for Dengue incidence by using machine learning algorithms. In Proceedings of the 2019 International Conference on Communication and Electronics Systems (ICCES), Coiambatore, India, 17–19 July 2019; pp. 51–59. [Google Scholar]
- Thiruchelvam, L.; Dass, S.C.; Mathur, N.; Asirvadam, V.S.; Gill, B.S. Inclusion of Climate Variables for Dengue Prediction Model: Preliminary Analysis. In Proceedings of the 2021 IEEE International Conference on Signal and Image Processing Applications (ICSIPA), Kuala Terengganu, Malaysia, 13–15 September 2021; pp. 162–166. [Google Scholar]
- Jayasani, C.; Dammalage, P.; Sarathchandra, S.; Godaliyadda, R.; Ekanayake, P.; Herath, V.; Ekanayake, J.; Dharmaratne, S. Limited Data Forecasting for Dengue Propagation. In Proceedings of the 2021 10th International Conference on Information and Automation for Sustainability (ICIAfS), Negambo, Sri Lanka, 11–13 August 2021; pp. 416–421. [Google Scholar]
- Stolerman, L.M.; Maia, P.D.; Kutz, J.N. Forecasting dengue fever in Brazil: An assessment of climate conditions. PLoS ONE 2019, 14, e0220106. [Google Scholar] [CrossRef] [Green Version]
- Koh, Y.-M.; Spindler, R.; Sandgren, M.; Jiang, J. A model comparison algorithm for increased forecast accuracy of dengue fever incidence in Singapore and the auxiliary role of total precipitation information. Int. J. Environ. Health Res. 2018, 28, 535–552. [Google Scholar] [CrossRef]
- Nguyen, V.-H.; Tuyet-Hanh, T.T.; Mulhall, J.; Minh, H.V.; Duong, T.Q.; Chien, N.V.; Nhung, N.T.T.; Lan, V.H.; Minh, H.B.; Cuong, D.; et al. Deep learning models for forecasting dengue fever based on climate data in Vietnam. PLoS Negl. Trop. Dis. 2022, 16, e0010509. [Google Scholar] [CrossRef]
- Estallo, E.L.; Benitez, E.M.; Lanfri, M.A.; Scavuzzo, C.M.; Almirón, W.R. MODIS Environmental Data to Assess Chikungunya, Dengue, and Zika Diseases Through Aedes (Stegomia) aegypti Oviposition Activity Estimation. IEEE J. Sel. Top. Appl. Earth Obs. Remote Sens. 2016, 9, 5461–5466. [Google Scholar] [CrossRef]
- Jain, R.; Sontisirikit, S.; Iamsirithaworn, S.; Prendinger, H. Prediction of dengue outbreaks based on disease surveillance, meteorological and socio-economic data. BMC Infect. Dis. 2019, 19, 272. [Google Scholar] [CrossRef] [PubMed]
- Zhang, Y.; Wang, T.; Liu, K.; Xia, Y.; Lu, Y.; Jing, Q.; Yang, Z.; Hu, W.; Lu, J. Developing a Time Series Predictive Model for Dengue in Zhongshan, China Based on Weather and Guangzhou Dengue Surveillance Data. PLoS Negl. Trop. Dis. 2016, 10, e0004473. [Google Scholar] [CrossRef] [PubMed] [Green Version]
- Codeco, C.; Coelho, F.; Cruz, O.; Oliveira, S.; Castro, T.; Bastos, L. Infodengue: A nowcasting system for the surveillance of arboviruses in Brazil. Rev. Épidémiologie St. Publique 2018, 66, S386. [Google Scholar] [CrossRef]
- NOAA. Dengue forecasting project website. Available online: https://dengueforecasting.noaa.gov/ (accessed on 8 June 2022).
- da Silva Neto, S.R.; Tabosa de Oliveira, T.; Teixiera, I.V.; Medeiros Neto, L.; Souza Sampaio, V.; Lynn, T.; Endo, P.T. Arboviral disease record data—Dengue and Chikungunya, Brazil, 2013–2020. Sci. Data 2022, 9, 198. [Google Scholar] [CrossRef] [PubMed]
- Hochreiter, S.; Schmidhuber, J. Long Short-Term Memory. Neural Comput. 1997, 9, 1735–1780. [Google Scholar] [CrossRef] [PubMed]
- Hochreiter, S. The Vanishing Gradient Problem During Learning Recurrent Neural Nets and Problem Solutions. Int. J. Uncertain. Fuzziness Knowl.-Based Syst. 1998, 06, 107–116. [Google Scholar] [CrossRef] [Green Version]
- Dong, X.; Yu, Z.; Cao, W.; Shi, Y.; Ma, Q. A survey on ensemble learning. Front. Comput. Sci. 2020, 14, 241–258. [Google Scholar] [CrossRef]
- Hajirahimi, Z.; Khashei, M. Hybrid structures in time series modeling and forecasting: A review. Eng. Appl. Artif. Intell. 2019, 86, 83–106. [Google Scholar] [CrossRef]
- Hashizume, M.; Dewan, A.M.; Sunahara, T.; Rahman, M.Z.; Yamamoto, T. Hydroclimatological variability and dengue transmission in Dhaka, Bangladesh: A time-series study. BMC Infect. Dis. 2012, 12, 98. [Google Scholar] [CrossRef] [PubMed] [Green Version]
- Francisco, M.E.; Carvajal, T.M.; Ryo, M.; Nukazawa, K.; Amalin, D.M.; Watanabe, K. Dengue disease dynamics are modulated by the combined influences of precipitation and landscape: A machine learning approach. Sci. Total Environ. 2021, 792, 148406. [Google Scholar] [CrossRef] [PubMed]
- Yue, Y.; Sun, J.; Liu, X.; Ren, D.; Liu, Q.; Xiao, X.; Lu, L. Spatial analysis of dengue fever and exploration of its environmental and socio-economic risk factors using ordinary least squares: A case study in five districts of Guangzhou City, China, 2014. Int. J. Infect. Dis. 2018, 75, 39–48. [Google Scholar] [CrossRef]
- Kummu, M.; Taka, M.; Guillaume, J.H.A. Gridded global datasets for Gross Domestic Product and Human Development Index over 1990–2015. Sci. Data 2018, 5, 180004. [Google Scholar] [CrossRef] [PubMed] [Green Version]
- Chen, J.; Gao, M.; Cheng, S.; Hou, W.; Song, M.; Liu, X.; Liu, Y. Global 1 km × 1 km gridded revised real gross domestic product and electricity consumption during 1992–2019 based on calibrated nighttime light data. Sci. Data 2022, 9, 202. [Google Scholar] [CrossRef] [PubMed]
- Viana, J.; Santos, J.; Neiva, R.; Souza, J.; Duarte, L.; Teodoro, A.; Freitas, A. Remote Sensing in Human Health: A 10-Year Bibliometric Analysis. Remote Sens. 2017, 9, 1225. [Google Scholar] [CrossRef] [Green Version]
- Parselia, E.; Kontoes, C.; Tsouni, A.; Hadjichristodoulou, C.; Kioutsioukis, I.; Magiorkinis, G.; Stilianakis, N.I. Satellite Earth Observation Data in Epidemiological Modeling of Malaria, Dengue and West Nile Virus: A Scoping Review. Remote Sensing 2019, 11, 1862. [Google Scholar] [CrossRef] [Green Version]
- Ceccato, P.; Ramirez, B.; Manyangadze, T.; Gwakisa, P.; Thomson, M.C. Data and tools to integrate climate and environmental information into public health. Infect. Dis. Poverty 2018, 7, 126. [Google Scholar] [CrossRef] [PubMed]
- Tamiminia, H.; Salehi, B.; Mahdianpari, M.; Quackenbush, L.; Adeli, S.; Brisco, B. Google Earth Engine for geo-big data applications: A meta-analysis and systematic review. ISPRS J. Photogramm. Remote Sens. 2020, 164, 152–170. [Google Scholar] [CrossRef]
- Amani, M.; Ghorbanian, A.; Ahmadi, S.A.; Kakooei, M.; Moghimi, A.; Mirmazloumi, S.M.; Moghaddam, S.H.A.; Mahdavi, S.; Ghahremanloo, M.; Parsian, S.; et al. Google Earth Engine Cloud Computing Platform for Remote Sensing Big Data Applications: A Comprehensive Review. IEEE J. Sel. Top. Appl. Earth Obs. Remote Sens. 2020, 13, 5326–5350. [Google Scholar] [CrossRef]
- Li, Z.; Zhang, S.; Dong, J. Suggestive Data Annotation for CNN-Based Building Footprint Mapping Based on Deep Active Learning and Landscape Metrics. Remote Sens. 2022, 14, 3147. [Google Scholar] [CrossRef]
- Frake, A.N.; Peter, B.G.; Walker, E.D.; Messina, J.P. Leveraging big data for public health: Mapping malaria vector suitability in Malawi with Google Earth Engine. PLoS ONE 2020, 15, e0235697. [Google Scholar] [CrossRef]
- Yin, J.; Dong, J.; Hamm, N.A.S.; Li, Z.; Wang, J.; Xing, H.; Fu, P. Integrating remote sensing and geospatial big data for urban land use mapping: A review. Int. J. Appl. Earth Obs. Geoinf. 2021, 103, 102514. [Google Scholar] [CrossRef]
- Yin, J.; Fu, P.; Hamm, N.A.S.; Li, Z.; You, N.; He, Y.; Cheshmehzangi, A.; Dong, J. Decision-Level and Feature-Level Integration of Remote Sensing and Geospatial Big Data for Urban Land Use Mapping. Remote Sens. 2021, 13, 1579. [Google Scholar] [CrossRef]
- McGough, S.F.; Clemente, L.; Kutz, J.N.; Santillana, M. A dynamic, ensemble learning approach to forecast dengue fever epidemic years in Brazil using weather and population susceptibility cycles. J. R. Soc. Interface 2021, 18, 20201006. [Google Scholar] [CrossRef] [PubMed]
- Ong, J.; Aik, J.; Ng, L.C. Short Report: Adult Aedes abundance and risk of dengue transmission. PLoS Negl. Trop. Dis. 2021, 15, e0009475. [Google Scholar] [CrossRef]
- Sanchez, L.; Vanlerberghe, V.; Alfonso, L.; Marquetti, M.d.C.; Guzman, M.G.; Bisset, J.; van der Stuyft, P. Aedes aegypti larval indices and risk for dengue epidemics. Emerg. Infect. Dis. 2006, 12, 800–806. [Google Scholar] [CrossRef] [PubMed] [Green Version]
- Angelo, M.; Ramalho, W.M.; Gurgel, H.; Belle, N.; Pilot, E. Dengue Surveillance System in Brazil: A Qualitative Study in the Federal District. Int. J. Environ. Res. Public Health 2020, 17, 2062. [Google Scholar] [CrossRef] [PubMed]
Figure 1.
Histogram of publication years of the studies associated with dengue risk forecasting and the application of deep learning in dengue risk forecasting from 1990 to 2022. The two categories of literature records were collected using “dengue AND (predict* OR forecast*)” and “(deep learning OR neural net-work) AND (dengue AND (predict* OR forecast*))” in the field of title and abstract in Web of Science, Science Direct, MEDLINE (PubMed), Scopus, ACM digital library, and IEEE Xplore.

Figure 2.
A general framework of dengue risk forecasting, in which the orange-filled rectangles indicate the key terms concerned in this review.
Figure 2.
A general framework of dengue risk forecasting, in which the orange-filled rectangles indicate the key terms concerned in this review.

Figure 3.
The process of literature selection used in this study.

Figure 4.
The co-occurrence map of predominate dengue risk predictors and data sources identified from selected articles. We set the minimum number of keyword occurrences to 2 to map all keywords. The keywords in green indicate the predominant predictors, and the keywords in purple indicate the predominant data sources. The number in brackets indicates the number of a keyword appearing. A keyword is associated with each node in the co-occurrence map, with each edge representing a co-occurrence link between two keywords.

Figure 5.
Spatial and temporal scales used in recent studies of dengue risk forecasting.

Figure 6.
The categories of predominate dengue risk forecasting models used in recent studies, with a minimum number of model occurrences of 2.
Figure 6.
The categories of predominate dengue risk forecasting models used in recent studies, with a minimum number of model occurrences of 2.

Figure 7.
Illustration of RNN architecture (a) and the LSTM cell with input (it), forget (ft), and output gates (ot) (b). The forget gate (ft) uses the sigmoid activation function to selectively forget the irrelevant information (with less weight), the input gate (it) decides what to memorize using the sigmoid and tanh functions, and the output gate (ot) determines the exact output from the current cell.

Figure 8.
Illustration of N-week-ahead dengue risk forecasting in different LSTM-based prediction scenarios: (a) indicates the prediction based on historical dengue data; (b) indicates the prediction based on external predictors; and (c) indicates the prediction based on both historical dengue data and external predictors.

Table 1.
The representative ready-to-use products in GEE platform can be used to define the predominant transmission area of dengue fever and identify dengue predictors.
Table 1.
The representative ready-to-use products in GEE platform can be used to define the predominant transmission area of dengue fever and identify dengue predictors.
| Predictors and Datasets | Spatial Resolution | Temporal Resolution | Period | ||
|---|---|---|---|---|---|
| Climate | Temperature | GLDAS-2.1 | 27,000 m | 3-hourly | 2000 to present |
| Rainfall | GLDAS-2.1 | 27,000 m | 3-hourly | 2000 to present | |
| Humidity | GLDAS-2.1 | 27,000 m | 3-hourly | 2000 to present | |
| Environment | NDVI | MOD09GA | 500 m | Daily | 2000 to present |
| EVI | MOD09GA | 500 m | Daily | 2000 to present | |
| NDWI | MOD09GA | 500 m | Daily | 2000 to present | |
| dLST | MOD11A1 | 1000 m | Daily | 2000 to present | |
| nLST | MOD11A1 | 1000 m | Daily | 2000 to present | |
| Transmission areas | Population density | GPW v4.0 | 1000 m | 5-year | 2000, 2005, 2010, 2015, 2020 |
| Imperious surface | GAIA | 30 m | Annual | 1985–2018 | |
Publisher’s Note: MDPI stays neutral with regard to jurisdictional claims in published maps and institutional affiliations. |
© 2022 by the authors. Licensee MDPI, Basel, Switzerland. This article is an open access article distributed under the terms and conditions of the Creative Commons Attribution (CC BY) license (https://creativecommons.org/licenses/by/4.0/).
Share and Cite
MDPI and ACS Style
Li, Z.; Dong, J. Big Geospatial Data and Data-Driven Methods for Urban Dengue Risk Forecasting: A Review. Remote Sens. 2022, 14, 5052. https://doi.org/10.3390/rs14195052
AMA Style
Li Z, Dong J. Big Geospatial Data and Data-Driven Methods for Urban Dengue Risk Forecasting: A Review. Remote Sensing. 2022; 14(19):5052. https://doi.org/10.3390/rs14195052
Chicago/Turabian StyleLi, Zhichao, and Jinwei Dong. 2022. "Big Geospatial Data and Data-Driven Methods for Urban Dengue Risk Forecasting: A Review" Remote Sensing 14, no. 19: 5052. https://doi.org/10.3390/rs14195052
Note that from the first issue of 2016, this journal uses article numbers instead of page numbers. See further details here.