

Field Reflectance Measurements at Night of Beach and Desert Sands within a Particulate BRDF Model
1
Cortana Corporation, Falls Church, VA 22046, USA
2
United States Geological Survey, Reston, VA 20192, USA
*
Author to whom correspondence should be addressed.
Remote Sens. 2022, 14(19), 5020; https://doi.org/10.3390/rs14195020
Submission received: 15 July 2022
/
Revised: 9 September 2022
/
Accepted: 23 September 2022
/
Published: 9 October 2022
Abstract
:The Bidirectional Reflectance Distribution Function (BRDF) of soils is frequently assumed to be Lambertian in remote sensing applications, even though many soils are observed to have a distinct backscatter. This is largely due to the difficulty of obtaining accurate in-situ BRDF of these materials over the entire hemisphere. The objective of the work presented here is to describe a new technique that combines the measurement of field BRDF data on desert and beach sands measured at night with a model that reproduces the backscatter except in a small region around zero phase angle. It is found that this combination produces parameterized BRDF of sufficient accuracy to allow its inclusion in a remote sensing materials database. The measurement technique was developed in the laboratory and transitioned to perform in-plane BRDF field measurements of sands at night. Field measurements were obtained using a portable light source and field spectrometer over the range of 0.4–2.4 micrometers. The spectrometer sensor optics and light source were mounted on a portable, manually operated goniometer allowing in-plane measurements to within 3 degrees of backscatter. Unlike daytime measurements, corrections for background were unnecessary, and BRDF was obtained by referencing to a Spectralon calibration standard. Analysis of the spectrometer field data used a variant of the Shadow Hiding Opposition Effect (SHOE) wherein a series expansion of Legendre Polynomials was substituted for the angularly dependent backscatter function. It is shown that when the out-of-plane scattering and the backscatter peak are small, this model provides an adequate description of the BRDF. The combination of the nocturnal in-situ measurements with an analysis using a model that can describe the backscatter produces parameterized BRDF for these sands of sufficient accuracy to allow inclusion in the NEFDS materials database. Measurement and analysis techniques are assessed, sample results for both the laboratory and field data are shown, and the extension to future soils measurements are discussed.
1. Introduction
1.1. Overview
Under the Materials Measurement program of the Nonconventional Exploitation Factors Data System (NEFDS) [1,2], BRDF had been measured in the laboratory and field for several beach and desert sand sites and incorporated within the NEFDS database. Typical remote sensing applications for spectral reflectance measurements of beach or desert sands include the vicarious calibration of satellite sensors [3,4], study of materials where sand is a contaminant or background in a larger scene [5,6], the determination of soil particle sizes [7], disturbed soil studies [8,9,10,11] and mapping evaporite mineral distributions [12,13]. Model parameters obtained as a function of wavelength from the current measurements have been incorporated within the NEFDS software database, allowing users of the software to quickly compute BRDF for a given reflection geometry. The equipment, procedure and analysis techniques in this program have been examined throughout the program’s lifetime to decrease the statistical variation of the results and increase the measurement and analysis efficiency. Field measurements are now made at night using the same portable light source, mountings and spectrometer used in the laboratory. Analyses of the measurements are performed using best fits to variants of the Shadow Hiding Opposition Effect (SHOE) BRDF model [14,15,16] for particulates. Improved procedures and analysis techniques are discussed below. A discussion of extensions of this work and suggestions for improvements are provided.
1.2. The NEFDS Program
The Nonconventional Exploitation Factors Data System/Database (NEFDS/NEFDB) is a system of high-quality data and algorithms for spectro-radiometric exploitation, thermal, polarimetric, and radar modeling. The NEFDS software and database is unique in that, unlike with traditional spectral libraries, it provides a system of data, parameters, and models that permit the characterization of effective reflectance, emissivity, and aperture radiance estimates, as a function of arbitrary source, sensor, and target geometry. The materials database includes Directional Hemispheric Reflectance (DHR) and Bidirectional Reflectance Distribution Function (BRDF) for over 2000 and 750 materials, respectively. In addition, material thermal and electromagnetic bulk properties were included in the database.
BRDF is included for most materials using the Modified Beard Maxwell (MBM) [17,18] model. Model parameters are determined from more than one thousand polarized and unpolarized measurements for each material, which are measured at each of five laser wavelengths at the Optical Measurement Facility (OMF) at Wright Patterson Air Force Base. Imagery and description files were included within the Graphical User Interface (GUI) for the user. Over 100 modeled atmospheric database items allow users to approximately correct for atmospheric extinction, scattering and radiative effects (upwelling and downwelling). Sensor response functions and source irradiance database items are also available. The software package also includes an Application Program Interface (API) that allows for implementation of NEFDS algorithms into external software.
1.3. Soils Materials in the NEFDS
Laboratory DHR had been measured for soils throughout most of the NEFDS program. However, field BRDF is desirable for remote sensing applications, especially for sands, as the crust known to exist on soils in the field is hard to recreate in the laboratory. In addition, particulates such as sands are known to have a backscatter peak in their reflectance and thus simple assumptions such as Lambertian scattering, which is used as a reasonable assumption for soil BRDF, does not adequately describe the angular distribution for all reflection geometries. Early attempts at field BRDF measurements for the NEFDS soils program [19,20] were performed in daylight with a portable field spectrometer using the sun as a source. The movement of the sun, atmospheric corrections and multiple scattering from environmental sources made interpretation of the data, even within simple models, difficult. Measurements made at the USGS laboratory of soil samples returned from the field sites that used the portable Analytic Spectral Devices (ASD) Field Spec Pro spectrometer [21] available through Malvern Panlytical Ltd., (Malvern, UK), and an unpolarized tungsten halogen light source [22] were more successful. The sensor and source were mounted on photographic tripods and aligned to the required angles using digital protractors. In-plane data were acquired using the light source in a darkened room. These measurements were referenced to a Spectralon polytetrafluoroethylene (PTFE) calibration panel manufactured by Labsphere. Initially, data were analyzed within a simple empirical model that assumed a polynomial background with Gaussian peaks at the forward and backward reflection angles. The more physically based nine-parameter MBM model, used to parameterize laboratory BRDF data from OMF, was found to not provide adequate fits to the field data. While analysis of the data within the MBM model was not feasible, Hapke’s particulate BRDF SHOE model proved more successful. This semi-empirical BRDF model is based on radiative transfer theory, but includes a model, added ad hoc, for the observed backscatter peak seen in soil BRDF measurements. The height and width of this peak are determined empirically through data fits but can be related to soil physical properties [14].
BRDF measurements for several of the sands returned from the field were measured in the laboratory using both the USGS equipment and Northrop Grumman’s Horizontal Mount Scatterometer (HMS) [23] at several VNIR laser wavelengths. The Northrop Grumman HMS obtained BRDF to within 1.5 degrees of the backscatter peak, allowing extraction of the peak width and height within a fit to the SHOE model. These were held fixed within the analysis of the USGS data, which were obtained to within 3 degrees of backscatter.
A modification of the original Hapke model, described in the following sections provided sufficient accuracy to allow the inclusion of laboratory and field BRDF measurements for seven different soils in the NEFDS database by the end of September 2019.
2. Materials and Methods
2.1. Equipment and Measurement Procedure
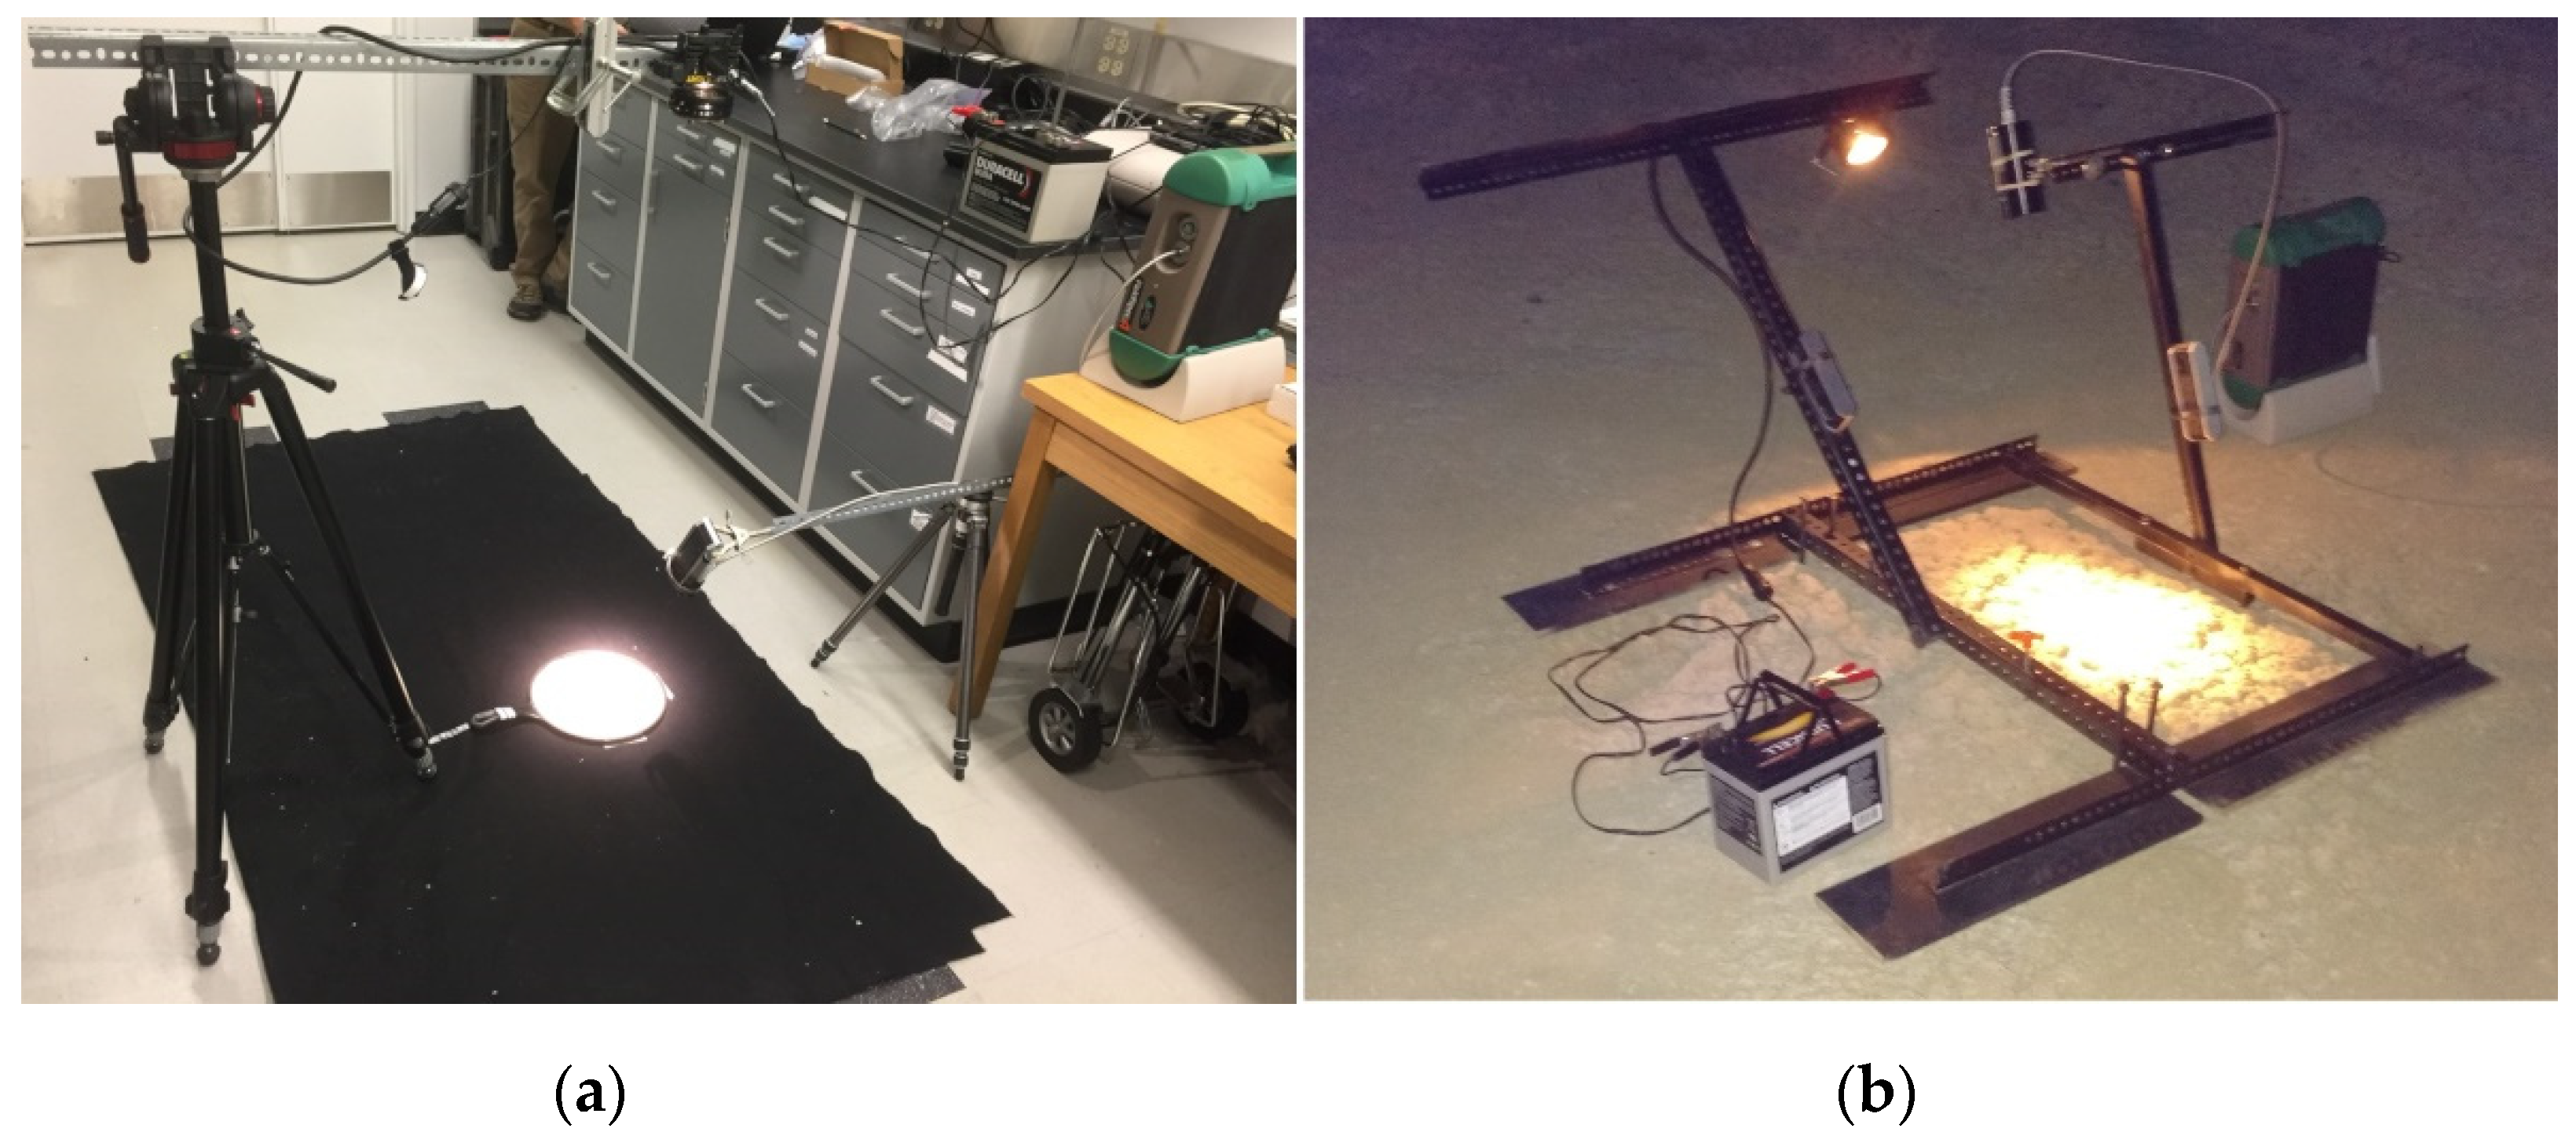
Equipment used for reflectance measurements in the NEFDS soils program included the portable VNIR/SWIR Field Spec Pro spectrometer, shown in Figure 1, set up for laboratory use (left) and for use in the field for the Nevada desert site near Railroad Valley (right). The light reflected from the target is collected by a lens with either a 1-degree or 5-degree field of view and transferred to the ASD spectrometer via fiber-optic cable. The sensor optic and light source were mounted on swing arms using either photo-tripods or a simple goniometer platform. The reflection angles were determined by digital protractors on the swing arms. Angular distributions of reflectance, which were measured with respect to a Spectralon calibration panel with the sensor angle fixed, were used to extract model parameters within the Hapke BRDF model. An in-plane calibration spectrum was taken for each reflection measurement at a given sensor and source angle. In the laboratory, the Spectralon panel was the same depth as the target container, so no offset in height was required for the calibration measurement. However, for the calibration of field measurements the tripod would be raised by the height of the Spectralon panel for the duration of the calibration. Measurements of these calibrated “white-referenced” spectra were made at about 10-degree intervals, between a −70- and 70-degree zenith source angle, for three positions of the sensor. Measurements typically were made to within 3 degrees of backscatter. Sensor and source field-of-view coincidence were verified by laser pointers mounted on the swing arms collinear with the sensor and light sources. At the soil surface, the areal field of view for the 1-degree foreoptic was approximately 3 cm in width (major axis) at 60 degrees zenith, and 19 cm width for the 5-degree field of view foreoptic.
Later measurements in the program used a goniometer constructed out of aluminum struts to mount the source and sensor. While goniometer designs for the measurement of BRDF have been extensive, ranging from simple designs using inexpensive materials to automated designs capable of measuring over the entire hemisphere [24,25,26,27,28], our design effort led to a portable, inexpensive platform capable of in-plane measurements using our laboratory equipment over a 140-degree range to within 3 degrees of backscatter.
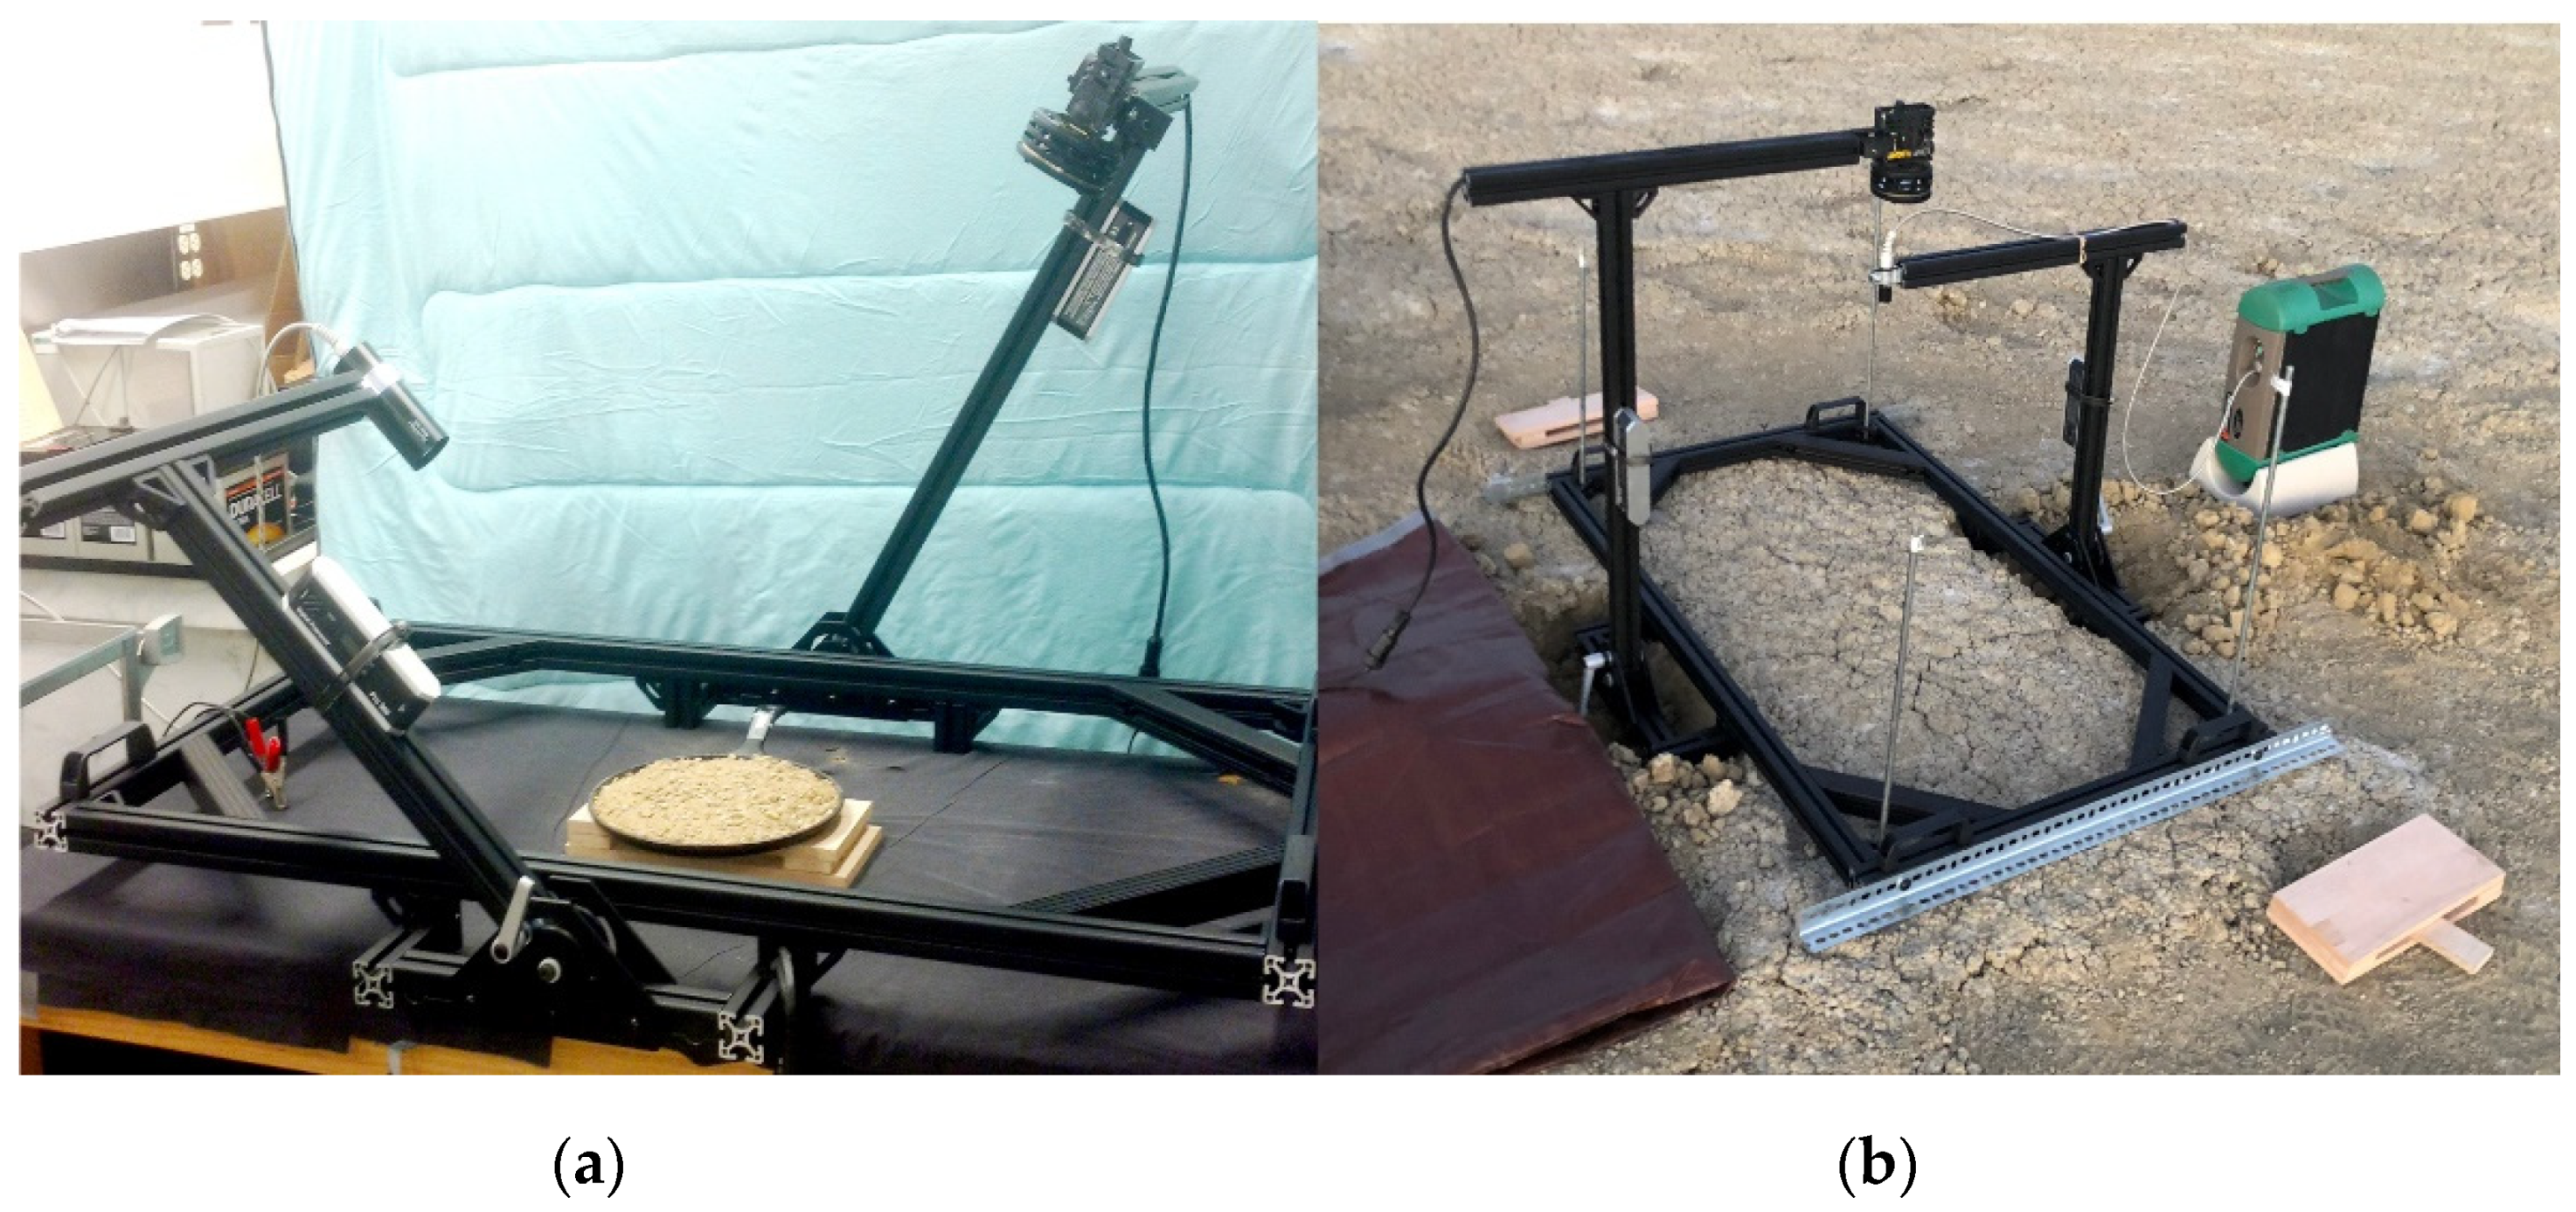
An upgraded version of the field goniometer constructed of 80–20 [29] aluminum struts is shown below. The inexpensive platform is 122 × 61 cm at the base, has swing arms of 46 and 66 cm in height and weighs about 9 kg.
Field measurements using this platform require a small trench to be dug to allow the pivot point of the swing arms to be coincident with the soil surface, as shown in Figure 2b.
2.2. Nocturnal Field Measurements
Daylight measurements of soil reflectance using the sun as a source require either an absolute measurement of solar intensity, in which case atmospheric corrections must be applied, or relative measurements with respect to a calibrator, where the solar intensity is assumed not to change during the measurement. Corrections to absolute measurements of solar intensity can be substantial, even for cloudless daylight measurements of solar light transmitted through the atmosphere [30] under clear sky conditions. Changes in solar intensity must be monitored in daylight measurements as even light clouds can cause significant reductions in intensity.
Both laboratory and field measurements presented in this work are taken under darkened conditions. A Spectralon calibration spectrum was acquired with each soil reflectance measurement and a ratio determined. These “white-referenced” data were outputs of the spectrometer software for later analysis.
Field BRDF measurements for the NEFDS soil program are performed at night using the same equipment and techniques developed for laboratory measurements The portable halogen source was mounted on the swing arm of either the tripod or goniometer platform and was adjusted to the desired illumination angle for the length of the measurement, at the desired fixed sensor angle. This allowed full angular distributions to be accumulated, unlike solar daytime measurements. Some problems unique to night measurements in the field were encountered, most notably during warm, wet conditions, when flying insects are abundant. These insects were attracted to the goniometer source light and could make data acquisition difficult, if not impossible.
The top layer of soil, roughly 1 cm in thickness, was returned to the USGS laboratory in sample bags. Samples were spread without compaction onto a tray approximately 25 cm in diameter, wetted using a water bottle spray (simulating raindrops) and allowed to dry to form a crust. BRDF and DHR laboratory measurements were made in an air condition-controlled environment, under darkened conditions using the same equipment (for BRDF) as used for the in-situ measurements. DHR was measured over the VNIR/SWIR range using a grating spectrometer and in the Thermal Infrared (2.0–14 microns) using a Fourier Transform Interferometer. Both instruments were equipped with an integrating sphere. Photography of the field site and laboratory samples, including photomicroscopy, are included as part of the NEFDS database.
2.3. Model and Data Analysis Procedures
2.3.1. Data Analysis Procedures
The Spectralon calibrated “white-referenced” spectra were: (1) corrected for angle offsets and Spectralon degradation; (2) averaged over three measurements collected at each reflection setting; and (3) binned within analysis fitting codes. These codes use the Levenberg–Marquardt algorithm [31,32] to obtain the best fit of the data to one of two variants of the Hapke BRDF model; either the Shadow Hiding Opposition Effect (SHOE) [14,15,16] or the surface phase function (SPF) variant introduced by Shepard and Helfenstein [33,34]. The SHOE model is a radiative transfer model that describes the backscatter peak seen in soils as a combination of a geometric shadowing model and a coherent backscatter model relevant within a few degrees of backscatter. The SHOE algorithm used in this analysis is a 4-parameter description of the scattering that includes only shadow hiding—the single particle albedo, the height and width of the backscatter peak, and an asymmetry scattering parameter that describes the average of the cosine of the scattering angle within an Henyey-Greenstein [35] empirical phase function.
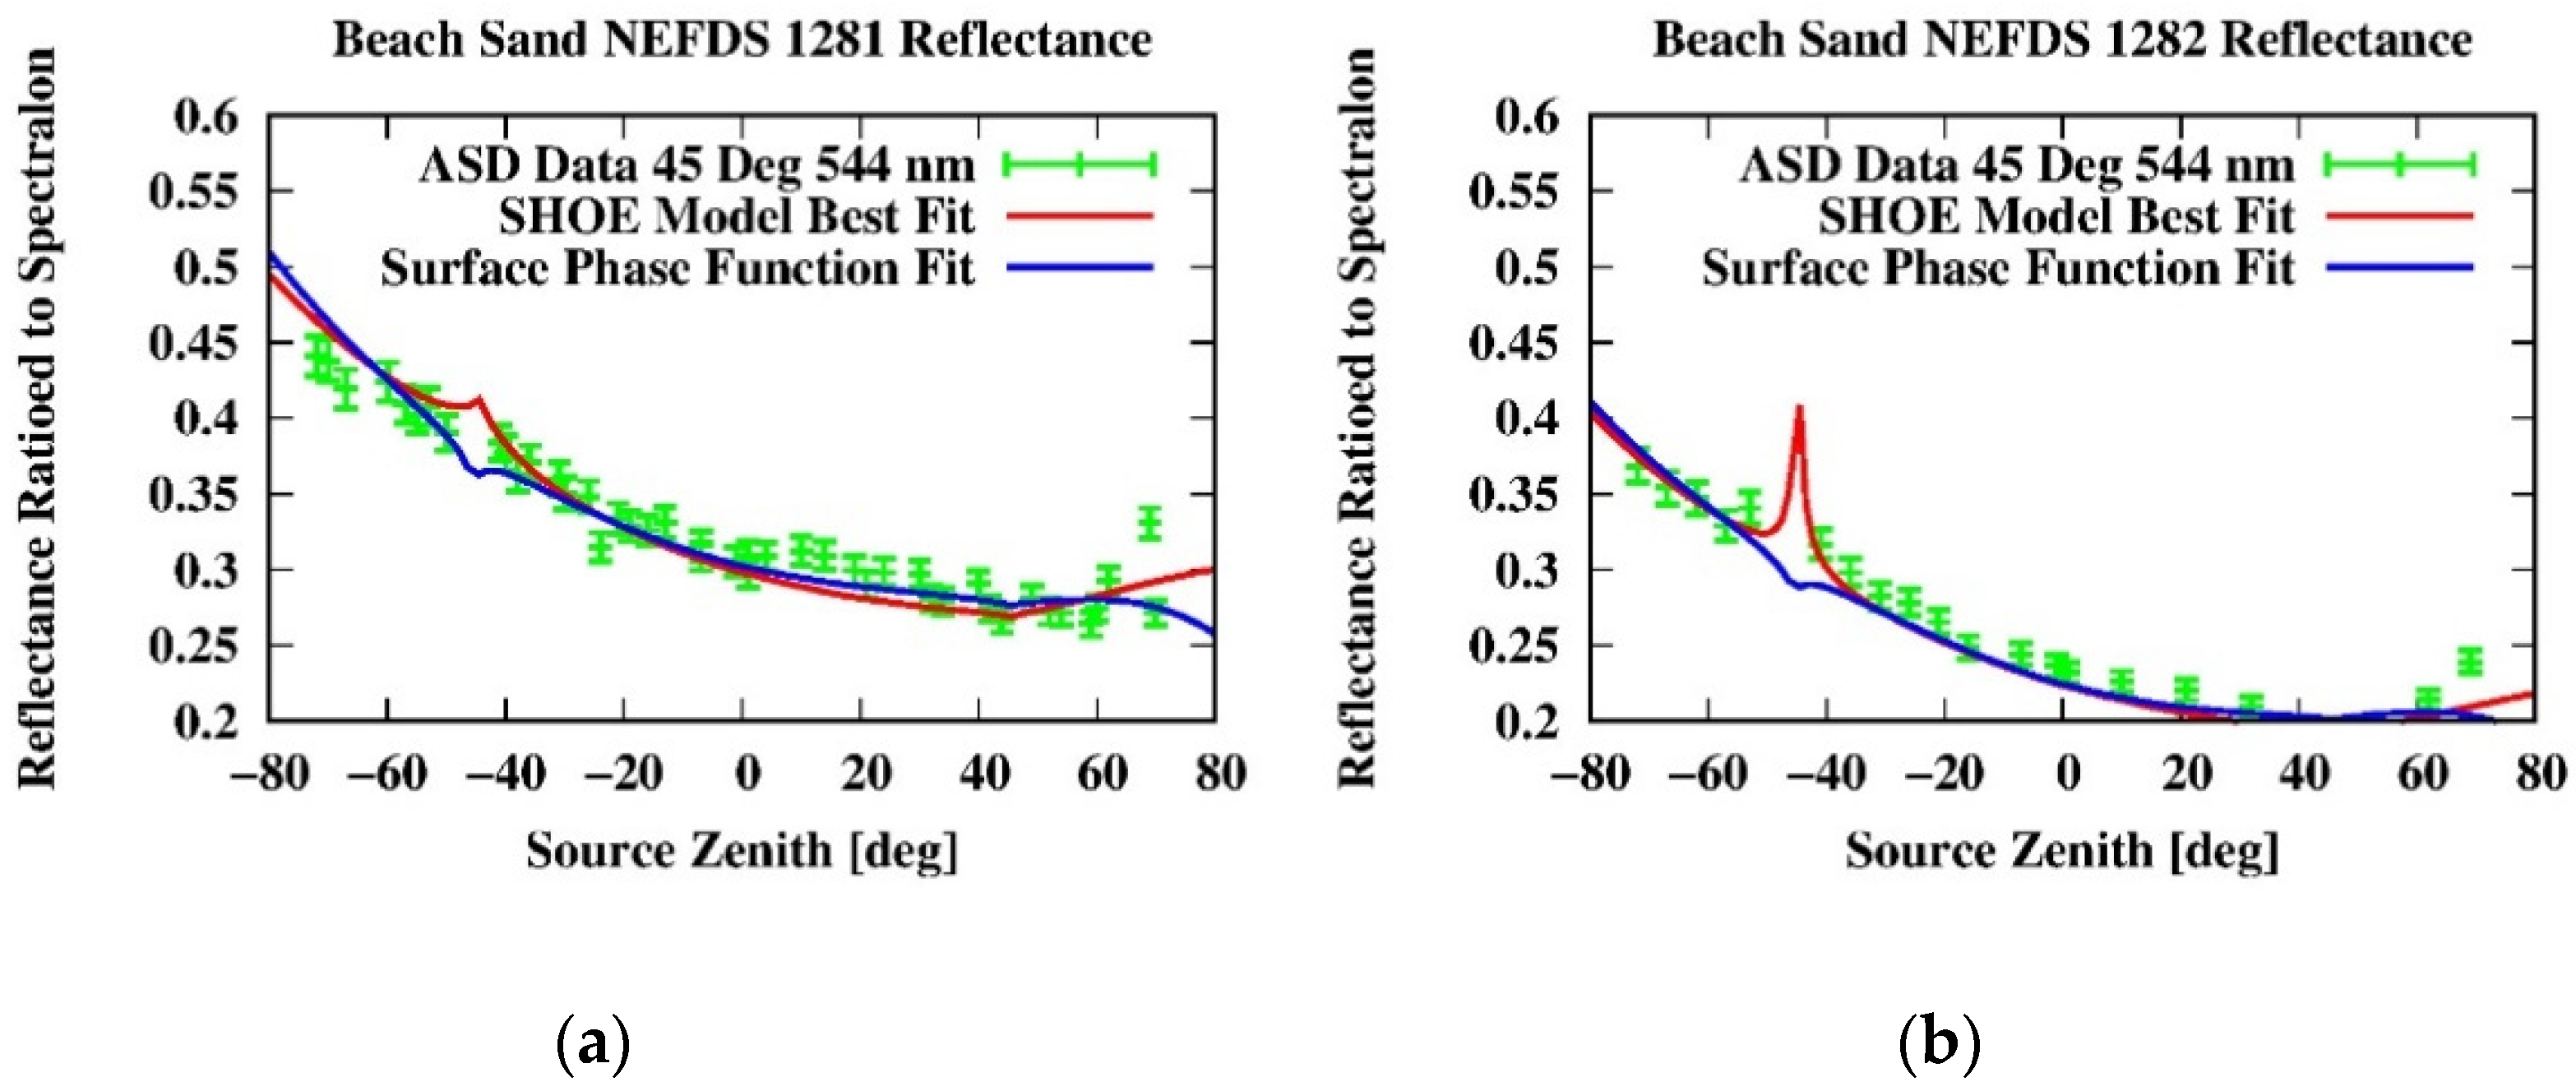
The surface phase function variant of Hapke’s BRDF model substitutes a polynomial expansion for the backscatter in the original SHOE model. The difference in the calculated BRDF ratioed to the calibrator Spectralon between the two models can be seen in Figure 3, in which laboratory data taken at 544 nm are shown for two New Jersey beach sands, with best fits derived using both the SHOE and the surface phase function models. These data were taken at a fixed sensor angle of 45 degrees zenith. The width and height of the backscatter peak were determined from separate fits to data (collected with Northrop Grumman’s HMS) and held constant for the SHOE model fits to the ASD data presented here. Using the SHOE model, the backscatter peaks for the beach and desert sands included in the NEFDS database were small, typically having a Full Width Half Maximum (FWHM) width of about 2 degrees. The surface phase function modification provided a good fit to the data; thus, the Shepard and Helfenstein model variant has been chosen for analysis of the ASD field data. This allowed a determination of the BRDF over the hemisphere with a limited dataset, except near (within a degree or two) the backscatter peak. Future goniometer development could allow field measurements closer to the backscatter peak and thus reconstruction of the BRDF using the height and width parameters of the SHOE model.
2.3.2. BRDF Model Parameters within Hapke’s SHOE Model
In the SHOE model, the BRDF is given as the bidirectional reflectance divided by the cosine of the incident zenith angle producing:
where i and e are the incident and emitted reflectance angles, respectively, and is the phase angle, and
In these equations, the incident light makes an angle with the normal to the surface and is reflected from the surface at an angle ϑe with respect to the surface normal towards the sensor. The phase angle is the difference between the incident and emitted angles, is the single scattering albedo, is the cosine of the reflection zenith angle , and are the width and height of the backscatter peak, respectively, and the function is an approximate solution to an integral equation [14,15,16,36] with
The scattering phase function describes the angular pattern into which power is scattered. The BRDF can then be seen to be a function of three adjustable parameters, and , plus the parameters of the scattering phase function, when the incident and emitted reflectance angles are known. The scattering phase function can add from zero to four (or more) additional parameters to these three, depending on the complexity of the data to be described. Isotropic scattering gives , while the phase function that describes the molecular dipole scattering of unpolarized visible light, Rayleigh scattering, is given by [37]
Data taken and incorporated into the NEFDS in Hapke’s SHOE model are described by the Henyey-Greenstein equation [14] given by:
with defined as the “asymmetry factor,” describing the amount of forward-backward asymmetry to the scattering. If the angles are known, the function can instead be viewed as a function of the asymmetry parameter , , and used as a fit parameter to the reflection data. Data within this model were analyzed with best fits to the four model parameters and . In the NEFDS, four soil materials were analyzed within the SHOE model and are presented within the database.
2.3.3. BRDF in SPF Modification
Note that Hapke’s BRDF model as described above can be rewritten in the following form:
where the surface phase function is defined by
The angularly dependent product of H-functions is defined here as
In the above model, we have expressed this product function as well as the SPF as functions of the reflection angles, not in terms of the SHOE backscatter parameters h and and “asymmetry factor” .
The Shepard-Helfenstein modification of Hapke’s model parameterizes the function F(g) in terms of Legendre polynomials expressed as an expansion in the phase angle g. The coefficients of the Legendre polynomials are the parameters of interest describing the material reflection properties, instead of the three parameters and derived from the SHOE model. While the form of the derived model for the BRDF is the same as the original, with the single parameter albedo parameter identical in the two models, the modified parameterization does not require a peak described by the parameters . This is an advantage if one wishes to reproduce experimental BRDF datasets, though only the parameter is linked directly to a physical property of the material—the albedo. While the original Hapke SHOE model parameter, the width of the backscatter peak, can be shown to be a function of the particle size and packing fraction, the parameters of the Legendre function do not directly represent physical properties of the particulate under study. They are an empirical fit to the data.
The modified Hapke model can then be written as above, but with the functional form as below
where Pn is the Legendre Polynomials of order , the summation starting at n = 1 and the parameters fit to the data are the coefficients .
As shown in Figure 3, if the backscatter peak is small, the error in describing the BRDF is small using the SPF variant of Hapke’s model. The albedo parameter and up to three polynomial coefficients are determined in the fitting procedures within the Shepard-Helfenstein modification of Hapke’s model [34,38].
BRDF was obtained from this model for 284 wavelengths over the range of the spectrometer measurements, from approximately 400–2440 nm. As the measured quantity from the spectrometer is BRDF ratioed to a Spectralon calibrator, Spectralon BRDF was calculated within the analysis code to obtain a ratio of target BRDF to the Spectralon at that wavelength. The calculated Spectralon BRDF was obtained from NEFDS MBM-modeled BRDF from OMF measurements on either a pristine or weathered panel. A constant 3% error was added in quadrature to the measured data to account for the uncertainty in Spectralon BRDF.
Best fit modeled BRDF was integrated over the hemisphere to obtain DHR for comparison with laboratory measured DHR (8-degree source angle). This integrated BRDF is included within the NEFDS for each measured field dataset.
3. Recent Results
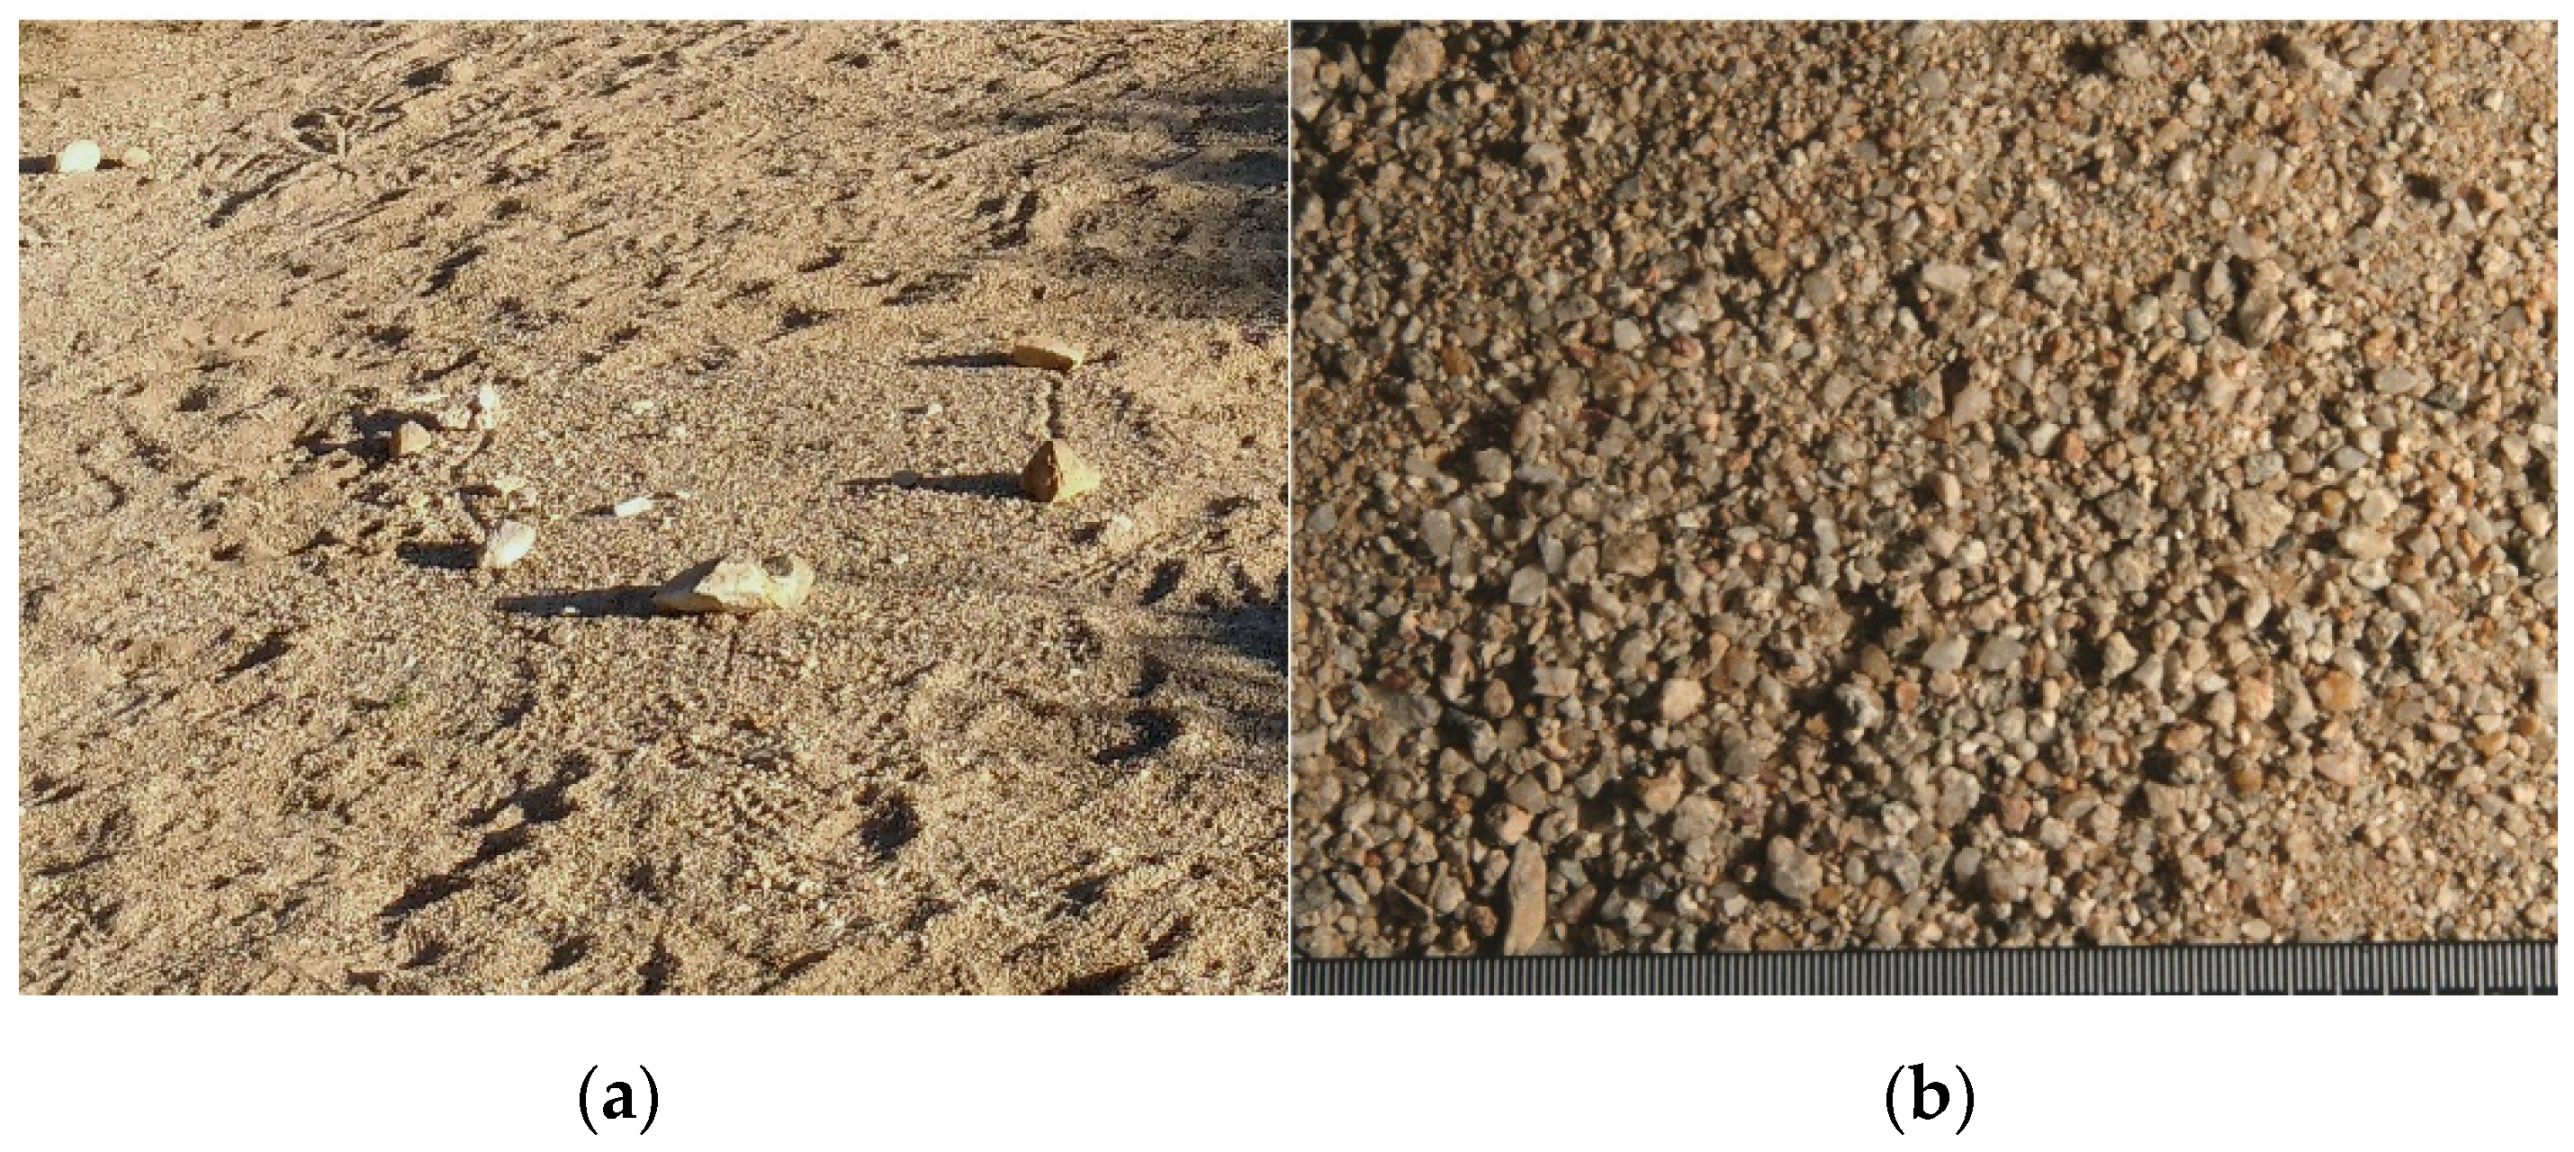
Removal of the soil from a site for laboratory measurements changes its physical structure and reflection characteristics. Thus, it should be a goal of the program to measure BRDF for soils in-situ. Field data were taken on both beach and desert sands for incorporation into the NEFDS. Recent data on desert sand were from the lower part of an alluvial fan at a site near Mountain Pass, CA. The sample measured both in the laboratory and in the field, consists mostly of (90–93%) poorly sorted, very fine to coarse sand with granitic granule sized, subangular rock fragments, that form a weak crust. The site is shown on the left of Figure 4, taken from a few meters distance in the day. A recreation of the surface in the laboratory is shown on the right of Figure 4, from a nadir viewing position at about the same source angle as for the field image. A metric ruler at the bottom of the right image shows the larger pebbles to be a few millimeters in size.
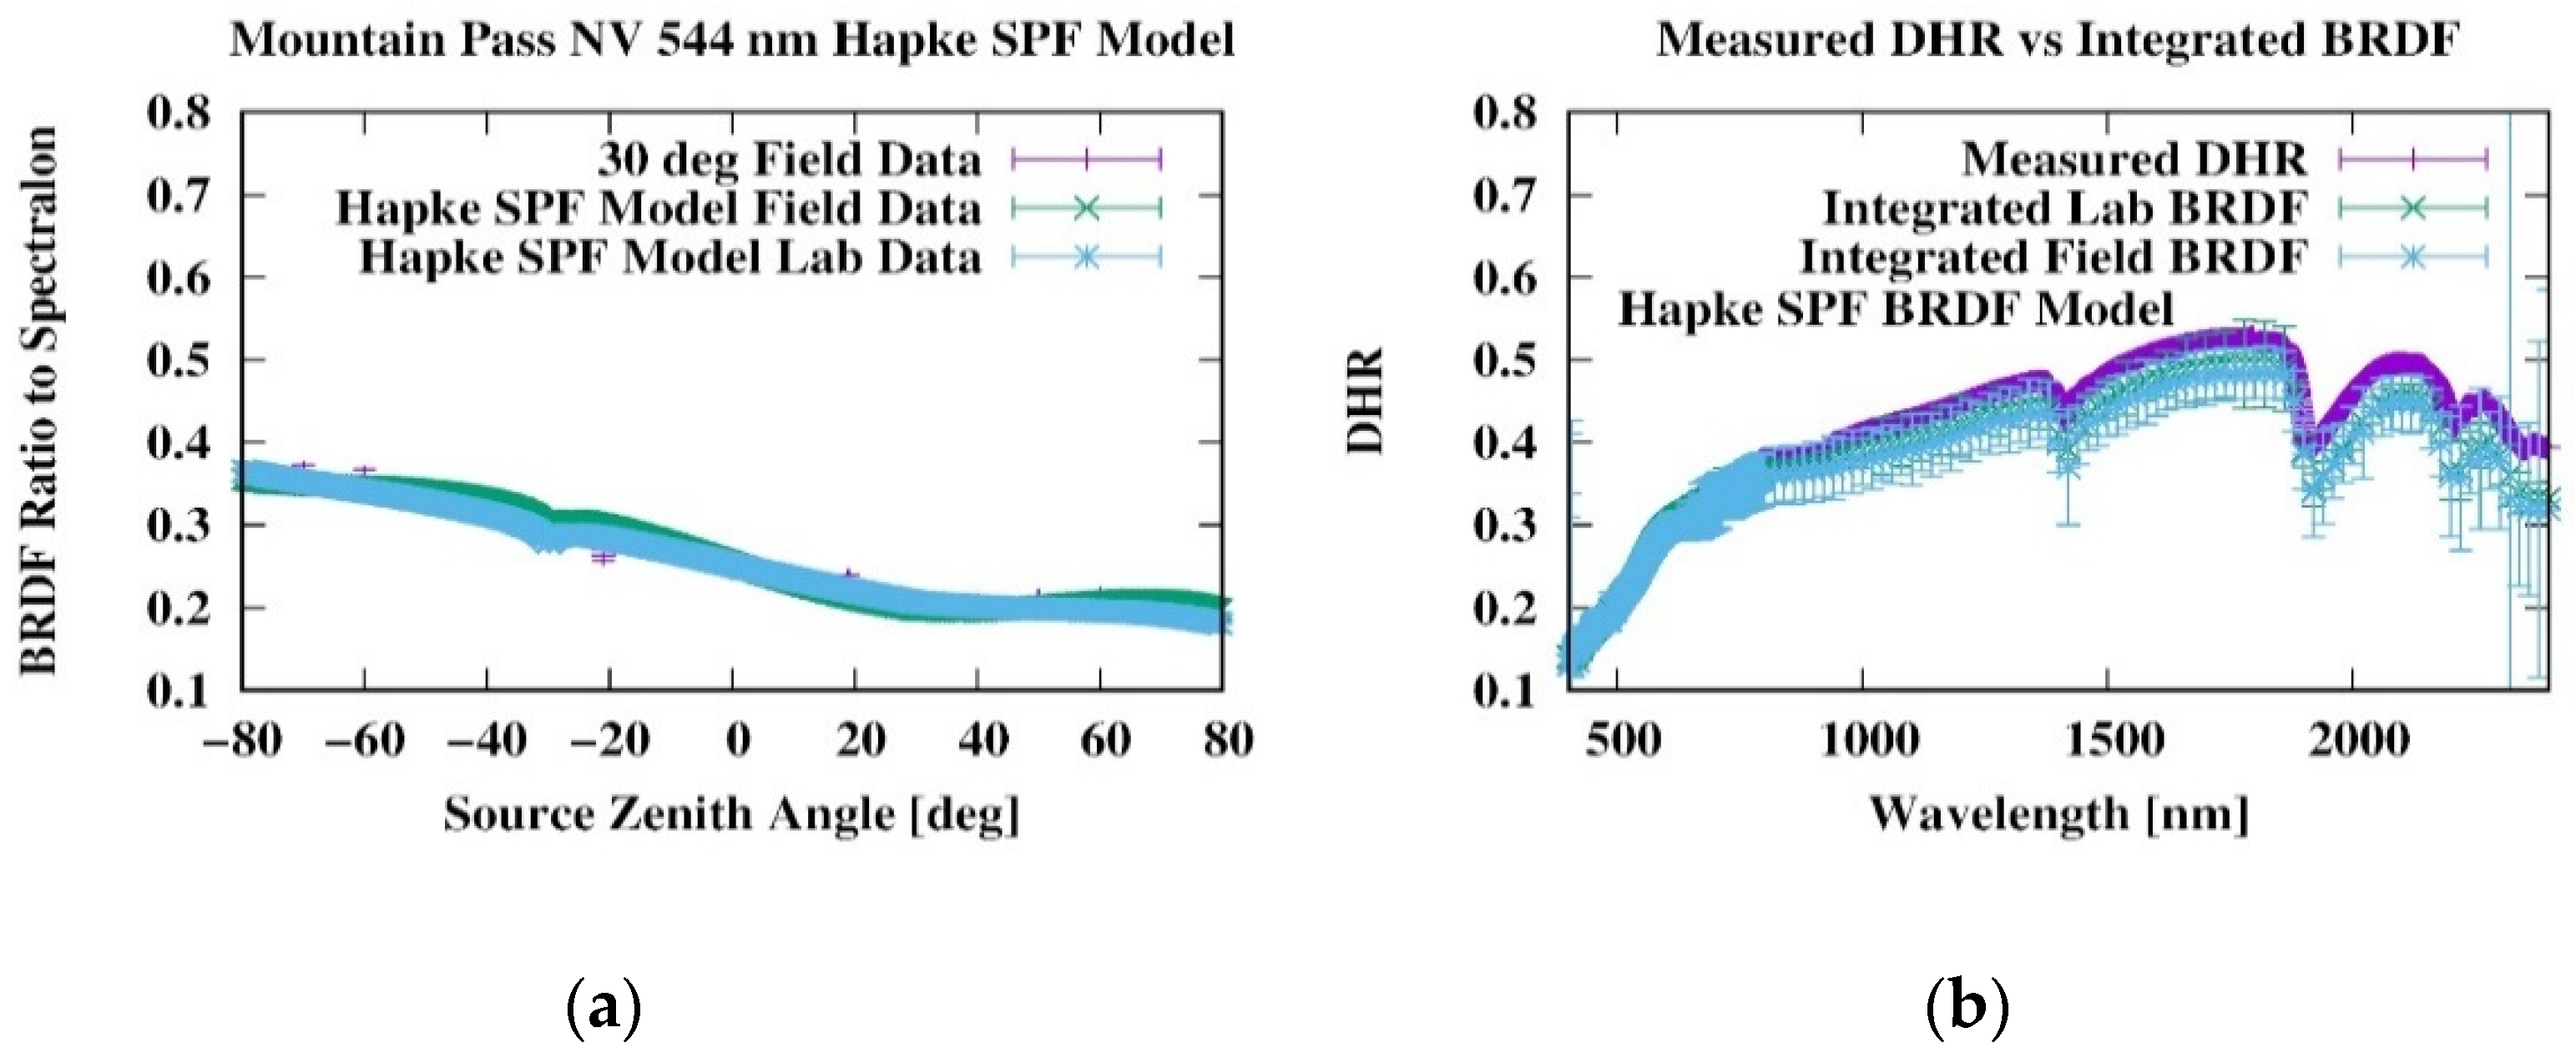
Angular distribution data measured both in the field and laboratory were analyzed with the SPF model variant of the Hapke model; field data are presented along with the model fits in Figure 5a. The 544 nm field BRDF data ratioed to Spectralon are shown ranging from −70 to 70 degrees source angle, taken at a fixed sensor angle of 30 degrees, along with best fits from the field and laboratory measurements. These data show a pronounced backward asymmetry that would be modeled within the SHOE model as a combination of negative asymmetry parameter and a backscatter peak at −30 degrees zenith. The SPF variant can model the asymmetry, though it cannot reproduce a peak at backscatter. As the Spectralon calibrator has a small backscatter peak, the “white-referenced” data, which is a ratio of the calculated BRDF to Spectralon, slightly decreases in the backscatter peak region, as shown in Figure 5a.
DHR values obtained from integration of the measured BRDF over the hemisphere (Figure 5b) are essentially identical for the field and laboratory data. DHR data show a high reflectance in the VNIR, which is commonly observed in non-organic sandy soils, with contributions from water absorption at approximately 1400 and 1900 nm. A feature due to aluminum hydroxide found in either muscovite or clay is seen at about 2200 nm. The integrated BRDF results are approximately within 1-standard deviation errors of the measured laboratory DHR.
The nearly identical field and laboratory results presented here are not necessarily typical, as it is difficult to reproduce the physical structure of the soil surface in the laboratory. In addition to the admixing of different layers of soils returned from the field, the wetting and drying of the soil in the laboratory may not reproduce the hysteresis effect of natural repeated wetting and drying of the crusted soil in the field [39,40].
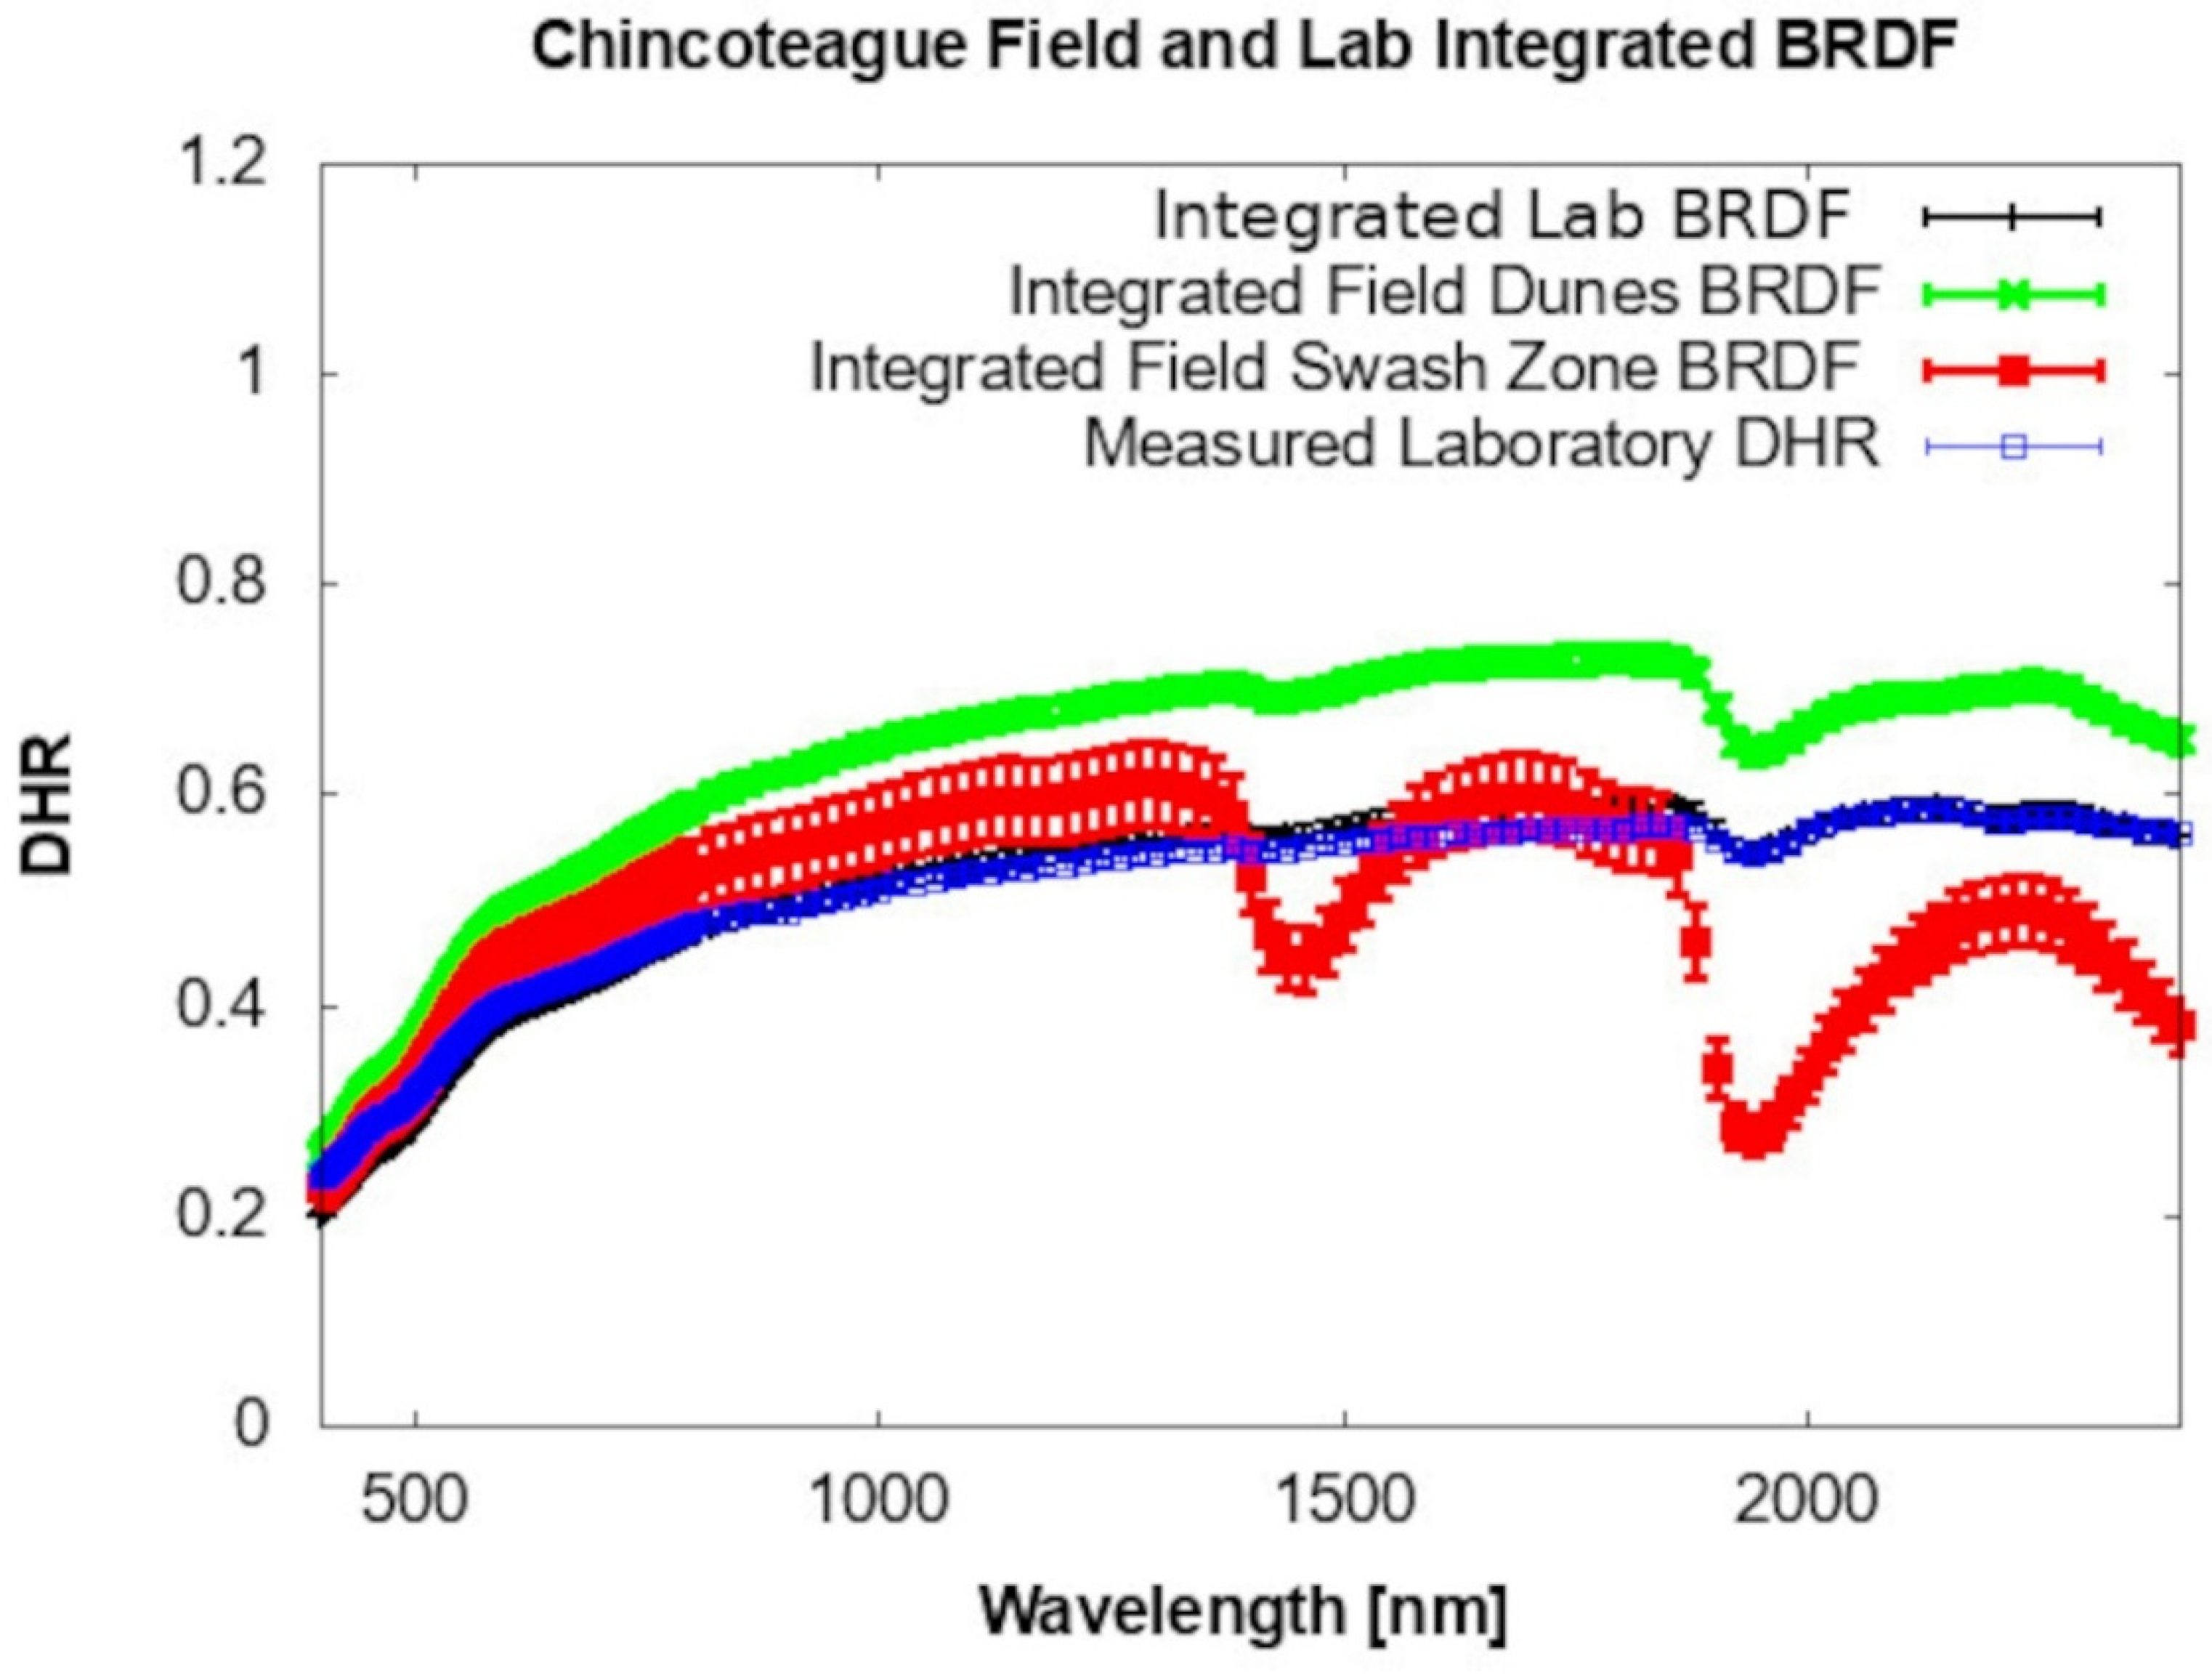
More interesting are the results presented in Figure 6, which are the integrated BRDF extracted from data taken on Chincoteague Island beach. BRDF integrated over the hemisphere from model fits to data taken in the laboratory on returned samples are shown in black. Data taken from an area approximately 50 m from the shoreline, which consists of a thin veneer (<1 cm) of wind-rippled sand that covers wave-swash deposited sand, are shown in green. Field data from the swash zone, which has been wetted by the incoming tide, are shown in red. The integrated laboratory BRDF from model fits to data taken on returned samples (black) are seen to be identical to within the measurement errors of laboratory DHR (blue) measured with a grating spectrometer and integrating sphere.
The relatively high reflectance is in part due to the quartz composition of the sample, rounded by frictional processes with only a small admixture of feldspar and organics. Quartz spectral features are not seen in these VNIR/SWIR spectra, but the characteristic crystalline quartz structure is seen in visual magnified imagery of the sand and in FTIR laboratory data of the samples, where the restrahlen feature from 8 to 9.5 micrometers is prominent [41]. The top few millimeters of crusted, wind-rippled sand were well-sorted and transported by wind; thus, they will have an enhanced reflectance compared to the more poorly sorted underlying wave swash deposited sand [42]. Enhanced reflectance of crusted soils has also been observed to occur in laboratory crusting experiments [43]. When the soil is removed from the field for laboratory measurements, the thin veneer of wind-rippled crusted sand is destroyed; also, the sampling technique collects some of the underlying, less reflective, swash zone sand. Soil hysteresis makes reproduction of the field crust unlikely. It is not surprising that the laboratory data, which was wetted only once and allowed to dry to form a crust, has a different reflectance than the measured field data. Spectral features from water absorption at about 1400 nm and 1900 nm are larger in the field reflectance data when compared with the reflectance of the dried laboratory sample, which was kept in a temperature and humidity-controlled environment. Not only are the water spectral features very large for the field swash zone data, but the average reflectance is also much smaller in the VNIR away from those spectral features. This is a general feature of the reflectance seen for wetted materials and is caused by the increased scattering and absorption of incident light by the water that replaces the air in the voids between sand grains. It should be noted that the value of the reflectance of the sand measured in the swash zone is 12 percent less than value measured in the dunes at 1000 nm. This is consistent with the 12.5% reduction seen with a 20% water volume of a Florida quartz beach sand (NEFDS 1136QuartsS) from [5]. Though this is a reasonable value for the water content of the swash zone sand, other effects must be considered, such as a difference between the structure of the field dunes and swash zone sand, and instrumental effects, including condensation on the sensor optics. To prevent condensation on the optics, we recommend measurements in warm, humid environments use heat tapes to keep the optics free from condensation.
4. Discussion
Continual improvement of the data acquisition process, equipment and analysis technique allowed incorporation of in-situ soil reflectance measurements into the NEFDS materials database. A portable spectrometer and light source mounted on a lightweight goniometer platform has been used to collect sufficient data to do a best-fit within a variant of Hapke’s BRDF model. The features seen in the recorded spectra of these beach and desert sands data are typical of minimally altered soils with a small organic matter content as described in Stoner and Baumgardner [44]. Water absorption features are seen in the beach sand, and both the depth of the features and overall reflectance are clearly correlated to the amount of water present in the sand. Some spectral features indicative of hydroxyl content is seen in the desert sand. Specific mineral content indicative of quartz, for instance, which is a major component of the beach sand, is not seen in the VNIR/SWIR spectra discussed herein.
The BRDFs for these soils do have a significant backscatter, which is modeled within the SPF variant of Hapke’s model as a large contribution to the 1st order Legendre polynomial. The backscatter gives a maximal contribution at zero phase angle, going to zero at 90 degrees. SHOE model fits might give a better approximation, but as seen in Figure 3, there would only be a significant difference between the two approaches at small phase angles. In the case of the beach sand shown in Figure 6, integrating the laboratory BRDF over the hemisphere gives virtually identical results to the value of measured DHR using a laboratory integrating sphere, thereby supporting the supposition that the backscatter peak is small enough to ignore except within a few degrees of zero phase angle.
Future goniometer development would allow the measurement of in-plane BRDF with greater efficiency and precision as well as the performance of out-of-plane measurements.
The 80–20 aluminum platform has recently been used in both laboratory and field measurements of desert sands using the SPF variant of Hapke’s BRDF model. Though this goniometer did allow data to be acquired to within 3 degrees of backscatter, laboratory BRDF has been obtained to within 1.5 degrees of the backscatter peak for several desert soils using the SHOE model and the Northrop Grumman HMS [23]. As soil porosity is related to the backscatter peak width in Hapke’s model, porosity changes due to soil crusting could be obtained using this instrument. Assuming equant particles and a narrow particle size distribution, the porosity would be related to the width of the backscatter peak as an exponentially decreasing function of the backscatter peak width [14]. If measurements closer to the backscatter peak become possible in the field, the porosity, at least within model assumptions, can be included in measured materials databases (using reflection measurements only) as well as BRDF measurements of the backscatter peak region. This information would be of use to a variety of remote sensing customers.
5. Conclusions
This effort has been focused on conducting field BRDF measurements on in-situ desert and beach sands. Results of this effort include:
The development of BRDF measurement techniques in the laboratory that have been transitioned to field use at night. This includes nocturnal measurements that allow extraction of soil BRDF uncontaminated by scattered background light inherent in daylight field measurements.
The development of an inexpensive goniometer and analysis techniques that allow a full set of in-plane reflectance measurements to be acquired in one measurement session.
Comparisons of in-situ field soil measurements with laboratory-measured samples returned from the field. BRDF laboratory and field data were obtained that can be compared directly or integrated over the hemisphere to provide comparisons with calibrated measurements using a grating spectrometer and integrating sphere. Laboratory and field BRDF measurements agree for the desert sand example presented in this work, while there are deviations between the laboratory and field measurements for the beach sand. This difference is attributed to the difficulty in reproducing the conditions found in the in-situ environment of the beach sand, such as soil moisture and crusting, in the laboratory.
Analysis of reflectance data was conducted with two versions of Hapke’s BRDF Model: the SHOE and the SPF variants. The SPF variant is shown to provide results consistent with SHOE except in the difficult to measure region near zero phase angle. The results of the analyses were the BRDF parameterization of seven (7) desert and beach sands. The BRDF parameters are included in the NEFDS database for use with NEFDS algorithms to determine the reflectance of the soils for specific source, sensor, and target geometries.
Planned efforts include a more precise determination of the BRDF in the backscatter plane, out-of-plane measurement studies, studies of sediments, such as playas, which exhibit specular behavior, the study of porosity within Hapke’s model using crusted and uncrusted sand samples in the laboratory, and comparisons with satellite calibration efforts.
Author Contributions
Conceptualization, J.C.M.; Methodology, J.C.M. and J.E.W.; Software, J.E.W.; Validation, J.C.M., J.E.W.; Formal analysis, J.E.W.; Investigation, J.C.M.; Resources, J.C.M.; Data curation, J.C.M., J.E.W.; Writing: original draft preparation, J.E.W.; Writing: review and editing, J.C.M.; Visualization, J.E.W.; Supervision, J.C.M.; Project administration, J.C.M. All authors have read and agreed to the published version of the manuscript.
Funding
This research was funded by United States Geological Survey, the United States Department of Defense and Cortana Corporation.
Data Availability Statement
Requests for data and the NEFDS should be made to Tim Boyce, Cortana Corporation, 520 N. Washington St., Suite 200, Falls Church, VA, USA 22046.
Acknowledgments
The authors wish to acknowledge Jack Salisbury, Tim Boyce, Carol May, Jim Crowley, Sasha Alexander, Richard Haberstroh and Michael Metzler for their support and encouragement in the field measurement aspects of the program.
Conflicts of Interest
The authors declare no conflict of interest.
Abbreviations
| API | Application Programming Interface |
| AFB | Air Force Base |
| ASD | Analytical Spectral Devices |
| BRDF | Bidirectional Reflectance Distribution Function |
| DHR | Directional Hemispheric Reflectance |
| FTIR | Fourier Transform Infrared |
| FWHM | Full Width Half Maximum |
| GUI | Graphical User Interface |
| HMS | Horizontal Mount Scatterometer |
| MBM | Modified Beard Maxwell |
| NEFDS | Nonconventional Exploitation Factors Data System |
| OMF | Optical Measurement Facility |
| PTFE | polytetrafluoroethylene |
| SHOE | Shadow Hiding Opposition Effect |
| SPF | Surface Phase Function |
| SWIR | Short Wave Infrared |
| VNIR | Visible/Near Infrared |
| USGS | United States Geological Survey |
References
- Westlund, H.B.; Meyer, G.W. A BRDF database employing the Beard-Maxwell reflection model. In Proceedings of the Graphic Interface, Calgary, AB, Canada, 27–29 May 2002; pp. 189–200. [Google Scholar]
- Computer Graphic Rendering of Material Surfaces–NEFDS. Available online: https://math.nist.gov/~FHunt/appearance/nefds.html (accessed on 30 November 2021).
- Bacour, C.; Briottet, X.; Bréon, F.-M.; Viallefont-Robinet, F.; Bouvet, M. Revisiting Pseudo Invariant Calibration Sites (PICS) Over Sand Deserts for Vicarious Calibration of Optical Imagers at 20 km and 100 km Scales. Remote Sens. 2019, 11, 1166. [Google Scholar] [CrossRef] [Green Version]
- Bruegge, C.J.; Coburn, C.; Elmes, A.; Helmlinger, M.C.; Kataoka, F.; Kuester, M.; Kuze, A.; Ochoa, T.; Schaaf, C.; Shiomi, K.; et al. Bi-Directional Reflectance Factor Determination of the Railroad Valley Playa. Remote Sens. 2019, 11, 2601. [Google Scholar] [CrossRef] [Green Version]
- DiMarzio, D.; Haberstroh, R.; Chu, S.; Fonneland, N. Contamination Modeling Document NEFDS V17.0 Distribution, 2016.
- Kerekes, J.P.; Strackerjan, K.E.; Salvaggio, C. Spectral reflectance and emissivity of man-made surfaces contaminated with environmental effects. Opt. Eng. 2008, 47, 106201. [Google Scholar] [CrossRef] [Green Version]
- Salisbury, J.W.; D’Aria, D.M. Infrared (8–14 μm) remote sensing of soil particle size. Remote Sens. Environ. 1992, 42, 157–165. [Google Scholar] [CrossRef]
- Koh, G.; Ballard, J.R. Disturbed Soil Signatures for Mine Detection. In Proceedings of the Army Science Conference (24th), Orlando, FL, USA, 29 November–2 December 2005. [Google Scholar]
- Kelch, D.J.; Fatora, D.A.; Hill, R.K.; Krause, K.; Lind, P.R.; Siler, E.; Sink, B.L.; Sira, D.; Salisbury, J.W.; Nguyen, S.T. Rainfall Dependence of Soil Spectra. In Proceedings of the International Symposium on Spectral Sensing Research, Las Vegas, NV, USA, 3 November 1999. Paper WP00–008. [Google Scholar]
- Johnson, J.R.; Lucey, P.G.; Horton, K.A.; Winter, E.M. Infrared Measurements of Pristine and Disturbed soils 1. Spectral Contrast Differences between Field and Laboratory Data. Remote Sens. Environ. 1998, 64, 34–46. [Google Scholar] [CrossRef]
- Salisbury, J.W.; Crowley, J.K. A Collection of White Papers by Dr. Jack Salisbury on Spectral Analysis, e.g., How to Interpret NEFDS Spectra, NEFDS 11.0.3.1 Documentation. 15 July 2008. [Google Scholar]
- Crowley, J.K. Visible and near-infrared (0.4–2.5 μm) Reflectance Spectra of Playa Evaporite Minerals. J. Geophy. Res. Solid Earth 1991, 96, 16231–16240. [Google Scholar] [CrossRef]
- Mars, J.C. Mineral and Lithologic Mapping Capability of WorldView 3 Data at Mountain Pass, California, Using True- and False-Color Composite Images, Band Ratios, and Logical Operator Algorithms. Econ. Geol. 2018, 113, 1587–1601. [Google Scholar] [CrossRef] [Green Version]
- Hapke, B. Theory of Reflectance and Emittance Spectroscopy; Cambridge University Press: Cambridge, UK, 2005. [Google Scholar]
- Hapke, B. Bidirectional Reflectance Spectroscopy: 1. Theory. J. Geophy. Res. 1981, 86, 3039–3054. [Google Scholar] [CrossRef] [Green Version]
- Hapke, B. Bidirectional Reflectance Spectroscopy. 4. The Extinction Coefficient and the Opposition Effect. Icarus 1986, 67, 264–280. [Google Scholar] [CrossRef] [Green Version]
- Maxwell, J.R.; Beard, J.; Weiner, S.; Ladd, D.; Ladd, S. Bidirectional Reflectance Model Validation and Utilization Technical Report AFAL-TR-73–303; Environmental Research Institute of Michigan (ERIM): Ann Arbor, MI, USA, 1973.
- Montanaro, M.; Salvaggio, C.; Brown, S.; Messenger, D. NEFDS Beard-Maxwell BRDF Model Implementation; Matlab Rochester Institute of Technology: New York, NY, USA, 2007. [Google Scholar]
- Salisbury, J.W. Spectral Measurements Field Guide; Report No. ADA362372; Earth Satellite Corporation, Defense Technology Information Center: Fort Belvoir, VA, USA, 1998; Available online: https://apps.dtic.mil/sti/pdfs/ADA362374.pdf (accessed on 8 September 2022).
- Crowley, J.K. Report on New Mexico Soil Spectral Measurements Report for Cortana Corp.; United States Geological Survey: Falls Church, VA, USA, 2006.
- Hatchell, D.C. (Ed.) Analytical Spectral Devices, Inc. (ASD) Technical Guide, 4th ed.; Analytical Spectral Devices: Boulder, CO, USA, 1999. [Google Scholar]
- Lowel DC-Powered 100 W I-Light. Available online: http://www.s-pro.tv/upload/iblock/Loweli_idLightWeb_05_10_i.pdf (accessed on 5 April 2022).
- May, C. (Ed.) NEFDS Instrumentation Guide for Use with NEFDS 17.1 Report for NEFDS 17.1 Documentation; Cortana Corporation: Falls Church, VA, USA, September 2016; p. 36. [Google Scholar]
- Landis, B.; Aber, J.S. Low-cost field goniometer for multiangular reflectance measurements. Emporia State Res. Stud. 2007, 44, 1–6. Available online: https://dspacep01.emporia.edu/bitstream/handle/123456789/383/202.pdf (accessed on 6 September 2022).
- Biliouris, D.; Verstraeten, W.W.; Dutré, P.; van Aardt, J.A.N.; Muys, B.; Coppin, P. A Compact Laboratory Spectro-Goniometer (CLabSpeG) to Assess the BRDF of Materials. Presentation, Calibration, and Implementation on Fagus sylvatica L. Leaves. Sensors 2007, 7, 1846–1870. [Google Scholar] [CrossRef] [PubMed]
- Harms, J.D.; Bachmann, C.M.; Ambeau, B.L.; Faulring, J.W.; Ruiz Torres, A.J.; Badura, G.; Myers, E. Fully automated laboratory and field-portable goniometer used for performing accurate and precise multiangular reflectance measurements. J. Appl. Remote Sens. 2017, 11, 046014. [Google Scholar] [CrossRef]
- Schopfer, J.; Dangel, S.; Kneubühler, M.; Itten, K.I. The Improved Dual-view Field Goniometer System FIGOS. Sensors 2008, 8, 5120–5140. [Google Scholar] [CrossRef] [PubMed] [Green Version]
- Bachmann, C.M.; Gray, D.; Abelev, A.; Philpot, W.; Fusina, R.A.; Musser, J.A.; Vermillion, M.; Doctor, K.; White, M.; Georgiev, G. A Field portable Hyperspectral Goniometer for Coastal Characterization. IEEE Geosci. Remote Sens. Symp. 2012. Available online: https://ntrs.nasa.gov/api/citations/20120016989/downloads/20120016989.pdf (accessed on 6 September 2022).
- 80–20, the Industrial Erector Set, Catalog 21. 2018. Available online: www.8020.net (accessed on 30 November 2021).
- Wise, J.E.; Gaines, G.; Gaudet, A.; Gummin, M.A.; Hanser, F.A.; Harris, A.; Hersey, S.; Kjornrattanawanich, B. GOES solar EUV detector calibration at the NSLS. Proc. SPIE 2004, 5549, 123–133. [Google Scholar]
- Marquardt, D.W. An Algorithm for Least-Squares Estimation of Nonlinear Parameters. J. Soc. Ind. Appl. Math. 1963, 11, 431–441. [Google Scholar] [CrossRef]
- Press, W.H.; Teukolsky, S.; Vetterling, W.; Flannery, B.P. Numerical Recipes in C; Cambridge University Press: New York, NY, USA, 1992; pp. 681–688. [Google Scholar]
- Helfenstein, P.; Shepard, M.K. Testing the Hapke photometric model: Improved inversion and the porosity correction. Icarus 2011, 215, 83–100. [Google Scholar] [CrossRef]
- Shepard, M.K.; Helfenstein, P. A laboratory study of the bidirectional reflectance from particulate samples. Icarus 2011, 215, 526–533. [Google Scholar] [CrossRef]
- Henyey, C.; Greenstein, J. Diffuse radiation in the galaxy. Astrophys. J. 1941, 93, 70–83. [Google Scholar] [CrossRef]
- Chandrasekhar, S. Radiative Transfer; Dover: New York, NY, USA, 1960. [Google Scholar]
- Petty, G.W. A First Course in Atmospheric Radiation; Sundog Publishing: Madison, WI, USA, 2006; pp. 347–351. [Google Scholar]
- Wise, J.E.; May, C.; Mars, J.C.; Crowley, J.K.; Haberstroh, R. Hapke Model Implementation for NEFDS Particulate Measurement Program; Report for NEFDS 16.1 Documentation; Cortana Corporation: Falls Church, VA, USA, August 2015. [Google Scholar]
- Brady, N.C.; Weil, R.R. The Nature and Properties of Soils, 12th ed.; Prentice Hall: Hoboken, NJ, USA, 1999; p. 184. [Google Scholar]
- Valentin, C.; Bresson, L.M. Morphology, Genesis and Classification of Surface Crusts in Loamy and Sandy Soils. Geoderma 1992, 55, 225–245. [Google Scholar] [CrossRef]
- NEFDS Version 18.1.41, Material 1551SOLH, DHR, Feature Description for NEFDS 17.0 Release; Cortana Corporation: Falls Church, VA, USA, May 2016.
- Ben-Dor, E.; Goldlshleger, N.; Benyamini, Y.; Agassi, M.; Blumberg, D.G. The Spectral Reflectance of Soil Structural Crusts in 1.2 to 2.5 micrometer Spectral Region. Soil Sci. Am. J. 2003, 67, 289–299. [Google Scholar] [CrossRef]
- Anderson, K.; Kuhn, N.J. Variations in Soil Structure and Reflectance During a Controlled Crusting Experiment. Int. Jour. Rem. Sens. 2008, 29, 3457–3475. [Google Scholar] [CrossRef]
- Stoner, E.R.; Baumgardner, M.F. Characteristic Variations in Reflectance of Surface Soils. Soil Sci. Soc. Am. J. 1981, 45, 1161–1165. [Google Scholar] [CrossRef]
Figure 1.
(a) Equipment setup for laboratory measurements. Portable ASD spectrometer and Lowel halogen photographic light source are mounted on tripods with swing arms. (b) Field measurements using same source and sensor as used in laboratory measurements. Angles are measured by digital protractor mounted on swing arms in both cases.

Figure 2.
Goniometer platform constructed of 80–20 aluminum struts ready for (a) laboratory or (b) field measurements.
Figure 2.
Goniometer platform constructed of 80–20 aluminum struts ready for (a) laboratory or (b) field measurements.

Figure 3.
Laboratory white-referenced BRDF of two beach sands fit with either Hapke’s SHOE model (red) or the surface phase function variant (blue). (a) New Jersey Beach Sand NEFDS designation 1281SOLH, USGS laboratory Field Spec Pro data taken at 45 degrees Source Zenith. (b) New Jersey Beach Sand NEFDS 1282SOLH data taken at 45 degrees Source Zenith. Note the dip in the reflectance at backscatter for the surface phase function model is a result of taking a ratio with Spectralon, which has a slight increase in reflectance at zero phase angle.

Figure 4.
(a) Mountain Pass, CA, alluvial fan site as seen from a few meters distance in late afternoon. Latitude: N 35 degrees 22 min 2.273 s. Longitude W115 degrees 34 min 43.5 s. North is towards the bottom of the figure. The image is of a region approximately 3 m in extent. (b) Nadir view of laboratory recreated soil surface as measured at USGS, illuminated with a strobe light at about the same angle of incidence as the field image, scale in millimeters at bottom of photo. BRDF field measurements were made at about 05:00 UT, 28 September 2017.

Figure 5.
(a) Mountain Pass alluvial sand field and laboratory BRDF relative to Spectralon taken at 30 degrees source Zenith for 544 nm data with best fits using the SPF variant of Hapke’s BRDF model. (b) integrated BRDF over the hemisphere (right) for both field and laboratory measurement for the Mountain Pass site. Measured laboratory DHR is shown to be consistent with the integrated BRDF values obtained from either the field or laboratory data.

Figure 6.
Shown are data taken on Chincoteague Island beach sand: Extracted DHR from laboratory (black), field dunes (green) and field swash zone (red) BRDF data. Laboratory measured DHR (blue) are identical within the measured error with the integrated laboratory BRDF results.
Figure 6.
Shown are data taken on Chincoteague Island beach sand: Extracted DHR from laboratory (black), field dunes (green) and field swash zone (red) BRDF data. Laboratory measured DHR (blue) are identical within the measured error with the integrated laboratory BRDF results.

Publisher’s Note: MDPI stays neutral with regard to jurisdictional claims in published maps and institutional affiliations. |
© 2022 by the authors. Licensee MDPI, Basel, Switzerland. This article is an open access article distributed under the terms and conditions of the Creative Commons Attribution (CC BY) license (https://creativecommons.org/licenses/by/4.0/).
Share and Cite
MDPI and ACS Style
Wise, J.E.; Mars, J.C. Field Reflectance Measurements at Night of Beach and Desert Sands within a Particulate BRDF Model. Remote Sens. 2022, 14, 5020. https://doi.org/10.3390/rs14195020
AMA Style
Wise JE, Mars JC. Field Reflectance Measurements at Night of Beach and Desert Sands within a Particulate BRDF Model. Remote Sensing. 2022; 14(19):5020. https://doi.org/10.3390/rs14195020
Chicago/Turabian StyleWise, John E., and John C. Mars. 2022. "Field Reflectance Measurements at Night of Beach and Desert Sands within a Particulate BRDF Model" Remote Sensing 14, no. 19: 5020. https://doi.org/10.3390/rs14195020
Note that from the first issue of 2016, this journal uses article numbers instead of page numbers. See further details here.