
Controls on Alpine Lake Dynamics, Tien Shan, Central Asia

1
School of Geographical Sciences, Shanxi Normal University, Taiyuan 030031, China
2
State Key Laboratory of Desert and Oasis Ecology, Xinjiang Institute of Ecology and Geography, Chinese Academy of Sciences, Urumqi 830011, China
3
Research Center of Ecology and Environment in the Middle Reaches of the Yellow River, Shanxi Normal University, Taiyuan 030031, China
4
School of Public Administration, Shanxi University of Finance and Economics, Taiyuan 030006, China
*
Author to whom correspondence should be addressed.
Remote Sens. 2022, 14(19), 4698; https://doi.org/10.3390/rs14194698
Submission received: 30 July 2022
/
Revised: 12 September 2022
/
Accepted: 16 September 2022
/
Published: 20 September 2022
(This article belongs to the Special Issue Remote Sensing in Natural Resource and Water Environment)
Abstract
:The number and area of alpine lakes in Tien Shan (TS) are rapidly growing in response to a warming climate and retreating glaciers. This paper presents a comparative analysis of lake classification and changes by dividing alpine lakes (within a 10 km buffer of the glacier margins) into four types (supraglacial lakes, proglacial lakes, extraglacial lakes and non-glacial lakes), and subsequently determining the driving forces of change across the TS region from 1990 to 2015. The analysis utilized multiple satellite images and climatic data from gridded data sets and meteorological station observations. The results indicate that the total number and area of glacial lakes continuously increased during the study period, whereas non-glacial lakes intermittently expanded. Specifically, the total number and area of all glacial lakes (supraglacial lakes, proglacial lakes and extraglacial lakes) increased by 45.45% and 27.08%, respectively. Non-glacial lakes, in contrast, increased in quantity and area by 23.92% and 19.01%, respectively. Alpine lakes are closer to glaciers at high altitudes; in fact, some (e.g., proglacial lakes) are connected to glacier termini, and these show the highest expansion speed during the study period. The area of proglacial lakes expanded by 60.32%. Extraglacial lakes expanded by 21.06%. Supraglacial lakes, in marked contrast to the other types, decreased in area by 3.74%. Widespread rises in temperature and glacier wastage were the primary cause of the steady expansion of glacial lakes, particularly those linked to small- and medium-sized glaciers distributed in the Eastern TS where glacial lakes have rapidly increased. Both proglacial and extraglacial lakes expanded by 6.47%/a and 2%/a, respectively, from 1990 to 2015. While these proglacial and extraglacial lakes are located in largely glacierized areas, lakes in the Central TS exhibited the slowest expansion, increasing in area by 1.44%/a and 0.74%/a, respectively. Alterations in non-glacial lake areas were driven by changes in precipitation and varied spatially over the region. This study has substantial implications for the state of water resources under the complex regional changes in climate in the TS and can be used to develop useful water-resource management and planning strategies throughout Central Asia.
1. Introduction
Alpine glacial lakes (i.e., lakes in mountains, glacial terrains that are predominatly supplied by glacier meltwater) form a crucial part of the cryosphere and play an important role in climate change and cryosphere research [1]. These lakes also provide a critical reservoir for water resources in mountain regions prone to vanishing mountain glaciation [2]. Changes in the number or area of glacial lakes can therefore be considered a direct reflection of changes in the cryosphere, and are indicators of environmental change [3,4].
Ongoing global warming is affecting numerous processes within the cryosphere, including the accelerated melting of glaciers, snow, and river ice, causing a substantial increase in meltwater from mountainous regions around the world [5,6,7,8]. Global warming, howerver, is inducing different spatial patterns of changes in glacial lakes, especially in arid zones [1,9]. The instability in alpine glacial lakes may eventually influence hydrological cycles in mountain regions, or they may cause or aggravate sudden hazards and risks of glacial lake outburst floods in downstream areas [10,11,12].
Under global warming, glacial lakes in mountainous regions in the high mountains of Asia (HMA) have exhibited obvious changes. For example, since the 1970s, the glacial lake area on Tanggula Mountain, located in the central part of the Qinghai-Tibet Plateau, has expanded by about 28.9% [9]. In addition, Qiao and Zhu [4] found that the increased water from glacial lakes accounted for about 84% of the total volume of lake growth in the Tibetan Plateau between 1990 and 2013. From 1990 to 2009, the number of glacial lakes in the eastern part of the Hindu Kush–Himalaya mountain range increased by about 20–65% [13], and within the Poiqu River basin, Central Himalayas, the total glacial lake area expanded by ~110% from 1964 to 2017 [10].
Often referred to as the “water tower of Central Asia”, a positive trend in both glacial lake numbers and area has been shown in the TS since 1990 [1,14]. For example, since 1968, glacial lakes in the headwaters of the Amu Darya River basin have expanded more and at a higher rate than other types of lakes [14]; during the period 1990–2015, glacial lakes contributed 69% of the total increase in the number of alpine lakes in the upper reaches of the Syr Darya River basin [1]. Similarly, between 2002 and 2014, the total number and area of glacial lakes in the Djungarskiy Alatau region increased by about 37 (6.2%) and ~18 km2, respectively [15]. Glacial lakes in the northern part of the Tarim River basin, near the TS region, expanded by about 32.9% between 1990 and 2015 [16].
Previous studies have shown that the changes in alpine glacial lakes are not only influenced by temperature, but also by precipitation and evaporation [9,17]. Song et al. [17] indicated that since 2000, the expansion of lakes in the Qinghai-Tibet Plateau may be due to increases in precipitation and decreases in evaporation in the central part of the plateau. Although precipitation accounts for ~60% of the total lake supply, with glacier meltwater contributing ~10%, the increase in glacier meltwater contributed ~50.6% to the total change in lake water volume. Lei et al. [18] asserted that increased precipitation and decreased evaporation are the main factors leading to the rapid growth of lakes in the central part of the Qinghai-Tibet Plateau, and that these trends contributed about 70% to the lakes’ total water storage increase. Petrov et al. [19] found that the recent increases in temperatures were the main reason for an increase in both glacial lake numbers and area in Uzbekistan. In turn, glacial lake expansion maybe be inversely related to glacier mass loss in high-altitude mountains [20].
Glacial lakes in the TS are not significantly affected by human activities, mainly because of their relative isolation. While the main driving forces underlying changes in the TS glacial lakes are still open for debate, possible causes include changes in temperature, precipitation, glacier meltwater supply, and regional topographic conditions.
In order to comprehensively examine the factors controlling the spatio-temporal changes in alpine lakes across the entire TS region since 1990, we integrated remote sensing data from several available satellite images with data pertaining to known factors that influence lake number and size, such as temperature, precipitation, glacier melting and regional terrain conditions. The aim of this study is to create a detailed inventory of glaciers and alpine lakes of different types, and in addition, it further aims to identify the driving factors contributing to the different types of alpine lake changes and their impacts on water resources in the TS region. The identification of these factors lays the groundwork needed to support water security in the core area of the Silk Road Economic Belt.
2. Study Area
The TS region forms the largest mountain system in Central Asia and is situated deep within the Eurasian hinterland, located farther from the ocean than any other mountain system in the world (Figure 1a). The area is situated at 39°–46° N and 69°–95° E. It measures about 2500 km from west to east and 250–350 km from south to north, making it one of the largest mountain systems in Asia. Geographically, the TS region, which includes Xinjiang Province in China as well as Kazakhstan, Kyrgyzstan and Uzbekistan, can be divided into the four distinct areas referred to as the Eastern, Northern, Central and Western TS (Figure 1d).
Based on their geographical positioning, the Eastern TS stretches from the eastern part of Hami City to the west of Fukang City and across the Harlik Mountains, Barkol Mountains and Bogda Mountains. The average elevation of the Eastern TS is 1624 m a.s.l., with the highest peak being Bogda Peak (5445 m a.s.l.), known in China as Bogada Feng. The Northern TS ranges from the eastern region of Yuergou, Turpan, in Xinjiang, crosses the western part of Zhetysu Alatau in Kazakhstan and has an average elevation of about 2521 m a.s.l. The Central TS starts in Gangou, Turpan, in Xinjaing, crossing the eastern part of the Hantengri and Artbash Mountains and the southern mountains of Issyk-Kul Lake to the west of the Fergana range in Kyrgyzstan. It possesses the highest mountains in the four TS regions with an average elevation of 2574 m a.s.l. Notable peaks include Tomor Peak (7443 m a.s.l.). Western TS covers the largest portion of the TS region, extending from northeastern Issyk-Kul Lake westward to the Kashkadarya and Surkhandarya regions of Uzbekistan; it has an average elevation of 2570 m a.s.l. (Table 1).
The TS regions are characterized by extensive glaciers and amount of snow. However, there are significant spatial differences in the distribution of glaciers (Figure 1d). The glaciers mainly distributed in the Central TS account for 57% of the entire TS region, with the largest glacierized proportional area of 4.01%, followed by the Northern TS, covering a total glacier area of 2.81%. The Western TS has a glacier coverage area of 1.46%, while the Eastern TS has coverage of only about 0.33%.
From the perspective of climate characteristics across the TS region (Figure 1e), precipitation in the Eastern, Northern and Central TS mainly occurs in summer under the influence of the moist Atlantic westerly air stream. However, the Eastern TS receives little air flow, mainly because the westerly current from the ocean is blocked by large parts of the TS. As a consequence, the Eastern TS is the driest with an annual average temperature and precipitation of 5.43 °C and 142 mm, respectively. In contrast, the lowest temperatures occur in the Northern TS, where the annual average temperature is −0.71 °C. The Northern TS is mainly affected by high pressure from Siberia and has an average annual precipitation of 289 mm. The Central TS encompasses the largest part of the TS; its average annual temperature is about 0.82 °C, whereas the annual average precipitation is 242 mm. In the Western TS, precipitation mainly occurs in the winter and spring seasons. Summer is typically the driest time of the year. Annual average precipitation in the Western TS is around 468 mm, making it the wettest area in the entire TS region. The annual average temperature of the Western TS is about 1.38 °C.
3. Dataset and Material
3.1. Dataset
3.1.1. Satellite Data
In this study, we used Landsat Thematic Mapper (TM)/Enhanced Thematic Mapper Plus (ETM+)/Operational Land Imager (OLI) sensor data from 1990, 2000, 2010 and 2015 as our main sources in order to obtain lake and glacier information across the TS. These images were downloaded from the United States Geological Survey (USGS) website (http://www.usgs.gov accessed on 10 November 2016). To maximize the elimination of potential uncertainty caused by seasonal snow cover and clouds in glacial lake boundary delineation, the highest quality scenes from July to October were chosen, accounting for about 95% of the total selected scenes. Due to the limitations caused by the available number and the poor quality of images in some regions, glacial lake extraction for some time frames (e.g., 1990) was replaced by images over a 1- to 3-year time frame. In addition, imagery from WorldView-2 (resolution ~0.5 m) [19], Google Earth and Bing map [21,22,23], which provide higher-resolution images (resolution ~1.65 to 2.62 m for GeoEye, SPOT-5 and QuickBird images [19,23,24,25]), were also employed as auxiliary datasets for lake identification in the study. These images provided higher resolution topographic data for lake basin delineation and area extraction for the years of 1990–2015. In addition, the Advanced Spaceborne Thermal Emission and Reflection Radiometer (ASTER Level 1T) scenes (resolution of 15 m) from the years 2000 and 2015 were used to estimate the accuracy of lake boundaries during our study. The ASTER images could not provide a longer period or larger extent for lake extraction for the TS region, but they provided higher resolution. Herein, all the ASTER scenes were acquired with the highest quality data under cloud-free conditions and for the ablation period when the extent of snow coverage was minimal. The ASTER data are available for distribution through the USGS Global Visualization Viewer (GloVis, https://earthexplorer.usgs.gov/ accessed on 1 November 2020).
In this study, the altitudes of glaciers and lakes in the TS were developed from the Shuttle Radar Topography Mission (SRTM1) Arc-Second digital elevation model (DEM). Compared to the 3 arcsec DEM, the SRTM1 arcsec DEM has a higher spatial resolution of 30 m, and it was accessed from the USGS website (https://earthexplorer.usgs.gov/ accessed on 26 December 2018). Terrestrial water storage (TWS) in the TS was analyzed using GRACE data. The GRACE dataset in this study was obtained from the Jet Propulsion Laboratory of the California Institute of Technology (https://grace.jpl.nasa.gov/data/get-data/jpl_global_mascons/ accessed on 10 December 2019). The data possesses a resolution of 0.5° covering a period ranging from April 2002 to February 2016. Missing monthly data were interpolated by adopting the multiyear cumulative averages of the missing and adjacent months.
3.1.2. Glacier and Lake Data
The first Chinese glacier catalogues from the 1960s and 1970s were used in this study. The catalogues were created by the Cold and Arid Regions Science Data Center (http://westdc.westgis.ac.cn accessed on 12 Auguest 2018). In addition, the glacier outlines for the entire TS region were developed using the latest RGI 6.0 glacier catalogue (obtained from the website: http://www.glims.org/RGI/randolph60.html accessed on 1 Auguest 2017). The inventory was performed in the period from the 1990s to 2010s (mainly during in the 2010s for the TS) and was used to extract glacial lakes within a 10 km buffer of the glacier margins. In addition, two long-term records (of more than 35 years) of glaciers in the TS were used. Tuyuksuyskiy glacier (Western TS) and Urumqi glacier No. 1 (Northern TS) were adopted in this study in order to detect the glacier mass balance (GMB) changes across the TS region. Further information on the changes in mean annual glacier mass and the equilibrium line altitude (ELA) from 1980 to 2015 were obtained from the World Monitoring Service (WGMS, https://wgms.ch/ accessed on 5 June 2019). These two glaciers have similar characteristics. Tuyuksuyskiy glacier has a mean area of 2.3 km2 and is positioned at an elevation between 3743 and 4267 m, whereas Urumqi glacier No. 1 has a mean area of 1.84 km2 and between 3752 and 4225 m.
Alpine lake data for 1990 for parts of the Western TS were adopted from the glacial lake inventory of HMA [24,26]. This inventory used a manual visual visually based method to interpret and extract glacial lake boundaries within a 10 km buffer of glacier termini using ArcGIS and ENVI software, normalized difference water index maps, and Google Earth images. These lakes range in size from of 0.0054–6.46 km2; the average relative error was ±13.8 in 1990. The glacial lake information for 2015 in China was obtained from a dataset of glacial lake inventory of West China (http://csdata.org/p/207/ accessed on 5 June 2019). This dataset, which features the Tibetan Plateau as its core, covers an area between 26°–55°N and 65°–105°E, and includes the Himalayas, Hengduan, and TS mountains, the Tibetan Plateau, and other regions. The error in glacial lake area in the dataset is about ±13.0% of the total glacial lake area in western China [25].
3.1.3. Climate Data
Monthly climate data between 1990 and 2015 from 34 national meteorological stations in and around the TS in China were obtained from the meteorological science data-sharing service network (http://data.cma.cn/ accessed on 5 June 2019). For meteorological stations outside China, data from 43 other meteorological stations in Central Asia were screened. Screening criteria included the period of monthly temperature and precipitation data collected between 1990 and 2015.
The Global Precipitation Climatology Centre (GPCC) offers global precipitation analyses for monitoring and research of the Earth’s climate from 1891 to 2016. These analyses are based on quality-controlled data from all stations in the GPCC’s database; it includes more than 79,000 stations spread across the global land surface. This product has been optimized to provide the best spatial coverage and use in water budget studies. The current study used monthly precipitation data from the GPCC monthly precipitation product V.2018 (V8) for the period 1990–2015; the data were downloaded from the website (https://www.dwd.de/EN/ourservices/gpcc/gpcc.html accessed on 1 June 2020). Compared to other products [13,26,27], it has higher accuracy with its spatial resolution of 0.25° latitude/longitude and has been shown to perform better with regard to describing actual amounts of precipitation in mountainous regions within an area of complex topography [10,28].
In addition, we used the monthly gridded land surface temperature (2 m temperature) data for the period 1990–2015 from the fifth generation of global climate datasets released by the European Center for Medium-Range Weather Forecasts (https://cds.climate.copernicus.eu/cdsapp#!/home accessed on 10 Octomber 2020). The ERA-5 land dataset is a replay of the land component of the ERA-5 climate reanalysis but with a series of improvements making it more accurate for all types of land applications. In particular, ERA5-Land runs at enhanced resolution (on a regular latitude/longitude of 0.1° × 0.1°). Compared to other gridded datasets, ERA-5 exhibits higher spatial resolution and more effectively reflects the spatio-temporal distribution of air temperature in the TSM region. It also provides the highest consistent trends in annual and monthly temperature; specifically, R2 values approach about 0.50–0.85. The ERA-5 dataset has therefore been widely used in high-altitude mountains with complex topography because of the scarcity of meteorological stations in these regions [29]. Linear regression and Mann–Kendall trend tests were applied to confirm the trends in climatic variables and test the statistical confidence or significance level, respectively.
3.2. Methods
3.2.1. Lake Extraction
Widely adopted methods for lake extraction include automatic water body information extraction and manual vectorization. Considering different perspectives from delineating glacial lakes [24,30,31], as well as their complicated climatic and topographic conditions, many studies used distances of 2, 3, 5 or 10 km from the glacier terminus or the nearest glacier boundaries [19,31,32,33]. Moreover, they used a distance of 10 km from the mother glacier termini as a reasonable guide and threshold suitable for the delineation of glacial lake boundaries in the Third Pole region [31]. Therefore, during this study, alpine lake surface areas within a 10 km buffer of the maximum glacier margin during the 1990–2015 period were extracted using an automatic water body information extraction method. The procedures for lake extraction are shown in Figure 2. This was accomplished mainly by applying the normalized water body index (NDWI: Normalized Difference Water Index) and visual inspection with manual improvement. The automated lake extraction process can be mathematically defined as:
where Bgreen and BNIR are the green band and NIR band of the Landsat imagery, respectively. It is inappropriate to identify lake bodies by adopting a static threshold across the entire TS; thus, the appropriate thresholds were used to distinguish water and non-water information based on the calculated NDWI of different imagery [34].
There were two instances of misjudgment for the NDWI: (1) water was miss-defined as non-water, and (2) non-water features (e.g., glacier, snow and clouds) were incorrectly defined as water bodies. These problems resulted from the fact that water bodies appeared similar to mountain shadows in the NDWI images. The shadows not only influence the accuracy of lake mapping but also make it difficult to identify lake areas [35]. However, mountain shadows have higher slopes than lakes, which can be detected geomorphologically. Thus, the water and non-water bodies were distinguished by comparing the slopes of the SRTM1 DEM and NDWI thresholds, after which the glacial lakes with slopes < 5° were extracted. In the case of clouds, particularly within the higher areas, we manually defined the glacial lakes when clouds existed in the upper sky from the combined Landsat images. We also checked if these lake basins existed in higher-resolution World-View 2 and Google Earth imagery. Additionally, for regions where the glacial lakes or glaciers were covered by snow and clouds, we adopted images between 1–3 years outside of the aforementioned period to fill the image gap.
Due to the limitations in automatic lake extraction (especially for ice and ice-water), manual checks were required to identify errors in glacial lake extraction in each image. For alpine lakes outside of China’s portion of the TS in 2015, the lake information was extracted from a dataset of global surface water [36], then the lake information from this dataset was checked and improved by manual delineation using the Landsat and WorldView-2 imagery. In addition to the water area dataset, we also combined false color composites of bands 3, 5 and 7 (or bands 4, 6 and 7) for visual inspection of the Landsat TM/ETM+/OLI images. We then extracted, checked and revised the lake data. Considering the different methods of glacial lake extraction used by different scholars [1,24] for the Landsat imagery, lakes > 0.0054 km2 (which is approximately six full lake water body pixels for the Landsat TM scenes) can greatly reduce the extraction errors. Compared to other higher-resolution satellite images in order to extract alpine lake boundaries, the minimum mapping area of 0.0054 km2 for estimation using the Landsat TM (with a spatial resolution of 30 m) was considered the minimum area of glacial lake extraction in the TS.
The uncertainty in lake area largely depends on the image’s spatial resolution and co-registration errors [37]. As the selected Landsat TM/ETM+/OLI images were processed using standard terrain correction (Level 1T), and, in this study, lake comparisons were not conducted pixel by pixel but rather entity by entity, we assumed that co-registration errors did not have a significant impact on lake area measurements [13,19]. In recent research [1,19], the buffer method has been used to estimate uncertainties. In this study, we considered the maximum error to be a buffer size of half a pixel for the lake area. A pixel is 15 m for the Landsat TM/ETM/OLI scenes and 0.25 m for the WorldView-2 imagery. Here, we adopted the method of Hanshaw and Bookhagen [38] for estimating lake uncertainties, which assumes that the uncertainty in lake area from manual identification has a Gaussian distribution. As pixels composed entirely of lake water are usually surrounded by mixed pixels, the uncertainty caused by the spatial resolution of the Landsat imagery was estimated with an error of ±0.5 pixels for lake boundaries. This number was then multiplied by half the area of a single pixel, assuming that the uncertainty for each pixel is half a pixel, as follows:
where p is the lake perimeter (m), g is the spatial resolution of the Landsat imagery (m), 0.6872 is the revised coefficient (~69% of peripheral pixels are subjected to errors), ERR is the relative error of the total lake area (%), Ei is the area (km2) of the lake (i), and A is the total area of the glacial lakes (km2).
Overall, the maximum uncertainty in TS lake area was 14.38% for 1990, 14.99% for 2000, 15.03% for 2010 and 15.89% for 2015. To check the accuracy of the extracted lake boundaries, the alpine lakes for the Eastern TS in 2000 and 2015 were extracted using the high-quality ASTER images. The results are consistent with the former lake areas but provide more spatial and temporal information regarding the lake boundaries. The repeated mapping of a sample of glacial lakes in Eastern TS showed that the error of the total alpine lake area was 5.64% in 2000 and 7.6% in 2015. For the smaller alpine lakes, which dominated the TS, the mapping of lake areas smaller than 0.1 km2 possessed an error of estimation for the total area of about 12.47% (2000) and 10.86% (2015).
3.2.2. Identifying Different Lake Types
Many different types of alpine lakes (mainly glacial lakes) occur in the TS. These different lake types do not develop and respond to climate change in the same way, which makes it difficult to monitor the continuous replenishment of the lakes by glacier meltwater or precipitation from the upstream areas. As a result, differences in alpine lake types may cause large errors in the results. Therefore, in order to accurately analyze the factors of glacial lake expansion in the TS and to intuitively monitor the main driving factors, four types of alpine lakes including glacial lakes (supraglacial lakes, proglacial lakes and extraglacial lakes) and non-glacial lakes were defined and identified in the TS region in detail (Figure 3). Lake types and the characteristics of glacial lakes in the TS were based on previous literature on the area, while their mapping was based on a combination of high-resolution WorldView-2, Google Earth and Landsat TM/ETM+/OLI imagery. The resolution of the DEM data was 30 m.
In this study, supraglacial lakes were usually small and occurred on the glacier surface where they were dammed by ice. They mainly appear at the termini of valley glaciers that are characterized by large-scale areas and lengths (Figure 3c,d). Proglacial lakes are directly controlled by the advance or retreat of glaciers. Thus, these glaciers (e.g., those found in cirques and hanging valleys) are of small to medium size and show evidence of rapid retreat in response to a warming climate (Figure 3c,e,f). In addition, extraglacial lakes are positioned in front of the glacier termini without a direct connection to the glacier termini. However, they are directly fed by glacier meltwater, particularly when associated with valley glaciers. Many extraglacial lakes occur several meters to kilometers in front of the glacier termini (Figure 3c,g). We defined non-glacial lakes as lakes that could not receive glacier meltwater, and no streams occurred between the non-glacial lakes and the upper upstream glacier (Figure 3c,h).
4. Results
4.1. Spatial Patterns in Lake Distribution in the TS
In total, there were 2421 alpine lakes in 2015, covering a total area of 129.75 km2 in the TS. These alpine lakes were quite small; the mean single lake area was 0.05 km2. Of the total, 2213 glacial lakes were <0.1 km2 in area, accounting for 91.41%. Their total area was 46.07 km2. Only 11 alpine lakes were >1 km2. Of these, 9 were located in the Central TS, 1 in the Western TS, and 1 in the Northern TS. The maximum altitude of the glacial lakes appears in the Central TS at an altitude of 4,281 m.
The distribution of alpine lakes in the TS closely is related to glacier area (Figure S1). Overall, the mean glacier terminal (at about 3938 m) was highest in Central TS, where numerous higher-elevation (3611 m) alpine lakes had developed, followed by Western and Eastern TS. The Northern TS had the lowest glacier termini, with an average elevation of 3696 m, whereas the alpine lakes in the Northern TS also had the lowest elevation (at an average altitude of 3348 m) (Figure 4; Table 1). Among these different alpine lake types across the entire TS in 2015 (Table 2), there were 52 supraglacial lakes, 399 proglacial lakes, 1597 extraglacial lakes and 373 non-glacial lakes.
4.2. Spatiotemporal Changes in Alpine Lakes in the TS
Since 1990, alpine lakes in the TS have increased significantly. Between 1990 and 2015, the total number of alpine lakes increased by 712 (a 41.66% increase), whereas the lake area expanded by about 26.73 km2 (25.95%) at rates of 1.67%/a and 1.04%/a, respectively, in the lake number and area (Table S1). These glacial lakes increased in number and area by 45.45% and 27.08%, respectively. Non-glacial lakes exhibited a slower increase, with the total lake number and area increasing by 23.92% and 19.01%, respectively.
4.2.1. Temporal Changes in Alpine Lake in the TS
Also noteworthy is the fact that the total number and area of glacial lakes continuously increased during the study period, whereas non-glacial lakes intermittently expanded. From 1990 to 2000, the total glacial lake area expanded by 0.65 km2/a, whereas from 2000 to 2010, it jumped to 1.09 km2/a. From 2010 to 2015, the rate jumped even higher, to approximately 1.33 km2/a. Meanwhile, we found that non-glacial lakes did not exhibit these steady expansion trends. The total non-glacial lake area expanded by 0.92 km2 during 1990–2000 in contrast to a slower expansion during 2000–2010 (a 0.77 km2 increase) and a greater area expansion by 1.06 km2 from 2000 to 2015.
The change rates for the various alpine lake types are shown in Figure 5. Both the number and area of proglacial lakes from 1990 to 2015 exhibited the highest increase with rates of 4.40%/a and 2.41%/a, respectively. Increases in extraglacial lakes and non-glacial lakes followed. In the case of extraglacial lakes, their rates of increase in number and area were 1.48%/a and 0.84%/a between 1990 and 2015, respectively. The increase in extraglacial lakes was higher than those for non-glacial lakes, increasing at rates of 0.96%/a and 0.76%/a in 1990 and 2015. It is noteworthy that both the number and area of supraglacial lakes decreased at rates of −0.08%/a and −0.15%/a, respectively.
4.2.2. Spatial Changes in Alpine Lakes in the TS
Obvious geographically heterogeneous changes occurred in the number and area of different alpine lake types from 1990–2015 (Figure 6). For example, Central TS showed a substantial increase in number and area between 1990 and 2015. Specifically, the number of glacial lakes increased by 217, and the total area expanded by about 10.27 km2. Lakes in the Northern and Western TS followed. The total number and area of glacial lakes increased by 192 (7.09 km2) and 194 (6.70 km2), respectively. In the Eastern TS, there was an increase in number and area of 39 and 1.44 km2. Regarding the spatial expansion rates of glacial lakes during the study period, lakes in the Eastern and Northern TS showed the most significant expansions of 2.44%/a and 1.65%/a, respectively. Glacial lakes in the Western TS expanded at a rate of 0.98%/a, while those in the Central TS showed the slowest expansion (0.87%/a).
Nearly all the supraglacial lakes in the TS are distributed in the Central TS. No continuous positive trends in the number or area of these supraglacial lakes were found from 1990 to 2015 (Figure 6a). For proglacial and extraglacial lakes, both exhibited increases in area, especially the proglacial lakes in the Eastern, Northern and Western TS. They also exhibited higher expansion rates of 6.47%/a, 3.49%/a and 5.51%/a, respectively, which are obviously higher than the rates (2%/a, 1.29%/a and 0.53%/a) associated with extraglacial lakes (Figure 6b,c). In the Central TS, the expansion rate of proglacial lakes was about two times higher than that of the extraglacial lakes. All non-glacial lakes (Figure 6d) showed a relatively slow expansion rate in comparison to the other glacial lakes, with rates of 1.75%/a (Eastern TS), 1.03%/a (Northern TS), 0.73%/a (Central TS) and 0.62%/a (Western TS).
4.3. Variations in New and Extinct Glacial Lakes in the TS
As shown in Figure 7a, from 1990 to 2000, the number of newly emerged alpine lakes was 381, whereas the total area increased by 8.45 km2. These glacial lakes experienced a 92.39% and 93.15% increase in number and area, respectively (Table 3). Glacial lakes in Western TS showed the highest numerical increase and area expansion, accounting for 46.18% and 37.01% of the total of new glacial lakes, respectively.
Between 2000 and 2010, the number of new lakes in the TS increased by 325, and the area expanded by 8.34 km2. The increase in the number and area in the Central TS accounted for 50.15% and 58.61%, respectively, of the total in the TS. From 2010 to 2015, 359 new glacial lakes covering a total area of 6.82 km2 were discovered, and the new glacial lakes in the Central TS contributed 43.18% and 47.60% of the total number and area increase in the TS, respectively.
It is worth noting, however, that many alpine lakes have disappeared (Figure 7b,d,f). For example, from 1990 to 2000, a total of 102 alpine lakes (14 non-glacial lakes and 88 glacial lakes) disappeared in the TS. The total loss in area was about 1.66 km2. From 2000 to 2010, 124 alpine lakes (6 non-glacial lakes and 118 glacial lakes) disappeared, accounting for a total area loss of 1.54 km2. Then, from 2010 to 2015, 193 alpine lakes (14 non-glacial lakes and 179 glacial lakes) disappeared, and the lake area decreased by 3.97 km2.
Overall, we found that the disappearance of glacial lakes in the TS were mainly concentrated in the Central or Western TS. For example, from 1990 to 2000, the number and area of lake loss in the Central TS accounted for 69.32% and 72.5%, respectively. From 2000 to 2010, the proportion of extinct (lost) glacial lakes in the Central TS accounted for 45.76% (number) and 44.28% (area) of the total loss, respectively, which is higher than in the Western TS where the proportion of extinct glacial lakes accounted for 40.98% (number) and 37.02% (area) of the total loss. Between 2010 and 2015, the number and area of the lost lakes accounted for 41.90% and 50.84% (Central TS) and 37.43% and 37.61% (Western TS) of the total lost glacial lakes, respectively.
5. Discussion
Glacial lakes (supraglacial lakes, proglacial lakes and extraglacial lakes) form 91.41% of the total alpine lakes in the TS and are therefore the dominant lake type. Glacial lake changes are driven by numerous factors, including changes in temperature, precipitation, evaporation and glacier meltwater in the upper portions of the mountains, in addition to topographic conditions.
5.1. Driving Factors of Lake Change: Glacial Influences
Glaciers in the TS are rapidly shrinking and exhibit a negative mass balance [39,40]. About 97.52% of the glaciers in the region have shrunk [26] resulting in a total decrease in glacier area and mass of about 18 ± 6% and 27 ± 15%, respectively [41]. The decreases are expected to continue [40,42,43], especially for medium- and small-sized glaciers located at lower altitudes [44]. Sorg et al. [45] found that glaciers with large glacierized areas in the inner TS exhibited a slower shrinkage rate than in the outer ranges. Pieczonka and Bolch [46] concluded that glacier changes in the Central TS are predominantly thinning and possess lower shrinkage rates than in the other outer TS regions. In addition, the termini of larger-sized glaciers are often debris-mantled, making them less vulnerable to a warming climate [47]. For example, glaciers in the Eastern TS are mostly of small and medium size, with a mean glacier area of 0.48 km2, and have a lower terminal altitude than those in the Western and Central TS (Figure S2; Table 1), which makes them more sensitive to climate change. Based on the two utilized glacier catalogues, the total number and area of glaciers in the Eastern TS decreased by about 20.65% and 45.22% from the 1960s/1970s to the 2010s, respectively.
Spatially, glaciers in the Eastern TS have experienced the most recession, with shrinkage of around −0.85%/a during 1990–2015 (Figure 8b, Table S2); in response, glacial lakes expanded by 2.44%/a. In the Northern TS, glacier area decreased by −0.64%/a. In that region, glaciers exhibit lower termini and median altitudes (the terminal and median altitudes were 3696 and 3895 m, respectively), making them more sensitive to climate change; in response, the total glacial lake area expanded by 1.65%/a. In the Western TS, the total glacier area decreased at a slower rate of about −0.46%/a, and total glacial lake area increase by 0.98%/a. The Central TS exhibited a relatively slow rate of glacier shrinkage (about −0.41%/a), even though the glaciers in those mountains are relatively large (mean glacier area was 1.11 km2 during 2015, which is about twice as large as those in the Northern and Western TS) and are located at higher elevations. In response, the total glacial lake area expanded by 0.87%/a. The slower retreat and shrinkage may explain why the expansion rate of the glacial lakes in the Central TS was slower than in other TS areas.
Changes in glacial lake areas were closely related to glacier shrinkage. For example, in the Eastern TS, the glacier area decreased by 1.06%/a from 1990 to 2000, and exhibited more rapid glacial lake expansion (4.35%/a) than the glaciers possessing a slower shrinkage rate of 1.06%/a, where lakes expanded by 0.81%/a. In contrast, the glaciers in the Northern TS were characterized by a continuous decreasing rate, and the total glacier area decreased at a rate of −0.60%/a between 1990 and 2000 and then decreased at a rate of −0.71%/a post-2000. In response to the rapid glacier shrinkage, the total glacial lake areas expanded from 1.38%/a during the 1990–2000 period to 1.61%/a between 2000 and 2015. Overall, spatial changes in glaciers and glacial lakes demonstrate that regions in the TS with rapidly shrinking glaciers have contributed to the expansion of glacial lakes, particularly in mountains with medium- to small-sized glaciers (Figure 8c).
GMB is considered an indicator of climate change and can directly drive hydrological processes [48]. An analysis of the records [49,50,51,52,53] of glacier mass balance in the TS over past decades shows that, in general, glaciers in the Eastern and Northern TS exhibited greater mass loss. Before the 2000s, the annual average GMB was −405 mm/a, which was higher in the Bogeda Mountains (about −445 mm). In the Northern TS, the annual average GMB was −337.66 mm before 2000 and −642.18 mm since 2000. The glacier mass loss post-2000 averaged −323.44 mm and was lower than the GMB of −419 mm before 2000.
Two typical glaciers’ (with a similar scale and elevation range) long-term monitoring records (the Ts. Tuyuksuyskiy glacier in the Western TS and Urumqi glacier No. 1 in the Northern TS) were analyzed (Figure 9). For both, the average annual and cumulative GMB was negative from 1980 to 2015; the cumulative GMB was 18,073 mm and 17,102 mm for the Tuyuksuyskiy glacier and Urumqi glacier No. 1, respectively. Compared to the Western TS, the GMB in Northern TS had the greatest loss. The annual average GMB change of Urumqi glacier No. 1 was about −15.70 mm/a, which was notably higher than that of the Western TS (which had a loss rate of −0.26 mm/a). The annual equilibrium-line altitude (ELA) of the Tuyuksuyskiy glacier rose by 0.30 m/a and possessed a change rate that was notably lower than that of Urumqi glacier No. 1, which changed at a rate of 13.16 m/a. For the Tuyuksuyskiy glacier, the annual average GMB was −486.64 mm between 1990 and 2000 and slowed to −463.31mm post-2000. The annual average GMB of Urumqi glacier No. 1 was −362.55 mm between 1990 and 2000, which increased to −652.25 mm during the 2000–2015 period.
Glacier meltwater is an important water supply for glacier lakes and mountain water balance. In recent years, the accelerated shrinkage of glaciers and their resulting mass loss have been the main water resources for the expansion of the glacial lakes [54,55]. Since 2002, the total water storage in the TS has continuously declined at a rate of −9.98 mm/a (Figure 10). Regions characterized by higher losses in glacier area also experienced significant water storage loss. For example, the glacier area in the Central TS exhibited the largest decrease during the 1990–2015 period, shrinking by about 805.08 km2. This equates to about 46.27% of the TS glacier area. Water storage losses in the Western TS measured −14.89 mm/a. In the Northern TS, glacier area decreased by 456.43 km2, and the water storage loss measured −11.75 mm/a. It is worth noting that minor glacier shrinkage is often accompanied by minor storage loss, as occurred in the Western TS where glacier area and water storage decreased by only 374.16 km2 and −5.94 mm/a, respectively. In the Eastern TS, temperatures showed the largest rise of all four mountain areas, though water storage showed a slower loss of only −2.58 mm/a, and glacier area only decreased by 73.19 km2. Glaciers in this part of the mountain system are relatively small, making them extremely sensitive to a warming climate. Overall, glaciers in the Eastern TS exhibited the highest reduction, decreasing in area by about 25.88% from 1990 to 2015.
Under a warming climate, proglacial lakes rapidly expanded, and their changes were closely related to the advance and retreat of upvalley mother glaciers. For example, within the Adygine Valley of Northern TS, many new glacial lakes have formed. These lakes have mainly resulted from the retreat of the polythermal glaciers surrounded by permafrost [56]. Zheng et al. [1] found that in these four types of alpine lakes (proglacial lakes, unconnected-fed lakes, unconnected–non-fed lakes and non-glacial lakes) in the Syr River basin, proglacial lakes showed the greatest expansion, with the number of lakes increasing by 88.71% and the lake area expanding by 60.82% from 1990 to 2015. In the Djungarskiy Alatau at the northeastern flank of the TS region, the paternoster lakes showed the largest increase in abundance and average area (in comparison to unconnected glacial lakes within 500 m at glacier termini, unconnected glacial lakes with more than 500 m, and rock-dammed lakes) from 2002–2014 [15]. Proglacial lakes in the Tarim basin had the fastest expansion rate of 3.35%/a from 1990 to 2013, which was notably higher than other types of glacial lakes (0.37%/a for supraglacial lakes, 0.57%/a for non-glacial lakes and 0.64%/a for extraglacial lakes) [16]. For the Eastern, Northern, Central and Western TS, the expansion rates (6.47%/a, 3.49%/a 1.44%/a and 5.51%/a) of the proglacial lakes were higher than the expansion rates of the extraglacial lakes (with rates of 2.00%/a, 1.29%/a, 0.74%/a and 0.67%, respectively). Compared to other glacier lakes, the proglacial lakes have strongly responded to glacier recession, e.g., proglacial lakes in the Adygine Valley in the Western TS expanded. Lakes in contact with the glacier terminus particularly increased in area, depth and volume by more than 13 times [56].
Compared to other glacial lakes, supraglacial lakes exhibited rapid seasonal responses to climate change and glacier recession. Their seasonal drainage cycle is not only determined by climate but is also affected by glacier evolution including development of a drainage network. For example, supraglacial lakes in the Tomor regions are below 3985 m with glacier surface gradients between 2°–6° [57]. They tend to appear on debris-covered glaciers in the advanced stage of glacier evolution [58]. Narama et al. [57] found that the cycle of the Southern Inylchek glacial lake begins to increase in April as increased snow and meltwater and reaches the maximum area in May–June. The lake volume and area sharply decrease in June–July, resulting from a greater connectivity to the englacial drainage network.
On the contrary, glacial lakes may also significantly impact glacier melting [32]. For example, proglacial lakes can amplify ice wastage from the glacier termini through mechanical calving and subaqueous melting [59]. King et al. [20] found that, in addition to climate change, the continuous expansion of established glacial lakes may amplify glacier recession. The continued expansion of glacial lakes may exacerbate ice mass loss in the coming decades in the Himalayan Mountains. Overall, glacial lake changes across the TS region are rapidly increasing in number and area in response to glacier retreat and wastage. These changes have been particularly significant for proglacial lakes in regions with medium- and small-sized glaciers.
5.2. Driving Factors of Lake Change: Climate
Alpine lake changes are closely associated with climate change. For glacial lake changes, rising temperatures may accelerate the melting of glacier ice and snow, which results in the expansion of glacial lake area down-valley or at the glacier termini. In addition, precipitation increases and evaporation decreases may both contribute to the expansion of glacial lake area. Song and Sheng [9] found that the expansion of glacial lakes in the Tanggula Mountains since 2002 could mainly be attributed to increased glacier meltwater, while the contributions from precipitation were not obvious. Liu and Liu [60] found that the GMB in the TS regions is more sensitive to changes in temperature than precipitation.
Consistent with glacial lake area expansion, annual temperature across the TS during the 1990–2015 period has been increasing at a rate of 0.30 °C/10 a (p < 0.05). Compared to the period before 1990, the annual temperature during this period increased by 0.95 °C (Figure 1b). This warming rate is obviously higher than the global rate (0.12 °C/10 a) [61], average rate for all of China (0.2 °C/10 a) [62], and Eastern Xinjiang (0.27 °C/10 a) [63]. It is, however, similar to the warming rate of Central Asia (0.31 °C/10 a) [64] (Table S3). The analyzed temperature records indicate that temperatures at nearly all meteorological stations (95%) rose from 1990 to 2015 (with the exception of three stations around the southern parts of the TS). Spatially, temperatures in the Eastern TS and the outer ranges I TS possessed higher warming rates. Deng et al. [65] even found a decline in temperatures in the Western TS from 2003 to 2015 and an accelerated warming climate in the Eastern TS.
Over the past half a century, precipitation in the TS has increased, with annual amounts rising by 16.44 mm compared to the period prior to 1990 (Figure 1c). During the study period from 1990 to 2015, the annual precipitation increased at a rate of 0.69 mm/10 a, but with significant regional differences. Spatial patterns in precipitation, as recorded by the meteorological stations and gridded GPCC data across the entire TS between 1990–2015, show a notable increase in precipitation in the inner TS. In contrast, precipitation in many outer regions declined. These patterns were more distinct in the Western TS region. The notable rising temperatures and decreasing precipitation have resulted in a drier climate. In contrast, a wetter environment has developed in the inner TS region because of both increased glacier–snow meltwater and precipitation.
As shown in Table 4, we further explored the spatial pattern of changes in different types of alpine lakes and analyzed their responses to climate change. A warming climate was found in the TS during the 1990–2015 period, particularly in the Eastern TS, with the highest warming rate of 0.32 °C/10 a. The expansion rate of proglacial lakes was higher than in the other TS regions, with a rate of 6.47%/a. The expansion of proglacial lakes was lower than that of the extraglacial lakes. We found that 83% of the alpine lakes in Eastern TS were extraglacial lakes. Between 1990 and 2015, the number and area of the extraglacial lakes increased, accounting for 88% and 85% of the total increase in alpine lake number and area, respectively.
During the 1990–2015 period, the temperature in the Central TS rose by 0.31 °C/10 a, while the expansion rate of proglacial lakes reached 1.44%/a, which was higher than that of the extraglacial lakes (with rate of 0.74%/a) and the non-glacial lakes (with rate of 0.73%/a). The rise in temperatures by 0.28 °C/10 a was lower than the rates of increase in Northern and Western TS, while the expansion rates (3.49%/a and 5.51%/a) of the glacial lakes were higher than the extraglacial lakes (with rates of 1.29%/a and 0.67%/a, respectively) and the non-glacial lakes (with rates of 1.03%/a and 0.62%/a, respectively).
During the 1990–2015 period, both the number and area of the supraglacial lakes in Central TS decreased at rates of −0.38%/a and −0.35%/a, respectively. Supraglacial lakes are generally unstable water bodies on glacier ice, and their spatial and temporal distribution is highly constrained by glacier hydrology. During the summer, they can usually form quickly due to increased surface melt, and they drain quickly when a subglacial channel opens. Within some ice caps or ice fields, supraglacial lakes appear and dry out on a seasonal basis. Since supraglacial lakes are much more transient than proglacial lakes over time, their locations vary yearly within a limited scale [13]. These factors may have contributed to the decrease in supraglacial lake number and area, and they make it difficult to detect the response of supraglacial lakes to climatic change.
Spatially, positive trends in non-glacial lakes were detected in the TS, which may result from increasing precipitation (e.g., occurred in the Eastern, Northern and Central TS regions). As shown in Figure 11b,d, for every 1000 m increase in elevation, precipitation increased by 55 mm. The influence of precipitation may, therefore, be particularly significant in high-altitude areas, which provide much of the water supply for non-glacial lakes. For example, a decrease in annual precipitation was documented for Western TS between 1990 and 2015, particularly for the southwest regions. In response to this decline in precipitation, the total lake number and area both decreased at rates of −0.67%/a and −1.11%/a, respectively. These alterations in lake number and area indicate that precipitation changes played an important role in the formation and evolution of non-glacial lakes in the TS.
Despite the fact that non-glacial lakes are disconnected from glacier ice, they may be disturbed by snow meltwater, the melting of buried ice, and higher runoff caused by the increased melting of glaciers. Here, the buried ice plays less of a role than the other factors, and while glacial lakes are now significantly disturbed during the warming seasons, non-glacial lakes were excluded from the influence of meltwater from the upper mother glaciers. In a warming climate, changes to the snow cover area and snowfall fraction could also influence the water balance. Li et al. [66] found that warming temperatures in the TS were driven by shifts in precipitation from snow to rain, particularly for the Eastern TS region. This change in the form of precipitation will likely become more notable in the near future [67]. Under a warming climate, snow cover in the Eastern TS also significantly decreased, along with the annual number of days of snow cover. The change in the number of days of snow cover was related to a delay in the snow onset data and an advance in the snow end data [68].
Comparison of changes in glacial lakes and non-glacial lakes across the four TS regions from 1990 to 2015 (Table 4) shows that the rates of glacial lake expansion were higher than those of non-glacial lakes, despite the increase in precipitation with higher elevation (Figure 11d). When elevation increases in the mountainous areas of the TS, temperature decreases at a rate of −4.8 °C/1000 m (Figure 11a). Warming rates for the TS region decrease with elevation below 2500 m but rapidly increase above this elevation (Figure 11c). These data indicate that a reverse in elevation-dependent warming occurred above 2500 m during the 1990–2015 period. The increase in land surface temperature warming rates at and above 2500 m could be adverse for solid water resources, meaning more water wastage from the mountains, which provides more water for down-valley lakes and streams. For example, in Eastern TS, we found that newly glaciated lakes (proglacial lakes and extraglacial lakes) increased by 38 (76%), with an area expansion of 1.18 km2 (44.95%) during the 1990–2015 period. These glacial lakes also showed the largest increase in numbers, jumping from 48 in 1990 to 87 in 2015, a 95.12% increase in the total number of alpine lakes. Glacial lake area expanded by about 1.44 km2 during the same period, representing a 97.19% increase. Overall, lake expansion in the Eastern TS was mainly caused by the expansion of glacial lakes. This indicates that the increase in the number and area of glacial lakes since 1990 has primarily been caused by increases in the glacier meltwater supply, which is mainly attributed to the acceleration of climate warming across the TS region. These results also confirm that proportions of water from glacier meltwater play more important roles in the expansion of alpine lakes than the recharge of alpine lakes in the TS by precipitation.
5.3. Driving Factors of Lake Change: Geomorphological Conditions
The current warming climate has expanded these mountain lakes, particularly the glacial lakes mainly recharged by increasing glacier meltwater from glacier wastage. However, lake expansion was limited by local geomorphological conditions and groundwater recharge, i.e., some lake basins that were not closed could not retain water resources despite the increasing meltwater from the upstream glaciers. These glacial lakes typically drained partially or completely when their dams were destroyed [56]. In TS, many rivers recharged by meltwater were routed from glaciers throughout the lakes and further downstream by a subsurface system in the rock glaciers [69]. With the disappearance of mother glaciers, the down-valley lake areas shrank, and their hazards also decreased [54]. In addition, some lakes in the Teskey Range of the TS were short-lived glacial lakes. Their drainage (and disappearance) occurred in July–August when the ice tunnel re-opened [70]. Daiyrov et al. [71] found that many of the recently disappeared and temporary glacial lakes in the Issyk-Kul Lake basin of the Teskey and Kungoy ranges are not significantly affected by short-term summer temperature anomalies, precipitation changes, or glacier shrinkage, but rather by regional geomorphological conditions. This can be seen in the distribution of glacial lakes at various altitudes in the Alps, where glacier expansion and shrinkage were mostly controlled by glacier erosion and sedimentation dynamics, and not by the scale of the glaciers [2].
Over the past decades, glacial lakes in the Eastern TS have exhibited the highest expansion rates in comparison to other regions of TS. The warming climate may be causing accelerated glacier recession in medium- and small-sized glaciers, but the immediate cause for the expansion rate is newly formed lakes. While new lakes form in other parts of the TS, these regions have lost far more glacial lakes than the Eastern TS.
Since 1990, the number of glacial lakes in the Eastern TS increased by 39 (67.8%), and their area expanded by 60.97%. Only two glacial lakes disappeared between 1990 and 2015, representing less than 1% of the total glacial lake area. By analyzing the locations of newly formed glacial lakes from 1990 to 2015, we found that these lakes were mainly concentrated at the termini of valley-type glaciers. Jia et al. [72] concluded that most of the lakes that formed prior to the Ice Age did so because of massive glacial deposits and erosion, as identified by the latest WorldView-2 images used in this study. However, the new glacial lakes that appeared during our study period were formed mainly by the replenishment of increasing amounts of meltwater from upstream alpine glaciers.
Of the two glacial lakes that disappeared in the Eastern TS, one is related to an upper glacier that also disappeared (entirely melted), while the other was located in an open lake basin. It was found that in the upper reaches of the second extinct glacial lake basin, there are several large glaciers with elevation differences of about 72 m; these are mainly supplied by three large glaciers (total area of 4.29 km2). Over the 25 years of the study period, the glacier area in the Eastern TS decreased by 24.79%, thus providing a large amount of glacier meltwater. The increase in glacier meltwater, whether occurring suddenly or over a short duration, may release water from the lake by opening the lake dam (the upper terrain slope has an average slope of 45°).
Under a warming climate, glaciers in the TS region have experienced great recession. Wastages of ice-melt inputs to mountain rivers and alpine lakes are changing their physicochemical characteristics and, in turn, aquatic communities [73,74]. Liu et al. [74] found that bacterial abundances and alpha diversity increased as the amount of meltwater increased during the summer melting season. Whereas in these disappearing or extinct alpine lakes, e.g., the supplied glacial lakes in the long term with the glacier wastage, which subsequently affect microbial communities, leading to the total loss of microbial biodiversity in glacier-fed lakes/river runoffs [75,76].
6. Conclusions
In this study, a comprehensive and multi-temporal alpine lake inventory was conducted based on multiple remotely sensed data across the TS region from 1990 to 2015. The main conclusions are as follows:
As of 2015, there were 2421 alpine lakes covering a total area of 129.75 km2 in the TS; a total of 85% of these lakes are glacial lakes, which accounts for 87% of the total alpine lake area. Among the glacial lakes, proglacial lakes and extraglacial lakes contribute 20% and 79% of the total glacial lake area, respectively. From 1990 to 2015, the total glacial lake number and area in the TS increased by 45.45% and expanded by 27.08%, respectively, while there was a 23.92% and 19.01% increase for the non-glacial lakes, respectively. From 1990 to 2000, the expansion rate of glacial lakes was 0.65 km2/a; during the 2000–2010 period, the rate was about 1.09 km2/a, and from 2010 to 2015, the rate further increased to 1.33 km2/a. Among the four defined lake types from 1990 to 2015, proglacial lakes showed the highest expansion; their areas expanded by 60.32%. Extraglacial lakes and non-glacial lakes followed; their areas expanded by 21.06% and 19.01%, respectively. Supraglacial lakes contracted. Their total number and area decreased by 1.89% and 3.74%, respectively.
In general, glacial lakes in the TS expanded, likely in response to widespread temperature rises and glacier shrinkage. From 1990 to 2015, glaciers in the Eastern and Northern TS showed the highest rates of shrinkage at −0.85%/a and −0.73%/a, respectively. In response to glacier size and mass, glacial lakes in the Eastern TS and Northern TS during 1990–2015 exhibited the highest expansion rates of 2.44%/a and 1.65%/a, respectively. The Western and Central TS exhibited glacier shrinkage rates of about −0.46%/a and −0.41%/a, respectively, which led to the expansion of glacial lakes by 0.98%/a and 0.87%/a, respectively. The shrinkage of glaciers and the enlargement of glacial lakes, particularly for the proglacial lakes, supports the assumption that lake growth is related to glacier recession. Specifically, in the Eastern TS, which has the greatest glacier shrinkage, proglacial lakes and extraglacial lakes both exhibited the highest expansion rates of 6.47% and 2%, respectively, from 1990 to 2015. The Eastern TS was followed by the Northern TS, where proglacial lakes and extraglacial lakes expanded by 3.49%/a and 1.29%/a, respectively. Glacial lakes in the Western and Central TS, which are located at relatively higher elevations and contain large glacierized areas, had slower expansion rates during 1990–2015. This was especially true for the Central TS. In response to glacier shrinkage, proglacial lakes and extraglacial lakes in the Western TS and Central TS expanded by 1.44%/a and 0.74%/a, respectively. Non-glacial lakes also expanded throughout TS, but showed spatial differences, which were likely related to precipitation differences.
Global warming has accelerated the global and regional water-cycle, increased the vulnerability of water systems and added more uncertainty to water resources’ management in Central Asia. The increasing meltwater from ice and snow in the TS region has resulted in increased runoff and lake expansion, which has influenced the TWS and temporally shifted water resources in mountains areas. Our work on the changes in alpine lakes has significant implications for the evaluation of regional hydrological changes and indicates the priority for further integrated assessments of water balances and management in the Tien Shan region. The next step is to carry out research on water resources in the Tien Shan by using a recent glacial-hydrological model and recent climate and satellite imagery.
Supplementary Materials
The following supporting information can be downloaded at: https://www.mdpi.com/article/10.3390/rs14194698/s1, Figure S1: Distribution of glacier terminal elevation and glacier lake elevation in the Eastern, Northern, Central and Western Tien Shan. (a) Distribution of glacier terminal elevation; (b) Distribution of glacier lake elevation; Figure S2: Characteristics of rivers, glacier area, and glacier lake termini in the Tien Shan region. (a) Spatial distribution of rivers; (b) Spatial distribution of glaciers; (c) spatial distribution of glacier areas; (d) spatial distribution of glacier termini; Table S1: Variations in alpine lake number and area from 1990 to 2015; Table S2: Changes in glacier number and area between 1990 and 2015; Table S3: Summary of temperature changes in different regions documented by previous investigations; Table S4: Fraction of the total lake number/area to glacier number/area in 2015. Refs. [61,62,63,64,77,78,79,80,81,82,83] are cited in the Supplementary file.
Author Contributions
Q.Z. and Y.C. conceived the original design of the paper; Y.X. improved the structure of the paper; Z.L., G.F. and Y.L. provided comments on this paper. All authors have read and agreed to the published version of the manuscript.
Funding
This research was supported by the National Natural Science Foundation of China (grant numbers 42130512, U1903208 and 42071046). The authors gratefully acknowledge the Youth Innovation Promotion Association of the Chinese Academy of Sciences (2019431).
Data Availability Statement
Not applicable.
Acknowledgments
We sincerely thank Wang Xin from Hunan University of Science and Technology for providing glacial lake area data from 1990 to 2010. We also thank Daniel E. Lawson for his suggestions about methods of glacier extraction in the TS. We wish to acknowledge the editor and the anonymous reviewers that helped to improve the quality of this paper.
Conflicts of Interest
The authors declare no conflict of interest.
References
- Zheng, G.X.; Bao, A.M.; Li, J.L.; Zhang, G.Q.; Xie, H.J.; Guo, H.; Jiang, L.L.; Chen, T.; Chang, C.; Chen, W.F. Sustained growth of high mountain lakes in the headwaters of the Syr Darya River, Central Asia. Global Planet. Change 2019, 176, 84–99. [Google Scholar] [CrossRef]
- Buckel, J.; Otto, J.C.; Prasicek, G.; Keuschnig, M. Glacial lakes in Austria—Distribution and formation since the Little Ice Age. Global Planet. Change 2018, 164, 39–51. [Google Scholar] [CrossRef]
- Zhang, G.Q.; Yao, T.D.; Piao, S.L.; Bolch, T.; Xie, H.J.; Chen, D.L.; Gao, Y.H.; O’Reilly, C.M.; Shum, C.K.; Yang, K.; et al. Extensive and drastically different alpine lake changes on Asia’s high plateaus during the past four decades. Geophys. Res. Lett. 2017, 44, 252–260. [Google Scholar] [CrossRef]
- Qiao, B.J.; Zhu, L.P. Difference and cause analysis of water storage changes for glacier-fed and non-glacier-fed lakes on the Tibetan Plateau. Sci. Total Environ. 2019, 693, 133399. [Google Scholar] [CrossRef]
- Chen, H.Y.; Chen, Y.N.; Li, W.H.; Li, Z. Quantifying the contributions of snow/glacier meltwater to river runoff in the Tianshan Mountains, Central Asia. Global Planet. Change 2019, 174, 47–57. [Google Scholar] [CrossRef]
- Luo, Y.; Wang, X.L.; Piao, S.L.; Sun, L.; Ciais, P.; Zhang, Y.Q.; Ma, C.K.; Gan, R.; He, C.S. Contrasting streamflow regimes induced by melting glaciers across the Tien Shan—Pamir—North Karakoram. Sci. Rep. 2018, 8, 16470. [Google Scholar] [CrossRef]
- Shen, Y.J.; Shen, Y.J.; Fink, M.; Kralisch, S.; Chen, Y.N.; Brenning, A. Trends and variability in streamflow and snowmelt runoff timing in the southern Tianshan Mountains. J. Hydrol. 2018, 557, 173–181. [Google Scholar] [CrossRef]
- Yang, X.; Pavelsky, T.M.; Allen, G.H. The past and future of global river ice. Nature 2020, 577, 69–73. [Google Scholar] [CrossRef]
- Song, C.Q.; Sheng, Y.W. Contrasting evolution patterns between glacier-fed and non-glacier-fed lakes in the Tanggula Mountains and climate cause analysis. Clim. Change 2016, 135, 493–507. [Google Scholar] [CrossRef]
- Zhang, G.Q.; Bolch, T.; Allen, S.; Linsbauer, A.; Chen, W.F.; Wang, W.C. Glacial lake evolution and glacier–lake interactions in the Poiqu River basin, central Himalaya, 1964–2017. J. Glaciol. 2019, 65, 347–365. [Google Scholar] [CrossRef] [Green Version]
- Shangguan, D.H.; Ding, Y.J.; Liu, S.Y.; Xie, Z.Y.; Pieczonka, T.; Xu, J.L.; Moldobekov, B. Quick release of internal water storage in a glacier leads to underestimation of the hazard potential of glacial lake outburst floods from ake Merzbacher in central Tian Shan Mountains. Geophys. Res. Lett. 2017, 44, 9786–9795. [Google Scholar] [CrossRef]
- Veh, G.; Korup, O.; Walz, A. Hazard from Himalayan glacier lake outburst floods. Proc. Natl. Acad. Sci. USA 2020, 117, 907–912. [Google Scholar] [CrossRef]
- Gardelle, J.; Arnaud, Y.; Berthier, E. Contrasted evolution of glacial lakes along the Hindu Kush Himalaya mountain range between 1990 and 2009. Global Planet. Change 2011, 75, 47–55. [Google Scholar] [CrossRef]
- Mergili, M.; Müller, J.P.; Schneider, J.F. Spatio-temporal development of high-mountain lakes in the headwaters of the Amu Darya River (Central Asia). Global Planet. Change 2013, 107, 13–24. [Google Scholar] [CrossRef]
- Kapitsa, V.; Shahgedanova, M.; Machguth, H.; Severskiy, I.; Medeu, A. Assessment of evolution and risks of glacier lake outbursts in the Djungarskiy Alatau, Central Asia, using Landsat imagery and glacier bed topography modelling. Nat. Hazard. Earth Sys. 2017, 17, 1837–1856. [Google Scholar] [CrossRef]
- Wang, X.; Liu, Q.H.; Liu, S.Y.; Wei, J.F.; Jiang, Z.L. Heterogeneity of glacial lake expansion and its contrasting signals with climate change in Tarim Basin, Central Asia. Environ. Earth Sci. 2016, 75, 696. [Google Scholar] [CrossRef]
- Song, C.Q.; Huang, B.; Richards, K.; Ke, L.H.; Hien, V.P. Accelerated lake expansion on the Tibetan Plateau in the 2000s: Induced by glacial melting or other processes? Water Resour. Res. 2014, 50, 3170–3186. [Google Scholar] [CrossRef]
- Lei, Y.; Yao, T.; Bird, B.W.; Yang, K.; Zhai, J.; Sheng, Y. Coherent lake growth on the central Tibetan Plateau since the 1970s: Characterization and attribution. J. Hydrol. 2013, 483, 61–67. [Google Scholar] [CrossRef]
- Petrov, M.A.; Sabitov, T.Y.; Tomashevskaya, I.G.; Glazirin, G.E.; Chernomorets, S.S.; Savernyuk, E.A.; Tutubalina, O.V.; Petrakov, D.A.; Sokolov, L.S.; Dokukin, M.D. Glacial lake inventory and lake outburst potential in Uzbekistan. Sci. Total Environ. 2017, 592, 228–242. [Google Scholar] [CrossRef]
- King, O.; Bhattacharya, A.; Bhambri, R.; Bolch, T. Glacial lakes exacerbate Himalayan glacier mass loss. Sci. Rep. 2019, 9, 18145. [Google Scholar] [CrossRef] [Green Version]
- Phan, V.H.; Lindenbergh, R.C.; Menenti, M. Geometric dependency of Tibetan lakes on glacial runoff. Hydrol. Earth Syst. Sci. 2013, 17, 4061–4077. [Google Scholar] [CrossRef]
- Zhang, G.Q.; Yao, T.D.; Xie, H.J.; Wang, W.C.; Yang, W. An inventory of glacial lakes in the Third Pole region and their changes in response to global warming. Global Planet. Change 2015, 131, 148–157. [Google Scholar] [CrossRef]
- Worni, R.; Huggel, C.; Stoffel, M. Glacial lakes in the Indian Himalayas—From an area-wide glacial lake inventory to on-site and modeling based risk assessment of critical glacial lakes. Sci. Total Environ. 2013, 468, S71–S84. [Google Scholar] [CrossRef]
- Wang, X.; Guo, X.Y.; Yang, C.D.; Liu, Q.H.; Wei, J.F.; Zhang, Y.; Liu, S.Y.; Zhang, Y.L.; Jiang, Z.L.; Tang, Z.G. Cataloging data set of high Asian ice lakes. Natl. Cryosphere Desert Date Cent. 2021. [Google Scholar] [CrossRef]
- Yang, C.D.; Wang, X.; Wei, J.F.; Liu, S.Y. A dataset of glacial lake inventory of West China in 2015. Sci. Data Bank 2018. [Google Scholar] [CrossRef]
- Chen, Y.N.; Li, W.H.; Deng, H.J.; Fang, G.H.; Li, Z. Changes in Central Asia’s Water Tower: Past, Present and Future. Sci. Rep. 2016, 6, 35458. [Google Scholar] [CrossRef]
- Li, Z.; Chen, Y.; Zhang, Q.; Li, Y. Spatial patterns of vegetation carbon sinks and sources under water constraint in Central Asia. J. Hydrol. 2020, 590, 125355. [Google Scholar] [CrossRef]
- Yang, T.; Li, Q.; Ahmad, S.; Zhou, H.F.; Li, L.H. Changes in Snow Phenology from 1979 to 2016 over the Tianshan Mountains, Central Asia. Remote Sens. 2019, 11, 499. [Google Scholar] [CrossRef]
- Hu, Z.Y.; Dietz, A.; Zhao, A.; Uereyen, S.; Zhang, H.; Wang, M.; Mederer, P.; Kuenzer, C. Snow Moving to Higher Elevations: Analyzing Three Decades of Snowline Dynamics in the Alps. Geophys. Res. Lett. 2020, 47, e2019GL085742. [Google Scholar] [CrossRef]
- Yao, X.J.; Liu, S.Y.; Han, L.; Sun, M.P.; Zhao, L.L. Definition and classification system of glacial lake for inventory and hazards study. J. Geogr. Sci. 2018, 28, 193–205. [Google Scholar] [CrossRef] [Green Version]
- Wang, X.; Guo, X.Y.; Yang, C.D.; Liu, Q.H.; Wei, J.F.; Zhang, Y.; Liu, S.Y.; Zhang, Y.L.; Jiang, Z.L.; Tang, Z.G. Glacial lake inventory of high-mountain Asia in 1990 and 2018 derived from Landsat images. Earth Syst. Sci. Data 2020, 12, 2169–2182. [Google Scholar] [CrossRef]
- Wangchuk, S.; Bolch, T. Mapping of glacial lakes using Sentinel-1 and Sentinel-2 data and a random forest classifier: Strengths and challenges. Sci. Remote Sens. 2020, 2, 100008. [Google Scholar] [CrossRef]
- Veh, G.; Korup, O.; Roessner, S.; Walz, A. Detecting Himalayan glacial lake outburst floods from Landsat time series. Remote Sens. Environ. 2018, 207, 84–97. [Google Scholar] [CrossRef]
- Wang, X.; Ding, Y.J.; Liu, S.Y.; Jiang, L.H.; Wu, K.P.; Jiang, Z.L.; Guo, W.Q. Changes of glacial lakes and implications in Tian Shan, central Asia, based on remote sensing data from 1990 to 2010. Environ. Res. Lett. 2013, 8, 44052. [Google Scholar] [CrossRef]
- Li, J.; Warner, T.A.; Wang, Y.; Bai, J.; Bao, A. Mapping glacial lakes partially obscured by mountain shadows for time series and regional mapping applications. Int. J. Remote Sens. 2019, 40, 615–641. [Google Scholar] [CrossRef]
- Pekel, J.F.; Cottam, A.; Gorelick, N.; Belward, A.S. High-resolution mapping of global surface water and its long-term changes. Nature 2016, 540, 418–422. [Google Scholar] [CrossRef]
- Hall, D.K.; Bayr, K.J.; Schöner, W.; Bindschadler, R.A.; Chien, J.Y.L. Consideration of the errors inherent in mapping historical glacier positions in Austria from the ground and space (1893–2001). Remote Sens. Environ. 2003, 86, 566–577. [Google Scholar] [CrossRef]
- Hanshaw, M.N.; Bookhagen, B. Glacial areas, lake areas, and snow lines from 1975 to 2012: Status of the Cordillera Vilcanota, including the Quelccaya Ice Cap, northern central Andes, Peru. Cryosphere 2014, 8, 359–376. [Google Scholar] [CrossRef]
- He, Y.; Yang, T.B.; Ji, Q.; Chen, J.; Zhao, G.; Shao, W.W. Glacier variation in response to climate change in Chinese Tianshan Mountains from 1989 to 2012. J. Mt. Sci. 2015, 12, 1189–1202. [Google Scholar] [CrossRef]
- Pritchard, H.D. Asia’s shrinking glaciers protect large populations from drought stress. Nature 2019, 569, 649–654. [Google Scholar] [CrossRef]
- Farinotti, D.; Longuevergne, L.; Moholdt, G.; Duethmann, D.; Mölg, T.; Bolch, T.; Vorogushyn, S.; Güntner, A. Substantial glacier mass loss in the Tien Shan over the past 50 years. Nat. Geosci. 2015, 8, 716–722. [Google Scholar] [CrossRef]
- Petrakov, D.; Shpuntova, A.; Aleinikov, A.; Kääb, A.; Kutuzov, S.; Lavrentiev, I.; Stoffel, M.; Tutubalina, O.; Usubaliev, R. Accelerated glacier shrinkage in the Ak-Shyirak massif, Inner Tien Shan, during 2003–2013. Sci. Total Environ. 2016, 562, 364–378. [Google Scholar] [CrossRef] [PubMed]
- Sorg, A.; Huss, M.; Rohrer, M.; Stoffel, M. The days of plenty might soon be over in glacierized Central Asian catchments. Environ. Res. Lett. 2014, 9, 104018. [Google Scholar] [CrossRef]
- Wang, X.W.; Gong, P.; Zhao, Y.Y.; Xu, Y.; Cheng, X.; Niu, Z.G.; Luo, Z.C.; Huang, H.B.; Sun, F.D.; Li, X.W. Water-level changes in China’s large lakes determined from ICESat/GLAS data. Remote Sens. Environ. 2013, 132, 131–144. [Google Scholar] [CrossRef]
- Sorg, A.; Bolch, T.; Stoffel, M.; Solomina, O.; Beniston, M. Climate change impacts on glaciers and runoff in Tien Shan (Central Asia). Nat. Clim. Change 2012, 2, 725–731. [Google Scholar] [CrossRef]
- Pieczonka, T.; Bolch, T. Region-wide glacier mass budgets and area changes for the Central Tien Shan between ~1975 and 1999 using Hexagon KH-9 imagery. Global Planet. Change 2015, 128, 1–13. [Google Scholar] [CrossRef]
- Narama, C.; Kääb, A.; Duishonakunov, M.; Abdrakhmatov, K. Spatial variability of recent glacier area changes in the Tien Shan Mountains, Central Asia, using Corona (~1970), Landsat (~2000), and ALOS (~2007) satellite data. Global Planet. Change 2010, 71, 42–54. [Google Scholar] [CrossRef]
- Zhang, Q.F.; Chen, Y.N.; Li, Z.; Fang, G.H.; Xiang, Y.Y.; Li, Y.P.; Ji, H.P. Recent Changes in Water Discharge in Snow and Glacier Melt-Dominated Rivers in the Tienshan Mountains, Central Asia. Remote Sens. 2020, 12, 2704. [Google Scholar] [CrossRef]
- Aizen, V.B.; Kuzmichenok, V.A.; Surazakov, A.B.; Aizen, E.M. Glacier changes in the Tien Shan as determined from topographic and remotely sensed data. Global Planet. Change 2007, 56, 328–340. [Google Scholar] [CrossRef]
- Kenzhebaev, R.; Barandun, M.; Kronenberg, M.; Chen, Y.; Usubaliev, R.; Hoelzle, M. Mass balance observations and reconstruction for Batysh Sook Glacier, Tien Shan, from 2004 to 2016. Cold Reg. Sci. Technol. 2017, 135, 76–89. [Google Scholar] [CrossRef] [Green Version]
- Kronenberg, M.; Barandun, M.; Hoelzle, M.; Huss, M.; Farinotti, D.; Azisov, E.; Usubaliev, R.; Gafurov, A.; Petrakov, D.; Kääb, A. Mass-balance reconstruction for Glacier No. 354, Tien Shan, from 2003 to 2014. Ann. Glaciol. 2016, 57, 92–102. [Google Scholar] [CrossRef]
- Wu, K.; Liu, S.; Jiang, Z.; Zhu, Y.; Xie, F.; Gao, Y.; Yi, Y.; Tahir, A.A.; Muhammad, S. Surging Dynamics of Glaciers in the Hunza Valley under an Equilibrium Mass State since 1990. Remote Sens. 2020, 12, 2922. [Google Scholar] [CrossRef]
- Zhang, H.; Li, Z.Q.; Zhou, P.; Zhu, X.F.; Wang, L. Mass-balance observations and reconstruction for Haxilegen Glacier No.51, eastern Tien Shan, from 1999 to 2015. J. Glaciol. 2018, 64, 689–699. [Google Scholar] [CrossRef]
- Shugar, D.H.; Burr, A.; Haritashya, U.K.; Kargel, J.S.; Watson, C.S.; Kennedy, M.C.; Bevington, A.R.; Betts, R.A.; Harrison, S.; Strattman, K. Rapid worldwide growth of glacial lakes since 1990. Nat. Clim. Change 2020, 10, 939–945. [Google Scholar] [CrossRef]
- Woolway, R.I.; Kraemer, B.M.; Lenters, J.D.; Merchant, C.J.; O Reilly, C.M.; Sharma, S. Global lake responses to climate change. Nat. Rev. Earth Environ. 2020, 1, 388–403. [Google Scholar] [CrossRef]
- Falatkova, K.; Šobr, M.; Neureiter, A.; Schöner, W.; Janský, B.; Häusler, H.; Engel, Z.; Beneš, V. Development of proglacial lakes and evaluation of related outburst susceptibility at the Adygine ice-debris complex, northern Tien Shan. Earth Surf. Dyn. 2019, 7, 301–320. [Google Scholar] [CrossRef]
- Narama, C.; Daiyrov, M.; Tadono, T.; Yamamoto, M.; Kääb, A.; Morita, R.; Ukita, J. Seasonal drainage of supraglacial lakes on debris-covered glaciers in the Tien Shan Mountains, Central Asia. Geomorphology 2017, 286, 133–142. [Google Scholar] [CrossRef]
- Benn, D.I.; Bolch, T.; Hands, K.; Gulley, J.; Luckman, A.; Nicholson, L.I.; Quincey, D.; Thompson, S.; Toumi, R.; Wiseman, S. Response of debris-covered glaciers in the Mount Everest region to recent warming, and implications for outburst flood hazards. Earth-Sci. Rev. 2012, 114, 156–174. [Google Scholar] [CrossRef]
- Truffer, M.; Motyka, R.J. Where glaciers meet water: Subaqueous melt and its relevance to glaciers in various settings. Rev. Geophys. 2016, 54, 220–239. [Google Scholar] [CrossRef]
- Liu, Q.; Liu, S.Y. Response of glacier mass balance to climate change in the Tianshan Mountains during the second half of the twentieth century. Clim. Dynam. 2016, 46, 303–316. [Google Scholar] [CrossRef]
- IPCC. Working Group I Contribution to the IPCC Fifth Assessment Report, Climate Change 2013: The Physical Science Basis: Summary for Policymakers; Cambridge University Press: Cambridge, UK, 2013. [Google Scholar]
- Shi, Y.F.; Shen, Y.P.; Kang, E.; Li, D.L.; Ding, Y.J.; Zhang, G.W.; Hu, R. Recent and future climate change in northwest China. Clim. Change 2007, 80, 379–393. [Google Scholar] [CrossRef]
- Li, K.M.; Li, Z.Q.; Gao, W.Y.; Wang, L. Recent glacial retreat and its effect on water resources in eastern Xinjiang. Chin. Sci. Bull. 2011, 56, 3596–3604. [Google Scholar] [CrossRef]
- Deng, H.J.; Chen, Y.N. Influences of recent climate change and human activities on water storage variations in Central Asia. J. Hydrol. 2017, 544, 46–57. [Google Scholar] [CrossRef]
- Deng, H.J.; Chen, Y.N.; Li, Q.H.; Lin, G.F. Loss of terrestrial water storage in the Tianshan Mountains from 2003 to 2015. Int. J. Remote Sens. 2019, 40, 8342–8358. [Google Scholar] [CrossRef]
- Li, Z.; Chen, Y.N.; Li, Y.P.; Wang, Y. Declining snowfall fraction in the alpine regions, Central Asia. Sci. Rep. 2020, 10, 3476. [Google Scholar] [CrossRef]
- Li, Y.P.; Chen, Y.N.; Wang, F.; He, Y.Q.; Li, Z. Evaluation and projection of snowfall changes in high mountain Asia based on NASA’s NEX-GDDP high-resolution daily downscaled dataset. Environ. Res. Lett. 2020, 15, 104040. [Google Scholar] [CrossRef]
- Li, Y.P.; Chen, Y.N.; Li, Z. Climate and topographic controls on snow phenology dynamics in the Tienshan Mountains, Central Asia. Atmos. Res. 2020, 236, 104813. [Google Scholar] [CrossRef]
- Falatkova, K.; Šobr, M.; Slavík, M.; Bruthans, J.; Janský, B. Hydrological characterization and connectivity of proglacial lakes to a stream, Adygine ice-debris complex, northern Tien Shan. Hydrol. Sci. J. 2020, 65, 610–623. [Google Scholar] [CrossRef]
- Narama, C.; Daiyrov, M.; Duishonakunov, M.; Tadono, T.; Sato, H.; Kääb, A.; Ukita, J.; Abdrakhmatov, K. Large drainages from short-lived glacial lakes in the Teskey Range, Tien Shan Mountains, Central Asia. Nat. Hazard. Earth Sys. 2018, 18, 983–995. [Google Scholar] [CrossRef]
- Daiyrov, M.; Narama, C.; Yamanokuchi, T.; Tadono, T.; Ukita, J. Regional geomorphological conditions related to recent changes of glaciallakes in the Issyk-Kul Basin, northern Tien Shan. Geosciences 2018, 8, 99. [Google Scholar] [CrossRef] [Green Version]
- Jia, Y.; Chen, X.; Cao, L.Z.; Zhang, W.G. Glacial lake changes and its relation with climate change in Bogda Mountains of Tienshan during 1990–2012. In Proceedings of the International Academic Symposium on Remote Sensing and Social Development Conference, Shanghai, China, 1 December 2013; pp. 93–103. [Google Scholar]
- Fell, S.; Carrivick, J.; Brown, L. The Multitrophic Effects of Climate Change and Glacier Retreat in Mountain Rivers. Bioscience 2017, 10, 897–911. [Google Scholar] [CrossRef] [PubMed]
- Liu, K.S.; Liu, Y.Q.; Han, B.P.; Xu, B.Q.; Zhu, L.P.; Ju, J.T.; Jiao, N.Z.; Xiong, J.B. Bacterial community changes in a glacial-fed Tibetan lake are correlated with glacial melting. Sci. Total Environ. 2019, 651, 2059–2067. [Google Scholar] [CrossRef]
- Milner, A.M.; Brown, L.E.; Hannah, D.M. Hydroecological response of river systems to shrinking glaciers. Hydrol. Process. 2009, 23, 62–77. [Google Scholar] [CrossRef]
- Milner, A.M.; Khamis, K.; Battin, T.J.; Brittain, J.E.; Barrand, N.E.; Füreder, L.; Cauvy-Fraunie, S.; Gislason, G.M.; Jacobsen, D.; Hannah, D.M.; et al. Glacier shrinkage driving global changes in downstream systems. Proc. Natl. Acad. Sci. USA 2017, 114, 9770–9778. [Google Scholar] [CrossRef] [PubMed]
- Bolch, T. Climate change and glacier retreat in northern Tien Shan (Kazakhstan/Kyrgyzstan) using remote sensing data. Global Planet. Change. 2007, 56, 1–12. [Google Scholar] [CrossRef]
- Kaldybayev, A.; Chen, Y.N.; Vilesov, E. Glacier change in the Karatal river basin, Zhetysu (Dzhungar) Alatau, Kazakhstan. Ann. Glaciol. 2016, 57, 11–19. [Google Scholar] [CrossRef]
- Racoviteanu, A.; Williams, M.W. Decision Tree and Texture Analysis for Mapping Debris-Covered Glaciers in the Kangchenjunga Area, Eastern Himalaya. Remote Sens. 2012, 4, 3078–3109. [Google Scholar] [CrossRef]
- Sidjak, R.W.; Wheate, R.D. Glacier mapping of the Illecillewaet icefield, British Columbia, Canada, using Landsat TM and digital elevation data. Int. J. Remote Sens. 1999, 20, 273–284. [Google Scholar] [CrossRef]
- Pfeffer, W.T.; Arendt, A.A.; Bliss, A.; Bolch, T.; Cogley, J.G.; Gardner, A.S.; Hagen, J.; Hock, R.; Kaser, G.; Kienholz, C.; et al. The Randolph Glacier Inventory: A globally complete inventory of glaciers. J. Glaciol. 2014, 60, 537–552. [Google Scholar] [CrossRef]
- Bolch, T.; Yao, T.; Kang, S.; Buchroithner, M.F.; Scherer, D.; Maussion, F.; Huintjes, E.; Schneider, C. A glacier inventory for the western Nyainqentanglha Range and the Nam Co Basin, Tibet, and glacier changes 1976–2009. Cryosphere 2010, 4, 419–433. [Google Scholar] [CrossRef] [Green Version]
- Guo, W.Q.; Liu, S.Y.; Xu, J.L.; Wu, L.Z.; Shangguan, D.H.; Yao, X.J.; Wei, J.F.; Bao, W.J.; Yu, P.C.; Liu, Q.; et al. The second Chinese glacier inventory: Data, methods and results. J. Glaciol. 2015, 61, 357–372. [Google Scholar] [CrossRef] [Green Version]
Figure 1.
Map showing the TS study region (a); changes in annual temperature and precipitation (b,c); map of study area showing the spatial distribution of lakes, glaciers, rivers and meteorological stations (d); monthly average temperature (ERA-5) and precipitation (GPCC) (e); hypsometric curve of the TS region and distribution of the area by layer under each 500 m elevation band (f). Note: Jan = January, Mar = March, Jul = July, Sep = September, Nov = November.

Figure 2.
Flow chart showing the process used for alpine lake extraction.

Figure 3.
Diagram showing the classification of alpine lakes across the TS region (a); the available Landsat images used in the TS; (b) alpine lakes within a 10 km buffer zone of a glacier were extracted in the TS; (c) the position of different types of alpine lakes relative to the glaciers; (d–h) examples of supraglacial, proglacial, extraglacial and non-glacial lakes in the TS. Note: the bule framework means the different types of alpine lakes.

Figure 4.
Distribution of the four alpine lake types of different sizes in the TS in 2015.

Figure 5.
Yearly changing rates of the different alpine lake types in terms of number (a) and lake area (b) in the TS from 1990 to 2015.
Figure 5.
Yearly changing rates of the different alpine lake types in terms of number (a) and lake area (b) in the TS from 1990 to 2015.

Figure 6.
Variations in the number and area of the four types of alpine lakes in the TS between 1990 and 2015.
Figure 6.
Variations in the number and area of the four types of alpine lakes in the TS between 1990 and 2015.

Figure 7.
Changes in glacial lakes in the TS from 1990 to 2015. (a,c,e) Newly formed lakes between 1990–2000, 2000–2010, and 2010–2015; (b,d,f) Extinct (lost) lakes between the periods of 1990–2000, 2000–2010, and 2010–2015.
Figure 7.
Changes in glacial lakes in the TS from 1990 to 2015. (a,c,e) Newly formed lakes between 1990–2000, 2000–2010, and 2010–2015; (b,d,f) Extinct (lost) lakes between the periods of 1990–2000, 2000–2010, and 2010–2015.

Figure 8.
Changes in glacier number and area across the Eastern Tien Shan. (a,d) Glacier number; (b,e) glacier area; (c,f) change rates in glacier area for glaciers of different sizes.
Figure 8.
Changes in glacier number and area across the Eastern Tien Shan. (a,d) Glacier number; (b,e) glacier area; (c,f) change rates in glacier area for glaciers of different sizes.

Figure 9.
Mean annual and cumulative glacier mass balance for Tuyuksuyskiy glacier and Urumqi glacier No. 1 in the TS from 1980 to 2015. (a) Ts. Tuyuksuyskiy glacier; (b) Urumqi glacier No. 1.
Figure 9.
Mean annual and cumulative glacier mass balance for Tuyuksuyskiy glacier and Urumqi glacier No. 1 in the TS from 1980 to 2015. (a) Ts. Tuyuksuyskiy glacier; (b) Urumqi glacier No. 1.

Figure 10.
Geographical information in the TS region (a); spatial distribution of glaciers and glacial lakes (b,c); the proportion of glaciers and glacial lakes (d,e); spatial variations in annual TWS (f); variations in monthly TWS (g); variations in annual TWS (h).
Figure 10.
Geographical information in the TS region (a); spatial distribution of glaciers and glacial lakes (b,c); the proportion of glaciers and glacial lakes (d,e); spatial variations in annual TWS (f); variations in monthly TWS (g); variations in annual TWS (h).

Figure 11.
Variations in annual temperature and precipitation in the TS from 1990 to 2015. (a) Variations in temperature from the meteorological stations; (b) variations in temperature from the ERA5 data; (c) variations in precipitation from the meteorological stations; (d) variations in precipitation from the GPCC data.


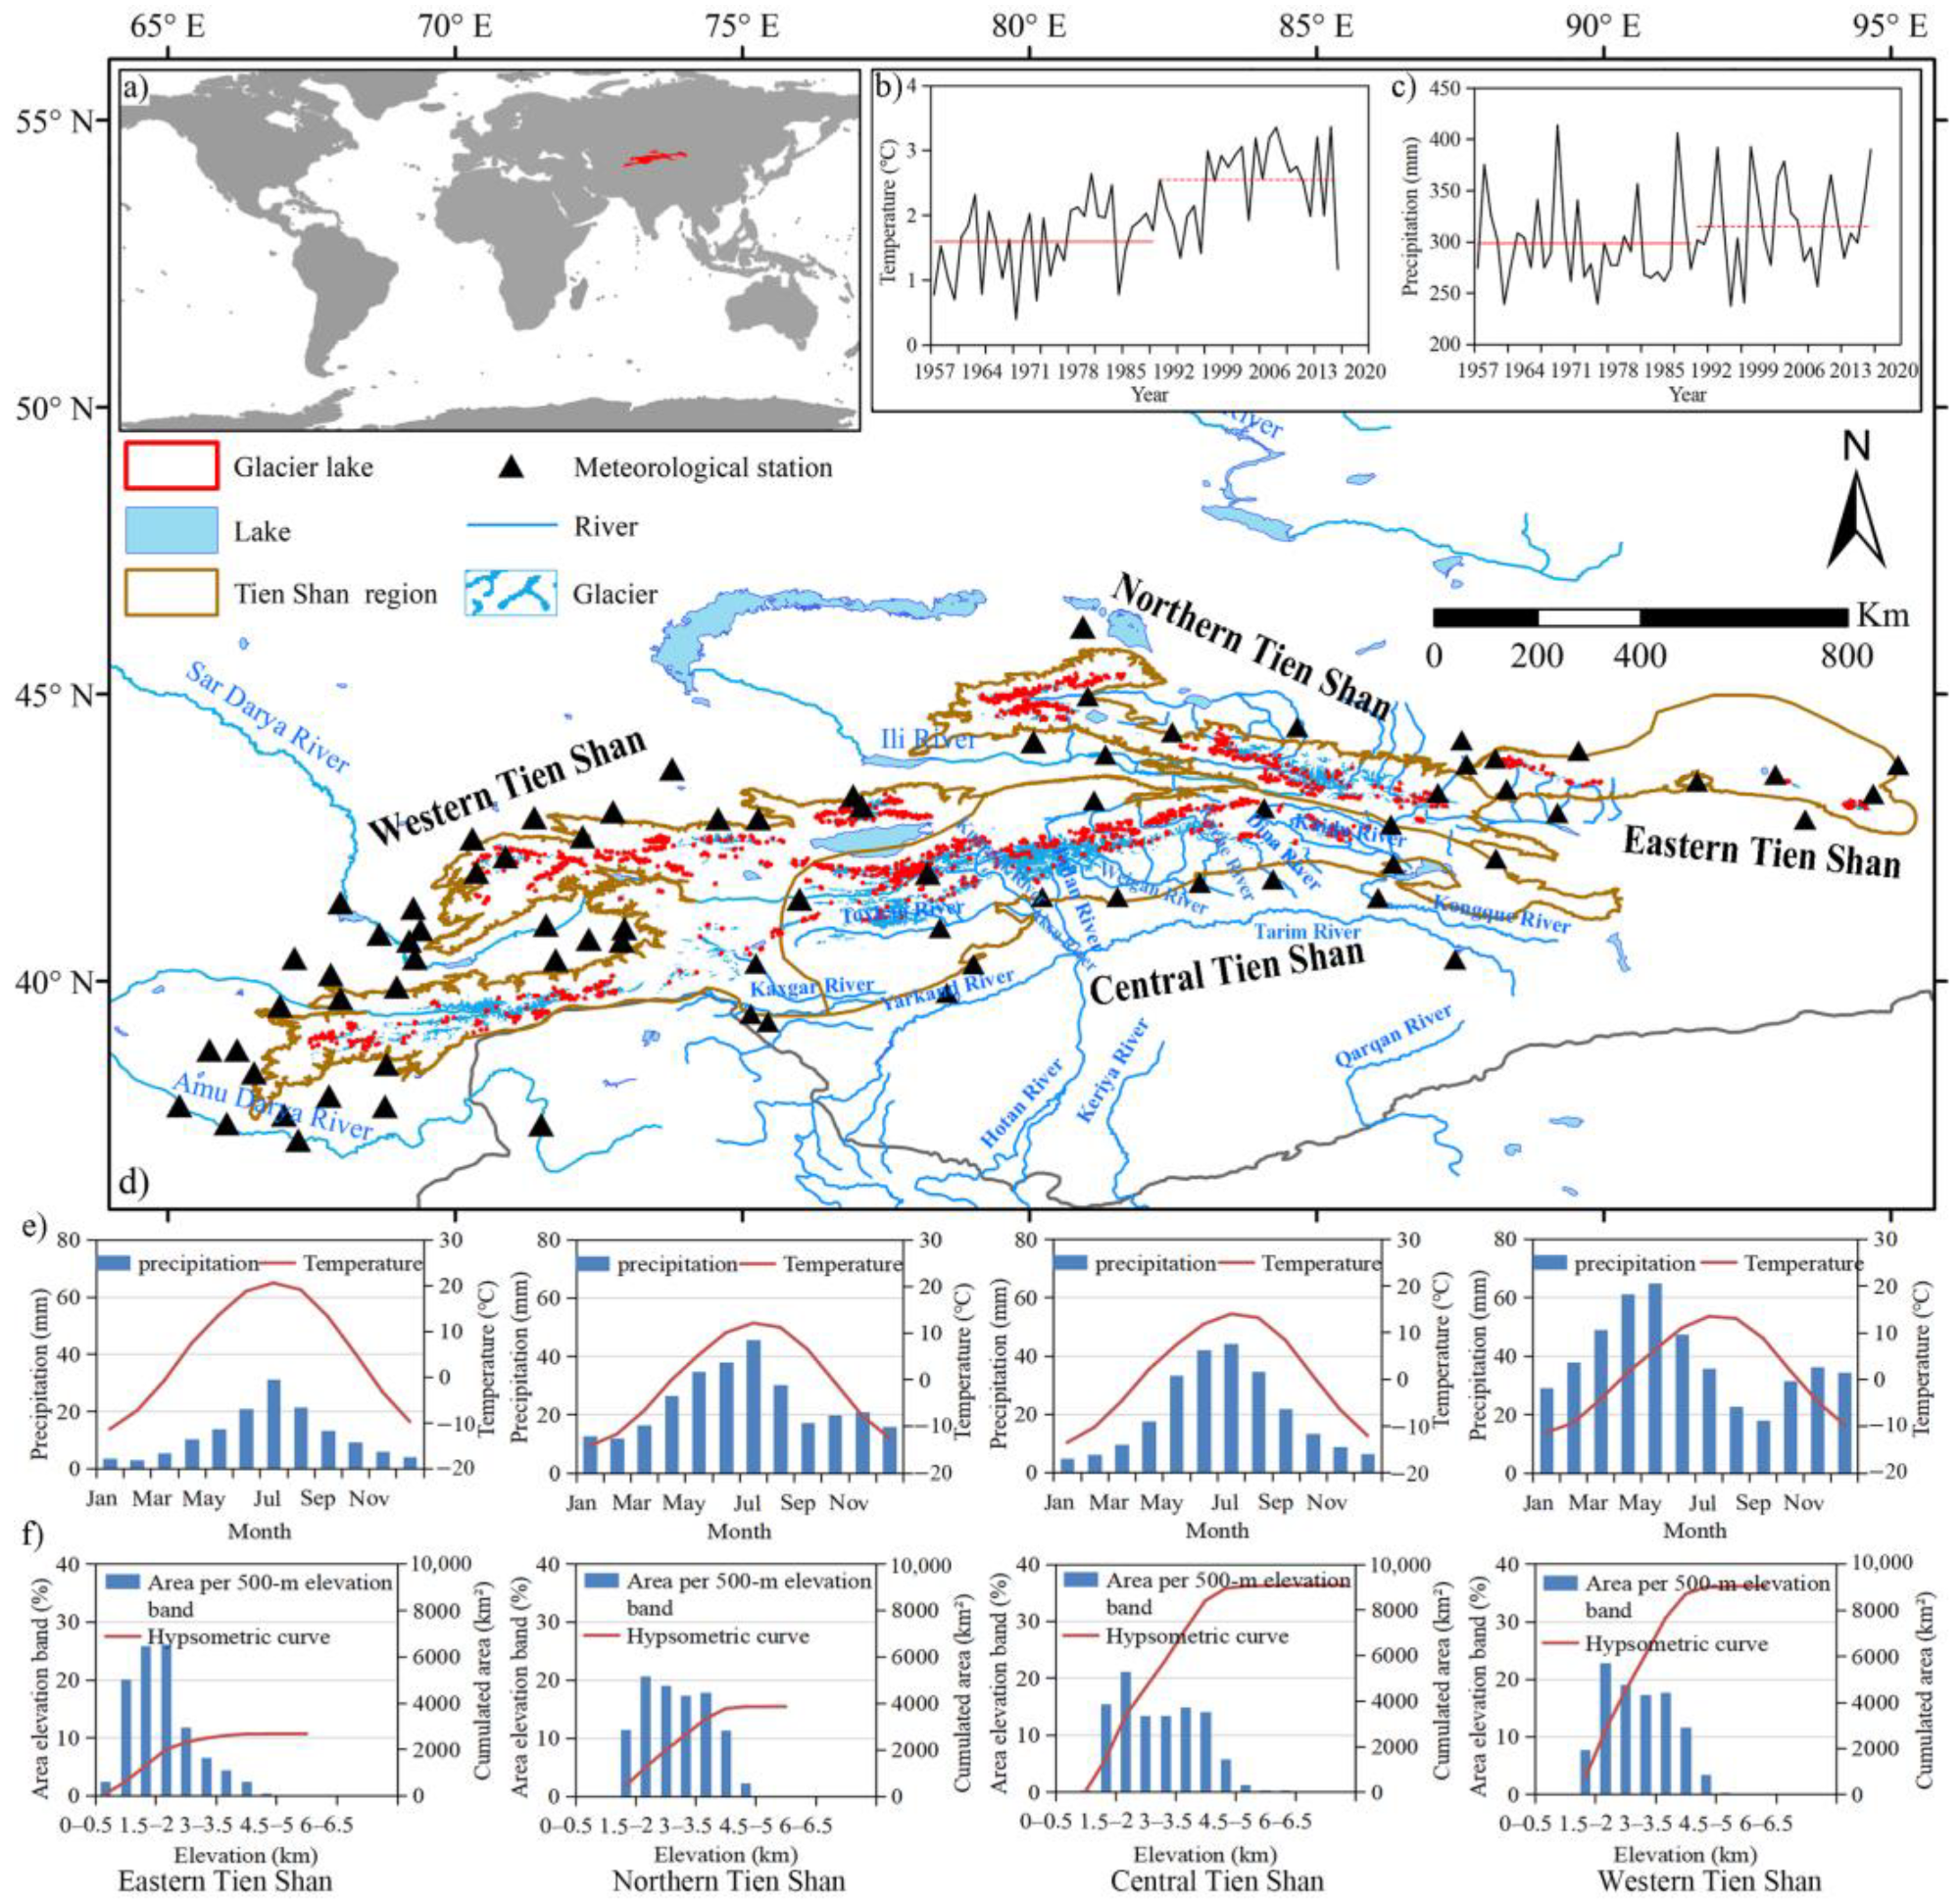
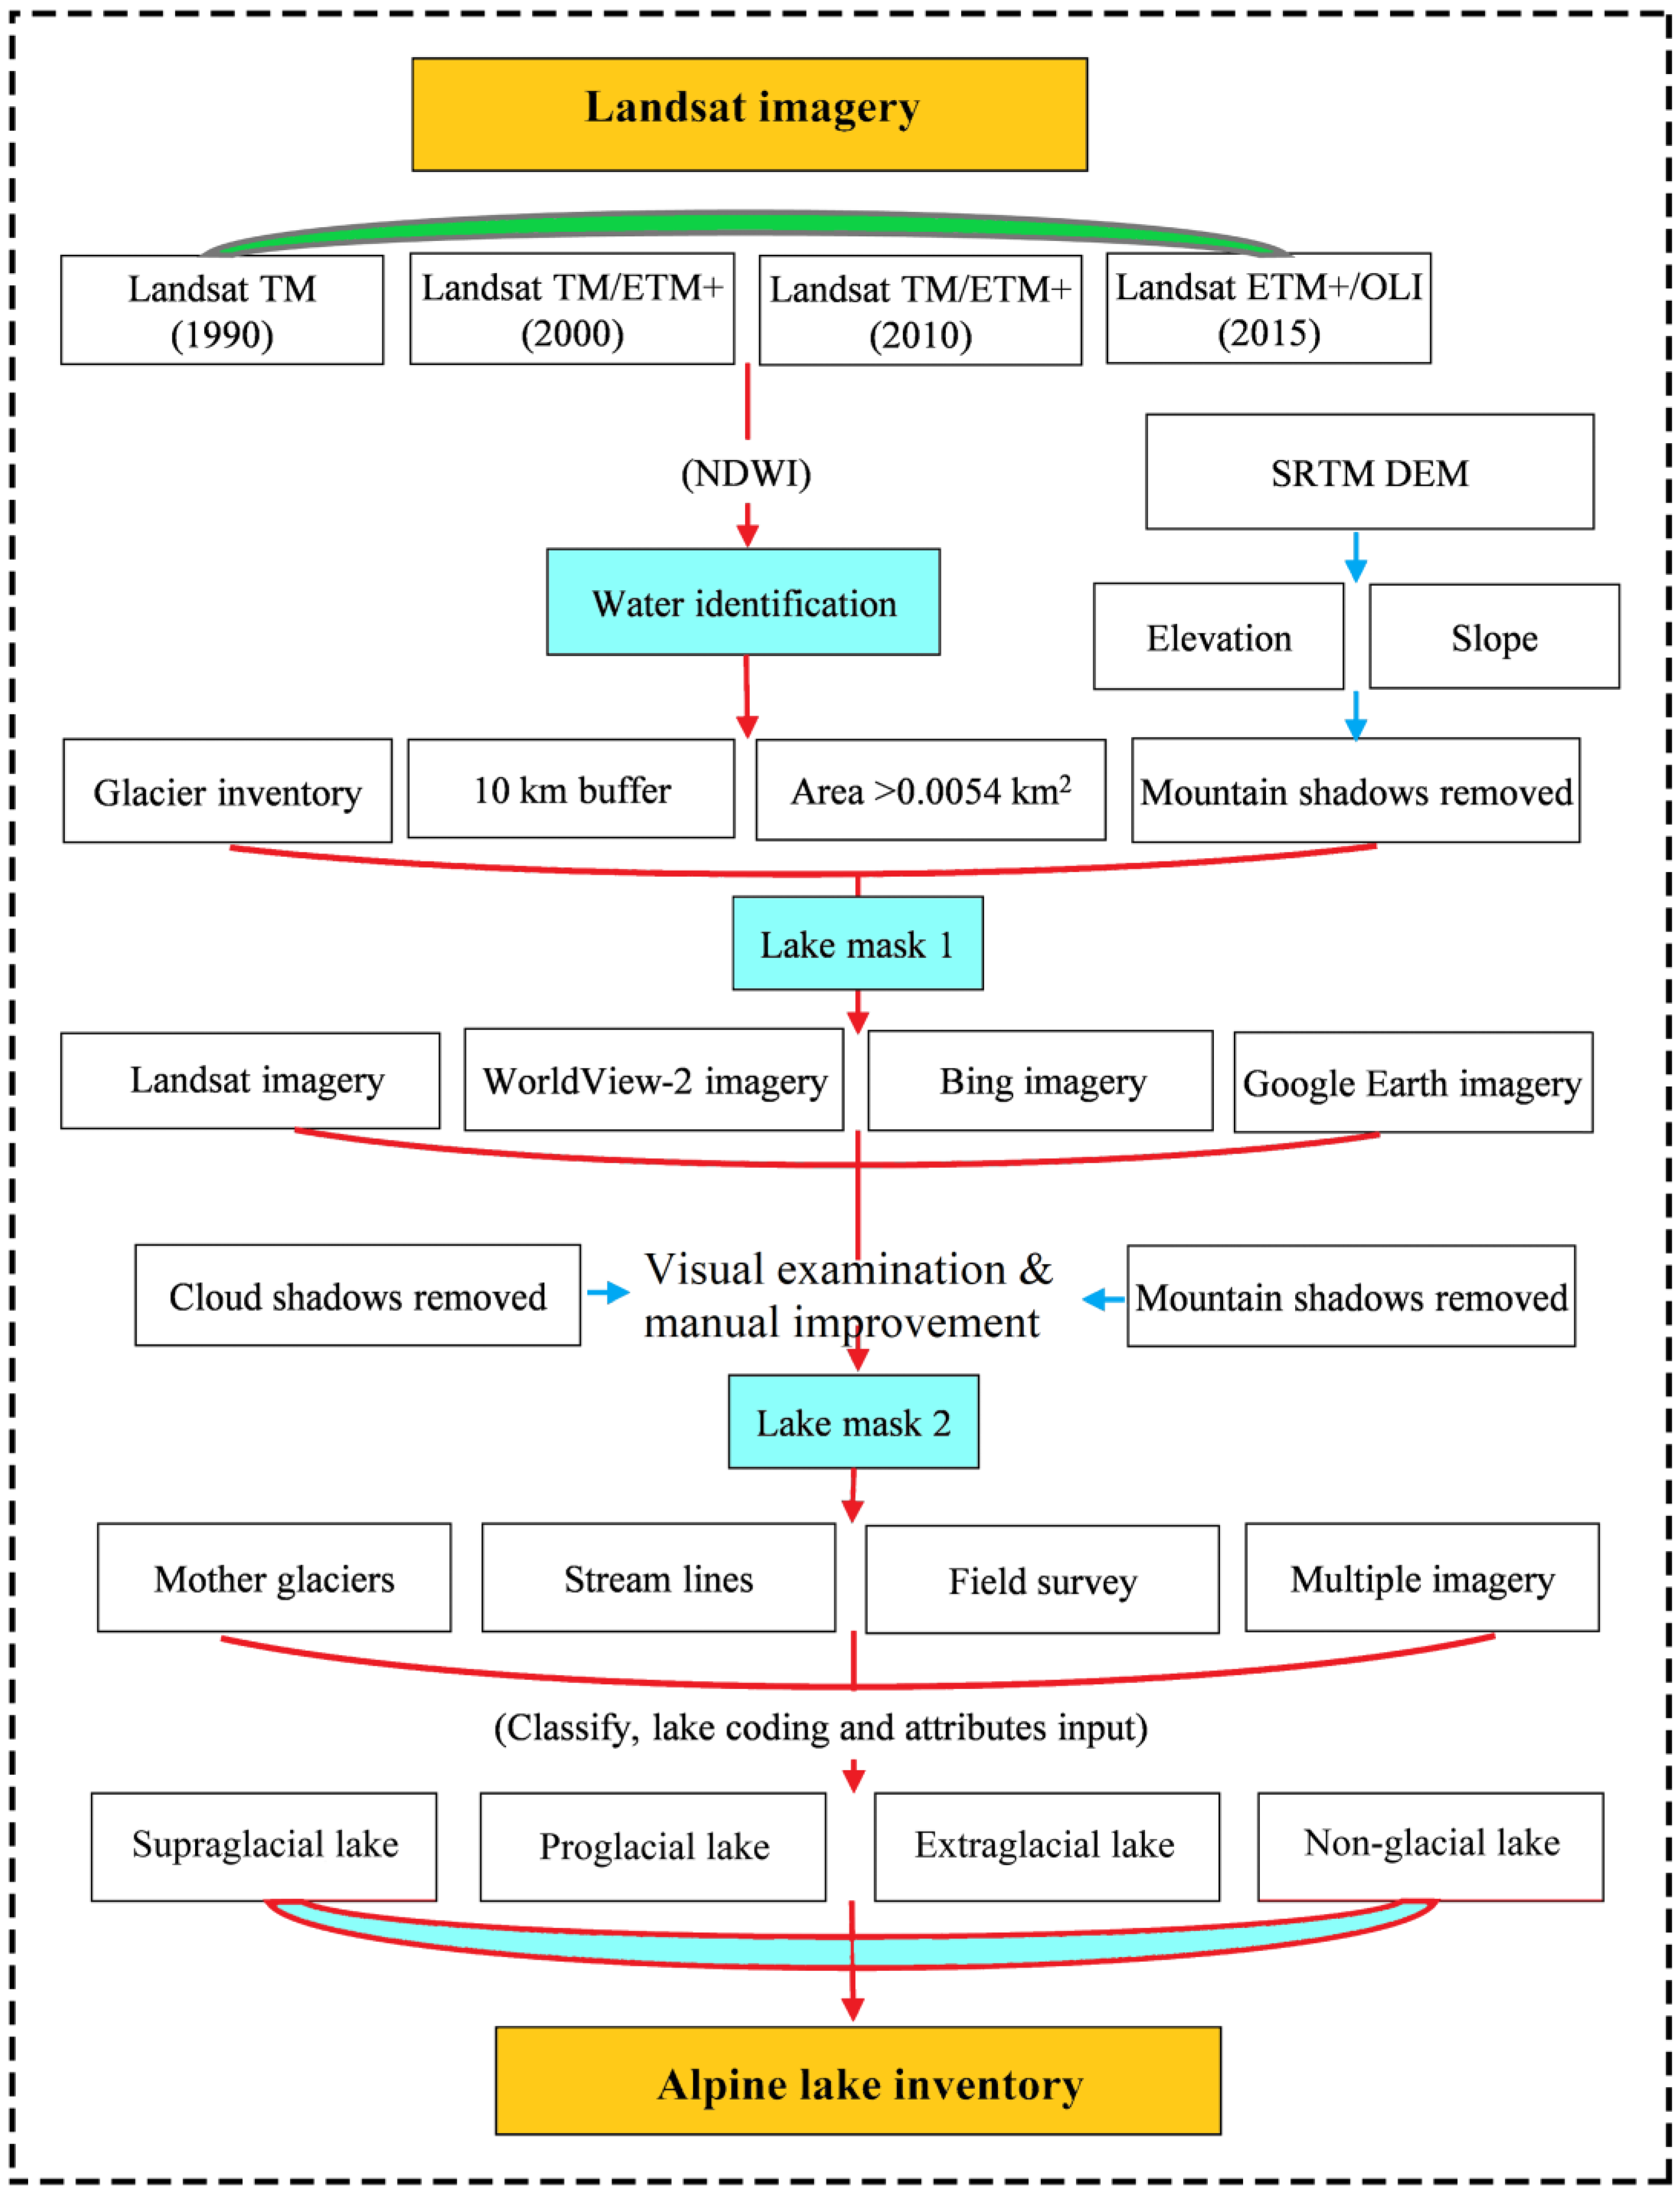
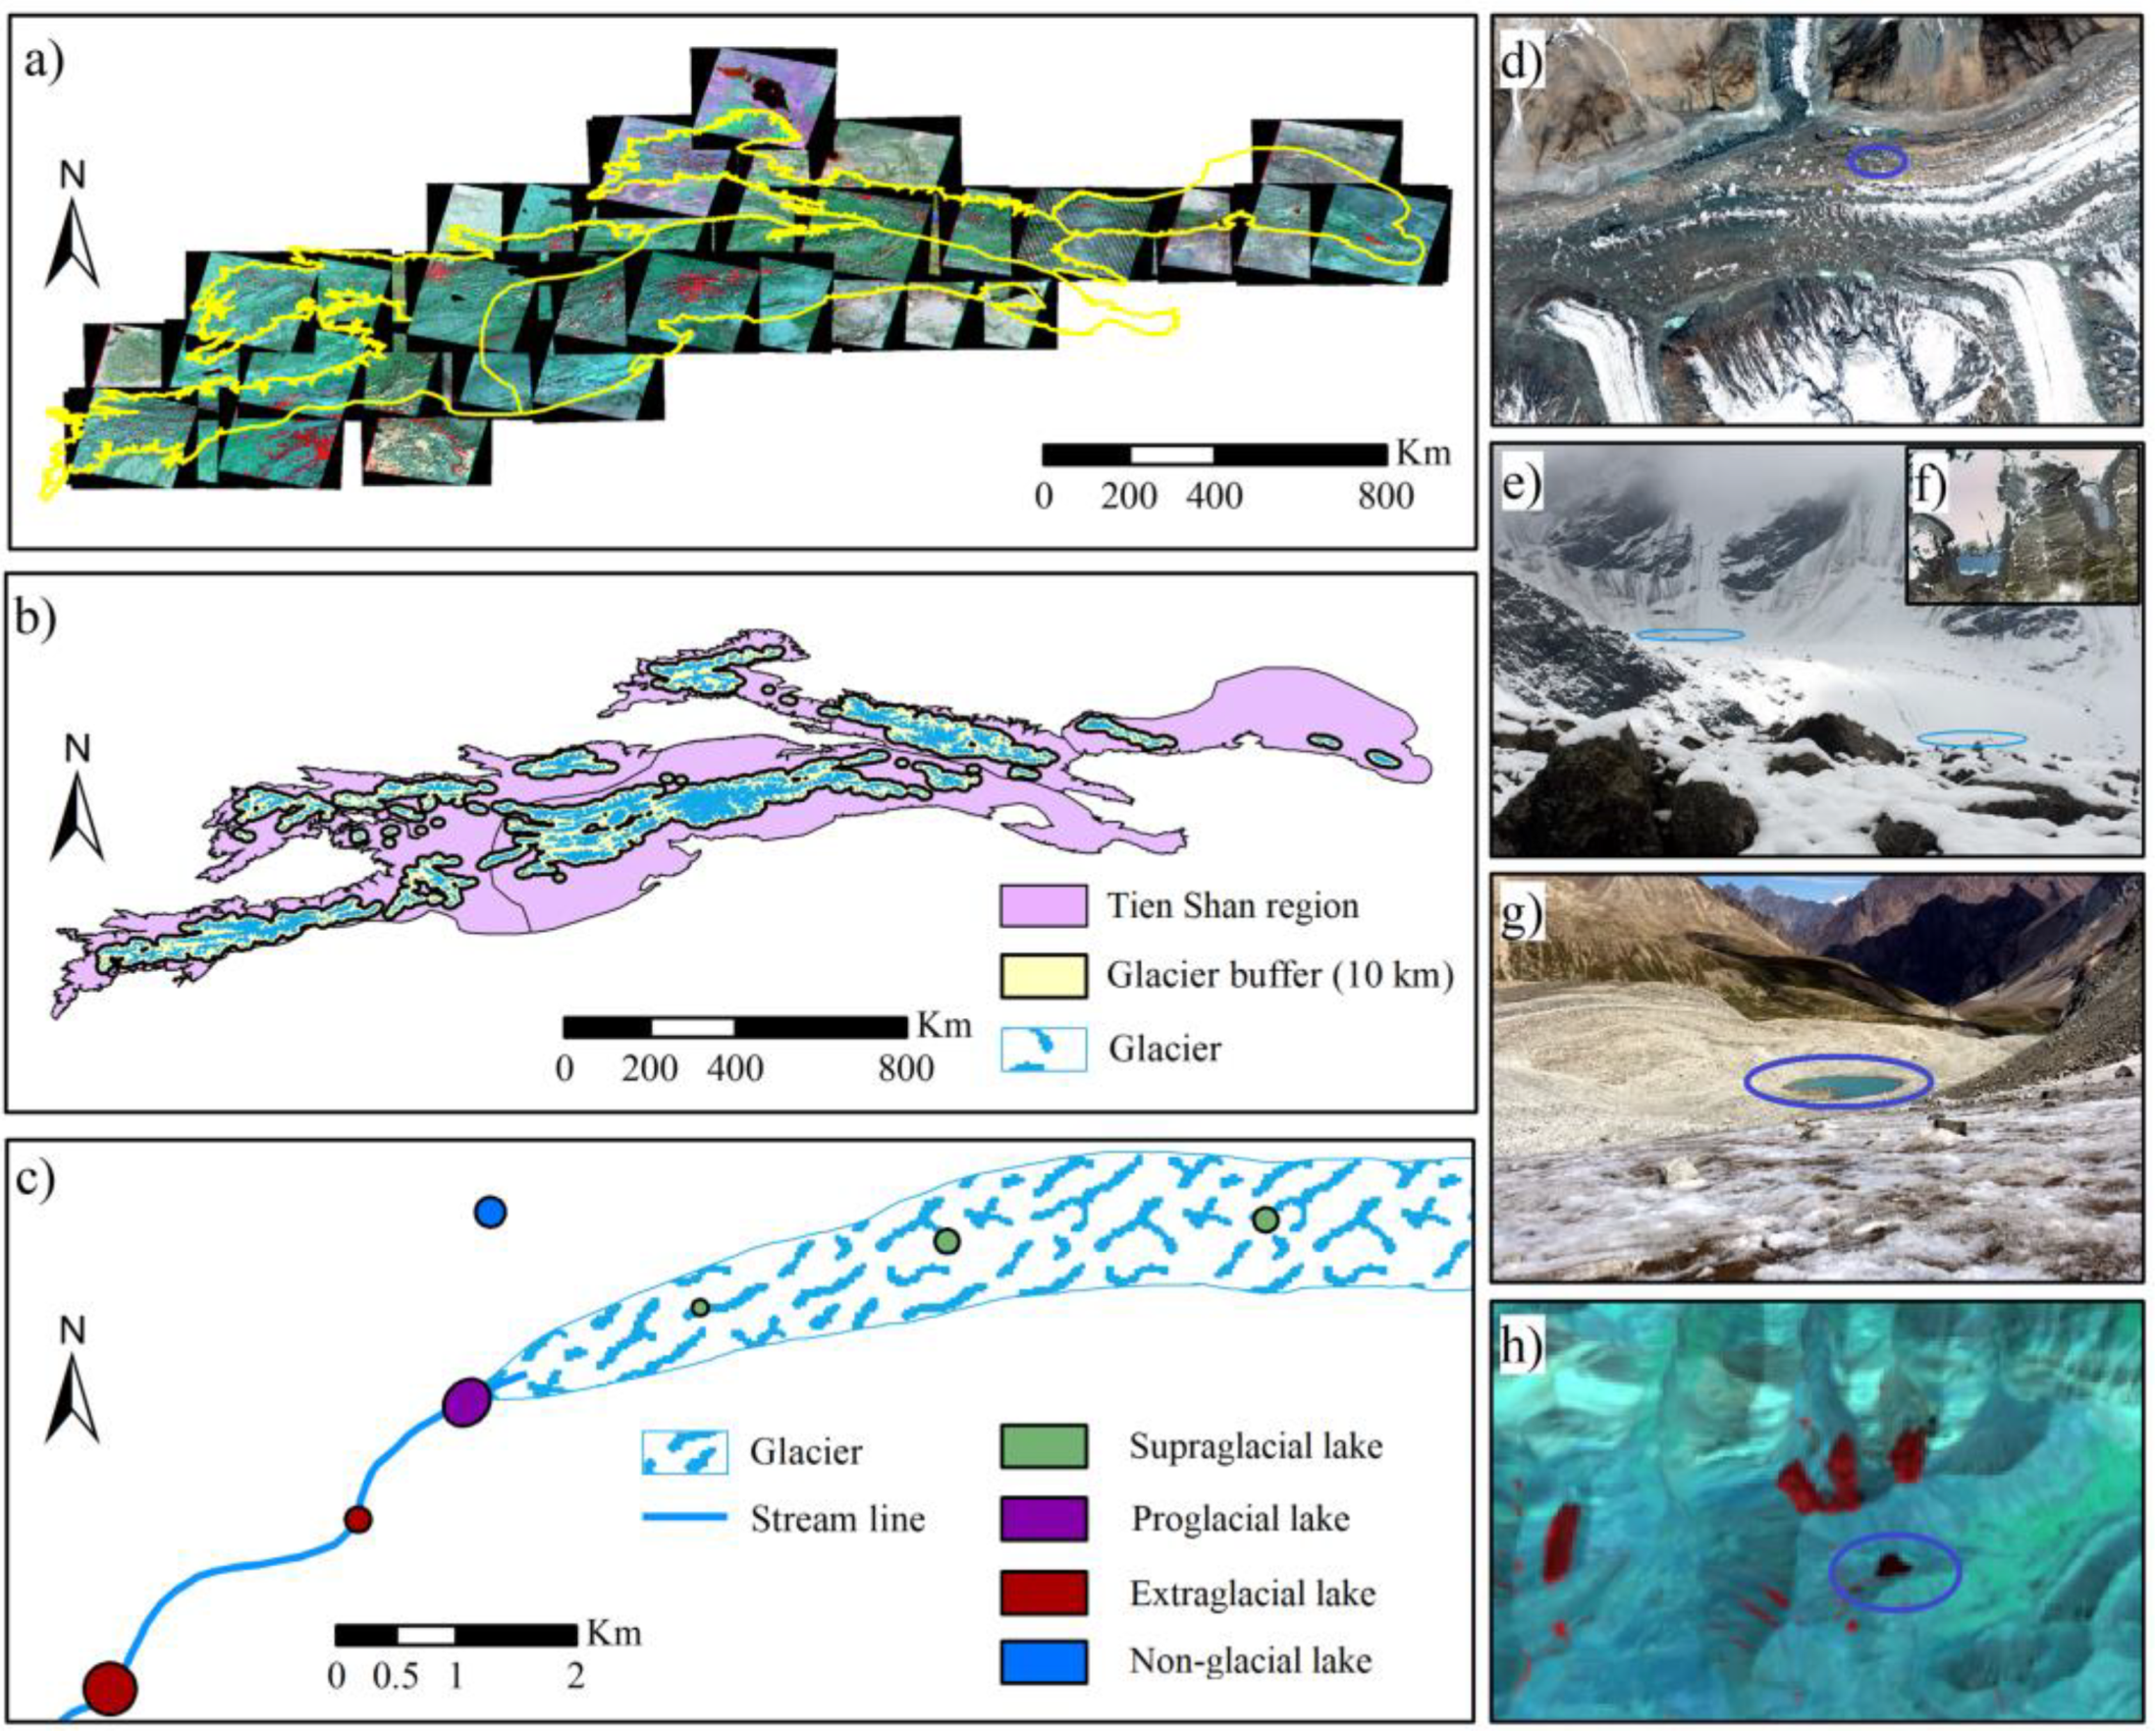
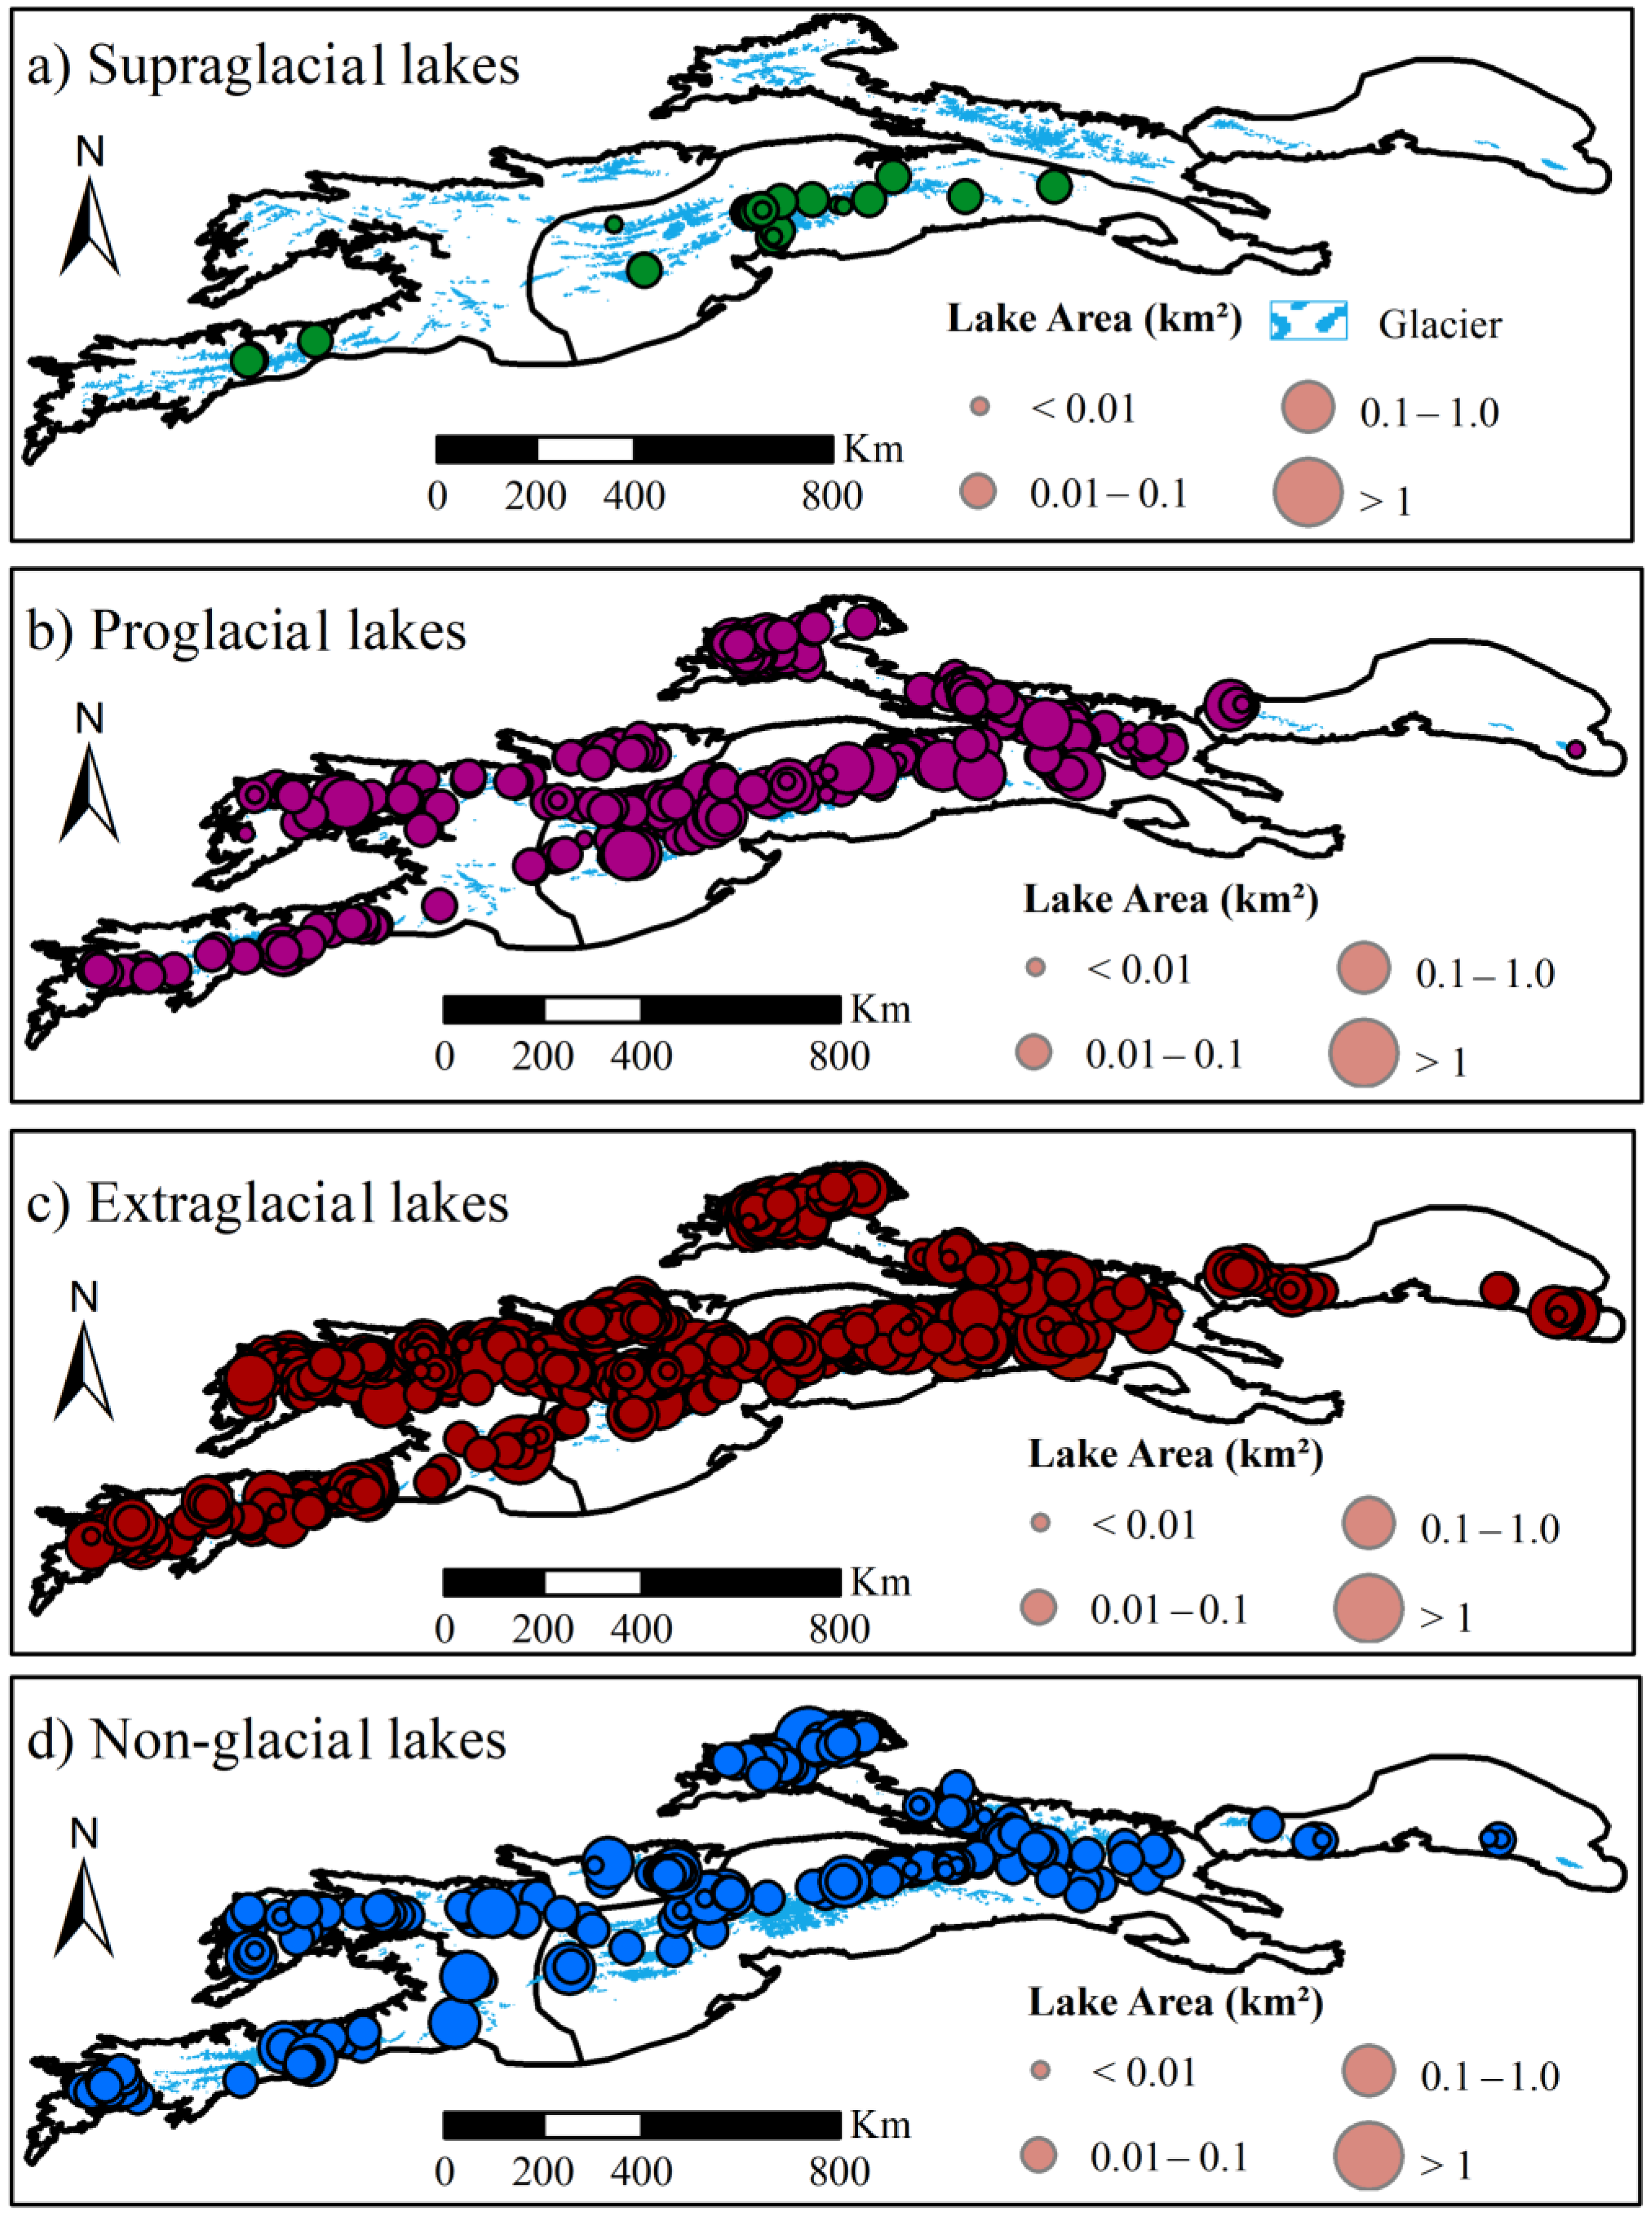
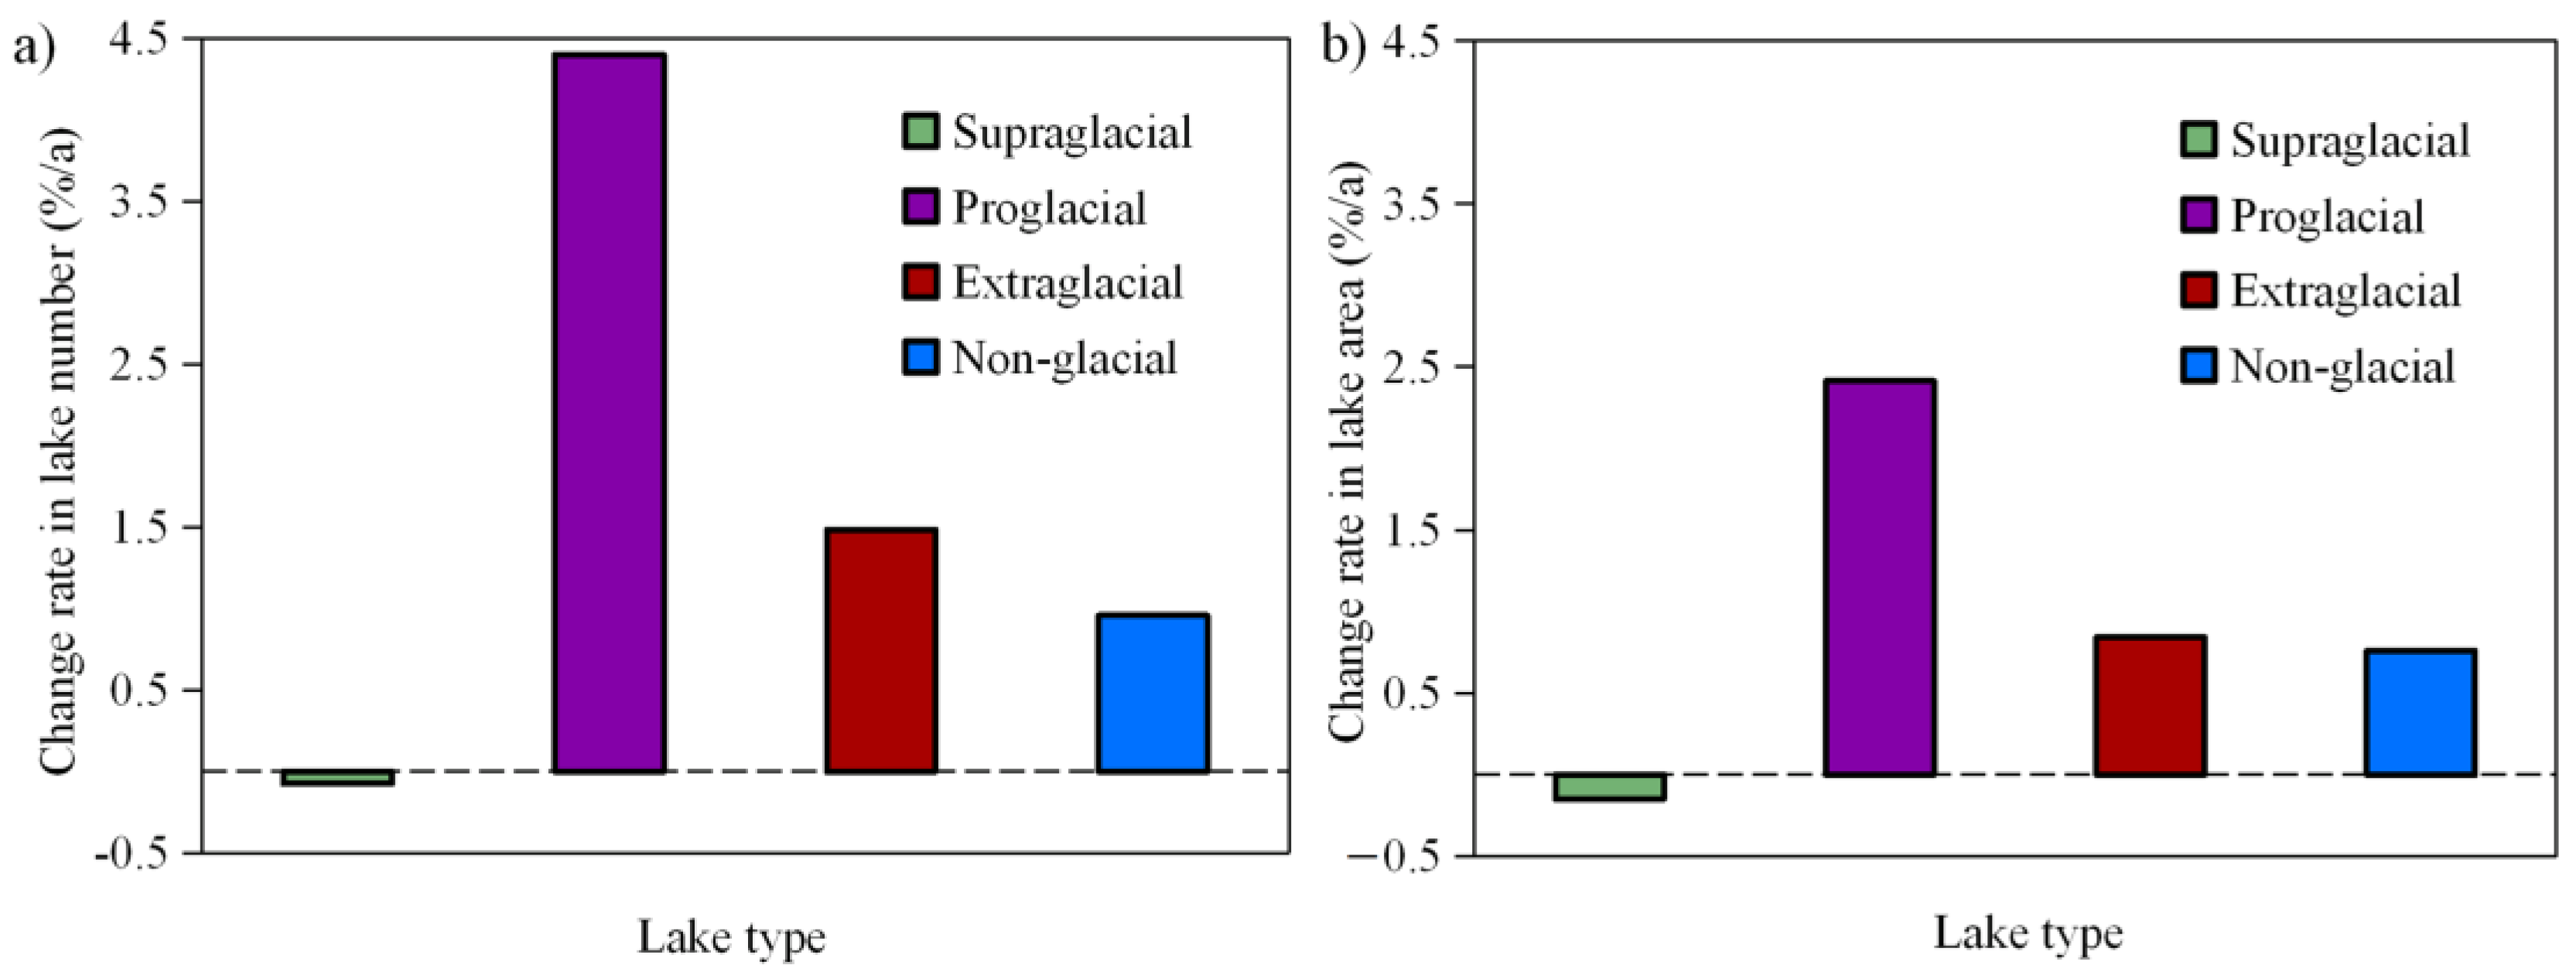
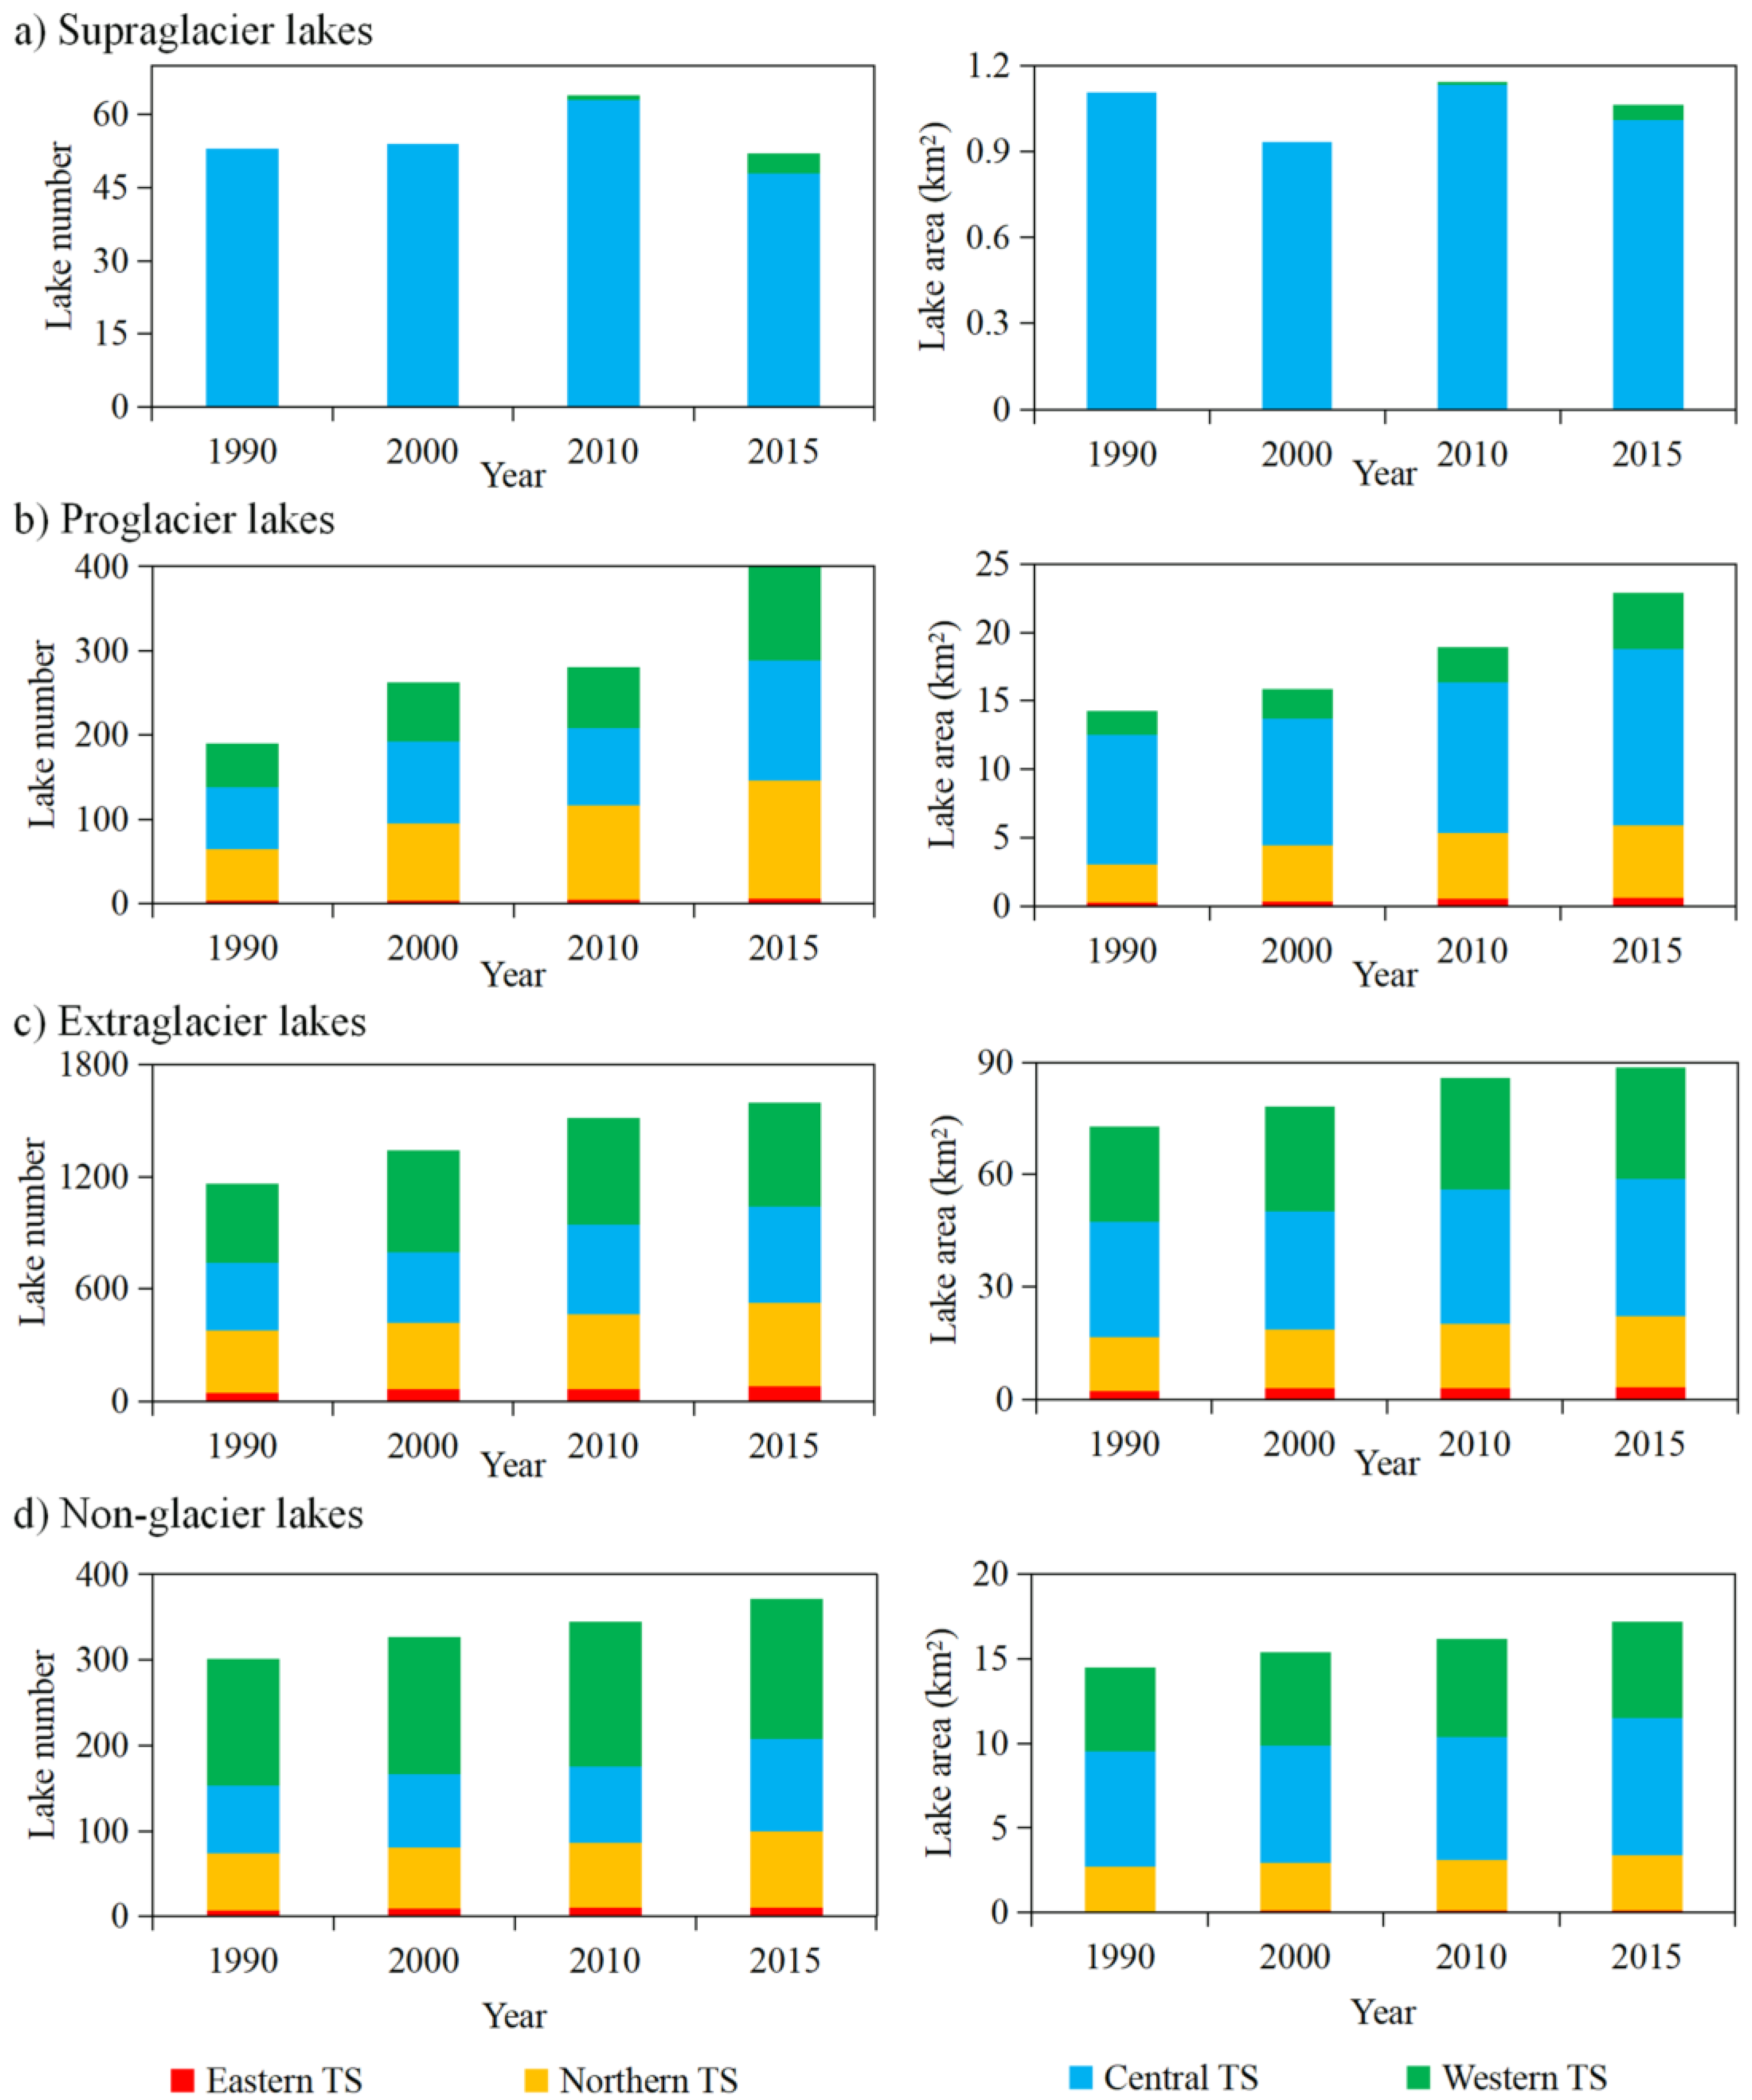
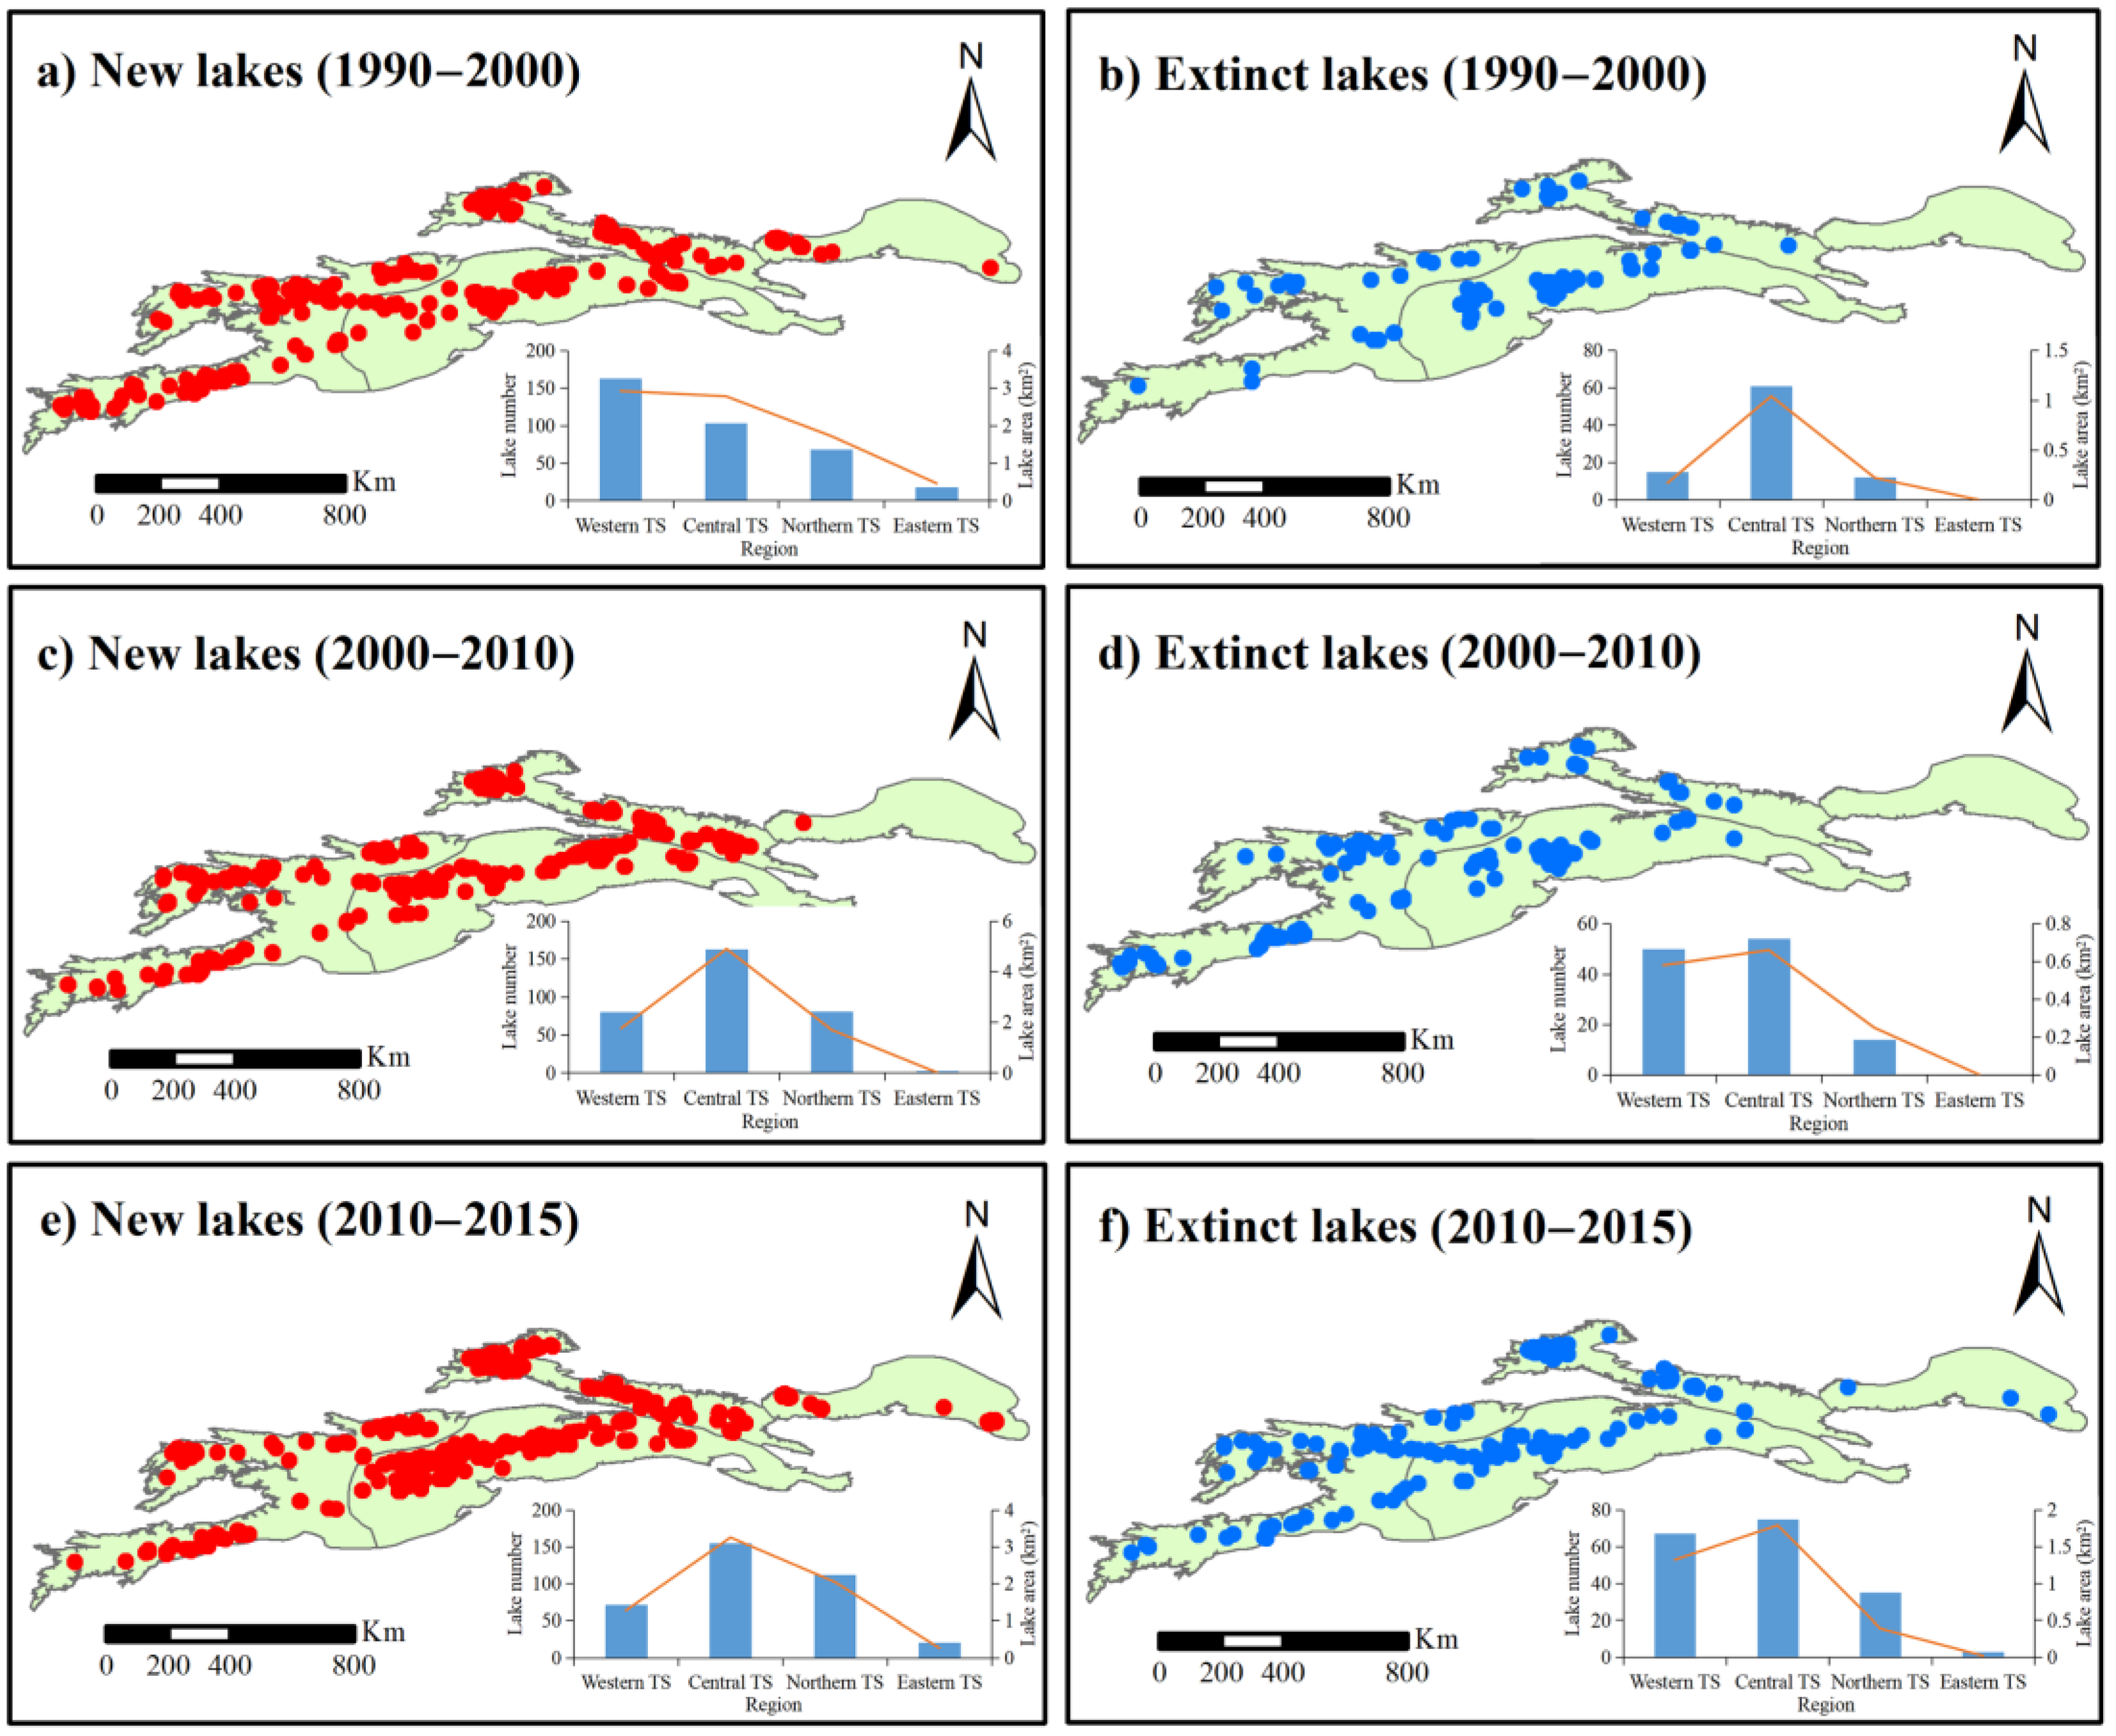
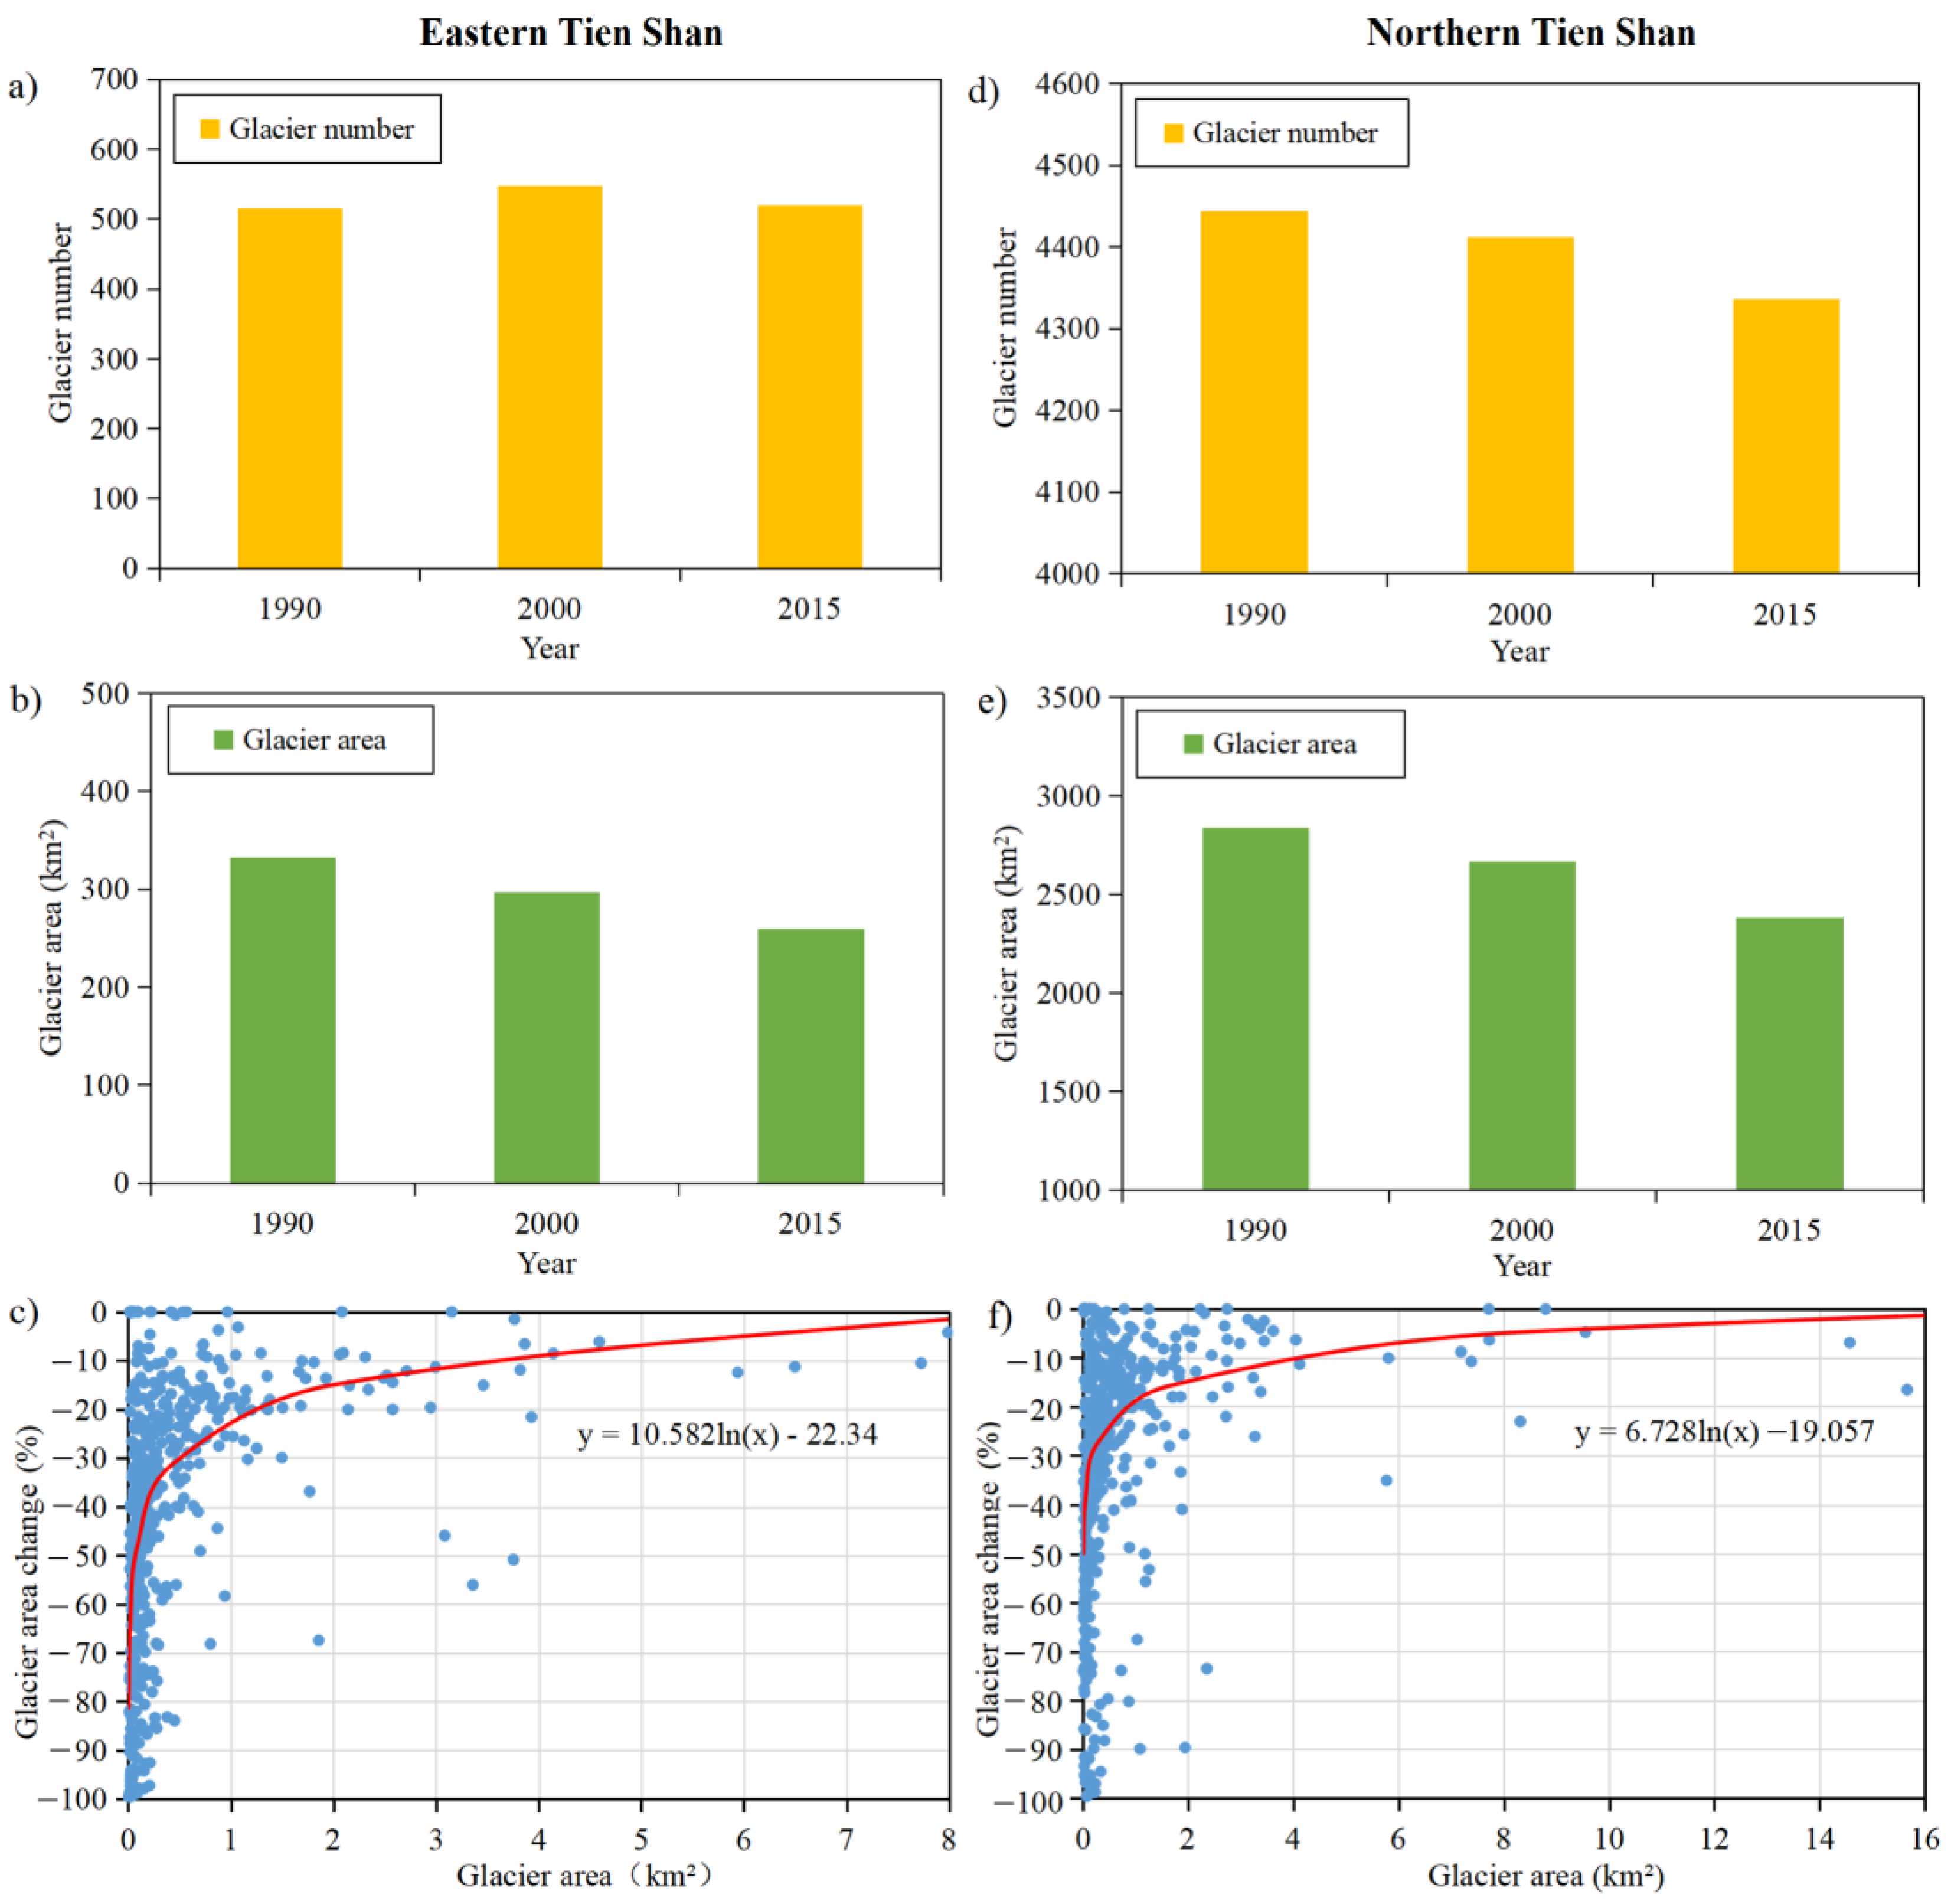
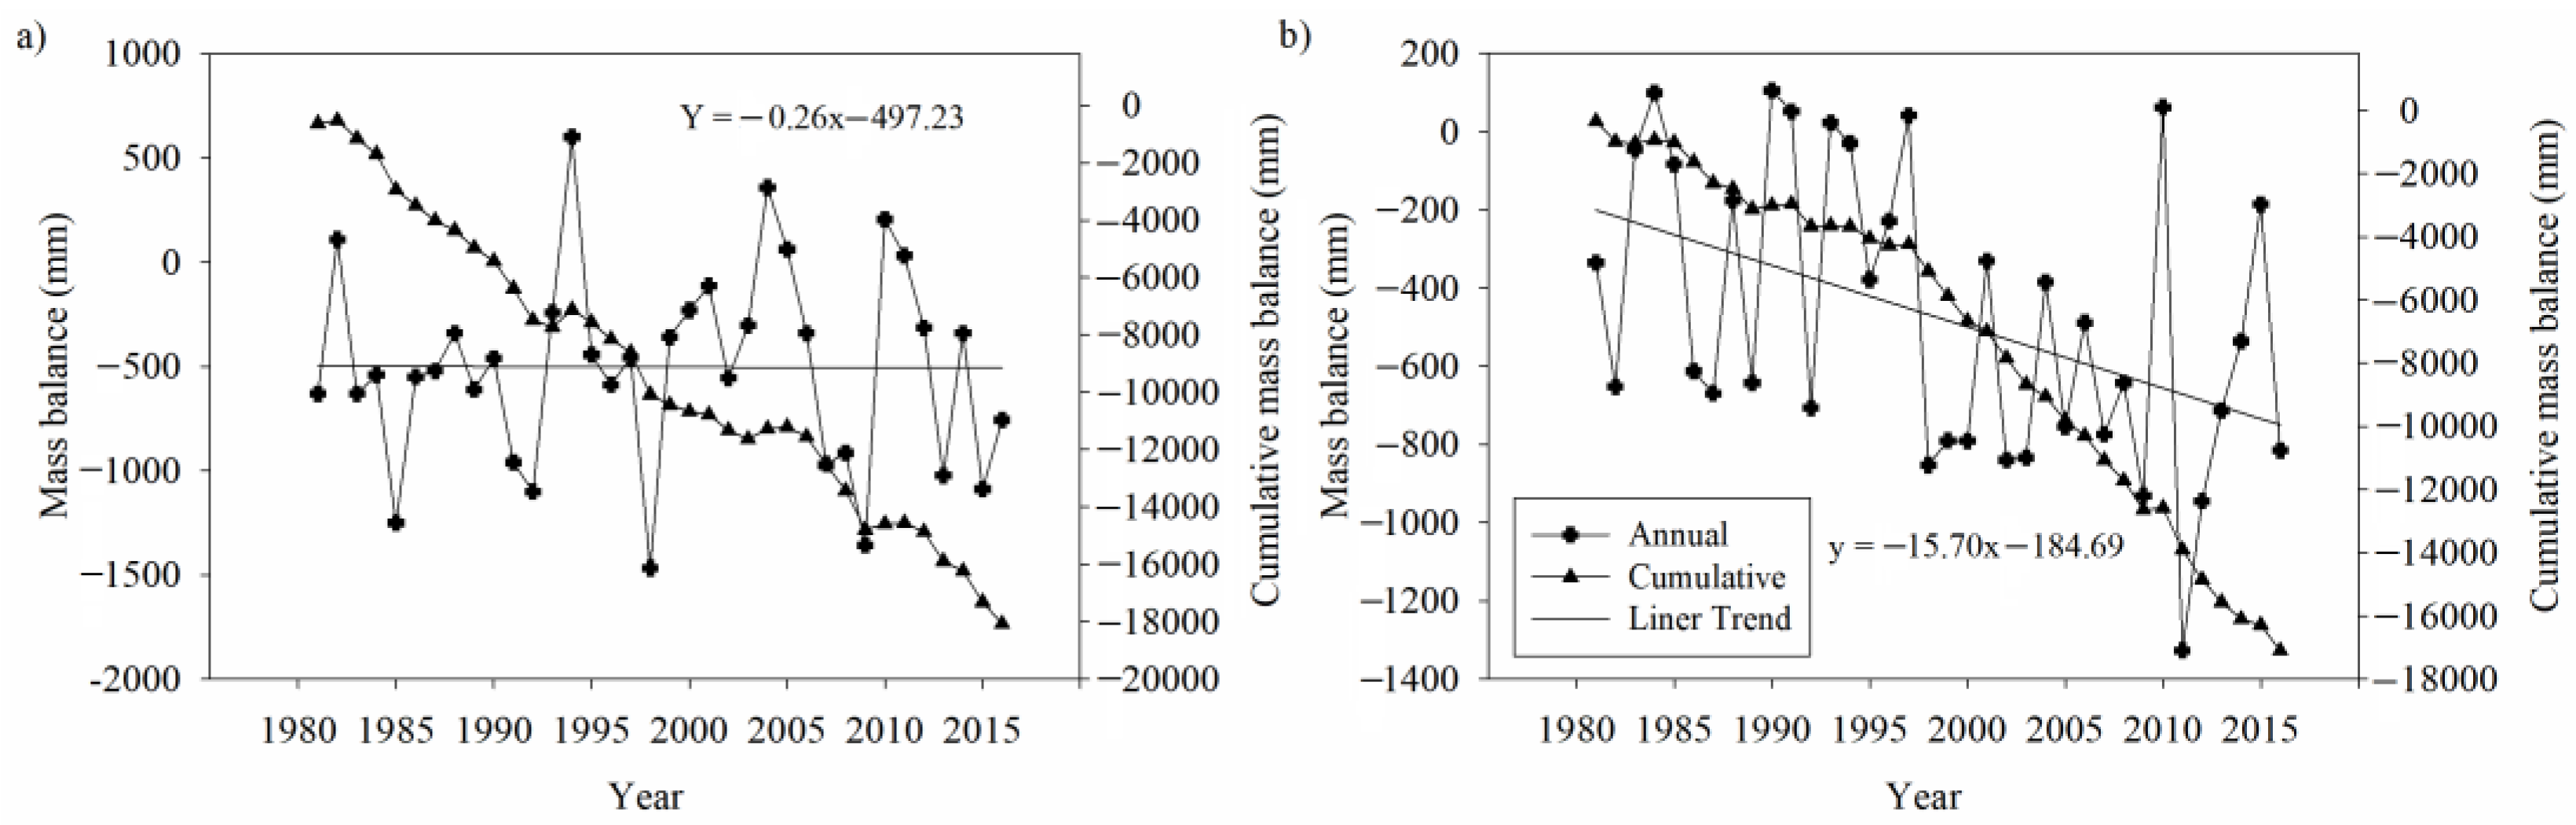
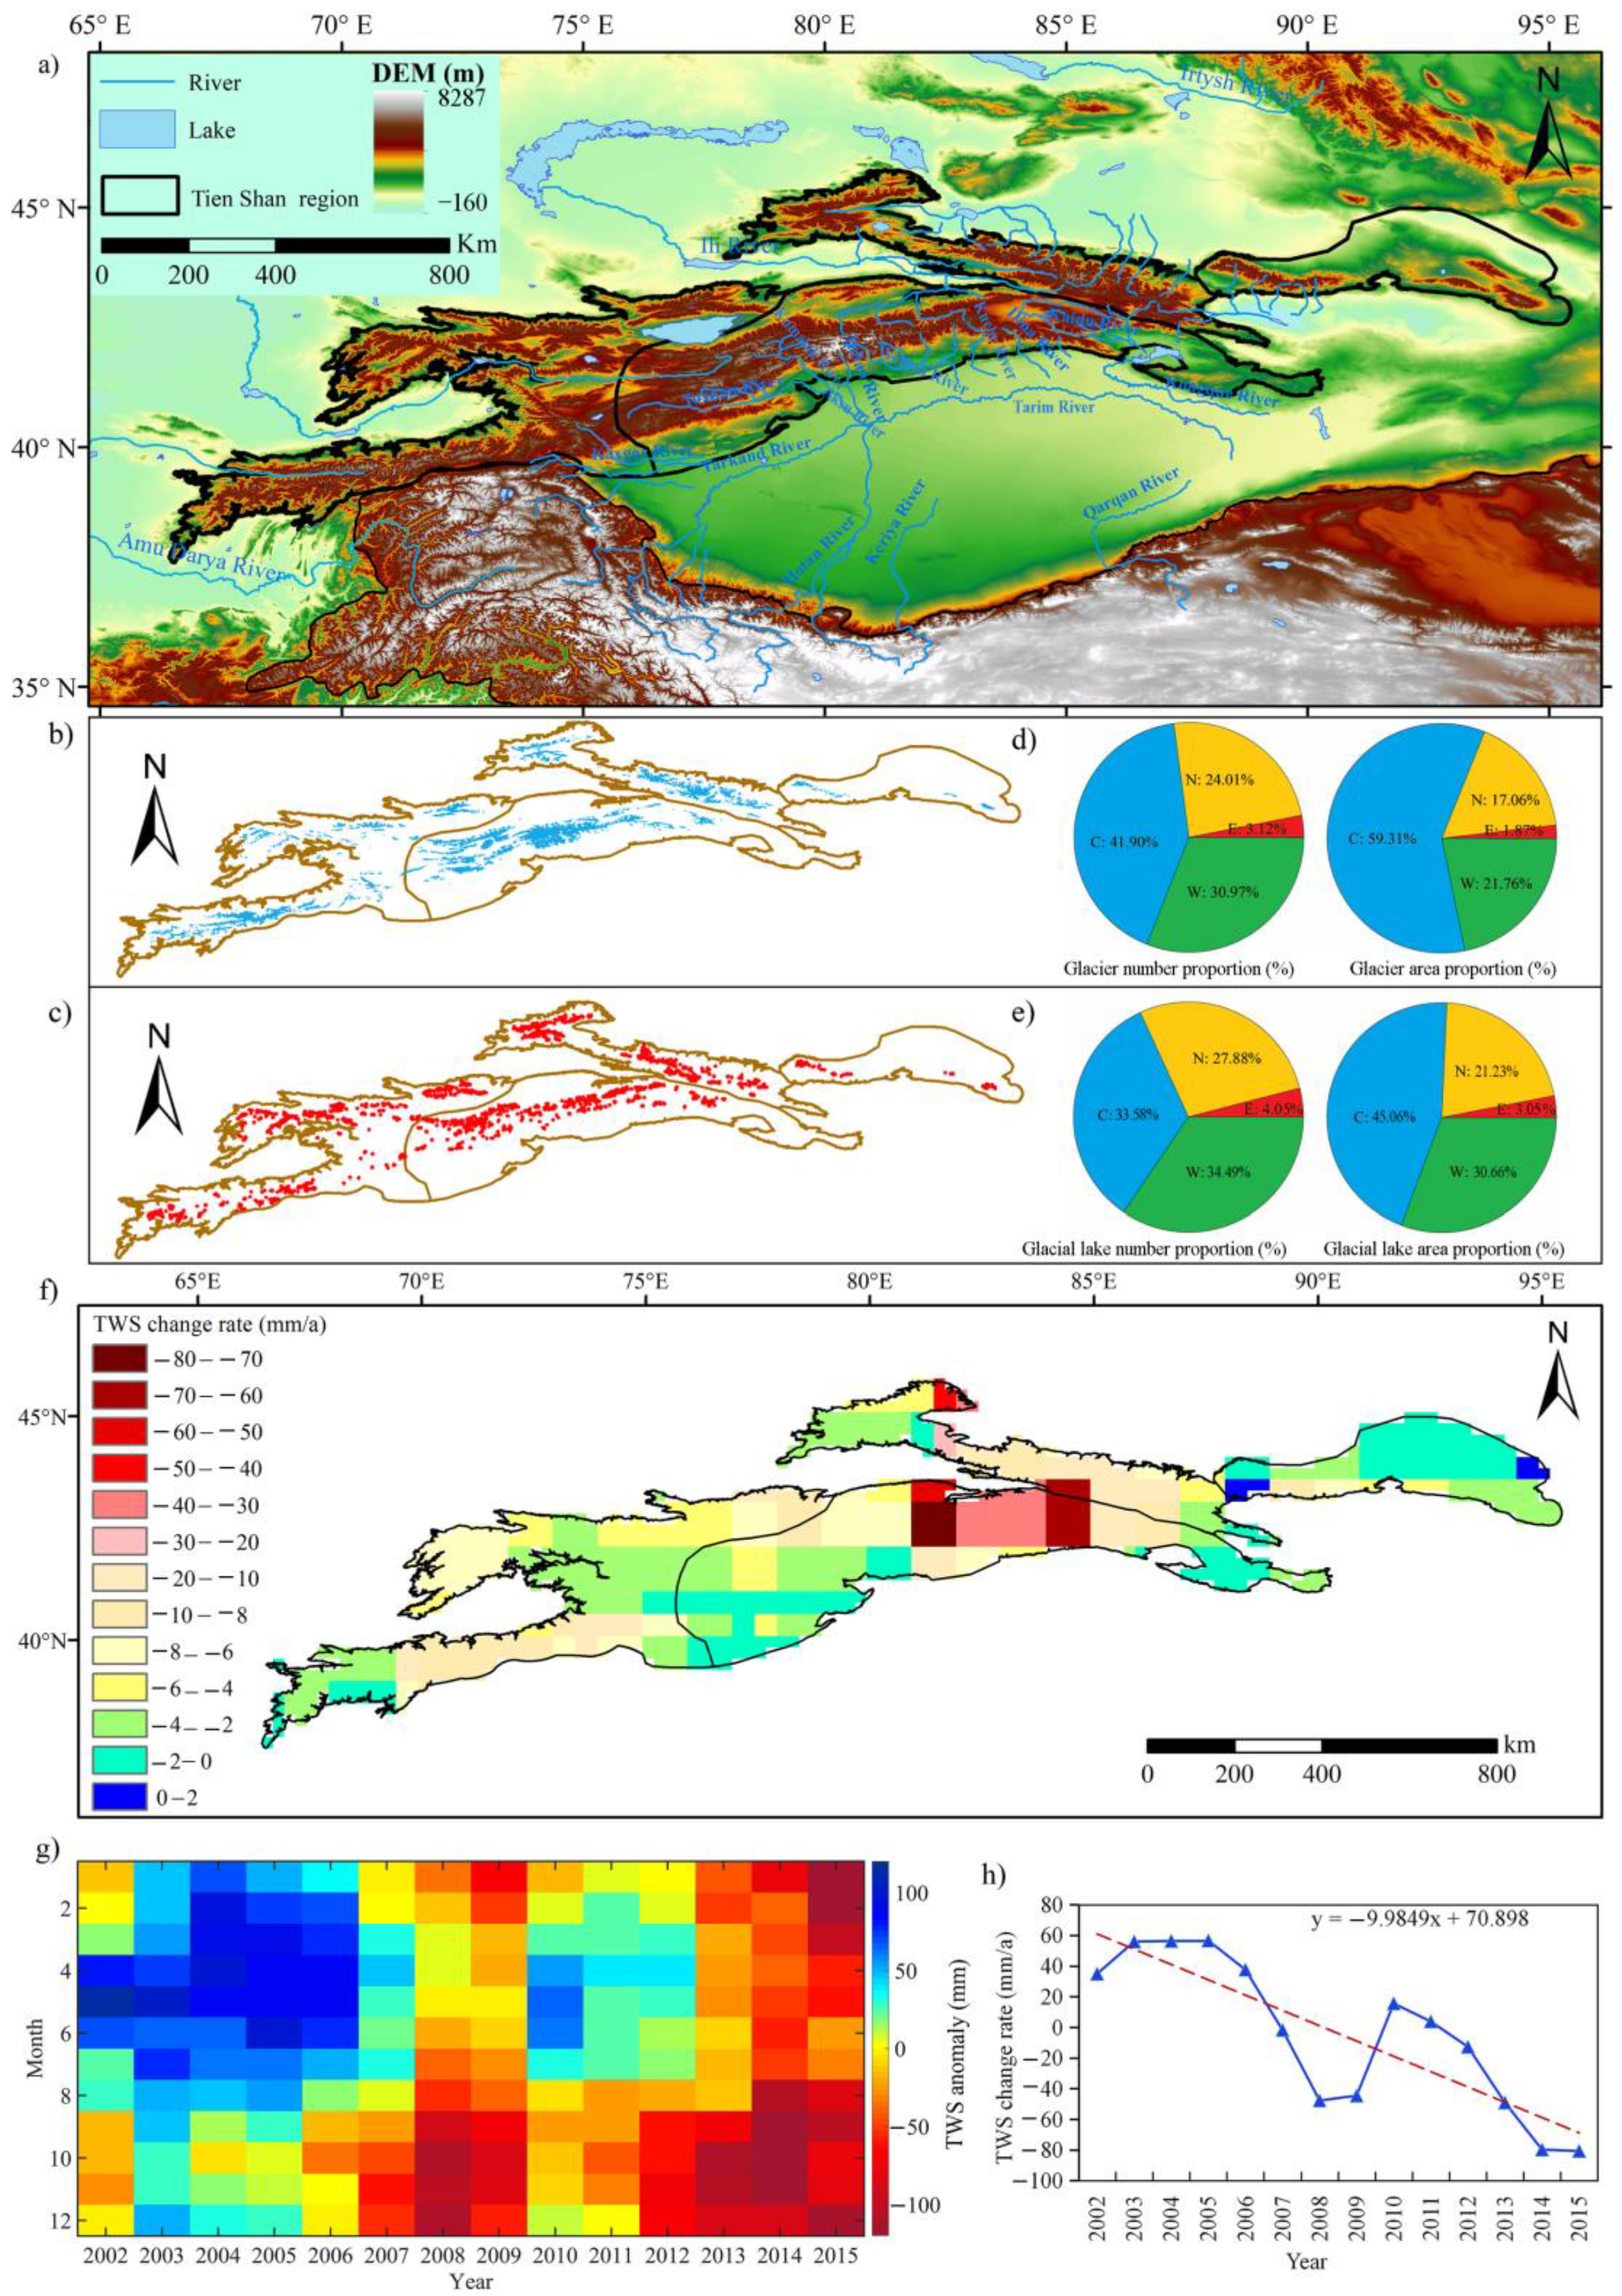
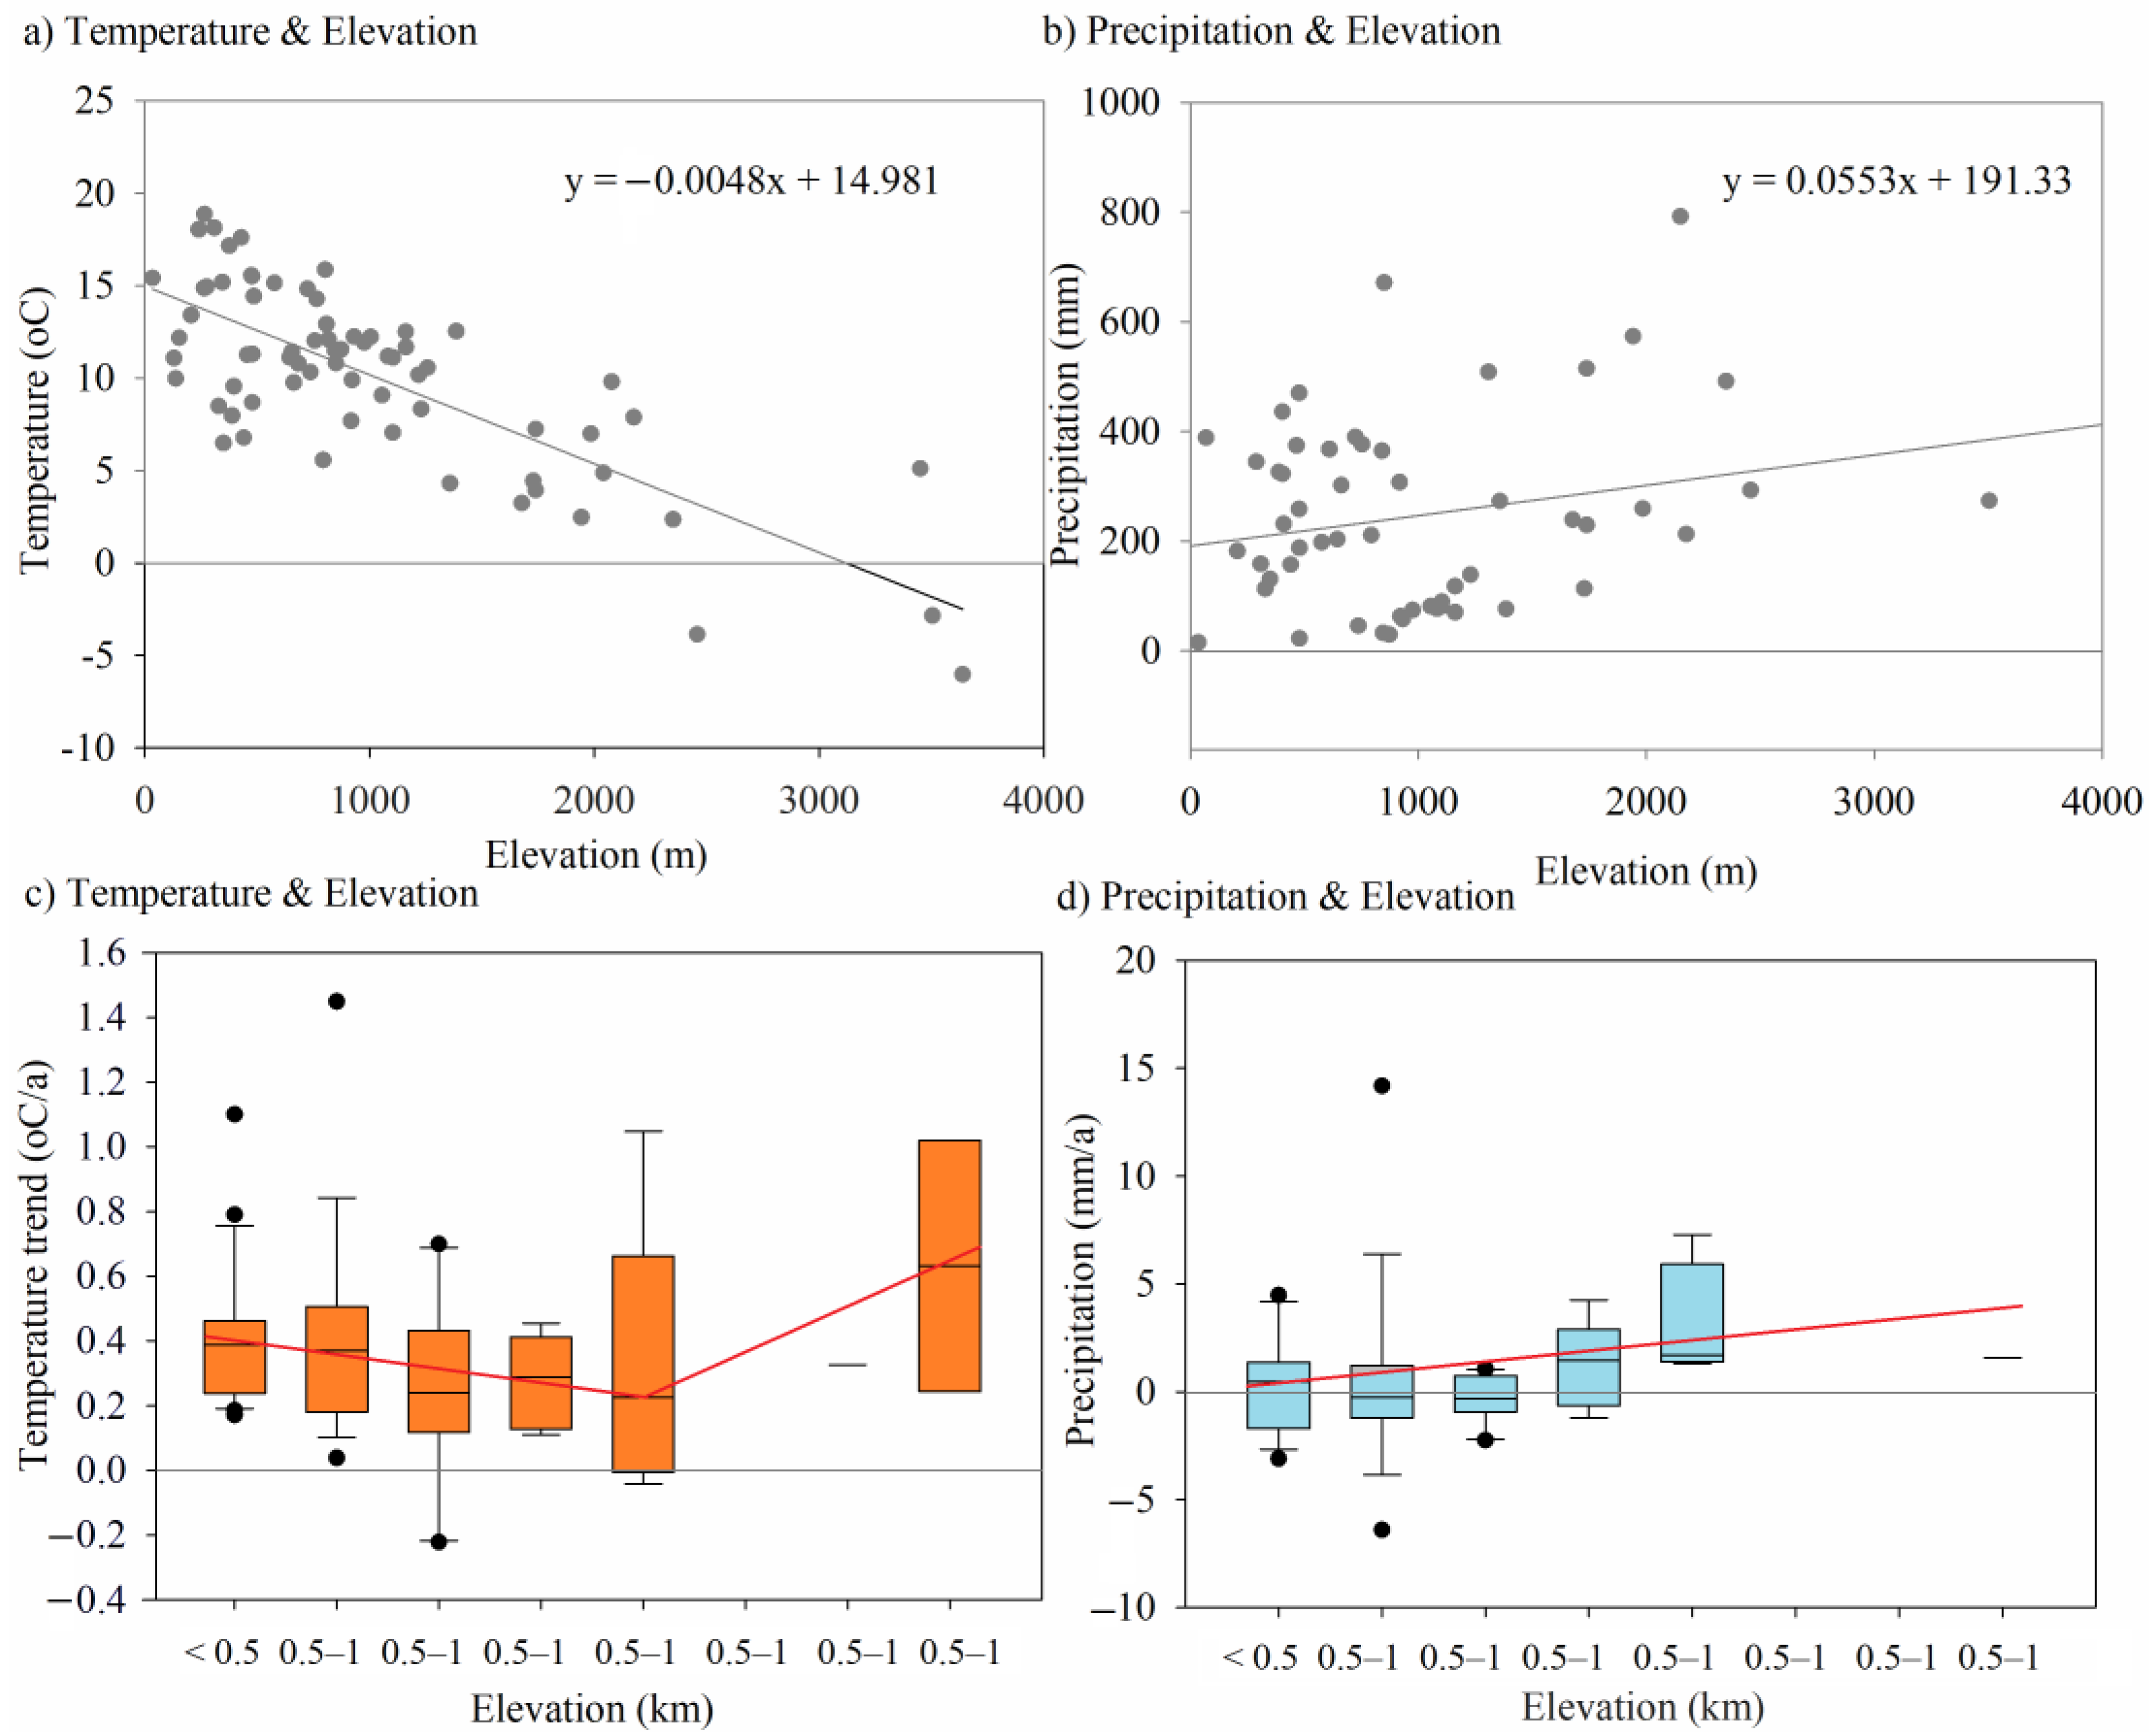
Table 1.
The geographic characteristics of the TS, Central Asia.
| Mountains | Eastern | Northern | Central | Western | Total |
|---|---|---|---|---|---|
| Region area (105 km2) | 0.82 | 0.87 | 2.10 | 2.12 | 5.91 |
| Glacier area proportion (%) | 0.33 | 2.81 | 4.01 | 1.46 | 2.41 |
| Mean glacier terminal altitude (m a.s.l.) | 3800 | 3696 | 3938 | 3824 | 3844 |
| Mean glacier median altitude (m a.s.l.) | 3990 | 3895 | 4169 | 4008 | 4051 |
| Mean glacial lake altitude (m a.s.l.) | 3450 | 3348 | 3611 | 3520 | 3500 |
| Mean single glacier area (km2) | 0.48 | 0.56 | 1.11 | 0.55 | 0.79 |
| Mean single glacial lake area (km2) | 0.04 | 0.04 | 0.07 | 0.06 | 0.05 |
| Elevation range (m a.s.l.) | 284~5099 | 1082~5246 | 966~7431 | 896~5667 | 284~7431 |
| Average elevation (m a.s.l.) | 1624 | 2521 | 2574 | 2570 | 2430 |
| Average annual temperature (°C) | 5.43 | −0.71 | 0.82 | 1.38 | 1.44 |
| Average annual precipitation (mm) | 142 | 289 | 242 | 468 | 315 |
Note: Glacier data used the newly published Randolph Glacier Inventory (6.0) from 2017. The average annual temperature and precipitation data in the entire TS region was calculated from the ERA5 land and GPCC datasets.
Table 2.
Lake statistics of different types of lakes in the TS during 2015.
| Lake Type | Number | Area (Km2) | Average Elevation (m a.s.l.) |
|---|---|---|---|
| Supraglacial lake | 52 | 1.06 | 3462 |
| Proglacial lake | 399 | 22.88 | 3469 |
| Extraglacial lake | 1597 | 88.61 | 3491 |
| Non-glacial lake | 373 | 17.20 | 3368 |
| Total | 2421 | 129.76 | 3500 |
Table 3.
New and disappeared glacial lake number and area during 1990–2000, 2000–2010 and 2010–2015.
Table 3.
New and disappeared glacial lake number and area during 1990–2000, 2000–2010 and 2010–2015.
| Periods | Eastern | Northern | Central | Western | Total | |||||
|---|---|---|---|---|---|---|---|---|---|---|
| Number | Area | Number | Area | Number | Area | Number | Area | Number | Area | |
| New lakes | ||||||||||
| 1990–2000 | 18 | 0.46 | 68 | 1.72 | 103 | 2.78 | 163 | 2.92 | 352 | 7.88 |
| 2000–2010 | 1 | 0.01 | 81 | 1.69 | 163 | 4.89 | 80 | 1.76 | 325 | 8.35 |
| 2010–2015 | 21 | 0.26 | 112 | 2.04 | 155 | 3.25 | 71 | 1.27 | 359 | 6.82 |
| Disappeared lakes | ||||||||||
| 1990–2000 | 0 | 0.00 | 12 | 0.22 | 61 | 1.04 | 15 | 0.17 | 88 | 1.44 |
| 2000–2010 | 0 | 0 | 14 | 0.25 | 54 | 0.66 | 50 | 0.58 | 118 | 1.49 |
| 2010–2015 | 2 | 0.02 | 35 | 0.39 | 75 | 1.79 | 67 | 1.32 | 179 | 3.52 |
Table 4.
Change rates in mean annual temperature, precipitation and the areas of different types of alpine lake from 1990 to 2015.
Table 4.
Change rates in mean annual temperature, precipitation and the areas of different types of alpine lake from 1990 to 2015.
| Region | Temperature Trend | Precipitation Trend | Supraglacial Lake Trend | Proglacial Lake Trend | Extraglacial Lake Trend | Non-Glacial Lake Trend |
|---|---|---|---|---|---|---|
| (°C/10 a) | (mm/10 a) | (%/a) | (%/a) | (%/a) | (%/a) | |
| Eastern TS | 0.32 | 5.9 | / | 6.47 | 2.00 | 1.75 |
| Northern TS | 0.28 | 5.3 | / | 3.49 | 1.29 | 1.03 |
| Central TS | 0.31 | 13.4 | −0.35 | 1.44 | 0.74 | 0.73 |
| Western TS | 0.28 | −16.0 | / | 5.51 | 0.67 | 0.62 |
Publisher’s Note: MDPI stays neutral with regard to jurisdictional claims in published maps and institutional affiliations. |
© 2022 by the authors. Licensee MDPI, Basel, Switzerland. This article is an open access article distributed under the terms and conditions of the Creative Commons Attribution (CC BY) license (https://creativecommons.org/licenses/by/4.0/).
Share and Cite
MDPI and ACS Style
Zhang, Q.; Chen, Y.; Li, Z.; Fang, G.; Xiang, Y.; Li, Y. Controls on Alpine Lake Dynamics, Tien Shan, Central Asia. Remote Sens. 2022, 14, 4698. https://doi.org/10.3390/rs14194698
AMA Style
Zhang Q, Chen Y, Li Z, Fang G, Xiang Y, Li Y. Controls on Alpine Lake Dynamics, Tien Shan, Central Asia. Remote Sensing. 2022; 14(19):4698. https://doi.org/10.3390/rs14194698
Chicago/Turabian StyleZhang, Qifei, Yaning Chen, Zhi Li, Gonghuan Fang, Yanyun Xiang, and Yupeng Li. 2022. "Controls on Alpine Lake Dynamics, Tien Shan, Central Asia" Remote Sensing 14, no. 19: 4698. https://doi.org/10.3390/rs14194698
Note that from the first issue of 2016, this journal uses article numbers instead of page numbers. See further details here.