Technical Note

Radiant Power Patterns Inferred from Remote Sensing Using a Cloud Computing Platform, during the 2021 Fagradalsfjall Eruption, Iceland

by
Muhammad Aufaristama
1,*,
Armann Hoskuldsson
2,3,
Mark van der Meijde
1,
Harald van der Werff
1,
William Michael Moreland
3,4 and
Ingibjorg Jonsdottir
3,4
1
Department of Applied Earth Sciences, Faculty of ITC, University of Twente, P.O. Box 6, 7500 AA Enschede, The Netherlands
2
Nordic Volcanological Center, Institute of Earth Sciences, University of Iceland, Sturlugata 7, 102 Reykjavík, Iceland
3
Institute of Earth Sciences, University of Iceland, Sturlugata 7, 102 Reykjavík, Iceland
4
Faculty of Earth Sciences, University of Iceland, Sturlugata 7, 102 Reykjavík, Iceland
*
Author to whom correspondence should be addressed.
Remote Sens. 2022, 14(18), 4528; https://doi.org/10.3390/rs14184528
Submission received: 5 July 2022 / Revised: 19 August 2022 / Accepted: 7 September 2022 / Published: 10 September 2022

Abstract

:
The effusive eruption at Mt. Fagradalsfjall began on 19 March 2021 and it ended a period of about 800 years of volcano dormancy on the Reykjanes Peninsula. To monitor and evaluate power output of the eruption, we compiled in total 254 freely available satellite images from Terra MODIS and Landsat 8 OLI-TIRS via the Google Earth Engine platform over a six-month period. This cloud computing platform offers unique opportunities for remote sensing data collection, processing, analysis, and visualizations at a regional scale with direct access to a multi-petabyte analysis-ready data catalogue. The average radiant power from the lava during this time was 437 MW, with a maximum flux of 3253 MW. The intensity thermal power output of the 2021 Fagradalsfjall (3253 MW) is in marked contrast to radiant power observed at the 2014–2015 Holuhraun Iceland (11956 MW) where, while both eruptions also hosted active lava pools and channel, Holuhraun exhibited a much greater variability in radiant power over the same period of time. We performed Spearman correlation coefficient (SCC). Our results show a positive correlation (0.64) with radiative power from the MODVOLC system, which suggests that both results follow the same general trend. The results provide a unique temporal data set of heat flux, hosted, and processed by a cloud computing platform. This enabled the rapid assessment of eruption evolution via a cloud computing platform which can collect and process time series data within minutes.

1. Introduction

On 19 March 2021, the Fagradalsfjall volcano began to erupt, ending a period of 781 years of dormancy on the Reykjanes Peninsula, Iceland [1,2]. The eruption of Geldingadalir within the Mt. Fagradalsfjall volcanic complex (Figure 1) was preceded by an intensive earthquake swarm lasting one month in the Fagradalsfjall region [3]. The lava field was created by basaltic fissure eruptions and formed a lava flow field covering 4.8 km2, with a bulk volume of 0.15 km3 [4]. This eruption presents an opportunity to use satellite-based remote sensing to improve our understanding of the basaltic effusive eruption. Here, we present an application of freely available satellite imagery in combination with recent cloud computing technology for inferring eruptive activity based on power output from the eruption. We show how real-time satellite monitoring of the Fagradalsfjall eruption can provide the rapid information needed related to volcano power output.

Background

Volcanic activity involves processes that can change in a short time, such as an explosive activity, fumarole emissions associated with lava ascent, or the opening of an effusive vent. These processes are often related to eruption pattern or style or the timing of their transition [6]. An eruption is the ejection of high-temperature materials such as magma or gas to the surface; therefore, the ejection of these materials may be detectable as a thermal energy by using infrared observations [6]. The thermal energy emitted by erupting volcanoes is a proxy for temporal variations in the intensity of those eruptions [7], which is an important part of analyzing the eruption pattern or state and an efficient method of characterizing eruption sequences. The thermal energy has also been shown to correlate with the mass of lava required to produce that energy [7,8,9]. While this flux is difficult to measure in situ, satellite remote sensing is presently an essential part for monitoring eruption activity of most active volcanoes. Thus, many studies have correlated spectral radiance on satellites (or parameters derived from such measurements) related to volcanic processes, including volcanic gas emissions [10], effusion rates [11,12,13,14,15], dome growth cycle and explosive failure [13,16], temperature estimation [17,18], volume estimation [19,20], and heat flux [7,21,22,23]. Radiant power is one of the most straightforward heat fluxes to estimate by satellite remote sensing [24]. It requires a measurement of the target temperature, the temperature of the area surrounding the target or ambient temperature, and the area of the target. These main parameters can be extracted from remote sensing data collected by satellite-borne sensors. Radiant power has also been shown to act as a reliable proxy for general levels of volcanic eruption activity around the world, particularly when these temporal coverages are of a long duration [22].
Recent improvements in remote sensing data management and cloud computing have opened opportunities to develop a cloud-based platform for automated processing of time series remote sensing data for volcanic applications [25]. Google Earth Engine (GEE) is one of the tools that offers possibilities for remote sensing data access, processing, analysis, and visualizations at a global scale [25,26]. GEE consists of a high-performance computing service with direct access to a multi-petabyte analysis-ready data catalogue. This cloud-based platform has the advantage of straightforward and efficient processing of large volumes of remote sensing data [26] and an ability to derive temporal maps and other GIS-based products without the time investment and cost intensive resources required for traditional methods. In this letter, we focus on using freely available space-based remote sensing data hosted by the GEE platform. By building up a high-density temporal time series of the power output during the effusive eruption, this study will analyze the effusive eruption that occurred in Fagradalsfjall from 19 March 2021 to 18 September 2021 (referred as the “The 2021 Fagradalsfjall eruption”) using the Terra Moderate Resolution Imaging Spectroradiometer (MODIS) and Landsat-8 Operational Land Imager (OLI)/Thermal Infrared Sensor (TIRS) sensors. We show the radiant power from the 2021 Fagradafjall eruption varied over this six-month period. Although the 2021 Fagradalsfjall eruption was one of the most well monitored eruptions in Iceland (in-situ) [4], the method of using freely available satellite data with the GEE platform is expected to offer a novel approach for near real-time eruption monitoring without expensive computational resources, time, and data management.

2. Data and Methods

2.1. High Temporal-Low Spatial Resolution Satellite

We used analysis ready data from Terra MODIS level 3 fire radiative power (FRP) to estimate radiative power from the active lava. This product is tile based, with each product file spanning one of the 460 MODIS tiles, 326 of which contain land pixels [27]. All available acquisitions of MODIS FRP were obtained from the GEE [28] as a stack or sequence of images that are being used for time series analysis. The time series product of MODIS FRP provides daily fire mask composites at 1 km resolution derived from the MODIS 4 μm and 11 μm radiances band. Anomaly detection for this product is performed using a contextual algorithm that exploits the strong emission of mid-infrared radiation from thermal anomalies [27]. Although the main aim of this product is detecting fire, other thermal anomalies, such as volcanic eruptions, can also be identified. The nature of the relationship between temperature and spectral radiance means that although the spatial resolution of MODIS is coarse (1 km × 1 km), eruption activity much smaller than this can be detected and quantified [7]. The algorithm examines each pixel of the MODIS swath, and assigns to each pixel one of the following classes: missing data, cloud, water, non-thermal anomaly, and thermal anomaly. For each thermal anomaly pixel detected, the fire radiative power (FRP) within the pixel is estimated using the empirical relationship [29]:
F R P = ( 4.34 × 10 19   MWK 8   km 2 ) ( T 4 8 T 4 8 ¯ ) A
where T 4 is the 4-μm brightness temperature of the fire pixel, T ¯ 4 is the mean 4-μm brightness temperature of the non-fire background, and A is the total area of the MODIS pixel (1 km2) in which the thermal anomaly was detected. The resulting value of the FRP unit is expressed in MW.

2.2. Low Temporal-Medium Spatial Resolution Satellite

As a second step, a thermal and visual analysis of the multispectral data of the sensors Landsat 8 OLI/TIRS was performed regarding detectable volcanic activity: (1) volcanic ash and water vapor plumes and/or (2) thermal anomaly in the shortwave infrared (SWIR) and TIRS band, respectively. As with MODIS FRP, all available acquisitions of Landsat 8 OLI/TIRS were obtained from GEE as a stack or sequence of images for time series analysis. This dataset has 30 m spatial resolution with 16 days temporal resolution and had been calibrated for sensor radiance. The visual inspection of Landsat 8 OLI was performed using the band combination 7/6/5 (SWIR-2 λ = 2.20 μm/SWIR-1 λ = 1.60 μm/near-infrared (NIR) = 0.86 μm). Furthermore, for detection of thermal anomalies and area analysis we used the thermal eruption index (TEI) algorithm described in detail by [18]. The TEI algorithm combines radiances in band 6 (SWIR-1 = 1.60 μm) and band 10 (TIR-1 = 10.60 μm), respectively. This index uses the square of the TIR-1 spectral radiance and the maximum of the SWIR-1 spectral radiance to differentiate between the thermal domains, expressed as:
TEI = B 6 ( B 10 ) 2 10 ×   B 6 max B 6 + ( B 10 ) 2 10 ×   B 6 max ( B 10 ) 2 ( B 6 max 3 ) 2
where B 6 max   is the maximum value of spectral radiances detected in band 6 for each scene. A pixel is classified as a hotspot with a strong thermal anomaly if TEI > 0.51 or as a less intensive thermal anomaly if 0.1 < TEI < 0.51. In addition, we computed the total TEI of each detected thermal anomaly for each scene. Furthermore, by combining the thermal anomaly for each pixel detected by Landsat-8 OLI, we estimated the total hotspot area that correspond with TEI > 0.51. All the data collection and processing was performed under GEE.

2.3. Data Comparison

In this work, we refer to radiant power of the 2021 Fagradalsfjall eruption provided by MODIS Volcano alert (MODVOLC, http://modis.higp.hawaii.edu/ (accessed on 6 May 2022), [30]) for comparison. MODVOLC use two MODIS sensors, the Terra satellite and one on the Aqua satellite, to monitor the thermal anomaly on a daily basis. To detect thermal anomalies, MODVOLC implements the normalized thermal index (NTI), which is a ratio of the radiances measured by MODIS at 3.959 μm (MODIS Band 21/22) and 12.02 μm (Band 32) [31]. For each thermal anomaly pixel detected, radiative power within the pixel is estimated using a similar approach to Equation (1). We use the Spearman correlation Ccoefficient (SCC) to determine the strength of a relationship between these two sets of radiant power data.
Comparisons of radiant power were also made between the 2021 Fagradalsfjall and the 2014–2015 Holuhraun eruptions. These comparisons were made considering that the eruption had the same duration and basaltic effusive activity. We compare how these eruptions differ with regards to the amount of energy they radiate and how the total amount of energy released varies during the eruption.

3. Results

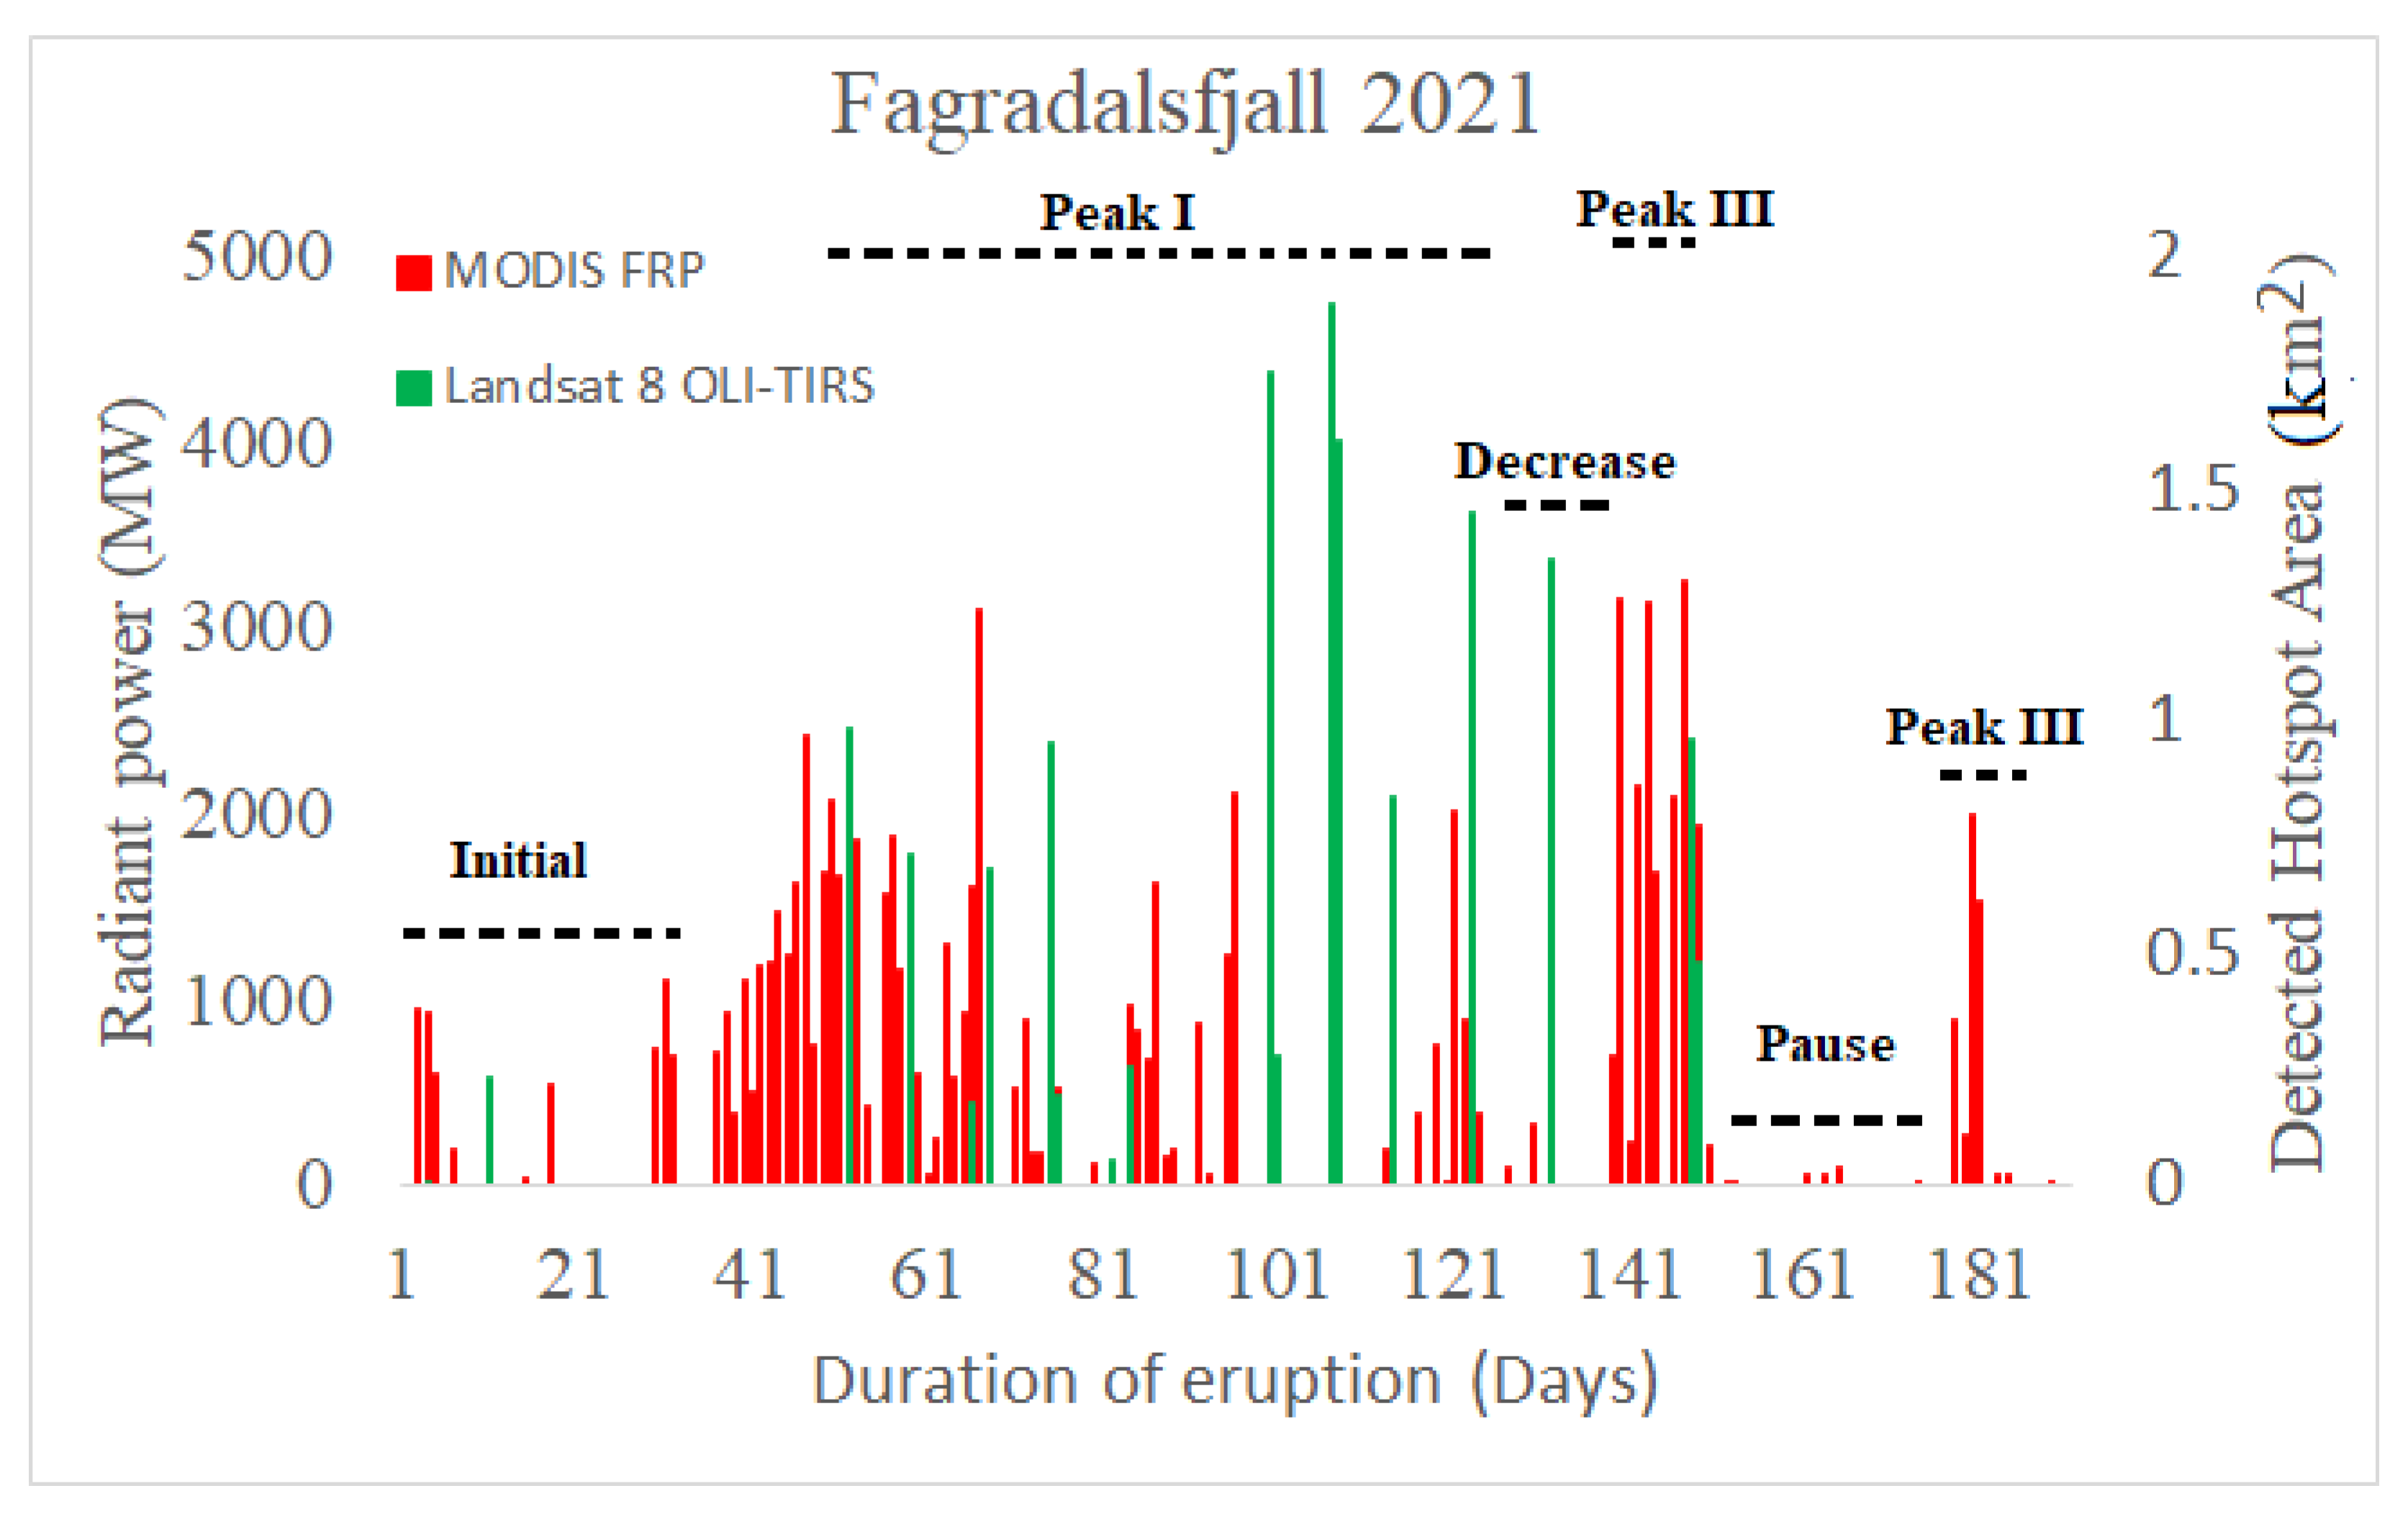
3.1. Radiant Power Pattern

Here, we identify long-term variations in this eruptive activity by focusing on the cumulative radiant power measured during each day. Figure 2 shows the temporal radiant power calculated for the 2021 Fagradalsfjall eruption constructed using 208 individual MODIS FRP images acquired between 19 March and 13 October 2021. The total amount of radiant power during the eruption was ca. 86,000 MW with a maximum of 3253 MW and an average of 454 MW. The time series shows the fluctuating level of heat flux that mostly was caused by partial cloud cover and volcanic plume. This period of eruptive pattern was divided into four stages (initial, peaks, decrease, and pause stages) based on the time-series analysis (Figure 2). The first thermal signature of volcanic activity in the area was detected on 23 March 2021 (day 5 of the eruption), this initial activity stabilized during the first 31 days of the eruption with a maximum of 947 MW and average of ca. 199 MW. Long-term minor fluctuations in these variations reflect long-term fluctuations in the radiant power of this lava. During the initial stage, the power output was constant and nearly flat, which suggests that the effusion of lava was constant during this stage. The first peak (Peak I) occurred on the day 67 (24 May 2021) with a maximum radiant power of 3091 MW. The average radiant power over these periods was ca. 614 MW. Then, on day 68 to 130, the radiant power decreased from Peak I. The average radiant power during this period was ca. 302 MW. Subsequently, the value decreased to low levels and infrequently stopped between days 131 and 138. This was caused by the volcanic plume and intense cloud cover during this stage. The second peak (Peak II) occurred on day 147 with a maximum peak of 3253 MW and an average of ca. 1564 MW. This period had the most intensive radiant power during the eruption. During the last few days of this period, the value decreased to low levels when a week-long pause in activity occurred from day 166 to 177, which was then followed by a week-long period of the third peak (Peak III) from day 178 to 189 with a maximum radiant power of 2000 MW and an average of 533 MW. Finally, the radiant power discontinuously dropped for the last thermal signature, which marks the point when the effusion of lava finally ceased.
The analysis of the higher spatial resolution images (hotspot detection based on Landsat 8 OLI-TIRS using 46 constructed datasets) showed eruption activity from this period featured a hotspot area ranging from 0.2 to 2 km2 (Figure 2). These values provide a rough estimate of the total hotspot area, because of the plume affecting the number of detected hotspot areas. Figure 3 shows temporal activity of the lava flow. The area of strong SWIR signature from Landsat 8 OLI corresponds well with the radiant power derived from MODIS FRP but has less frequent observations. During the initial stage of the eruption between 22 March and 29 March 2021 (day 4 and 10 of the eruption) the vents maintained a steady area of active lava flow which demonstrate that the effusion of lava was constant during this week-long period, although only two data points available from the Landsat 8, however field observation shows agreement that lava flow was constant and occupied area ca. 0.2 km2. On 9 May 2021 (day 52) the active lava migrated and formed a channel with an area coverage of 1 km2. In this period (9 May and 10 June 2021) the vent activity stabilized at one location with an average active lava area of ca. 0.83 km2. The 26 June 2021 (day 99) to 3 July (day 106) was characterized by the maximum areal coverage by active lava. The maximum active lava coverage during this period was 2 km2 with an average of ca. 1.5 km2. Based on hotspot detection, the 13 August (day 148) was the last hotspot detected by Landsat 8 due to significant cloud cover and less frequent datasets prior to the eruption ending.

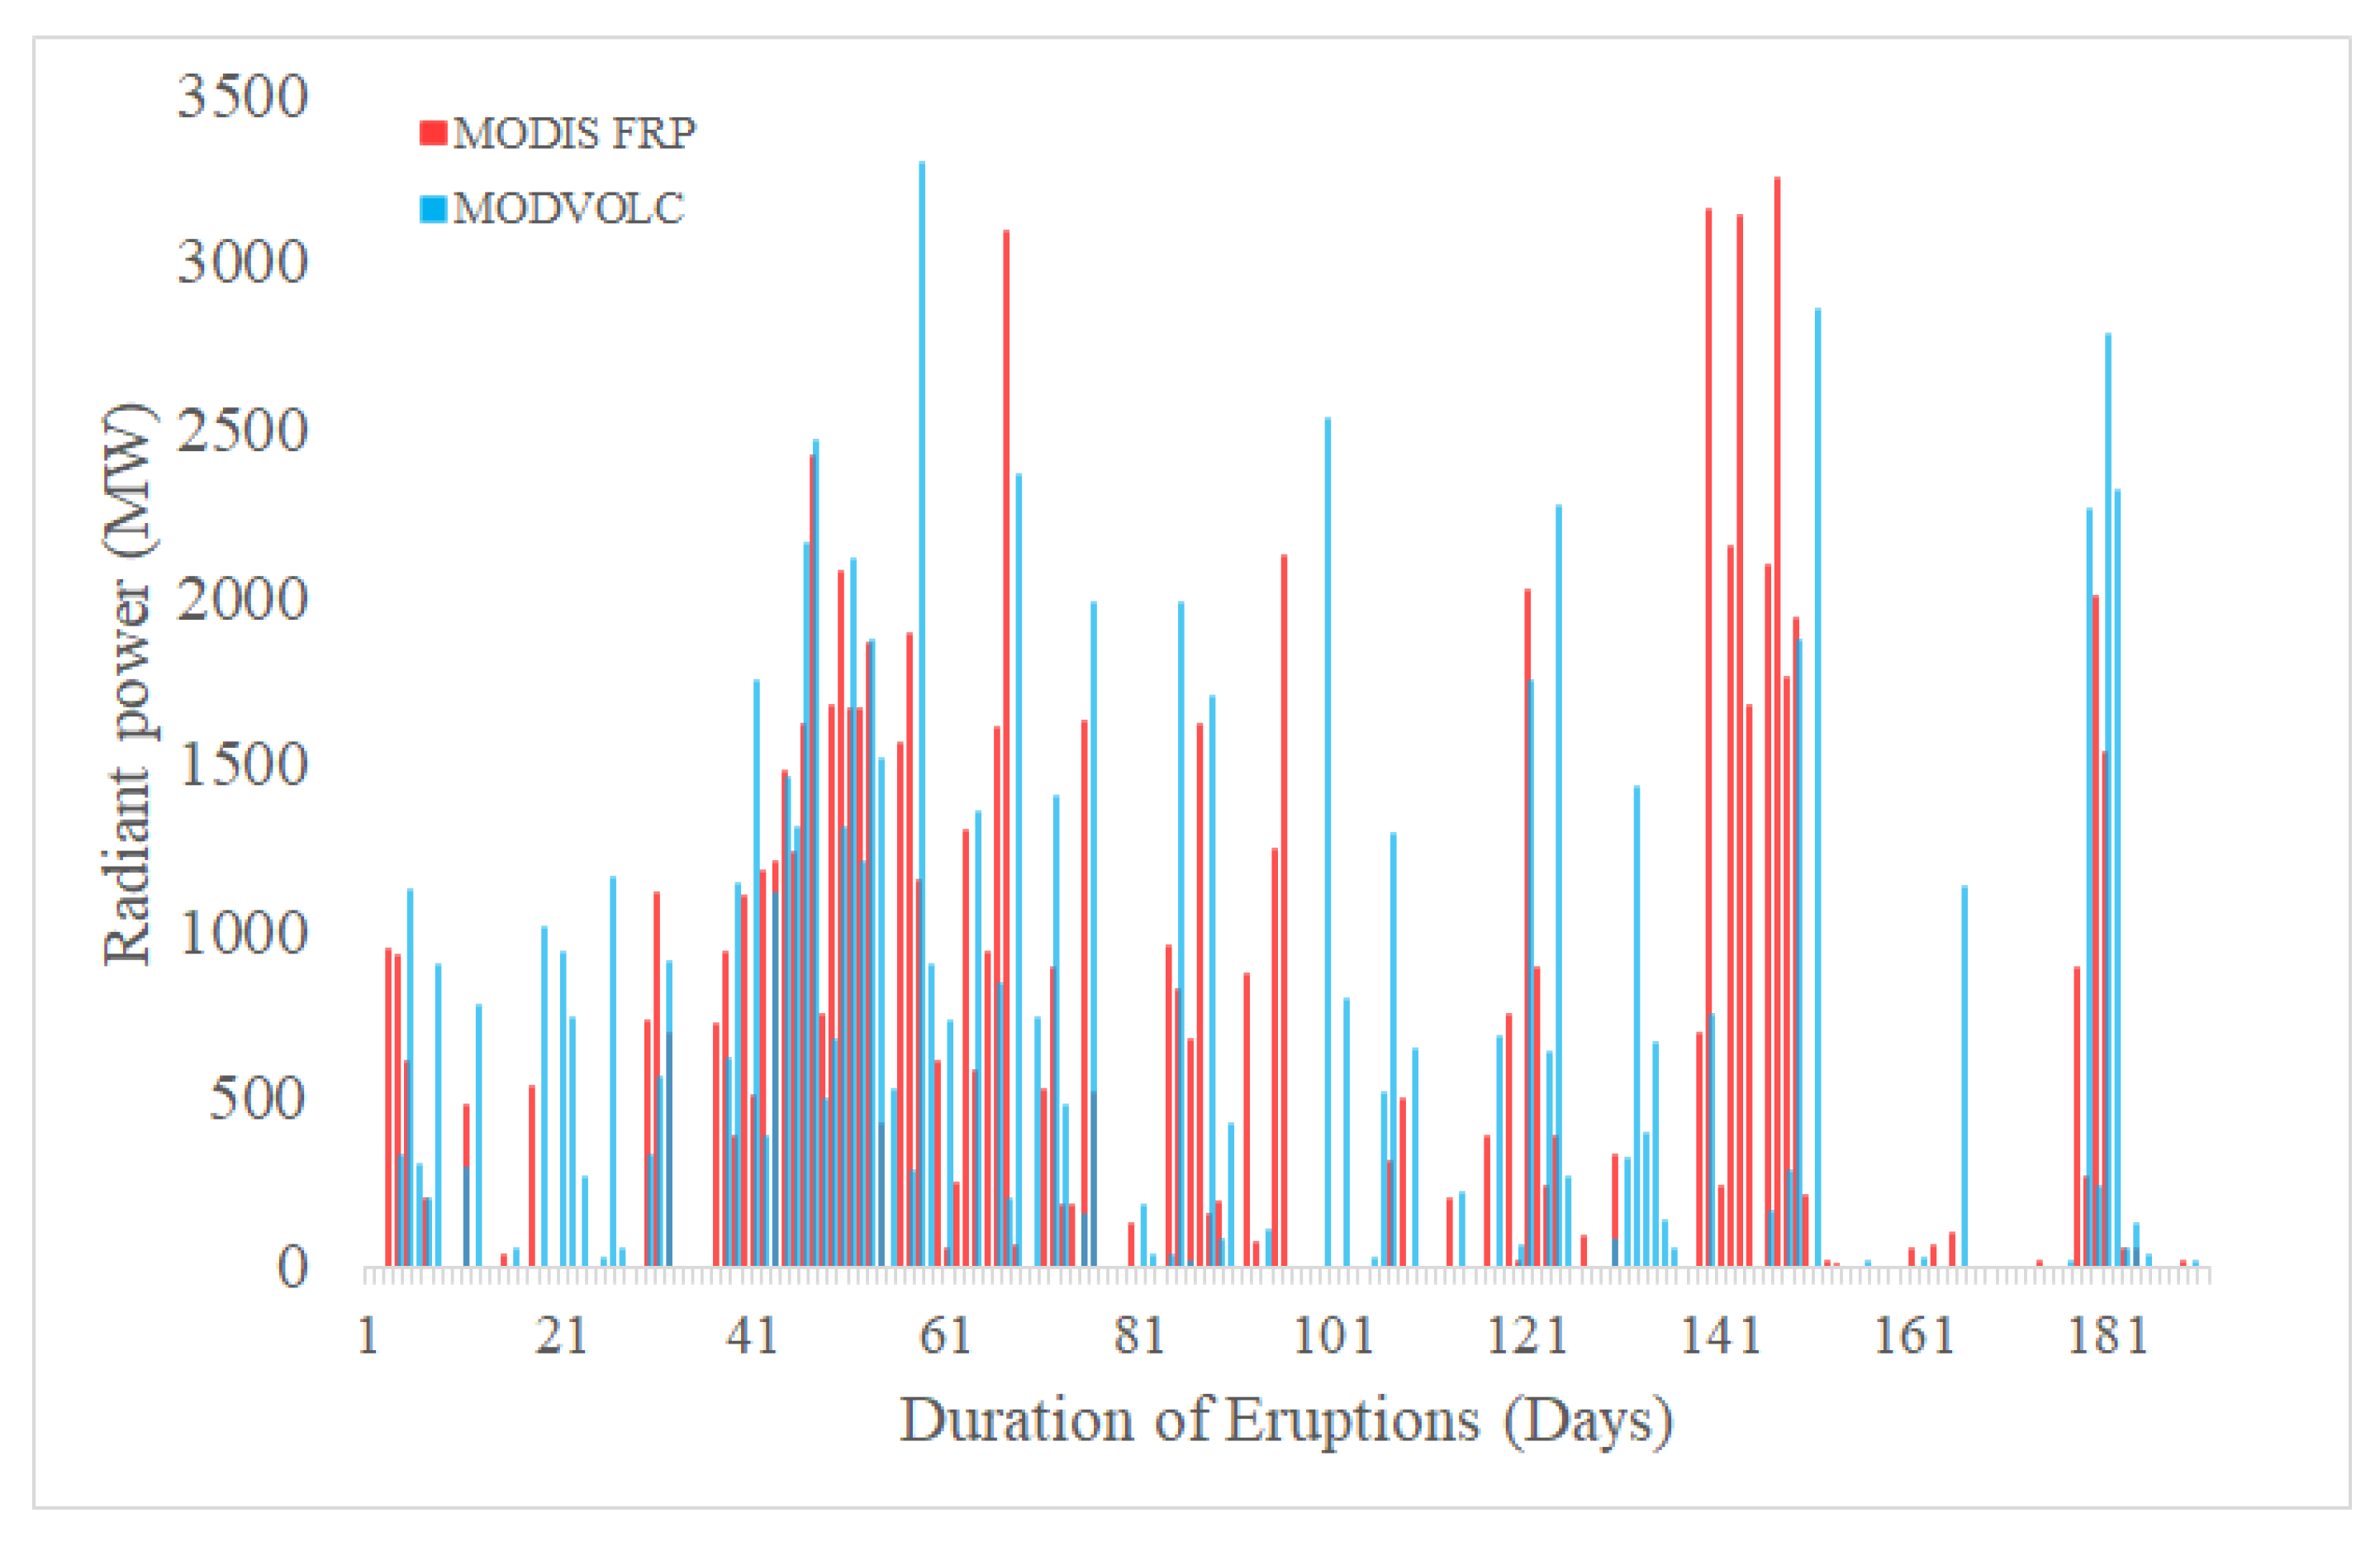
3.2. Comparison with MODVOLC Radiant Power

The MODIS FRP and MODVOLC derived radiant powers follow the same general trend, but the magnitudes of the values differ (Figure 4). When averaged over the duration of the eruption, MODVOLC exhibited the higher radiant flux (797 MW) compared with MODIS FRP (437 MW) over its 191 days duration. On the other hand, the total amount of radiant power detected by MODVOLC during the eruption was ca. 81,000 MW with a maximum of ca. 3297 MW. Because we are primarily interested in analyzing the correlation in pattern, the overall radiant power patterns are more important than their absolute values. We calculated the Spearman correlation coefficient between MODIS FRP and MODVOLC for the entire eruption and each of the eruption stages (Table 1). The strongest correlation, with a Spearman correlation coefficient of 0.72, is for Peak I (day 40 to 67 of eruption). The lowest Spearman correlation coefficient (0.34) is from the period of decrease prior to Peak II when MODIS FRP had periods of underestimate and overestimate of hot spot anomalies (days 125 to 150). This was caused by the different detection algorithms of MODIS FRP and MODVOLC which have different sensitivities towards the volcanic plume and intense cloud (discussed more in Section 5). The overall eruption exhibited a relatively positive correlation (0.64) between MODIS FRP and MODVOLC.

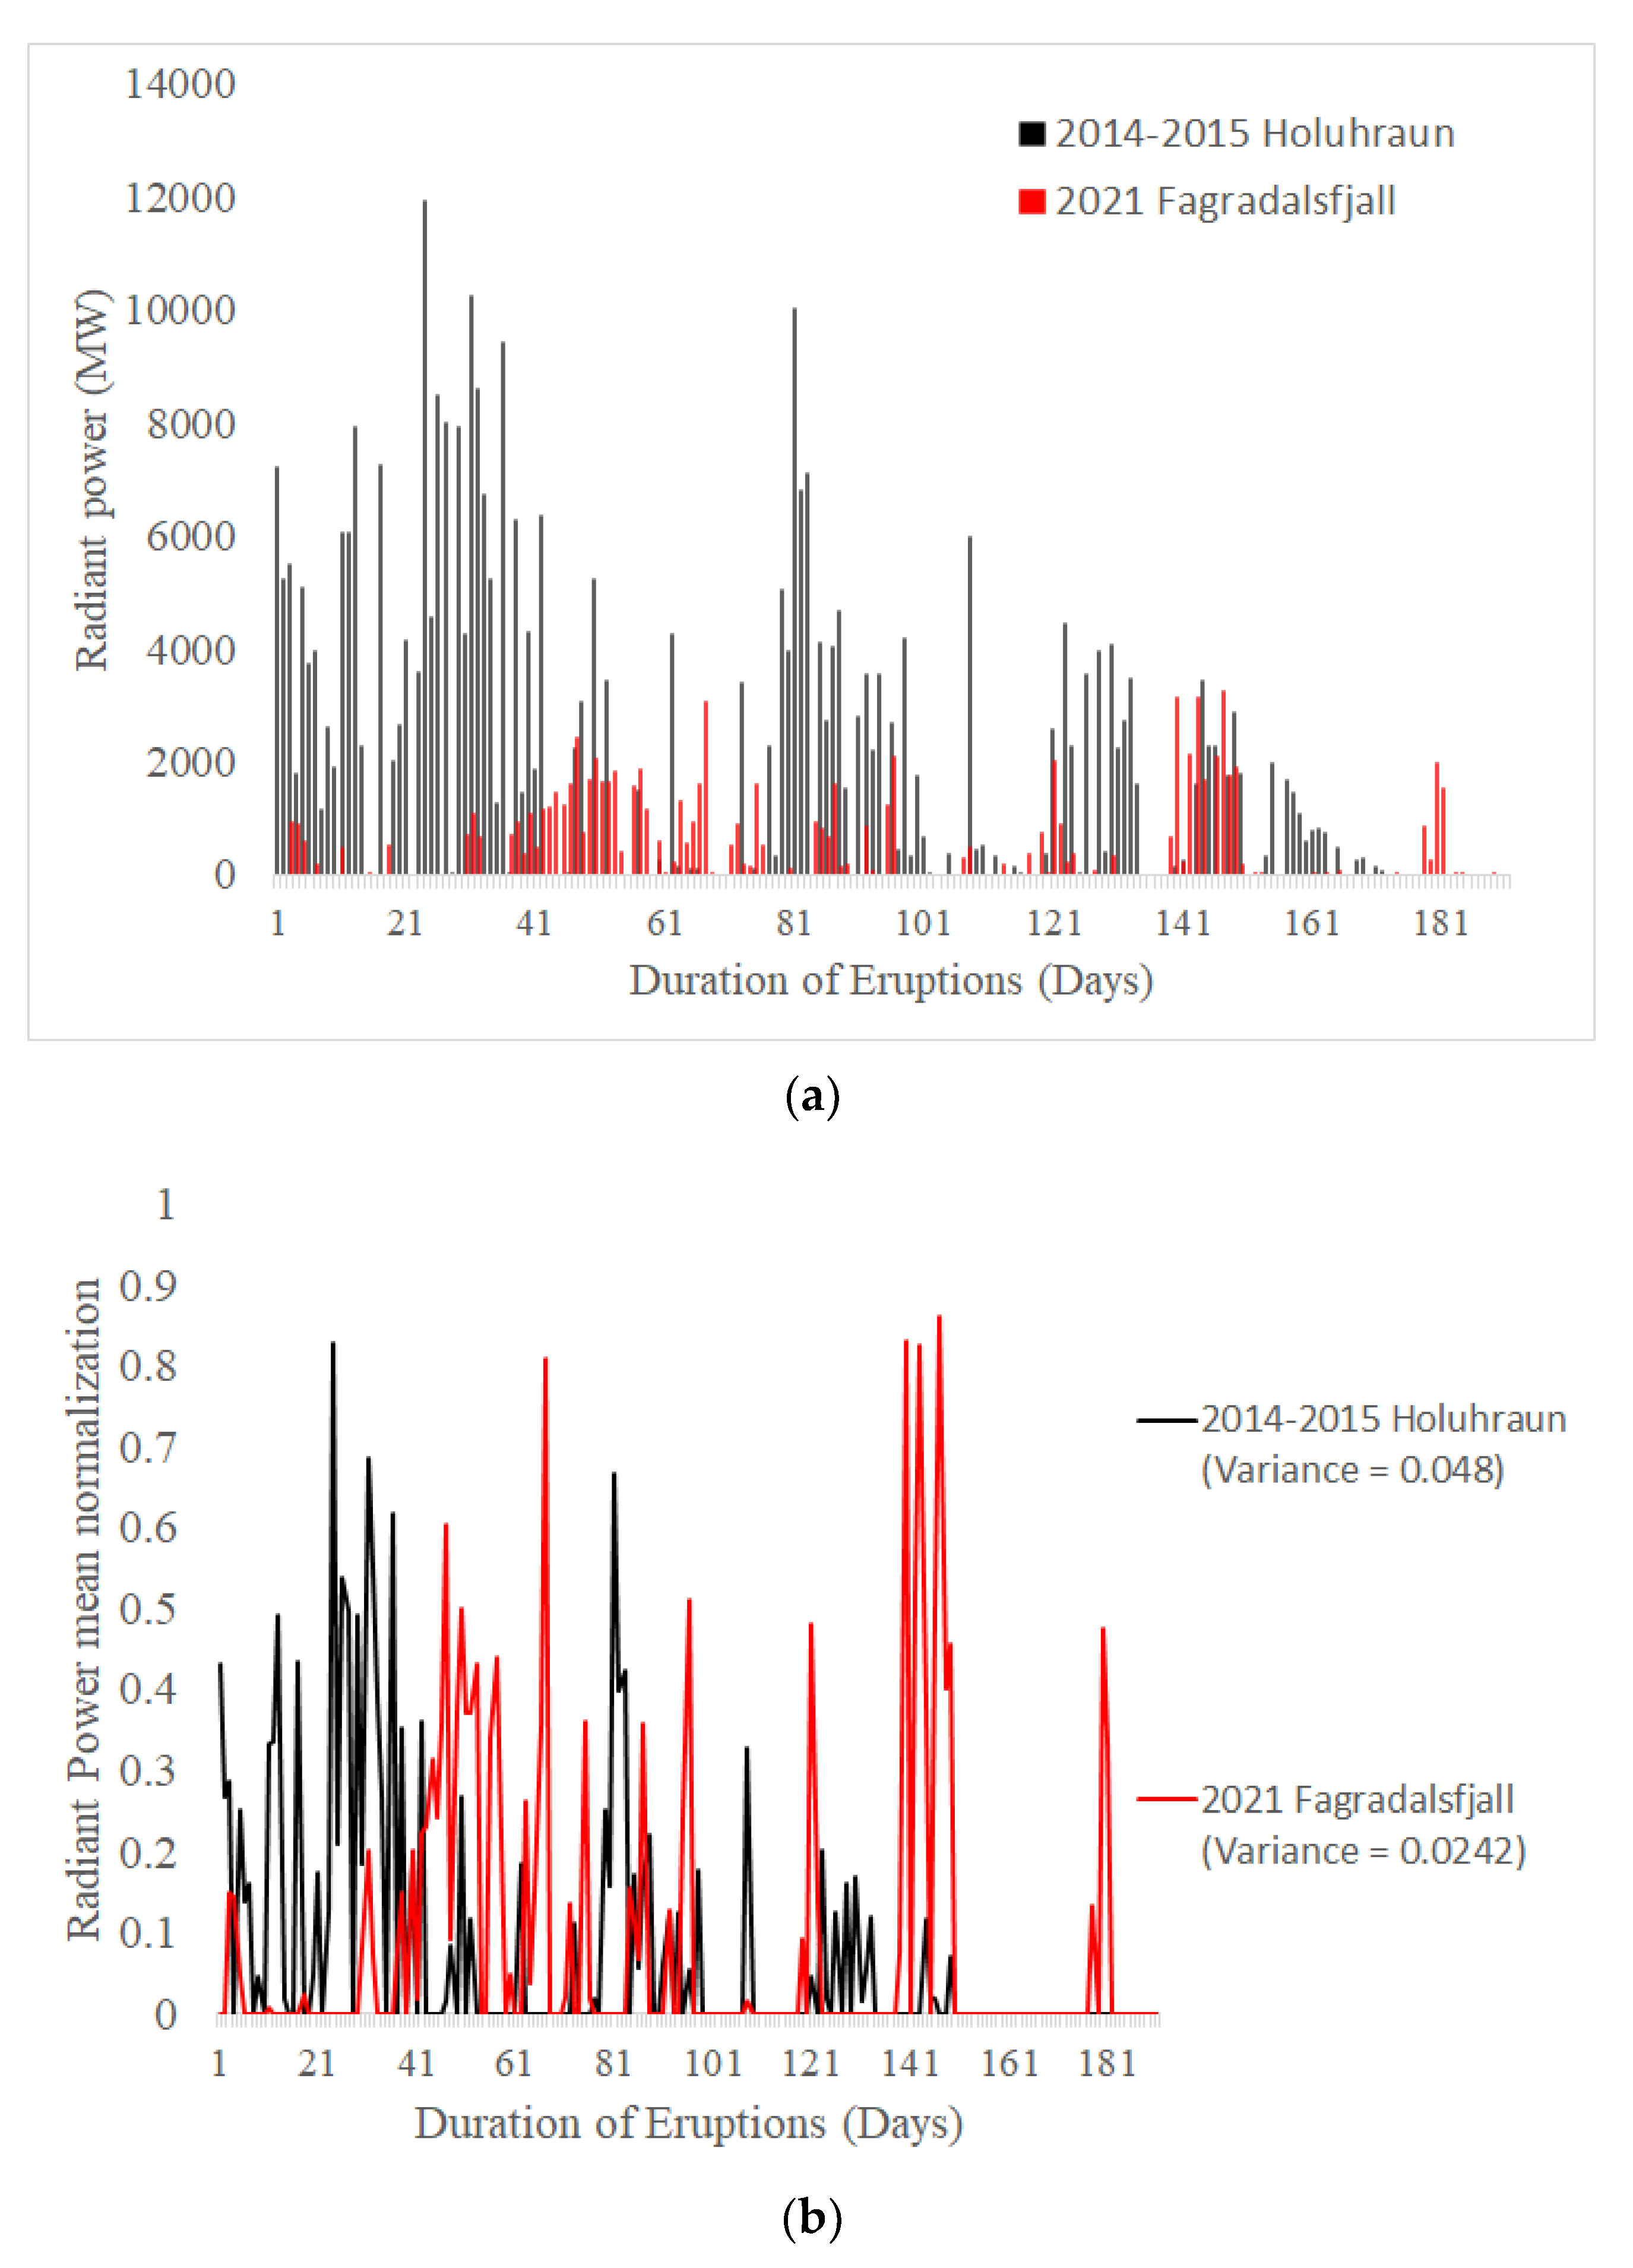
3.3. Comparison with the 2014–2015 Holuhraun Eruption

The radiant flux time series of the 2014–2015 Holuhraun eruption constructed using 211 individual MODIS FRP images acquired between 31 August 2014 and 30 March 2015. The 2021 Fagradalsfjall thermal power output is in marked contrast to the power output observed at the 2014–2015 Holuhraun eruption, Iceland (Figure 5), which also hosted active lava ponds and channels. We performed mean normalization to calculate variance for both time series. Holuhraun exhibited much larger variance in radiant power (0.048) compare with Fagradalsfjall (0.024) over the same period (Figure 5b). In the first 15 days of the eruption, the 2021 Fagradalsfjall eruption started with low and stable radiant power in the range of ca. 100 to 940 MW. Meanwhile, the 2014–2015 Holuhraun started with radiant power in the range of ca. 1100 to 7900 MW, meaning the 2021 Fagradalsfjall eruption has only ca. 10% of Holuhraun’s radiant power during the initial stage. By contrast, Holuhraun has a total radiant power of ca. 350,000 MW with a maximum radiant power of 11,956 MW and an average of 2071 MW over the course of the eruption.

4. Discussion

There are some limitations to the interpretation of satellite-derived thermal time series. MODIS FRP has not been tested for cloud effects. Therefore, a large decline in radiative power from one observation time to the next does not necessarily mean that the energy of the eruptive radiation has decreased. According to Wright and Pilger [22], complete occlusion by thick clouds does not have this effect, because in this case MODIS records the temperature of the cloud, not the eruption, so no hotspot would be detected. Instead, partial cloud cover (or the presence of cirrus clouds) suppresses the satellite’s spectral radiance. Similar results can be expected due to the presence of subpixel-sized clouds or volcanic plumes above the detection target. An advantage of the dense temporal coverage from MODIS that we use here for eruption monitoring is that the substantial number of images analyzed mitigates these effects. Instead of analyzing each image, we can describe general trends depicted by the radiant power time-series we present.
The 2021 Fagradalsfjall eruption started with low and stable radiant power in the first 31 days which corresponds well with a low initial effusion rate from a recent study based on airborne observation [4]. This indicates a thermal anomaly of the 2021 Fagradalsfjall eruption generated from small total area during this first initial stage. Our results from Landsat-8 OLI/TIRS also indicate, during this initial stage, that the 2021 Fagradalsfjall eruption covered an area up to 0.9 km2, in contrast with the 2014–2015 Holuhraun eruption, which covered an area of ca. 58.3 km2 during the first phase of the eruption with a much higher radiant power and effusion rate [18,32]. On 26 June to 13 August 2022 (day 99 to 147), the eruption reached a maximum areal coverage (up to 2 km2) and radiant power (up to 3253 MW) detected by both MODIS and OLI/TIRS. This period corresponds to episodic activity with intense lava emplacement according to the observation during the phase 4 of the eruption [4]. The undetected thermal anomaly during day 166 to 177 (pause stages) corresponds well with a observed week-long pause in activity which was then followed by a week-long period of activity [4] which also corresponds well with Peak III (day 178 to 189) before the eruption ended. It is clear that our results indicate that the 2021 Fagradalsfjall eruption is considered as a low-intensity basalt eruption in terms of power output and areal coverage compared with the other recent Icelandic basalt eruption, the 2014–2015 Holuhraun eruption [7,32]. Holuhraun hosted an active lava lake and a 20 km long lava flow channel [18,32] which also made the radiant power much greater than Fagradalsfjall.
Furthermore, the variation and magnitude of radiant power for thermally anomalous pixels gathered by MODIS FRP and MODVOLC show a marked difference (i.e., overestimation and underestimation), which may be driven by the different algorithm sensitivity capabilities between MODIS FRP and MODVOLC. In this case, MODVOLC performs better in term of number of images which were analyzed, since the algorithm use both Terra and Aqua satellites [33], compared to our study which uses only Terra. However, the advantage of using GEE for such processing is flexibility to include other freely available remote sensing datasets such as VIIRS, Aqua MODIS FRP, ASTER and Sentinel-2 MSI to increase temporal coverage of multi-platform time series [25] and derive radiant power. The platform also can produce time series charts and visualizations in under 5 min, making this platform simple to utilize and efficient to process large volumes of data to monitor future eruption.

5. Conclusions

In this letter, we explored the potential of a cloud computing platform in analyzing the radiant power from the 2021 Fagradalsfjall. Our results indicate that this eruption is a low-intensity basalt eruption in term of power output. The total amount of radiant power during the eruption was ca. 86,000 MW with maximum of 3253 MW and an average of 454 MW. The thermal output of the 2021 Fagradalsfjall contrasts with the output observed in the 2014–2015 Holuhraun, which also had active lava pools and channels. During the same period, Holuhraun showed a greater variation in radiated power. In comparison with radiative power measured from the MODVOLC system, our study shows a positive correlation (0.64) indicating that both results follow the same general trend. This radiant power time-series have been shown to act as a reliable proxy for variations in the intensity of an eruption, determining stages of eruption from the initial stage to the end of eruption. Radiant power of the 2021 Fagradalsfjall eruption has been divided into four types of stages; an initial stage, peak stages, a decrease stage, and a pause stage. These stages correspond well with field observation of other volcanological parameter such as effusion rate [4]. The use of Google Earth Engine allows for the compilation of a multi-platform satellite dataset of the thermal power from Earth’s volcanoes. Such a database will allow us to analyze both past and ongoing eruptions, with an increased temporal coverage. The platform also can produce time series charts and visualizations within minutes, making this platform simple to utilize and efficient to process large volumes of data to monitor future eruption.

Author Contributions

Conceptualization, M.A.; methodology, M.A.; validation, M.A., A.H. and W.M.M.; formal analysis, M.A.; field investigation, A.H. and W.M.M.; resources, M.A., A.H., M.v.d.M., H.v.d.W., W.M.M. and I.J.; writing—original draft preparation, M.A., A.H. and I.J.; writing—review and editing, M.A., A.H., H.v.d.W., M.v.d.M., W.M.M. and I.J.; visualization, M.A.; supervision, M.v.d.M. and H.v.d.W. All authors have read and agreed to the published version of the manuscript.

Funding

This research received no external funding.

Data Availability Statement

Satellite data used in this work are from operational missions and do not come with restrictions. The data are made available for free through Google Earth Engine. Scripts will be made available through GitHub and Earth Engine upon the publication.

Acknowledgments

We are grateful to the Google Earth Engine team for giving access to their cloud computing platform, to the NASA for access to Terra-MODIS FRP and Landsat-8 OLI/TIRS datasets.

Conflicts of Interest

The authors declare no conflict of interest.

References

  1. Sigurgeirsson, M.Á. The Younger-Stamp ar eruption at Reykjanes, SW-Iceland. Náttúrufræðingurinn 1995, 64, 211–230. [Google Scholar]
  2. Sæmundsson, K.; Sigurgeirsson, M.; Friðleifsson, G.Ó. Geology and structure of the Reykjanes volcanic system, Iceland. J. Volcanol. Geotherm. Res. 2020, 391, 106501. [Google Scholar] [CrossRef]
  3. Fischer, T.; Hrubcová, P.; Salama, A.; Doubravová, J.; Horálek, J.; Ágústsdóttir, T.; Gudnason, E.Á.; Hersir, G.P. Swarm seismicity illuminates stress transfer prior to the 2021 Fagradalsfjall eruption in Iceland. Earth Planet. Sci. Lett. 2022, 594, 117685. [Google Scholar] [CrossRef]
  4. Pedersen, G.B.M.; Belart, J.M.C.; Óskarsson, B.V.; Gudmundsson, M.T.; Gies, N.; Högnadóttir, T.; Hjartardóttir, Á.R.; Pinel, V.; Berthier, E.; Dürig, T.; et al. Volume, effusion rate, and lava transport during the 2021 Fagradalsfjall eruption: Results from near real-time photogrammetric monitoring. Geophys. Res. Lett. 2022, 49, e2021GL097125. [Google Scholar] [CrossRef]
  5. Esri World Imagery-Overview. Available online: https://www.arcgis.com/home/item.html?id=10df2279f9684e4a9f6a7f08febac2a9 (accessed on 11 February 2022).
  6. Kaneko, T.; Takasaki, K.; Maeno, F.; Wooster, M.J.; Yasuda, A. Himawari-8 infrared observations of the June–August 2015 Mt Raung eruption, Indonesia. Earth Planets Sp. 2018, 70, 89. [Google Scholar] [CrossRef]
  7. Wright, R.; Blackett, M.; Hill-Butler, C. Some observations regarding the thermal flux from Earth’s erupting volcanoes for the period of 2000 to 2014. Geophys. Res. Lett. 2015, 42, 282–289. [Google Scholar] [CrossRef]
  8. Harris, A.; Blake, S.; Rothery, D.A.; Stevens, N.F. A chronology of the 1991 to 1993 Mount Etna eruption using advanced very high resolution radiometer data:Implications for real-time thermal volcano monitoring. J. Geophys. Res. 1997, 102, 19. [Google Scholar] [CrossRef]
  9. Wright, R.; Rothery, D.A.; Blake, S.; Harris, A.J.L.; Pieri, D.C. Simulating the response of the EOS Terra ASTER sensor to high-temperature volcanic targets. Geophys. Res. Lett. 1999, 26, 1773–1776. [Google Scholar] [CrossRef]
  10. Ilyinskaya, E.; Schmidt, A.; Mather, T.A.; Pope, F.D.; Witham, C.; Baxter, P.; Jóhannsson, T.; Pfeffer, M.; Barsotti, S.; Singh, A.; et al. Understanding the environmental impacts of large fissure eruptions: Aerosol and gas emissions from the 2014–2015 Holuhraun eruption (Iceland). Earth Planet. Sci. Lett. 2017, 472, 309–322. [Google Scholar] [CrossRef]
  11. Wright, R.; Blake, S.; Harris, A.J.L.; Rothery, D.A. A simple explanation for the space-based calculation of lava eruption rates. Earth Planet. Sci. Lett. 2001, 192, 223–233. [Google Scholar] [CrossRef]
  12. Harris, A.J.L.; Flynn, L.P.; Keszthelyi, L.; Mouginis-Mark, P.J.; Rowland, S.K.; Resing, J.A. Calculation of lava effusion rates from Landstat TM data. Bull. Volcanol. 1998, 60, 52–71. [Google Scholar] [CrossRef]
  13. Wooster, M.J.; Kaneko, T. Satellite thermal analyses of lava dome effusion rates at Unzen Volcano, Japan. J. Geophys. Res. Solid Earth 1998, 103, 20935–20947. [Google Scholar] [CrossRef]
  14. Kaneko, T.; Yasuda, A.; Fujii, T. Simple empirical method for estimating lava-effusion rate using nighttime Himawari-8 1.6-µm infrared images. Earth Planets Sp. 2021, 73, 1–10. [Google Scholar] [CrossRef]
  15. Coppola, D.; Laiolo, M.; Cigolini, C.; Massimetti, F.; Delle Donne, D.; Ripepe, M.; Arias, H.; Barsotti, S.; Parra, C.B.; Centeno, R.G.; et al. Thermal Remote Sensing for Global Volcano Monitoring: Experiences From the MIROVA System. Front. Earth Sci. 2020, 7, 1–21. [Google Scholar] [CrossRef]
  16. Oppenheimer, C.; Rothery, D.A.; Pieri, D.C.; Abrams, M.J.; Carere, V. Analysis of Airborne Visible/Infrared Imaging Spectrometer (AVTRIS) data of volcanic hot spots. Int. J. Remote Sens. 1993, 14, 2919–2934. [Google Scholar] [CrossRef]
  17. Nádudvari, Á.; Abramowicz, A.; Maniscalco, R.; Viccaro, M. The estimation of lava flow temperatures using landsat night-time images: Case studies from eruptions of Mt. Etna and Stromboli (Sicily, Italy), Kilauea (Hawaii Island), and Eyjafjallajökull and Holuhraun (Iceland). Remote Sens. 2020, 12, 2537. [Google Scholar] [CrossRef]
  18. Aufaristama, M.; Hoskuldsson, A.; Jonsdottir, I.; Ulfarsson, M.O.; Thordarson, T. New insights for detecting and deriving thermal properties of lava flow using infrared satellite during 2014-2015 effusive eruption at Holuhraun, Iceland. Remote Sens. 2018, 10, 151. [Google Scholar] [CrossRef]
  19. Zakšek, K.; Hort, M.; Lorenz, E. Satellite and ground based thermal observation of the 2014 effusive eruption at Stromboli Volcano. Remote Sens. 2015, 7, 17190–17211. [Google Scholar] [CrossRef]
  20. Bonny, E.; Thordarson, T.; Wright, R.; Höskuldsson, A.; Jónsdóttir, I. The Volume of Lava Erupted During the 2014 to 2015 Eruption at Holuhraun, Iceland: A Comparison Between Satellite- and Ground-Based Measurements. J. Geophys. Res. Solid Earth 2018, 123, 5412–5426. [Google Scholar] [CrossRef]
  21. Davies, A.G.; Calkins, J.; Scharenbroich, L.; Vaughan, R.G.; Wright, R.; Kyle, P.; Castańo, R.; Chien, S.; Tran, D. Multi-instrument remote and in situ observations of the Erebus Volcano (Antarctica) lava lake in 2005: A comparison with the Pele lava lake on the jovian moon Io. J. Volcanol. Geotherm. Res. 2008, 177, 705–724. [Google Scholar] [CrossRef]
  22. Wright, R.; Pilger, E. Satellite observations reveal little inter-annual variability in the radiant flux from the Mount Erebus lava lake. J. Volcanol. Geotherm. Res. 2008, 177, 687–694. [Google Scholar] [CrossRef]
  23. Wright, R.; Flynn, L.P. Space-based estimate of the volcanic heat flux into the atmosphere during 2001 and 2002. Geology 2004, 32, 189–192. [Google Scholar] [CrossRef]
  24. Harris, A. Thermal Remote Sensing of Active Volcanoes: A User’s Manual; Cambridge University Press: Cambridge, UK, 2013; ISBN 9781139029346. [Google Scholar]
  25. Genzano, N.; Pergola, N.; Marchese, F. A Google Earth Engine Tool to Investigate, Map and Monitor Volcanic Thermal Anomalies at Global Scale by Means of Mid-High Spatial Resolution Satellite Data. Remote Sens. 2020, 12, 3232. [Google Scholar] [CrossRef]
  26. Gorelick, N.; Hancher, M.; Dixon, M.; Ilyushchenko, S.; Thau, D.; Moore, R. Google Earth Engine: Planetary-scale geospatial analysis for everyone. Remote Sens. Environ. 2017, 202. [Google Scholar] [CrossRef]
  27. Melorose, J.; Perroy, R.; Careas, S. MODIS FIRE PRODUCTS (Version. MODIS Sci. Team 2006, 1, 1–34. [Google Scholar]
  28. Giglio, L.; Justice, C. MYD14A1 MODIS/Aqua Thermal Anomalies/Fire Daily L3 Global 1km SIN Grid V006 [Data set]. NASA EOSDIS L. Process. DAAC. 2015.
  29. Kaufman, Y.J.; Justice, C.O.; Flynn, L.P.; Kendall, J.D.; Prins, E.M.; Giglio, L.; Ward, D.E.; Menzel, W.P.; Setzer, A.W. Potential global fire monitoring from EOS-MODIS. J. Geophys. Res. Atmos. 1998, 103, 32215–32238. [Google Scholar] [CrossRef]
  30. Wright, R.; Flynn, L.; Garbeil, H.; Harris, A.; Pilger, E. Automated volcanic eruption detection using MODIS. Remote Sens. Environ. 2002, 82, 135–155. [Google Scholar] [CrossRef]
  31. Wright, R.; Flynn, L.P.; Garbeil, H.; Harris, A.J.L.; Pilger, E. MODVOLC: Near-real-time thermal monitoring of global volcanism. J. Volcanol. Geotherm. Res. 2004, 135, 29–49. [Google Scholar] [CrossRef]
  32. Pedersen, G.B.M.; Höskuldsson, A.; Dürig, T.; Thordarson, T.; Jónsdóttir, I.; Riishuus, M.S.; Óskarsson, B.V.; Dumont, S.; Magnusson, E.; Gudmundsson, M.T.; et al. Lava field evolution and emplacement dynamics of the 2014–2015 basaltic fissure eruption at Holuhraun, Iceland. J. Volcanol. Geotherm. Res. 2017, 340, 155–169. [Google Scholar] [CrossRef]
  33. Wright, R. MODVOLC: 14 years of autonomous observations of effusive volcanism from space. Geol. Soc. Spec. Publ. 2016, 426, 23–53. [Google Scholar] [CrossRef] [Green Version]
Figure 1. The 2021 Fagradalsfjall lava flow field map (red polygon). Green box indicates the image subset location. The shading in the image is the hill shade, created from ArcticDEM. The 2021 Fagradalsfjall lava flow field is situated at Mt. Fagradalsfjall Reykjanes Peninsula, Iceland. (Source of base map from Esri World Imagery [5]).
Remotesensing 14 04528 g001
Figure 2. The time series of radiant power detected (red) during the 2021 Fagradalsfjall eruption derived from MODIS FRP; eruption stages (dashed line) in the 2021 Fagradalsfjall eruption based on the radiant power pattern. This period of eruptive pattern was divided into four stages (initial, peaks, decrease and pause stages). Temporal area covered by detected active lava hotspot (green) derived from Landsat-8 OLI-TIRS.
Remotesensing 14 04528 g002
Figure 3. The images from Landsat 8-OLI (band combination 7/6/5) show the temporal evolution of the 2021 Fagradalsfjall eruption. The active lava flows were detected by the satellite from 22 March 2021 until 13 August 2021.
Remotesensing 14 04528 g003
Figure 4. Plot shows the radiant power of the 2021 Fagradalsfjall eruption from MODIS FRP in red and from MODVOLC in light blue. The Spearman correlation coefficient of these two datasets is 0.64 over the entire duration of the eruption.
Remotesensing 14 04528 g004
Figure 5. (a) Radiant flux comparison from the 2021 Fagradalsfjall (red) and the 2014–2015 Holuhraun eruption (black); (b) mean normalization and variance of radiant flux comparison from the 2021 Fagradalsfjall (red) and the 2014–2015 Holuhraun eruption (black).
Remotesensing 14 04528 g005
Table 1. Spearman correlation coefficient showing the degree of correlation between MODIS FRP and MODVOLC during the 2021 Fagradalsfjall eruption.
Initial PhasePeak IDecreasePeak IIPausePeak IIIOverall Eruption
Spearman correlation0.520.720.550.340.440.620.64
Publisher’s Note: MDPI stays neutral with regard to jurisdictional claims in published maps and institutional affiliations.

