
Deciphering the Drivers of Net Primary Productivity of Vegetation in Mining Areas
by
Huiwen Tian
1,2,
Shu Liu
1,2,
Wenbo Zhu
1,2,
Junhua Zhang
1,2,*,
Yaping Zheng
1,2,
Jiaqi Shi
1,2 and
Rutian Bi
3 1
Key Laboratory of Geospatial Technology for the Middle and Lower Yellow River Regions, Ministry of Education, College of Geography and Environmental Science, Henan University, Kaifeng 475004, China
2
National Demonstration Center for Experimental Environment and Planning Education, Henan University, Kaifeng 475004, China
3
College of Resource and Environment, Shanxi Agricultural University, Jinzhong 030801, China
*
Author to whom correspondence should be addressed.
Remote Sens. 2022, 14(17), 4177; https://doi.org/10.3390/rs14174177
Submission received: 13 July 2022
/
Revised: 12 August 2022
/
Accepted: 22 August 2022
/
Published: 25 August 2022
(This article belongs to the Special Issue Applications of Remote Sensing and GIS Integration in Natural Resources and Environmental Science)
Abstract
:Spatial differentiation of the net primary productivity (NPP) of vegetation is an important factor in the ecological protection and restoration of mining areas. However, most studies have focused on climatic productivity constraints and rarely considered the effects of soil properties and mining activities. Thus, the impact of the forces driving NPP in mining areas on spatial location remains unclear. Taking the Changhe Basin mining area as an example, we used the Carnegie–Ames–Stanford approach (CASA) model to estimate NPP and quantified the impact of climate, soil properties, and mining activities based on factorial experiments. Our results indicate that the average NPP in the Changhe Basin mining area was 290.13 gC/(m2·yr), and the NPP in the western Changhe Basin, an intensive coal mining area, was significantly lower than that in the east. The correlations between each driver and NPP varied by location, with mean annual temperature and precipitation, soil organic carbon, total nitrogen, and land degradation showing strong correlations. The relative importance of climate, soil properties, and mining activities on the spatial variability of NPP was 38.97%, 31.50%, and 29.53%, respectively. Furthermore, 70.72% of the NPP variability in mining areas was controlled by the coupled effects of climate and soil properties (CS + SC) or climate and mining activities (CM + MC). Meanwhile, The NPP in the western Changhe Basin mining area was mainly controlled by mining activities (M) or climate and mining activities (CM), while that in the east was mainly controlled by soil properties and climate (CS). Overall, our study extends the knowledge regarding the impacts of driving forces on spatial variation of NPP in mining areas and provides a reference point for forming strategies and practices of ecological restoration and land reclamation in different spatial locations in mining areas.
1. Introduction
The net primary productivity (NPP) of vegetation is the main factor characterizing the carbon sink of the environment and regulating ecological processes, and it plays a crucial role in the global carbon balance [1]. In recent decades, coal mining and utilization have promoted the rapid development of society and economy but have also caused serious damage to the regional ecological environment [2,3,4]. The area of land degradation caused by coal mining during 1989–2010 was 100.01 × 10⁴ ha [5], and the ecological environment in mining areas has been facing several challenges. The quality of ecosystem functioning in a mining area can be characterized based on NPP, which can be used as a unified scale standard to measure changes in the ecological environment, thereby reflecting the ecosystem health of the mining area [6]. Therefore, identifying the spatial variation and driving mechanisms of NPP in mining areas is crucial for quantifying carbon budgets and formulating land remediation and ecological restoration plans.
Climate and soil properties contribute to the large-scale global and regional spatial variability exhibited by NPP [7,8,9]. The evidence that climatic factors have a strong impact on NPP patterns at the global or regional scale is conclusive; however, the sensitivity of vegetation to climate change varies in different regions [10,11,12,13,14]. Numerous studies and experiments have demonstrated that soil properties (e.g., soil nutrients and texture) are one of the primary factors restricting vegetation productivity. For instance, soil nutrients are considered determinants of temperate vegetation productivity [15]. The availability of nitrogen and phosphorus regulates forest productivity patterns and scale [16]. In tropical rain forests, soil fertility influences the redistribution of the above- and belowground vegetation biomass [17]. Soil physical properties (e.g., soil texture and soil particle size fraction) are also important predictors of forest and grassland biomass [18,19,20]. In mining areas, soil properties control vegetation community structures such as plant density, coverage, and biomass [21]. Reconstructing soil can provide nutrients for vegetation and promote vegetation productivity [22]. Measures such as applying organic fertilizers, planting nitrogen-fixing plants, and introducing fertile soil can also promote vegetation restoration and increase vegetation coverage and plant diversity [23,24]. Meanwhile, mining destroys soil’s physical properties, acidifying soil pH, reducing soil quality, and being unable to support the growth of plants around the mining area [25]. However, most spatial (raster) studies have focused on the climate constraints on productivity and rarely considered the soil constraints. Additionally, coal mining areas are semi-artificial ecosystems that are fragile and severely disturbed due to anthropogenic activities. Long-term, large-scale, and high-intensity coal mining has caused extensive land degradation, resulting in a high loss of NPP. For example, Huang et al. [26] believed that coal mining destroyed vegetation chlorophyll, reduced the response of vegetation to local climate, and weakened the ability of vegetation to absorb atmospheric CO2, resulting in slow growth and lower biomass. Han et al. [2] simulated the degree of land degradation in the Yanzhou coalfield under different development scenarios and found that land degradation in the scenario of coal mining without reclamation resulted in significant degradation of ecosystem carbon storage. Xu et al. [27] investigated the NPP changes in the Jincheng mining area of Shanxi Province and found that NPP in subsidence areas was lower than that in non-subsidence areas. Subsidence, seeper (large amounts of water accumulated in the collapsed areas caused by coal mining), goaves (cavities left after underground coal or coal gangue mining), and other structural factors caused by coal mining result in the high spatial variability of NPP in mining areas [6,26,27]. Therefore, there is an urgent need to combine climate, soil properties, and mining activities when assessing NPP in mining areas.
Owing to the substantial workload associated with recording field observations of NPP and the difficulty in extrapolating to a larger range, the method of estimating NPP using remote sensing data-driven ecological models is generally accepted [28,29]. The Carnegie–Ames–Stanford approach (CASA) model proposed by Potter et al. [30] is highly representative and widely used in NPP simulations at different spatiotemporal resolutions [14,31,32,33]. To identify the impact of key drivers on NPP in the mining area, we used the CASA model to simulate NPP of the Changhe Basin mining area, quantified the land degradation using geological hazard data to reflect the intensity of mining activities, and quantified the role played by climate, soil properties, and mining activities in NPP spatial variation. Moreover, we provided clear estimates of the main spatial drivers of NPP, which are helpful for ecological restoration, land reclamation planning, and management of mining areas in different locations.
2. Materials and Methods
2.1. Study Area
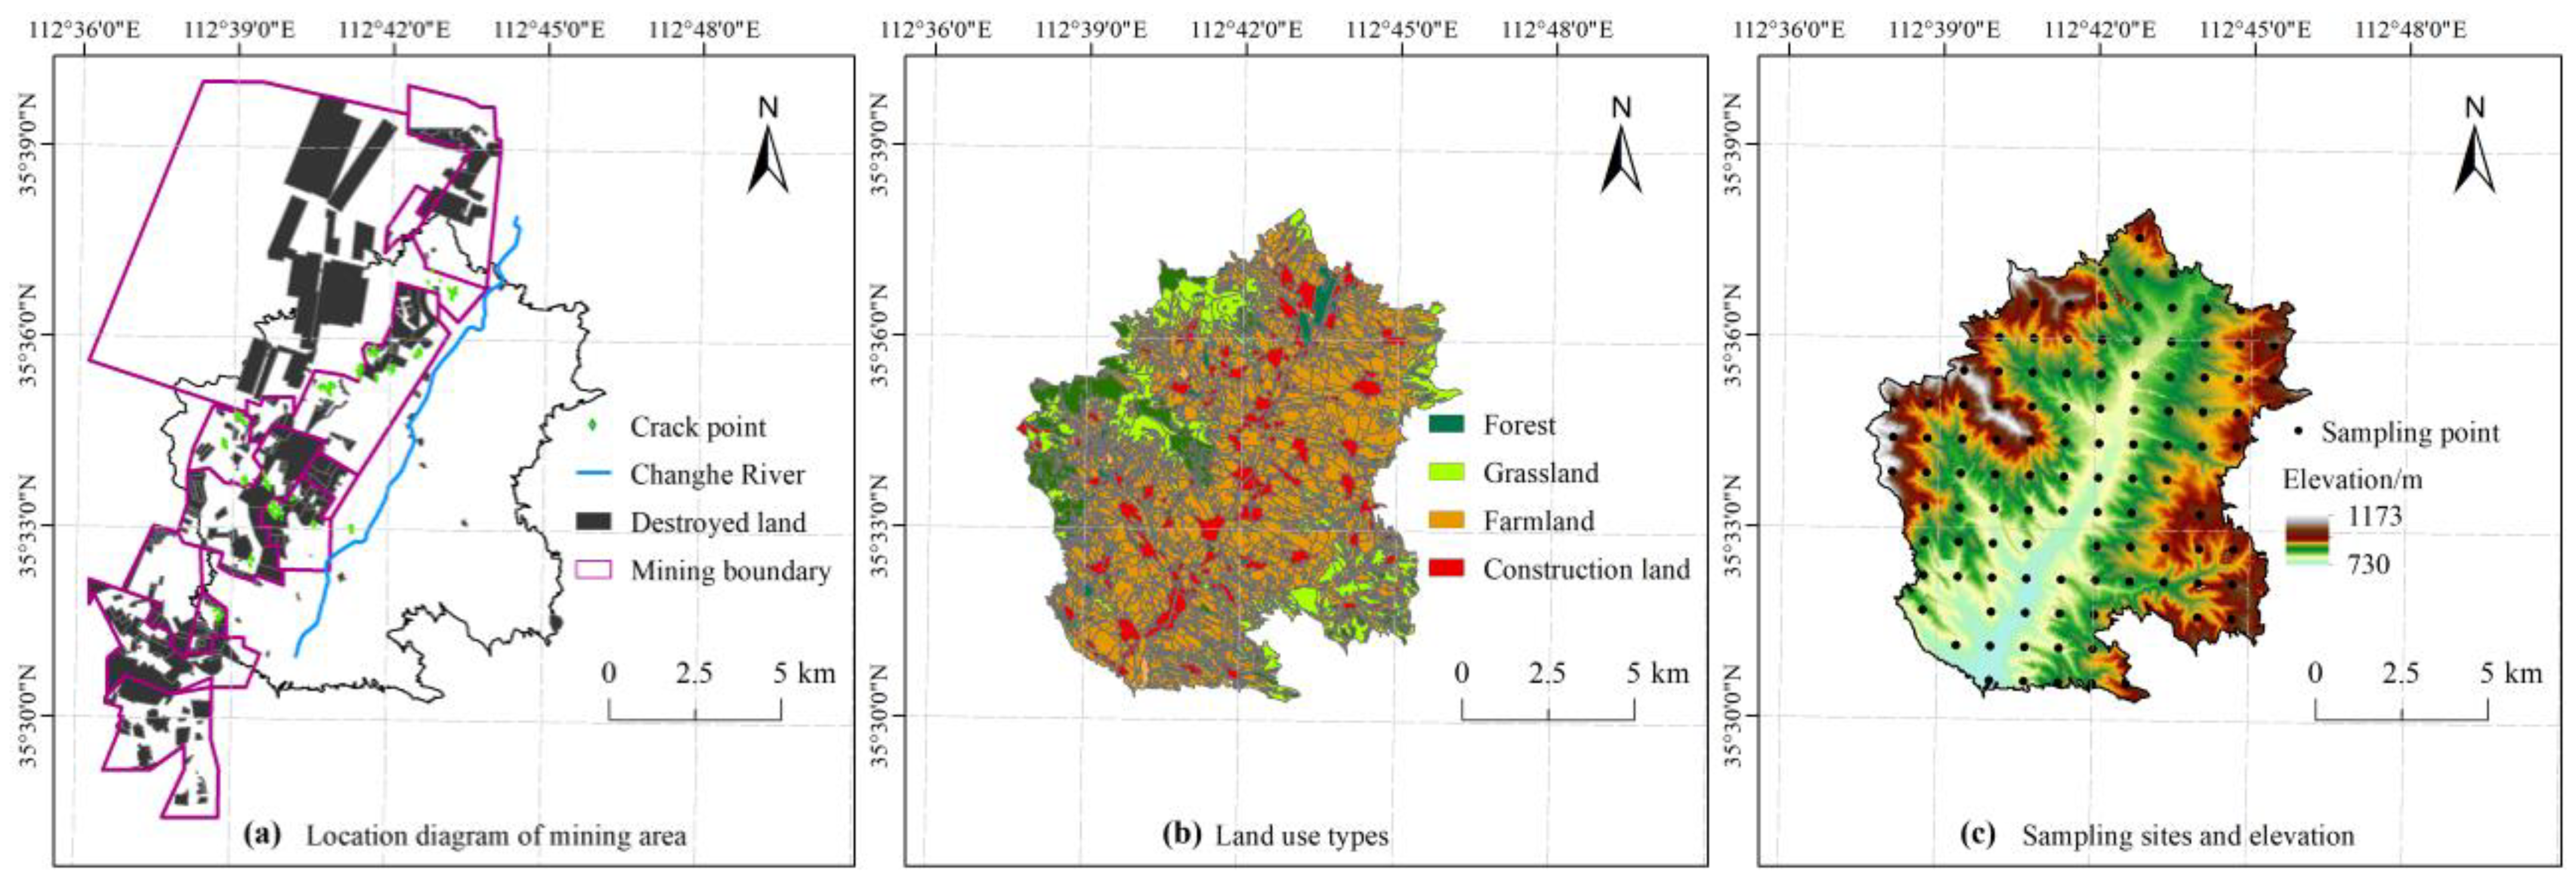
The Changhe Basin is located in Jincheng city, China (112.63°–112.77°N, 35.50°–35.63°E), and extends over an area of approximately 113.16 km2 (Figure 1). The land cover primarily includes forests, grassland, farmland, and construction land. The annual average temperature in the Changhe Basin is 10.6 °C, and the annual precipitation is 550–600 mm. On the west side of the Changhe river, there are 11 coal mines, including Chengzhuang, Tiantai Kunda, and Tian’an Jinrui, with a total of 8–17 layers of coal and a total thickness of 9.18–14.23 m. The scope of the mining permit is from 2010 to 2030, the mining method is underground mining, and the total annual coal production is more than 450,000 tons. Since 2010, large-scale land degradation such as goaves, subsidence, and cracks have occurred. As of 2015, the area of land damage has reached 10.29 km2, resulting in serious environmental problems, such as reduced vegetation cover and soil and water pollution.
2.2. Estimating the Mining Area NPP
In this study, we adopted a CASA model driven by the normalized difference vegetation index (NDVI), land cover, and climate data to simulate NPP in the Changhe Basin mining area. The NDVI dataset was sourced from the United States Geological Survey (USGS) (https://www.usgs.gov/, accessed on 12 December 2021) and included MODIS Terra Daily NDVI images (250 m resolution and 16-day time interval) and Landsat Collection 1 Tier 1 8-day NDVI images (30 m resolution and less than 10% cloud cover). The timeframe was 2010–2015. Land cover data (1:10,000) were sourced from the Jincheng city land use update database. The climate dataset included precipitation, temperature, and solar radiation, and their sources are listed in Table 1.
Owing to the small extent of the Changhe Basin, the vegetation growing season changes rapidly, and remote sensing images with a higher spatiotemporal resolution are required to monitor NPP. Although the MODIS Terra Daily NDVI data can simulate monthly NPP, the spatial representation of NPP estimation results is imprecise because of the spatial resolution limitation. The medium- and high-resolution Landsat Collection 1 Tier 1 8-day NDVI images are affected by time series and cloudy or rainy weather and can only be used to perform single-phase or single-season NPP simulations. Generally, the lower the spatial resolution of the satellite, the wider the imaging swath, the shorter the time interval between revisits, and the higher the temporal resolution. Therefore, the spatiotemporal resolution of the current satellite-obtained data is insufficient to accurately monitor vegetation changes [34]. Hence, this study adopted the Enhanced Spatial and Temporal Adaptive Reflectance Fusion Model (ESTARFM) proposed by Zhu et al. [35], using the MODIS multi-temporal data and Landsat high spatial resolution data to synthesize NDVI (30 m resolution and 16-day time interval) [5,35,36] (Figure S1a). The synthesized NDVI and climate data were used as input in the CASA model for the NPP simulation (Figure S1b). To avoid the single-year variation uncertainty of NPP, we calculated the average value from 2010 to 2015 to represent the overall state of NPP.
2.2.1. Synthesizing NDVI Using the ESTARFM Method
The ESTARFM method uses the MODIS and Landsat images obtained at time tm and tn and MODIS images obtained at time tp to predict the high spatial resolution at time tp (tp lies between tm and tn) [35]. First, the spatial distribution and spectral differences of similar pixels between the MODIS and Landsat images at time tk (k = m, n) were obtained by calculating the moving window, which is denoted by Lm(xw/2, yw/2, tp) and Ln(xw/2, yw/2, tp), respectively. Then, based on the difference in the MODIS image reflectivity, the weight of time tk relative to time tp was calculated and denoted by Tm and Tn, respectively. Finally, a high-resolution image, such as the Landsat image, at time tp was calculated using the MODIS image at time tp and time weight. The ESTARFM Equation (1) expresses the detailed calculation method and parameters as described by Zhu et al. [35]:
2.2.2. The CASA Model for Simulating NPP
The CASA model is a light energy utilization model used for estimating NPP [30]. In the model, the NPP (gC/[m2·month]) of pixel x in month t is represented by the product of two factors: the photosynthetically active radiation of vegetation (APAR; MJ/[m2·month]) and light use efficiency factor (gC/MJ). The CASA model uses the following equations:
and
where SOL(x, t) is the total solar radiation at pixel x in month t, and FPAR(x, t) is the absorption ratio of APAR by the vegetation layer, estimated using NDVI. The constant 0.5 represents the proportion of the effective solar radiation that the vegetation can use to the total solar radiation, εmax is the maximum light use efficiency under ideal conditions, Tε1(x, t) and Tε2(x, t) are the stress coefficients of low and high temperature on light energy utilization, respectively, and Wε(x, t) is the water stress coefficient. The detailed computational steps for each parameter are described in previous studies [30,38]. Furthermore, we performed descriptive statistical analyses on the NPP simulation results, including average value, standard deviation, and coefficient of variation.
2.3. Selection of Driving Factors
Climatic and soil factors influence NPP, and their interactions usually control spatial variation in productivity. Mining activities take place in specific geographic areas where NPP is further affected. Therefore, we selected 12 driving factors that affect NPP in mining areas, which can be divided among climate, soil properties, and mining activities (Table 1). We used the extent of land degradation caused by coal mining to reflect the intensity of mining activities.
2.3.1. Soil Sampling
In July 2015, we evenly selected 117 soil sampling points in the Changhe Basin (Figure 1). Three topsoil samples within a radius of 5 m from each sampling point were collected and mixed. Topsoil was collected using a 100 cm3 ring knife. We measured the soil clay fraction (CF), soil organic carbon (SOC), total nitrogen (TN), available phosphorous (AP), available potassium (AK), pH, and bulk density (BD) in the laboratory [39,40,41,42,43,44,45]. We used kriging to interpolate the soil data to the same spatial resolution (30 m) as the NPP [46].
2.3.2. Geological Hazard Survey
In 2015, we conducted a field survey on geological hazards in the Changhe Basin, including destroyed land (e.g., land collapse, subsidence, and goaf), surface cracks, and seeper areas. Additionally, we obtained coal seam excavation engineering plans, uphole and downhole comparison map, the coal mining disturbance map, and the mine-field development map of the degraded sites. In our previous study [47], six indicators were used to evaluate degraded farmland, where the indicator weights were determined using the analytic hierarchy process (AHP) [48]. These indicators were also used in this study (Table S1). Finally, land degradation (LD) was quantified using Equation (5):
where Vi is the weight of indicator i, Wij is the value of the i-th indicator of the j-th pixel, m is the number of indicators, and the normalized interval of the quantization result is [0, 1]. The detailed method can be found in our previous study [47]. The land degradation results of this study are provided in Figure S2.
2.4. Driving Factor Analysis
2.4.1. Single Factor Analysis
We randomly selected 1000 points in the study area as sample points (Figure S3) because these points can basically cover the patches of various land use types in the Changhe basin. Then, we used ArcGIS 10.5 to extract the values of NPP and driving factors and SPSS25.0 software to conduct Pearson correlation analyses between NPP and drivers. Since the correlations between NPP and drivers are location-specific, the overall correlation coefficient (i.e., over an extensive area) cannot identify spatially local correlation features [49]. Hence, we calculated the geographic location correlation coefficient (LCC) between NPP and drivers through moving windows [50,51] and calculated the overall percentage of positive, negative, and insignificant correlations in the study area.
2.4.2. Contribution of Different Driver Categories to NPP
Random forest (RF) is a regression prediction model that comprises multiple decision trees [47,52] and has the advantages of clarity, easy interpretation, and high stability. Both categorical and continuous inputs are accepted by RF, which can handle high-dimensional data and is less prone to overfitting and multicollinearity issues [47]. Random forests can also assess the importance of variables (drivers), that is, the average contribution of each variable to each tree, which can clarify the relative contribution of variables [53]. We designed factorial experiments to distinguish the influence of climate, soil properties, and mining activities on NPP in the mining area (Figure S1c), whereby four separate RF models were used. Three of the models each excluded climate (RF_clim), soil properties (RF_soil), and mining activities (RF_mine), and one model included all drivers (RF_all). We used the 1000 sample point data (Figure S3) to perform the regression prediction of NPP using the RF models. We also used the mean drop in accuracy (MDA) to assess the importance of drivers. Details of the RF methods used can be found in previous studies [47,54]. The RF modeling experiments of driver importance were conducted using the ‘Random forest’ package in R [55]. We isolated the effects of the target drivers by comparing the differences in the experimental results and quantified their respective actual contributions [56]:
where Vi is the driving factor i, ActCon_Vi is the actual contribution of driving factor Vi, and RF_Vi is the regression result, excluding driving factor Vi.
Using the relative contribution to the mining area NPP of the three driver categories, the red-green-blue (RGB) combination of each pixel was derived from visualizing the influence of the driver categories. Moreover, we defined a single dominant driver category for each pixel as a factor with a relative contribution greater than 60%. If the relative contribution of each single drive category is below this threshold, the dominant drive category for that pixel is defined as the combination of the two drive categories with larger relative contributions among the three drive categories.
3. Results
3.1. Simulation Results of NPP in the Mining Area
In 2015, we selected two equal-area plots, A and B, in the study area, measured the aboveground plant biomass after felling the plants one by one, and then used the carbon content (45%) to convert the dry weight of the biomass into carbon weight [57]. Meanwhile, we obtained the 2015 NPP product MOD17A3 (Spatial resolution 500 m) from USGS. We compared the simulated value with the measured value and the MOD17A3 value to verify the accuracy of the model simulation. The results showed a small difference between the simulated and measured values, and the average values of various land use types of the simulated values were similar to those of the MOD17A3 product (Table 2), indicating that the NPP estimated in this study was reliable. The distribution map of annual average NPP from 2010 to 2015 indicated that NPP in the Changhe Basin ranged from 0.74 gC/(m2·yr) to 649.72 gC/(m2·yr), with an average value of 290.13 gC/(m2·yr) and a standard deviation of 110.18 gC/(m2·yr). The coefficient of variation was 37.98% (Figure 2). Further, NPP in the Changhe Basin varied in different locations. Considering the Changhe River as the boundary, NPP in the west of the Changhe Basin was significantly smaller than that in the east. This clear pattern of east-west differentiation was also reflected in the degree of land degradation (Figure S2).
3.2. Influence of a Single Driver
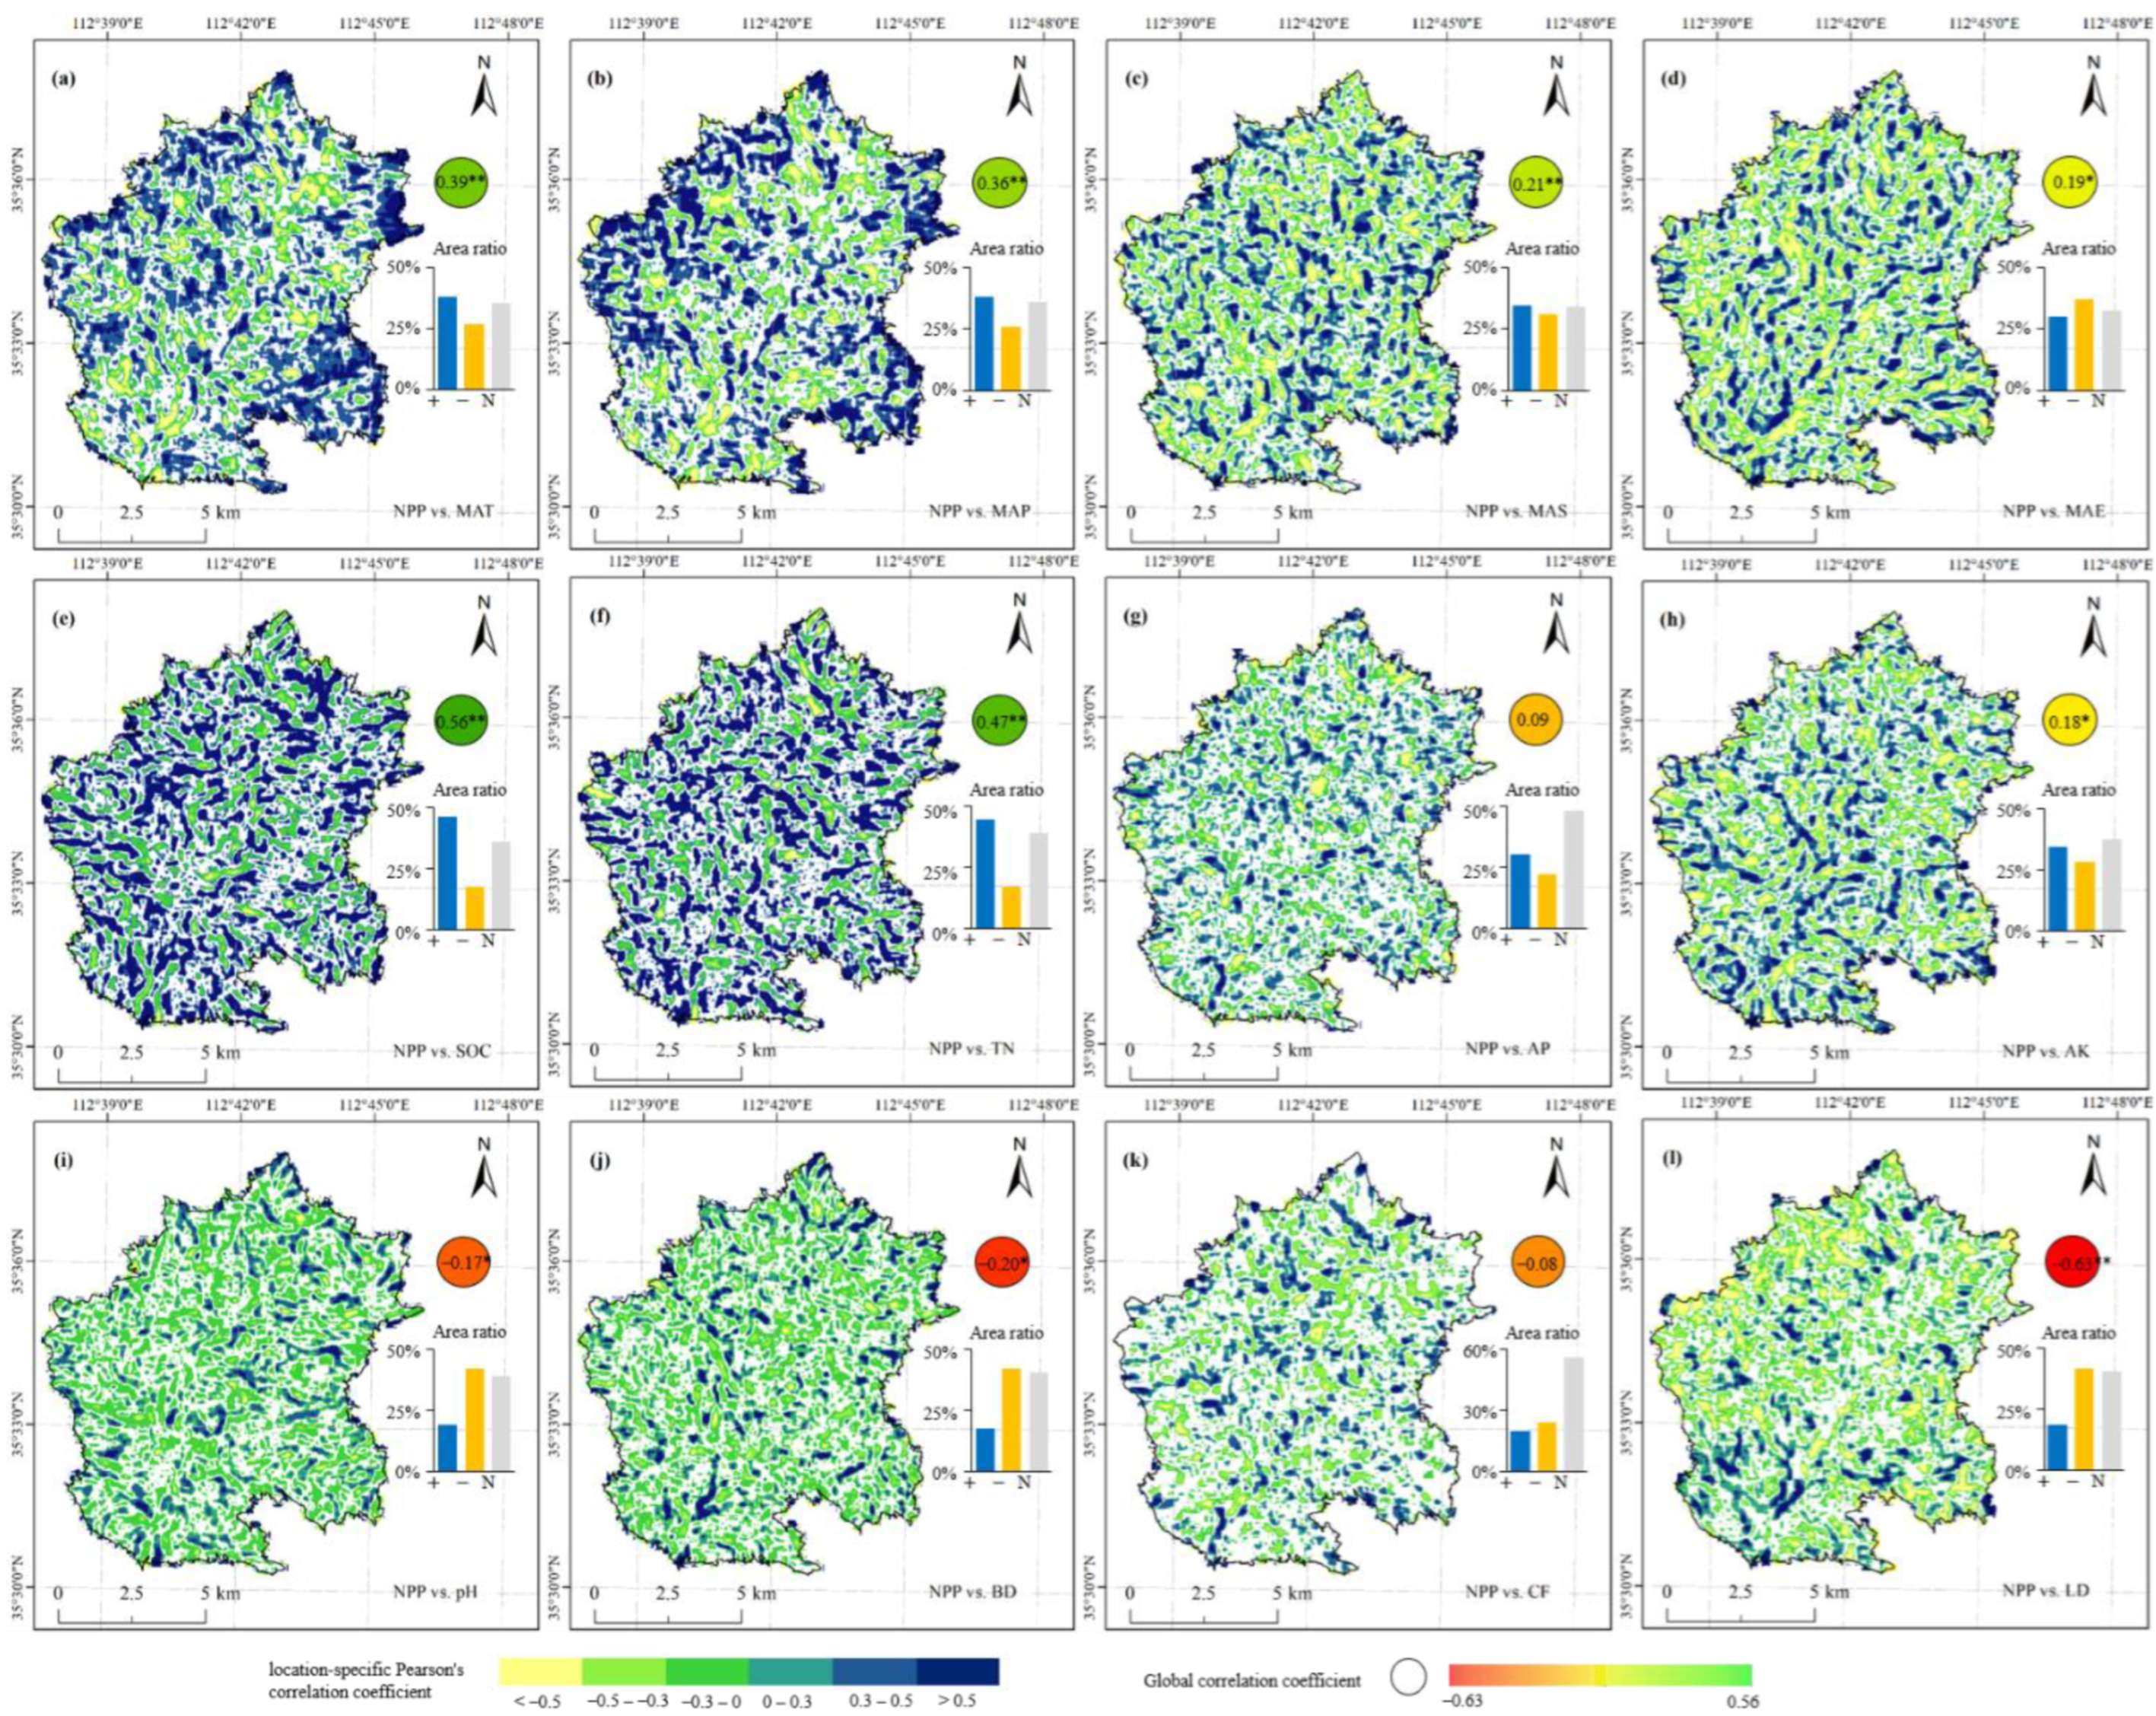
The colored circles in Figure 3 represent the overall Pearson correlation coefficients between NPP and individual drivers. Overall, NPP was significantly correlated with the mean annual temperature (MAT), mean annual precipitation (MAP), SOC, and TN at p < 0.01, and with pH and BD at p < 0.05. A significant correlation was not observed between NPP and AP or CF (p > 0.05). Contradictory and complex relationships for location-specific Pearson correlation coefficients were observed between NPP and the drivers (Figure 3). For example, NPP was significantly positively correlated with MAT and MAP as a whole; however, at a localized level, the high-altitude areas on the east and west sides of the Changhe Basin were strongly positively correlated, and the low-altitude area in the center was mostly negatively correlated. This suggests a local dependency between NPP and drivers in the Changhe Basin. Areas of significant positive and negative correlations between NPP and mean annual solar radiation (MAS), mean annual evapotranspiration (MAE), AP, AK, and CF were scattered and cross-distributed. Over the entire study area, NPP showed a significantly positive correlation with SOC and TN (LCC > 0.5). Conversely, NPP showed a significantly negative correlation with pH and BD (−0.5 < LCC < 0). Additionally, LD had a strong negative effect on NPP, especially in the western part of the basin, where coal mining operations are intense. The significantly negative correlation area ratio of NPP with MAE, pH, BD, and LD was higher than the significantly positive correlation, while the remaining driving factors showed the opposite trend (Figure 3 inset). The area ratio of the insignificant correlation between NPP and AP and CF was much higher than that of the significantly positive or negative correlation area, indicating that AP and CF had relatively little spatial influence on NPP. Spatially, if the significantly positive correlation area ratio is the largest, the overall correlation is positive and significant. Similarly, if the area ratio of significantly negative correlation is the largest, the overall correlation is negative and significant, and if the area ratio of insignificant correlation is the largest, the overall correlation is insignificant.
3.3. Impact of Driver Categories
3.3.1. Relative Importance of Drivers
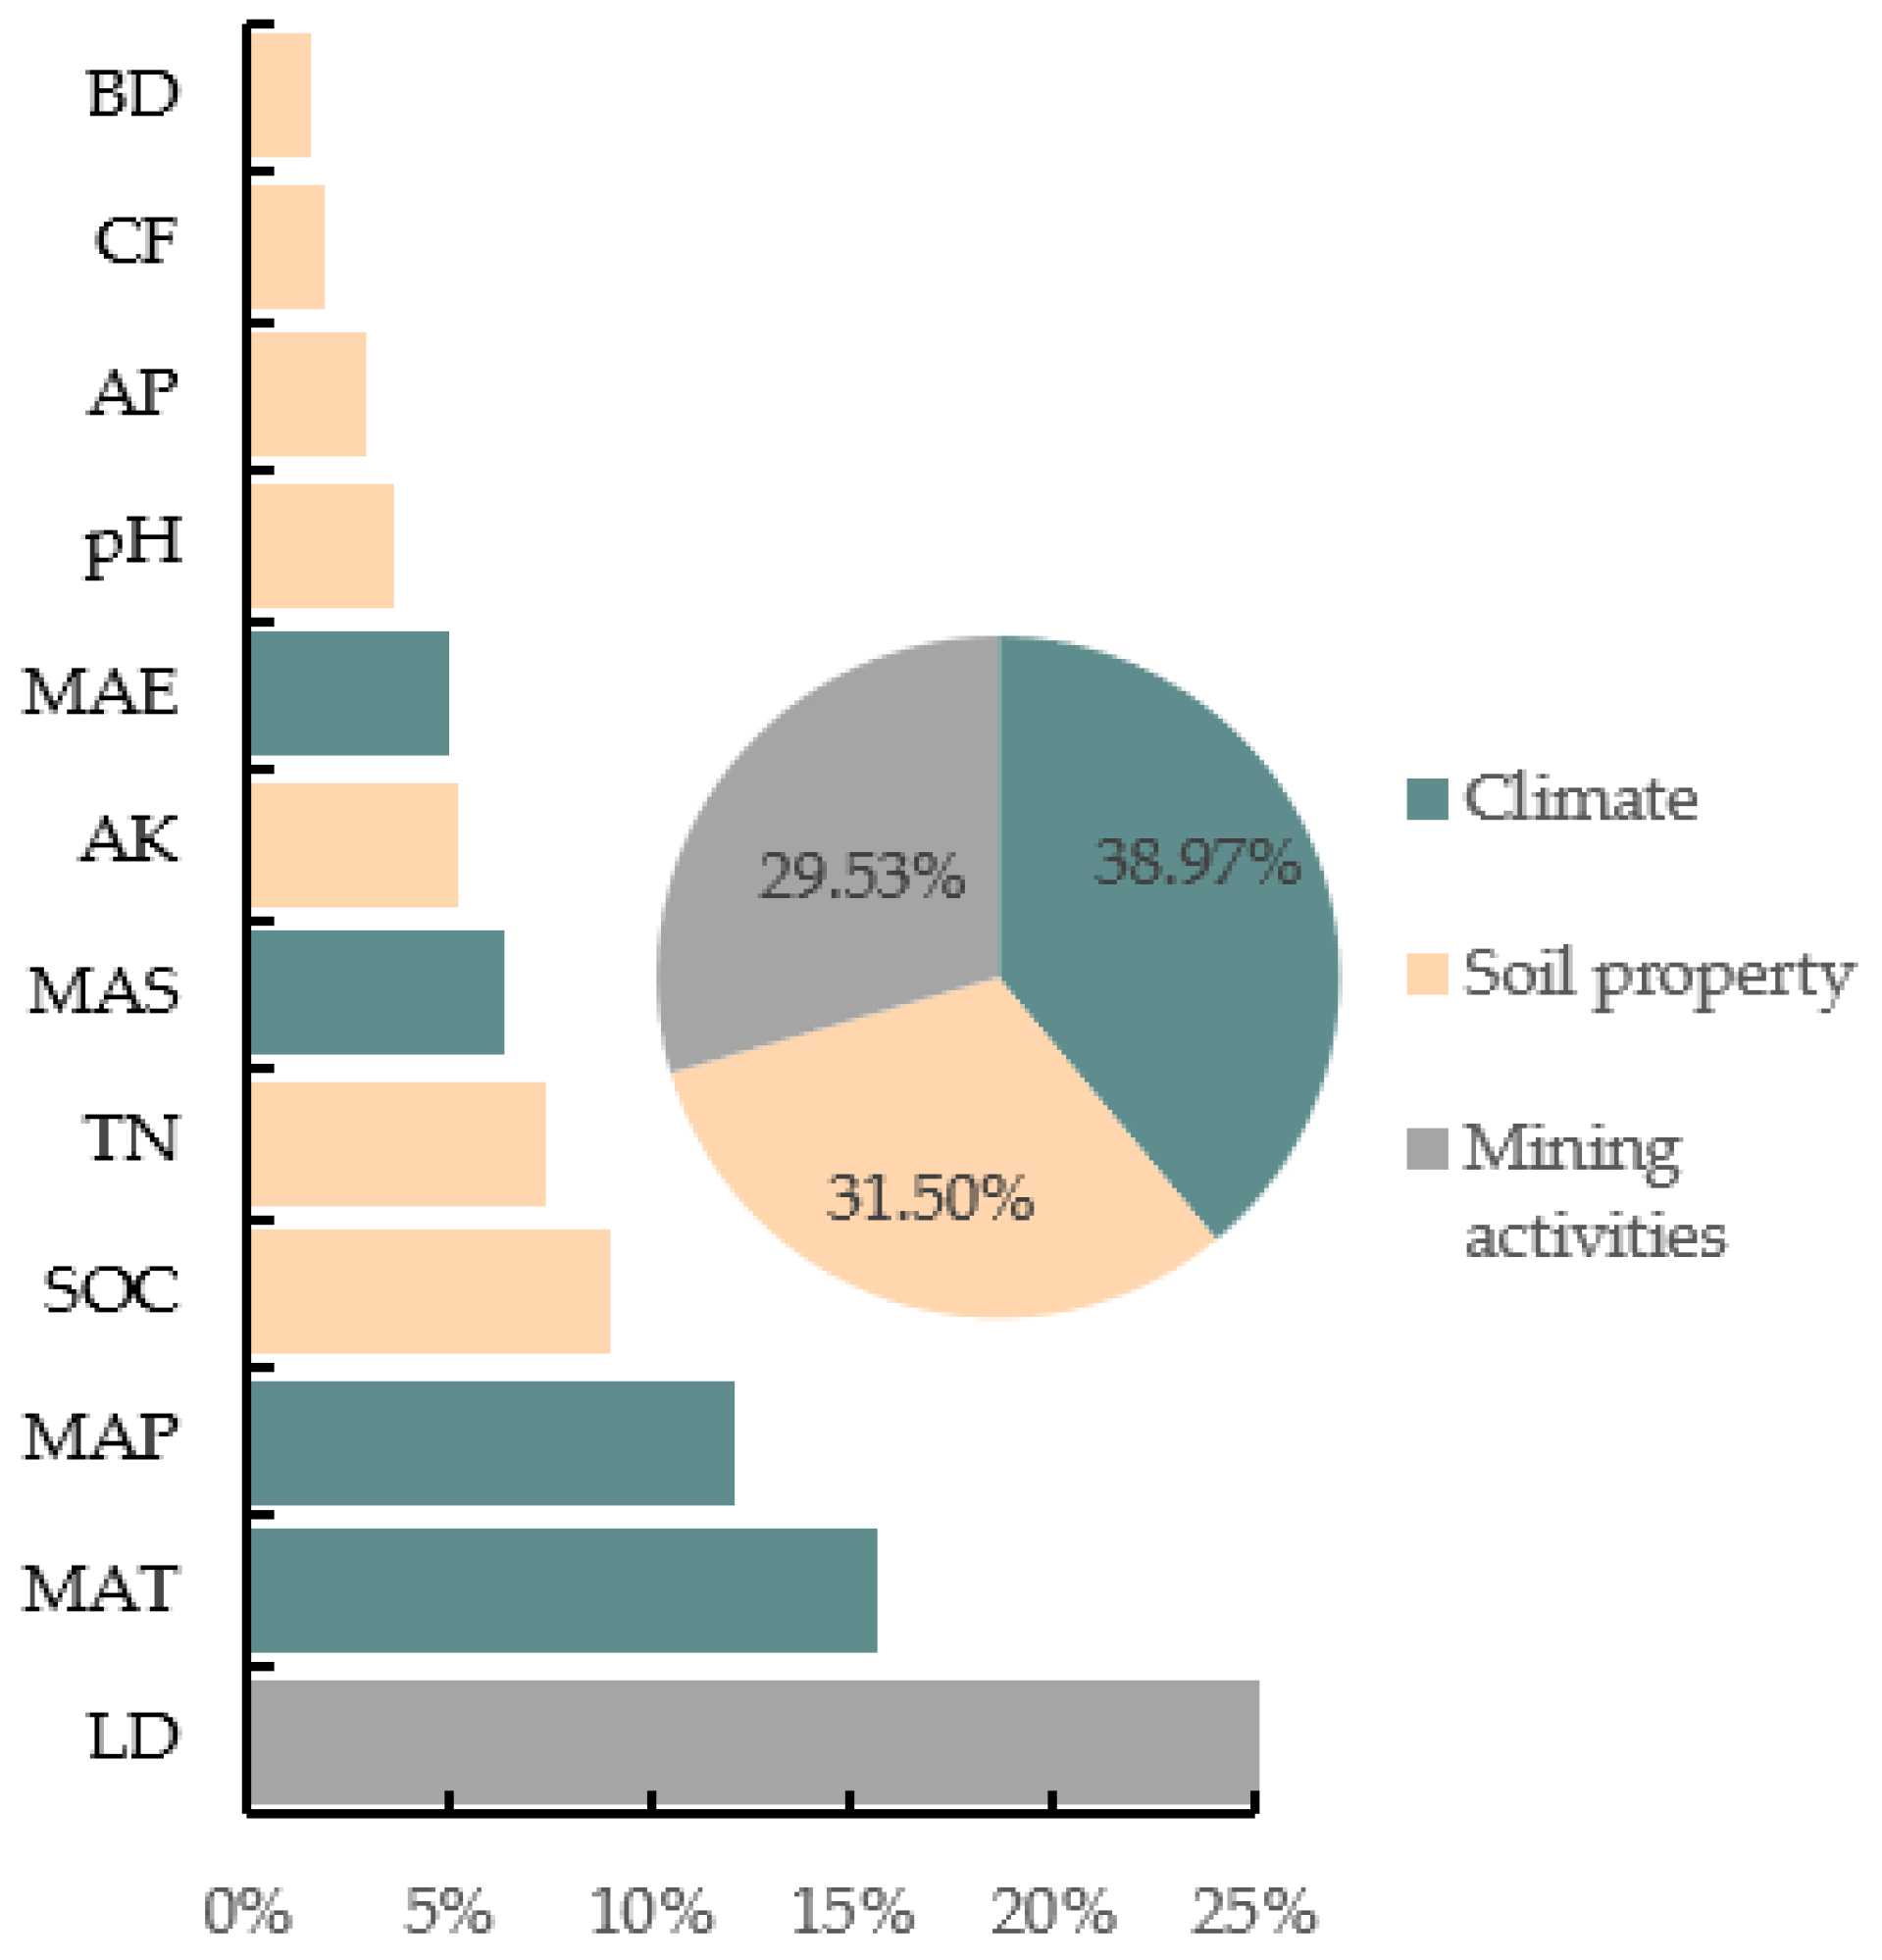
We analyzed the relative importance of each factor in the RF model experiment using all drivers (RF_all) and adjusted the sum of the driver importance to 100% [47] (Figure 4). Drivers with greater than 5% importance were LD, MAT, MAP, SOC, TN, MAS, and AK (Figure 4). The most important driver of NPP in the mining areas was LD. Moreover, the results demonstrated that the importance of climate, soil properties, and mining activities on the NPP of the mining area was 38.97%, 31.50%, and 29.53%, respectively.
3.3.2. Relative Contributions of Different Driver Categories
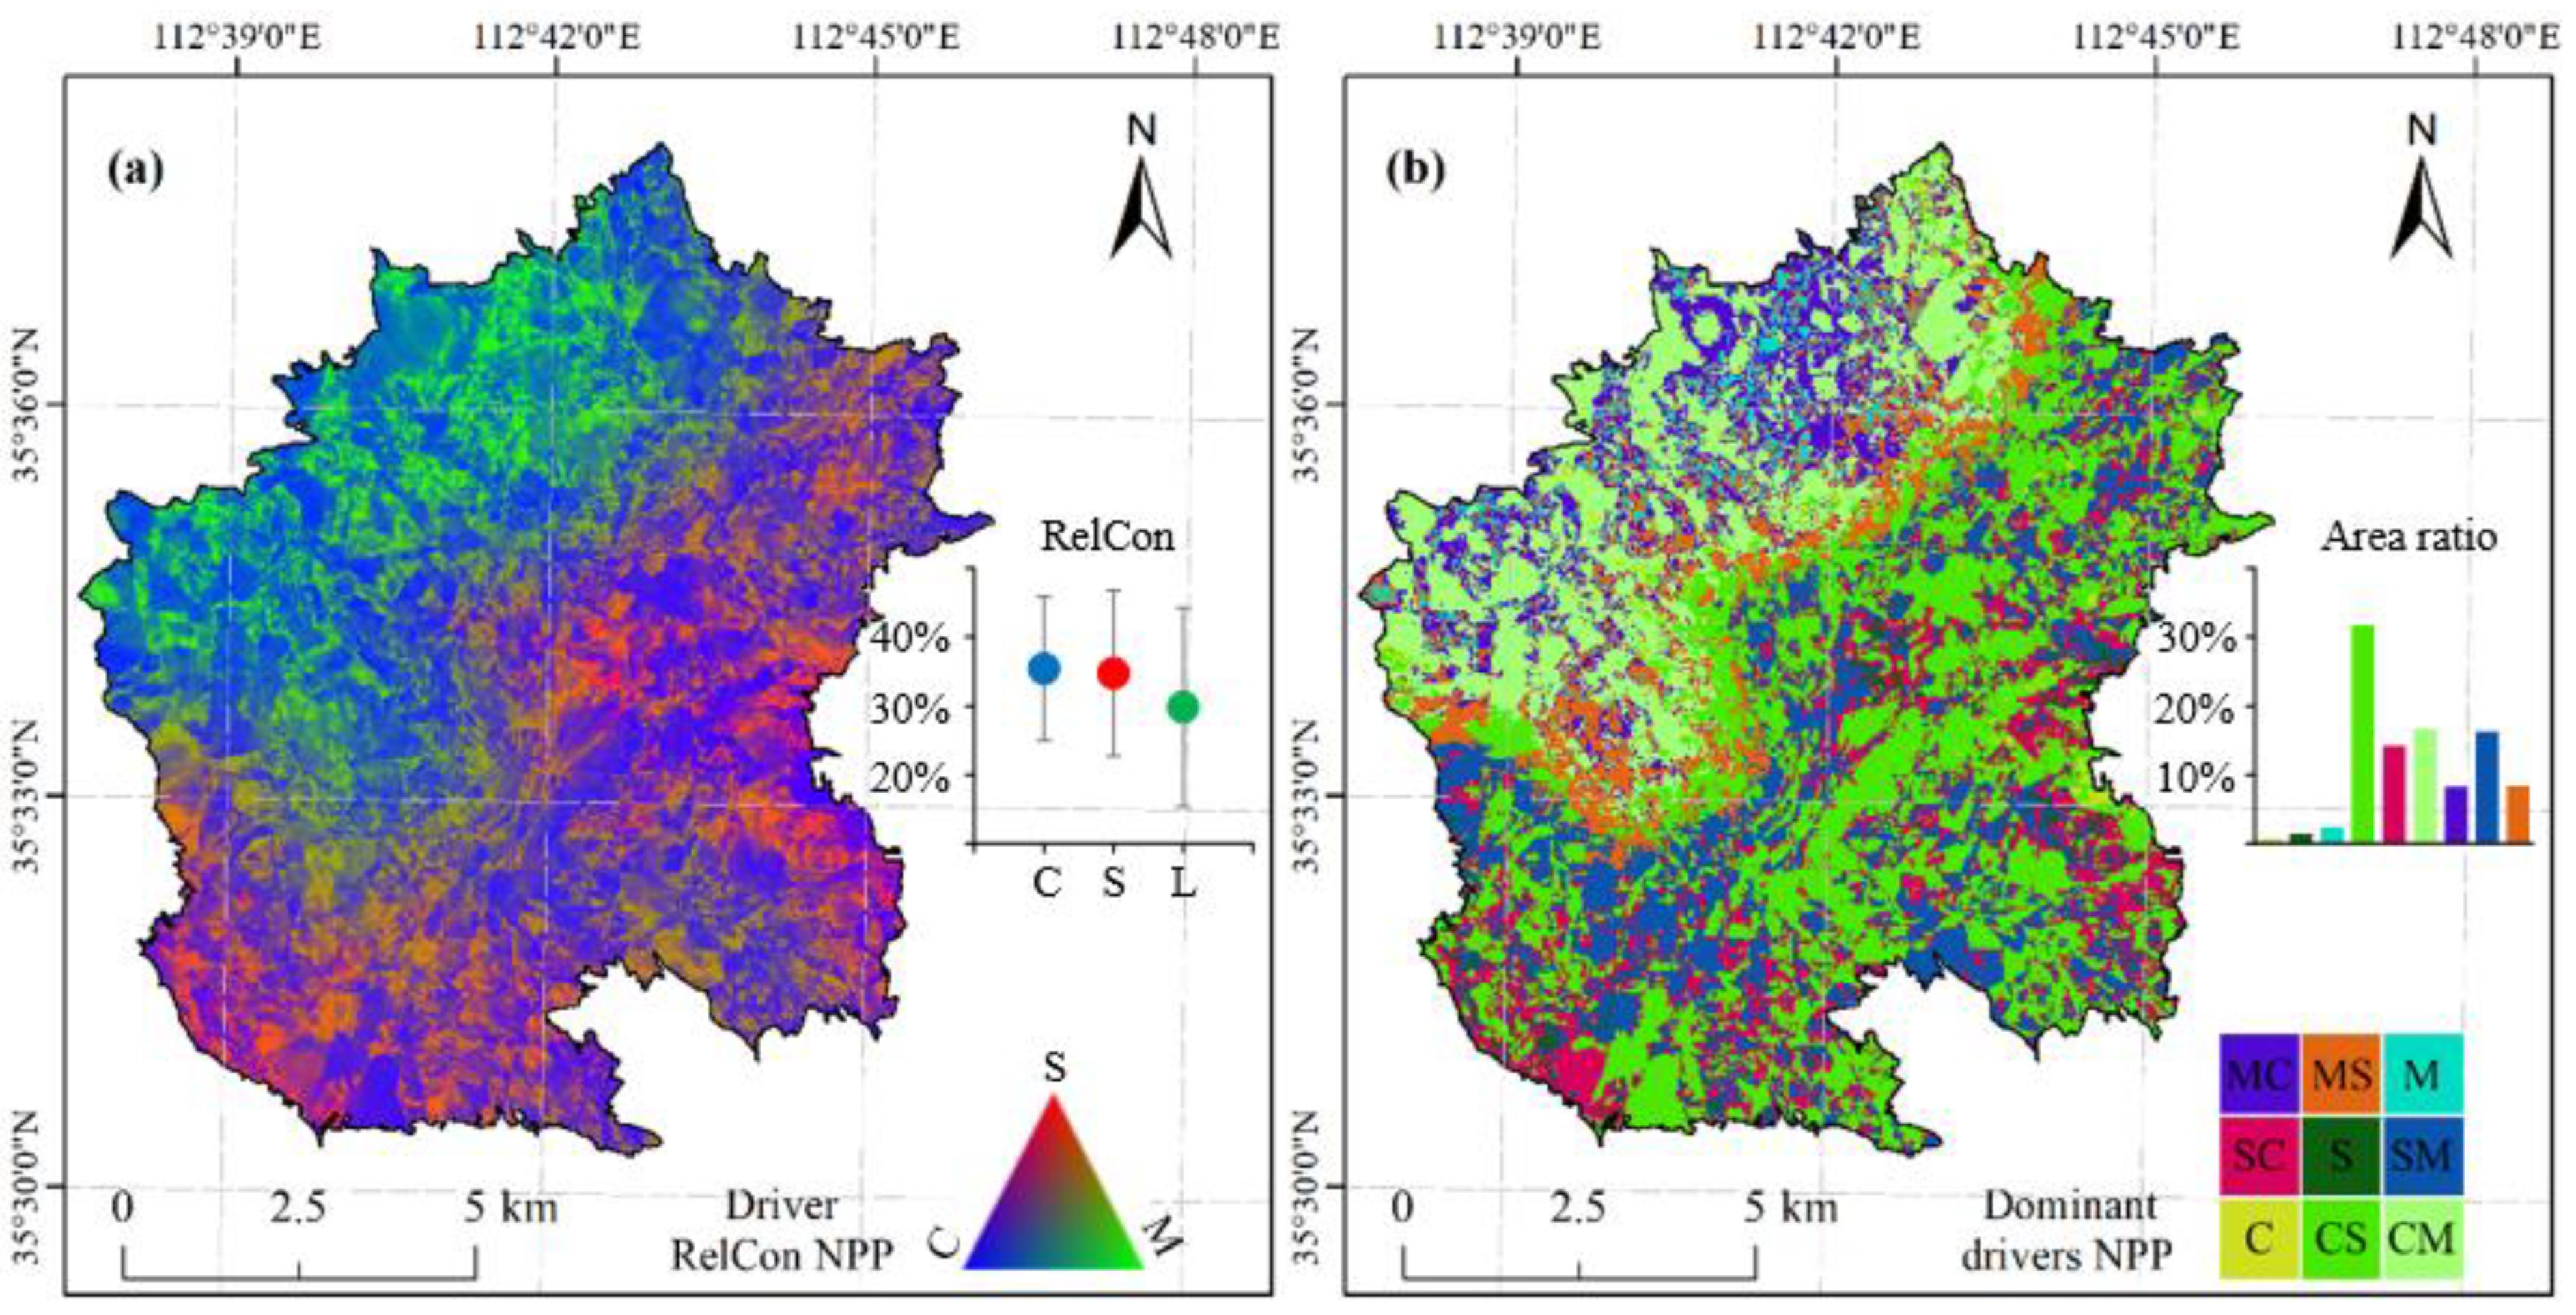
The RGB combinations of the relative contributions (RelCon) of the three driver categories (climate, soil properties, and mining activities) are presented in Figure 5a. Climate, soil properties, and coal mining activities have different RelCon to driving NPP variation in the mining area of the Changhe River Basin at different spatial locations (Figure 5). Overall, the average RelCon of climate, soil properties, and mining activities to NPP in the mining area were 35.4%, 34.7%, and 29.8%, respectively (Figure 5a inset), indicating that climate was the most important driving factor controlling the spatial variability of NPP in the Changhe Basin; however, the influence of soil properties and mining activities cannot be ignored. The NPP areas predominantly influenced by climate were widely distributed in the Changhe Basin (Figure 5a, blue), whereas the NPP areas predominantly influenced by soil were mainly the eastern and southeastern parts of the Changhe Basin (Figure 5a, red). The areas of NPP predominantly influenced by mining activities were mainly in the western Changhe Basin (Figure 5a, green). There was a clear transition between the soil- and coal mining-dominant areas in the center of the basin, where the combined influence of soil properties and mining activities on NPP were distributed (Figure 5). Figure 5b reveals a heterogeneous geographic pattern of the interaction of dominant driving categories in the NPP spatial distribution in the mining area. Independent single drivers (climate, soil properties, and mining activities) had a limited impact on the spatial variation in NPP across the Changhe Basin (Figure 5b). Interestingly, in the single driver category, the ability of mining activities to explain NPP variability was stronger than that of climate or soil properties, and the dominant areas of influence of mining activities on NPP were in the northwest part of the basin, indicating that mining activities are an important factor controlling the spatial variation of NPP in the mining area. The coupled effects of climate and soil properties dominated the NPP variability in the eastern part of the basin, and climate and mining activities dominated the NPP variability in the western part of the basin. Notably, the coupling effect of climate and other factors controlled the NPP variation in 70.72% of the area of the Changhe Basin, and the area with the greatest climate effect accounted for 48.28% of the Basin area (Figure 5b).
4. Discussion
4.1. Importance of Drivers and Spatial Heterogeneity of Different Driver Categories on the Driving NPP
Land degradation resulting from coal mining activities was the most important driver of NPP variability in the mining areas (Figure 4), which mainly drove NPP in the western Changhe Basin (Figure 5). In this study, coal mining, as a violent human activity, subversively changes the structure of the land and destroys the basic conditions for vegetation growth, including but not limited to directly removing vegetation, changing vegetation types, and destroying chlorophyll in vegetation leaves [5,6,26]. For instance, coal mining activities cause surface subsidence, surface cracks, and changes in surface microtopography, which changes the growth environment of vegetation roots [58], and coal transportation, washing, and processing directly occupy the vegetation growth area [59]. Thus, mining activities have resulted in the degradation or death of large vegetation areas, which directly affected the spatial variation of NPP in these areas. Moreover, topsoil removal and tailings dumping during mining altered soil physicochemical properties, disturbed soil structure, and indirectly hindered nutrient uptake by vegetation [60,61]. Meanwhile, the emission of dust and pollutants contaminate the surrounding air, soil, and water bodies, which indirectly affects vegetation growth [47]. Moreover, the studies of Fu et al. [62] and Yang et al. [63] showed that human activities such as coal mining caused a large loss of vegetation NPP in mining areas. Therefore, empirical scientific remodeling of landforms, soil reconstruction, land reclamation, and ecological restoration can slow down the disturbance of coal mining activities to vegetation and improve the vegetation productivity of mining areas.
In addition to mining activities, climatic factors have a substantial impact on vegetation transformation [33,64,65]. In this study, the highest contribution to NPP variability was climate (38.97%, Figure 4), and it showed a strong contribution over a wider area (Figure 5). This seems to be common sense because a large number of studies have shown that climate affects soil moisture and temperature, groundwater level, and vegetation transpiration, which in turn affects plant growth, where hydrothermal conditions directly affect vegetation formation and distribution, especially at different altitudes [66,67]. This study has shown that temperatures are relatively low at high altitudes where forests are the dominant vegetation, and temperature, precipitation, and evaporation are the main limiting factors for forest NPP. However, in low-altitude farmlands, where temperatures are relatively high and the main growing season is summer, the increase in temperature increases evaporation, thereby reducing the available water for crops and vegetation and leading to lower NPP. Solar radiation can promote or weaken NPP because it affects photosynthesis [68]. Although the extent of the Changhe Basin is small and stable under climate change, the influence of climatic factors on NPP was found to be significant, indicating that the microclimate in this area adjusts hydrological functioning, thereby affecting vegetation growth and NPP. This is consistent with the findings of Sun et al. [69], who highlighted the importance of climatic factors in influencing NPP.
The main soil factors affecting NPP variation were SOC and TN (Figure 4), as they are the key indicators of the soil-vegetation carbon cycle and affect plant growth and distribution [70,71,72]. In our study, soil nutrients contributed 28.06% of the influence on NPP. In general, soil nutrients have complex effects on plant growth habits [73,74]. Specifically, lower nutrient availability reduces plant productivity because plants are forced to devote more resources to obtaining nutrients in favor of growth [75,76]. Soil structural factors (e.g., soil texture and BD) can also affect vegetation productivity by regulating plant water and soil nutrient availability [17,77]. Furthermore, the geographic pattern of soil nutrients contributes significantly to regional vegetation productivity, and our previous study showed that the soil quality in the eastern Changhe Basin was higher than that in the western part [78], which is consistent with the results of this study, and the driving of NPP by soil properties is more likely to occur in the eastern Changhe Basin (Figure 5).
4.2. Key Role of Soil Properties and Mining Activities in Improving NPP Estimates in Mining Areas
We selected seven common soil attributes that represent the soil environment in which plants grow. Soil quality plays a key role in vegetation productivity in both agricultural and natural systems [71]. For example, numerous studies have shown that soil quality is significantly correlated with forest and grassland biomass [79,80]. Crop yields have also been reported to be significantly correlated with soil fertility [72,81,82]. Our previous study suggested a strong interaction between NPP and SOC in the Changhe Basin mining area [47]. In this study, we observed that the relative contributions of soil properties and climate to the spatial variation in NPP both approached 35% (Figure 5a inset). However, current classical vegetation productivity models are driven by climatic factors, such as the Miami [83], BIOME-BGC [84], and CASA models [30], and only a few models focus on soil carbon and nitrogen [1]. This may be because of the poor availability of data on soil properties, which are required for estimating vegetation productivity, where data acquisition is challenging, particularly at large scales. However, with the development of large-scale soil monitoring technology, it is expected that dynamic soil data at the regional scale will be more readily available in the future. Therefore, future productivity models should fully consider soil properties, which may substantially improve the accuracy of productivity simulations.
The response of vegetation to mining activities is complex and depends on the mode and intensity of mining. Many studies have quantified the impact of coal mining activities on NPP by comparing the spatiotemporal differences in vegetation in coal mining and non-coal mining areas [5,6,26]. Our research quantified the land degradation resulting from coal mining by analyzing geological hazard surveys to reflect coal mining intensity, which is beneficial for spatially quantifying and separating the impact of coal mining on vegetation. The results showed that the vegetation productivity in the severely degraded areas of the western Changhe Basin was significantly lower than that in the east, and NPP improvement was inhibited by intensive coal mining activities. Mining activities or the coupling effect of mining activities and climatic factors were the predominant drivers affecting NPP in the western Changhe Basin mining area. It is worth noting that the LCC between LD and NPP was not entirely negative, and an improvement effect in areas where coal mining activities were not intensive (part of the southwest of the Changhe Basin) was observed (Figure 3l). This indicates that setting a reasonable mining intensity may be beneficial for the recovery of NPP. A strong spatial dependence of NPP on mining activities is evident in the study area, and the impact of mining activities should, therefore, be fully considered in the measurement of NPP in this area.
In conclusion, under future evaluation or statistical models, the estimation of NPP should fully consider soil properties and mining activities. Similarly, the unique environmental impacts associated with specific geographic areas should be considered. This helps to optimize the spatial distribution model of NPP in local areas and to better understand the dynamics and development potential of NPP in specific areas.
4.3. Impact and Uncertainty
The RGB composite of the relative contributions of climate, soil properties, and mining activities and the spatial estimation of dominant driver categories could identify the strongest constraints on vegetation productivity at specific locations. Evidence suggests that NPP in the mining areas in the western Changhe Basin was mainly limited by mining activities and climatic factors (Figure 5), whereas that in the eastern Changhe Basin was constrained by soil properties in areas where coal mining activities were less intense. Therefore, ecosystem protection and land reclamation management strategies in mining areas can be determined accordingly. For example, in areas with intense coal mining activities, vegetation productivity is determined by climate and mining activities. Hence, coal mining intensity should be reduced, and reclamation should occur simultaneously with mining activities to reduce land degradation and increase vegetation productivity [5,85]. For areas with higher soil constraints, management strategies should focus on improving soil quality and ecological remediation [86]. Overall, management priorities can be identified according to the main constraints for NPP in mining areas, which can contribute to localized conservation strategies.
However, uncertainties and limitations are present in this study. These include the estimation of vegetation NPP using ESTARFM and CASA models. The accuracy and results of the experiments still need to be improved. Furthermore, our study only considered mining and did not fully consider other anthropogenic activities that may affect NPP variation, such as the duration of land reclamation, irrigation levels, and fertilization, which are also key drivers of NPP variation in mining areas. Combining these drivers may provide superior analysis of the variation in NPP in mining areas. Therefore, future research should explore the impact of other driving factors on NPP in mining areas more comprehensively.
5. Conclusions
This study simulated the vegetation productivity pattern in the Changhe Basin mining area using ESTARFM and CASA models. The spatial influence of climate, soil properties, and mining activities on NPP in mining areas was also revealed. The results show that the NPP in the eastern Changhe Basin mining area was higher than that in the west, and climate, soil properties, and mining activities were the crucial drivers affecting the spatial variation in NPP. At different spatial locations, NPP had a stronger correlation with MAT, MAP, SOC, TN, and LD. Soil properties and mining activities were the main controlling factors affecting NPP in the eastern and western Changhe basins, respectively, and the coupling effect of climate and other driver categories controlled the spatial variation of NPP in 70.72% of the mining areas. Climate and mining activities were the most important driver categories of NPP in the western Changhe Basin, whereas climate and soil properties were the most important driver categories of NPP in the eastern Changhe Basin. Our results highlight the necessity of introducing soil properties into the NPP simulations. Meanwhile, combining the influence of mining activities may substantially improve the accuracy of simulating NPP in mining areas, and other special geographical areas should also consider their unique environmental impact factors. Our results provide an RGB map of the relative contributions of the three driver categories and a spatial estimate of the dominant driving category that clarifies which regions are primarily influenced by which drivers. These two maps present the impact of the three driver categories on NPP at different locations and provide a reference for location-based strategies and practices for ecological restoration and land reclamation.
Supplementary Materials
The following supporting information can be downloaded at: https://www.mdpi.com/article/10.3390/rs14174177/s1, Figure S1: Flowcharts for the simulation of NPP in mining areas and experimental design for driving factors analysis; Figure S2: Spatial distribution of land degradation in Changhe Basin; Figure S3: Spatial distribution of 1000 randomly sampled points; Table S1: Quantitative indicator system of land degradation.
Author Contributions
Conceptualization, H.T. and W.Z.; methodology, H.T.; software, S.L.; validation, S.L., J.S. and J.Z.; formal analysis, Y.Z. and H.T.; investigation, H.T. and R.B.; resources, R.B.; data curation, H.T. and R.B.; writing—original draft preparation, H.T.; writing—review and editing, W.Z.; visualization, H.T.; supervision, W.Z.; project administration, J.Z.; funding acquisition, J.Z. and H.T. All authors have read and agreed to the published version of the manuscript.
Funding
This research was funded by the National Natural Science Foundation of China (No.42171112), the Henan University Postgraduate Talents Project (No: SYL20060133), the National Demonstration Center for Experimental Environment and Planning Education (Henan University) Funding Project (No: 2020HGSYJX005), and the Key Research and Development Project in Henan Province (No: 212102310415, 222102320322 and 212102310847).
Data Availability Statement
Not applicable.
Conflicts of Interest
The authors declare no conflict of interest.
References
- Cramer, W.; Kicklighter, D.; Bondeau, A.; Iii, B.M.; Churkina, G.; Nemry, B.; Ruimy, A.; Schloss, A. Comparing global models of terrestrial net primary productivity (npp): Overview and key results. Glob. Change Biol. 1999, 5, 46–55. [Google Scholar] [CrossRef]
- Han, J.; Hu, Z.; Wang, P.; Yan, Z.; Li, G.; Zhang, Y.; Zhou, T. Spatio-temporal evolution and optimization analysis of ecosystem service value—A case study of coal resource-based city group in Shandong, China. J. Clean. Prod. 2022, 363, 132602. [Google Scholar] [CrossRef]
- Zhang, J.; Fu, M.; Hassani, F.P.; Zeng, H.; Geng, Y.; Bai, Z. Land Use-Based Landscape Planning and Restoration in Mine Closure Areas. Environ. Manag. 2011, 47, 739–750. [Google Scholar] [CrossRef] [PubMed]
- Hui, J.; Bai, Z.; Ye, B.; Wang, Z. Remote Sensing Monitoring and Evaluation of Vegetation Restoration in Grassland Mining Areas—A Case Study of the Shengli Mining Area in Xilinhot City, China. Land 2021, 10, 743. [Google Scholar] [CrossRef]
- Tian, H.; Zhang, X.; Bi, R.; Zhu, H.; Xi, X. An assessment of the carbon sequestration loss of farmland ecosystems caused by coal mining. J. China Coal Soc. 2020, 45, 1499–1509. [Google Scholar]
- Hou, H.; Zhang, S.; Ding, Z.; Gong, Y.; Ma, C. Study on the measurement of ecological loss based on the net primary productivity in coal mines. J. China Coal Soc. 2012, 37, 445–451. [Google Scholar]
- Gang, C.; Zhang, Y.; Wang, Z.; Chen, Y.; Yang, Y.; Li, J.; Cheng, J.; Qi, J.; Odeh, I. Modeling the dynamics of distribution, extent, and npp of global terrestrial ecosystems in response to future climate change. Glob. Planet. Chang. 2017, 148, 153–165. [Google Scholar] [CrossRef]
- Wang, C.; Jiang, Q.; Engel, B.; Mercado, J.A.V.; Zhang, Z. Analysis on net primary productivity change of forests and its multi–level driving mechanism—A case study in Changbai Mountains in Northeast China. Technol. Forecast. Soc. Chang. 2020, 153, 119939. [Google Scholar] [CrossRef]
- Zarei, A.; Chemura, A.; Gleixner, S.; Hoff, H. Evaluating the grassland NPP dynamics in response to climate change in Tanzania. Ecol. Indic. 2021, 125, 107600. [Google Scholar] [CrossRef]
- Hasenauer, H.; Nemani, R.; Schadauer, K.; Running, S. Forest growth response to changing climate between 1961 and 1990 in Austria. For. Ecol. Manag. 1999, 122, 209–219. [Google Scholar] [CrossRef]
- Vicente-Serrano, S.; Cuadrat-Prats, J.; Romo, A. Aridity influence on vegetation patterns in the middle Ebro Valley (Spain): Evaluation by means of AVHRR images and climate interpolation techniques. J. Arid Environ. 2006, 66, 353–375. [Google Scholar] [CrossRef]
- Li, W.; Yang, X.; Saintilan, N. Local climate determines the NDVI-based primary productivity and flooding creates heterogeneity in semi-arid floodplain ecosystem. Ecol. Model. 2012, 242, 116–126. [Google Scholar]
- Tian, H.; Bi, R.; Zhu, H.; Yan, J. Driving factors and gradient effect of net primary productivity in Fenhe River Basin. Chin. J. Ecol. 2019, 38, 3066–3074. [Google Scholar]
- Zhang, M.; Yuan, N.; Lin, H.; Liu, Y.; Zhang, H. Quantitative estimation of the factors impacting spatiotemporal variation in NPP in the Dongting Lake wetlands using Landsat time series data for the last two decades. Ecol. Indic. 2022, 135, 108544. [Google Scholar] [CrossRef]
- Lin, J.; Zhou, S.; Liu, D.; Zhang, S.; Yu, Z.; Yang, X. Relative contribution of environmental and nutritional variables to net primary production of Cynodon dactylon (Linn.) Pers in the riparian zone of a Three Gorges tributary. Ecol. Evol. 2020, 10, 7073–7081. [Google Scholar] [CrossRef] [PubMed]
- Ali, A.; Sanaei, A.; Li, M.; Asadi Nalivan, O.; Ahmadaali, K.; Pour, M.J.; Valipour, A.; Karami, J.; Aminpour, M.; Kaboli, H.; et al. Impacts of climatic and edaphic factors on the diversity, structure and biomass of species-poor and structurally-complex forests. Sci. Total Environ. 2020, 706, 135719. [Google Scholar] [CrossRef]
- Quinto-Mosquera, H.; Moreno, F. Net Primary Productivity and Edaphic Fertility in Two Pluvial Tropical Forests in the Choco Biogeographical Region of Colombia. PLoS ONE 2017, 12, 15. [Google Scholar]
- Pan, Y.; McGuire, A.D.; Kicklighter, D.W.; Melillo, J.M. The importance of climate and soils for estimates of net primary production: A sensitivity analysis with the terrestrial ecosystem model. Glob. Chang. Biol. 1996, 2, 5–23. [Google Scholar] [CrossRef]
- Aragão, L.E.O.C.; Malhi, Y.; Metcalfe, D.B.; Silva-Espejo, J.E.; Jiménez, E.; Navarrete, D.; Almeida, S.; Costa, A.C.L.; Salinas, N.; Phillips, O.L.; et al. Above-and below-ground net primary productivity across ten Amazonian forests on contrasting soils. Biogeosciences 2009, 6, 2441–2488. [Google Scholar] [CrossRef]
- Jiao, C.; Yu, G.; He, N.; Ma, A.; Ge, J.; Hu, Z. Spatial pattern of grassland aboveground biomass and its environmental controls in the Eurasian steppe. J. Geogr. Sci. 2017, 27, 3–22. [Google Scholar] [CrossRef]
- Yang, Y.; Erskine, P.; Zhang, S.; Wang, Y.; Bian, Z.; Lei, S. Effects of underground mining on vegetation and environmental patterns in a semi-arid watershed with implications for resilience management. Environ. Earth Sci. 2018, 77, 605. [Google Scholar] [CrossRef]
- Wang, S.; Cao, Y.; Pietrzykowski, M.; Zhou, W.; Bai, Z. Research on the influence of vegetation restoration in loess open-pit coal mines of China: Influencing factors and mechanism. Ecol. Eng. 2022, 177, 106549. [Google Scholar] [CrossRef]
- Yan, D.; Zhao, F.; Sun, O. Assessment of vegetation establishment on tailings dam at an iron ore mining site of suburban Beijing, China, 7 years after reclamation with contrasting site treatment methods. Environ. Manag. 2013, 52, 748–757. [Google Scholar] [CrossRef] [PubMed]
- Zhang, Z.; Wang, J.; Feng, Y. Linking the reclaimed soils and rehabilitated vegetation in an opencast coal mining area: A complex network approach. Environ. Sci. Pollut. Res. 2019, 26, 19365–19378. [Google Scholar] [CrossRef] [PubMed]
- Alfan, E.S.; Fuad, M. Study amendment of post-field classification of illegal gold in Kolaka Regency, Southeast Sulawesi Province. In Proceedings of the 3rd International Conference on Energy, Environmental and Information System (ICENIS 2018), Semarang, Indonesia, 14–15 August 2018. [Google Scholar]
- Huang, Y.; Tian, F.; Wang, Y.; Wang, M.; Hu, Z. Effect of coal mining on vegetation disturbance and associated carbon loss. Environ. Earth. Sci. 2015, 73, 2329–2342. [Google Scholar] [CrossRef]
- Xu, Z.; Feng, J.; Zhang, Y.; Zhu, H.; Yu, J. Pre-evaluation of disturbance of farmland soil and vegetation carbon pool by mining subsidence in coal face. J. China Coal Soc. 2018, 43, 2605–2617. [Google Scholar]
- Wang, Q.; Zeng, J.; Leng, S.; Fan, B.; Tang, J.; Jiang, C.; Huang, Y.; Zhang, Q.; Qu, Y.; Wang, W.; et al. The effects of air temperature and precipitation on the net primary productivity in China during the early 21st century. Front. Earth Sci. 2018, 12, 818–833. [Google Scholar] [CrossRef]
- Luo, Z.; Wu, W.; Yu, X.; Song, Q.; Yang, J.; Wu, J.; Zhang, H. Variation of Net Primary Production and Its Correlation with Climate Change and Anthropogenic Activities over the Tibetan Plateau. Remote Sens. 2018, 10, 1352. [Google Scholar] [CrossRef]
- Potter, C.; Randerson, J.; Field, C.; Matson, A.; Klooster, S. Terrestrial ecosystem production: A process model based on global satellite and surface data. Glob. Biogeochem. Cycles 1993, 7, 811–841. [Google Scholar] [CrossRef]
- Potter, C. Predicting climate change effects on vegetation, soil thermal dynamics, and carbon cycling in ecosystems of interior Alaska. Ecol. Model. 2004, 175, 1–24. [Google Scholar] [CrossRef]
- Ricotta, C.; Avena, G.; Palma, A. Mapping and monitoring net primary productivity with AVHRR NDVI timeseries: Statistical equivalence of cumulative vegetation indices. ISPRS J. Photogramm. Remote Sens. 1999, 54, 325–331. [Google Scholar] [CrossRef]
- Ji, R.; Tan, K.; Wang, X.; Pan, C.; Xin, L. Spatiotemporal monitoring of a grassland ecosystem and its net primary production using Google Earth Engine: A case study of inner mongolia from 2000 to 2020. Remote Sens. 2021, 13, 4480. [Google Scholar] [CrossRef]
- Zhang, M.; Ceng, Y. Net primary production estimation by using fusion remote sensing data with high spatial and temporal resolution. J. Remote Sens. 2018, 22, 147–156. [Google Scholar]
- Zhu, X.; Chen, J.; Gao, F.; Chen, X.; Masek, J.G. An enhanced spatial and temporal adaptive reflectance fusion model for complex heterogeneous regions. Remote Sens. Environ. 2010, 114, 2610–2623. [Google Scholar] [CrossRef]
- Yan, Y.; Liu, X.; Wang, F.; Li, X.; Ou, J.; Wen, Y.; Liang, X. Assessing the impacts of urban sprawl on net primary productivity using fusion of Landsat and MODIS data. Sci. Total Environ. 2018, 613, 1417–1429. [Google Scholar] [CrossRef]
- Hutchinson, M.F. ANUSPLIN Version4.3 User Guide. Canberra: The Australia National University, Center for Resource and Environment Studies. 2004. Available online: http://cres.anu.edu.au/outputs/anusplin.php (accessed on 22 June 2020).
- Li, C.; Dou, T.; Wang, Y.; Zhu, T.; Yin, H.; Zhou, M.; Liu, L.; Wu, X. A Method for Quantifying the Impacts of Human Activities on Net Primary Production of Grasslands in Northwest China. Remote Sens. 2021, 13, 2479. [Google Scholar] [CrossRef]
- Richards, L.A. Diagnosis and improvement of saline and alkaline soils. Soil Sci. 1947, 64, 432. [Google Scholar] [CrossRef]
- Olsen, S.R.; Cole, C.V.; Watanabe, F.S. Estimation of Available Phosphorus in Soils by Extraction with Sodium Bicarbonate; USDA: Washington, DC, USA, 1954. [Google Scholar]
- Nelson, D.W.; Sommers, L.E. Total Carbon, Organic Carbon, and Organic Matter. In Methods of Soil Analysis, Part 2, Agronomy Monograph, 2nd ed.; Page, A.I., Miller, R.H., Keeney, D.R., Eds.; ASA-SSSA: Madison, WI, USA, 1982; Volume 9, pp. 534–580. [Google Scholar]
- Bremner, J.; Sparks, D.; Page, A.; Helmke, P.; Loeppert, R.; Soltanpour, P.; Tabatabai, M.; Johnston, C.; Sumner, M. Nitrogen-Total. In Methods of Soil Analysis, Part 3—Chemical Methods; Soil Science Society of America Inc.: Madison, WI, USA, 1996; pp. 1085–1121. [Google Scholar]
- Hossain, M.F.; Chen, W.; Zhang, Y. Bulk density of mineral and organic soils in the Canada’s arctic and sub-arctic. Inf. Process. Agric. 2015, 2, 183–190. [Google Scholar] [CrossRef]
- Li, G.; Zhang, J.; Zhu, L.; Tian, H.; Shi, J.; Ren, X. Spatial variation and driving mechanism of soil organic carbon components in the alluvial/sedimentary zone of the Yellow River. J. Geogr. Sci. 2021, 31, 535–550. [Google Scholar] [CrossRef]
- Tian, H.; Zhang, J.; Zhu, L.; Qin, J.; Liu, M.; Shi, J.; Li, G. Revealing the scale- and location-specific relationship between soil organic carbon and environmental factors in China’s north-south transition zone. Geoderma 2022, 409, 115600. [Google Scholar] [CrossRef]
- Webster, R.; Burgess, T.M. Optimal interpolation and isarithmic mapping of soil properties. III. Changing drift and universal kriging. Eur. J. Soil Sci. 1980, 31, 505–524. [Google Scholar] [CrossRef]
- Tian, H.; Zhang, J.; Zheng, Y.; Shi, J.; Qin, J.; Ren, X.; Bi, R. Prediction of soil organic carbon in mining areas. Catena 2022, 215, 106311. [Google Scholar] [CrossRef]
- Saaty, R.W. The analytic hierarchy process What it is and how it is used. Math. Model. 1987, 9, 161–176. [Google Scholar] [CrossRef]
- Lark, R.M.; Webster, R. Analysing soil variation in two dimensions with the discrete wavelet transform. Eur. J. Soil Sci. 2004, 55, 777–797. [Google Scholar] [CrossRef]
- Zhu, H.; Bi, R.; Sun, R.; Xu, Z.; Lv, C.; Yang, J. Revealing the 2d–scale, location–specific variations of soil properties in the coal mining area of Changhe watershed, China. Land Degrad. Dev. 2020, 31, 2775–2788. [Google Scholar] [CrossRef]
- Zhou, Y.; Chen, S.; Zhu, A.; Hu, B.; Shi, Z.; Li, Y. Revealing the scale- and location-specific controlling factors of soil organic carbon in Tibet. Geoderma 2021, 382, 114713. [Google Scholar] [CrossRef]
- Sreenivas, K.; Sujatha, G.; Sudhir, K.; Kiran, D.V.; Fyzee, M.A.; Ravisankar, T.; Dadhwal, V.K. Spatial assessment of soil organic carbon density through random forests based imputation. J. Indian Soc. Remote Sens. 2014, 42, 577–587. [Google Scholar] [CrossRef]
- Were, K.; Bui, D.T.; Dick, Ø.B.; Singh, B.R. A comparative assessment of support vector regression, artificial neural networks, and random forests for predicting and mapping soil organic carbon stocks across an Afromontane landscape. Ecol. Ind. 2015, 52, 394–403. [Google Scholar] [CrossRef]
- Bureau, A.; Dupuis, J.; Hayward, B.; Falls, K.; Van Eerdewegh, P. Mapping complex traits using Random Forest. BMC Genet. 2003, 4, S64. [Google Scholar] [CrossRef]
- R Core Team. A Language and Environment for Statistical Computing; R Foundation for Statistical Computing: Vienna, Austria, 2016. [Google Scholar]
- Li, H.; Wu, Y.; Liu, S.; Xiao, J.; Zhao, W.; Chen, J.; Alexandrov, G.; Cao, Y. Decipher soil organic carbon dynamics and driving forces across China using machine learning. Glob. Chang. Biol. 2022, 28, 3394–3410. [Google Scholar] [CrossRef]
- Johnson, W.C.; Sharpe, D.M. The ratio of total to merchantable forest biomass and its application to the global carbon budget. Can. J. For. Res. 1983, 13, 372–383. [Google Scholar] [CrossRef]
- He, W. Mining Subsidence and Damage in Mountainous Region; China Science and Technology: Beijing, China, 2004. [Google Scholar]
- Liu, S.; Li, W.; Qiao, W.; Wang, Q.; Hu, Y.; Wang, Z. Effect of natural conditions and mining activities on vegetation variations in arid and semiarid mining regions. Ecol. Indic. 2019, 103, 331–345. [Google Scholar] [CrossRef]
- Huang, Y.; Cao, Y.; Pietrzykowski, M.; Zhou, W.; Bai, Z. Spatial distribution characteristics of reconstructed soil bulk density of opencast coal-mine in the loess area of China. Catena 2021, 199, 105116. [Google Scholar] [CrossRef]
- Hu, Z.; Wang, P.; Li, J. Ecological restoration of abandoned mine land in China. J. Resour. Ecol. 2012, 3, 289–296. [Google Scholar]
- Fu, S.; Bai, Z.; Yang, B.; Xie, L. Study on Ecological Loss in Coal Mining Area Based on Net Primary Productivity of Vegetation. Land 2022, 11, 1004. [Google Scholar] [CrossRef]
- Yang, F.; Wang, J.; Zhang, C.; Li, J.; Xie, H.; Zhuoge, Z. The Impact of Human Activities on Net Primary Productivity in a Grassland Open-Pit Mine: The Case Study of the Shengli Mining Area in Inner Mongolia, China. Land 2022, 11, 743. [Google Scholar] [CrossRef]
- He, Y.; Piao, S.; Li, X.; Chen, A.; Qin, D. Global patterns of vegetation carbon use efficiency and their climate drivers deduced from MODIS satellite data and process-based models. Agric. For. Meteorol. 2018, 256–257, 150–158. [Google Scholar] [CrossRef]
- Xie, C.; Wu, S.; Zhuang, Q.; Zhang, Z.; Hou, G.; Luo, G.; Hu, Z. Where Anthropogenic Activity Occurs, Anthropogenic Activity Dominates Vegetation Net Primary Productivity Change. Remote Sens. 2022, 14, 1092. [Google Scholar] [CrossRef]
- Werner, B.A.; Johnson, W.C.; Guntenspergen, G.R. Evidence for 20th century climate warming and wetland drying in the North American Prairie Pothole Region. Ecol. Evol. 2013, 3, 3471–3482. [Google Scholar] [CrossRef]
- Yan, W.; Wang, Y.; Chaudhary, P.; Ju, P.; Zhu, Q.; Kang, X.; Chen, H.; He, Y. Effects of climate change and human activities on net primary production of wetlands on the Zoige Plateau from 1990 to 2015. Glob. Ecol. Conserv. 2022, 35, e02052. [Google Scholar] [CrossRef]
- Guo, D.; Song, X.; Hu, R.; Cai, S.; Zhu, X.; Hao, Y. Grassland type-dependent spatiotemporal characteristics of productivity in Inner Mongolia and its response to climate factors. Sci. Total Environ. 2021, 775, 145644. [Google Scholar] [CrossRef]
- Sun, Y.; Feng, Y.; Wang, Y.; Zhao, X.; Yang, Y.; Tang, Z.; Wang, S.; Su, H.; Zhu, J.; Chang, J.; et al. Field-based estimation of net primary productivity and its above- and belowground partitioning in global grasslands. J. Geophys. Res.-Biogeosci. 2021, 126, e2021JG006472. [Google Scholar] [CrossRef]
- Wang, T.; Kang, F.F.; Cheng, X.Q.; Han, H.R.; Bai, Y.C.; Ma, J.Y. Spatial variability of organic carbon and total nitrogen in the soils of a subalpine forested catchment at Mt. Taiyue, China. Catena 2017, 155, 41–52. [Google Scholar] [CrossRef]
- Ni, Y.; Jian, Z.; Zeng, L.; Liu, J.; Lei, L.; Zhu, J.; Xu, J.; Xiao, W. Climate, soil nutrients, and stand characteristics jointly determine large-scale patterns of biomass growth rates and allocation in Pinus massoniana plantations. For. Ecol. Manag. 2022, 504, 119839. [Google Scholar] [CrossRef]
- Qiao, L.; Wang, X.; Smith, P.; Fan, J.; Lu, Y.; Emmett, B.; Li, R.; Dorling, S.; Chen, H.; Liu, S.; et al. Soil quality both increases crop production and improves resilience to climate change. Nat. Clim. Chang. 2022, 12, 574–580. [Google Scholar] [CrossRef]
- Zarzosa, P.S.; Herraiz, A.D.; Olmo, M.; Ruiz-Benito, P.; Barrón, V.; Bastias, C.C.; de la Riva, E.G.; Villar, R. Linking functional traits with tree growth and forest productivity in Quercus ilex forests along a climatic gradient. Sci. Total. Environ. 2021, 786, 147468. [Google Scholar] [CrossRef]
- Viana, J.; Dalling, J. Soil fertility and water availability effects on trait dispersion and phylogenetic relatedness of tropical terrestrial ferns. Oecologia 2022, 198, 733–748. [Google Scholar] [CrossRef]
- Cleveland, C.C.; Townsend, A.R.; Taylor, P.; Alvarez-Clare, S.; Bustamante, M.M.C.; Chuyong, G.; Dobrowski, S.Z.; Grierson, P.; Harms, K.E.; Houlton, B.Z.; et al. Relationships among net primary productivity, nutrients and climate in tropical rain forest: A pan-tropical analysis. Ecol. Lett. 2011, 14, 939–947. [Google Scholar] [CrossRef]
- Doughty, C.E.; Goldsmith, G.R.; Raab, N.; Girardin, C.A.J.; FarfanAmezquita, F.; Huaraca-Huasco, W.; Silva-Espejo, J.E.; AraujoMurakami, A.; da Costa, A.C.L.; Rocha, W.; et al. What controls variation in carbon use efficiency among Amazonian tropical forests? Biotropica 2018, 50, 16–25. [Google Scholar] [CrossRef]
- Reichert, J.M.; Suzuki, L.E.A.S.; Reinert, D.J.; Horn, R.; Håkansson, I. Reference bulk density and critical degree-of-compactness for no-till crop production in subtropical highly weathered soils. Soil Tillage Res. 2009, 102, 242–254. [Google Scholar] [CrossRef]
- Xu, Z.; Zhao, S.; Wang, P.; Bi, R. Evaluation of the impacts of coal mining on farmland quality in mine-agriculture regions in China. Trans. CSAE 2020, 36, 273–282. [Google Scholar]
- He, H.; Xia, G.T.; Yang, W.J.; Zhu, Y.P.; Wang, G.D.; Shen, W.B. Response of soil C:N:P stoichiometry, organic carbon stock, and release to wetland grasslandification in Mu Us Desert. J. Soils Sediments 2019, 19, 3954–3968. [Google Scholar] [CrossRef]
- Mukhopadhyay, S.; Masto, R.E.; Yadav, A.; George, J.; Ram, L.; Shukla, S. Soil quality index for evaluation of reclaimed coal mine spoil. Sci. Total Environ. 2016, 542, 540–550. [Google Scholar] [CrossRef] [PubMed]
- Braimoh, A.K.; Vlek, P.L.G. Soil quality and other factors influencing maize yield in northern Ghana. Soil Use Manag. 2006, 22, 165–171. [Google Scholar] [CrossRef]
- Yang, W.; Zheng, F.; Han, Y.; Wang, Z.; Yi, Y.; Feng, Z. Investigating Spatial Distribution of Soil Quality Index and Its Impacts on Corn Yield in a Cultivated Catchment of the Chinese Mollisol Region. Soil Sci. Soc. Am. J. 2016, 80, 317–327. [Google Scholar] [CrossRef]
- Lieth, H. Modeling the Primary Productivity of the World. In Primary Productivity of the Biosphere; Lieth, H., Whittaker, R.H., Eds.; Springer: Berlin/Heidelberg, Germany, 1975. [Google Scholar]
- Churkina, G.; Running, S.W. Contrasting climatic controls on the estimated productivity of global terrestrial biomes. Ecosystems 1998, 1, 206–215. [Google Scholar] [CrossRef]
- Feng, Y.; Wang, J.; Bai, Z.; Reading, L. Effects of surface coal mining and land reclamation on soil properties: A review. Earth Sci. Rev. 2019, 191, 12–25. [Google Scholar] [CrossRef]
- Geng, S.; Li, W.; Kang, T.; Shi, P.; Zhu, W. An integrated index based on climatic constraints and soil quality to simulate vegetation productivity patterns. Ecol. Indic. 2021, 129, 108015. [Google Scholar] [CrossRef]
Figure 1.
Study area, land use types, and soil sampling sites.

Figure 2.
Spatial distribution map of annual mean net primary vegetation productivity from 2010 to 2015.
Figure 2.
Spatial distribution map of annual mean net primary vegetation productivity from 2010 to 2015.

Figure 3.
Spatial distributions of the location-specific Pearson’s correlation coefficient between NPP and drivers. (a) MAT, (b) MAP, (c) MAS, (d) MAE, (e) SOC, (f) TN, (g) AP, (h) AK, (i) pH, (j) BD, (k) CF, and (l) LD. All abbreviations (BD, CF, MAT, SOC, etc.) can be found in Table 1. The right inset shows the area ratios of positive, negative, and insignificant areas. ** means significant at p < 0.01 level, * means significant at p < 0.05 level.

Figure 4.
Ranking of the relative importance of environmental variables in RF_all model. All abbreviations (BD, CF, MAT, SOC, etc.) can be found in Table 1.
Figure 4.
Ranking of the relative importance of environmental variables in RF_all model. All abbreviations (BD, CF, MAT, SOC, etc.) can be found in Table 1.

Figure 5.
Relative contribution of different categories of driving factors to the spatial variation of NPP in the Changhe Basin mining area. (a) Spatial distribution map of the relative contributions of climate (C), soil properties (S), and mining activities (M) to NPP variability. (a) The right inset represents the average relative contribution of different categories of drivers, and whiskers represent the standard deviation of all pixel values. The right inset of (b) represents the proportion of control area that dominates the driver. C, S, and M in (b) represent climate, soil properties, and coal mining activities, respectively. The combination of C, S, and M indicates that the coupled effects of different categories of drivers dominate the spatial variation of NPP. For instance, CS (SC) represents the coupled effects of climate and soil properties, with a larger relative contribution from the former drivers. CM (MC): the combined effects of climate and mining activities, SM (MS): the combined effects of soil properties and mining activities.


Table 1.
The composition of driving factors.
| Driver Categories | Factors | Data Sources |
|---|---|---|
| Climate | Mean annual temperature (MAT) | The climate data were sourced from the basic geographic database of the Changhe watershed, and the years were 2010–2015; each factor was spatially interpolated using the ANUSPLIN method to generate a raster dataset with a pixel size of 30 m [37]. |
| Mean annual precipitation (MAP) | ||
| Mean annual evapotranspiration (MAE) | ||
| Mean annual solar radiation (MAS) | ||
| Soil property | Clay fraction (CF) | Refer to 2.3.1 Soil sampling. |
| Soil organic carbon (SOC) | ||
| Total nitrogen (TN) | ||
| Available phosphorus (AP) | ||
| Available potassium (AK) | ||
| pH | ||
| Bulk density (BD) | ||
| Mining activities | Land degradation (LD) | Refer to 2.3.2 Land degradation. |
Table 2.
Simulated NPP, measured NPP and MOD17A3 for different land use types (g C/(m2·yr)).
| NPP | A | B | Forest | Grassland | Farmland | Construction Land |
|---|---|---|---|---|---|---|
| Simulated value | 247.61 | 276.66 | 429.38 | 286.93 | 244.40 | 167.52 |
| Measured value | 248.96 | 275.15 | - | - | - | - |
| MOD17A3 | - | - | 402.24 | 265.76 | 261.03 | 174.31 |
Publisher’s Note: MDPI stays neutral with regard to jurisdictional claims in published maps and institutional affiliations. |
© 2022 by the authors. Licensee MDPI, Basel, Switzerland. This article is an open access article distributed under the terms and conditions of the Creative Commons Attribution (CC BY) license (https://creativecommons.org/licenses/by/4.0/).
Share and Cite
MDPI and ACS Style
Tian, H.; Liu, S.; Zhu, W.; Zhang, J.; Zheng, Y.; Shi, J.; Bi, R. Deciphering the Drivers of Net Primary Productivity of Vegetation in Mining Areas. Remote Sens. 2022, 14, 4177. https://doi.org/10.3390/rs14174177
AMA Style
Tian H, Liu S, Zhu W, Zhang J, Zheng Y, Shi J, Bi R. Deciphering the Drivers of Net Primary Productivity of Vegetation in Mining Areas. Remote Sensing. 2022; 14(17):4177. https://doi.org/10.3390/rs14174177
Chicago/Turabian StyleTian, Huiwen, Shu Liu, Wenbo Zhu, Junhua Zhang, Yaping Zheng, Jiaqi Shi, and Rutian Bi. 2022. "Deciphering the Drivers of Net Primary Productivity of Vegetation in Mining Areas" Remote Sensing 14, no. 17: 4177. https://doi.org/10.3390/rs14174177
Note that from the first issue of 2016, this journal uses article numbers instead of page numbers. See further details here.