
Surface Deformation Analysis of the Houston Area Using Time Series Interferometry and Emerging Hot Spot Analysis


Department of Earth and Atmospheric Sciences, University of Houston, Houston, TX 77004, USA
*
Author to whom correspondence should be addressed.
Remote Sens. 2022, 14(15), 3831; https://doi.org/10.3390/rs14153831
Submission received: 14 July 2022
/
Revised: 2 August 2022
/
Accepted: 5 August 2022
/
Published: 8 August 2022
(This article belongs to the Special Issue Ground and Structural Deformations Monitoring Systems Integrating Remote Sensing and Ground-Based Data)
Abstract
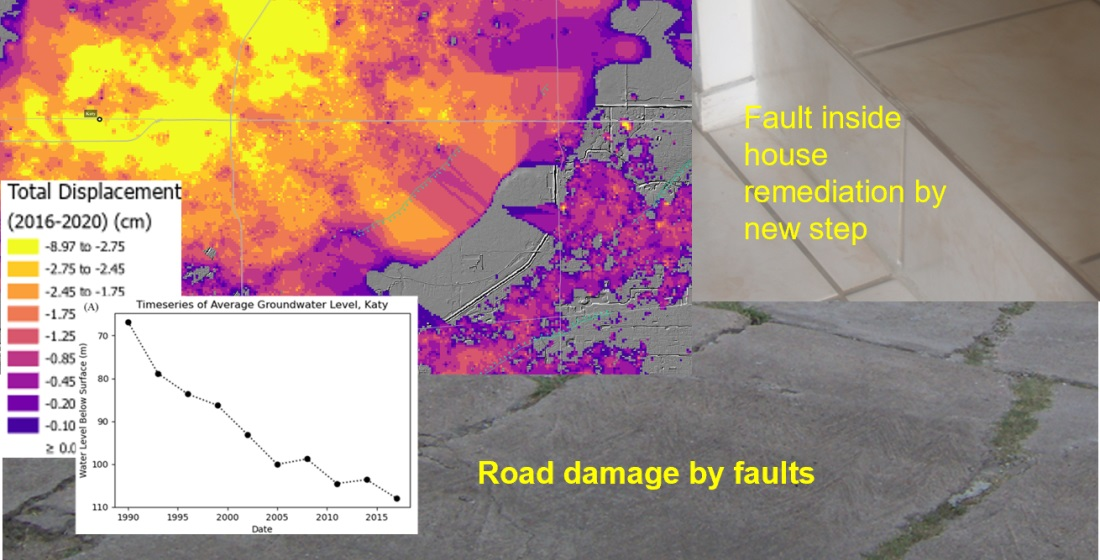
:Cities in the northern Gulf of Mexico, such as Houston, have experienced one of the fastest rates of subsidence, with groundwater/hydrocarbon withdrawal being considered the primary cause. This work reports substantial ground subsidence in a few parts of Greater Houston and adjoining areas not reported before. Observation of surface deformation using interferometric synthetic aperture radar (InSAR) data obtained from Sentinel-1A shows total subsidence of up to 9 cm in some areas from 2016 to 2020. Most of the area within the Houston city limits shows no substantial subsidence, but growing suburbs around the city, such as Katy in the west, Spring and The Woodlands in the north and northwest, and Fresno in the south, show subsidence. In this study, we performed emerging hot spot analysis on InSAR displacement products to identify areas undergoing significant subsidence. To investigate the contributions of groundwater to subsidence, we apply optimized hot spot analysis to groundwater level data collected over the past 31 years from over 71,000 water wells and look at the correlation with fault surface deformation patterns. To evaluate the contribution of oil/gas pumping, we applied optimized hot spot analysis to known locations of oil and gas wells. The high rate of water pumping in the suburbs is the main driver of subsidence, but oil/gas withdrawal plays an important role in areas such as Mont Belvieu. Displacement time series shows that the Clodine, Hockley, and Woodgate faults are active, whereas the Long Point Fault shows no motion, although it was once very active.

1. Introduction
Houston has experienced some of the most considerable subsidence of any megacity in the USA, losing over 3 m in elevation in certain areas since 1917 [1,2]. Excessive groundwater withdrawal and sediment compaction were considered to be the main drivers of subsidence [1,3,4,5]. For dealing with this acute problem in 1975, the Government of Texas and United States Geological Survey (USGS) established the Harris-Galveston Subsidence District (HGSD), followed by subsidence districts in the surrounding counties. HGSD and USGS installed borehole extensometers. HGSD, in collaboration with the National Geodetic Survey (NGS), carried out a leveling survey and established a GNSS network [6,7]. USGS and subsidence districts have also operated a dense groundwater monitoring network since the 1960s [7].
Due to regulatory efforts, subsidence in this region has been quantified by using various methods, including Global Navigation Satellite System (GNSS), lidar, etc. [7,8,9]. Several researchers used InSAR techniques for measuring subsidence in Houston and its surroundings [10,11,12,13,14,15]. In these studies, Stork and Sneed [10] processed data from the European Remote Sensing 1 (ERS-1) and ERS-2 satellite platforms from 1996 to 1999, and Buckley et al. [11] used ERS-1/2 data from 1993 to 1999. Bawden [8] integrated ERS-1/2 datasets with GNSS data from 1996 to 2010. In our previous work [9], we used persistent scatterer (PS) InSAR on ERS-1/2 data from 1992 to 2002 and measured subsidence of up to 47 mm/yr in the northwest part of Harris County. Qu et al. [13] suggested a subsidence rate of 30 mm/yr over northwest Houston from 2004 to 2011 using ENVISAT and ALOS PALSAR data. They also used ALOS PALSAR data from 2007 to 2011 to measure displacement of up to 13 mm/yr along faults north of Houston in Montgomery County [14]. Miller and Shirzaei [15] reported subsidence of up to 49 mm/yr from 2007 to 2011 according to ALOS PALSAR and 34 mm/yr (December 2015–August 2017) according to Sentinel-1.
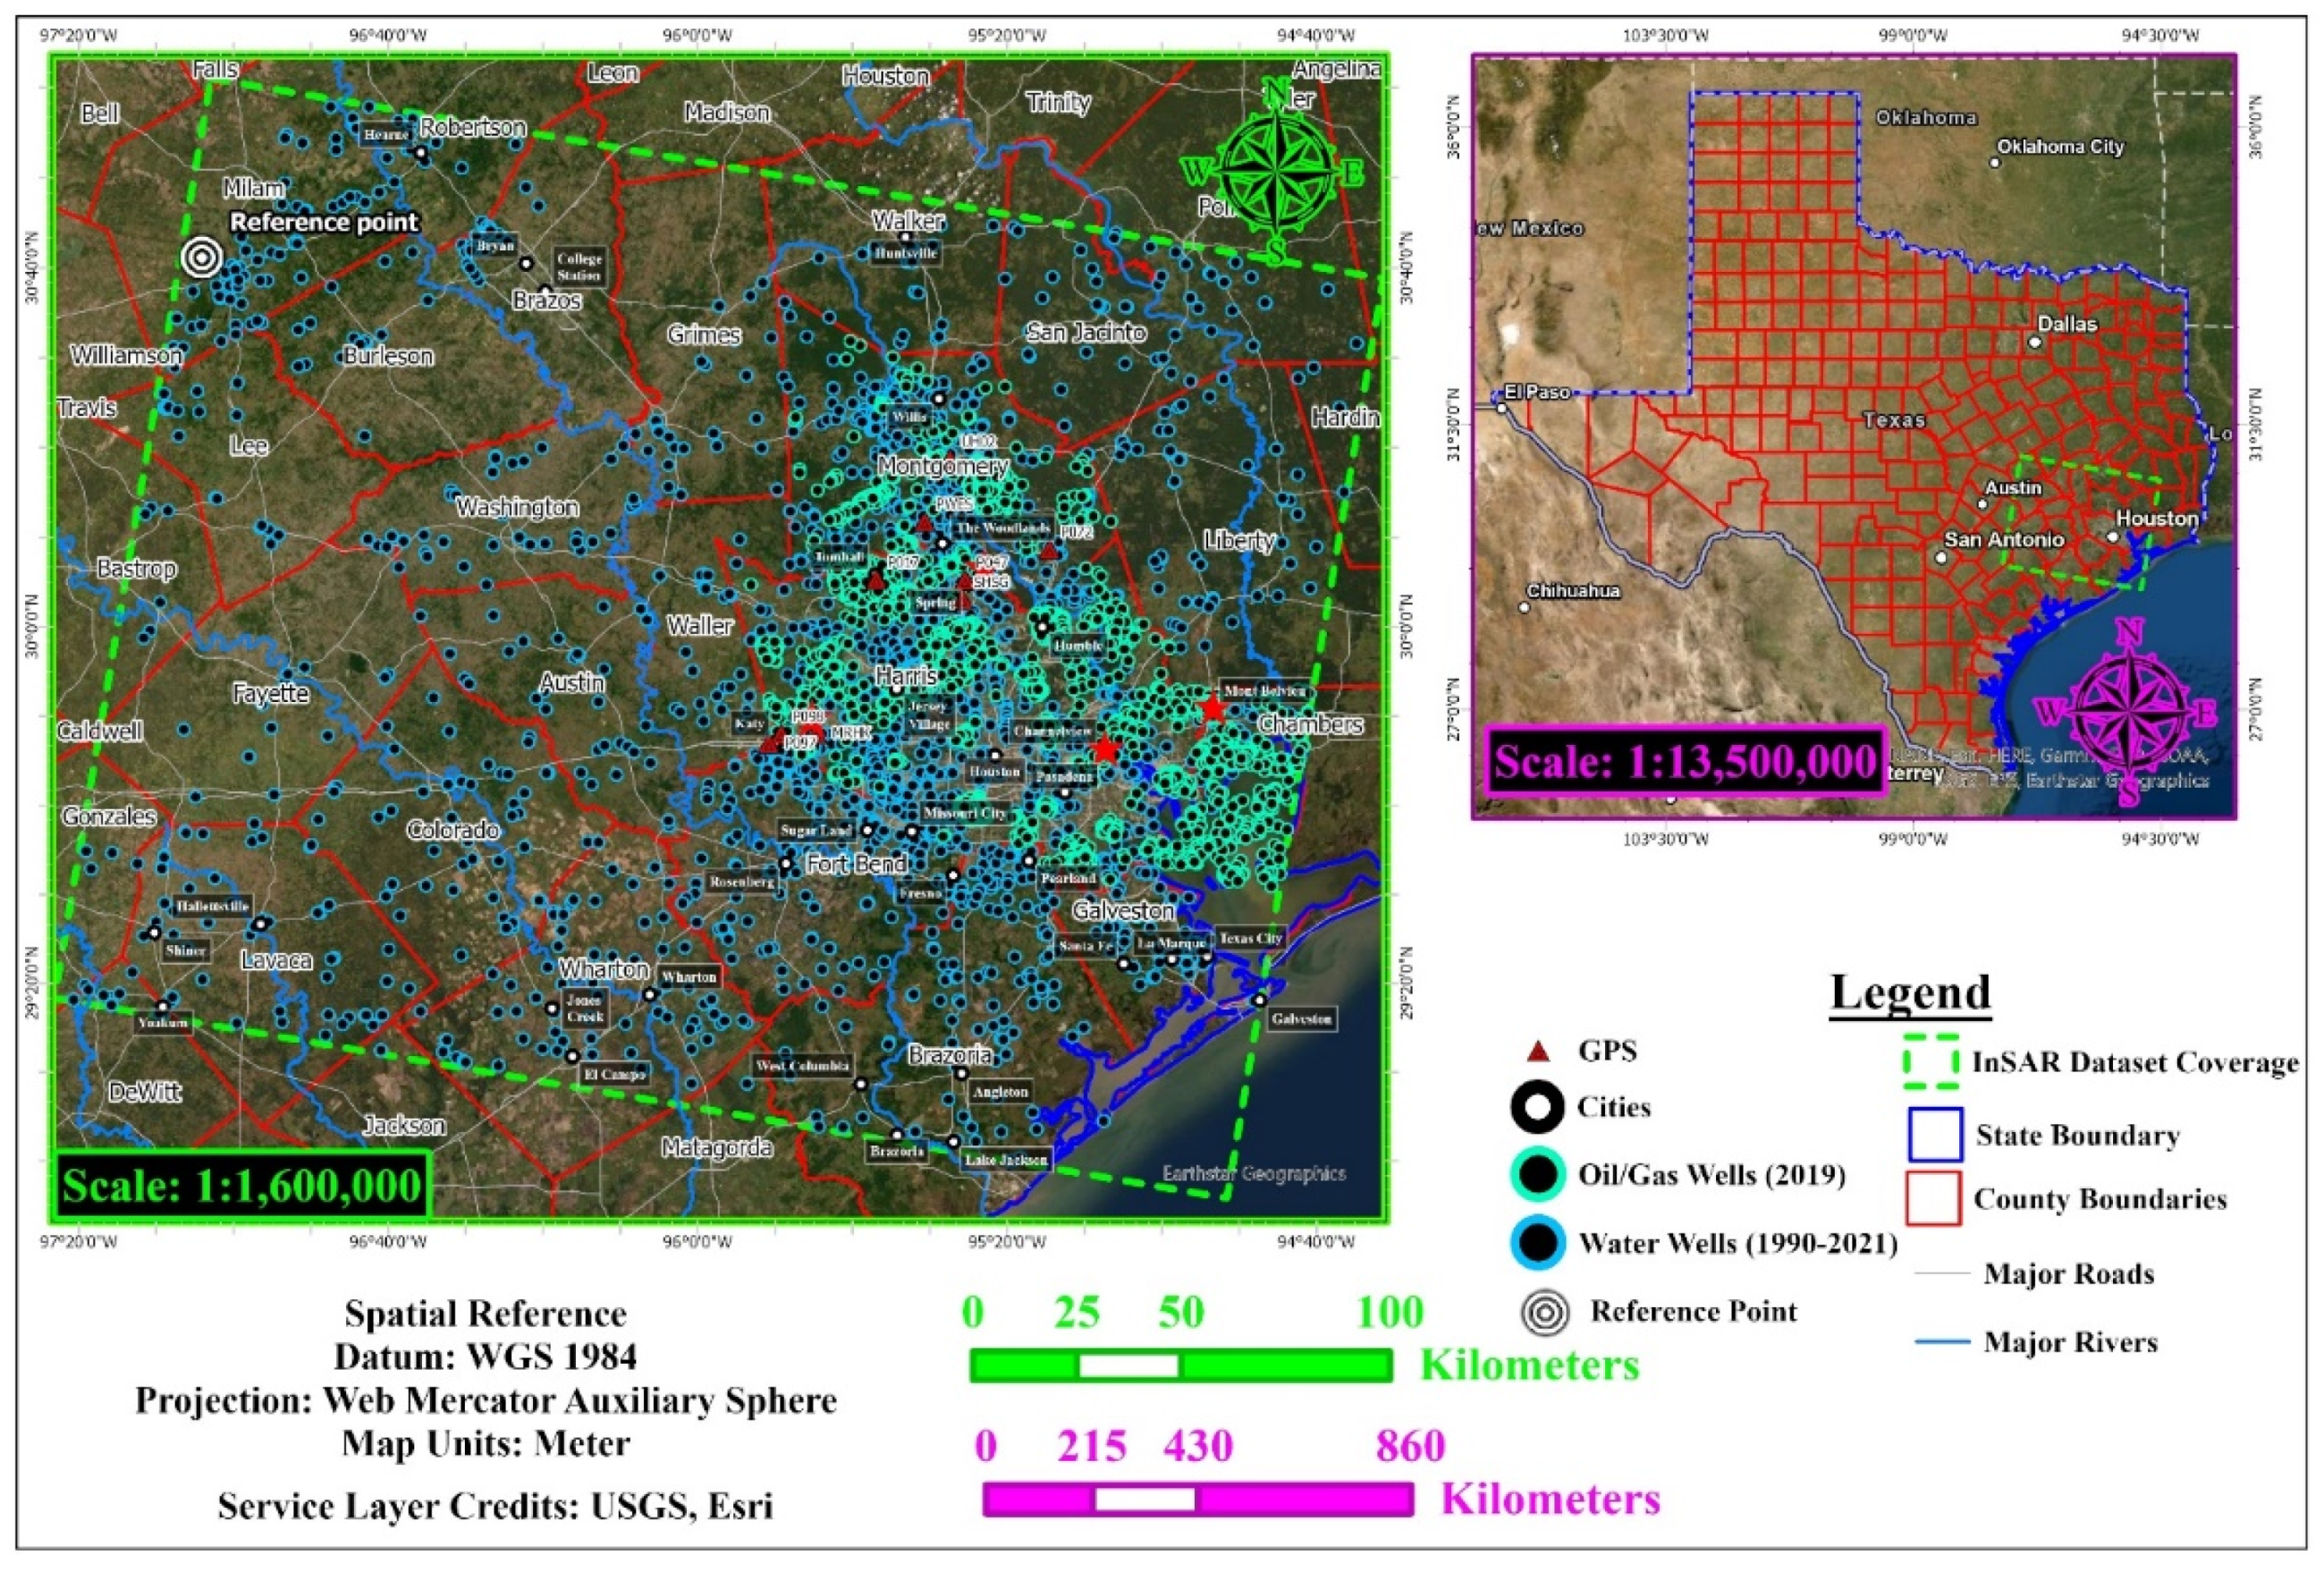
The primary purpose of this paper is to track the recent subsidence rates in Greater Houston—specifically northern and western Harris County, southern Montgomery County, and western Chambers County—and surrounding areas and determine the causes of recent subsidence (Figure 1). In addition, this work seeks to correlate aquifer water levels to subsidence rates statistically and assess the impact of oil/gas extraction and faulting on subsidence.
2. Geologic Setting
The Houston area experienced substantial subsidence in the last century that has been primarily attributed to groundwater/hydrocarbon withdrawal. However, the observed surface deformation is not purely anthropogenic in origin, with many geologic elements, such as faults and salt domes, playing a contributing role. During the Triassic period, the Gulf of Mexico experienced extensional rifting, which was followed by seafloor spreading in the middle Jurassic [16,17]. Large salt deposits also accumulated in this region in the late Triassic and Jurassic [18]. Then, deposition produced a prograding shelf margin throughout the Cretaceous and Cenozoic periods. This series of events resulted in multiple growth faults across the Gulf Coast Region, most of which occurred close to the shelf margin and divided the area into structural corridors [19]. The Houston area is situated over three primary growth fault zones: (1) the Hockley–Conroe Fault System, (2) the Addicks Fault System, and (3) the Long Point–Eureka Heights Fault System (Figure 2). In addition, there are several normal faults around salt domes [9]. These faults cut through Holocene and Paleocene sediments and primarily move through aseismic creep, resulting in spatial and temporal variation [20,21]. The large salt deposits of the past have resulted in modern salt domes, which, due to their low density, rise to the surface and fracture the surrounding regions in radial patterns [9].
3. Data and Methods
The European Space Agency (ESA) launched Sentinel-1A and then launched Sentinel-1B in 2014 and 2016, respectively. The two Sentinel-1 satellites utilize radar imaging in the C band to study the land and bodies of water. Sentinel-1 data are widely used for monitoring ground deformations, such as subsidence [22,23,24,25].
We processed Sentinel-1 InSAR data through the Geohazard Thematic Exploitation Platform (G-TEP), which Terradue operates in collaboration with the European Space Agency (ESA), utilizing the Small Baseline Subset (SBAS) interferometry technique [26]. Descending orbit data on track 143 for Sentinel-1A satellites were used. The spatial resolution for Single Look Complex (SLC) images in Interferometric Wide (IW) mode is 5 m by 20 m. Speckle noise was reduced by multi-looking with 5 azimuth and 20 range looks for all InSAR image products. A Goldstein filter was applied to the data for phase noise reduction and the temporal coherence threshold was set to 0.85. We processed 89 SLC images from 2016 to 2020, generating 246 interferograms. The Shuttle Radar Topography Mission (SRTM) 30-m resolution digital elevation model [27] was used to remove topographic noise. We used the workflow described in [28,29] to detect the coherent targets, movement rates in the line of sight, and estimate the time series.
A reference point west of College Station in Milam County, shown as a white circle in Figure 1, was used to process SBAS data. There are no GNSS stations near this site. The reference point was selected away from Houston in a place with no known subsidence, oil, gas, and water wells, and further away from the coast to avoid any possible contamination. Recently published GNSS data suggest there is minimal horizontal movement (~2 mm/yr) in most of the Houston area [30]. Moreover, there is no consistent horizontal movement. Therefore, most of the line-of-sight (LOS) velocity is assumed to be vertical.
To evaluate changes in the water table, this study implemented well-water depth from 71,170 wells from January 1990 to March 2021 from the Advisory Committee on Water Information (ACWI), Texas Water Development Board (TWDB), the National Ground-Water Monitoring Network (NGWMN), and the USGS (Figure 1). Most of the wells were operated sporadically for short time intervals, with very few wells remaining operational for all 31 years. By comparing groundwater and hydrocarbon extraction data, we can directly observe if subsidence is related to fluid withdrawal. Oil and gas well data were compiled from ESRI’s Living Atlas, which included 5,948 active and storage wells. We refined and modified the faults map prepared by [9]. We used DEM, hillshade, and slope maps derived from lidar data acquired in 2018. The 2018 lidar data are part of the Texas Strategic Mapping Program (StratMap), titled “Upper Coast Lidar” [31]. This dataset has a horizontal accuracy of ± 0.20 m and RMSE ≤ 0.1 m for the vertical direction.
Optimized hot spot analysis and emerging hot spot analysis are widely used for pattern analysis. Getis and Ord [32] describe hot spots and cold spots as patterns generated by underlying spatial relationships that are not caused by random processes. Emerging hot spot analysis adds a time dimension to the dataset. In this study, the emerging hot spot analysis tools in ArcGIS Pro were used to estimate spatial and temporal patterns, resulting in the discovery of statistically significant clusters of subsidence and groundwater withdrawal. Optimized hot spot analysis was applied to find significant groups of oil/gas well locations.
We used emerging hot spot analysis to find the spatiotemporal trend in subsidence in the study area. Emerging hot spot tools apply Mann–Kendall statistics [33,34], resulting in the detection and examination of statistically significant trends. The emerging hot spot tools can output up to 17 unique categories of trends. For this work, we did not include cold spots (low values) and nonsignificant trends and presented only hot spots (high values). The following eight hot spot categories represent different temporal states: new, consecutive, intensifying, persistent, sporadic, oscillating, diminishing, and historical hot spots (for details, see ESRI’s help archive [35]). During emerging hot spot analysis, the user can adjust parameters, such as neighborhood distance, neighborhood time step, and conceptualization of spatial relationships, which have an effect on how the statistical significance of a space–time bin is evaluated in the context of its neighbors. Neighborhood distance controls the maximum distance at which a space–time bin can be considered a spatial neighbor of another for analysis; neighborhood time step determines the maximum amount of time between two bins that can be considered temporal neighbors; conceptualization of spatial relationships limits the number of spatial neighbors within the neighborhood distance to a value defined by the user. During this particular study, selecting smaller neighborhood distances resulted in outputs that demonstrated greater detail in the shapes and extents of hot spot clusters. However, these outputs also tended to have many small, isolated hot spots, showing a greater susceptibility to random noise due to the analysis considering only local variations in the InSAR data. Alternatively, choosing larger neighborhood distances encourages the analysis to consider both local and regional variations, preventing noise-dominant sections of the data from being misidentified as statistically significant hot spots. However, the hot spot clusters that remain lose local details in shape and extent, resulting in a rounder and more bloated appearance. After testing several neighborhood distance values, the best emerging hot spot analysis results for the InSAR dataset used in this study were achieved with a distance of 10 km.
Global navigation satellite systems (GNSS) data for selected sites were obtained from Harris Galveston Subsidence District to validate InSAR results.
4. Results and Analysis
4.1. Ground Deformation Rates
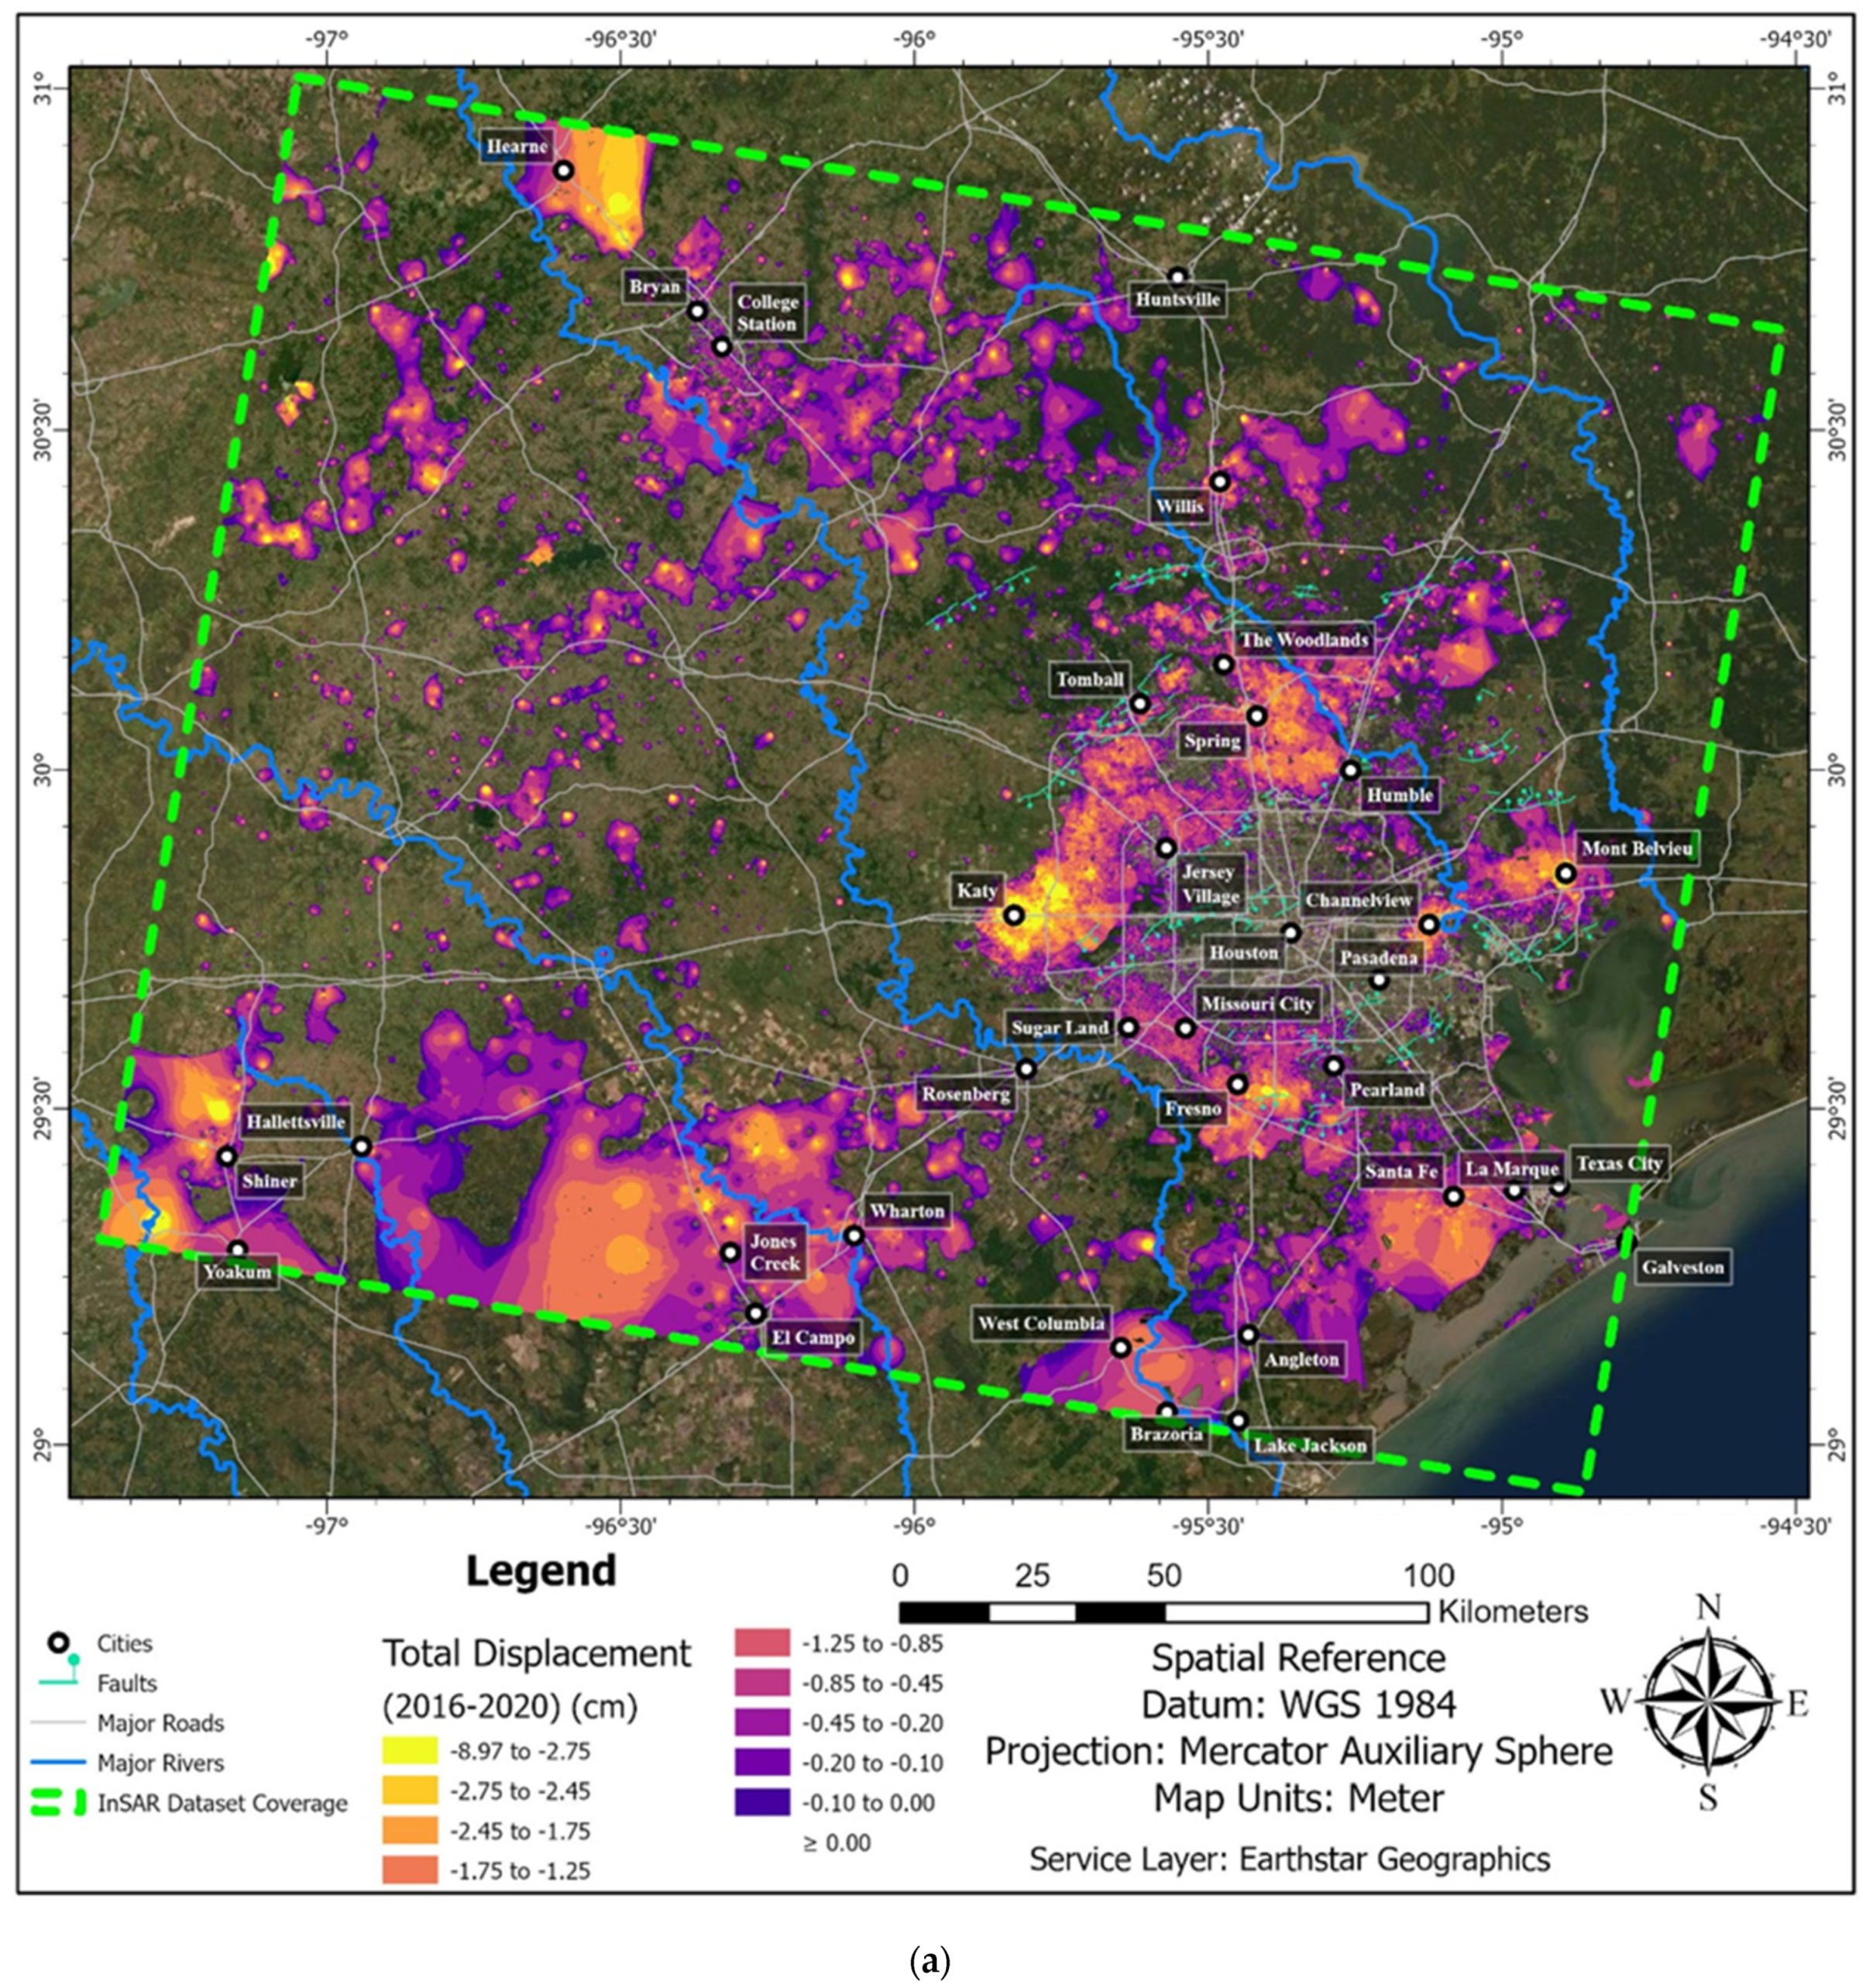
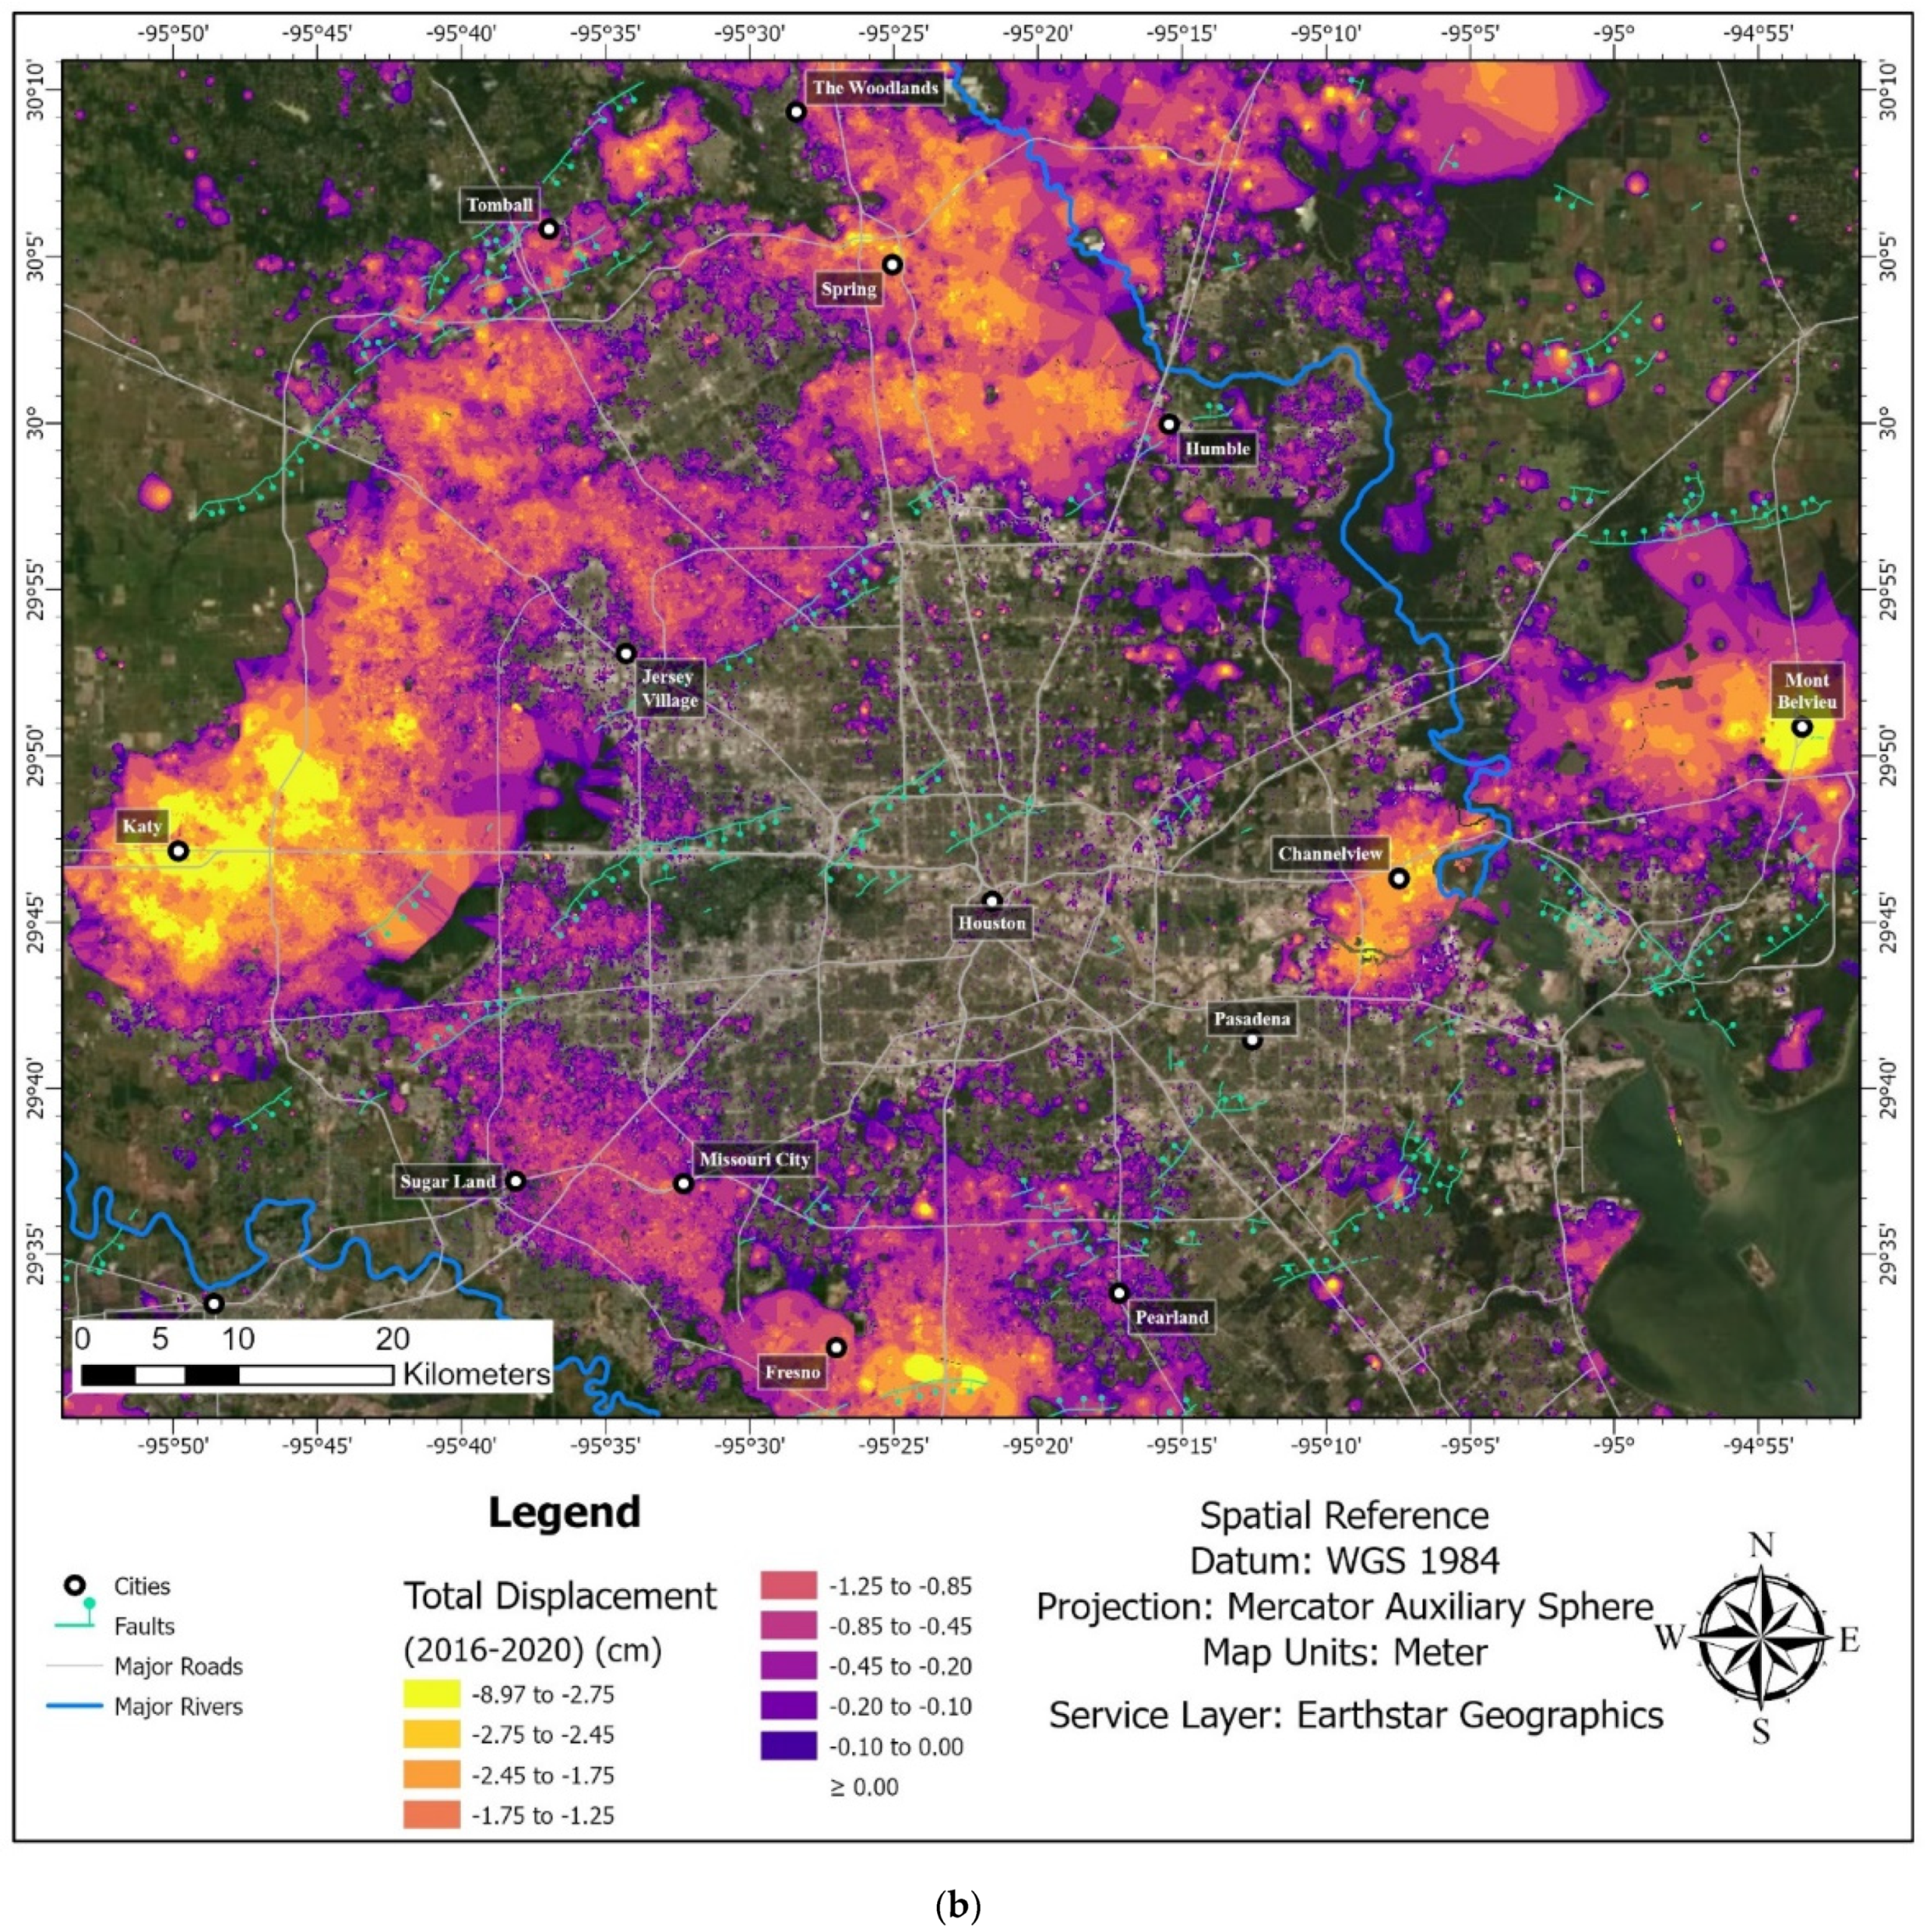
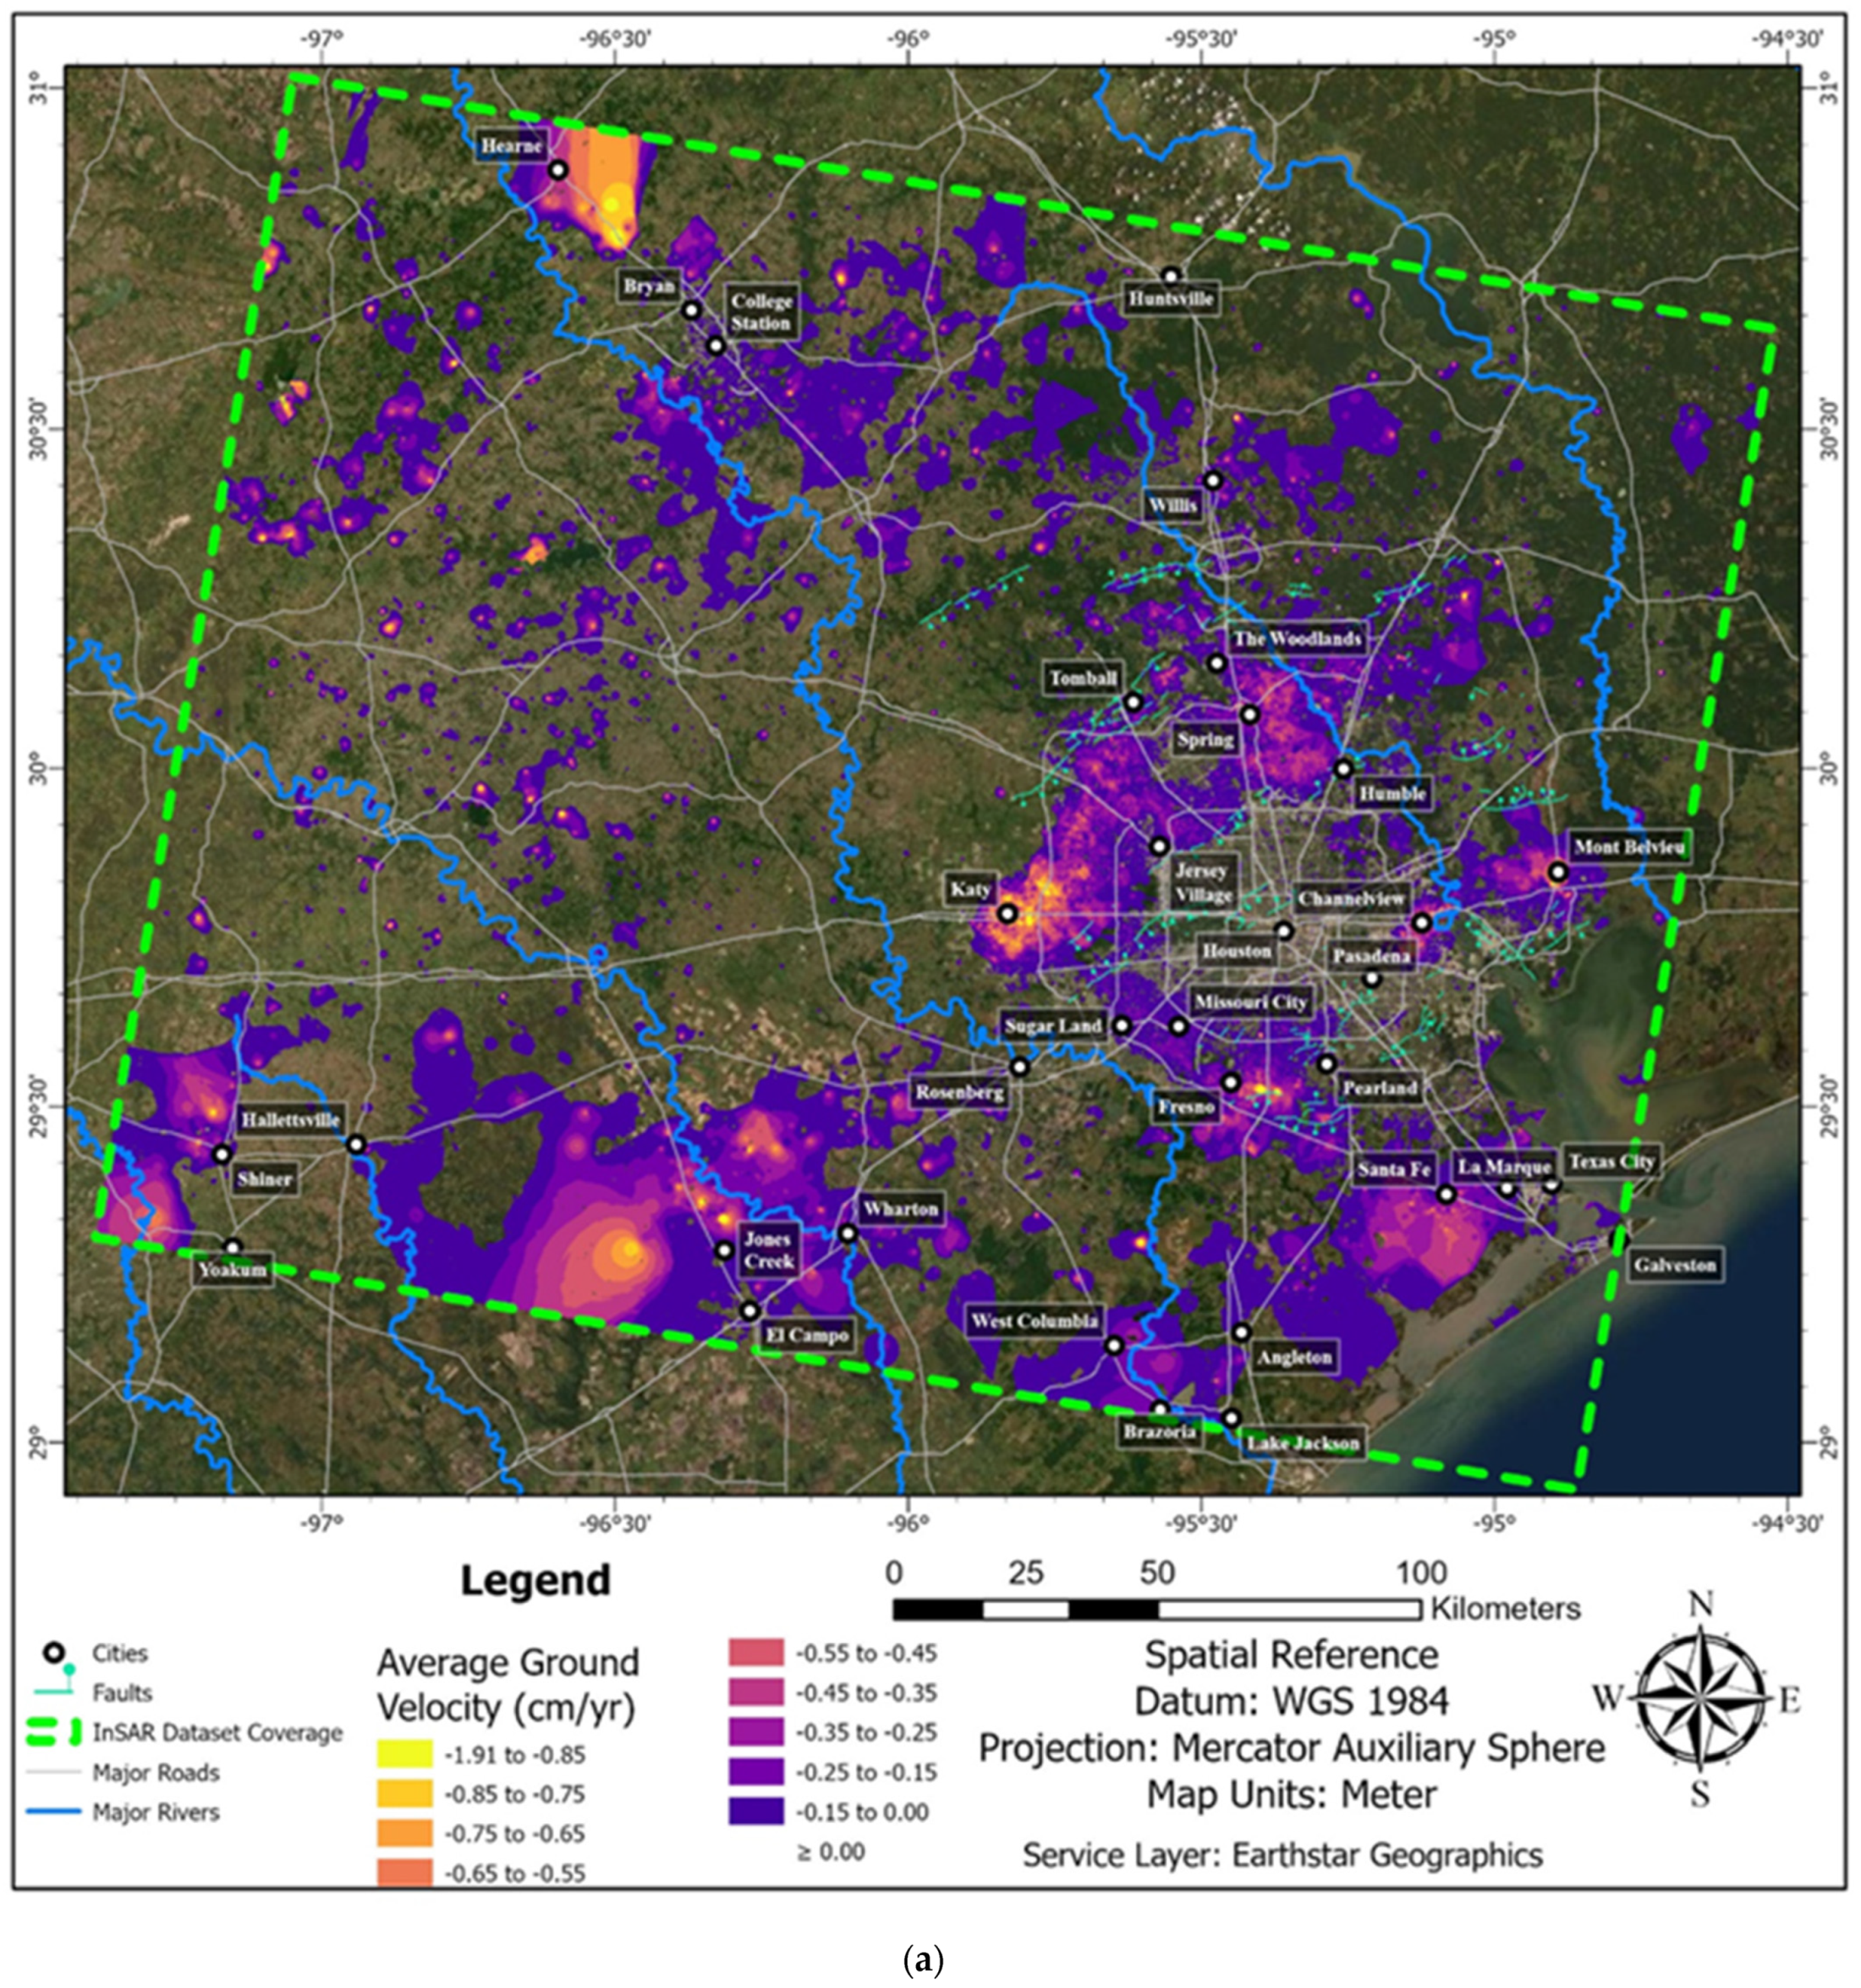
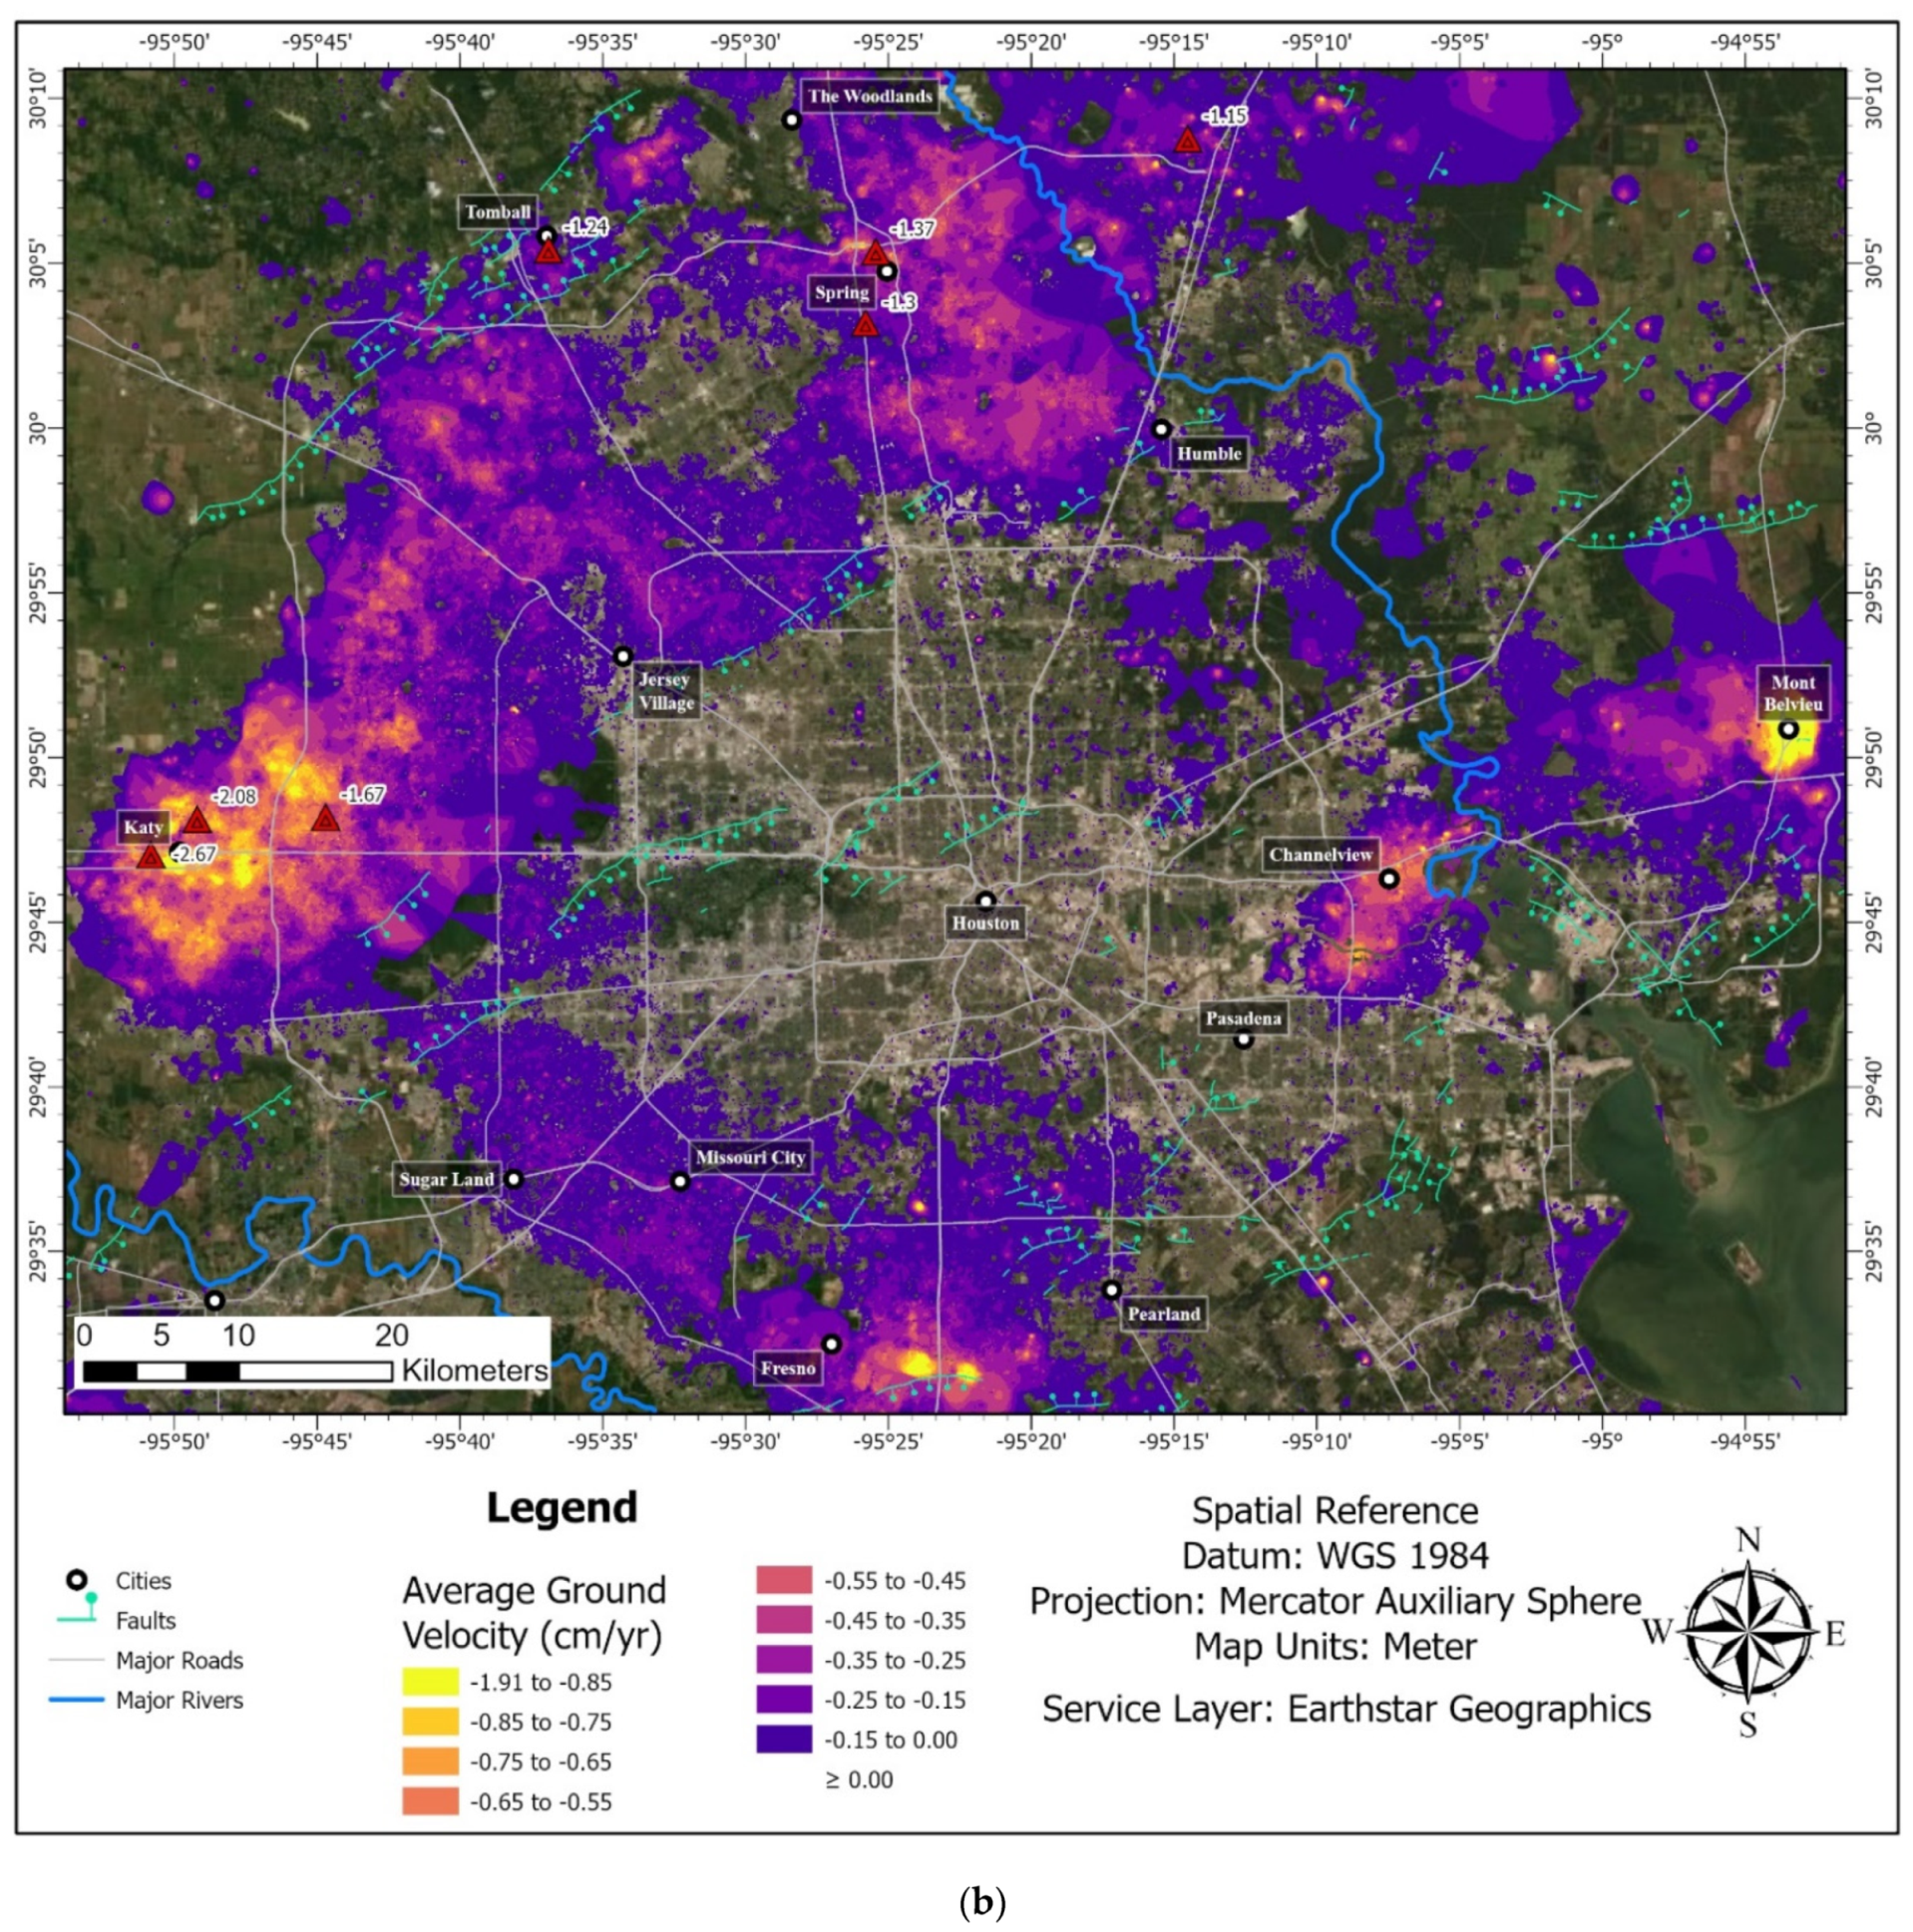
Figure 2 and Figure 3 show results of InSAR data from 2016 to 2020 for Houston and surrounding areas. In some parts of the study area, up to -9 cm of total LOS displacement with an average LOS velocity of −2 cm/yr is observed. There is no negative LOS displacement in Houston downtown and surrounding areas, including areas that experienced three meters of subsidence in the last century. Interestingly, suburbs and small towns adjacent to Houston show significant negative LOS displacement. For example, Katy, one of the fastest-growing and most desirable suburbs, displays the highest negative displacement (Figure 2 and Figure 3). Spring, The Woodlands, and northern and northwestern Houston also manifest substantial negative displacement, and those areas are rapidly expanding. Several other small towns further away to the south, southeast, northeast, and northwest show similar trends.
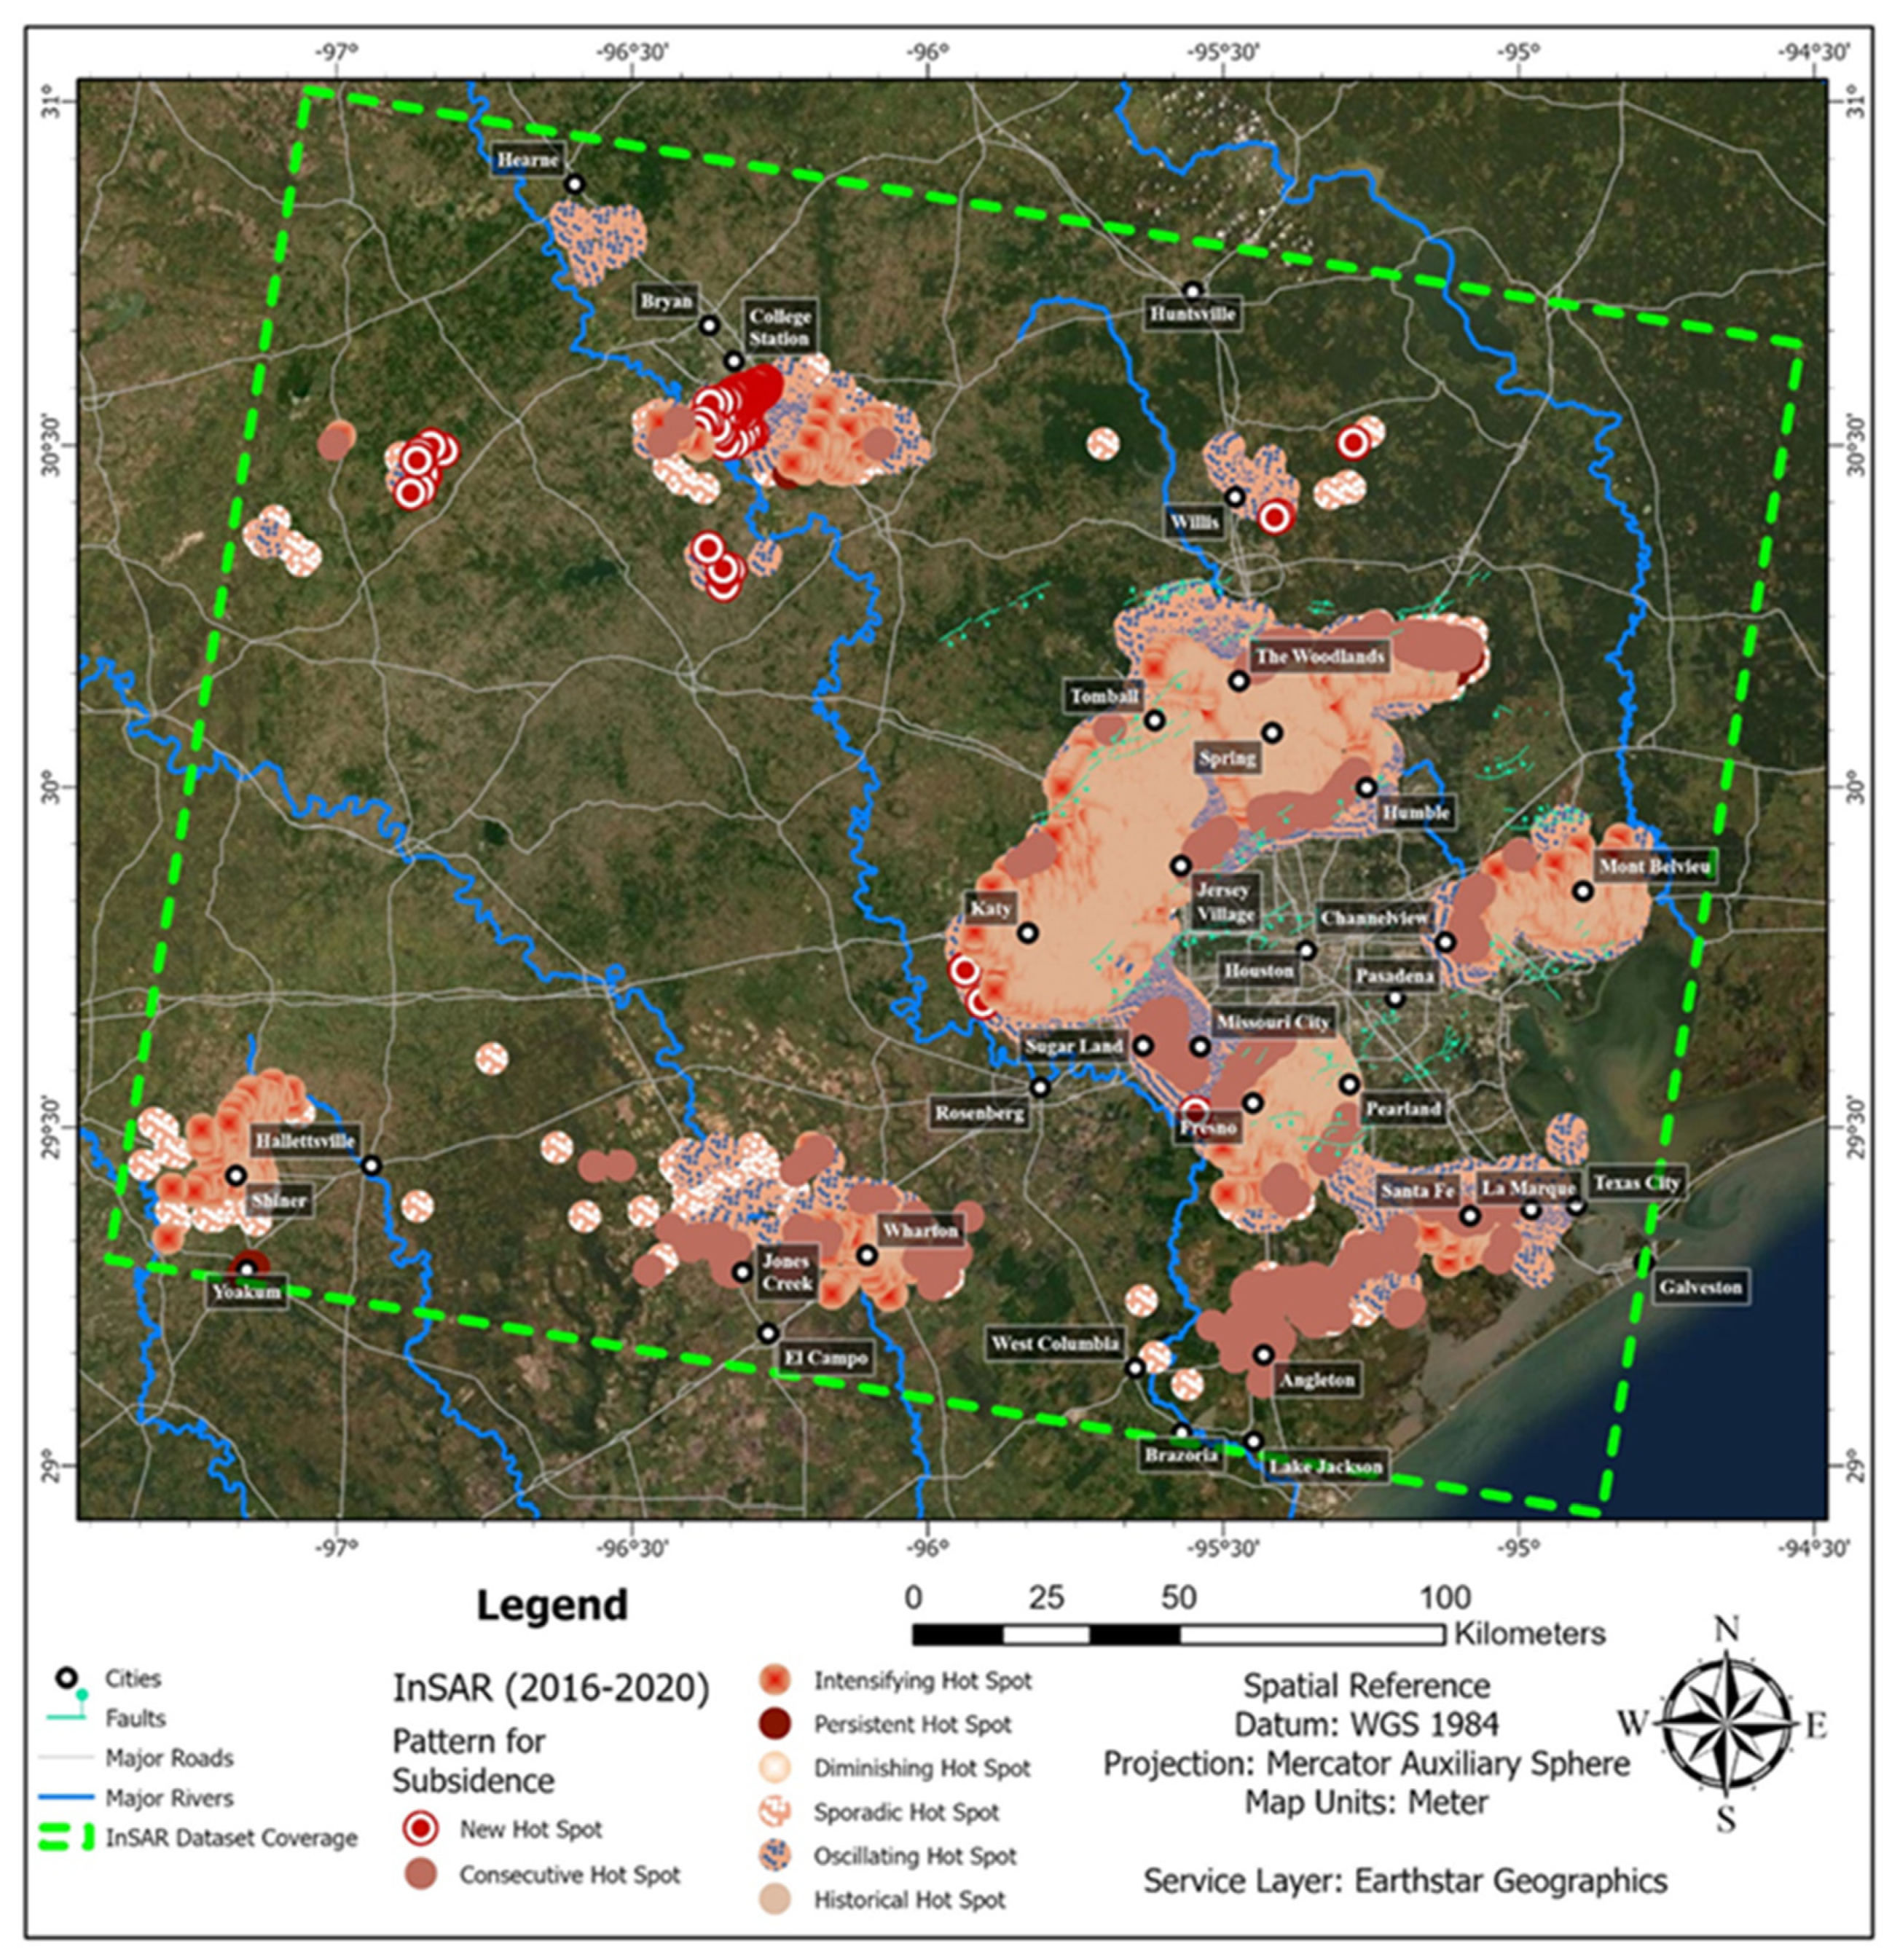
We conducted emerging hot spot analyses on InSAR data to find areas/clusters that show statistically significant subsidence (Figure 4). There are four major clusters of emerging hot spots in the study area. A large area encircling Houston from southeast to west to north depicts historical, consecutive, and intensifying hot spots. In Figure 4, similar clusters are located in the east around Mont Belvieu, in the northwest around College Station (a college town), and in the south around Wharton. There are a few additional clusters in small rural communities. Intensifying hot spots in Katy, Spring, The Woodlands, Mont Belvieu, and College Station represent statistically significant hot spots that have existed 90% of the time during 2016–2020; here, the clustering intensity is also increasing overall at a statistically significant rate [35]. The appearance of new hot spots during 2020 to the southwest of Katy and to the west of College Station suggests an expansion of statistically significant subsidence to those areas. Areas with consecutive hot spots at the margins may need monitoring, since subsidence at those sites could become substantial in the future.
To assess the quality of InSAR results, we plotted the subsidence rate measured by GNSS stations at several key locations (Figure 3b). To monitor subsidence, these locations have dense GNSS grids with more than 200 GNSS monitoring stations; all processed data are available to the public via the HGSD web portal [36]. HGSD operates most of the stations [5]. HGSD also contracted the University of Houston (UH); a local reference, Houston16, is used to process data utilizing the GAMIT/GLOBK (Version 10.7) package [5].
There are four GNSS stations in the Katy area under the designations P029, P097, P098, and MRHK (Figure 1). P029 was installed in 2007 and shows an average subsidence rate of −2.19 cm/yr from 2008 to 2021. When specifically looking at data from 2016 to 2020, this site shows a rate of −1.943 cm/yr. P097 started in 2018 and has shown a rate of −2.67 cm/yr until 2021. P098 shows a rate of −2.08 cm/yr from 2018 to 2021. The fourth site, MRHK, was set up by UH in 2014 and recorded a rate of −1.67 cm/yr from 2014 to 2021. Collectively, these four sites show an average subsidence rate of −2.119 cm/yr, which is very similar to the subsidence rate of approximately −2 cm/yr near Katy according to the InSAR results.
In the Tomball area northwest of Houston, GNSS station P017 shows vertical displacement rates of −1.24 cm/yr from 2000 to 2021 and −0.6 cm/yr from 2016 to 2020. The subsidence rate derived from the InSAR displacement product for that area ranges from −0.65 to −0.85 cm/yr. The GNSS station P047, located north of Houston in the Spring area, was installed in 2007 and shows a subsidence rate of −1.37 cm/yr from 2007 to 2021. The InSAR results of this same region yield similar rates, ranging from −0.75 cm/yr to −1.9 cm/yr. Comparatively, very little differences between the InSAR and GNSS results can be observed.
4.2. Groundwater Withdrawal
A complex, multilayered groundwater system called the Gulf Coast Aquifer System stretches across the entire Texas coastline. These deposits of clay, silt, sand, and gravel are over 3600 m thick and consist of the following five hydrologic units: the Catahoula confining system, the Jasper aquifer, the Burkville confining system, the Evangeline aquifer system, and the Chicot aquifer. The Chicot and Evangeline aquifers provide most of the water used by cities along the coast [37]. In the early 1900s, ground subsidence first became apparent [38] and, since then, continuous over-pumping of the Evangeline and Chicot aquifers by 1977 had led to decreases in the water level in areas of Houston. About three meters of ground sinking had occurred by 1979 [1]. In most previous studies, groundwater pumping and the piezometric surfaces of the Evangeline and Chicot aquifers are compared with subsidence [7,9,39,40,41,42]. Unlike previous studies, we have applied emerging hot spot analysis to groundwater data to find clusters of water decline and compare these clusters with recent and prior subsidence sites.
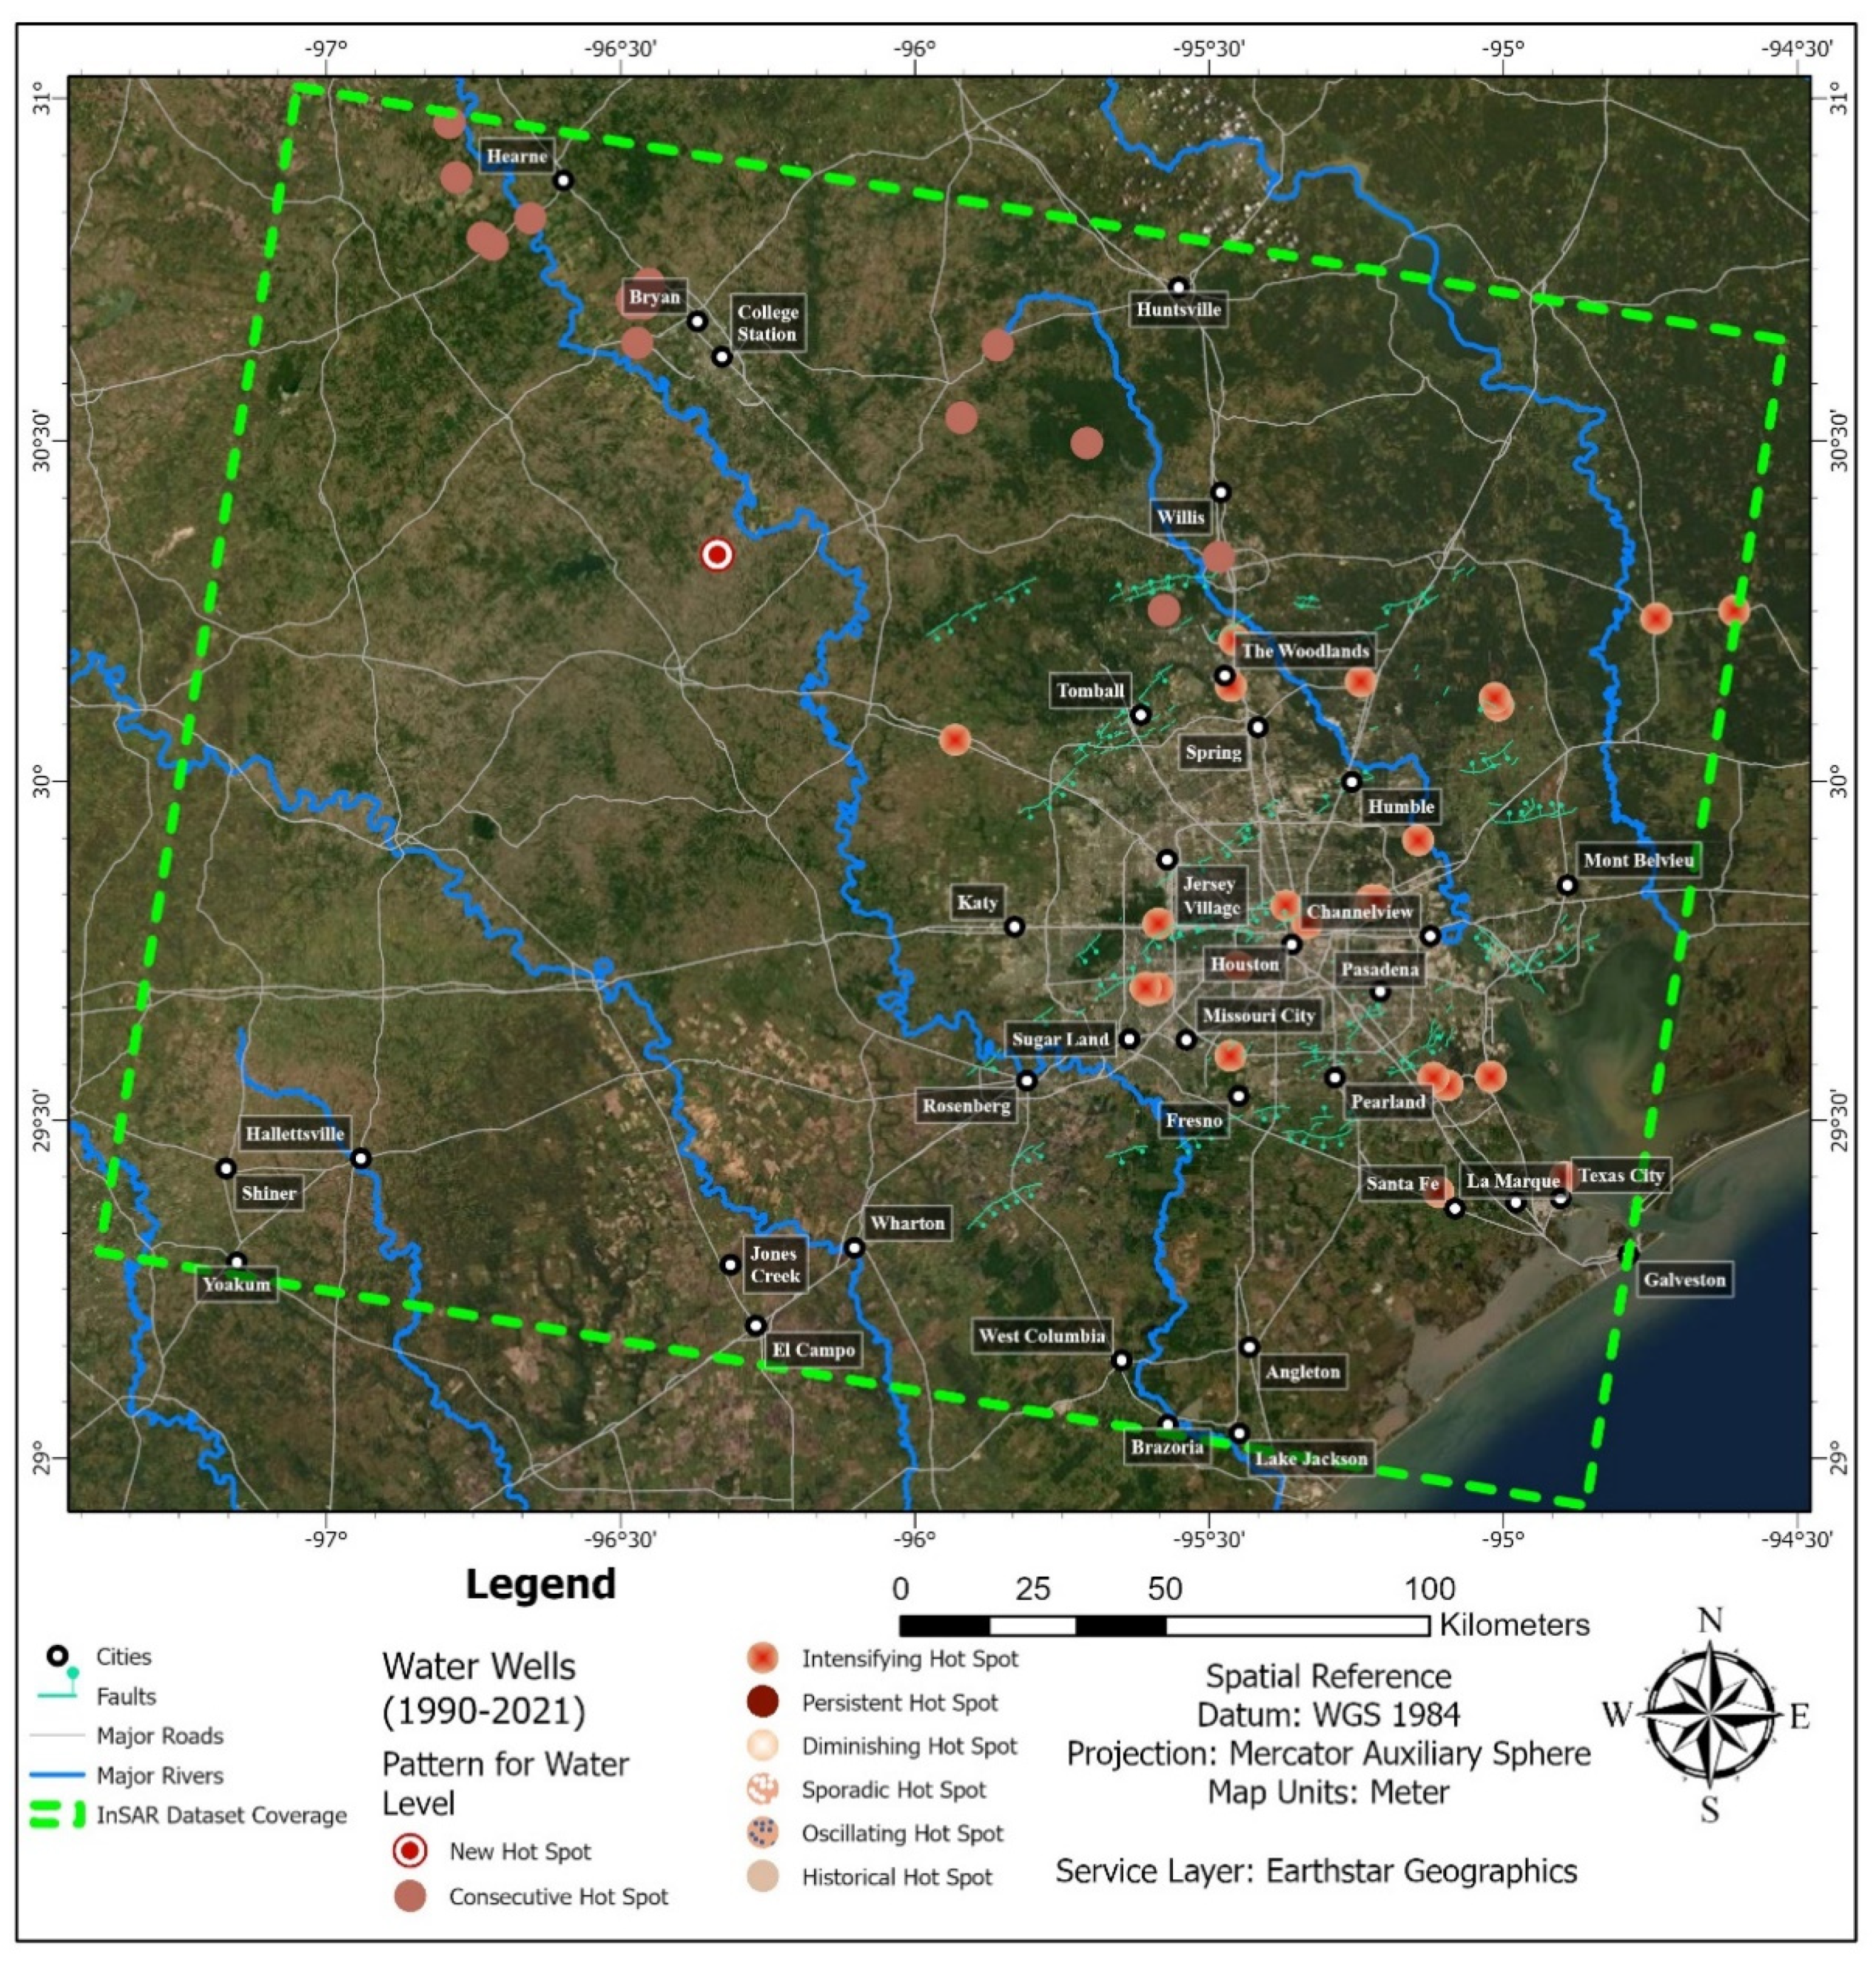
Results of emerging hot spot analysis are displayed in Figure 5. The emerging hot spot analysis for water level uses defined locations, but it relies on a time step interval of three years. Making the interval any shorter produces more detailed time-series graphs and hot spot analyses but erases any points associated with wells that do not gauge water level as frequently as the user-defined interval. As a result, the statistical analysis of the water level depicted in Figure 5 shows relatively smaller clusters. Most of these clusters in and around the Houston metroplex show intensifying hot spots, which, as mentioned before, represent statistically significant hot spots that have existed 90% of the time during 1990–2021, where clustering intensity increases over time [35]; in other words, here, the water table in Houston has fallen to and remained at an anomalous low compared to its surroundings and this anomaly is expanding outwards to surrounding areas. In the northwest of Houston, we see consecutive hot spots, which represent sites where less than 90% of all bins were statistically significant and the bins that became significant only did so towards the end of the analyzed period. In other words, here is where the water table had not fallen to an anomalous low until the last few time step intervals (closer to 2021), so these sites may need to be monitored in the near future.
4.3. Oil and Gas Well Clusters
Texas is a prominent oil-producing state in the United States. The first oil field, Humble, was discovered in 1905 while salt domes were being explored there [43]. In 1908, the Goose Creek Oil Field was found. In the 1930s, oil-productive fields located to the northwest of Harris County—i.e., Tomball and Hockley—were discovered. As the exploration of new oil fields continued, Pratt and Johnson [44] recognized subsidence over the Goose Creek area caused by oil extraction. Holzer [45] reported subsidence from six oil fields and uplift in four fields in this region from 1910 to 1970. Qu et al. used multi-temporal InSAR data from 1993 to 2011 to map the subsidence of the region; this work identified five oil-producing fields at Webster, Seabrook, Stratton Ridge, Santa Fe, and North Dayton where subsidence could be attributed to hydrocarbon production [13].
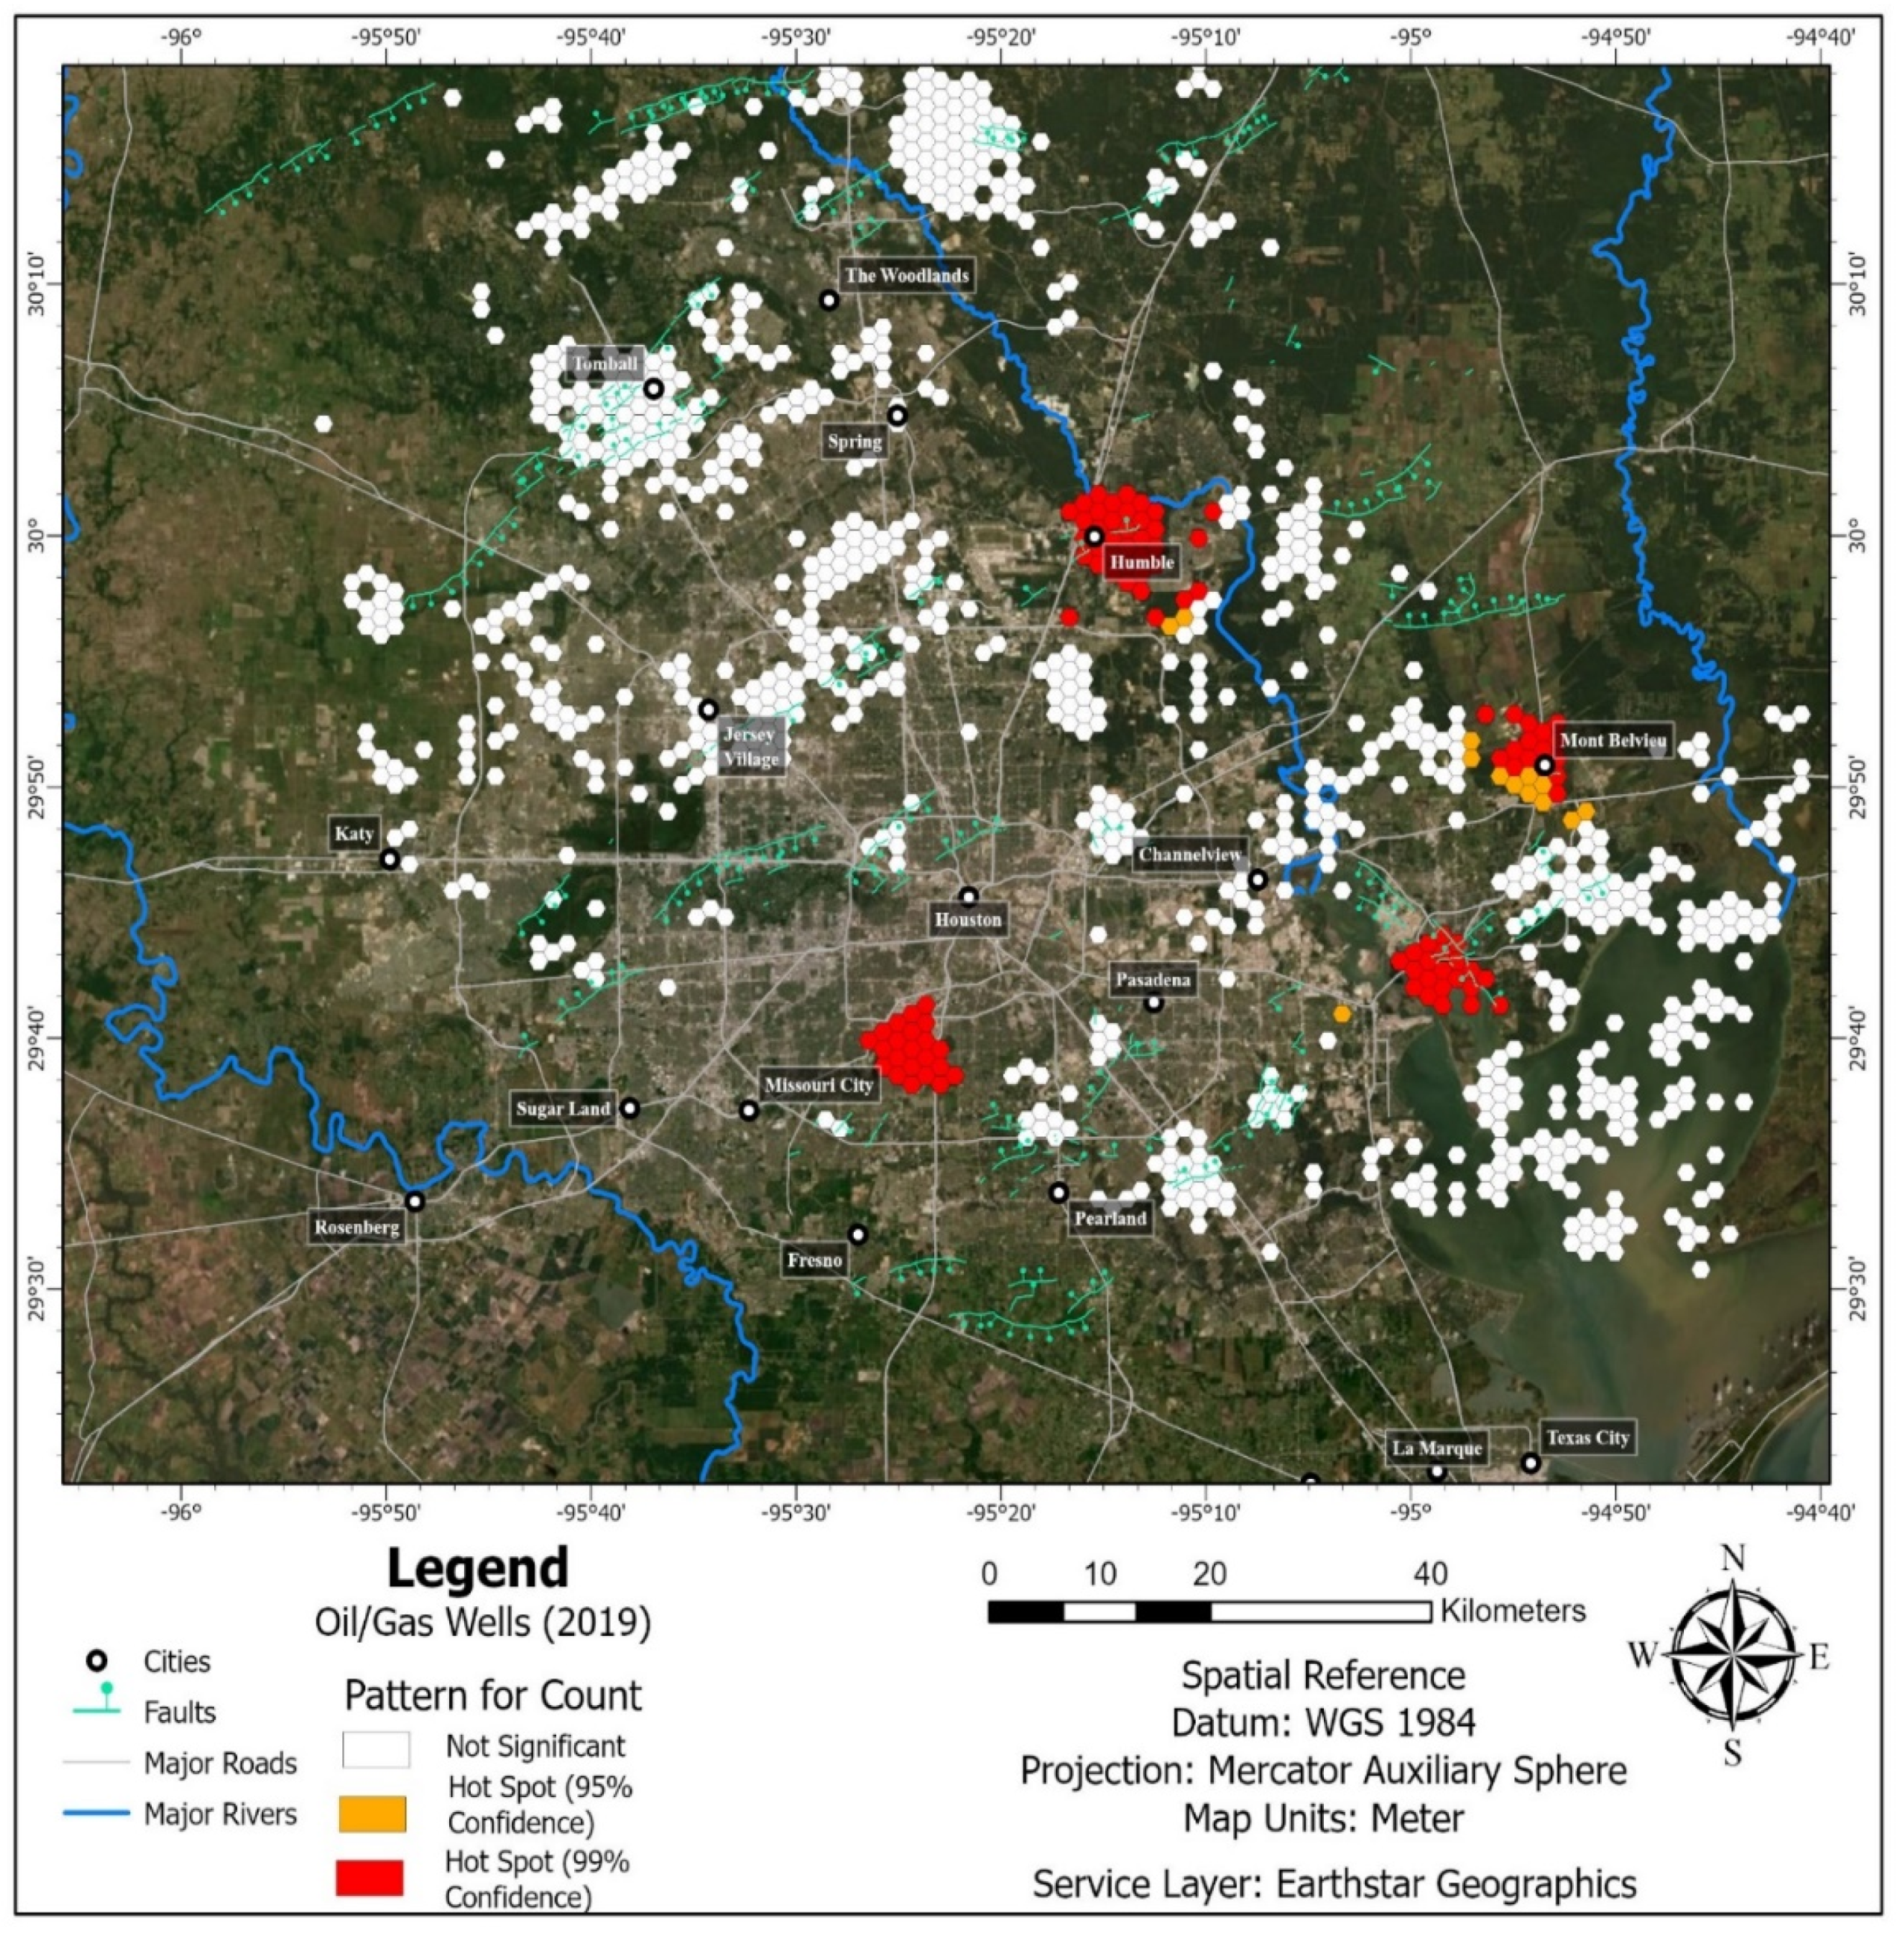
In this work, we conducted an optimized hot spot analysis of oil/gas well count using hexagon cells of different sizes. Larger cell sizes are easier to see on a map, though they tend to lose details related to the size, number, and statistical significance of cold spots, i.e., areas with fewer wells than others. Ultimately, the cell size for optimized hot spot analysis of oil/gas well count was set to two kilometers; the resulting output can still provide useful information (Figure 6). Four hot spots were found near Humble, east of Missouri City, Mont Belvieu, and south of Mont Belvieu, near Seabrook. Missouri City shows some subsidence, but Mont Belvieu shows a substantially greater amount, up to ~−2 cm/yr. Subsidence in Mont Belvieu may be caused by oil and gas pumping, though more work is needed to confirm this. In the past, Seabrook has been suggested as a location that is potentially undergoing subsidence due to oil and gas pumping [13].
4.4. Fault Mapping
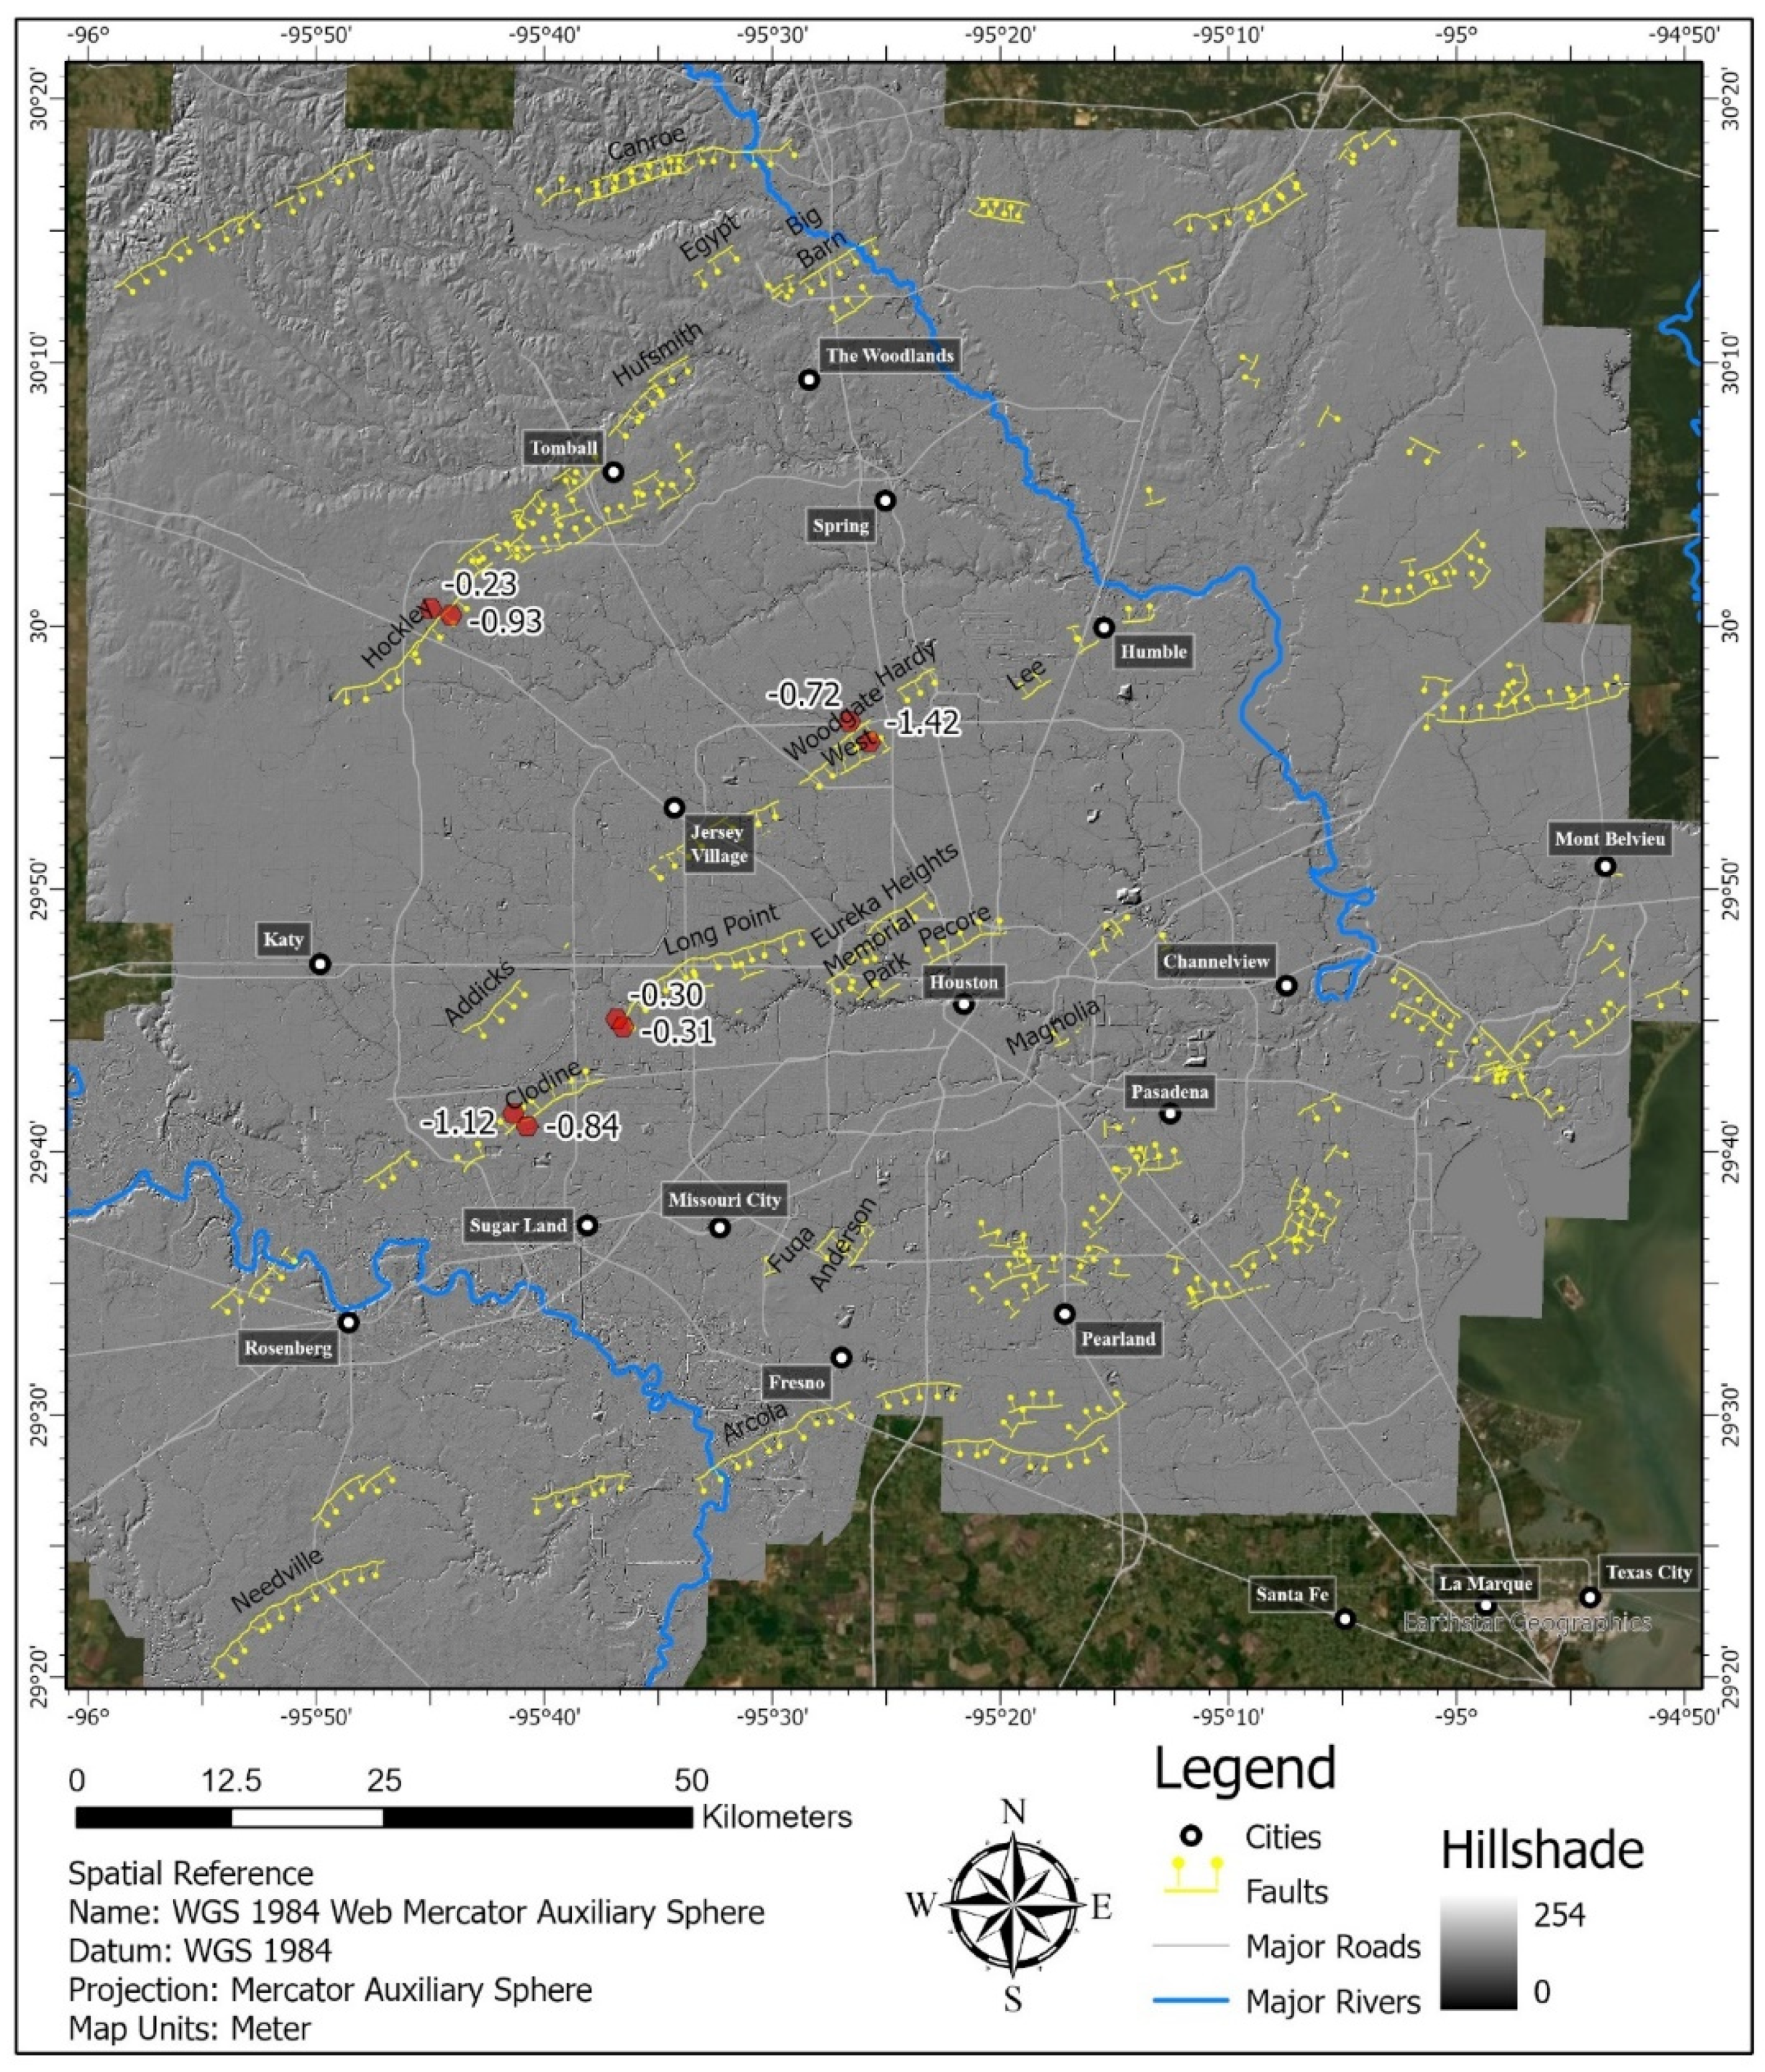
We used lidar datasets collected in 2018 and 2019 and generated hillshade images to update the faults map. Several new faults are identified in the southwest. We refined the location and orientation of other faults. We also added dip direction for these faults (Figure 7). These are normal faults with steep dip (65°–70°) and most of the displacement happens on the fault’s downthrown side (hanging wall).
5. Discussion on Causes of Subsidence
This study focused on the fourth-largest city in Texas, Houston, which is located near the northern coast of the Gulf of Mexico. This megacity is about 80 km from the shoreline. This region’s sea level rises more than four times higher than the global sea-level rise. As a result, the surface deformation in this region is quite complicated and is caused by multiple processes, including:
- Groundwater extraction: the primary cause of subsidence in the Gulf of Mexico is attributed to large-scale groundwater withdrawal since 1906. The area of the “subsidence bowl” (which covers a surface area of approximately 10,000 km2) was identified to have experienced over 3 m of subsidence [38]. In this area, groundwater was the main source of water supply for households, industry, and agriculture. In addition, demand for groundwater sharply increased with rapid population growth [42].
- Hydrocarbon withdrawal: one of the well-known subsidence incidents attributed to oil/gas pumping happened in the Goose Creek Oil Field, Houston, exceeding 110 mm/year [44].
- Active normal faulting: this can be seen in seismic reflection data extending to depths of 10 km and includes surface scarps. The long-term slip rates along these faults are unknown, but recent GNSS studies suggest 7–11 mm of vertical displacement per year along a few faults in the Houston area [9,30]. Similarly, Gagliano interpreted 20–30 years of tide gauge and releveling data and reported substantial vertical movement along growth faults in coastal Louisiana, resulting in considerable loss of land area to the sea [46]. Fault reactivation in subsiding areas has also been investigated. For example, fault reactivation by interaction with fluids was studied by several researchers [47,48,49]. Geological observations and numerical modeling demonstrated activation of pre-existing regional faults over areas undergoing subsidence [50,51,52,53,54,55,56]. Donnelly summarized several examples of damage and reactivation of faults in the United Kingdom’s urban areas undergoing subsidence [57]. Paul Segal dedicated a chapter of the textbook to the physics of poroelastic effects on faulting, as pore-fluid pressure can change frictional resistance on faults [58]. These and many other studies of subsidence disagree on the rates and relative contributions of several mechanisms; these inconsistencies come from these studies’ differences in time scales, depths, and spatial extent.
- Sediment compaction: alluvial aquifers in the Gulf Coast region are made up of semi-consolidated silt, clay, and sand layers. As water levels decrease, the fluid pressure in the aquifer also drops. The air-filled pores lower the strength of the aquifer skeletal system and cause subsidence [1,6,59]. Typically, aquifers undergo periodic fluctuations and produce reversible subsidence of a few centimeters [1]. Several researchers associated increased subsidence rates with increased sediment thickness in the Gulf Coast region [60,61]. These observations are based on generalized stratigraphy and are not qualitative. However, based on modeling data in the Netherlands, sediment compaction may be a minor factor. Kooi and De Vries suggested 0.1 to 1 mm/yr of subsidence due to Holocene sediment compaction in a relatively similar setting in the Netherlands [62]. Similarly, Monte Carlo simulations of sediment compaction in Louisiana, which has the same type of sediments as Houston, found only a few mm of subsidence on a regional scale [63]. However, sediment compaction could be significant locally.
- Salt extraction: subsurface salt withdrawal and migration are linked to normal faulting and sediment loading. Seni and Jackson estimated an approximate uplift of 0.45 mm/year for Texas salt domes during the Cenozoic [64]. They considered these growth rates to be discontinuous, contrary to prior notions of being cyclic.
- Water loading during extreme flooding: severe subsidence raises the prospect of flooding and produces a negative feedback loop. The hefty weight of floodwater from severe flooding compresses the sediments in the subsurface [1,7,59]. Generally, unconsolidated aquifers are elastic and can rebound after compaction. However, regions that have subsided lack this ability. Therefore, flooding can contribute to compacting the soil and drive subsidence [59]. Houston has experienced weather events, such as Hurricane Harvey, when over 150 cm of rain fell within six days [65]. GNSS data indicate that post-Hurricane Harvey deformation ranges from subsidence of ~68 mm to uplift of ~5 mm, with significant subsidence rates in northern and southwestern Harris County [66]. Using InSAR, it is estimated that 89% of the areas inundated by Hurricane Harvey experienced subsidence at rates greater than 3 mm/year [15].
In this work, we further analyzed the impact of long-term groundwater withdrawal using emerging hot spot analysis. We also analyzed counts of active oil and gas wells and recent fault activity in the region.
5.1. Groundwater and Subsidence
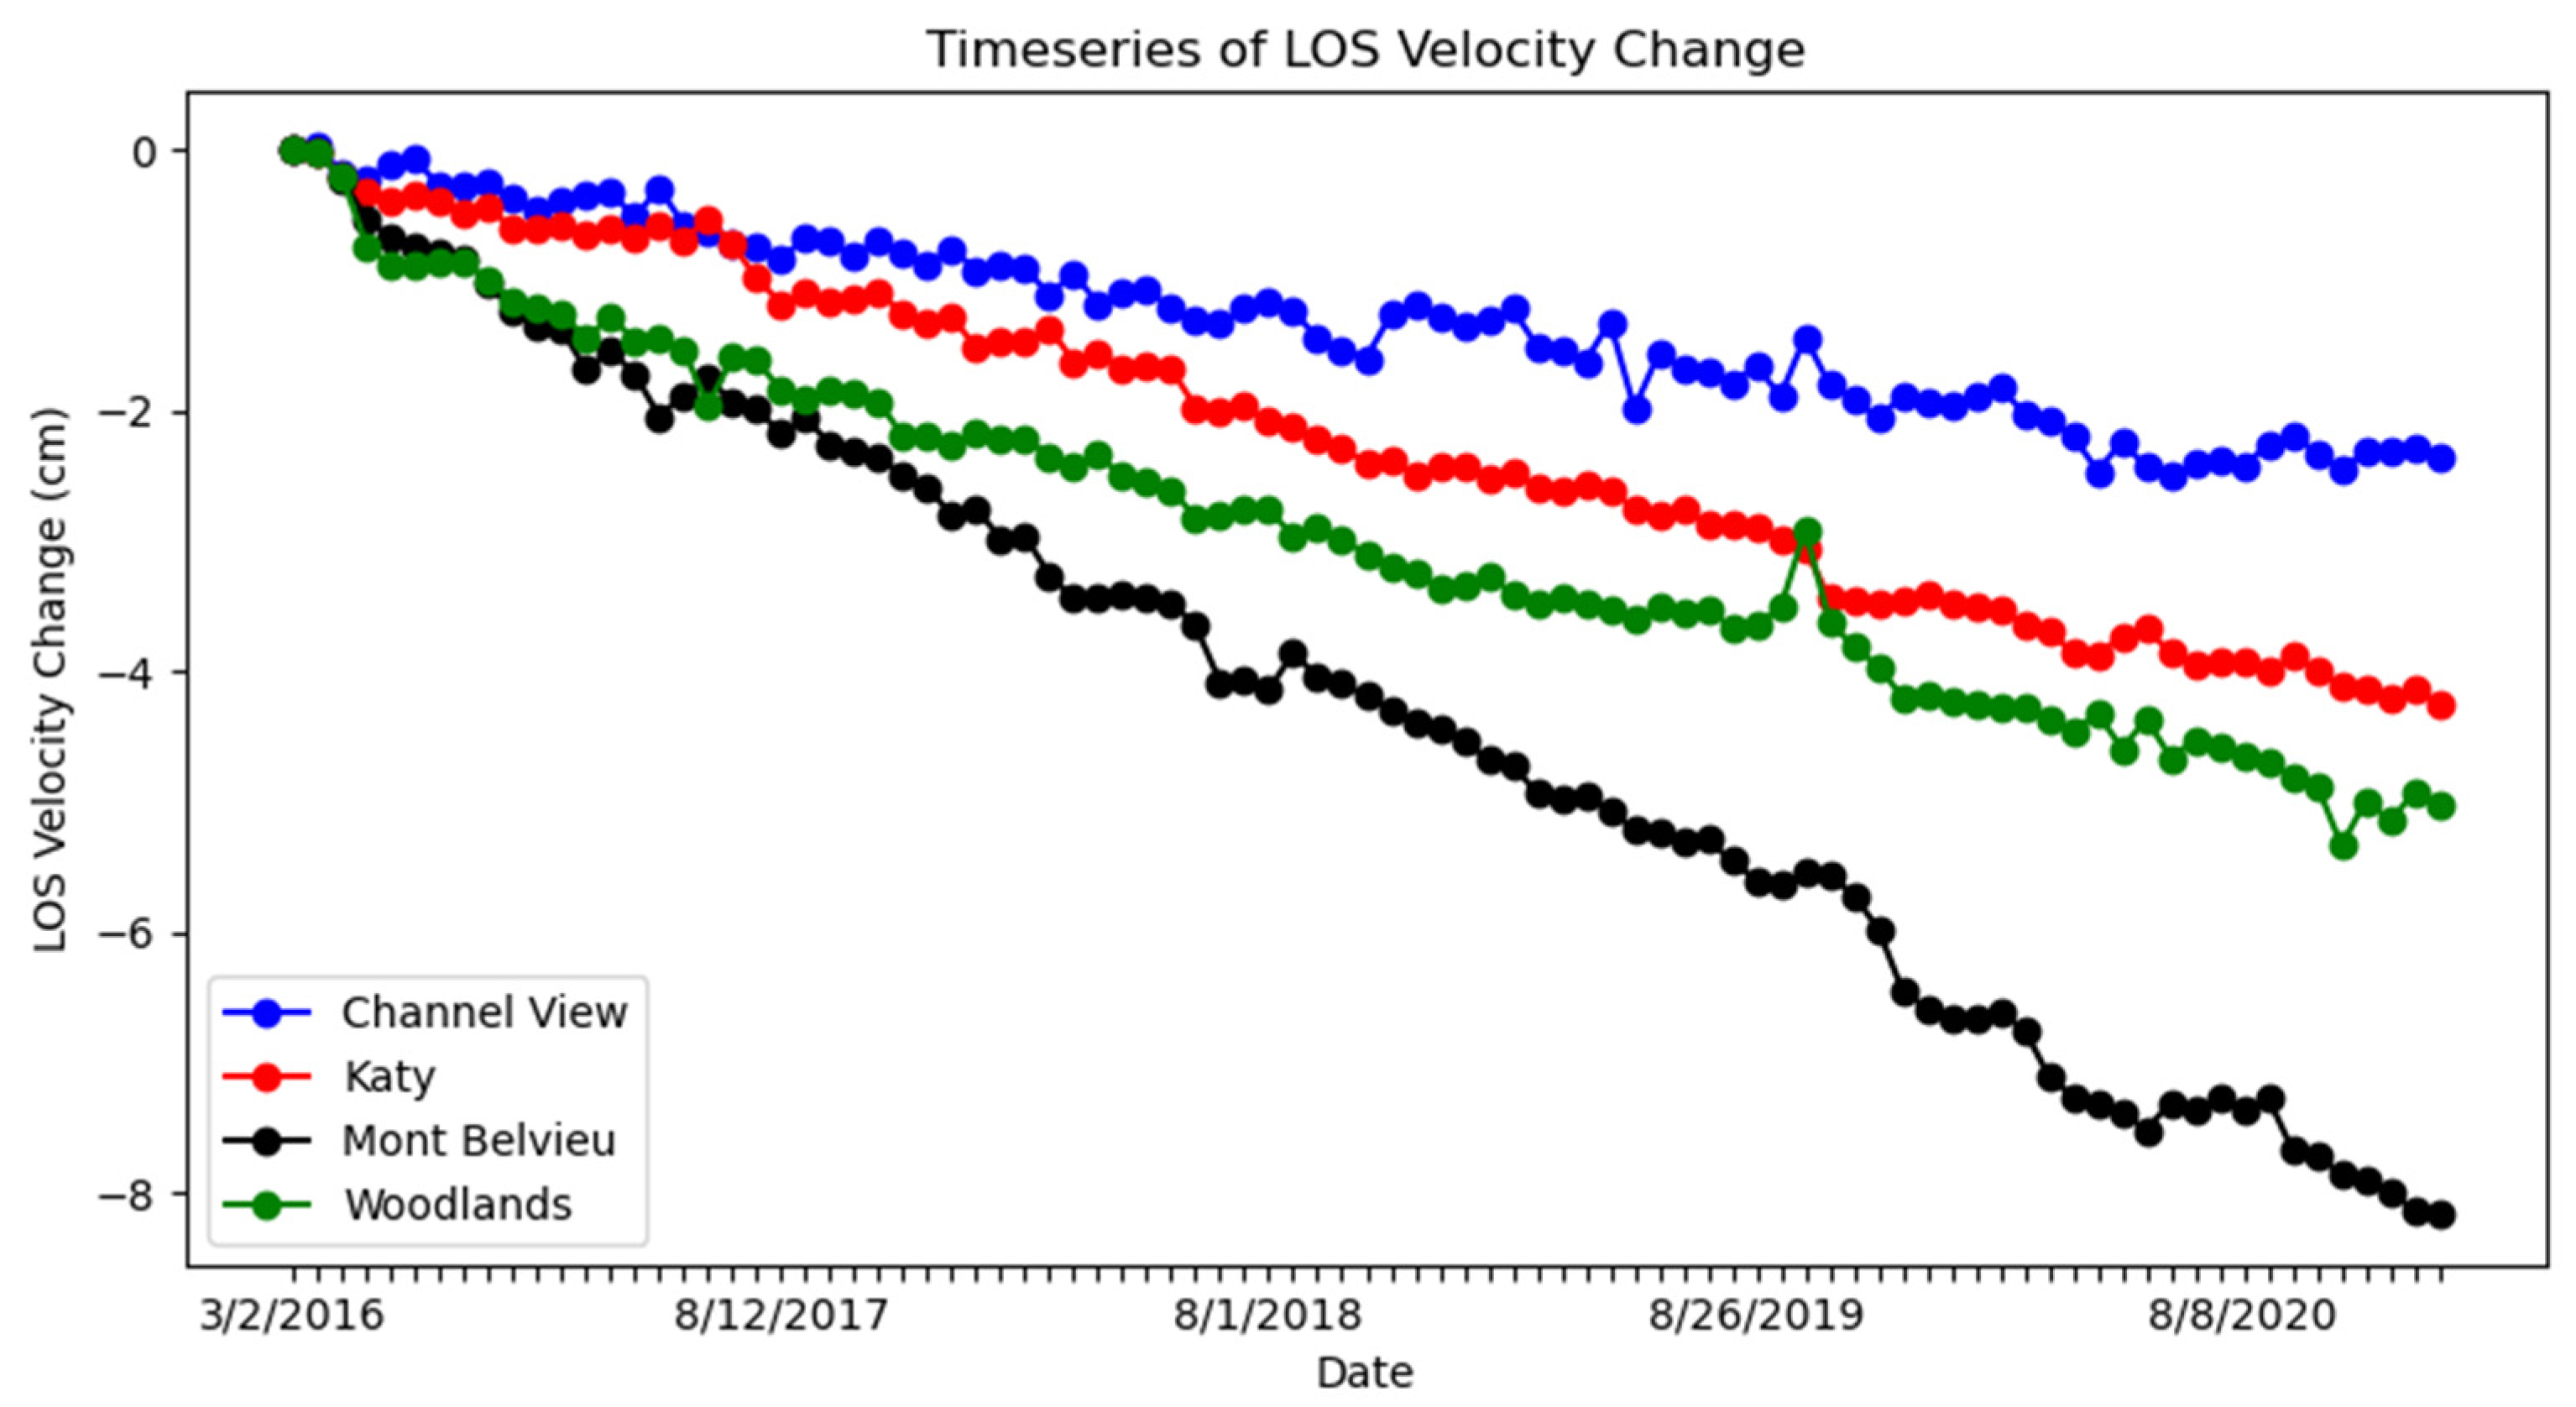
To determine the nature of displacement and its relation with groundwater and oil and gas wells, we plotted time series for four selected areas that show the highest subsidence (Figure 8). The locations selected for time series are shown in Figure 1 as red stars. Subsidence in Katy and Mont Belvieu shows a linear pattern that progressively increases from 2016 to 2020. Spring and The Woodlands show a sublinear decline, though, by September 2019, we see a brief rise followed by progressively slower LOS downward displacement. The time series for Channelview shows more complex variations over time but an overall reduction and change in the rate of decrease from October 2018 onwards.
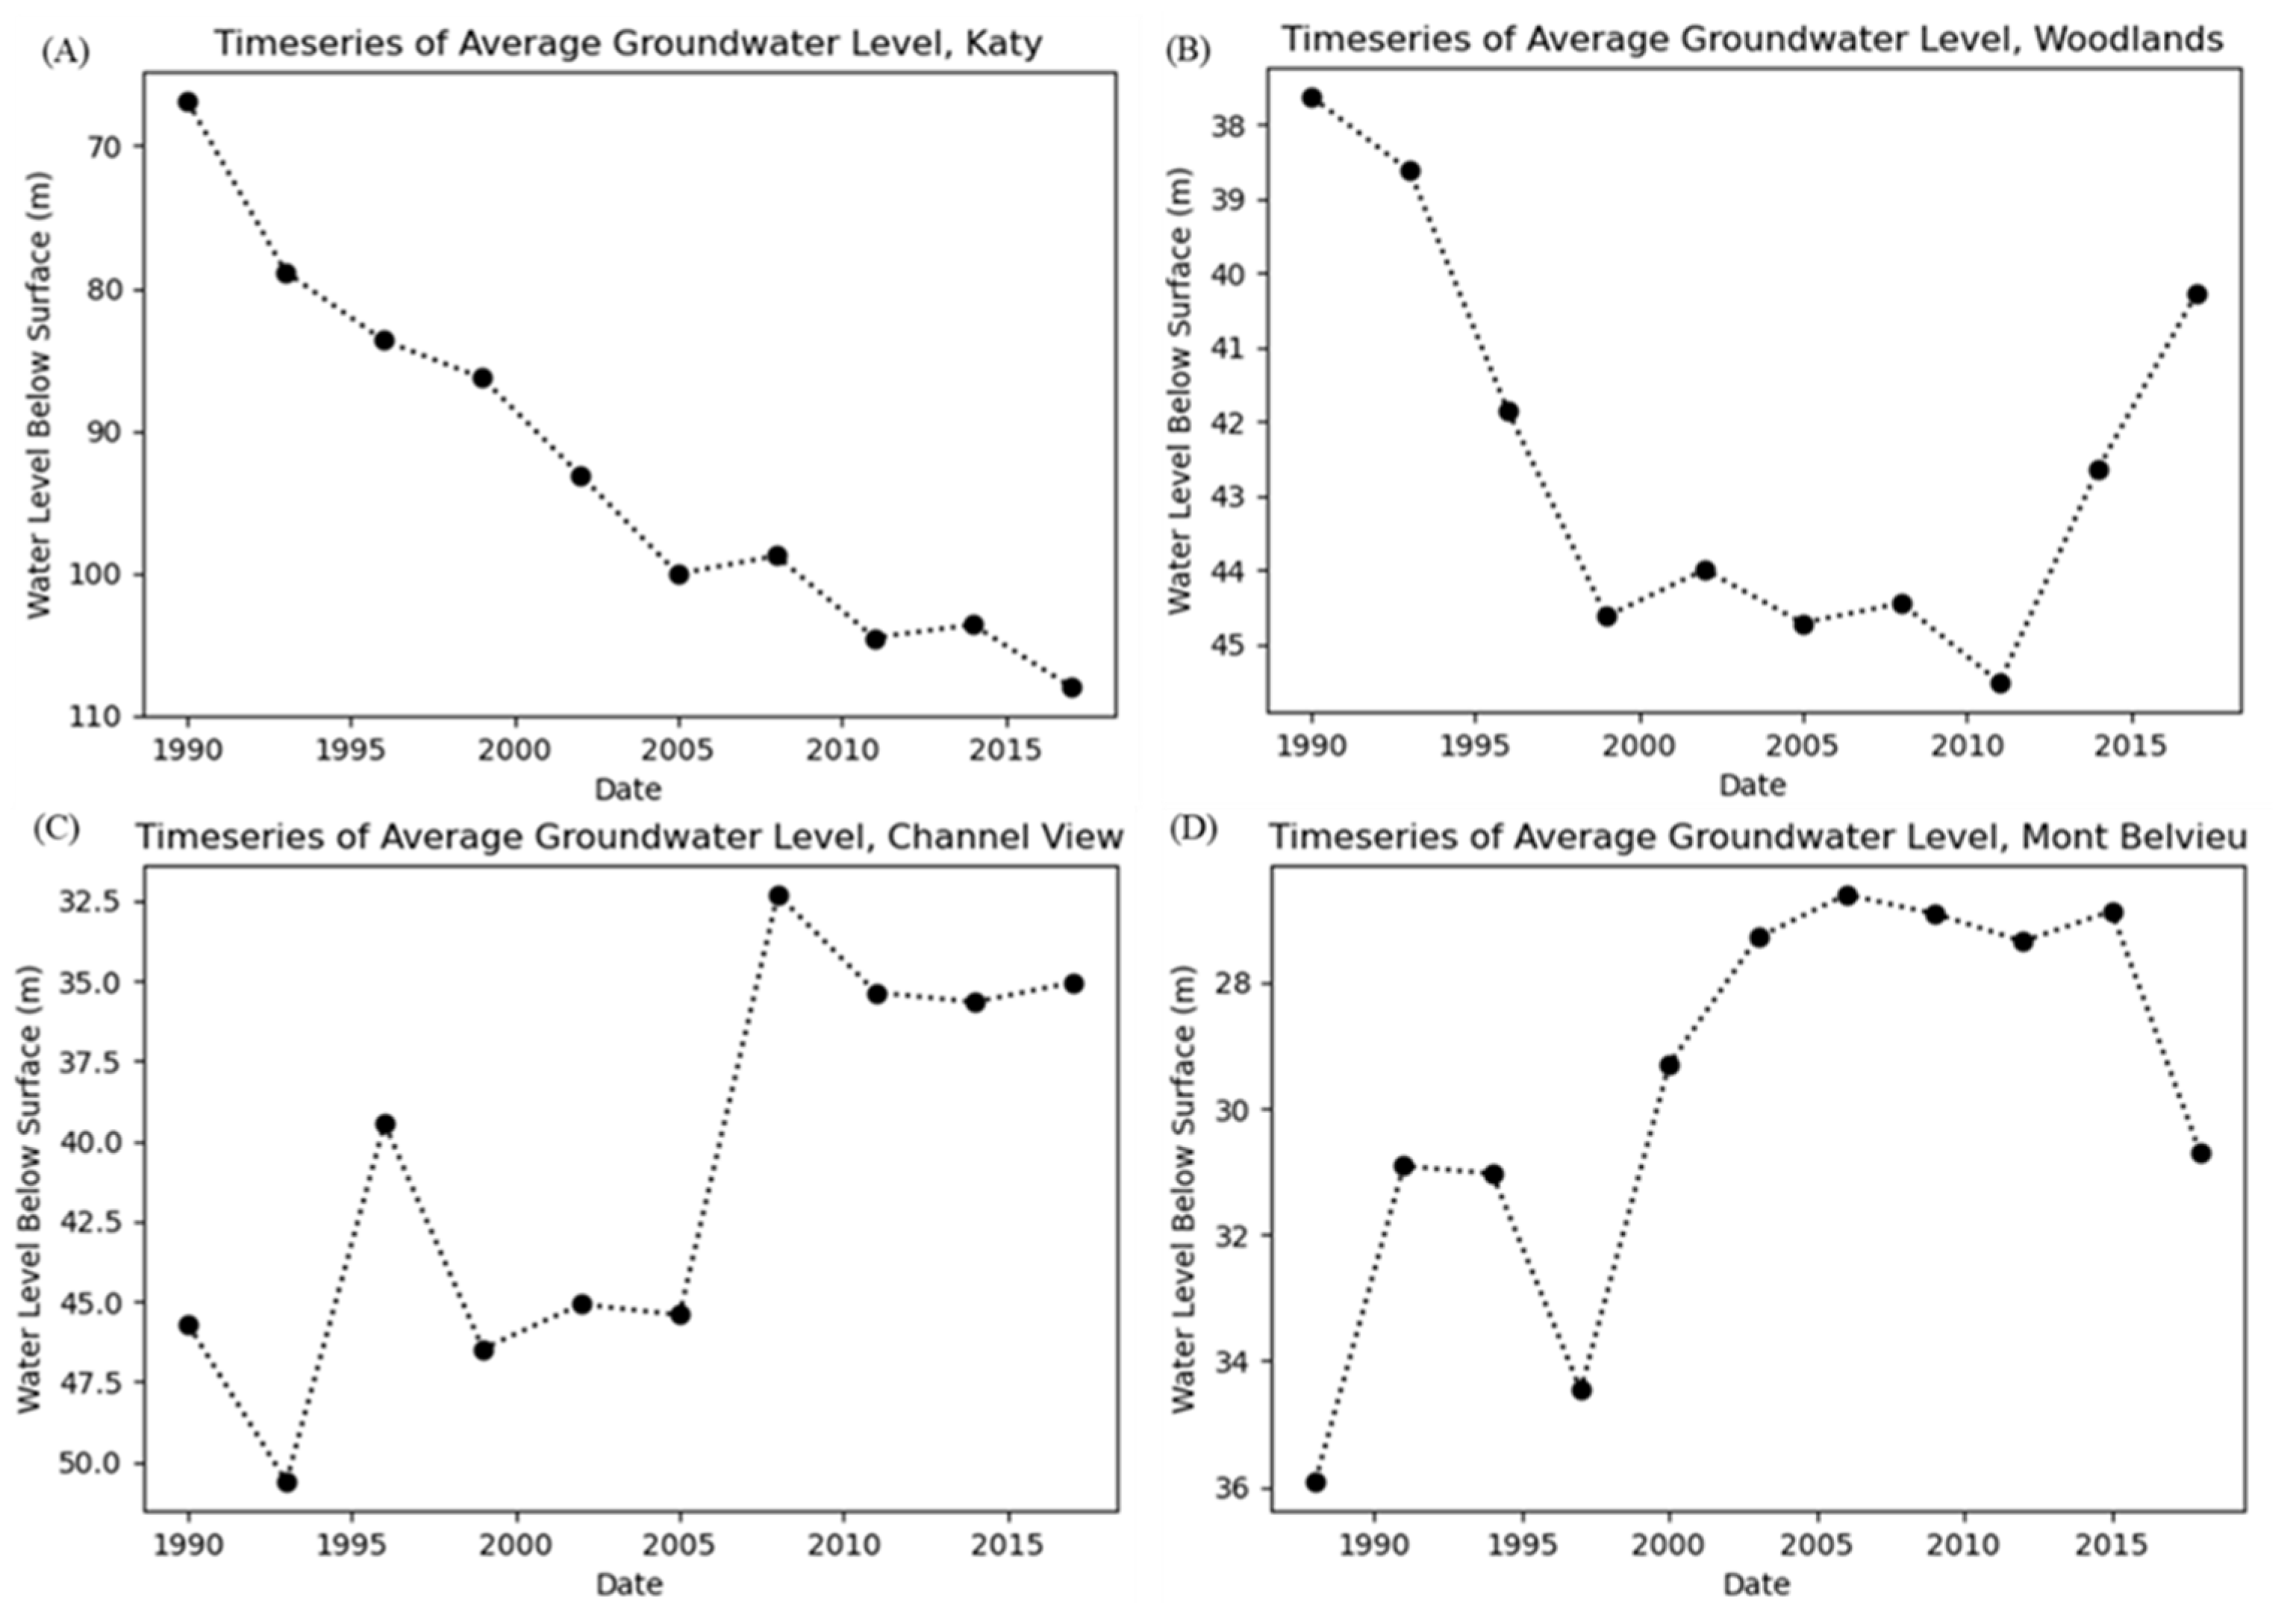
Emerging hot spot analysis was conducted for groundwater levels to investigate the relationship between groundwater level change and subsidence rates in Katy, The Woodlands, Channelview, and Mont Belvieu. Time-series graphs are generated showing average water level change within 10 km of each city (Figure 9). These graphs allow an analysis of the water levels closest to subsiding areas. Figure 9A shows a consistent decline in water level from 1990 to 2021 in the Katy area. The average water level dropped from 66.9 m below the ground surface to 108 m. In the Spring–Woodlands area, water levels declined from 37.6 m to 44.6 m from 1990 to 1999, after which the decline started slowing down from 2000 to 2011 before ultimately rebounding in 2014 (Figure 9B). A similar trend can be seen in Tomball and other surrounding areas, where the water level dropped for three decades before bouncing back in 2015. This decline and rebound are consistent with water usage since, starting in 2015, the Lone Star Groundwater Conservation District restricted groundwater usage and started using surface water from Lake Conroe in this region [67].
The water levels in Channelview show noticeable fluctuations. First, there was a three-meter decline in groundwater level from 1990 to 1993, followed by an overall rise by 10 meters, before stabilizing for a decade (Figure 9C). The time series for the average water level in Mont Belvieu shows a different pattern (Figure 9D); here, the water level rose by five meters during 1988–1993, declined by around three meters in the next six years, and rose again by five meters during 1999–2008. The water level then remained stable from 2008 to 2015, before finally dropping by four meters from 2017 to 2020.
Water level fluctuations are consistent with subsidence in Katy and, to some extent, in The Woodlands and Spring. However, groundwater level decline cannot explain the periods of water fluctuations and stability observed in the data for Channelview and Mont Belvieu. Channelview shows minor subsidence of less than −0.4 cm/yr. Conversely, Mont Belvieu shows one of the highest localized subsidence rates.
5.2. Faulting and Subsidence
Hundreds of faults are mapped in the Houston area using field methods [68,69], lidar [70], aerial photos [55,56], geophysical methods [71,72,73,74,75,76,77], and InSAR [14]. Figure 7 shows the updated map. We added the faults’ orientation and refined a few faults’ locations. These are normal faults. Most of the regional faults are trending northwest to southeast and dip in the southeast direction. Opposite to the regional faults are antithetic faults dipping mostly in the northwest direction. There are many small faults related to salt dome activity, mostly in the southeast. These faults in the Houston area were largely inactive until the last century, with most acting as fluid barriers. However, as pore pressure is reduced and sediment is compacted due to groundwater pumping, the differential pressure is transferred to the surface and the fault is reactivated [45,59,78]. Fault movement is, thus, highly correlated with aquifer elasticity in the Houston area.
No seismic activity is reported along these faults in Houston. As such, fault movement is suggested to be happening by aseismic creep. However, fault activity is evident from damages to roads, buildings, and other infrastructure in the vicinity of these faults. Displacement along these faults is variable both in space and time [75]. Displacement along some is measured up to 3 cm/yr [11,69]. Long Point Fault was historically very active and 2 cm/yr of movement for 20 years in the last century was observed [1]. Using data from 12 continuous GNSS stations from 2013 to 2018, Liu et al. [79] found less than 1 mm/yr movement along Long Point Fault and concluded that it was inactive. InSAR data were analyzed for two L-band PALSAR tracks from 2007 to 2011 using the multi-temporal InSAR technique [14]. They found a slip rate of 7–13 mm/yr with a shallow locking depth for the SW–NE-oriented faults in northwest Houston.
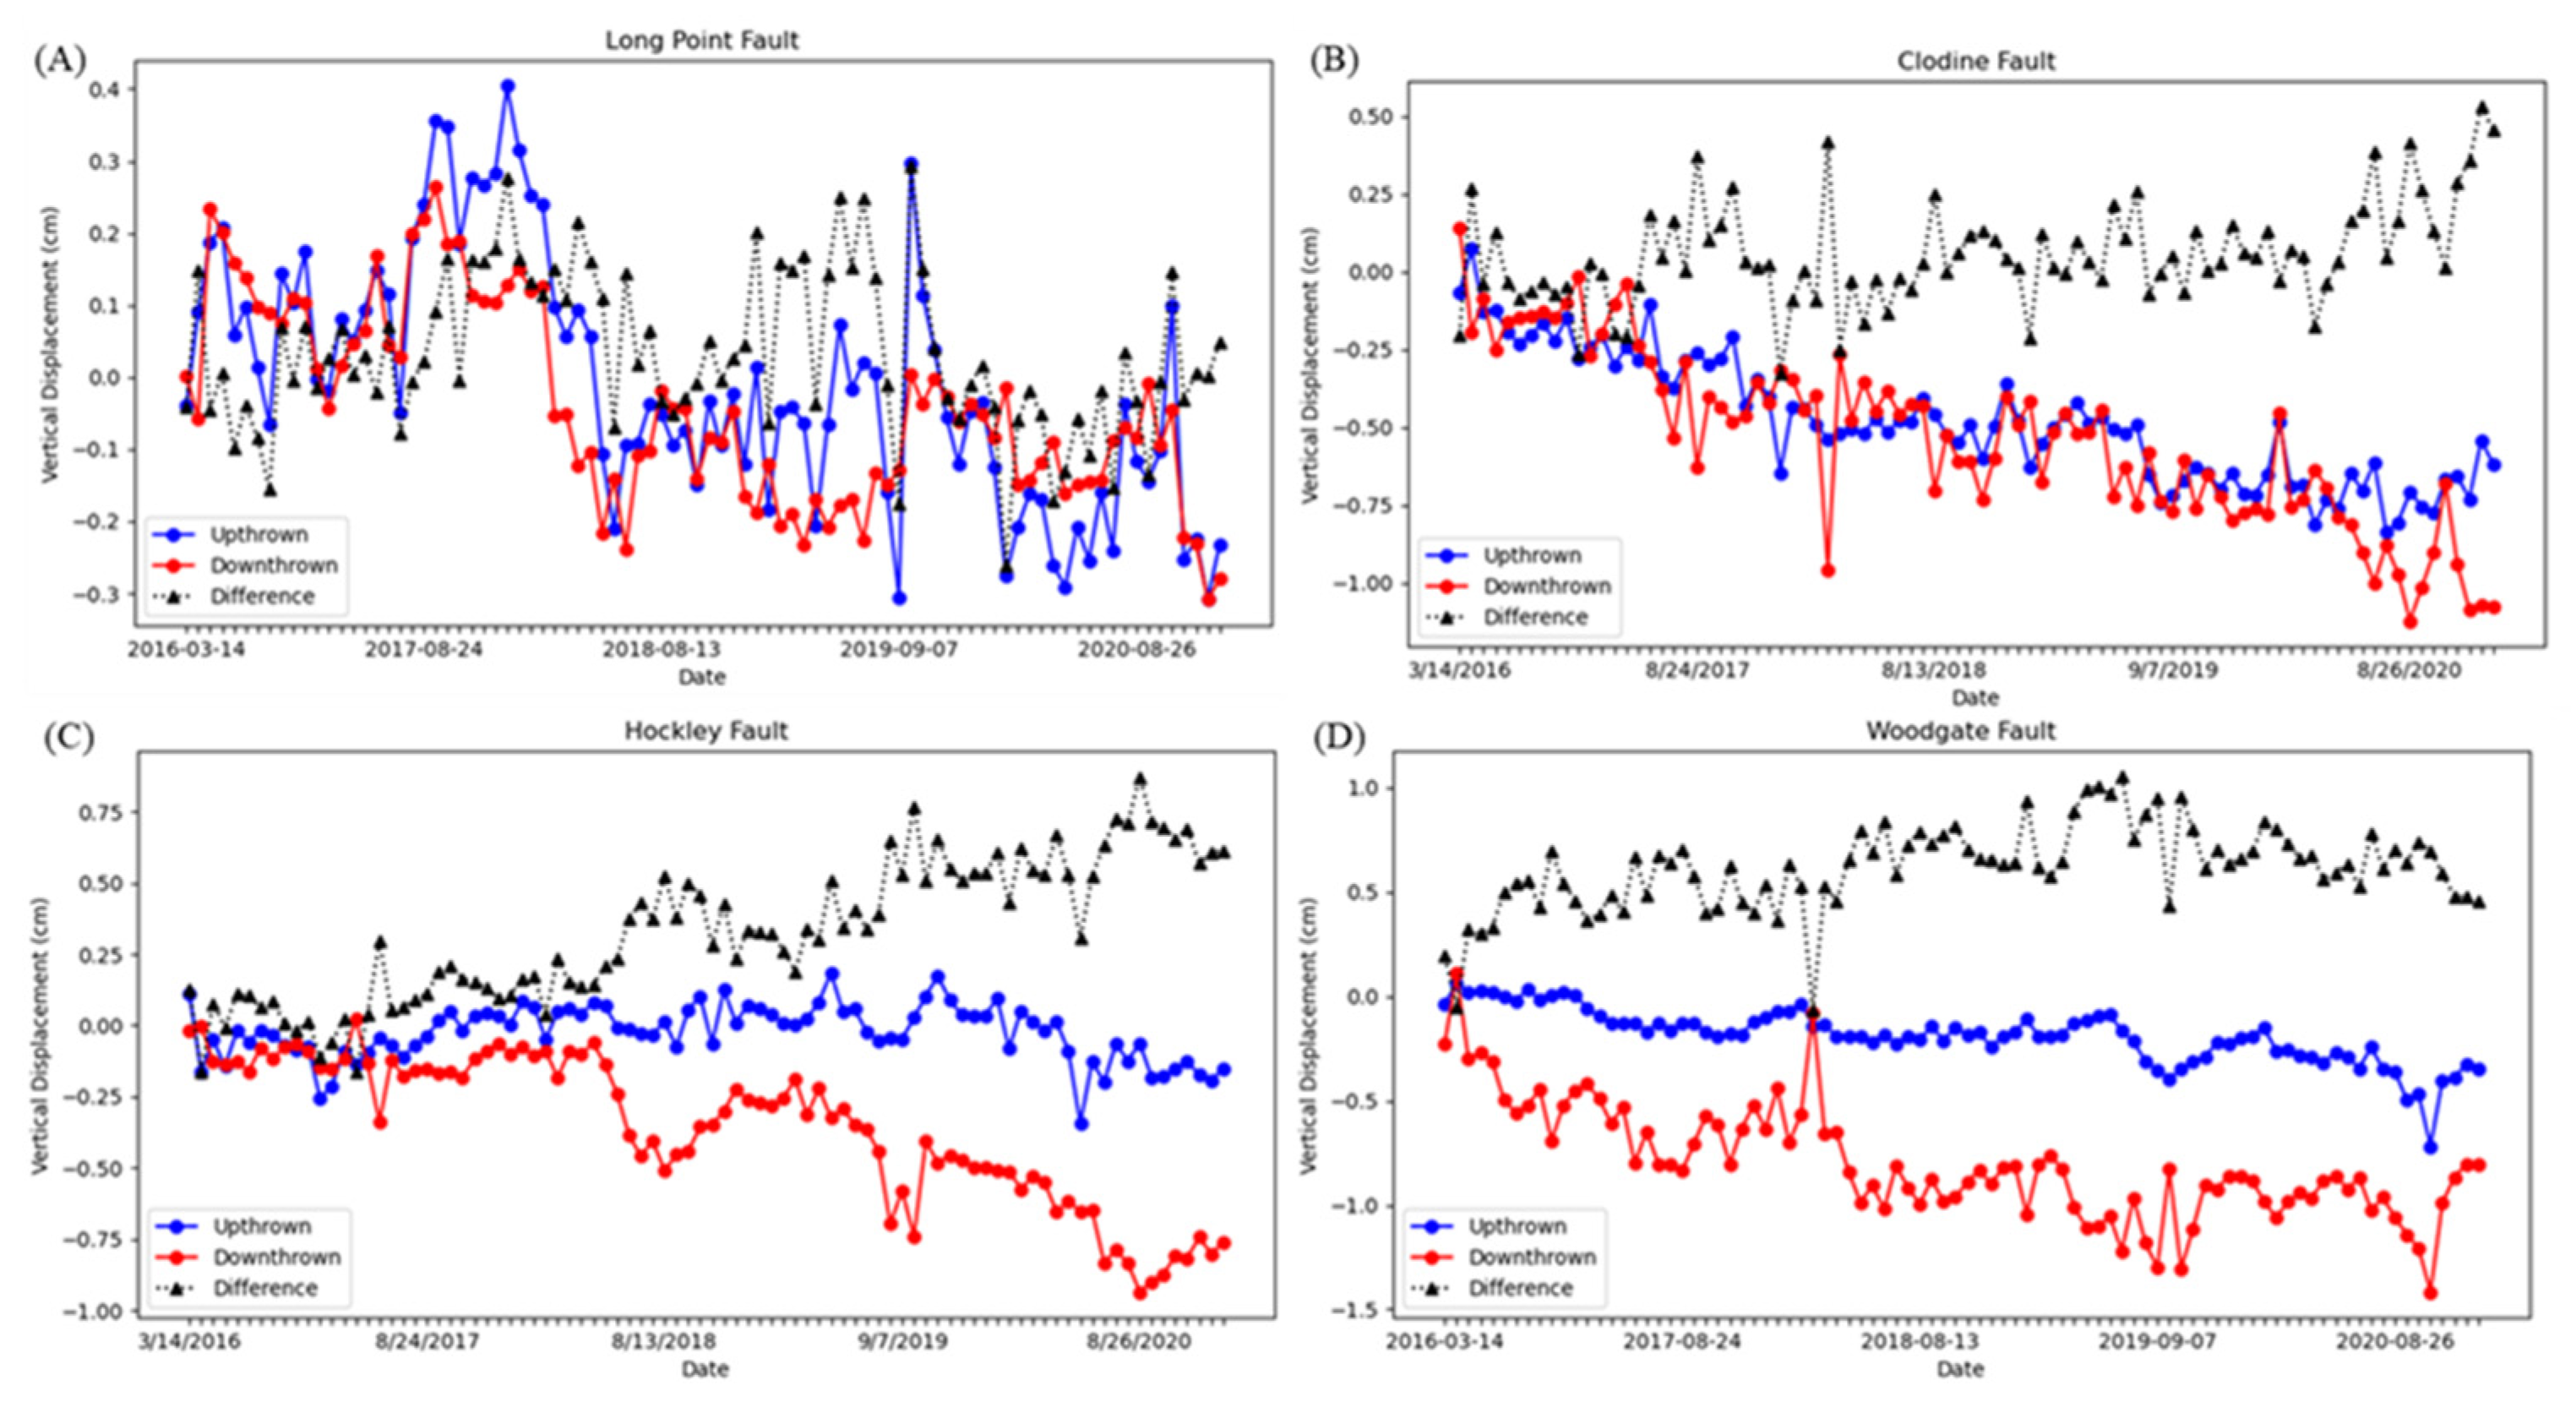
We analyzed InSAR time series data on four major faults to assess fault activity. We display LOS displacement time series for the upthrown and downthrown sides of the fault scarps, as well as the difference in displacement between them, for the Long Point, Clodine, Hockley, and Woodgate faults in Figure 10. We also labeled the maximum downward displacement of the two blocks for each of these four faults in Figure 7.
The Long Point Fault was historically very active but now shows an insignificant movement of −0.31 cm on the downthrown block and 0.30 cm on the upthrown block (Figure 10A). Clodine Fault shows a maximum movement of −1.12 cm on the downthrown side and −0.94 cm on the upthrown side; a maximum displacement difference of up to 0.53 cm between the two sides is also demonstrated (Figure 10B). Similarly, the Hockley Fault shows a maximum downward motion of −0.93 cm on the downthrown block and −0.34 cm on the upthrown block, with a maximum relative difference of 0.87 cm (Figure 10C). The Woodgate fault, which is in close proximity to George Bush Intercontinental/Houston Airport, manifests a maximum movement of −1.42 cm on the downthrown side and −0.72 cm on the upthrown side, with a maximum difference of 1.05 cm (Figure 10D). This analysis suggests that, as the subsidence decreased in areas surrounding the Long Point Fault, motion along this fault also ceased. However, relative motion along the Clodine, Hockley, and Woodgate faults continues. In addition, some sections of the Hockley Fault show subsidence only along the southeast side of the fault trace, suggesting the fault may be driving the subsidence (Figure 2b).
6. Conclusions
Cities in the Gulf Coast of the US experienced substantial subsidence. Groundwater and oil/gas pumping are considered the main drivers. However, many other geologic factors, such as faults and flooding, may play a contributing role. The Houston area consists of geologic and anthropogenic elements that can contribute to the subsidence. InSAR data from 2016 to 2020 show that the Houston area is experiencing subsidence of up to 2 cm/yr in the west, northwest, and north of downtown, due to excessive groundwater withdrawal. In addition, oil/gas pumping in and around Mont Belvieu and possibly in the southeast may be causing subsidence. The Long Point Fault has been determined to be inactive. At the same time, faults located in subsiding areas in the northwest and north are still active. This implies that subsidence may be causing fault movement in this area. If current ground pumping trends continue, faults in Katy and The Woodlands will likely become reactivated and/or increase in activity over time. In addition, subsidence from prolonged flooding and storms in this area, such as those caused by Hurricane Harvey, pose a risk of sediment compaction and flood-induced subsidence. Such events are likely to become more common as global climate patterns change.
Author Contributions
S.D.K. (conceptualization, methodology, formal analysis, writing, review, and editing); O.C.A.G. (methodology, hot spot analysis, first version of figures, and proofreading); A.T.A. (processing InSAR data by G-TEP); O.A.T. (figure and text editing). All authors have read and agreed to the published version of the manuscript.
Funding
This research received no external funding.
Acknowledgments
ESA’s Geohazards Thematic Exploitation Platform (G-TEP) is acknowledged for processing InSAR data.
Conflicts of Interest
The authors declare no conflict of interest.
References
- Galloway, D.L.; Jones, D.R. Houston-Galveston, Texas—Managing coastal subsidence. In Land Subsidence in the United States; Galloway, D.L., Jones, D.R., Ingebritsen, S.E., Eds.; United States Geological Survey: Reston, VA, USA, 1999; pp. 35–48. [Google Scholar]
- Kasmarek, M.C.; Gabrysch, R.K.; Johnson, M.R. Estimated Land Surface Subsidence in Harris County, Texas, 1915–17 to 2001; Scientific Investigations Map 3097; United States Geological Survey: Reston, VA, USA, 2009. [CrossRef]
- Paine, J.G. Subsidence of the Texas coast: Inferences from historical and late Pleistocene sea levels. Tectonophysics 1993, 222, 445–458. [Google Scholar] [CrossRef]
- Engelkemeir, R.M.; Khan, S.D. Lidar mapping of faults in Houston, Texas, USA. Geosphere 2008, 4, 170. [Google Scholar] [CrossRef] [Green Version]
- Wang, G.; Zhou, X.; Wang, K.; Ke, X.; Zhang, Y.; Zhao, R.; Bao, Y. GOM20: A Stable Geodetic Reference Frame for Subsidence, Faulting, and Sea-Level Rise Studies along the Coast of the Gulf of Mexico. Remote Sens. 2020, 12, 350. [Google Scholar] [CrossRef] [Green Version]
- Kasmarek, M.C.; Johnson, M.R.; Ramage, J.K. Scientific Investigations Map 3138. In Water-Level Altitudes 2010 and Water-Level Changes in the Chicot, Evangeline, and Jasper Aquifers and Compaction 1973–2009 in the Chicot and Evangeline Aquifers, Houston-Galveston region, Texas; United States Geological Survey: Reston, VA, USA, 2010. [Google Scholar] [CrossRef]
- Kasmarek, M.C.; Johnson, M.R.; Ramage, J.K. Scientific Investigations Map 3263. In Water-Level Altitudes 2013 and Water-Level Changes in the Chicot, Evangeline, and Jasper Aquifers and Compaction 1973–2012 in the Chicot and Evangeline Aquifers, Houston-Galveston Region, Texas; United States Geological Survey: Reston, VA, USA, 2013. [Google Scholar] [CrossRef]
- Bawden, G.W.; Johnson, M.R.; Kasmarek, M.C.; Brandt, J.T.; Middleton, C.S. Scientific Investigations Report 2012–5211. In Investigation of Land Subsidence in the Houston-Galveston Region of Texas by using the Global Positioning System and Interferometric Synthetic Aperture Radar, 1993–2000; United States Geological Survey: Reston, VA, USA, 2012. [Google Scholar] [CrossRef]
- Khan, S.D.; Huang, Z.; Karacay, A. Study of ground subsidence in northwest Harris county using GPS, LiDAR, and InSAR techniques. Nat. Hazards 2014, 73, 1143–1173. [Google Scholar] [CrossRef]
- Stork, S.V.; Sneed, M. Fact Sheet 110–02. In Houston-Galveston Bay Area, Texas, from Space; a New Tool for Mapping Land Subsidence; United States Geological Survey: Reston, VA, USA, 2002. [Google Scholar] [CrossRef]
- Buckley, S.M.; Rosen, P.A.; Hensley, S.; Tapley, B. Land subsidence in Houston, Texas, measured by radar interferometry and constrained by extensometers. J. Geophys. Res. Earth Surf. 2003, 108, 2542. [Google Scholar] [CrossRef]
- Casu, F.; Buckley, S.; Manzo, M.; Pepe, A.; Lanari, R. Large scale InSAR deformation time series: Phoenix and Houston case studies. In Proceedings of the 2005 IEEE International Geoscience and Remote Sensing Symposium, Seoul, Korea, 29 July 2005; Volume 7, pp. 5240–5243. [Google Scholar] [CrossRef]
- Qu, F.; Lu, Z.; Zhang, Q.; Bawden, G.W.; Kim, J.-W.; Zhao, C.; Qu, W. Mapping ground deformation over Houston–Galveston, Texas using multi-temporal InSAR. Remote Sens. Environ. 2015, 169, 290–306. [Google Scholar] [CrossRef]
- Qu, F.; Lu, Z.; Kim, J.-W.; Zheng, W. Identify and Monitor Growth Faulting Using InSAR over Northern Greater Houston, Texas, USA. Remote Sens. 2019, 11, 1498. [Google Scholar] [CrossRef] [Green Version]
- Miller, M.M.; Shirzaei, M. Land subsidence in Houston correlated with flooding from Hurricane Harvey. Remote Sens. Environ. 2019, 225, 368–378. [Google Scholar] [CrossRef]
- Salvador, A. (Ed.) Triassic-Jurassic. In The Gulf of Mexico. The Decade of North American Geology, Vol. J; Geological Society of America: Boulder, CO, USA, 1991; pp. 131–180. [Google Scholar] [CrossRef]
- Bird, D.E.; Burke, K.; Hall, S.A.; Casey, J.F. Gulf of Mexico tectonic history: Hotspot tracks, crustal boundaries, and early salt distribution. AAPG Bull. 2005, 89, 311–328. [Google Scholar] [CrossRef]
- Kupfer, D.H. Environment and intrusion of Gulf Coast salt and its probable relationship to plate tectonics. In Fourth Symposium on Salt; Coogan, A.H., Ed.; Northern Ohio Geological Society: Cleveland, OH, USA, 1974; Volume 1, pp. 197–213. [Google Scholar]
- Winker, C.D. Cenozoic Shelf Margins, Northwestern Gulf of Mexico. In Gulf Coast Association of Geological Societies Transactions; United States Geological Survey: Houston, TX, USA, 1982; Volume 32, pp. 427–448. Available online: https://archives.datapages.com/data/gcags/data/032/032001/0427.htm (accessed on 30 July 2022).
- Mastroianni, J.J. A Study of Active Fault Movement: Houston, Texas and Vicinity. Master’s Thesis, Department of Earth and Atmospheric Sciences, University of Houston, Houston, TX, USA, 1991. [Google Scholar]
- Engelkemeir, R.; Khan, S.D.; Burke, K. Surface deformation in Houston, Texas using GPS. Tectonophysics 2010, 490, 47–54. [Google Scholar] [CrossRef]
- Cigna, F.; Tapete, D. Satellite InSAR survey of structurally-controlled land subsidence due to groundwater exploitation in the Aguascalientes Valley, Mexico. Remote Sens. Environ. 2020, 254, 112254. [Google Scholar] [CrossRef]
- Cigna, F.; Tapete, D. Urban growth and land subsidence: Multi-decadal investigation using human settlement data and satellite InSAR in Morelia, Mexico. Sci. Total Environ. 2021, 811, 152211. [Google Scholar] [CrossRef] [PubMed]
- Strozzi, T.; Antonova, S.; Günther, F.; Mätzler, E.; Vieira, G.; Wegmüller, U.; Westermann, S.; Bartsch, A. Sentinel-1 SAR Interferometry for Surface Deformation Monitoring in Low-Land Permafrost Areas. Remote Sens. 2018, 10, 1360. [Google Scholar] [CrossRef] [Green Version]
- Torres, R.; Snoeij, P.; Geudtner, D.; Bibby, D.; Davidson, M.; Attema, E.; Potin, P.; Rommen, B.; Floury, N.; Brown, M.; et al. GMES Sentinel-1 mission. Remote Sens. Environ. 2012, 120, 9–24. [Google Scholar] [CrossRef]
- Foumelis, M.; Papadopoulou, T.; Bally, P.; Pacini, F.; Provost, F.; Patruno, J. Monitoring Geohazards Using On-Demand And Systematic Services On Esa’s Geohazards Exploitation Platform. In Proceedings of the IGARSS 2019, Yokohama, Japan, 28 July–2 August 2019; pp. 5457–5460. [Google Scholar] [CrossRef]
- Farr, T.G.; Rosen, P.A.; Caro, E.; Crippen, R.; Duren, R.; Hensley, S.; Kobrick, M.; Paller, M.; Rodriguez, E.; Roth, L.; et al. The Shuttle Radar Topography Mission. Rev. Geophys. 2007, 45, RG2004. [Google Scholar] [CrossRef] [Green Version]
- Manunta, M.; de Luca, C.; Zinno, I.; Casu, F.; Manzo, M.; Bonano, M.; Fusco, A.; Pepe, A.; Onorato, G.; Berardino, P.; et al. The Parallel SBAS Approach for Sentinel-1 Interferometric Wide Swath Deformation Time-Series Generation: Algorithm Description and Products Quality Assessment. IEEE Trans. Geosci. Remote Sens. 2019, 57, 6259–6281. [Google Scholar] [CrossRef]
- Cigna, F.; Tapete, D. Monitoring Natural and Anthropogenic Geohazards with SAR Big Data: Successful Experiences Using the Geohazards Exploitation Platform. In Proceedings of the IGARSS 2021, Brussels, Belgium, 12–16 July 2021; pp. 1804–1807. [Google Scholar] [CrossRef]
- Kearns, T.J.; Wang, G.; Turco, M.; Welch, J.; Tsibanos, V.; Liu, H. Houston16: A stable geodetic reference frame for subsidence and faulting study in the Houston metropolitan area, Texas, U.S. Geodesy Geodyn. 2018, 10, 382–393. [Google Scholar] [CrossRef]
- StratMap (Texas Strategic Mapping Program). Upper Coast Lidar 2018. 22 March 2018. Available online: https://library.ctr.utexas.edu/Presto/content/Detail.aspx?ctID=UHVibGljYXRpb25fMTE2MTA%3D&rID=MzM3MjA%3D&ssid=c2NyZWVuSURfMjEzMjI%3D&bmdc=MQ== (accessed on 30 July 2022).
- Getis, A.; Ord, J.K. The Analysis of Spatial Association by Use of Distance Statistics. Geogr. Anal. 2010, 24, 189–206. [Google Scholar] [CrossRef]
- Mann, H.B. Nonparametric tests against trend. Econometrica 1945, 13, 245–259. [Google Scholar] [CrossRef]
- Kendall, M.G.; Gibbons, J.D. Rank Correlation Methods, 5th ed.; Edward Arnold Publishers Limited: London, UK, 1990. [Google Scholar]
- ESRI. How Emerging Hot Spot Analysis Works. 13 May 2021. Available online: https://pro.arcgis.com/en/pro-app/2.8/tool-reference/space-time-pattern-mining/learnmoreemerging.htm (accessed on 30 July 2022).
- Harris Galveston Subsidence District. Home—Harris Galveston Subsidence District. 1 June 2022. Available online: https://hgsubsidence.org/ (accessed on 30 July 2022).
- Chowdhury, A.H.; Scanlon, B.R.; Reedy, R.C.; Young, S. Fingerprinting groundwater salinity sources in the Gulf Coast Aquifer System, USA. Appl. Hydrogeol. 2017, 26, 197–213. [Google Scholar] [CrossRef]
- Gabrysch, R.; Coplin, L. Report of Investigations 90–01. In Land-Surface Subsidence Resulting from Ground-Water Withdrawals in the Houston-Galveston Region, Texas, through 1987; United States Geological Survey: Reston, VA, USA, 1990. [Google Scholar] [CrossRef]
- Winslow, A.G.; Doyel, W.W. Land-surface subsidence and its relation to the withdrawal of ground water in the Houston-Galveston region, Texas. Econ. Geol. 1954, 49, 413–422. [Google Scholar] [CrossRef]
- Gabrysch, R.K.; Naftel, W.L.; McAdoo, G.D.; Bonnet, C.W. Ground-Water Data for Harris County, TEXAS: Volume II—Records of Wells, 1892–1972; Report 178; Texas Water Development Board: Austin, TX, USA, 1974. Available online: https://www.twdb.texas.gov/publications/reports/numbered_reports/doc/R178/report178.asp (accessed on 30 July 2022).
- Johnson, M.R.; Ramage, J.K.; Kasmarek, M.C. Scientific Investigations Map 3174. In Water-Level Altitudes 2011 and Water-Level Changes in the Chicot, Evangeline, and Jasper Aquifers and Compaction 1973–2010 in the Chicot and Evangeline Aquifers, Houston-Galveston Region, Texas; United States Geological Survey: Reston, VA, USA, 2011. [Google Scholar] [CrossRef]
- Siefer, W.J., Jr.; Drabek, C. History of production and potential future production of the Gulf Coast Aquifer. In Aquifers of the Gulf Coast of Texas; Report 365; Mace, R.E., Davidson, S.C., Angle, E.S., Mullican, W.F., III, Eds.; Texas Water Development Board: Austin, TX, USA, 2006; pp. 261–271. Available online: https://www.twdb.texas.gov/publications/reports/numbered_reports/doc/R365/Report365.asp (accessed on 30 July 2022).
- Olien, R.M. Oil and gas industry. In Handbook of Texas; Texas State Historical Association: Austin, TX, USA, 1995; Available online: https://www.tshaonline.org/handbook/entries/oil-and-gas-industry (accessed on 30 July 2022).
- Pratt, W.E.; Johnson, D.W. Local Subsidence of the Goose Creek Oil Field. J. Geol. 1926, 34, 577–590. [Google Scholar] [CrossRef]
- Holzer, T.L. (Ed.) Ground failure induced by ground-water withdrawal from unconsolidated sediment. In Man-Induced Land Subsidence; Geological Society of America: Boulder, CO, USA, 1984; Volume 6, pp. 67–105. [Google Scholar] [CrossRef]
- Gagliano, S.M. Effects of earthquakes, fault movements, and subsidence on the south Louisiana landscape. In The Louisiana Civil Engineer; Louisiana Section of the American Society of Civil Engineers: Baton Rouge, LA, USA, 2005; Volume 13, pp. 5–7, 19–22. Available online: http://www.lasce.org/documents/journal/2005-02.pdf (accessed on 30 July 2022).
- Cox, S. The application of failure mode diagrams for exploring the roles of fluid pressure and stress states in controlling styles of fracture-controlled permeability enhancement in faults and shear zones. Geofluids 2010, 10, 217–233. [Google Scholar] [CrossRef]
- Ingebritsen, S.E.; Manning, C. Permeability of the continental crust: Dynamic variations inferred from seismicity and metamorphism. Geofluids 2010, 10, 193–205. [Google Scholar] [CrossRef]
- Shelly, D.R.; Taira, T.; Prejean, S.G.; Hill, D.P.; Dreger, D.S. Fluid-faulting interactions: Fracture-mesh and fault-valve behavior in the February 2014 Mammoth Mountain, California, earthquake swarm. Geophys. Res. Lett. 2015, 42, 5803–5812. [Google Scholar] [CrossRef]
- Ferronato, M.; Gambolati, G.; Janna, C.; Teatini, P. Numerical modelling of regional faults in land subsidence prediction above gas/oil reservoirs. Int. J. Numer. Anal. Methods Geomech. 2007, 32, 633–657. [Google Scholar] [CrossRef]
- Chan, A.W.; Zoback, M.D. The Role of Hydrocarbon Production on Land Subsidence and Fault Reactivation in the Louisiana Coastal Zone. J. Coast. Res. 2007, 233, 771–786. [Google Scholar] [CrossRef]
- Morton, R.A.; Tiling, G.; Ferina, N.F. Primary Causes of Wetland Loss at Madison Bay, Terrebonne Parish, Louisiana; Open File Report 03–60; United States Geological Survey: St. Petersburg, FL, USA, 2003. [CrossRef]
- Morton, R.A.; Buster, N.A.; Krohn, M.D. Subsurface controls on historical subsidence rates and associated wetland loss in Southcentral Louisiana. In Gulf Coast Association of Geological Societies Transactions; United States Geological Survey: St. Petersburg, FL, USA, 2002; Volume 52, pp. 767–778. Available online: https://biotech.law.lsu.edu/climate/ (accessed on 30 July 2022).
- White, W.A.; Morton, R.A. Wetland losses related to fault movement and hydrocarbon production, south-eastern Texas coast. J. Coast Res. 1997, 13, 1305–1320. Available online: https://www.jstor.org/stable/4298740 (accessed on 30 July 2022).
- Colazas, X.C.; Strehle, R.W. Chapter 6 Subsidence in the Wilmington Oil Field, Long Beach, California, USA. In Subsidence Due to Fluid Withdrawal; Developments in Petroleum Science; Chilingarian, G.V., Donaldson, E.C., Yen, T.F., Eds.; Elsevier Science: Amsterdam, The Netherlands, 1995; Volume 41, pp. 285–335. [Google Scholar] [CrossRef]
- Holzer, T.L.; Gabrysch, R.K. Effect of Water-Level Recoveries on Fault Creep, Houston, Texas. Ground Water 1987, 25, 392–397. [Google Scholar] [CrossRef]
- Donnelly, L. A review of coal mining induced fault reactivation in Great Britain. Q. J. Eng. Geol. Hydrogeol. 2006, 39, 5–50. [Google Scholar] [CrossRef]
- Segall, P. Earthquake and Volcano Deformation; Princeton University Press: Princeton, NJ, USA, 2010. [Google Scholar]
- Kreitler, C.W. Fault Control of Subsidence, Houston, Texasa. Ground Water 1977, 15, 203–214. [Google Scholar] [CrossRef]
- Penland, S.; Ramsey, K.E. Relative sea-level rise in Louisiana and the Gulf of Mexico: 1908–1988. J. Coast Res. 1990, 6, 323–342. [Google Scholar]
- Roberts, H.H.; Bailey, A.; Kuecher, G.J. Subsidence in the Mississippi River delta—Important influences of valley filling by cyclic deposition, primary consolidation phenomena, and early diagenesis. In Gulf Coast Association of Geological Societies Transactions; United States Geological Survey: Houston, TX, USA, 1995; Volume 44, pp. 619–629. Available online: https://www.jstor.org/stable/4297682 (accessed on 30 July 2022).
- Kooi, H.; de Vries, J.J. Land subsidence and hydrodynamic compaction of sedimentary basins. Hydrol. Earth Syst. Sci. 1998, 2, 159–171. [Google Scholar] [CrossRef] [Green Version]
- Meckel, T.A.; ten Brink, U.S.; Williams, S.J. Current subsidence rates due to compaction of Holocene sediments in southern Louisiana. Geophys. Res. Lett. 2006, 33, L11403. [Google Scholar] [CrossRef]
- Seni, M.P.A.J.S.J. Evolution of Salt Structures, East Texas Diapir Province, Part 1: Sedimentary Record of Halokinesis. AAPG Bull. 1983, 67, 1219–1244. [Google Scholar] [CrossRef]
- Van Oldenborgh, G.J.; van der Wiel, K.; Sebastian, A.; Singh, R.; Arrighi, J.; Otto, F.; Haustein, K.; Li, S.; Vecchi, G.; Cullen, H. Attribution of extreme rainfall from Hurricane Harvey, August 2017. Environ. Res. Lett. 2017, 12, 124009. [Google Scholar] [CrossRef]
- Crupa, W. Surface Deformation Analysis of the Houston Area: Investigating Contributions of Faults, Salt Domes, and Major Storms. Master’s Thesis, Department of Earth and Atmospheric Sciences, University of Houston, Houston, TX, USA, 2019. Available online: https://uh-ir.tdl.org/bitstream/handle/10657/5301/CRUPA-THESIS-2019.pdf?sequence=1 (accessed on 30 July 2022).
- LSGCD (Lone Star Groundwater Conservation District). Groundwater Management Plan—Re-adopted 14 April 2020. 8 June 2022. Available online: https://www.lonestargcd.org/district-rules-1 (accessed on 30 July 2022).
- Verbeek, E.R. Surface faults in the gulf coastal plain between Victoria and Beaumont, Texas. Tectonophysics 1979, 52, 373–375. [Google Scholar] [CrossRef]
- Norman, C.E.; Elsbury, W.R. Active faults in North Harris County and South Central Montgomery County, Texas. In Environmental and Engineering Geology of North Harris and South Montgomery Counties, Texas; Guidebook 91-1, Field Trip of October 19; Houston Geological Society: Houston, TX, USA, 1991; pp. 13–27. Available online: http://www.ela-iet.com/NormanElsburyHGSGuidebook91_1_pp13_26.pdf (accessed on 30 July 2022).
- Shah, S.D.; Lanning-Rush, J. Principal faults in the Houston, Texas, metropolitan area. In Estimated Land Surface Subsidence in Harris County, Texas, 1915–17 to 2001; Scientific Investigations Map 2874; United States Geological Survey: Reston, VA, USA, 2005. [Google Scholar] [CrossRef]
- Saribudak, M. Geophysical Mapping of Hockley Growth Fault in NW Houston, Texas: A Few Surprising Results. In Symposium on the Application of Geophysics to Engineering and Environmental Problems Proceedings; Environmental and Engineering Geophysical Society: Denver, CO, USA; pp. 852–864. [CrossRef]
- Saribudak, M. Geophysical mapping of the Hockley growth fault in northwest Houston, USA, and recent surface observations. Lead. Edge 2011, 30, 172. [Google Scholar] [CrossRef]
- Saribudak, M. 2D resistivity imaging investigation of Long Point, Katy-Hockley, Tomball, and Pearland faults, Houston, Texas. In Gulf Coast Association of Geological Societies Transactions; United States Geological Survey: Houston, TX, USA, 2012; Volume 62, pp. 399–410. Available online: https://archives.datapages.com/data/gcags/data/062/062001/399_gcags620399.htm (accessed on 30 July 2022).
- Saribudak, M.; van Nieuwenhuise, B. Integrated geophysical studies over an active growth fault in Houston. Geophysics 2006, 25, 332–334. [Google Scholar] [CrossRef]
- Khan, S.D.; Stewart, R.R.; Otoum, M.; Chang, L. A geophysical investigation of the active Hockley Fault System near Houston, Texas. Geophysics 2013, 78, B177–B185. [Google Scholar] [CrossRef]
- Saribudak, M.; Ruder, M.; van Nieuwenhuise, B. Hockley Fault revisited: More geophysical data and new evidence on the fault location, Houston, Texas. Geophysics 2018, 83, B133–B142. [Google Scholar] [CrossRef]
- Minteer, D. A Geophysical Delineation of a Normal Fault Within the Gulf Coastal Plain, Montgomery County, Texas. Master’s Thesis, Department of Geology, Stephen, F. Austin State University, Nacogdoches, TX, USA, 2018. Available online: https://scholarworks.sfasu.edu/etds/153/ (accessed on 30 July 2022).
- Burbey, T. The influence of faults in basin-fill deposits on land subsidence, Las Vegas Valley, Nevada, USA. Appl. Hydrogeol. 2002, 10, 525–538. [Google Scholar] [CrossRef]
- Liu, Y.; Sun, X.; Wang, G.; Turco, M.J.; Agudelo, G.; Bao, Y.; Zhao, R.; Shen, S. Current Activity of the Long Point Fault in Houston, Texas Constrained by Continuous GPS Measurements (2013–2018). Remote Sens. 2019, 11, 1213. [Google Scholar] [CrossRef] [Green Version]
Figure 1.
Map of study area showing InSAR coverage area, locations of 71,170 water wells, and 5948 oil/gas wells that were used for optimized hot spot analysis.
Figure 1.
Map of study area showing InSAR coverage area, locations of 71,170 water wells, and 5948 oil/gas wells that were used for optimized hot spot analysis.

Figure 2.
(a) Total ground displacement from March 2016 to December 2020 measured by SBAS, InSAR data for Houston and surrounding areas. View of the entire InSAR footprint. (b) Zoomed-in view showing downtown Houston and encompassing suburbs and towns.
Figure 2.
(a) Total ground displacement from March 2016 to December 2020 measured by SBAS, InSAR data for Houston and surrounding areas. View of the entire InSAR footprint. (b) Zoomed-in view showing downtown Houston and encompassing suburbs and towns.


Figure 3.
(a) Average ground velocity per year from March 2016 to December 2020 measured by SBAS, InSAR data for Houston and surrounding areas. View of the entire InSAR footprint. (b) Zoomed-in view showing downtown Houston and encompassing suburbs and towns. Red triangles indicate the locations of GNSS stations.


Figure 4.
Emerging hot spot results for subsidence in Houston and surrounding areas. A neighborhood distance of 10 km was used and only the eight hot spot (high value trend) categories were shown.
Figure 4.
Emerging hot spot results for subsidence in Houston and surrounding areas. A neighborhood distance of 10 km was used and only the eight hot spot (high value trend) categories were shown.

Figure 5.
Emerging hot spot results for the groundwater level change in Houston and surrounding areas. A neighborhood distance of 3 km was used and only the eight hot spot (high value trend) categories were shown.
Figure 5.
Emerging hot spot results for the groundwater level change in Houston and surrounding areas. A neighborhood distance of 3 km was used and only the eight hot spot (high value trend) categories were shown.

Figure 6.
Optimized hot spot results for the oil/gas well count in Houston and surrounding areas. A neighborhood distance of 2000 m was used.
Figure 6.
Optimized hot spot results for the oil/gas well count in Houston and surrounding areas. A neighborhood distance of 2000 m was used.

Figure 7.
Updated fault map of Houston and surrounding areas. Three major fault systems run southwest to northeast; in the southeast, faults are associated with the salt domes. The background hillshade image was generated from lidar data.
Figure 7.
Updated fault map of Houston and surrounding areas. Three major fault systems run southwest to northeast; in the southeast, faults are associated with the salt domes. The background hillshade image was generated from lidar data.

Figure 8.
LOS displacement time series for areas with high subsidence rates. Data derived from the InSAR analysis from 2016 to 2020.
Figure 8.
LOS displacement time series for areas with high subsidence rates. Data derived from the InSAR analysis from 2016 to 2020.

Figure 9.
Groundwater level change time series for areas with high subsidence rates. Data derived from the groundwater well analysis from 1990 to 2021 for (A) Katy, (B) the Spring–Woodlands area, (C) Channelview, and (D) Mont Belvieu.
Figure 9.
Groundwater level change time series for areas with high subsidence rates. Data derived from the groundwater well analysis from 1990 to 2021 for (A) Katy, (B) the Spring–Woodlands area, (C) Channelview, and (D) Mont Belvieu.

Figure 10.
LOS displacement time series for downthrown and upthrown blocks of four faults. Data derived from the InSAR analysis from 2016 to 2020 for (A) Long Point Fault, (B) Clodine Fault, (C) Hockley Fault, and (D) Woodgate Fault. The sites used for the displacement time series are shown by red dots in Figure 7.

Publisher’s Note: MDPI stays neutral with regard to jurisdictional claims in published maps and institutional affiliations. |
© 2022 by the authors. Licensee MDPI, Basel, Switzerland. This article is an open access article distributed under the terms and conditions of the Creative Commons Attribution (CC BY) license (https://creativecommons.org/licenses/by/4.0/).
Share and Cite
MDPI and ACS Style
Khan, S.D.; Gadea, O.C.A.; Tello Alvarado, A.; Tirmizi, O.A. Surface Deformation Analysis of the Houston Area Using Time Series Interferometry and Emerging Hot Spot Analysis. Remote Sens. 2022, 14, 3831. https://doi.org/10.3390/rs14153831
AMA Style
Khan SD, Gadea OCA, Tello Alvarado A, Tirmizi OA. Surface Deformation Analysis of the Houston Area Using Time Series Interferometry and Emerging Hot Spot Analysis. Remote Sensing. 2022; 14(15):3831. https://doi.org/10.3390/rs14153831
Chicago/Turabian StyleKhan, Shuhab D., Otto C. A. Gadea, Alyssa Tello Alvarado, and Osman A. Tirmizi. 2022. "Surface Deformation Analysis of the Houston Area Using Time Series Interferometry and Emerging Hot Spot Analysis" Remote Sensing 14, no. 15: 3831. https://doi.org/10.3390/rs14153831
Note that from the first issue of 2016, this journal uses article numbers instead of page numbers. See further details here.