
A Near Real-Time and Free Tool for the Preliminary Mapping of Active Lava Flows during Volcanic Crises: The Case of Hotspot Subaerial Eruptions

 , and
, and
Abstract
:
1. Introduction
2. Materials and Methods
2.1. Input Parameters and Workspace
2.2. First Set up in R/RStudio
2.3. Run FRP_Statistical
2.4. Run LavaFlow_Mapper
3. Case Studies
3.1. Wolf Eruptions, Galápagos—Ecuador
3.1.1. Wolf—2015 Eruption
3.1.2. Wolf—2022 Eruption
3.2. Sierra Negra—2018 Eruption, Galápagos—Ecuador

| Eruption (Country) | First Day | Last Day | Duration (Days) | Main Phenomena | Area (km2) | Volume (Million m3) | Reference |
|---|---|---|---|---|---|---|---|
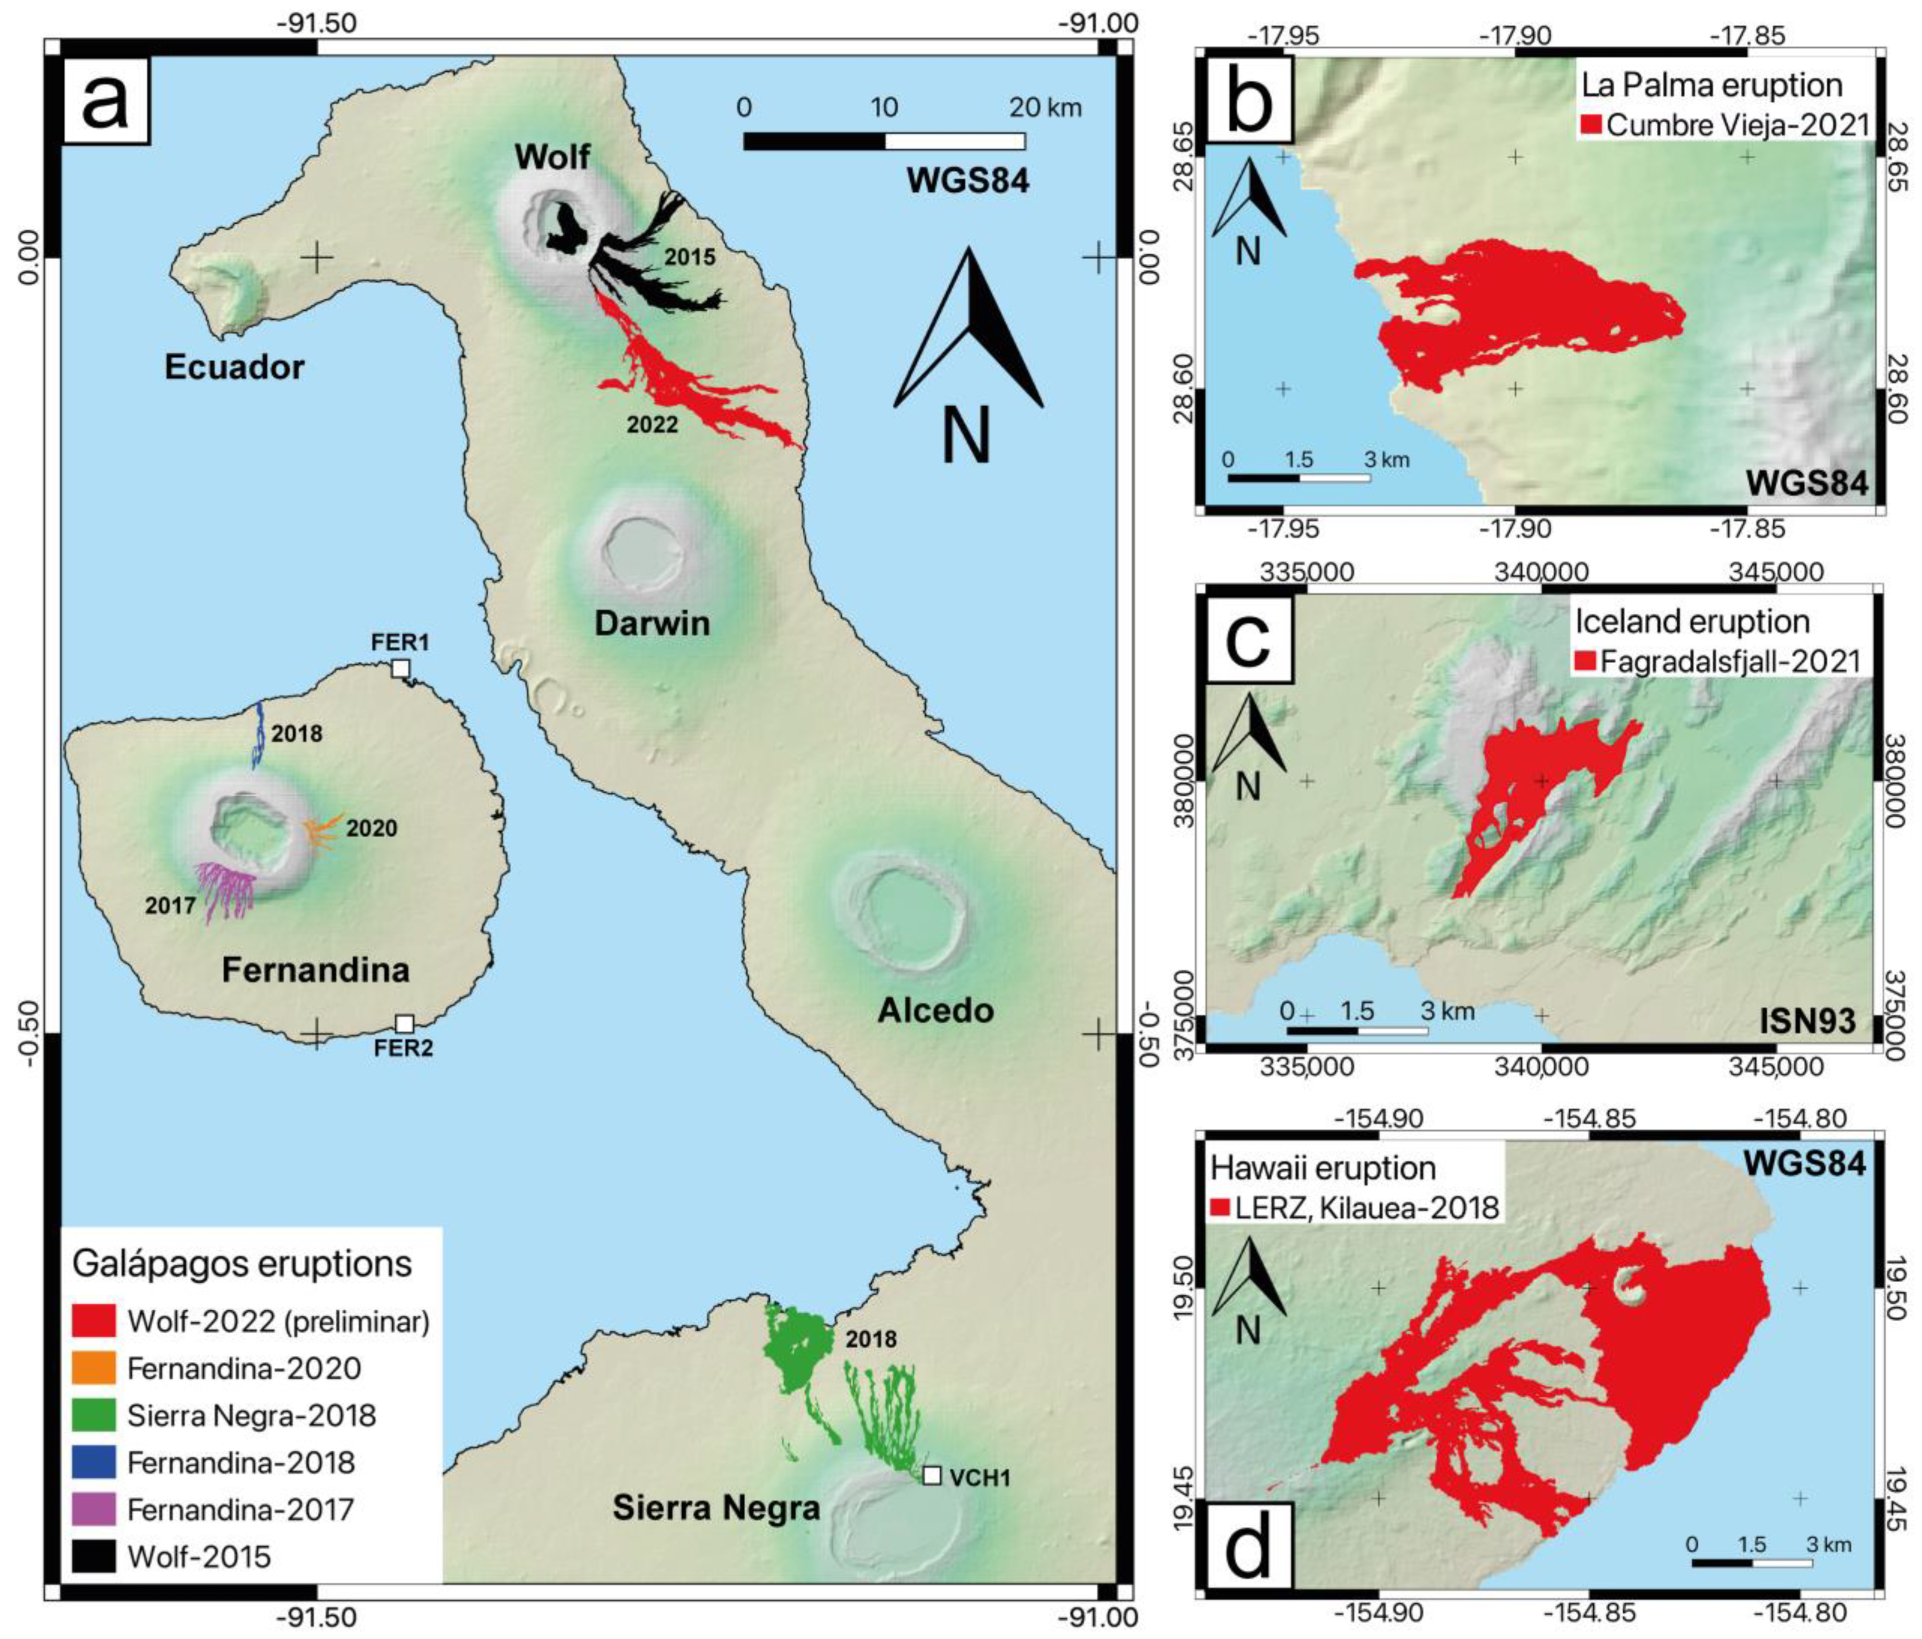
| Wolf-2022 (Ecuador) | 6 January | 20 April 1 | >100 | Lava flows | ~30 | - | This study |
| Wolf-2015 (Ecuador) 2 | 25 May | 30 June | 36 | Lava flows + gas plumes | 24 ± 1.52 | 116 ± 45 | [27] |
| Sierra Negra-2018 (Ecuador) 2 | 26 June | 23 August | 58 | Lava flows | 30.6 | 189 ± 94 | [52] |
| Fernandina-2020 (Ecuador) | 12 January | 13 January | 0.4 | Lava flows | 1.63 | - | This study |
| Fernandina-2018 (Ecuador) 2 | 16 June | 18 June | 2 | Lava flows | 1.58 | 7.9 ± 4 | [52] |
| Fernandina-2017 (Ecuador) | 4 September | 7 September | 2.5 | Lava flows + wildfires | 6.5 | 13 ± 6.5 | [52] |
| Cumbre Vieja-2021 (Spain) 2 | 19 September | 14 December | 85.3 | Lava flows + tephra plumes | 12.4 | >200 | IGN & EMS; [53] |
| Fagradalsfjall-2021 (Iceland) | 19 March | 18 September | 183 | Lava flows | 4.8 | 150 ± 3 | [54,55] |
| LERZ, Kilauea-2018 (USA) 2 | 18 May | 4 August | 78 | Lava flows + gas plumes | >35.6 | 1179 ± 97 | [56,57,58] |
3.3. Fernandina Eruptions, Galápagos—Ecuador
3.3.1. Fernandina—2017 Eruption
3.3.2. Fernandina—2018 Eruption
3.3.3. Fernandina—2020 Eruption
3.4. Cumbre Vieja—2021 Eruption, Canary Islands—Spain
3.5. Fagradalsfjall-2021 Eruption, Iceland
3.6. Lower East Rift Zone (LERZ), Kilauea—2018 Eruption, Hawai’i—USA
4. Results
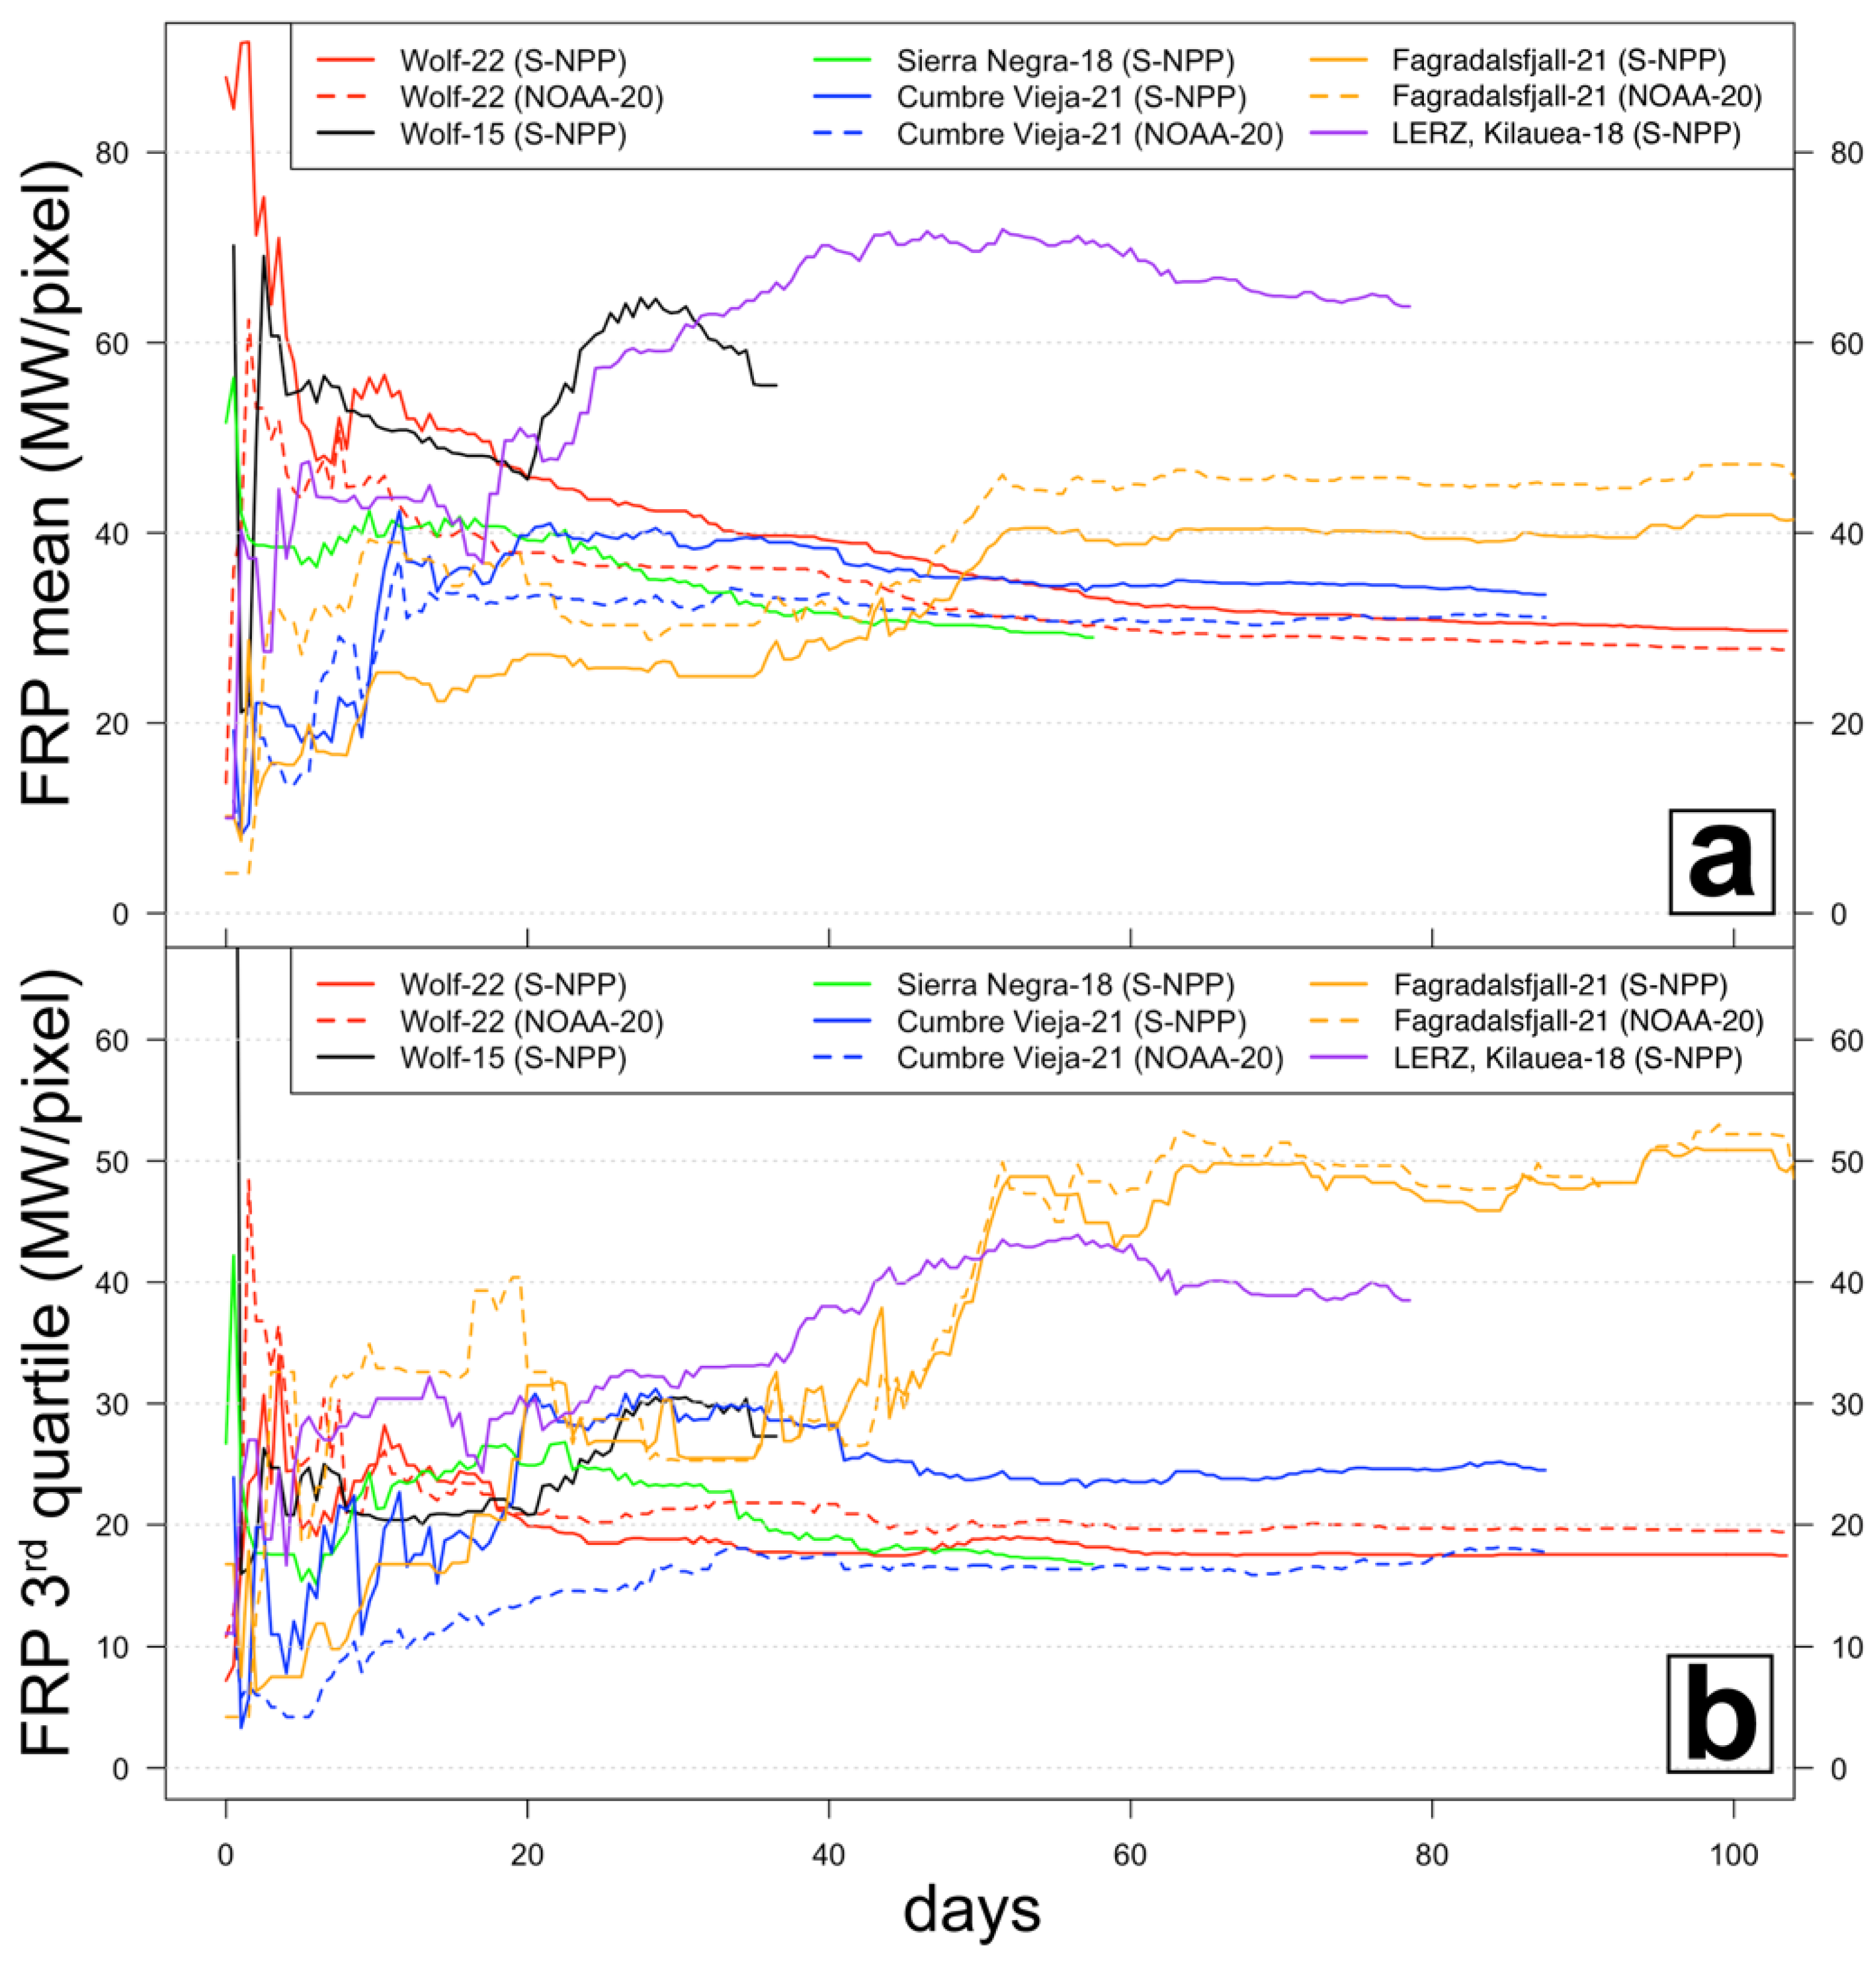
4.1. FRP_Statistical
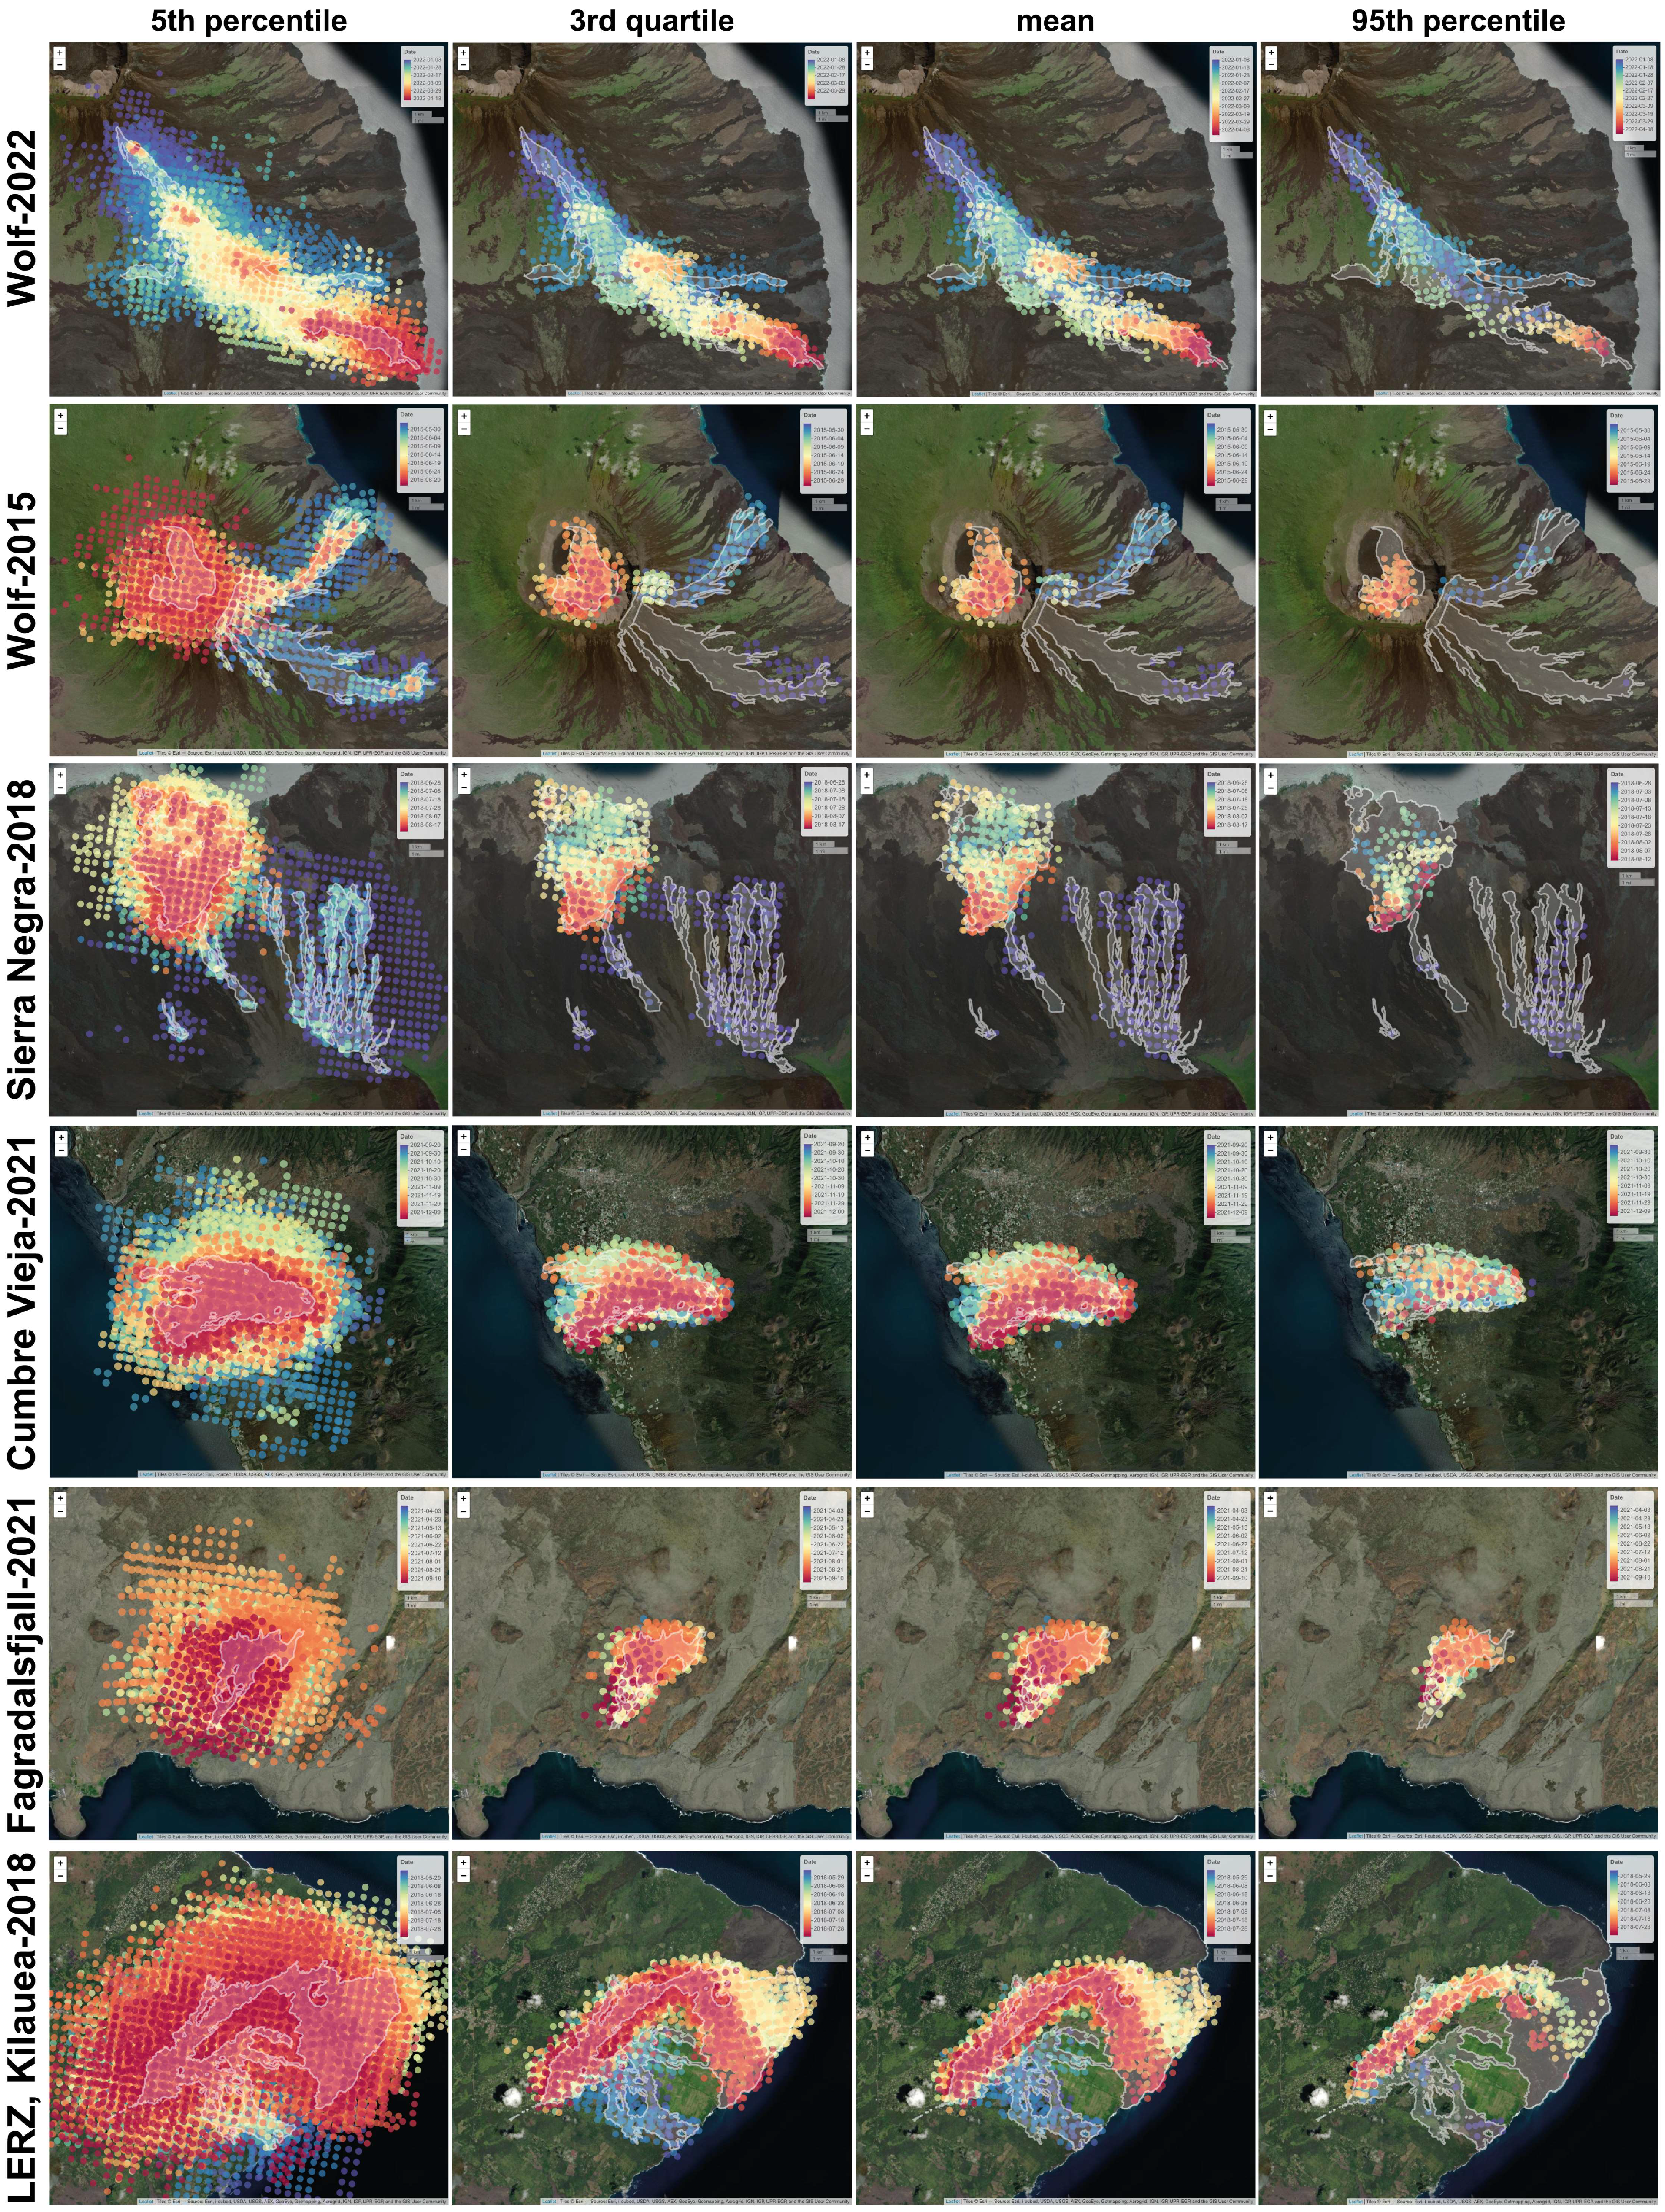
4.2. LavaFlow_Mapper
5. Discussion
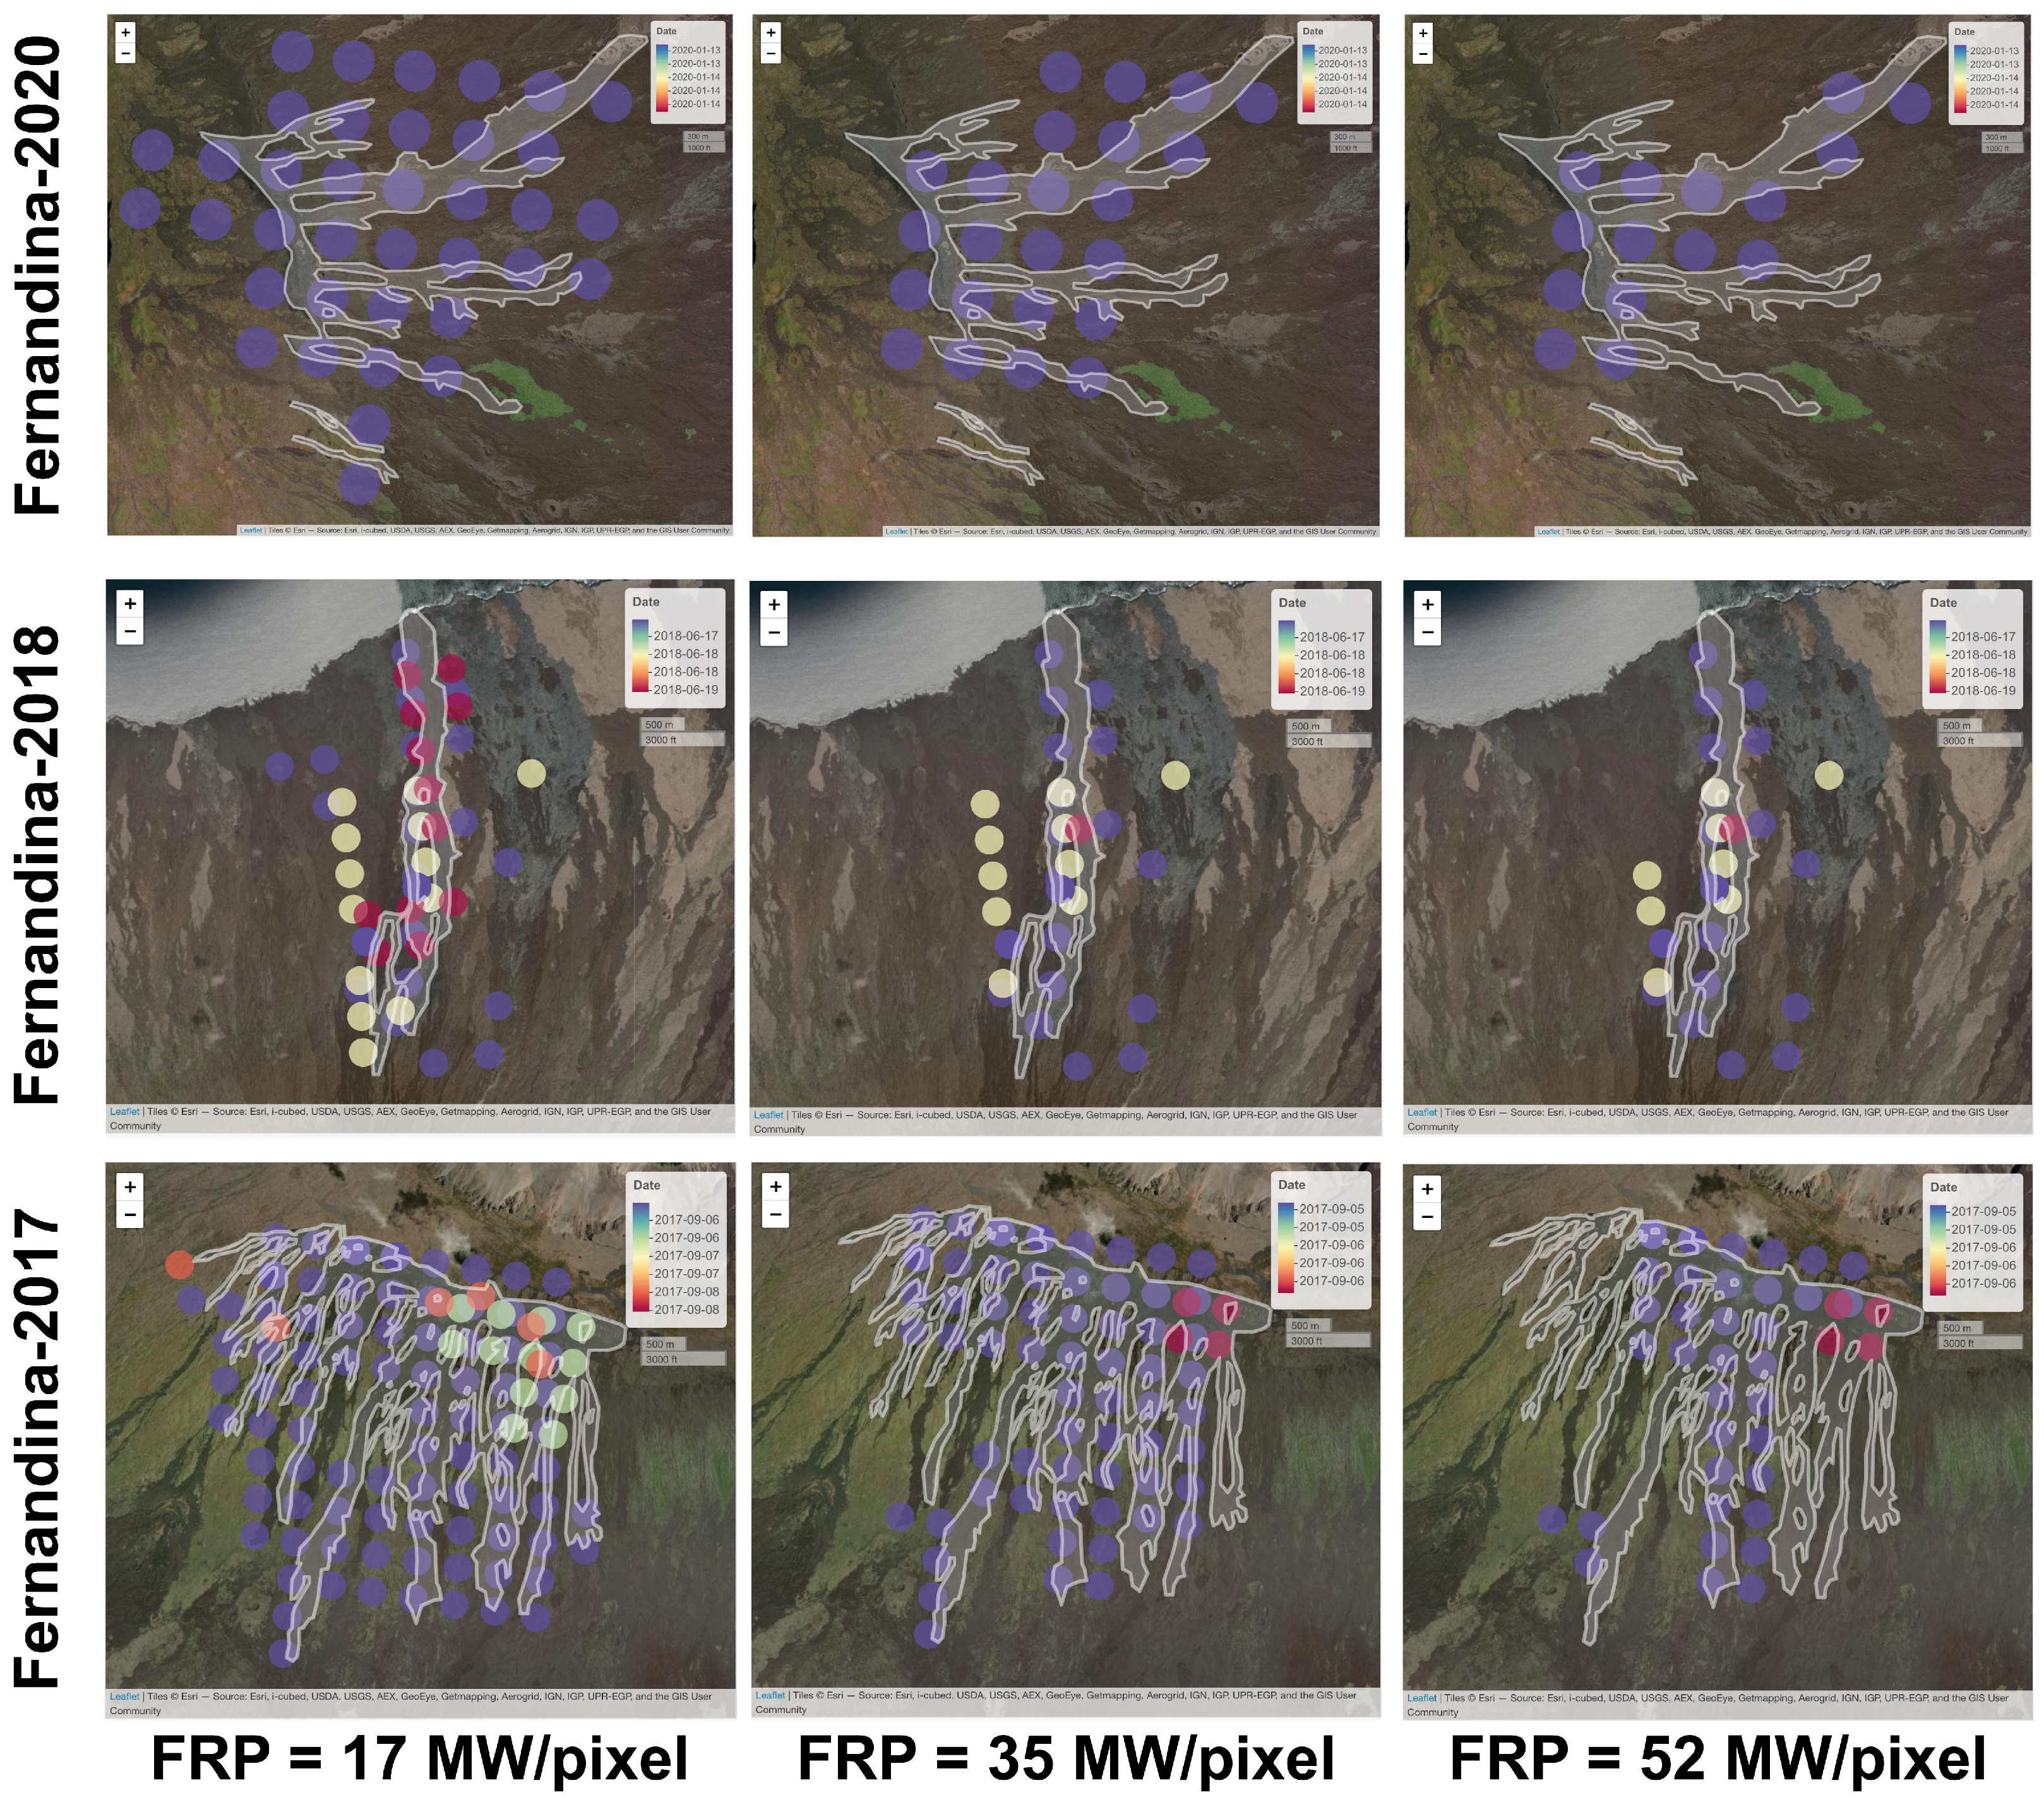
5.1. Short-Lived Eruptions: The Case of Fernandina Eruptions (Galápagos, Ecuador)
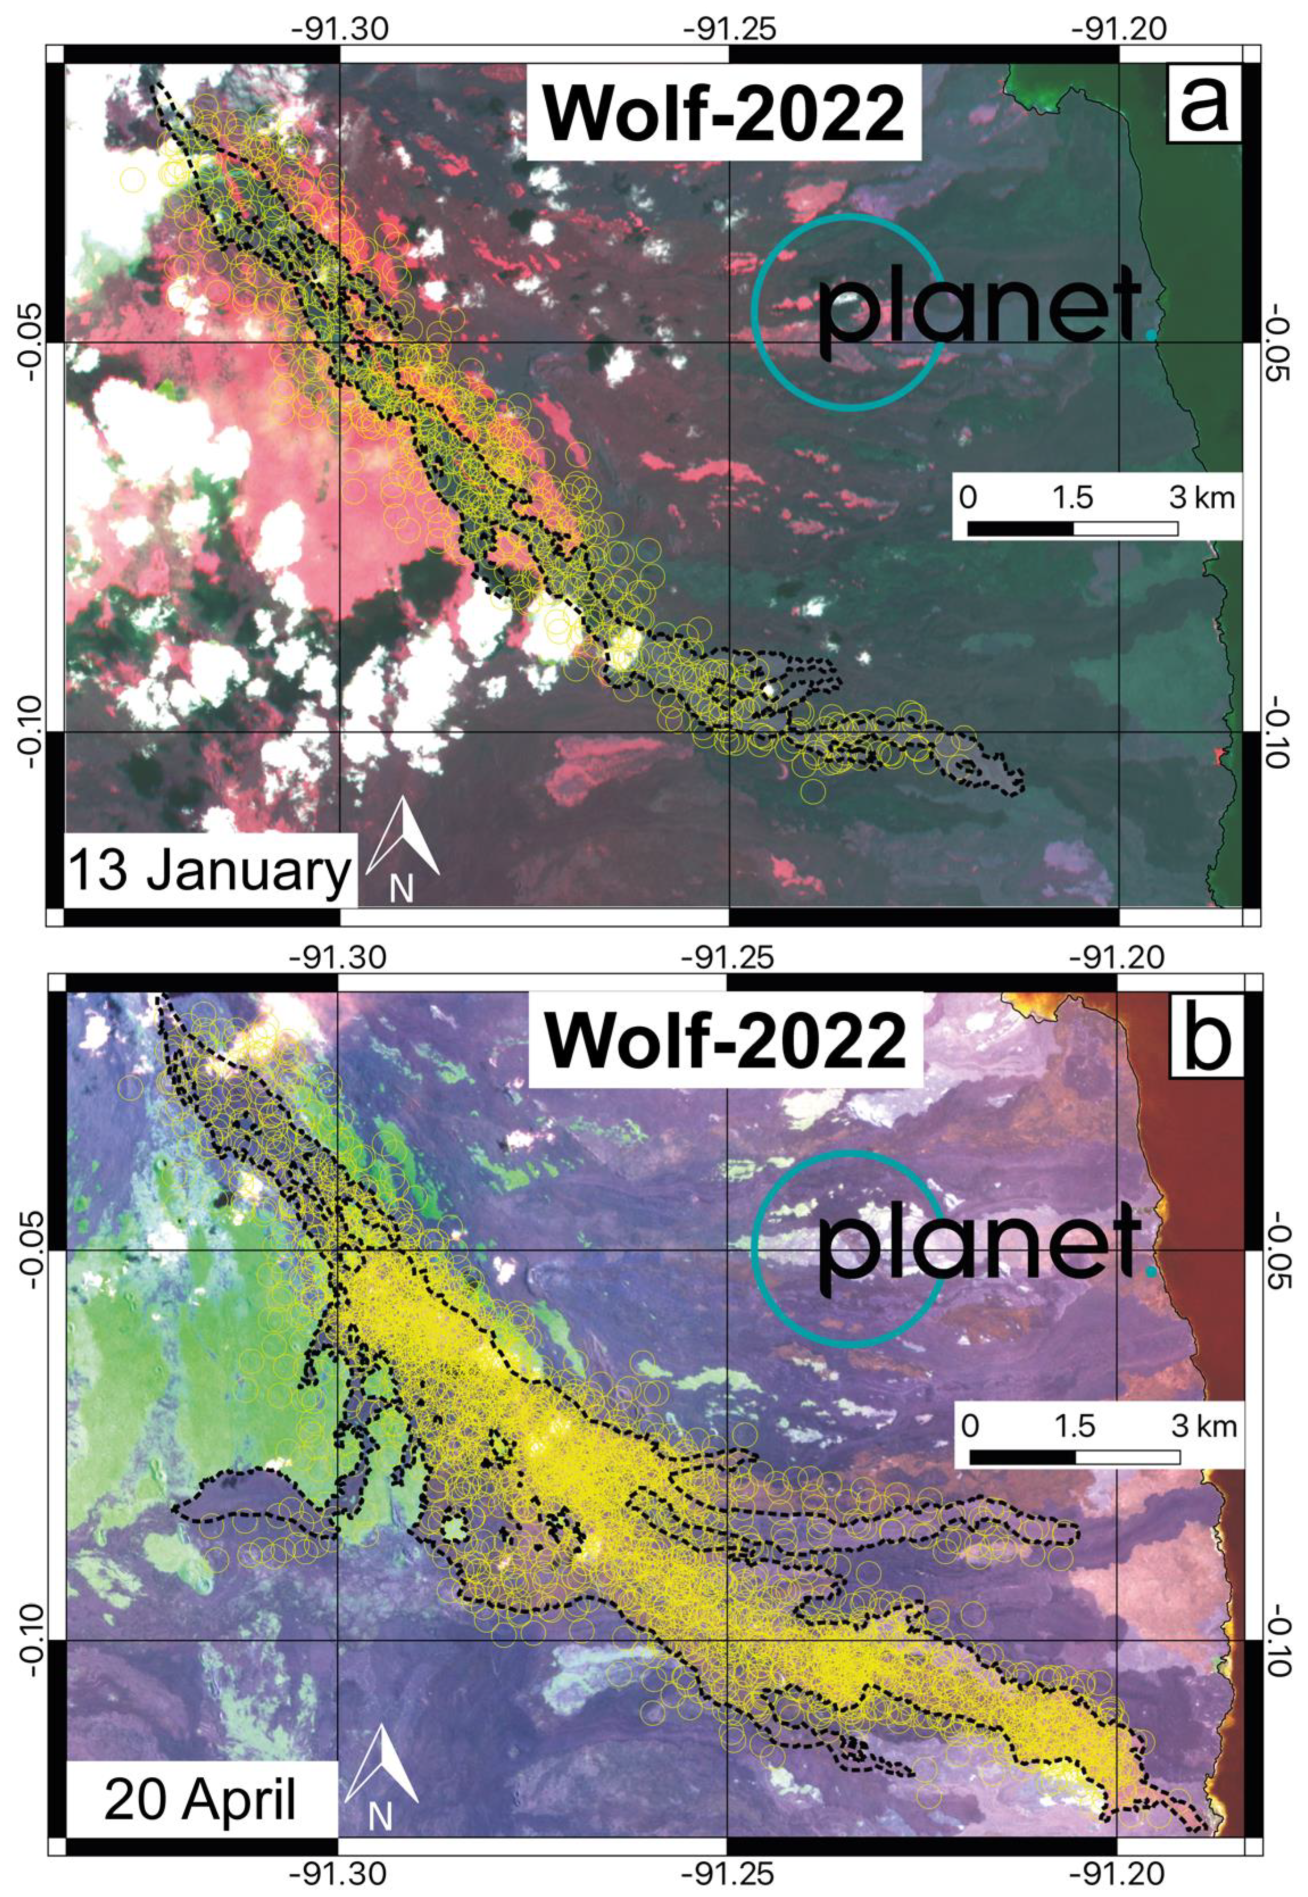
5.2. Ongoing Eruptions: Application to the Wolf-2022 Eruption (Galápagos, Ecuador)
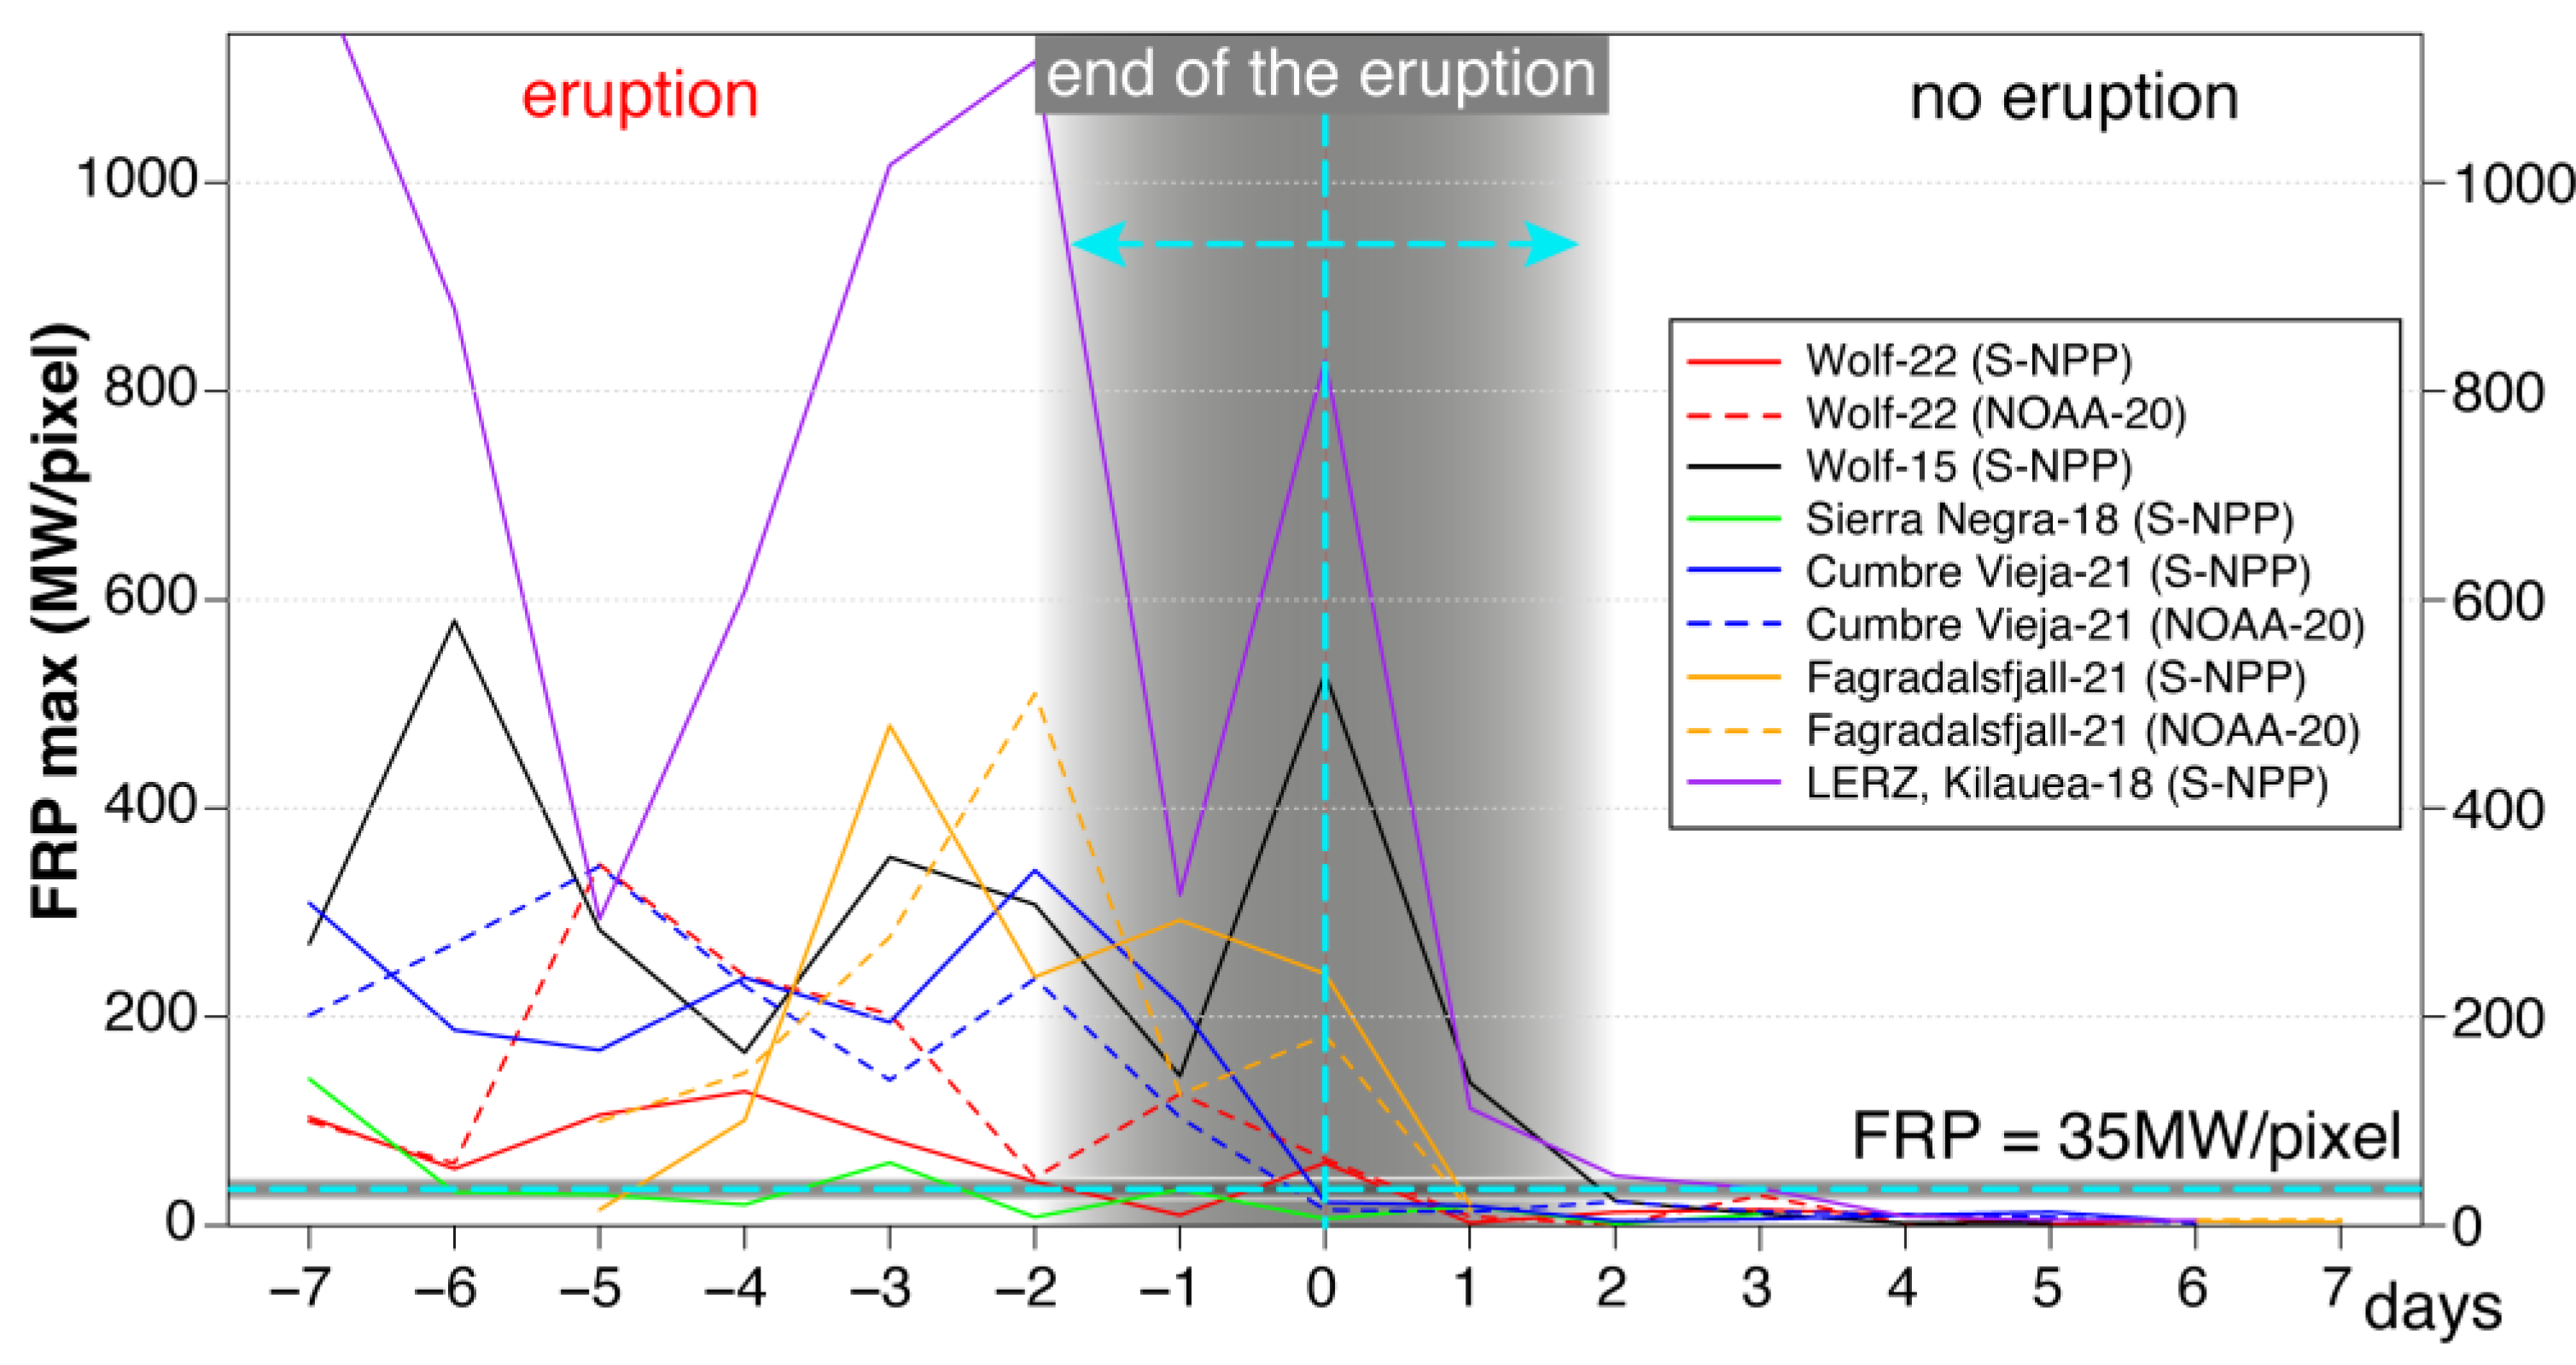
5.3. Approximating Eruptive Breaks and/or End of Unobserved Eruptions
5.4. The Value of Time during Volcanic Crises
5.5. Limitations, Advantages and Future Perspectives
6. Conclusions
Supplementary Materials
Author Contributions
Funding
Data Availability Statement
Acknowledgments
Conflicts of Interest
References
- Lowenstern, J.B.; Wallace, K.; Barsotti, S.; Sandri, L.; Stovall, W.; Bernard, B.; Privitera, E.; Komorowski, J.-C.; Fournier, N.; Balagizi, C.; et al. Guidelines for Volcano-Observatory Operations during Crises: Recommendations from the 2019 Volcano Observatory Best Practices Meeting. J. Appl. Volcanol. 2022, 11, 3. [Google Scholar] [CrossRef]
- Forte, P.; Rodríguez, L.; Jácome Paz, M.P.; Caballero García, L.; Alpízar Segura, Y.; Bustos, E.; Perales Moya, C.; Espinoza, E.; Vallejo, S.; Agusto, M. Volcano Monitoring in Latin America: Taking a Step Forward. Volcanica 2021, 4, vii–xxxiii. [Google Scholar] [CrossRef]
- Pavolonis, M.J.; Sieglaff, J.; Cintineo, J. Spectrally Enhanced Cloud Objects—A Generalized Framework for Automated Detection of Volcanic Ash and Dust Clouds Using Passive Satellite Measurements: 2. Cloud Object Analysis and Global Application. J. Geophys. Res. Atmos. 2015, 120, 7842–7870. [Google Scholar] [CrossRef]
- Pavolonis, M.J.; Sieglaff, J.; Cintineo, J. Automated Detection of Explosive Volcanic Eruptions Using Satellite-Derived Cloud Vertical Growth Rates. Earth Space Sci. 2018, 5, 903–928. [Google Scholar] [CrossRef] [Green Version]
- Davies, D.K.; Ilavajhala, S.; Wong, M.M.; Justice, C.O. Fire Information for Resource Management System: Archiving and Distributing MODIS Active Fire Data. IEEE Trans. Geosci. Remote Sens. 2009, 47, 72–79. [Google Scholar] [CrossRef]
- Justice, C.O.; Giglio, L.; Korontzi, S.; Owens, J.; Morisette, J.T.; Roy, D.; Descloitres, J.; Alleaume, S.; Petitcolin, F.; Kaufman, Y. The MODIS Fire Products. Remote Sens. Environ. 2002, 83, 244–262. [Google Scholar] [CrossRef]
- Schroeder, W.; Oliva, P.; Giglio, L.; Csiszar, I.A. The New VIIRS 375 m Active Fire Detection Data Product: Algorithm Description and Initial Assessment. Remote Sens. Environ. 2014, 143, 85–96. [Google Scholar] [CrossRef]
- Schroeder, W.; Giglio, L. Visible Infrared Imaging Radiometer Suite (VIIRS) 750 m Active Fire Detection and Characterization Algorithm Theoretical Basis Document 1.0; University of Maryland: College Park, MD, USA, 2017; p. 13. [Google Scholar]
- Coppola, D.; Laiolo, M.; Piscopo, D.; Cigolini, C. Rheological Control on the Radiant Density of Active Lava Flows and Domes. J. Volcanol. Geotherm. Res. 2013, 249, 39–48. [Google Scholar] [CrossRef]
- Coppola, D.; Laiolo, M.; Cigolini, C.; Donne, D.D.; Ripepe, M. Enhanced Volcanic Hot-Spot Detection Using MODIS IR Data: Results from the MIROVA System. Geol. Soc. Lond. Spec. Publ. 2016, 426, 181–205. [Google Scholar] [CrossRef]
- Wright, R.; Flynn, L.P.; Garbeil, H.; Harris, A.J.L.; Pilger, E. MODVOLC: Near-Real-Time Thermal Monitoring of Global Volcanism. J. Volcanol. Geotherm. Res. 2004, 135, 29–49. [Google Scholar] [CrossRef]
- Valade, S.; Ley, A.; Massimetti, F.; D’Hondt, O.; Laiolo, M.; Coppola, D.; Loibl, D.; Hellwich, O.; Walter, T.R. Towards Global Volcano Monitoring Using Multisensor Sentinel Missions and Artificial Intelligence: The MOUNTS Monitoring System. Remote Sens. 2019, 11, 1528. [Google Scholar] [CrossRef] [Green Version]
- Carn, S.A.; Krueger, A.J.; Krotkov, N.A.; Yang, K.; Evans, K. Tracking Volcanic Sulfur Dioxide Clouds for Aviation Hazard Mitigation. Nat. Hazards 2009, 51, 325–343. [Google Scholar] [CrossRef]
- Krueger, A.J.; Krotkov, N.A.; Yang, K.; Carn, S.; Vicente, G.; Schroeder, W. Applications of Satellite-Based Sulfur Dioxide Monitoring. IEEE J. Sel. Top. Appl. Earth Obs. Remote Sens. 2009, 2, 293–298. [Google Scholar] [CrossRef]
- Planet Team. Planet Application Program Interface: In Space for Life on Earth. San Francisco, CA, USA, 2017. Available online: https://api.planet.com (accessed on 14 March 2022).
- Coppola, D.; Valade, S.; Masias, P.; Laiolo, M.; Massimetti, F.; Campus, A.; Aguilar, R.; Anccasi, R.; Apaza, F.; Ccallata, B.; et al. Shallow Magma Convection Evidenced by Excess Degassing and Thermal Radiation during the Dome-Forming Sabancaya Eruption (2012–2020). Bull. Volcanol. 2022, 84, 16. [Google Scholar] [CrossRef]
- Naismith, A.K.; Matthew Watson, I.; Escobar-Wolf, R.; Chigna, G.; Thomas, H.; Coppola, D.; Chun, C. Eruption Frequency Patterns through Time for the Current (1999–2018) Activity Cycle at Volcán de Fuego Derived from Remote Sensing Data: Evidence for an Accelerating Cycle of Explosive Paroxysms and Potential Implications of Eruptive Activity. J. Volcanol. Geotherm. Res. 2019, 371, 206–219. [Google Scholar] [CrossRef] [Green Version]
- Vasconez, F.J.; Hidalgo, S.; Battaglia, J.; Hernandez, S.; Bernard, B.; Coppola, D.; Valade, S.; Ramón, P.; Arellano, S.; Liorzou, C.; et al. Linking Ground-Based Data and Satellite Monitoring to Understand the Last Two Decades of Eruptive Activity at Sangay Volcano, Ecuador. Bull. Volcanol. 2022, 84, 49. [Google Scholar] [CrossRef]
- Walter, T.R.; Haghshenas Haghighi, M.; Schneider, F.M.; Coppola, D.; Motagh, M.; Saul, J.; Babeyko, A.; Dahm, T.; Troll, V.R.; Tilmann, F.; et al. Complex Hazard Cascade Culminating in the Anak Krakatau Sector Collapse. Nat. Commun. 2019, 10, 4339. [Google Scholar] [CrossRef]
- Girona, T.; Realmuto, V.; Lundgren, P. Large-Scale Thermal Unrest of Volcanoes for Years Prior to Eruption. Nat. Geosci. 2021, 14, 238–241. [Google Scholar] [CrossRef]
- Laiolo, M.; Coppola, D.; Barahona, F.; Benítez, J.E.; Cigolini, C.; Escobar, D.; Funes, R.; Gutierrez, E.; Henriquez, B.; Hernandez, A.; et al. Evidences of Volcanic Unrest on High-Temperature Fumaroles by Satellite Thermal Monitoring: The Case of Santa Ana Volcano, El Salvador. J. Volcanol. Geotherm. Res. 2017, 340, 170–179. [Google Scholar] [CrossRef] [Green Version]
- Blackett, M. An Initial Comparison of the Thermal Anomaly Detection Products of MODIS and VIIRS in Their Observation of Indonesian Volcanic Activity. Remote Sens. Environ. 2015, 171, 75–82. [Google Scholar] [CrossRef] [Green Version]
- Coppola, D.; Laiolo, M.; Cigolini, C.; Massimetti, F.; Delle Donne, D.; Ripepe, M.; Arias, H.; Barsotti, S.; Parra, C.B.; Centeno, R.G.; et al. Thermal Remote Sensing for Global Volcano Monitoring: Experiences from the MIROVA System. Front. Earth Sci. 2020, 7, 362. [Google Scholar] [CrossRef] [Green Version]
- Harris, A.J.L.; Villeneuve, N.; Di Muro, A.; Ferrazzini, V.; Peltier, A.; Coppola, D.; Favalli, M.; Bachèlery, P.; Froger, J.-L.; Gurioli, L.; et al. Effusive Crises at Piton de La Fournaise 2014–2015: A Review of a Multi-National Response Model. J. Appl. Volcanol. 2017, 6, 11. [Google Scholar] [CrossRef] [Green Version]
- Plank, S.; Marchese, F.; Filizzola, C.; Pergola, N.; Neri, M.; Nolde, M.; Martinis, S. The July/August 2019 Lava Flows at the Sciara Del Fuoco, Stromboli–Analysis from Multi-Sensor Infrared Satellite Imagery. Remote Sens. 2019, 11, 2879. [Google Scholar] [CrossRef] [Green Version]
- Plank, S.; Massimetti, F.; Soldati, A.; Hess, K.-U.; Nolde, M.; Martinis, S.; Dingwell, D.B. Estimates of Lava Discharge Rate of 2018 Kīlauea Volcano, Hawaiʻi Eruption Using Multi-Sensor Satellite and Laboratory Measurements. Int. J. Remote Sens. 2021, 42, 1492–1511. [Google Scholar] [CrossRef]
- Bernard, B.; Stock, M.J.; Coppola, D.; Hidalgo, S.; Bagnardi, M.; Gibson, S.; Hernandez, S.; Ramón, P.; Gleeson, M. Chronology and Phenomenology of the 1982 and 2015 Wolf Volcano Eruptions, Galápagos Archipelago. J. Volcanol. Geotherm. Res. 2019, 374, 26–38. [Google Scholar] [CrossRef] [Green Version]
- Genzano, N.; Pergola, N.; Marchese, F. A Google Earth Engine Tool to Investigate, Map and Monitor Volcanic Thermal Anomalies at Global Scale by Means of Mid-High Spatial Resolution Satellite Data. Remote Sens. 2020, 12, 3232. [Google Scholar] [CrossRef]
- Marchese, F.; Genzano, N.; Neri, M.; Falconieri, A.; Mazzeo, G.; Pergola, N. A Multi-Channel Algorithm for Mapping Volcanic Thermal Anomalies by Means of Sentinel-2 MSI and Landsat-8 OLI Data. Remote Sens. 2019, 11, 2876. [Google Scholar] [CrossRef] [Green Version]
- Musacchio, M.; Silvestri, M.; Rabuffi, F.; Buongiorno, M.F.; Falcone, S. Kīlauea–Leilani 2018 Lava Flow Delineation Using Sentinel2 and Landsat8 Images. Geol. Soc. Lond. Spec. Publ. 2021, 519, SP519-2020-118. [Google Scholar] [CrossRef]
- Earthdata Visible Infrared Imaging Radiometer Suite (VIIRS). Available online: https://earthdata.nasa.gov/earth-observation-data/near-real-time/download-nrt-data/viirs-nrt/ (accessed on 23 February 2022).
- Xiong, X.; Oudrari, H.; McIntire, J.; Lei, N.; Chiang, K.; Angal, A. Initial Calibration Activities and Performance Assessments of NOAA-20 VIIRS. In Proceedings of the Earth Observing Missions and Sensors: Development, Implementation, and Characterization V; International Society for Optics and Photonics: Bellingham, WA, USA, 2018; Volume 10781, p. 107810L. [Google Scholar]
- Kaufman, Y.J.; Justice, C.O.; Flynn, L.P.; Kendall, J.D.; Prins, E.M.; Giglio, L.; Ward, D.E.; Menzel, W.P.; Setzer, A.W. Potential Global Fire Monitoring from EOS-MODIS. J. Geophys. Res. 1998, 103, 32215–32238. [Google Scholar] [CrossRef]
- Wooster, M. Fire Radiative Energy for Quantitative Study of Biomass Burning: Derivation from the BIRD Experimental Satellite and Comparison to MODIS Fire Products. Remote Sens. Environ. 2003, 86, 83–107. [Google Scholar] [CrossRef]
- Schroeder, W.; Csiszar, I.; Giglio, L.; Schmidt, C.C. On the Use of Fire Radiative Power, Area, and Temperature Estimates to Characterize Biomass Burning via Moderate to Coarse Spatial Resolution Remote Sensing Data in the Brazilian Amazon. J. Geophys. Res. Atmos. 2010, 115. [Google Scholar] [CrossRef] [Green Version]
- Armenteras, D.; González, T.M.; Retana, J. Forest Fragmentation and Edge Influence on Fire Occurrence and Intensity under Different Management Types in Amazon Forests. Biol. Conserv. 2013, 159, 73–79. [Google Scholar] [CrossRef]
- Boschetti, L.; Roy, D.P. Strategies for the Fusion of Satellite Fire Radiative Power with Burned Area Data for Fire Radiative Energy Derivation. J. Geophys. Res. Atmos. 2009, 114. [Google Scholar] [CrossRef] [Green Version]
- Ellicott, E.; Vermote, E. The Science and Application of Satellite Based Fire Radiative Energy. In Remote Sensing of Biomass—Principles and Applications; IntechOpen: Maryland, MD, USA, 2012; pp. 177–192. ISBN 978-953-51-0313-4. [Google Scholar]
- Kaiser, J.W.; Heil, A.; Andreae, M.O.; Benedetti, A.; Chubarova, N.; Jones, L.; Morcrette, J.-J.; Razinger, M.; Schultz, M.G.; Suttie, M. Biomass Burning Emissions Estimated with a Global Fire Assimilation System Based on Observed Fire Radiative Power. Biogeosciences 2012, 9, 527–554. [Google Scholar] [CrossRef] [Green Version]
- Kumar, S.S.; Hult, J.; Picotte, J.; Peterson, B. Potential Underestimation of Satellite Fire Radiative Power Retrievals over Gas Flares and Wildland Fires. Remote Sens. 2020, 12, 238. [Google Scholar] [CrossRef] [Green Version]
- Laurent, P.; Mouillot, F.; Moreno, M.V.; Yue, C.; Ciais, P. Varying Relationships between Fire Radiative Power and Fire Size at a Global Scale. Biogeosciences 2019, 16, 275–288. [Google Scholar] [CrossRef] [Green Version]
- Lozin, D.V.; Balashov, I.V.; Loupian, E.A. Possibilities of near Real-Time Forest Cover Damage Estimation Based on Fires Radiative Power Data. IOP Conf. Ser. Earth Environ. Sci. 2021, 806, 8. [Google Scholar] [CrossRef]
- Paudel, J. Environmental Disasters and Property Values: Evidence from Nepal’s Forest Fires. Land Econ. 2022, 98, 115–131. [Google Scholar] [CrossRef]
- Vermote, E.; Ellicott, E.; Dubovik, O.; Lapyonok, T.; Chin, M.; Giglio, L.; Roberts, G.J. An Approach to Estimate Global Biomass Burning Emissions of Organic and Black Carbon from MODIS Fire Radiative Power. J. Geophys. Res. Atmos. 2009, 114. [Google Scholar] [CrossRef]
- Wooster, M.J.; Roberts, G.; Perry, G.L.W.; Kaufman, Y.J. Retrieval of Biomass Combustion Rates and Totals from Fire Radiative Power Observations: FRP Derivation and Calibration Relationships between Biomass Consumption and Fire Radiative Energy Release. J. Geophys. Res. Atmos. 2005, 110. [Google Scholar] [CrossRef]
- Wang, W.; Cao, C.; Bai, Y.; Blonski, S.; Schull, M. Assessment of the NOAA S-NPP VIIRS Geolocation Reprocessing Improvements. Remote Sens. 2017, 9, 974. [Google Scholar] [CrossRef] [Green Version]
- Geist, D.J.; Naumann, T.R.; Standish, J.J.; Kurz, M.D.; Harpp, K.S.; White, W.M.; Fornari, D.J. Wolf Volcano, Galápagos Archipelago: Melting and Magmatic Evolution at the Margins of a Mantle Plume. J. Petrol. 2005, 46, 2197–2224. [Google Scholar] [CrossRef]
- Ramon, P.; Vallejo Vargas, S.; Mothes, P.A.; Andrade, S.D.; Vasconez, F.J.; Yepes, H.; Hidalgo, S.; Santamaría, S. Instituto Geofísico—Escuela Politécnica Nacional, the Ecuadorian Seismology and Volcanology Service. Volcanica 2021, 4, 93–112. [Google Scholar] [CrossRef]
- Bernard, B.; Ramón, P.; García, L.; Hernandez, S.; Vasconez, F.J.; Viracucha, G.; Hidalgo, S. Volcanic Event Management in the Galápagos Islands, Ecuador. Volcanica 2022, 5, 209–225. [Google Scholar] [CrossRef]
- Harris, D.B. Subspace Detectors: Theory; Lawrence Livermore National Lab. (LLNL): Livermore, CA, USA, 2006. [Google Scholar]
- Global Volcanism Program [Sierra Negra (353050)] in Volcanoes of the World, v. 4.3.4. 2013. Available online: https://volcano.si.edu/gvp_cite.cfm (accessed on 27 January 2022).
- Vasconez, F.J.; Ramon, P.; Hernandez, S.; Hidalgo, S.; Bernard, B.; Ruiz, M.; Alvarado, A.; La Femina, P.; Ruiz, G.A. The Different Characteristics of the Recent Eruptions of Fernandina and Sierra Negra Volcanoes (Galápagos, Ecuador). Volcanica 2018, 1, 127–133. [Google Scholar] [CrossRef]
- González, P.J. Volcano-Tectonic Control of Cumbre Vieja. Science 2022, 375, 1348–1349. [Google Scholar] [CrossRef]
- Global Volcanism Program. Report on Krysuvik-Trolladyngja (Iceland); Bennis, K.L., Venzke, E., Eds.; Bulletin of the Global Volcanism Network; Smithsonian Institution: Washington, DC, USA, 2021. [Google Scholar]
- Pedersen, G.B.; Gudmundsson, M.T.; Óskarsson, B.V.; Berlart, J.M.; Gies, N.; Hognadottir, T.; Hjartardottir, A.R.; Dürig, T.; Reynolds, H.I.; Valsson, G. Volume, Discharge Rate and Lava Transport at the Fagradalsfjall Eruption 2021: Results from Near-Real Time Photogrammetric Monitoring. In Proceedings of the AGU Fall Meeting 2021, New Orleans, LA, USA, 13–17 December 2021. [Google Scholar]
- Dietterich, H.R.; Diefenbach, A.K.; Soule, S.A.; Zoeller, M.H.; Patrick, M.P.; Major, J.J.; Lundgren, P.R. Lava Effusion Rate Evolution and Erupted Volume during the 2018 Kīlauea Lower East Rift Zone Eruption. Bull. Volcanol. 2021, 83, 25. [Google Scholar] [CrossRef]
- Neal, C.A.; Brantley, S.R.; Antolik, L.; Babb, J.L.; Burgess, M.; Calles, K.; Cappos, M.; Chang, J.C.; Conway, S.; Desmither, L.; et al. The 2018 Rift Eruption and Summit Collapse of Kīlauea Volcano. Science 2019, 363, 367–374. [Google Scholar] [CrossRef]
- Zoeller, M.H.; Perroy, R.L.; Wessels, R.; Fisher, G.B.; Robinson, J.E.; Bard, J.A.; Peters, J.; Mosbrucker, A.; Parcheta, C.E. Geospatial Database of the 2018 Lower East Rift Zone Eruption of Kilauea Volcano, Hawaii; U.S. Geological Survey: Reston, VA, USA, 2020. [Google Scholar] [CrossRef]
- Global Volcanism Program [Fernandina (353010)] in Volcanoes of the World, v. 4.3.4. 2013. Available online: https://volcano.si.edu/gvp_cite.cfm (accessed on 27 January 2022).
- Ministerio del Ambiente Reporte de Visitas, Sistema Nacional de Áreas Protegidas del Ecuador. Available online: http://areasprotegidas.ambiente.gob.ec/reporte-de-visitas# (accessed on 18 May 2022).
- Global Volcanism Program [Cumbre Vieja (383010)] in Volcanoes of the World, v. 4.3.4. 2013. Available online: https://volcano.si.edu/gvp_cite.cfm (accessed on 27 January 2022).
- Longpré, M.-A. Reactivation of Cumbre Vieja Volcano. Science 2021, 374, 1197–1198. [Google Scholar] [CrossRef]
- Pankhurst, M.J.; Scarrow, J.H.; Barbee, O.A.; Hickey, J.; Coldwell, B.C.; Rollinson, G.K.; Rodríguez-Losada, J.A.; Martín Lorenzo, A.; Rodríguez, F.; Hernández, W.; et al. Rapid Response Petrology for the Opening Eruptive Phase of the 2021 Cumbre Vieja Eruption, La Palma, Canary Islands. Volcanica 2022, 5, 1–10. [Google Scholar] [CrossRef]
- Global Volcanism Program. Report on La Palma (Spain); Crafford, A.E., Venzke, E., Eds.; Bulletin of the Global Volcanism Network; Smithsonian Institution: Washington, DC, USA, 2021. [Google Scholar]
- Emergency Management Service COPERNICUS Emergency Management Service. Available online: https://emergency.copernicus.eu/mapping/list-of-components/EMSR546 (accessed on 15 March 2022).
- Gudmundsson, M.T.; Larsen, G.; Höskuldsson, Á.; Gylfason, Á.G. Volcanic Hazards in Iceland. Jökull 2008, 58, 251–268. [Google Scholar]
- Sæmundsson, K.; Sigurgeirsson, M.Á.; Friðleifsson, G.Ó. Geology and Structure of the Reykjanes Volcanic System, Iceland. J. Volcanol. Geotherm. Res. 2020, 391, 106501. [Google Scholar] [CrossRef]
- Barsotti, S.; Parks, M.M.; Pfeffer, M.A.; Óladóttir, B.A.; Barnie, T.; Titos, M.M.; Jónsdóttir, K.; Pedersen, G.B.; Hjartardóttir, Á.R.; Stefansdóttir, G.; et al. The Eruption in Fagradalsfjall (2021, Iceland): How the Operational Monitoring and The Volcanic Hazard Assessment Contributed to Its Safe Access. Nat. Hazards 2022. preprint. [Google Scholar] [CrossRef]
- Patrick, M.R.; Orr, T.R.; Swanson, D.A.; Elias, T.; Shiro, B. Lava Lake Activity at the Summit of Kīlauea Volcano in 2016; US Geological Survey: Reston, VA, USA, 2018.
- Heliker, C.C.; Swanson, D.A.; Takahashi, T.J. The Puʻu ʻŌʻō-Kūpaianaha Eruption of Kīlauea Volcano, Hawaiʻi: The First 20 Years; US Department of the Interior, US Geological Survey: Reston, VA, USA, 2003.
- Wolfe, E.W. The Puu Oo Eruption of Kilauea Volcano, Hawaii: Episodes 1 through 20, January 3, 1983, through June 8, 1984; Professional Paper 1463; U.S. Geological Survey: Reston, VA, USA, 1988; 251p. [CrossRef] [Green Version]
- Patrick, M.R.; Houghton, B.F.; Anderson, K.R.; Poland, M.P.; Montgomery-Brown, E.; Johanson, I.; Thelen, W.; Elias, T. The Cascading Origin of the 2018 Kīlauea Eruption and Implications for Future Forecasting. Nat. Commun. 2020, 11, 5646. [Google Scholar] [CrossRef]
- Bonny, E.; Wright, R. Predicting the End of Lava Flow-Forming Eruptions from Space. Bull. Volcanol. 2017, 79, 52. [Google Scholar] [CrossRef]
- Wadge, G. The Variation of Magma Discharge during Basaltic Eruptions. J. Volcanol. Geotherm. Res. 1981, 11, 139–168. [Google Scholar] [CrossRef]
- Rowland, S.K.; Harris, A.J.L.; Wooster, M.J.; Amelung, F.; Garbeil, H.; Wilson, L.; Mouginis-Mark, P.J. Volumetric Characteristics of Lava Flows from Interferometric Radar and Multispectral Satellite Data: The 1995 Fernandina and 1998 Cerro Azul Eruptions in the Western Galápagos. Bull. Volcanol. 2003, 65, 311–330. [Google Scholar] [CrossRef]
- Poland, M.P. Synthetic Aperture Radar Volcanic Flow Maps (SAR VFMs): A Simple Method for Rapid Identification and Mapping of Volcanic Mass Flows. Bull. Volcanol. 2022, 84, 32. [Google Scholar] [CrossRef]
- Campus, A.; Laiolo, M.; Massimetti, F.; Coppola, D. The Transition from MODIS to VIIRS for Global Volcano Thermal Monitoring. Sensors 2022, 22, 1713. [Google Scholar] [CrossRef]
- Li, F.; Zhang, X.; Kondragunta, S.; Csiszar, I. Comparison of Fire Radiative Power Estimates from VIIRS and MODIS Observations. J. Geophys. Res. Atmos. 2018, 123, 4545–4563. [Google Scholar] [CrossRef]


| Eruption-Year | Satellite | Duration | Mean | Min. | 5th Per. | 1st Quar. | Median | 3rd Quar. | 95th Per. | Max. | # Anomalies |
|---|---|---|---|---|---|---|---|---|---|---|---|
| Wolf-2022 1 | S-NPP | 103 | 30 | 0 | 1 | 2 | 5 | 18 | 119 | 5979 | 11,498 |
| NOAA-20 | 28 | 0 | 1 | 2 | 5 | 19 | 136 | 1748 | 11,426 | ||
| Wolf-2015 | S-NPP | 36 | 56 | 0 | 1 | 2 | 7 | 27 | 337 | 1306 | 5269 |
| Sierra Negra-2018 | S-NPP | 58 | 29 | 0 | 1 | 2 | 5 | 17 | 153 | 1024 | 8628 |
| Cumbre Vieja-2021 | S-NPP | 85.3 | 34 | 0 | 1 | 2 | 6 | 25 | 185 | 719 | 15,060 |
| NOAA-20 | 31 | 0 | 1 | 2 | 5 | 18 | 165 | 1590 | 15,225 | ||
| Fagradalsfjall-2021 | S-NPP | 183 | 42 | 0 | 1 | 3 | 9 | 43 | 195 | 914 | 9918 |
| NOAA-20 | 41 | 0 | 1 | 2 | 8 | 36 | 198 | 1451 | 9658 | ||
| LERZ, Kilauea-2018 | S-NPP | 78 | 64 | 0 | 1 | 3 | 9 | 39 | 379 | 2089 | 34,628 |
| Average long-lasting | 91 ± 51 | 39 ± 13 | 0 ± 0 | 1 ± 0 | 2 ± 0 | 7 ± 2 | 27 ± 10 | 207 ± 90 | 103–104 | ||
| Fernandina-2020 | S-NPP | 0.4 | 44 | 2 | 10 | 21 | 33 | 53 | 126 | 126 | 47 |
| NOAA-20 | 16 | 3 | 4 | 11 | 13 | 23 | 26 | 26 | 26 | ||
| Fernandina-2018 | S-NPP | 2 | 74 | 1 | 1 | 2 | 5 | 26 | 475 | 2689 | 392 |
| Fernandina-2017 | S-NPP | 2.5 | 116 | 1 | 2 | 6 | 14 | 44 | 346 | 4334 | 528 |
| Average short-lived | 2 ± 1 | 63 ± 43 | 2 ± 1 | 4 ± 4 | 10 ± 8 | 16 ± 12 | 37 ± 14 | 243 ± 204 | |||
| TOTAL average | 63 ± 55 | 44 ± 26 | 0 ± 1 | 2 ± 2 | 4 ± 5 | 9 ± 7 | 28 ± 12 | 209 ± 122 | 101–102 |
| Data Reduction | ||||||||||
| Case Studies | No Filter (%) | 5th Per. (%) | 3rd Quar. (%) | Mean (%) | 95th Per. (%) | |||||
| Within | Outside | Within | Outside | Within | Outside | Within | Outside | Within | Outside | |
| Wolf-2022 | 7853 | 6032 | 7551 | 5283 | 2439 | 860 | 1855 | 606 | 602 | 163 |
| Wolf-2015 | 1220 | 1842 | 1187 | 1677 | 432 | 235 | 336 | 134 | 130 | 34 |
| Sierra Negra-2018 | 3059 | 2163 | 3024 | 1905 | 999 | 285 | 778 | 182 | 244 | 45 |
| Cumbre Vieja-2021 | 7655 | 8226 | 7511 | 7014 | 3168 | 725 | 2620 | 544 | 760 | 77 |
| Fagradalsfjall-2021 | 6367 | 7431 | 6184 | 6573 | 2269 | 612 | 2198 | 583 | 535 | 97 |
| LERZ, Kilauea-2018 | 7916 | 12349 | 7817 | 11451 | 3389 | 1513 | 2811 | 1056 | 951 | 225 |
| Error Analysis | ||||||||||
| Case Studies | No Filter (%) | 5th Per. (%) | 3rd Quar. (%) | Mean (%) | 95th Per. (%) | |||||
| Correct | Noise | Correct | Noise | Correct | Noise | Correct | Noise | Correct | Noise | |
| Wolf-2022 | 56.6 | 43.4 | 58.8 | 41.2 | 73.9 | 26.1 | 75.4 | 24.6 | 78.7 | 21.3 |
| Wolf-2015 | 39.8 | 60.2 | 41.4 | 58.6 | 64.8 | 35.2 | 71.5 | 28.5 | 79.3 | 20.7 |
| Sierra Negra-2018 | 58.6 | 41.4 | 61.4 | 38.6 | 77.8 | 22.2 | 81.0 | 19.0 | 84.4 | 15.6 |
| Cumbre Vieja-2021 | 48.2 | 51.8 | 51.7 | 48.3 | 81.4 | 18.6 | 82.8 | 17.2 | 90.8 | 9.2 |
| Fagradalsfjall-2021 | 46.1 | 53.9 | 48.5 | 51.5 | 78.8 | 21.2 | 79.0 | 21.0 | 84.7 | 15.3 |
| LERZ, Kilauea-2018 | 39.1 | 60.9 | 40.6 | 59.4 | 69.1 | 30.9 | 72.7 | 27.3 | 80.9 | 19.1 |
| Average | 48.1 | 51.9 | 50.4 | 49.6 | 74.3 | 25.7 | 77.1 | 22.9 | 83.1 | 16.9 |
| Std | 7.5 | 7.5 | 7.9 | 7.9 | 5.8 | 5.8 | 4.2 | 4.2 | 4.1 | 4.1 |
| Case Studies | No Filter (%) | 5th Per. (%) | 3rd Quar. (%) | Mean (%) | 95th Per. (%) |
|---|---|---|---|---|---|
| Wolf-2022 | 4.0 | 4.0 | −1.3 | −2.8 | −7.7 |
| Wolf-2015 | 0.3 | 0.3 | 0.2 | −5.5 | −7.5 |
| Sierra Negra-2018 | 5.7 | 5.7 | 2.0 | 0.4 | 0.0 |
| Cumbre Vieja-2021 | 39.3 | 36.1 | −1.3 | −1.3 | −4.8 |
| Fagradalsfjall-2021 | 84.4 | 84.4 | 0.7 | 0.7 | −24.3 |
| LERZ, Kilauea-2018 | 22.7 | 22.7 | 5.1 | 5.1 | −1.3 |
| Average | 26.1 | 25.5 | 0.9 | −0.6 | −7.6 |
| Std | 29.3 | 29.1 | 2.2 | 3.3 | 8.0 |
| Characteristic | iMac (2017) | MacbookPro (2012) | PC (Desktop) | ThinkPad (2017) |
|---|---|---|---|---|
| Processor | 3 GHz Core-i10 | 2.5 GHz Core-i5 | 3 GHz Core-i7 | 1.6 GHz Intel Celeron |
| RAM memory | 32 GB | 16 GB | 8 GB | 4 GB |
| Storage | 1 TB | 256 GB | 500 GB | 116 GB |
| System | Monterey | Catalina | Windows 7 | Windows 10 |
| Case Study | FRP Statistical (Seconds) | LavaFlow_Mapper (Seconds) | # Thermal Anomalies | ||||||
|---|---|---|---|---|---|---|---|---|---|
| iMac | MacbookPro | PC | ThinkPad | iMac | MacbookPro | PC | ThinkPad | ||
| Wolf-2022 1 | 16.48 | 33.06 | 41.72 | 151.77 | 0.58 | 1.27 | 0.57 | 2.83 | 22,924 |
| Wolf-2015 | 2.27 | 5.86 | 5.29 | 18.72 | 0.31 | 0.31 | 0.19 | 0.97 | 5269 |
| Sierra Negra-2018 | 5.13 | 8.77 | 12.64 | 46.95 | 0.38 | 0.47 | 0.31 | 1.66 | 8628 |
| Cumbre Vieja-2021 | 25.8 | 45.28 | 65.6 | 238.56 | 0.83 | 1.39 | 0.76 | 5.45 | 30,285 |
| Fagradalsfjall-2021 | 32.35 | 57.28 | 85.25 | 309.43 | 0.65 | 1.08 | 0.67 | 4.85 | 19,576 |
| LERZ, Kilauea-2018 | 25.51 | 46.20 | 67.11 | 242.66 | 0.87 | 1.83 | 1.07 | 7.20 | 34,628 |
| Average | 18 ± 11 | 33 ± 19 | 46 ± 29 | 168 ± 106 | 0.6 ± 0.2 | 1.1 ± 0.5 | 0.6 ± 0.3 | 3.8 ± 2.2 | 2.104 ± 1.104 |
| Fernandina-2020 | 0.59 | 0.22 | 0.19 | 0.72 | 0.19 | 0.12 | 0.10 | 0.30 | 73 |
| Fernandina-2018 | 0.16 | 0.26 | 0.22 | 0.98 | 0.20 | 0.12 | 0.11 | 0.31 | 392 |
| Fernandina-2017 | 0.26 | 0.27 | 0.24 | 1.51 | 0.20 | 0.14 | 0.11 | 0.39 | 528 |
| Average | 0.3 ± 0.2 | 0.3 ± 0 | 0.2 ± 0 | 1.1 ± 0.3 | 0.2 ± 0 | 1.1 ± 0 | 0.1 ± 0 | 0.3 ± 0 | 300 ± 200 |
Publisher’s Note: MDPI stays neutral with regard to jurisdictional claims in published maps and institutional affiliations. |
© 2022 by the authors. Licensee MDPI, Basel, Switzerland. This article is an open access article distributed under the terms and conditions of the Creative Commons Attribution (CC BY) license (https://creativecommons.org/licenses/by/4.0/).
Share and Cite
Vasconez, F.J.; Anzieta, J.C.; Vásconez Müller, A.; Bernard, B.; Ramón, P. A Near Real-Time and Free Tool for the Preliminary Mapping of Active Lava Flows during Volcanic Crises: The Case of Hotspot Subaerial Eruptions. Remote Sens. 2022, 14, 3483. https://doi.org/10.3390/rs14143483
Vasconez FJ, Anzieta JC, Vásconez Müller A, Bernard B, Ramón P. A Near Real-Time and Free Tool for the Preliminary Mapping of Active Lava Flows during Volcanic Crises: The Case of Hotspot Subaerial Eruptions. Remote Sensing. 2022; 14(14):3483. https://doi.org/10.3390/rs14143483
Chicago/Turabian StyleVasconez, Francisco Javier, Juan Camilo Anzieta, Anais Vásconez Müller, Benjamin Bernard, and Patricio Ramón. 2022. "A Near Real-Time and Free Tool for the Preliminary Mapping of Active Lava Flows during Volcanic Crises: The Case of Hotspot Subaerial Eruptions" Remote Sensing 14, no. 14: 3483. https://doi.org/10.3390/rs14143483