
Wetland Hydroperiod Analysis in Alberta Using InSAR Coherence Data
by
 , , , and
Meisam Amani
1,* ,
,
Brian Brisco
2, 
Rebecca Warren
3,
Evan R. DeLancey
4,
Seyd Teymoor Seydi
5 and
Valentin Poncos
6 1
Wood Environment and Infrastructure Solutions, Ottawa, ON K2E 7L5, Canada
2
Canada Center for Mapping and Earth Observation, Ottawa, ON K1S 5K2, Canada
3
Wood Environment & Infrastructure Solutions, Edmonton, AB T6B 3P6, Canada
4
NGIS EU Ltd., Ulysses House, D01 W2T2 Dublin, Ireland
5
School of Surveying and Geospatial Engineering, College of Engineering, University of Tehran, Tehran 1439957131, Iran
6
Kepler Space Inc., 72 Walden Dr., Ottawa, ON K2K 3L5, Canada
*
Author to whom correspondence should be addressed.
Remote Sens. 2022, 14(14), 3469; https://doi.org/10.3390/rs14143469
Submission received: 30 May 2022
/
Revised: 28 June 2022
/
Accepted: 15 July 2022
/
Published: 19 July 2022
(This article belongs to the Special Issue Wetland Monitoring Using Remote Sensing)
Abstract
:Wetlands are dynamic environments, the water and vegetation of which can change considerably over time. Thus, it is important to investigate the hydroperiod status of wetlands using advanced techniques such as remote sensing technology. Wetland hydroperiod analysis has already been investigated using optical satellite and synthetic aperture radar (SAR) backscattering data. However, interferometric SAR (InSAR) coherence products have rarely been used for wetland hydroperiod mapping. Thus, this study utilized Sentinel-1 coherence maps produced between 2017 and 2020 (48 products) to map the wetland hydroperiod over the entire province of Alberta, Canada. It was observed that a coherence value of 0.45 was an optimum threshold value to discriminate flooded from non-flooded wetlands. Moreover, the results showed that most wetlands were inundated less than 50% of the time over these four years. Furthermore, most wetlands (~40%) were seasonally inundated, and there was a small percentage of wetlands (~5%) that were never flooded. Overall, the results of this study demonstrated the high capability of InSAR coherence products for wetland hydroperiod analysis. Several suggestions are provided to improve the results in future works.
1. Introduction
Wetlands provide many advantages such as water purification, protection from natural hazards, soil and water conservation, and shoreline protection [1]. Wetlands are the result of naturally occurring hydrological and biogeochemical processes [2]. The wetland hydroperiod has been shown to be one of the main factors controlling species community structure and, thus, wetland biodiversity [3]. Hydroperiod refers to the fluctuations in wetland water level and extent that occur over daily, monthly, seasonal, and annual timescales mainly in response to weather [4,5,6], climate trends [7], or disturbances such as urbanization and development [8].
While hydroperiod observations and research have typically been conducted based on in situ measurements, these techniques cannot readily be applied to wide-area wetland mapping and monitoring, primarily because of substantial logistical challenges. On the other hand, remote sensing systems, which provide medium to high spatial resolution and multi-channel imagery over large areas, have effectively been applied to monitor wetlands at various scales [8,9]. Moreover, the multitemporal aspect of repeat satellite overpasses is helpful in improving hydroperiod characterization of these dynamic landscapes [8,9].
Among various remote sensing systems, synthetic aperture radar (SAR) has widely been used to map surface water [10,11,12,13] as well as to map wetland extent and type [14,15,16]. SAR systems can acquire imagery regardless of the atmospheric conditions, making them valuable in countries such as Canada, where the weather is not suitable for acquiring optical satellite imagery in many areas. Moreover, the emitted wavelengths of SAR systems are sensitive to moisture and vegetation structure (the two main characteristics of wetlands), making them efficient for wetland mapping. Several studies have so far investigated the application of SAR data for wetland hydroperiod analysis. For example, Ref. [17] used multitemporal RADARSAT-2 images to map open water and marsh hydroperiod classes, which are defined by the Alberta Wetland Classification System [18], i.e., temporary, seasonal, and semi-permeant wetlands. They observed that hydroperiod variation could be affected by short-term rainfalls. Additionally, Ref. [19] used Sentinel-1 data to investigate the surface water hydroperiod in Alberta. They proposed a method for identifying recurring and permanent water bodies within the Google Earth Engine (GEE) cloud computing platform.
Interferometric SAR (InSAR) techniques have previously been used for monitoring changes in the landscape [20,21,22,23]. InSAR products consist of paired SAR images for which the interferometric phase (φ) and coherence magnitude (γ) are determined. It has been argued that coherence can provide information on the differences between the paired images related to changes in wetland extent, water level, soil moisture, and vegetation [22,24,25,26]. However, low coherence can also be the result of other factors, such as sensor noise, sensor position, or temporal baselines, limiting the application of InSAR for wetland hydroperiod mapping [21]. Thus far, many studies have investigated the application of InSAR coherence for wetland mapping [22,23,24,25,26,27,28,29,30,31]. For example, Ref. [22] examined the utility of SAR coherence for wetland detection in southern boreal Canada. They found that inundated vegetation exhibited high coherence during the snow/ice-free period. The researchers also reported that among wetland classes, swamps generally demonstrated stable coherence values, while marshes showed the greatest variability in coherence due to the phenology of these species. Similarly, Ref. [30] produced time series Sentinel-1 coherence products from the entire province of Alberta and assessed their applicability for discriminating different wetland types. They examined the difference in wetland coherence at three timescales, monthly, seasonally, and leaf-on/leaf-off, and found that coherence products could be used to classify wetlands due to the separability of the coherence responses on both monthly and seasonal scales. Moreover, Ref. [27] discussed the application of L-band InSAR data for assessing water level change in coastal wetlands. They reported that coherence data could provide useful information regarding wetland seasonal variations, and coherence was inversely correlated with vegetation indices such as the normalized difference vegetation index (NDVI). Ref. [28] also used Sentinel-1 InSAR data to assess the hydrological connectivity of wetlands. Furthermore, Ref. [29] applied InSAR data, generated from the Advanced Land Observing Satellite (ALOS) and Radarsat-1, to detect the extent of inundation in the Louisiana coastal wetlands. They argued that InSAR was useful for mapping water level changes in wetlands. In terms of wetland hydroperiod analysis using InSAR techniques, Ref. [24] applied SAR intensity and coherence products to map the surface water, inundation, and hydroperiod in the Amazon basin. They reported that coherence was helpful in distinguishing inundated wetlands and could be a useful product for wetland hydroperiod analysis.
In Canada, wetlands are estimated to cover 13% of the landmass, the majority of those being peatlands (i.e., bogs and fens) [32]. Within Alberta, approximately 20% of the province is covered by wetlands, where peatlands constitute almost 90% of the wetland area [19]. Since wetlands in Alberta have increasingly been impacted by human activities and climate change [33], it is imperative to monitor trends in water occurrence and extent across all wetland types, especially peatlands, which dominate the Albertan and greater Canadian landscapes. Additionally, as discussed above, there is only one study (i.e., [24]) that has investigated the application of InSAR coherence data for wetland hydroperiod analysis. There are many upcoming SAR systems, such as NASA-ISRO Synthetic Aperture Radar (NISAR), that will produce InSAR coherence products. The increase in the number of SAR systems will also improve the revisit time of SAR data over dynamic wetland areas. This will consequently enhance wetland hydroperiod studies. Thus, continued development of InSAR coherence data for wetland hydroperiod analysis is of great importance. Therefore, the Seninel-1 coherence products were used in this study to:
- (1)
- Determine the optimum coherence threshold value for separating flooded and non-flooded vegetated Canadian wetlands;
- (2)
- Generate biweekly maps of flooded wetlands for the entire Alberta during the snow-free period from 2017 to 2020;
- (3)
- Produce inundation frequency maps for Alberta and determine the wetland hydroperiod for the entire study period and each individual year;
- (4)
- Examine hydroperiod trends across Alberta over four years.
2. Material and Method
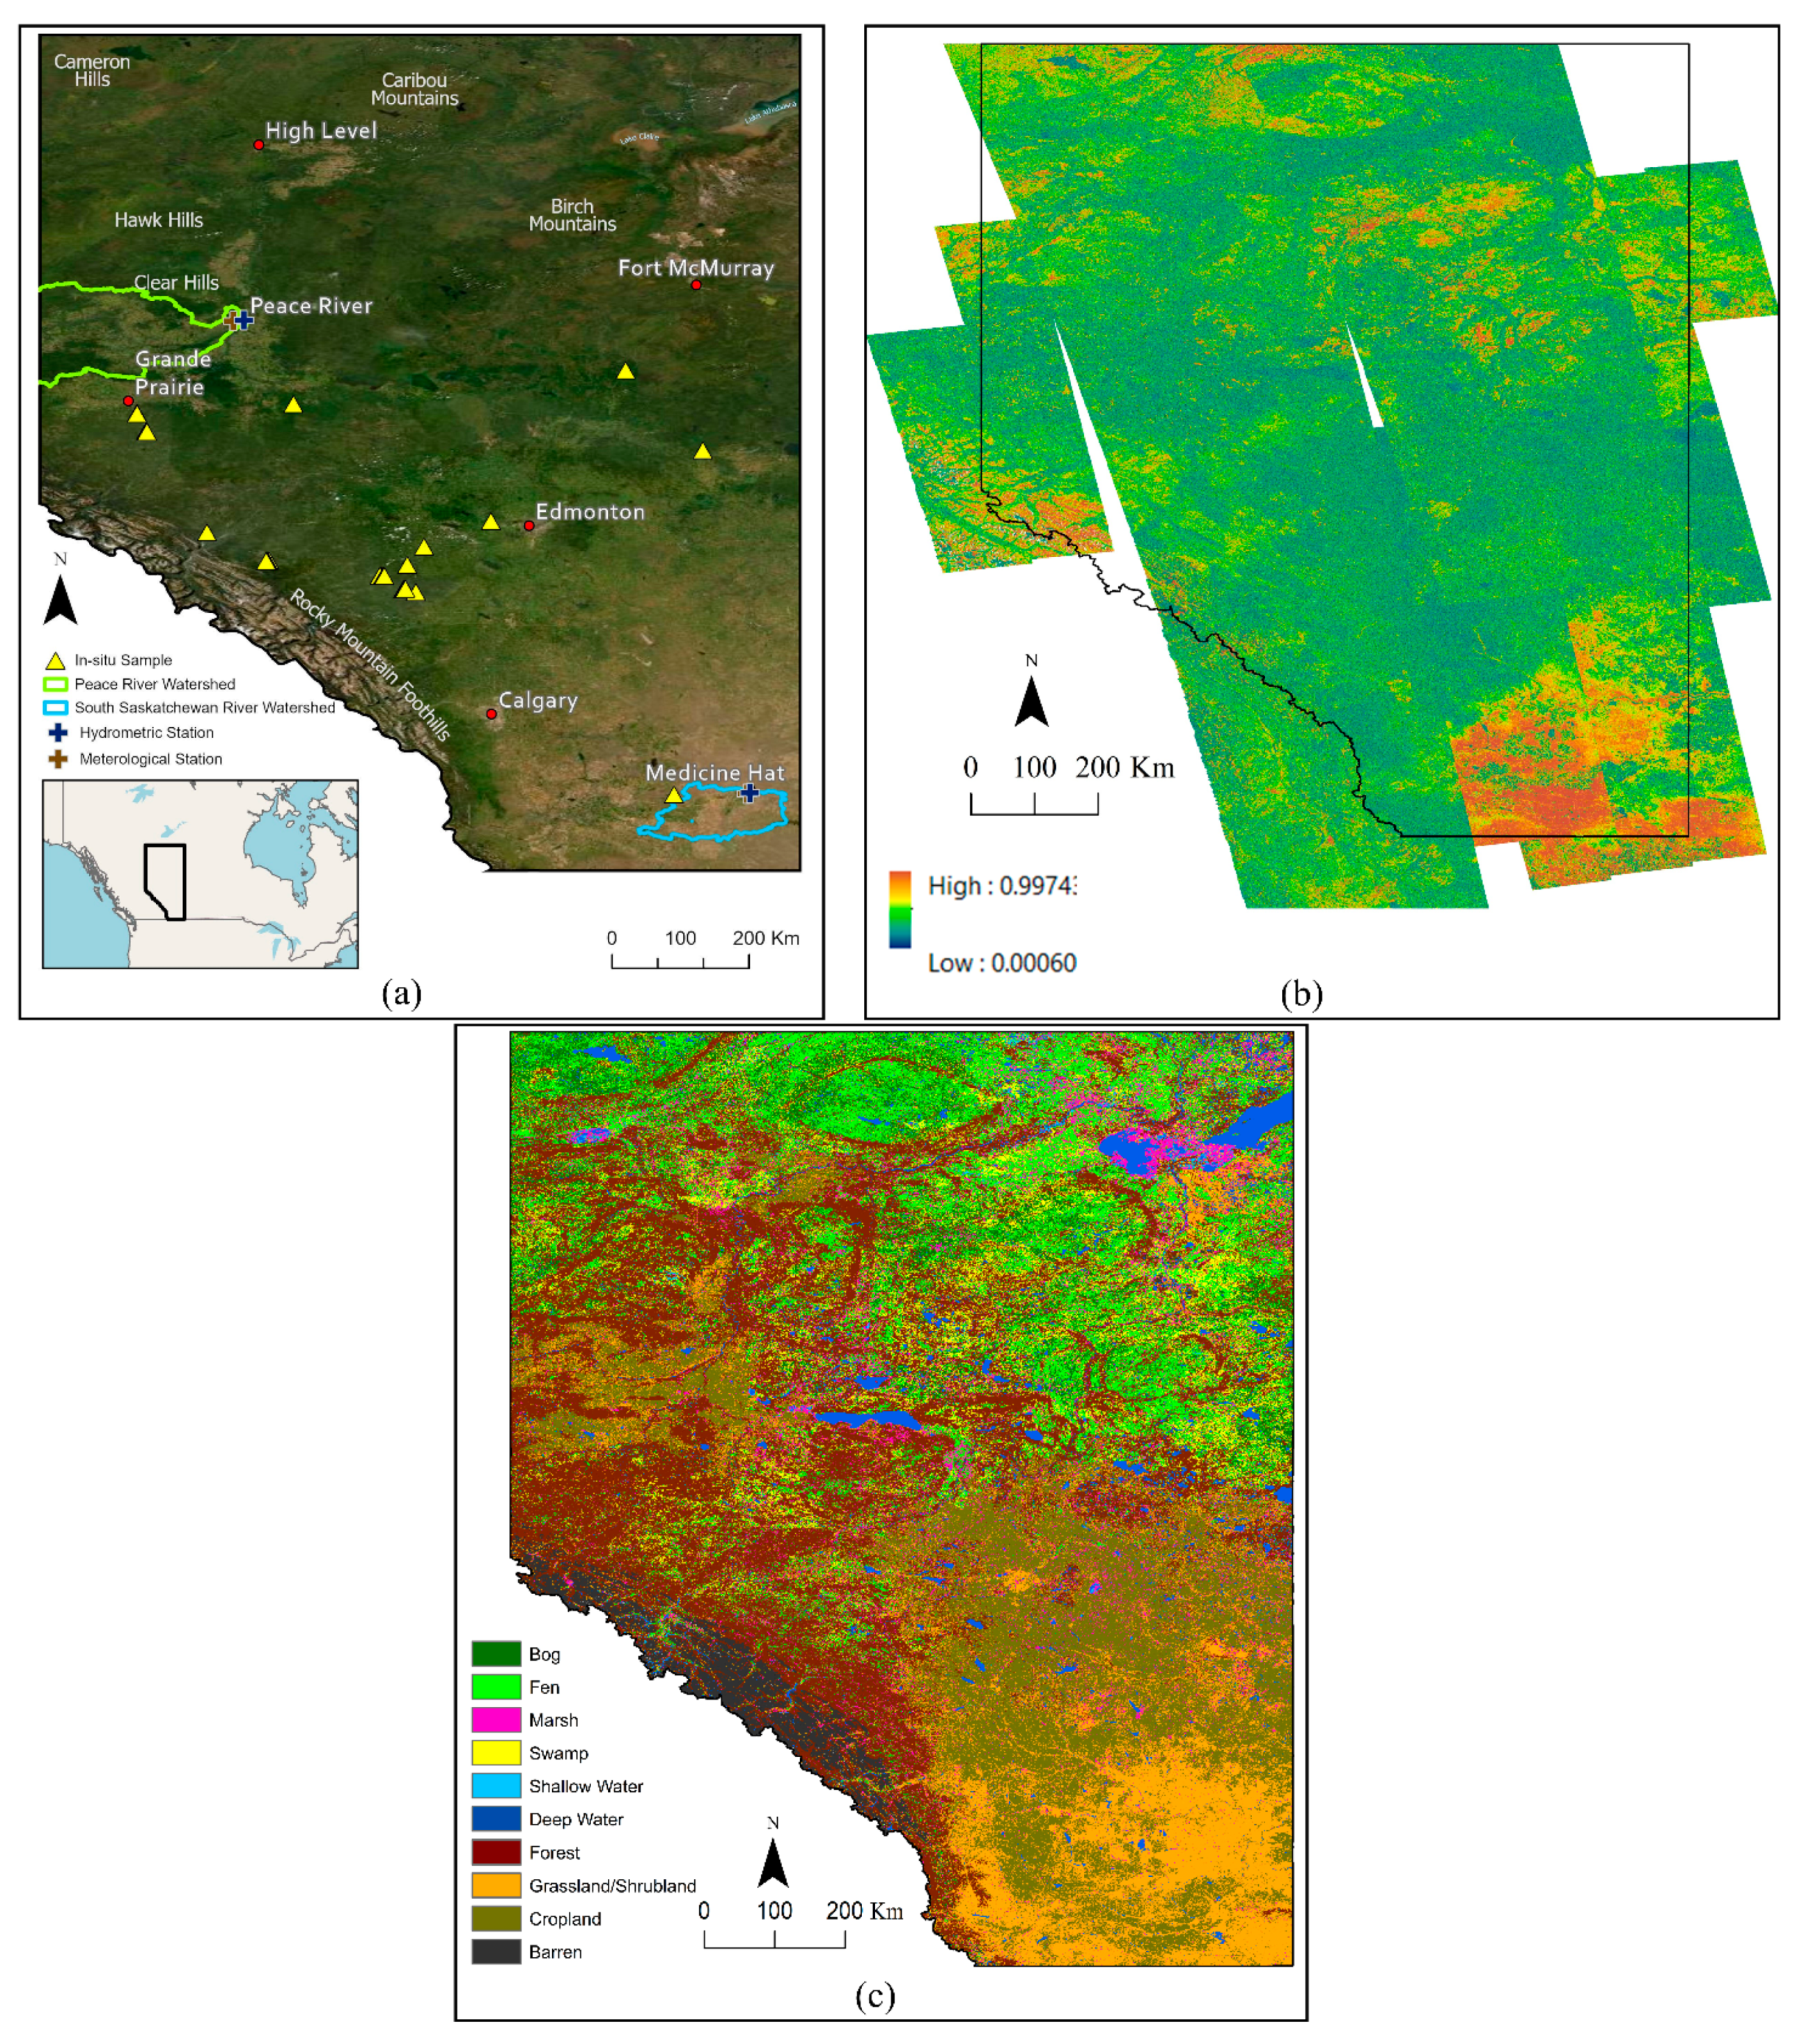
In this section, the study area (Figure 1a) and various datasets (Figure 1a–c) that were used in this study are described. Moreover, the methodology to use coherence data for assessing a wetland hydroperiod are explained in Section 2.5.
2.1. Study Area
The study area constituted the entire province of Alberta (~661,190 km2), located within interior western Canada (Figure 1a). During summer and winter, the average daytime temperatures range from 20 °C to 25 °C and from −5 °C to −15 °C, respectively [34]. The province hosts a variety of land covers due to the fact of its large extent and latitudinal gradient, occurring between 49°N and 60°N. For example, the southern portion of the province is characterized by prairie and parkland landscapes, with the northern portion being part of the boreal forest of North America and the west forming part of the Rocky Mountains. The prairie regions are mainly covered by pastures, cropland, and urban areas and is known for its pothole topography [35]. Small shallow water bodies and marshes are the dominant wetland classes, which experience frequent changes in water level and extent [18]. In the boreal regions, peatlands dominate the wetland areas which cover significant portions of the region, with non-wetland areas covered by forests and other anthropogenic activities such as oil and gas extraction [33]. Wetlands are uncommon within the Rocky Mountains [19,36].
2.2. In Situ Data
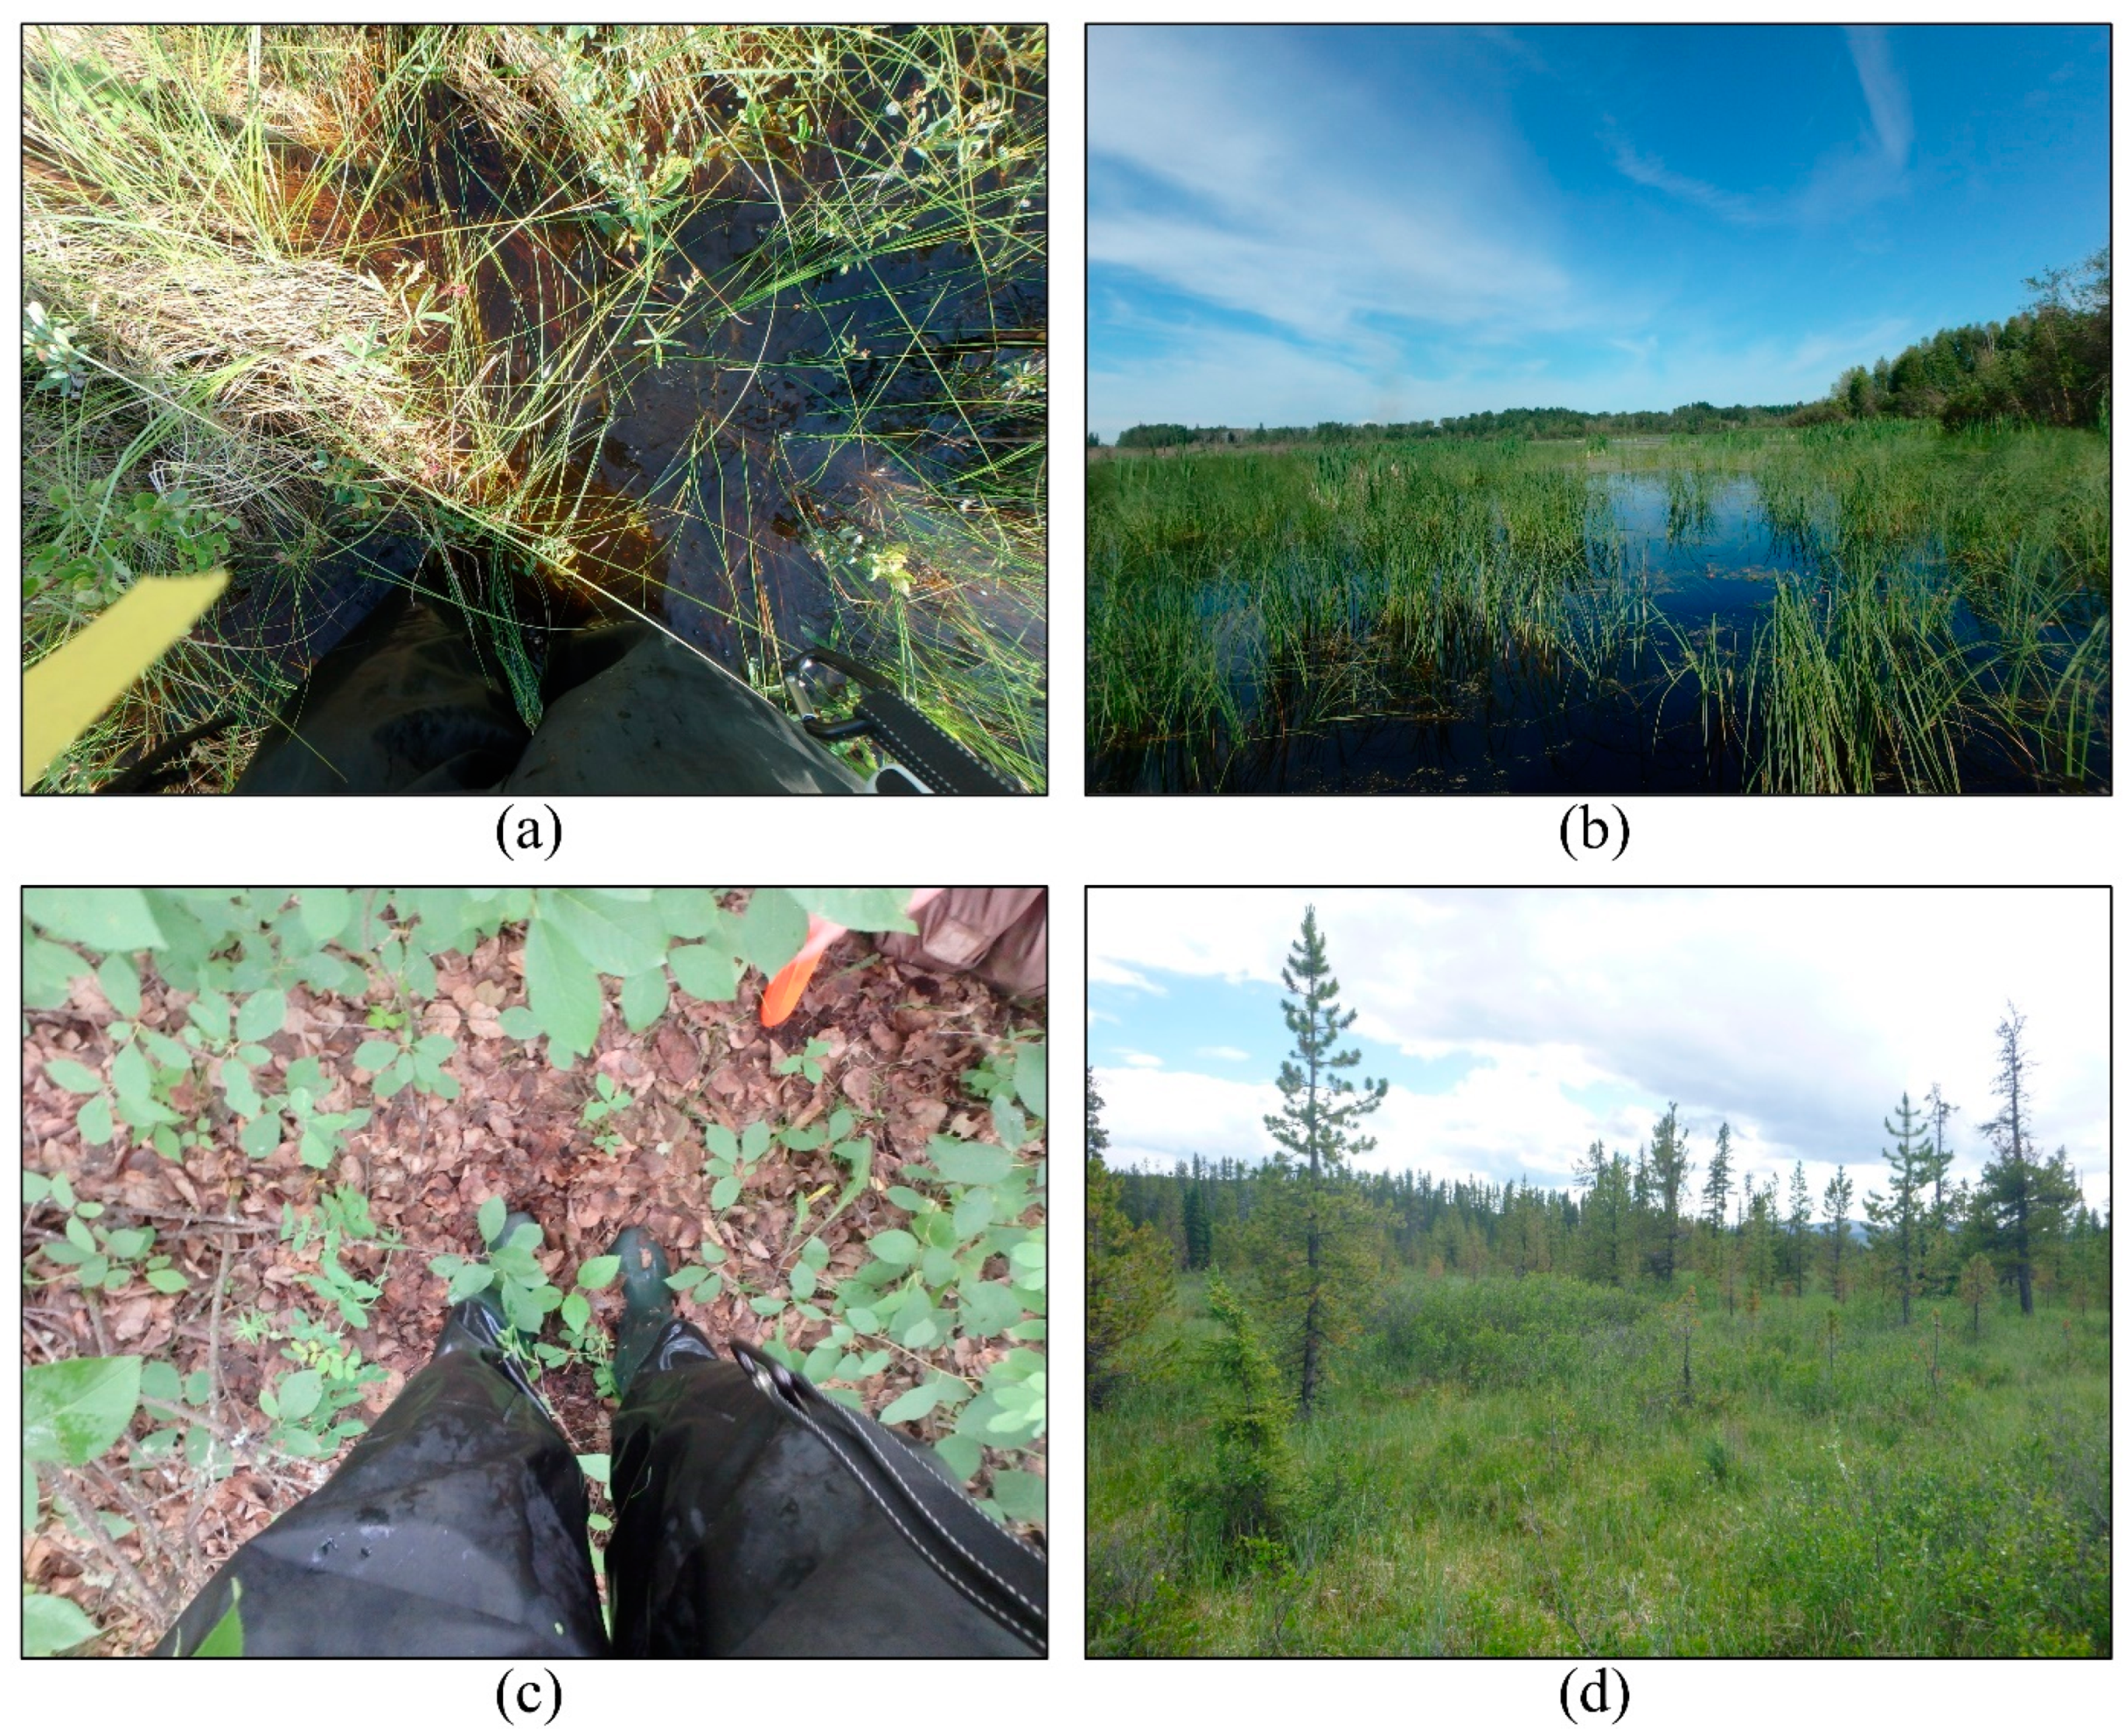
In this study, the in situ data of the locations of flooded and non-flooded wetlands, which were collected by the Alberta Biodiversity Monitoring Institute (ABMI), were employed. The distribution of in situ data is demonstrated in Figure 1a. Initially, 40 and 28 samples of flooded and non-flooded wetlands (see Figure 2 for examples), respectively, were used to select the optimum coherence threshold value for flooded wetlands (see Section 2.5.3). These samples were called training samples. Then, 10 and 9 independent samples of the flooded and non-flooded wetlands (called test samples) were applied to assess the accuracy level of the selected threshold values. It is worth noting that all in situ samples were collected from various types of wetlands and, thus, they represented various wetland types in the province, though not all types present on the landscape.
2.3. Coherence Products
Ref. [30] produced biweekly InSAR coherence products from five tracks of Sentinel-1’s orbits (600 maps in total), which can effectively be used for hydroperiod mapping. They generated these products using Sentinel-1 C-band SAR data, acquired between 2017 and 2020. The interferometric wide (IW) swath mode in the VV polarization with a spatial resolution of 5 × 20 m (single look complex (SLC) data) was utilized. Ref. [30] co-registered the 12 day Sentinel-1 InSAR pairs to produce these coherence maps. Approximately, 4% of the study area was not covered by same-date acquisition tracks and, thus, coherence was not derived for these areas. Figure 1b shows an example of these coherence products. In this study, the biweekly coherence products between May and October for the four years of 2017–2020 were employed. Thus, 48 coherence products from Alberta were applied to the hydroperiod analysis.
2.4. Alberta-Wide Wetland Map
Wetland maps of Alberta were produced in Ref. [33] using Landsat imagery for 16 time periods from 1984 to 2020. The maps were developed in GEE using an object-based random forest model and achieved overall accuracies and class accuracies generally above 87% and 80%, respectively. In this study, the classified maps for 2017–2018 and 2019–2020 were combined (Figure 1c) and used to identify vegetated wetlands (i.e., bog, fen, marsh, and swamp), open water (deep and shallow waters), and upland areas (i.e., forest, cropland, grassland, shrubland, and barren) across the province. Based on the produced wetland map, approximately 28% of the province was covered by vegetated wetlands and open water, leaving 72% composed of non-wetlands.
2.5. Methodology
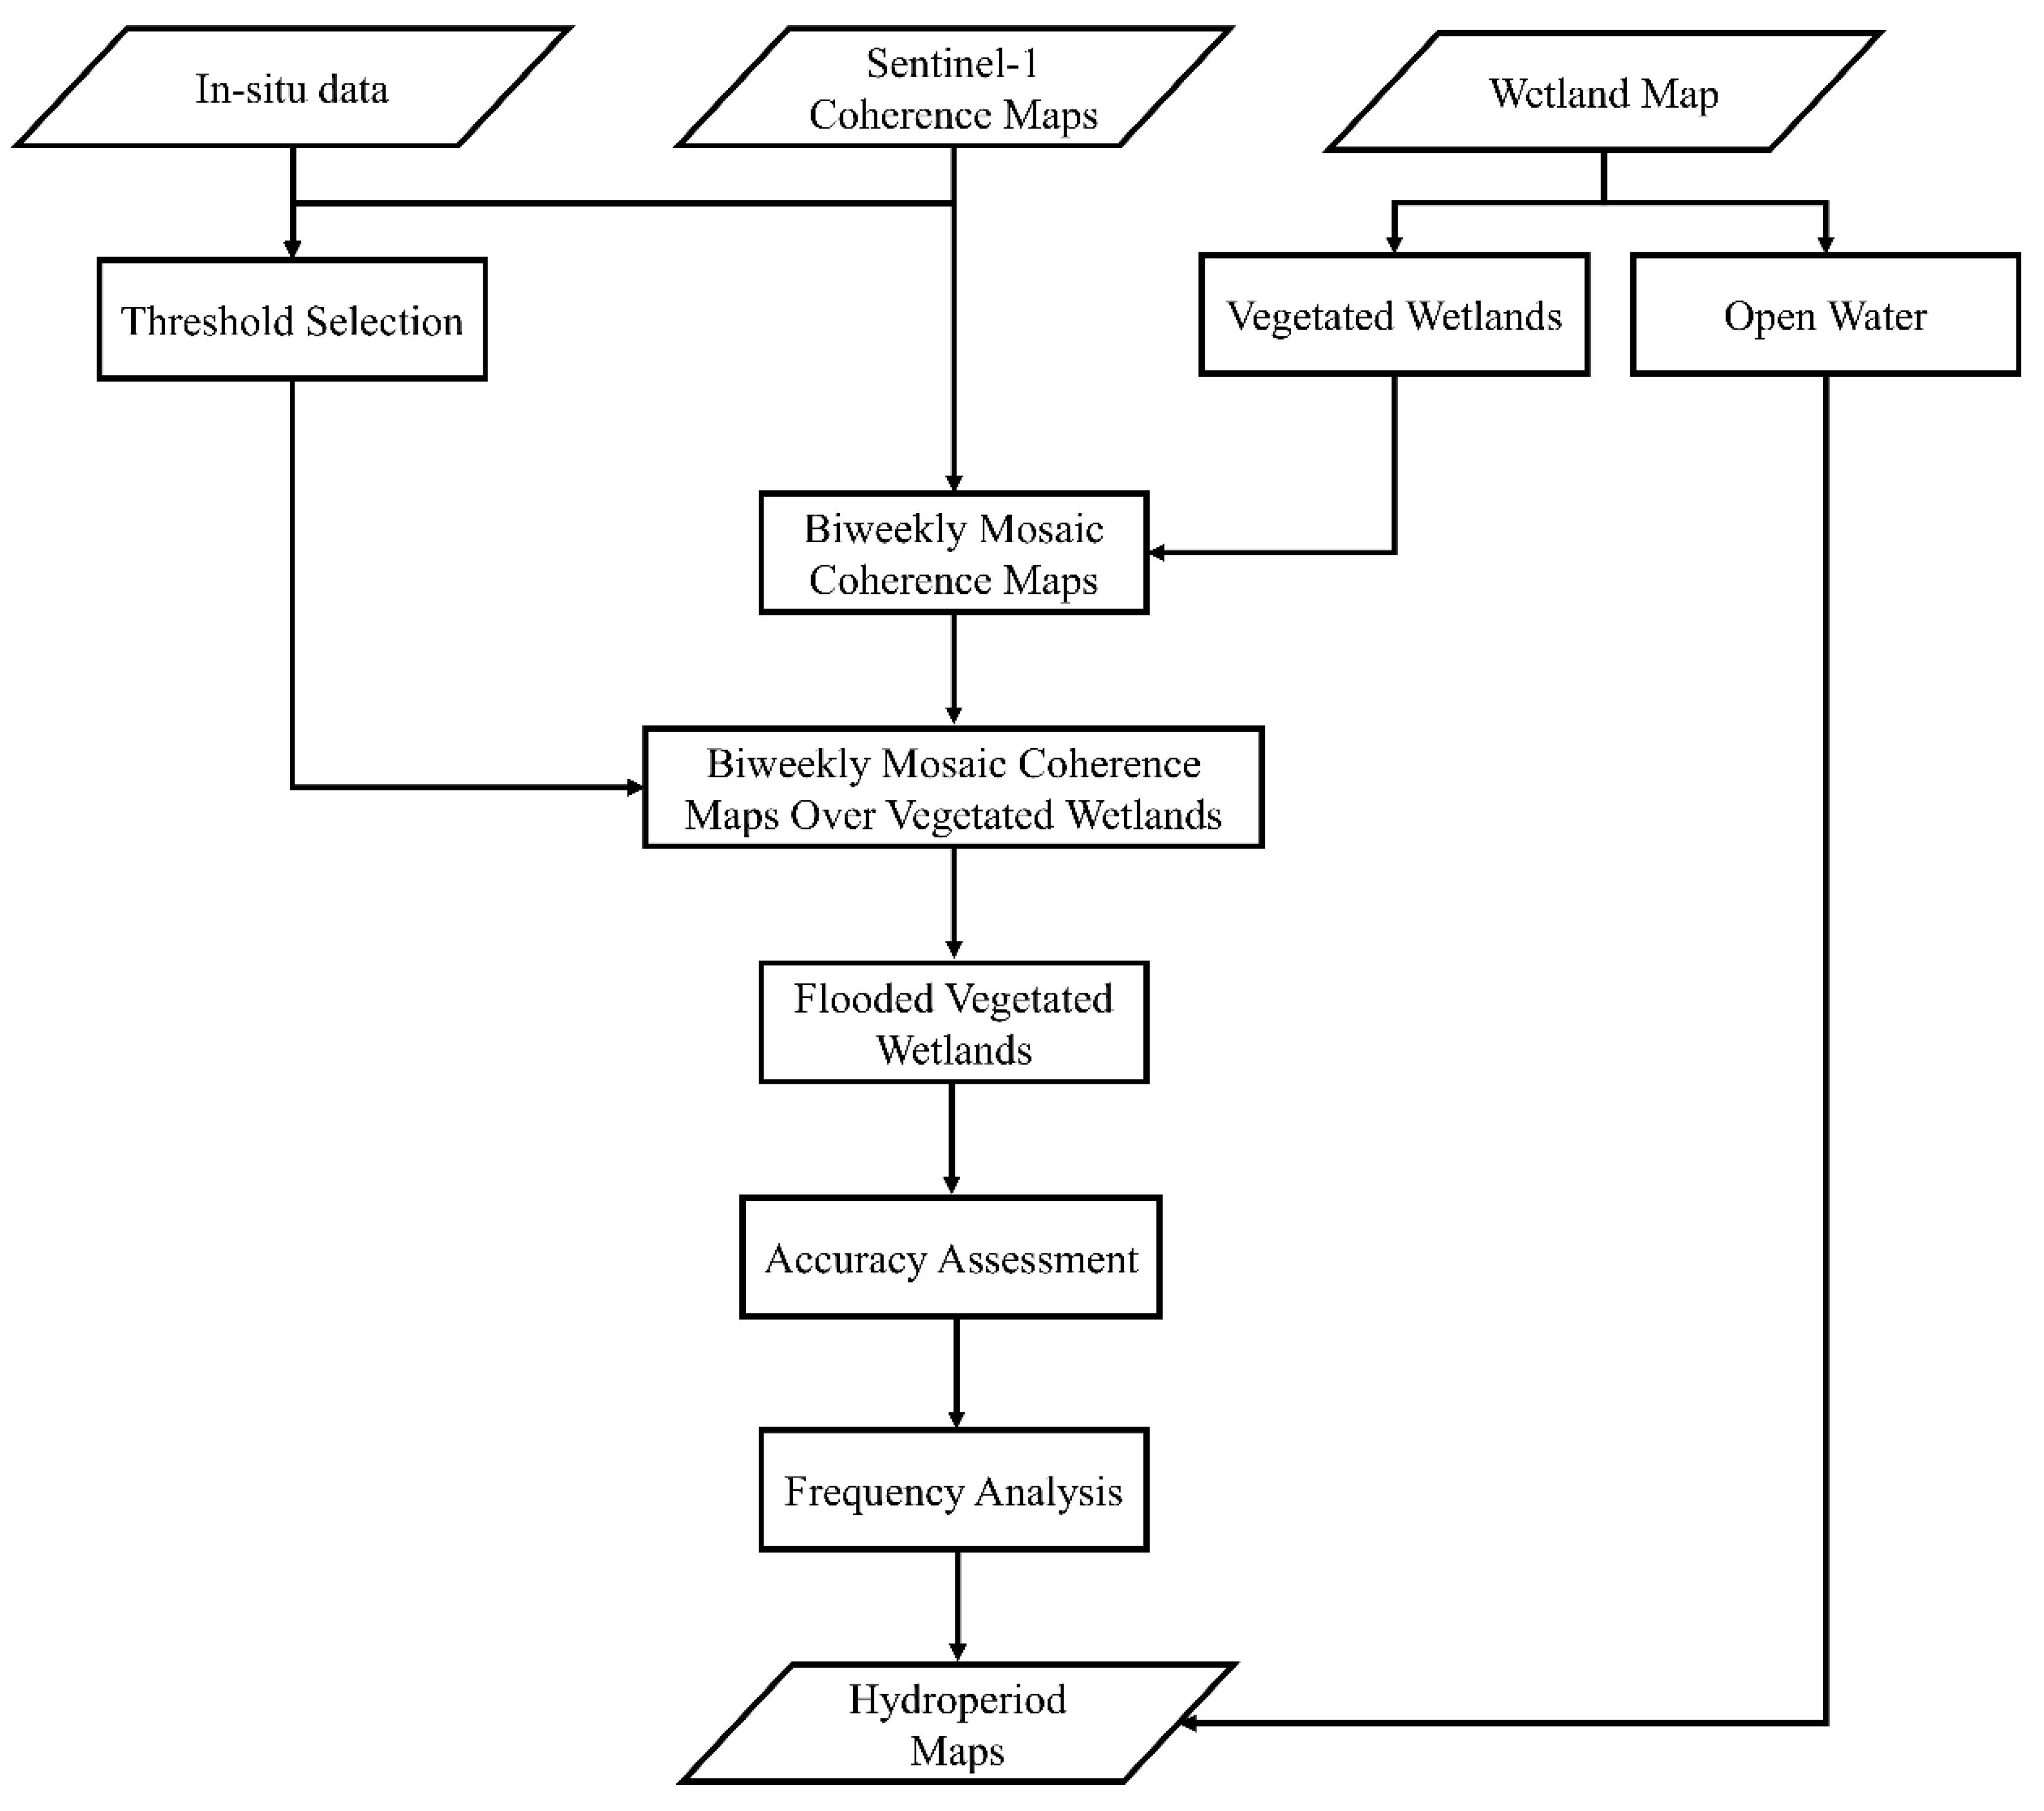
Figure 3 demonstrates the proposed method for wetland hydroperiod analysis using coherence data. The details of the different steps are discussed in the following subsections.
2.5.1. Masking Vegetated Wetlands and Open Water
The main objective of this study was to analyze the hydroperiod of wetlands. Thus, the vegetated wetlands (i.e., bog, fen, marsh, and swamp), as well as open water, were initially masked from the Alberta-wide wetland inventory map (Figure 1c). The hydroperiod analysis was only conducted over these masked areas.
2.5.2. Preparing Biweekly Coherence Mosaic Images
The biweekly coherence products from the five tracks, acquired between 2017 and 2020, were combined to create the biweekly coherence maps for the entirety of Alberta. Then, these maps were masked over the vegetated wetlands and open water areas (see Section 2.5.1). By this, 48 time series maps from 2017 to 2020 were generated and used for hydroperiod analysis.
2.5.3. Selecting Coherence Threshold Value for Flooded Wetlands
One of the main steps in hydroperiod assessment is detecting flooded areas. Although this is relatively simple using optical satellite and SAR data, there is no study that has comprehensively discussed coherence values for wetland hydroperiod analysis through detecting flooded wetlands. Consequently, the coherence values for in situ training samples (see Section 2.2) were extracted and analyzed to select the optimum threshold value for flooded wetlands.
2.5.4. Accuracy Assessment of Flooded Wetland Maps
The independent in situ test samples were first applied to assess the accuracy level of the selected threshold value in identifying inundated wetlands. Moreover, to further assess the accuracy of coherence thresholding for identifying flooded and non-flooded areas, the total area of flooded areas was calculated for vegetated wetlands for each of the 48 coherence maps. High coherence areas not associated with wetlands or due to the fact of human disturbance were masked in the calculations using the produced wetland map and the ABMI’s Human Footprint Inventory [37], which maps human activities across the entire province. To this end, portions of two representative watersheds were selected to assess the relationships between the mapped flooded areas and downstream river discharge, precipitation, and temperature (see Figure 1a for the locations of the hydrological and meteorological stations). The headwater sub-basins making up the Alberta portion of the Peace River watershed were selected to represent the landscape in the northern portions of the province, while the sub-basins constituting the South Saskatchewan River headwaters were chosen to represent the southern portion. The Peace River flows through the boreal forest which hosts extensive peatland complexes, whereas the South Saskatchewan River watershed is characterized by an expansive area of shallow wetlands known as potholes.
Daily discharge data were downloaded from the Environment and Climate Change Canada (ECCC) data portal for 2017 to 2020 from hydrometric stations along the watershed’s major watercourse and immediately downstream of the headwater sub-basins (i.e., the Peace River measured at Peace River and South Saskatchewan River measured at Medicine Hat). These locations were selected to minimize the influence of other hydrological processes (e.g., groundwater and human use) on assessing the relationship between flooded areas of downstream discharge. Precipitation and temperature measurements were also acquired from the ECCC data portal at meteorological stations located near the hydrometric stations in Peace River and Medicine Hat.
2.5.5. Wetland Hydroperiod Analysis
The selected optimum threshold value was applied to the biweekly coherence maps to produce a total of 48 (12 per year) wetland inundation maps for the province of Alberta. Then, two types of hydroperiod maps were produced:
- (1)
- Percentage hydroperiod map for the entire four years: the percent frequency of inundation was calculated for wetland areas based on the number of times an area was identified and mapped as flooded (i.e., coherence was more than the selected threshold value in each of the 48 maps), where 100% and 0%, respectively, represent permanently flooded areas and areas that were never flooded (i.e., coherence was always less than the selected threshold value) from 2017 to 2020.
- (2)
- Annual hydroperiod classification: For each year (12 maps), the hydroperiod classification was produced based on the number of flooded times, where 0, 1–2, 3–7, 8–10, and 11–12 instances represent the never flooded, temporary, seasonal, semi-permanent, and permanent classes, respectively. These classes were initially defined in Ref. [38] and were later used in several studies related to wetland hydroperiod analysis [12,17,19,24].
3. Results
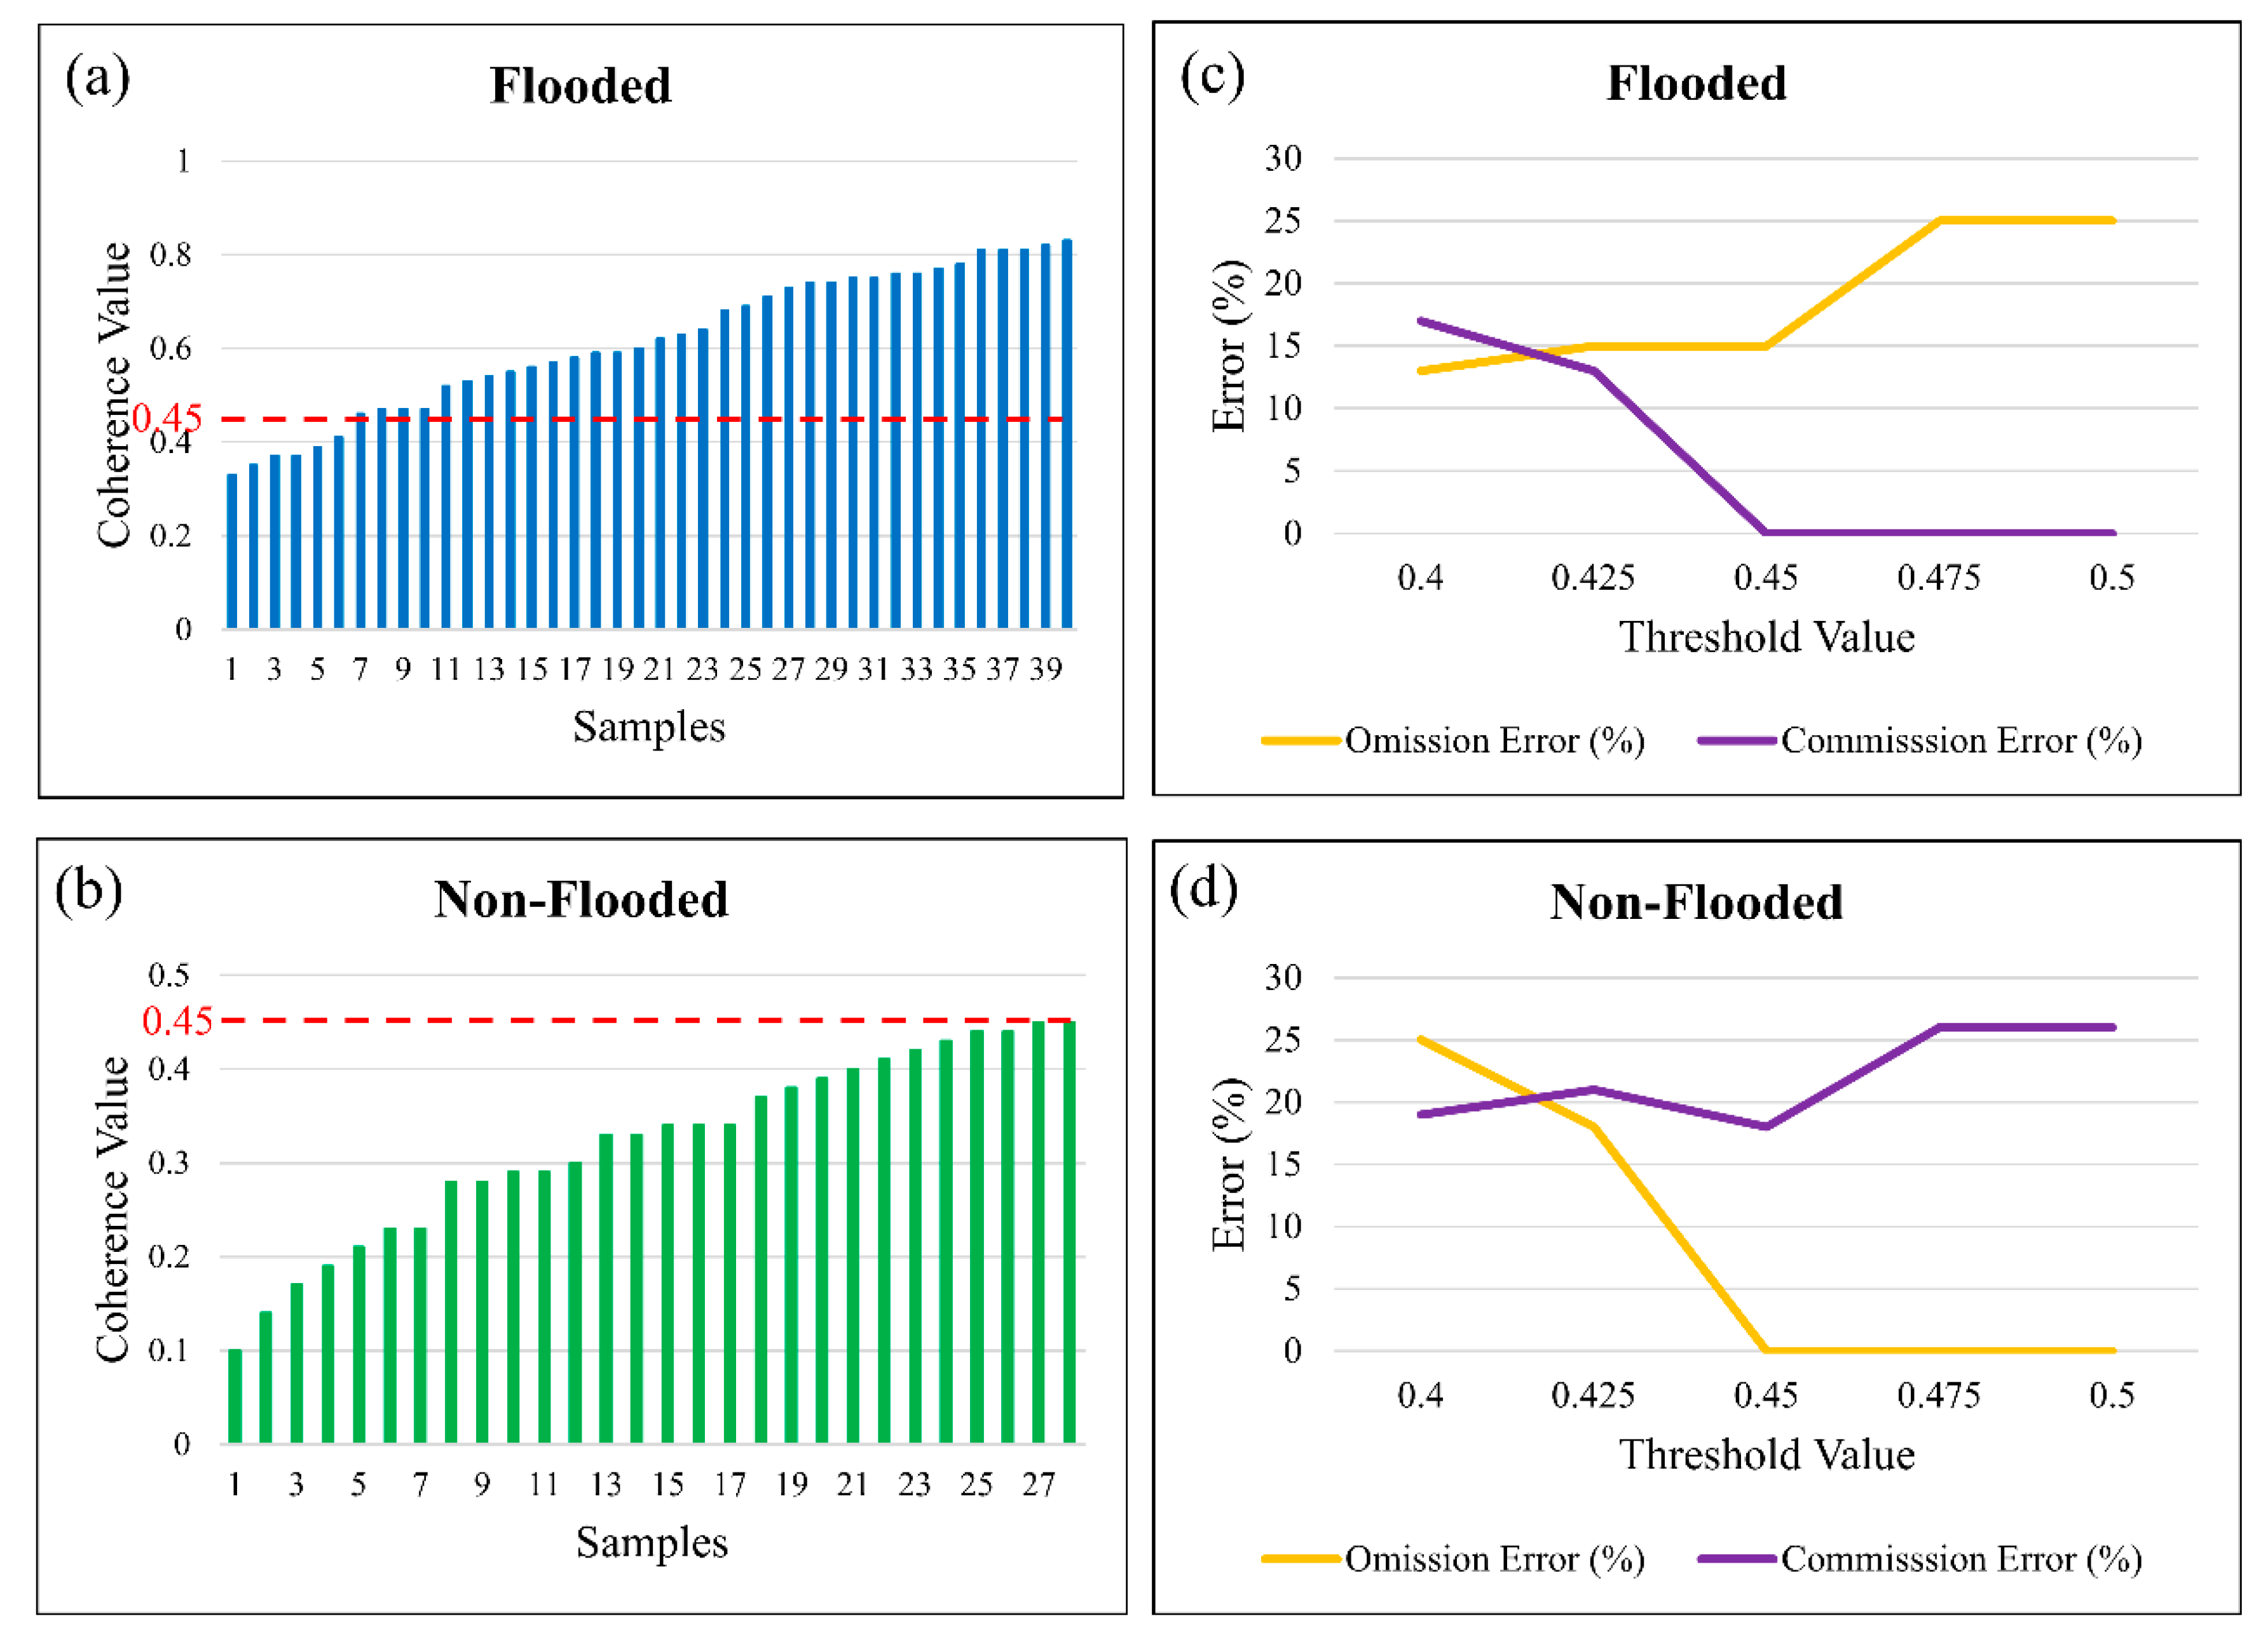
Coherence thresholding was used to identify flooded versus non-flooded conditions on a biweekly basis over the four-year period (see Figure 4 for the results obtained by the training samples). A threshold of 0.45 was selected after examining the coherence values for the in situ training samples with known hydrological conditions. The results showed that all non-flooded sites had coherence values less than 0.45 (omission error = 0).
Moreover, most flooded sites exhibited coherence values greater than 0.45 and up to 0.82, though a small proportion of the flooded sites fell below the selected coherence threshold value and were mapped as non-flooded wetlands. In fact, the value of 0.45 was selected as the optimum threshold value because it resulted in the lowest (second lowest for flooded) omission and commissions errors when used to mask flooded and non-flooded wetlands. This was also observed by analyzing the overall accuracies for different threshold values, where the values of 82%, 84%, 91%, 85%, and 85% were observed for the threshold values of 0.4, 0.425, 0.45, 0.475, and 0.5, respectively.
To evaluate the accuracy of the selected threshold value of coherence (i.e., 0.45), it was applied to 10 and 9 independent sites of the flooded and non-flooded wetlands, respectively (Table 1). The overall accuracy of identifying flooded and non-flooded wetlands using this threshold value was relatively high (84%), indicating the high potential of the coherence maps for mapping inundated wetlands. Overall, the results showed that coherence thresholding could effectively be used to map flooded wetlands over large areas such as the province of Alberta.
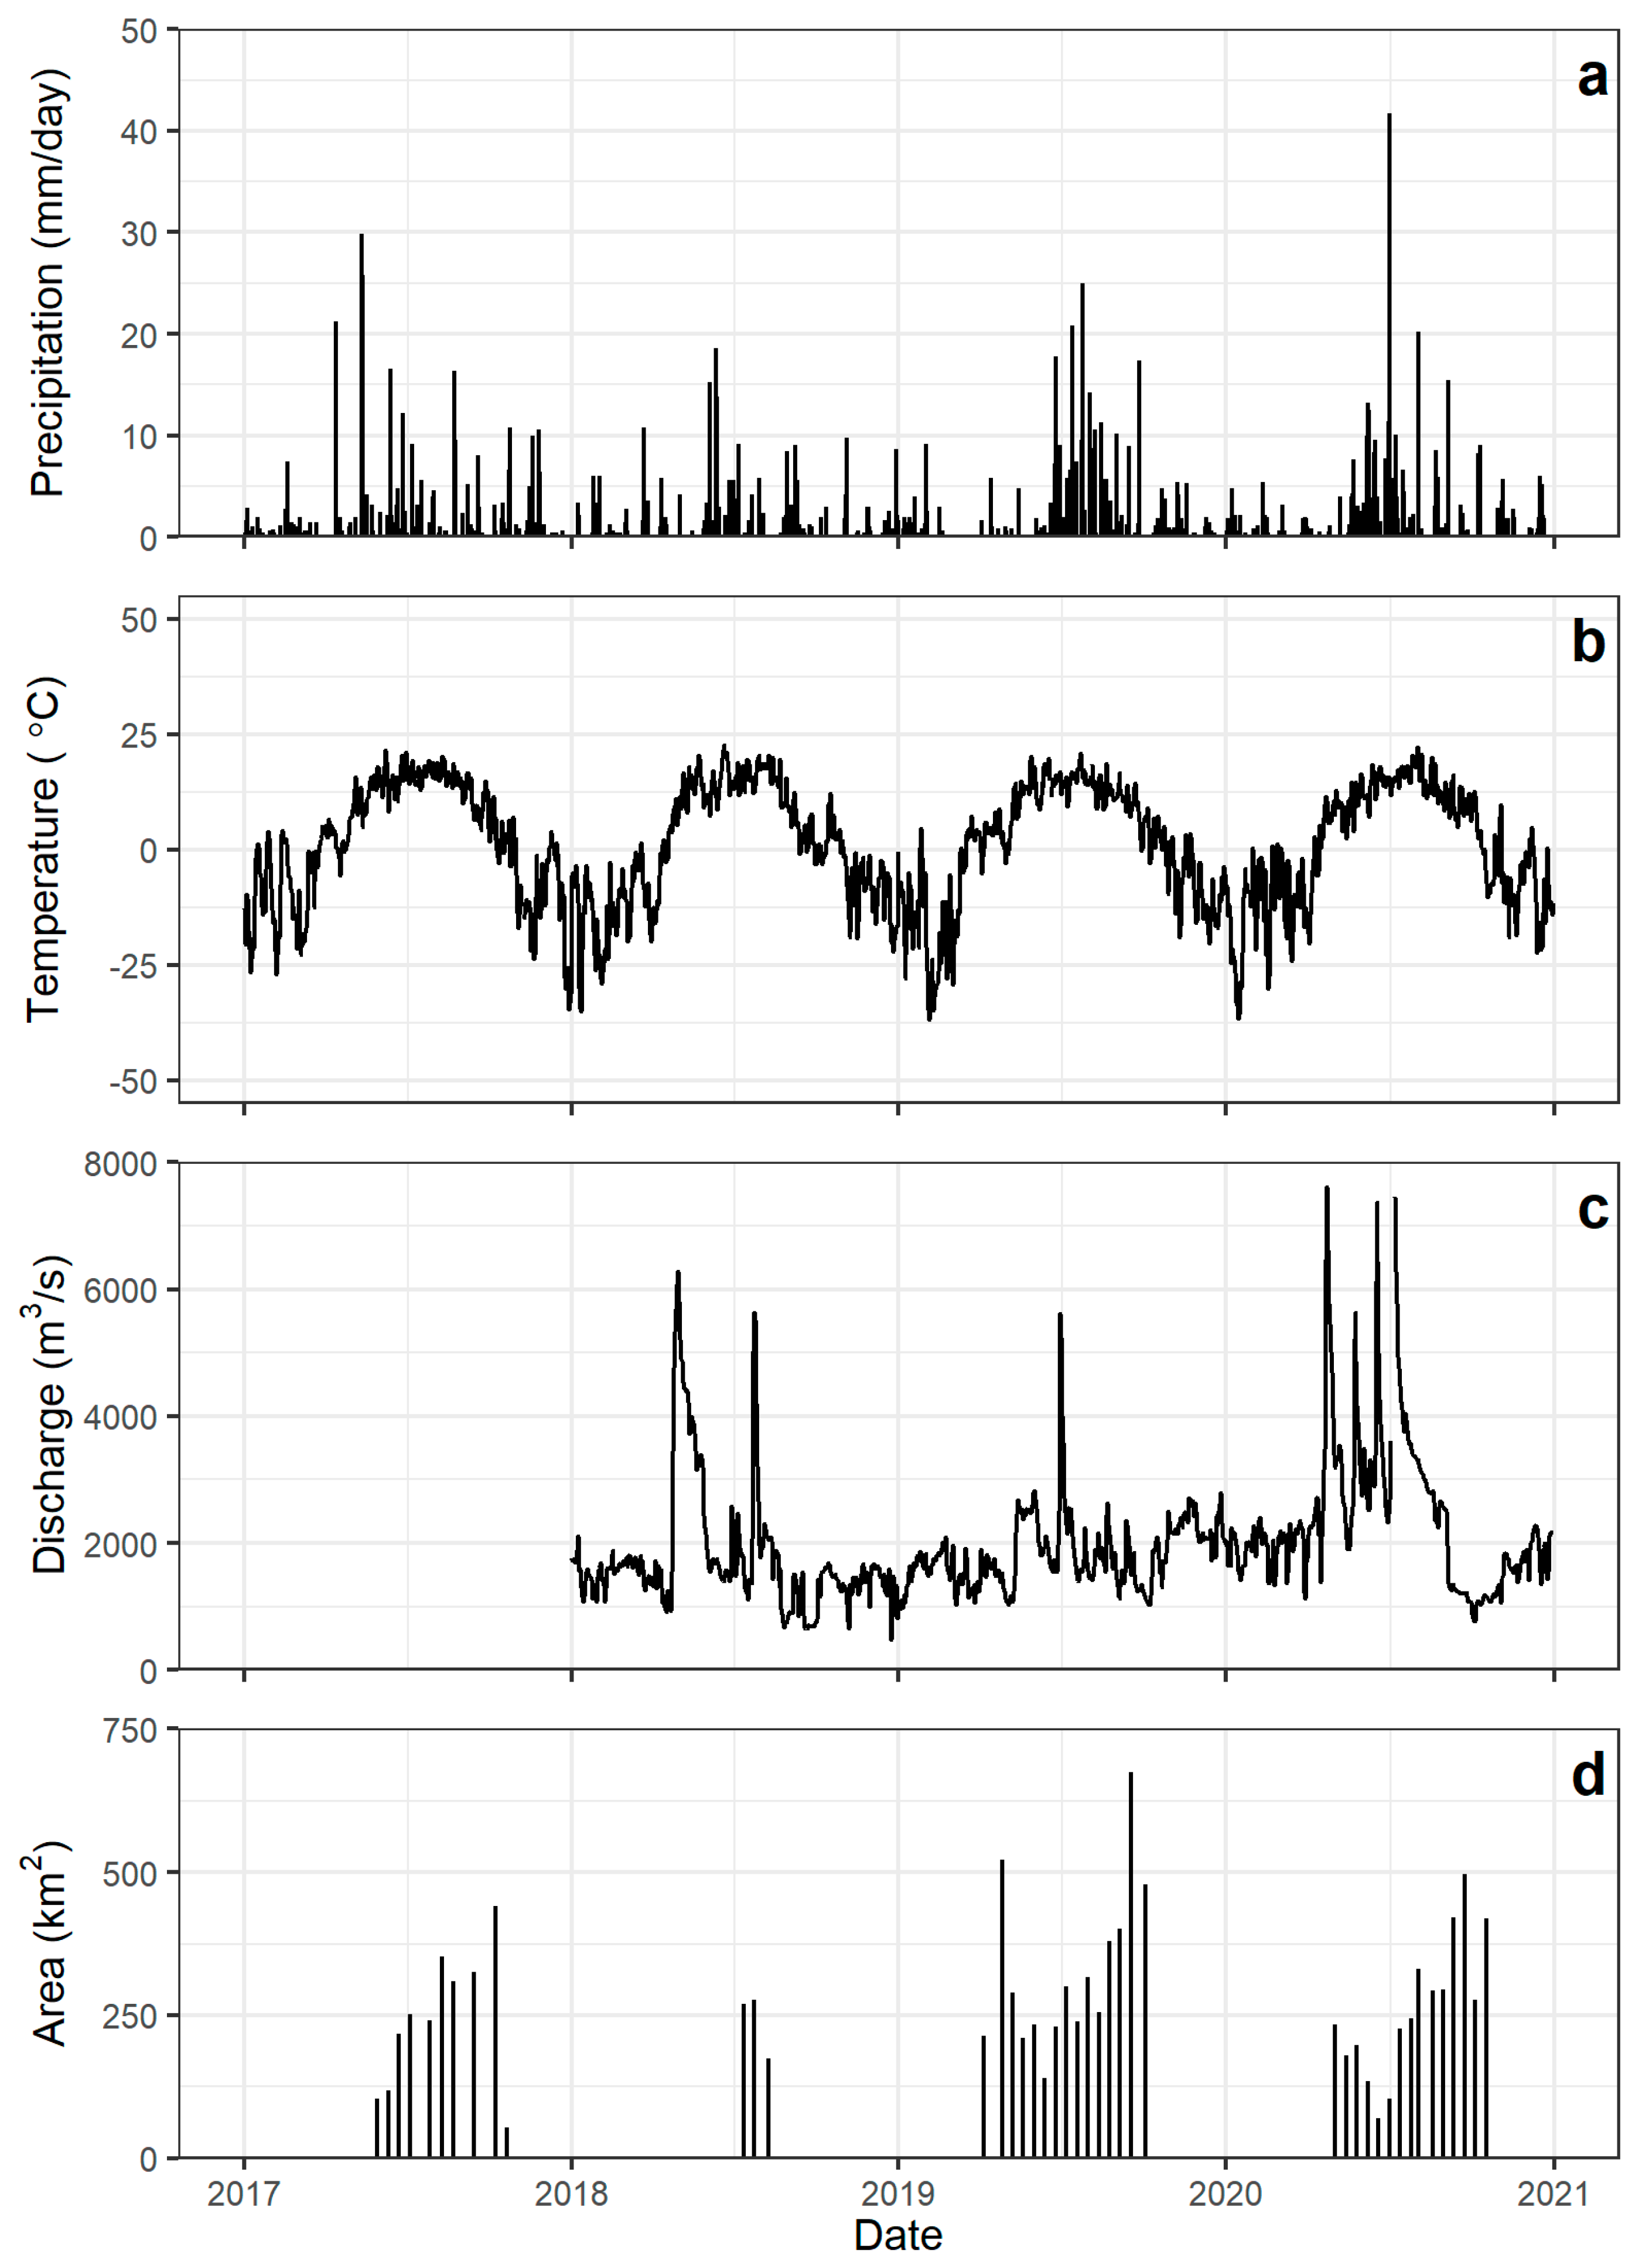
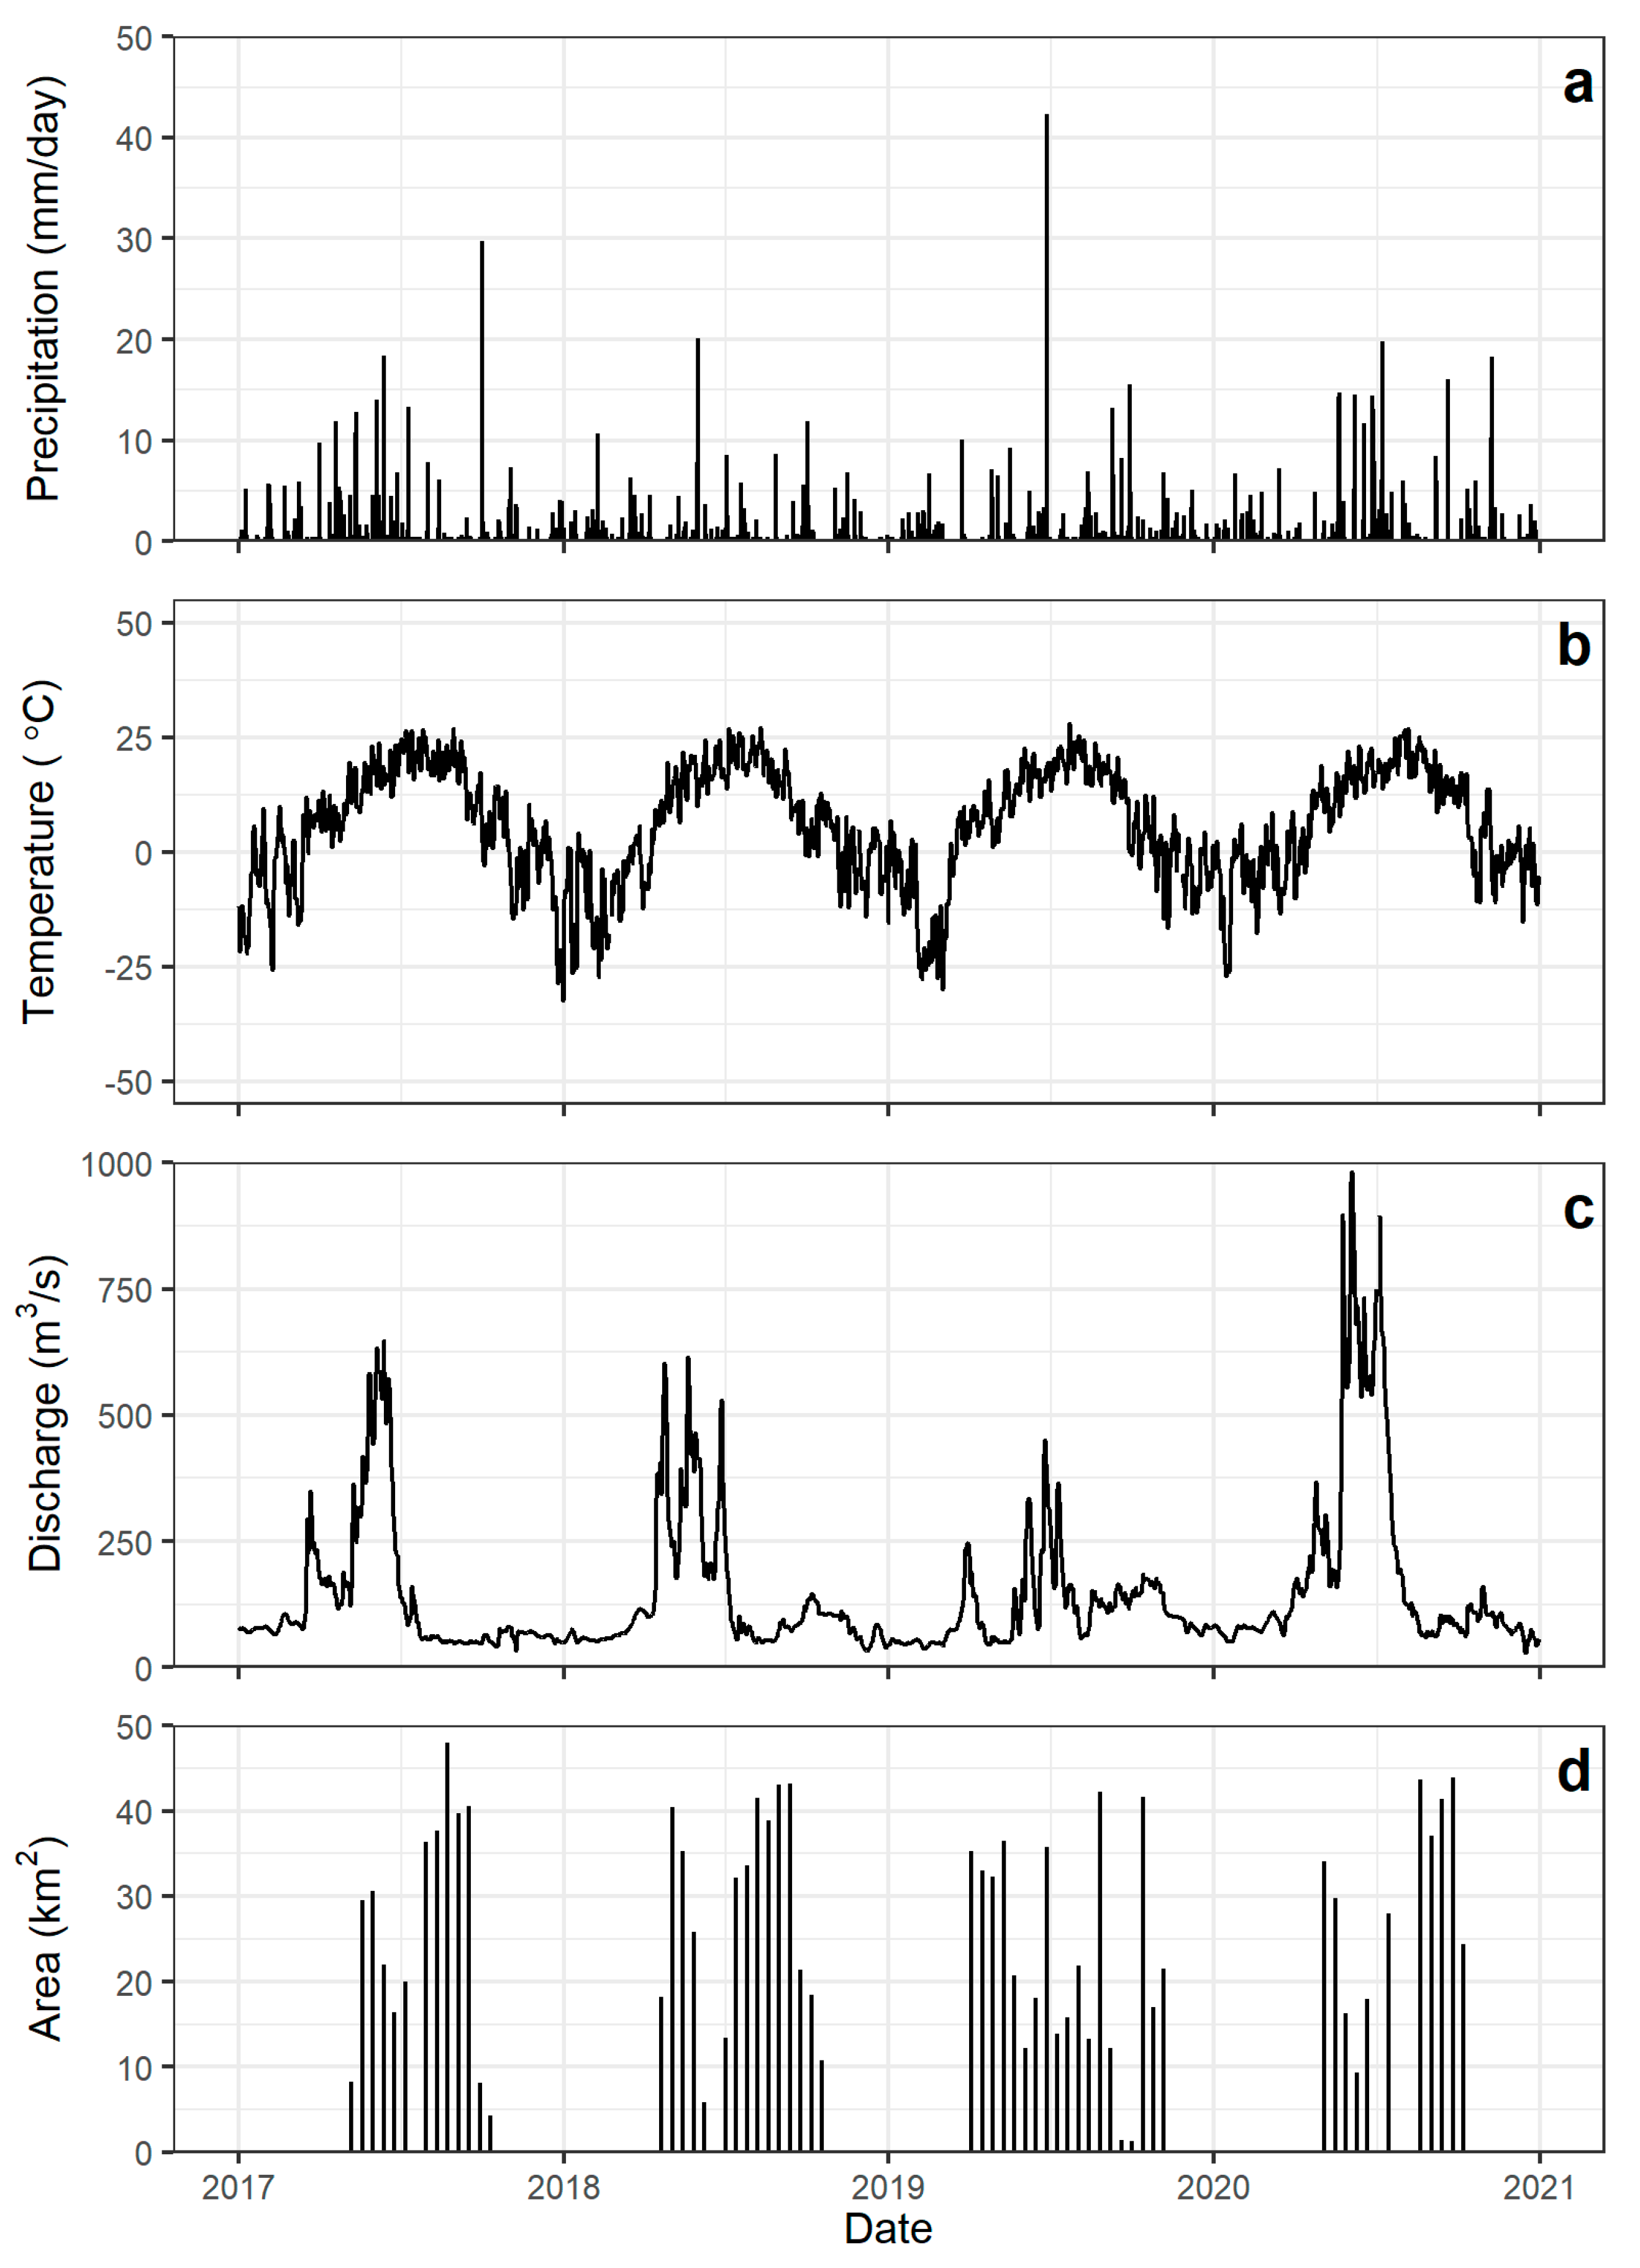
The selected optimum threshold value was applied to 48 coherence maps to identify flooded and non-flooded areas. Flooded areas for the Peace River and South Saskatchewan River sub-basins along with precipitation, temperature, and downstream river discharge data are illustrated in Figure 5 and Figure 6, respectively. Flooded areas followed trends similar to the recorded discharge for both the Peace River and South Saskatchewan River. Discharge from the South Saskatchewan River at Medicine Hat and flooded areas within the basin both slightly decreased from 2017 to 2019 and then increased in 2020. Discharge from the Peace River generally increased from 2018 to 2020. Flooded areas over the same period increased from 2018 to 2019, though they decreased in 2020. River discharge was not recorded at the Peace River hydrometric station in 2017.
A regression analysis found a moderate negative relationship between flooded area and downstream discharge for the Peace River basin (R2 = 0.40, p < 0.05) and no significant relationship for the South Saskatchewan River basin. It was hypothesized that the negative relationship was explained by a time lag between observing the flooded wetland conditions and the water being transmitted into the main watercourse. To assess this, lagged regressions and cross-correlations were additionally computed for each individual year and basin and no consistent pattern across all four years was observed. A positive significant correlation was observed at lag −6 for the South Saskatchewan basin in 2017 and lag −7 in 2018, while no significant correlations were observed in 2019 or 2020. For the Peace River basin, only 2019 and 2020 had enough observations to produce meaningful correlations. A significant negative relationship was found at lag +1 in 2020, with no significant correlation observed in 2019.
Overall, the poor correlations between flooded area and downstream discharge were likely due to the influence of various additional processes that determine downstream discharge over a large area such as hydrological connectivity (e.g., peatlands store water and transmit it slowly, and pothole wetlands are often unconnected, except during high water conditions), human influence (e.g., dams, canals, irrigation, and reservoirs), and antecedent conditions (e.g., size of snowpack and prolonged drought/rainfall). A similar analysis using precipitation measured at each representative meteorological station and derived from satellite data (i.e., PERSIANN-CDR) across the entire basin of interest yielded similar results. Flood maps were produced on a biweekly basis; thus, a relationship between flooded area and discharge or precipitation may be missed in this analysis.
Daily total precipitation, mean daily temperature, daily river discharge, and flooded area per time interval for the Peace River basin (Figure 5) and South Saskatchewan River basin (Figure 6) were instead plotted to confirm that the patterns in observed flooded area generally followed the meteorological and discharge trends observed at the representative stations.
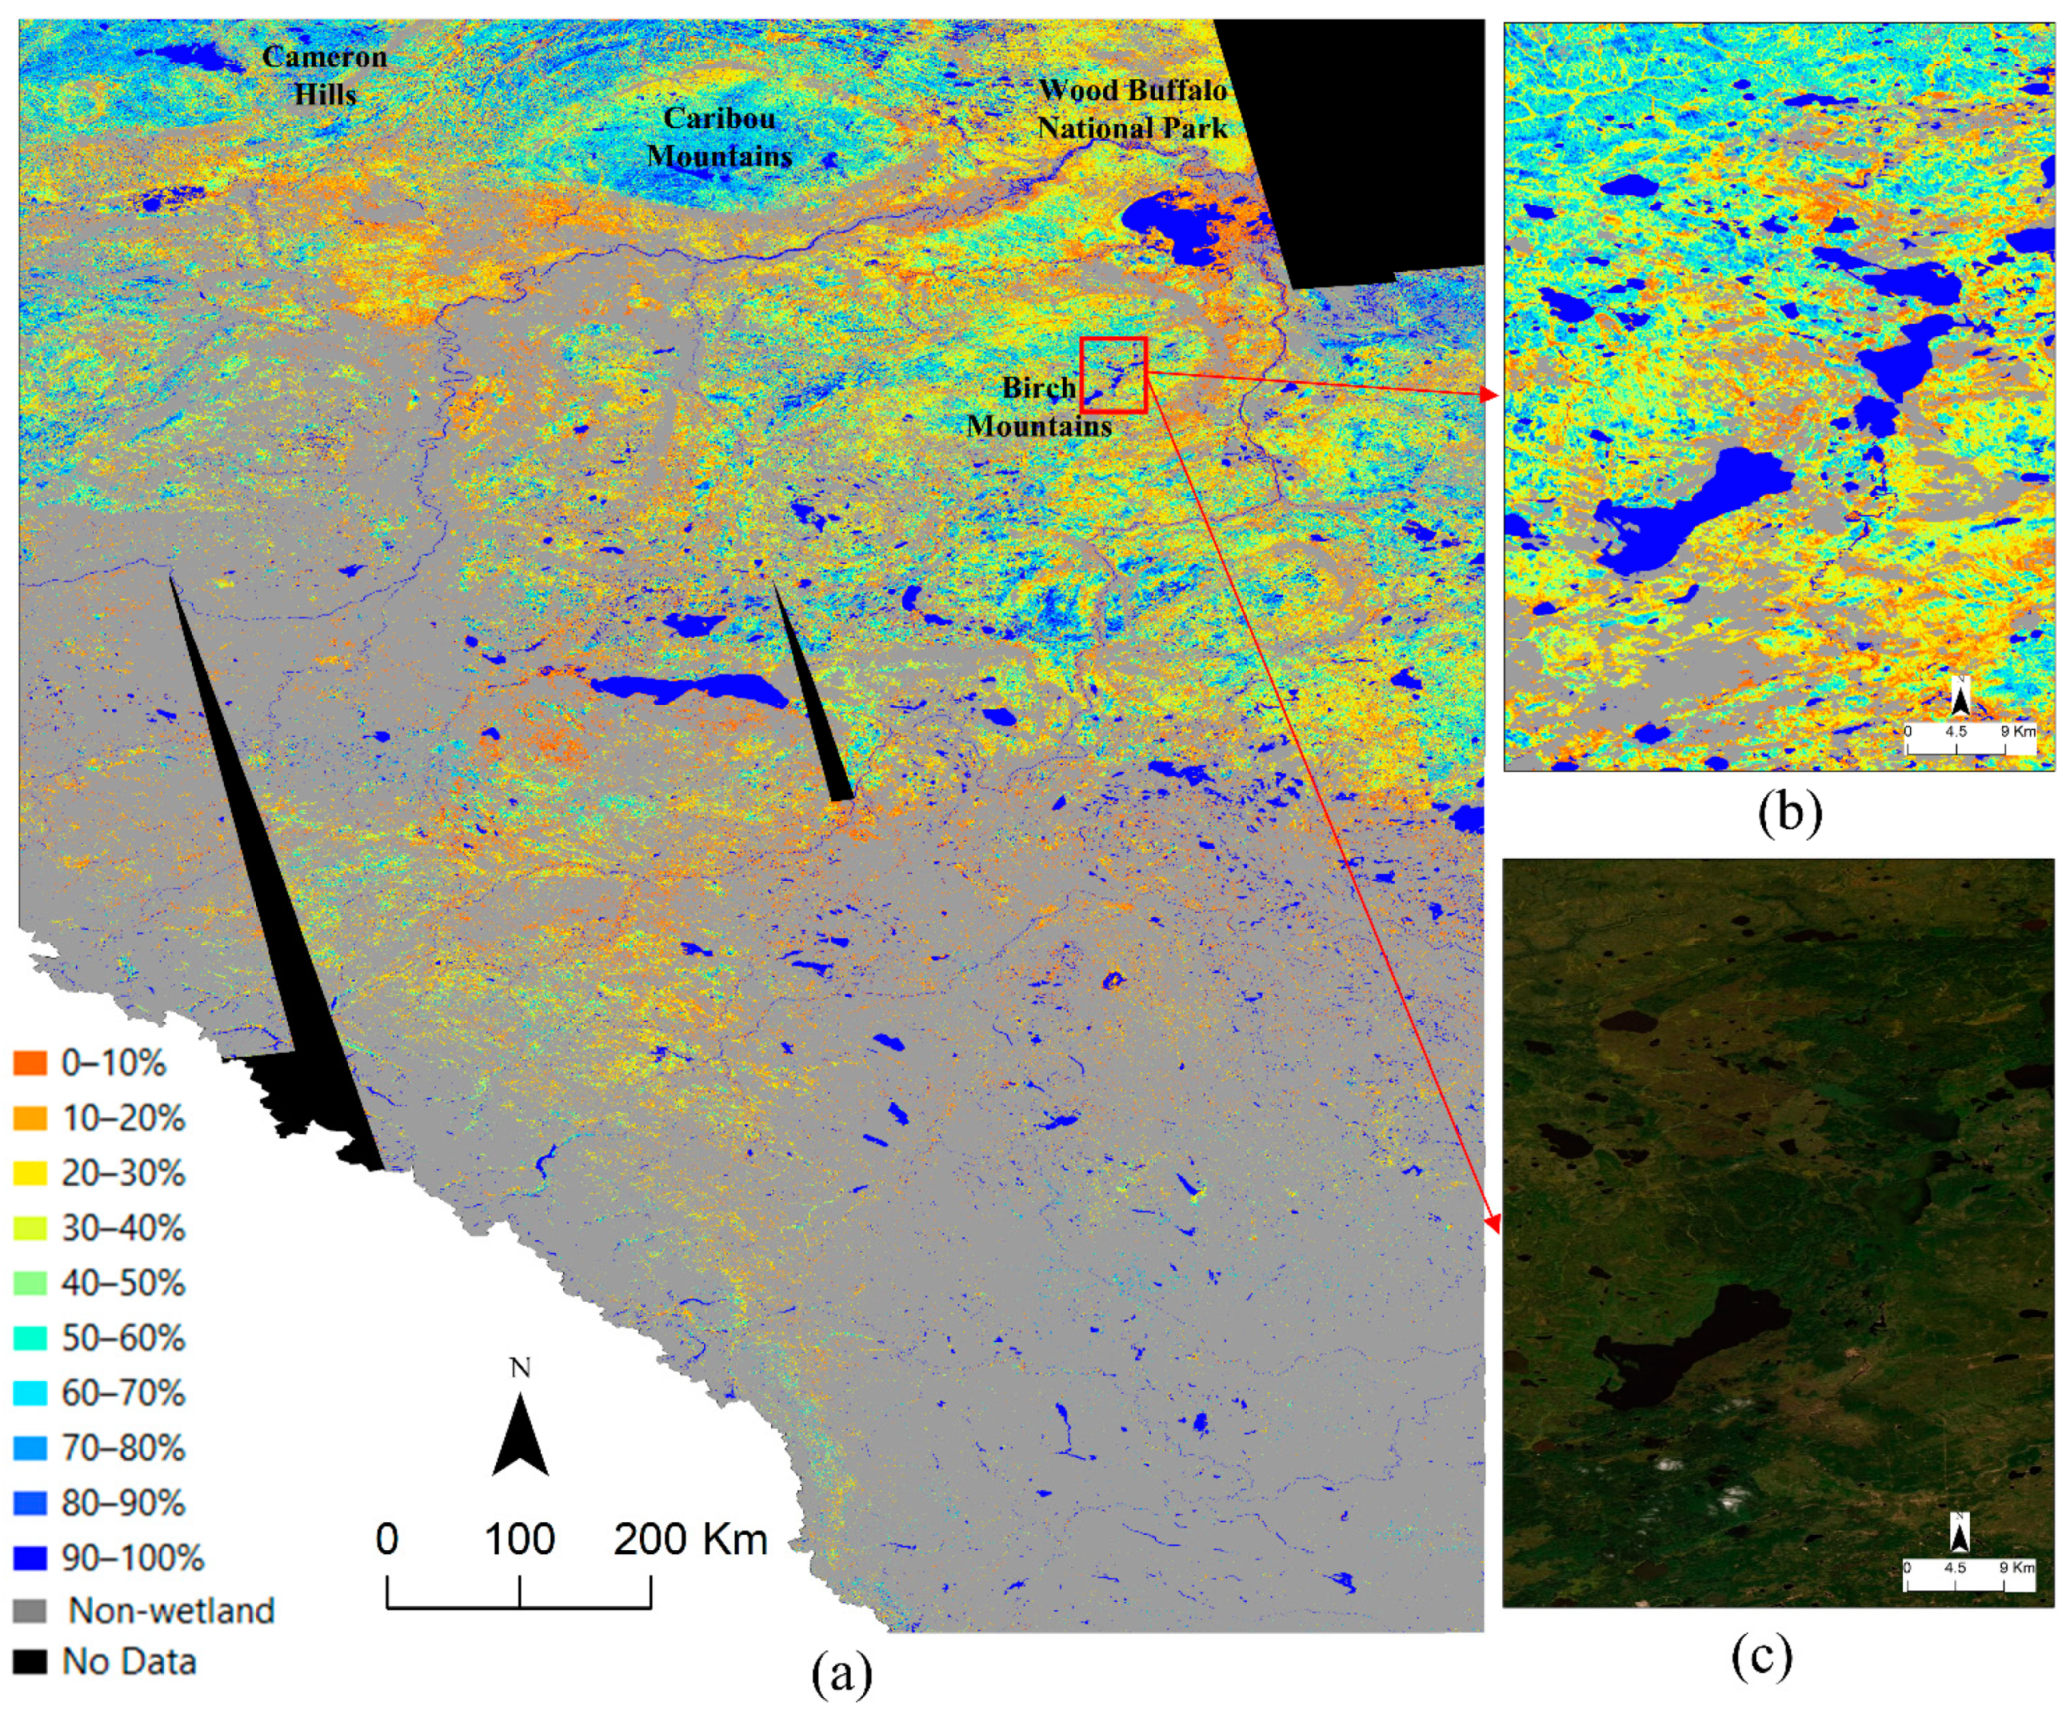
After assessing the accuracy of the flooded and non-flooded areas, they were used for hydroperiod analysis. The Alberta-wide hydroperiod map from 2017 to 2020 is illustrated in Figure 7. The area of each hydroperiod category is also provided in Table 2. Based on the results, most wetlands were flooded for less than 50% of the time between 2017 and 2020. Areas of moderate to higher inundation frequency not associated with open water occurred in the northern portion of the province, particularly in the Cameron Hills, Caribou Mountains, and Birch Mountains regions. Moderate to low inundation frequency was also observed in the eastern portion of Wood Buffalo National Park, where coherence information was available, and other portions of northeastern Alberta, as well as around the town of High Level in the northwest. In southern Alberta, most of the landscape consists of non-wetland areas, though where wetlands exist, they typically exhibit higher flooding frequencies.
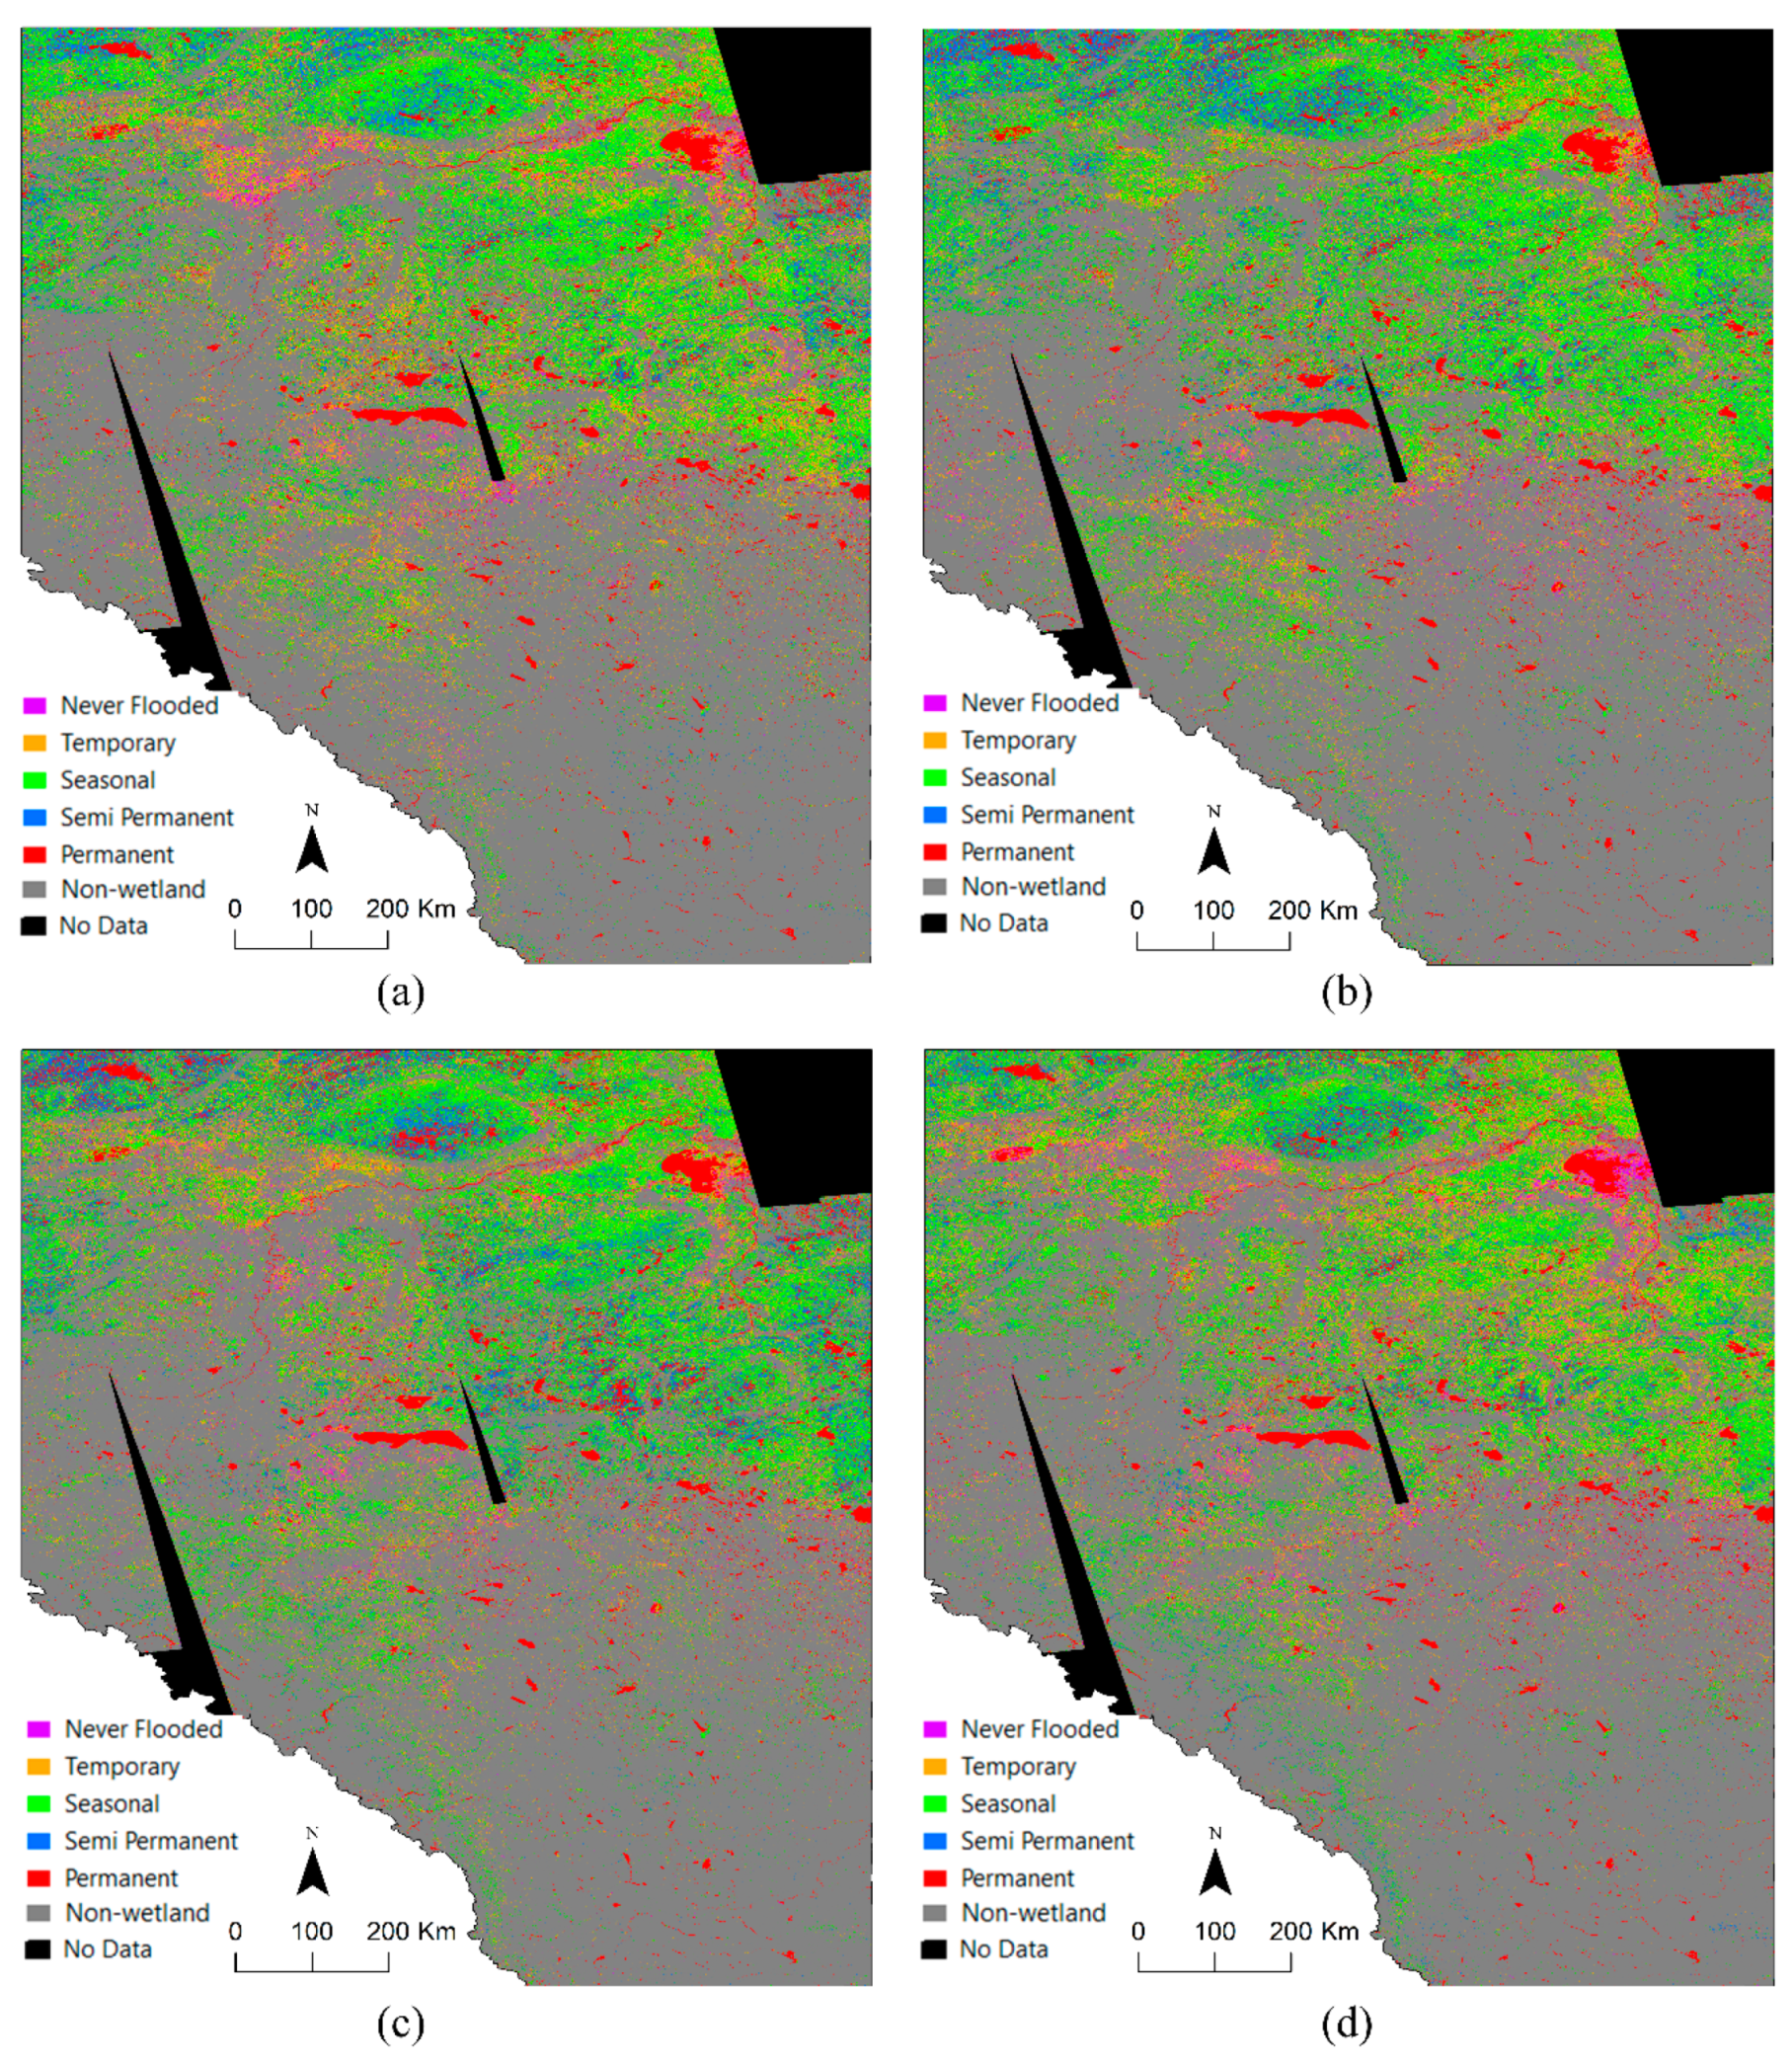
The hydroperiod maps based on various inundation classes in different years are provided in Figure 8. The coverage of each hydroperiod class is also demonstrated in Figure 9. Based on Figure 8, the hydroperiod classes showed similar spatial patterns across Alberta over the four years. In the northern portion of the province, inundation patterns appeared relatively consistent across the region, except for the map of 2018 during which northwestern Alberta experienced increases in flood frequency not seen in the northeast. Wet and dry conditions appeared consistent in southern Alberta across the study period. Non-flooded areas were not limited to specific parts of the province and instead occurred in various locations over the four years. For example, relatively large areas exhibiting non-flooded conditions were observed in northwestern Alberta in 2017, central Alberta in 2019, and northeastern Alberta in 2020.
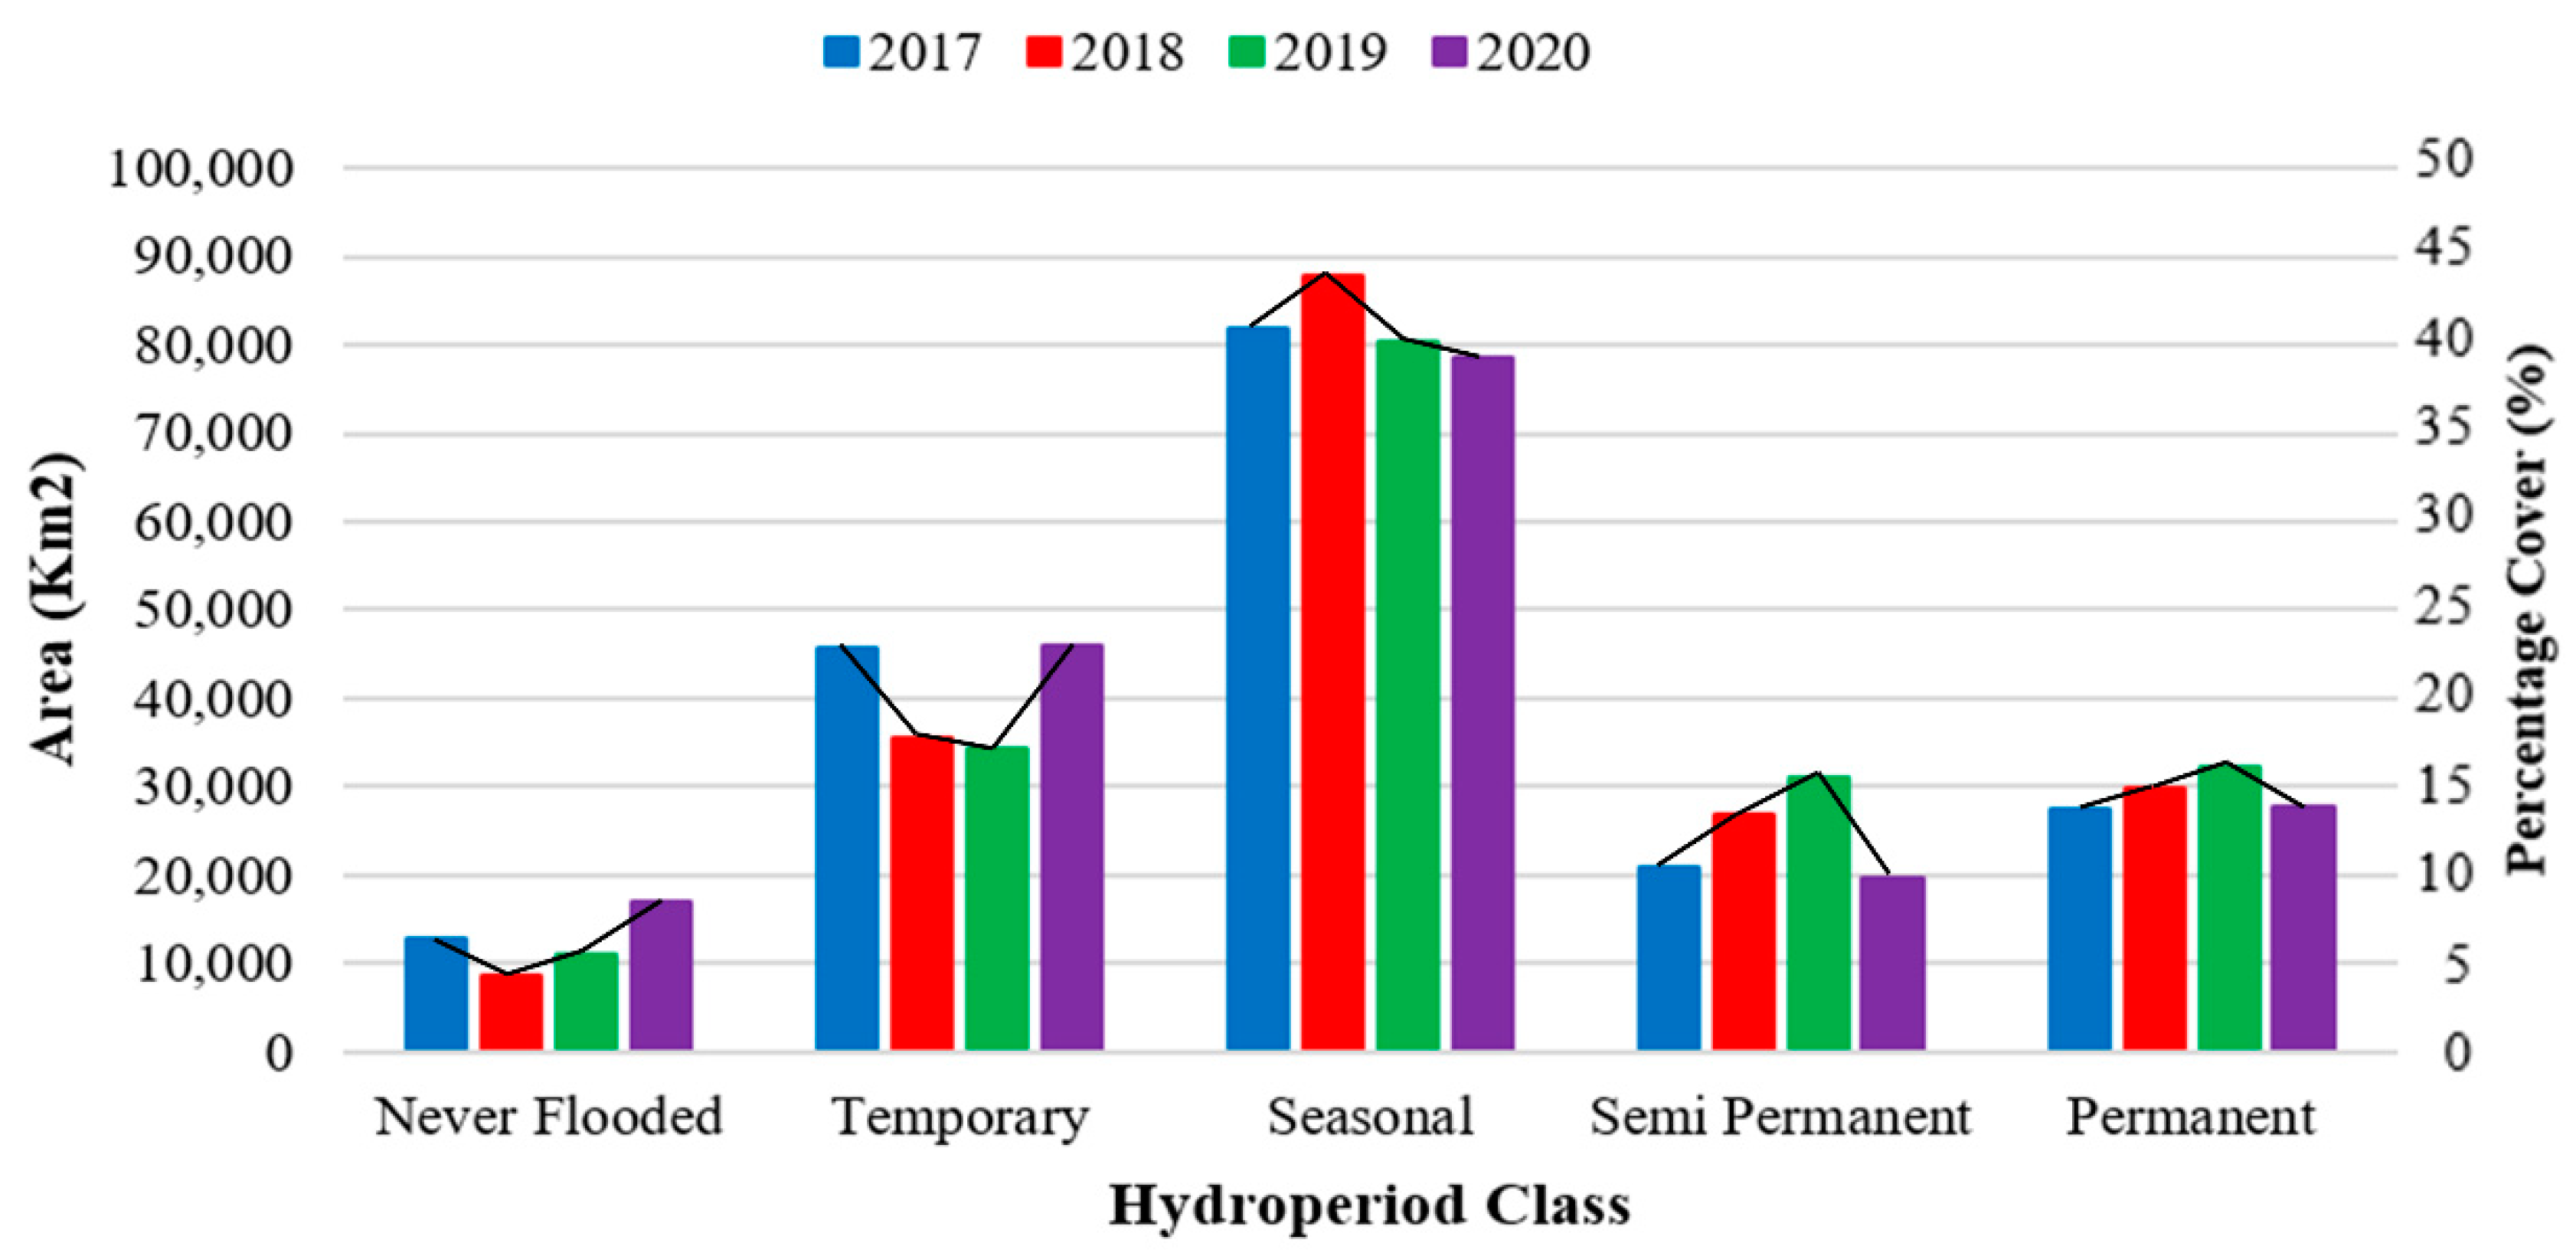
Based on Figure 9, seasonal wetlands were the most common hydroperiod class, accounting for approximately 43% of the wetland area in Alberta, followed by the temporary, permanent, and semi-permanent classes. Approximately 5% to 10% of wetlands were mapped as never flooded between 2017 and 2020. The area of wetlands that were permanently or semi-permanently flooded were relatively similar ranging from 10% to approximately 18% of total wetland area. Temporarily flooded wetlands covered approximately 20% of wetlands. The greatest proportion of the permanent and semi-permanent wetlands were observed in 2019, with the most never flooded and temporary conditions observed in 2020. Seasonal hydroperiods were most extensively observed in 2018.
Wetland hydroperiod trends from 2017 to 2020 are also illustrated in Figure 9. Semi-permanent and permanent wetlands peaked in 2018 and 2019 and were the lowest in 2017 and 2020, while the never flooded and temporary classes were observed having the opposite trend. Seasonal wetlands exhibited a different trend and peaked in 2018 which decreased through to 2020. Vegetated wetlands and open water bodies that were permanently flooded exhibited the most stable trend over the four years of this study, likely due to the inclusion of large lakes and rivers in this category.
4. Discussion
4.1. Findings
As identified in Refs. [19,33], most wetlands in Alberta are peatlands which occur predominantly in the northern part of the province. The results showed that most peatland areas experienced seasonal inundation, likely in the spring when there are large inputs of water from melting snow while the ground is still partially frozen [39] and then dry out over the remainder of the growing season. Peatlands are not typically associated with large fluctuations in water levels, where bogs, in particular, are characterized by raised Sphagnum mounds that elevate the surface slightly above the water table [19]. Additionally, bogs only receive water inputs through precipitation and, thus, do not experience flood pulses. Alberta has a relatively dry climate and, as such, the amount of precipitation received likely does not result in bogs exhibiting inundated states frequently. Fens are characterized by more level ground surfaces that are closer to the water table and hydrologically connected to other water inputs besides precipitation [1]. In general, graminoid-dominated fens have a water table close to or above the surface and are often much wetter than shrubby or treed fens and bogs. The results of this study showed that wetlands within the Cameron Hills and Caribou Mountains in northwestern and northcentral Alberta exhibited semi-permanent inundation, even though they are dominated by peatlands. This may partially be the result of discontinuous permafrost in these environmentally significant areas, where a thinner active layer keeps the water table closer to the surface [39].
Mineral wetlands experience greater variability in flooded conditions when comparing classes. Swamps are generally dry, with the water table falling >20 cm below the surface, though they can become temporarily inundated for varying amounts of time during certain periods [1]. The frequency of inundation in swamps is highly variable, occurring once per year to once every several years. Marshes similarly experience fluctuations in the water level over daily, seasonal, and annual time scales, and are often associated with permanent to semi-permanent standing water [1,18]. Shallow water and marsh wetlands are more common in southern Alberta [19,33,40], with larger deep water bodies occurring in the north.
Based on the results, relatively small but variable parts of the province’s wetlands experienced non-flooded conditions in each of the four years. Since the hydroperiod can be influenced by weather, climate, and disturbance, it is difficult to determine the exact causes of the non-flooded conditions in each particular area. However, it is noted that the areas that correspond with never flooded or temporary hydroperiods are generally situated in proximity to areas undergoing significant disturbance from agriculture and oil and gas extraction. It has been well documented that human disturbance alters wetland hydrology [39,41], and oil and gas extraction additionally requires vast quantities of water affecting regional water regimes [42].
4.2. Limitations and Suggestions
The wetland inventory used in this study to mask vegetated wetlands and open water had an overall accuracy of approximately 88%. Although this level of accuracy is relatively high, the map consisted of commission and omission errors between upland and wetland areas. Therefore, in the produced hydroperiod maps, it is possible that some areas were misidentified as wetlands and that some wetland areas were excluded. Additionally, pothole wetlands in southern Alberta are often smaller than 30 m in size and, therefore, most of them were not captured by Landsat and the inventory. Thus, if a more accurate wetland map is available in the future, it should be used to mask vegetated wetlands and open water.
Based on the findings in Ref. [30], the coherence values reported for marshes in Alberta between May and October 2017 to 2020 fell below the selected coherence threshold value in this study. Since there were some observed omission errors in the detection of flooded wetlands, it is probable the hydroperiod maps developed in this study underrepresented the influence of flooded marshes on the characterization of marsh hydroperiod dynamics. Marshes, while commonly inundated and having strong double-bounce effects, tend to decorrelate over short periods of time due to the fluctuations in the water level and rapid vegetation growth during the growing season [30]. Ref. [30] also found a seasonal effect on coherence, where vegetated wetlands lost coherence during the summer, which may introduce other difficulties to detecting flooded conditions and inferring the hydroperiod over the course of the snow-free period.
As discussed in Section 2.2, the in situ data, which were used for selecting the coherence threshold value, were collected over various types of wetlands. It might be a good idea to identify different optimum threshold values for various wetland types. However, this requires a suitable number of flooded/non-flooded in situ data from various wetland types. Additionally, the selected threshold value was only based on the Canadian wetlands, and this value should be updated for wetlands in other areas of the world considering the differences among wetlands in various regions.
Increasing the amount of in situ data would additionally allow for a more robust assessment of the accuracy of the produced flooded/non-flooded maps. The multitude of factors influencing downstream discharge made it difficult to use discharge to validate the flooded maps over an entire watershed. Wetland type also influences how a wetland will respond to precipitation or drying events and likely explains the lack of a clear relationship between flooded areas and discharge and precipitation in this study. In comparison, Ref. [12] found a strong positive relationship between coherence-derived flooded area and downstream discharge for the Upper Columbia River, British Columbia. However, their study area was substantially smaller (along an ~17 km stretch of river) and located within a mountain valley in British Columbia, which has a different hydrological regime to the plains ecozones found throughout Alberta. The limitations noted for capturing small pothole wetlands and marshes, which are common in southern Alberta, might have also led to poor relationships in this region.
The coherence products generated for this study were derived from SAR imagery collected at the C-band, which has relatively low penetration into vegetation canopies, such as the forests that characterize the boreal region. In contrast, the L-band (e.g., ALOS), P-, and S-band (e.g., NISAR) SAR systems emit longer wavelengths, thus having greater penetration capability and are less affected by surface features that mask relevant details in coherence products [1,31]. Greater wavelength penetration would promote the increased detection of flooded conditions from the double-bounce effect and improve estimates of hydroperiod for forested wetlands. Future studies should investigate the application of coherence products extracted from L- and P-band SAR data. Future SAR instruments that provide open-access data, such as NISAR, will facilities these applications.
In this study, coherence products were generated from Sentinel-1 imagery based on 12 day baseline data. As previously discussed, wetlands are highly dynamic landscapes, where vegetation and water can change over short timescales. While the temporal baseline used in this study was able to maintain coherence between SAR pairs, producing coherence maps with shorter baselines may reveal additional dynamics and trends in wetland hydroperiods. Shorter baselines may also improve coherence from marshes, which can undergo significant changes over short periods of time.
Previous studies [12,17,19] have showed that optical satellites and SAR backscattering images were effective for hydroperiod analysis. Thus, it is suggested to perform hydroperiod analysis using these datasets (e.g., Sentinel-1/2, Landsat-8/9, RADARSAT-2, and RADARSAT Constellation Mission (RCM)) and compare the results with those obtained in this study using InSAR coherence data. A combination of these datasets, which would probably provide better accuracies, would be another study, which could be investigated in future works.
5. Conclusions
Global coverage of SAR imagery provides a valuable tool for monitoring wetland change, which can be used in water and resource management. Previous studies have shown that SAR coherence products can be used to map wetlands, inundation extent, and water level. In this study, we showed a coherence application for measuring wetland hydroperiod over a large area covering multiple ecozones in the province of Alberta. While desirable results were achieved using C-band SAR data, the application of L- or future P-band systems for hydroperiod mapping will assist in the detection of flooded conditions especially in forested wetlands due to the increased penetration depth. Moreover, increased temporal frequency of image acquisitions, such as those collected by RCM, will further improve hydroperiod characterization of highly dynamic systems, such as marshes. Future studies should continue to assess the approaches to wetland hydroperiod mapping using coherence to monitor ongoing changes in these sensitive and important ecosystems.
Author Contributions
Conceptualization, M.A. and B.B.; Data curation, M.A., R.W., S.T.S. and V.P.; Formal analysis, M.A., R.W. and S.T.S.; Funding acquisition, M.A. and B.B.; Investigation, M.A., R.W. and E.R.D.; Methodology, M.A. and B.B.; Resources, M.A. and B.B.; Software, M.A., R.W. and S.T.S.; Supervision, B.B.; Validation, M.A. and R.W.; Visualization, M.A. and R.W.; Writing—original draft, M.A. and R.W.; Writing—review and editing, M.A., B.B., R.W., E.R.D., S.T.S. and V.P. All authors have read and agreed to the published version of the manuscript.
Funding
This research was funded by Natural Resources Canada under a grant to M.A.
Conflicts of Interest
The authors declare no conflict of interest.
References
- Mahdavi, S.; Salehi, B.; Granger, J.; Amani, M.; Brisco, B.; Huang, W. Remote sensing for wetland classification: A comprehensive review. GISci. Remote Sens. 2018, 55, 623–658. [Google Scholar] [CrossRef]
- Marton, J.M.; Creed, I.F.; Lewis, D.B.; Lane, C.R.; Basu, N.B.; Cohen, M.J.; Craft, C.B. Geographically Isolated Wetlands are Important Biogeochemical Reactors on the Landscape. Bioscience 2015, 65, 408–418. [Google Scholar] [CrossRef] [Green Version]
- Kneitel, J.M. Inundation timing, more than duration, affects the community structure of California vernal pool mesocosms. Hydrobiologia 2014, 732, 71–83. [Google Scholar] [CrossRef]
- Milly, P.C.D.; Dunne, K.A. Potential evapotranspiration and continental drying. Nat. Clim. Change 2016, 6, 946–949. [Google Scholar] [CrossRef]
- Willett, K.M.; Jones, P.D.; Gillett, N.P.; Thorne, P.W. Recent Changes in Surface Humidity: Development of the HadCRUH Dataset. J. Clim. 2008, 21, 5364–5383. [Google Scholar] [CrossRef]
- McVicar, T.R.; Roderick, M.L.; Donohue, R.J.; Li, L.T.; Van Niel, T.G.; Thomas, A.; Grieser, J.; Jhajharia, D.; Himri, Y.; Mahowald, N.M.; et al. Global review and synthesis of trends in observed terrestrial near-surface wind speeds: Implications for evaporation. J. Hydrol. 2012, 416–417, 182–205. [Google Scholar] [CrossRef]
- Klein, E.; Berg, E.E.; Dial, R. Wetland drying and succession across the Kenai Peninsula Lowlands, south-central Alaska. Can. J. For. Res. 2005, 35, 1931–1941. [Google Scholar] [CrossRef]
- Amani, M.; Salehi, B.; Mahdavi, S.; Granger, J.E.; Brisco, B.; Hanson, A. Wetland Classification Using Multi-Source and Multi-Temporal Optical Remote Sensing Data in Newfoundland and Labrador, Canada. Can. J. Remote Sens. 2017, 43, 360–373. [Google Scholar] [CrossRef]
- Mahdavi, S.; Salehi, B.; Amani, M.; Granger, J.E.; Brisco, B.; Huang, W.; Hanson, A. Object-Based Classification of Wetlands in Newfoundland and Labrador Using Multi-Temporal PolSAR Data. Can. J. Remote Sens. 2017, 43, 432–450. [Google Scholar] [CrossRef]
- Brisco, B.; Touzi, R.; van der Sanden, J.J.; Charbonneau, F.; Pultz, T.J.; D’Iorio, M. Water resource applications with RADARSAT-2—A preview. Int. J. Digit. Earth 2008, 1, 130–147. [Google Scholar] [CrossRef]
- Brisco, B.; Short, N.; van der Sanden, J.; Landry, R.; Raymond, D. A semi-automated tool for surface water mapping with RADARSAT-1. Can. J. Remote Sens. 2009, 35, 336–344. [Google Scholar] [CrossRef]
- Hopkinson, C.; Fuoco, B.; Grant, T.; Bayley, S.E.; Brisco, B.; MacDonald, R. Wetland Hydroperiod Change Along the Upper Columbia River Floodplain, Canada, 1984 to 2019. Remote Sens. 2020, 12, 4084. [Google Scholar] [CrossRef]
- Mahoney, C.; Merchant, M.; Boychuk, L.; Hopkinson, C.; Brisco, B. Automated SAR Image Thresholds for Water Mask Production in Alberta’s Boreal Region. Remote Sens. 2020, 12, 2223. [Google Scholar] [CrossRef]
- Amani, M.; Salehi, B.; Mahdavi, S.; Brisco, B.; Shehata, M. A Multiple Classifier System to improve mapping complex land covers: A case study of wetland classification using SAR data in Newfoundland, Canada. Int. J. Remote Sens. 2018, 39, 7370–7383. [Google Scholar] [CrossRef]
- Merchant, M.A.; Obadia, M.; Brisco, B.; DeVries, B.; Berg, A. Applying Machine Learning and Time-Series Analysis on Sentinel-1A SAR/InSAR for Characterizing Arctic Tundra Hydro-Ecological Conditions. Remote Sens. 2022, 14, 1123. [Google Scholar] [CrossRef]
- Merchant, M.A.; Warren, R.K.; Edwards, R.; Kenyon, J.K. An Object-Based Assessment of Multi-Wavelength SAR, Optical Imagery and Topographical Datasets for Operational Wetland Mapping in Boreal Yukon, Canada. Can. J. Remote Sens. 2019, 45, 308–332. [Google Scholar] [CrossRef]
- Montgomery, J.S.; Hopkinson, C.; Brisco, B.; Patterson, S.; Rood, S.B. Wetland hydroperiod classification in the western prairies using multitemporal synthetic aperture radar. Hydrol. Process. 2018, 32, 1476–1490. [Google Scholar] [CrossRef]
- Alberta Environment and Sustainable Resource Development. Alberta Wetland Classification System; Alberta Environment and Sustainable Resource Development: Edmonton, AB, Canada, 2015. [Google Scholar]
- DeLancey, E.R.; Kariyeva, J.; Cranston, J.; Brisco, B. Monitoring Hydro Temporal Variability in Alberta, Canada with Multi-Temporal Sentinel-1 SAR Data. Can. J. Remote Sens. 2018, 44, 1–10. [Google Scholar] [CrossRef]
- Smith, L.C. Emerging Applications of Interferometric Synthetic Aperture Radar (InSAR) in Geomorphology and Hydrology. Ann. Assoc. Am. Geogr. 2002, 92, 385–398. [Google Scholar] [CrossRef]
- Pepe, A.; Calò, F. A Review of Interferometric Synthetic Aperture RADAR (InSAR) Multi-Track Approaches for the Retrieval of Earth’s Surface Displacements. Appl. Sci. 2017, 7, 1264. [Google Scholar] [CrossRef] [Green Version]
- Brisco, B.; Ahern, F.; Murnaghan, K.; White, L.; Canisus, F.; Lancaster, P. Seasonal Change in Wetland Coherence as an Aid to Wetland Monitoring. Remote Sens. 2017, 9, 158. [Google Scholar] [CrossRef] [Green Version]
- Mohammadimanesh, F.; Salehi, B.; Mahdianpari, M.; Brisco, B.; Motagh, M. Wetland Water Level Monitoring Using Interferometric Synthetic Aperture Radar (InSAR): A Review. Can. J. Remote Sens. 2018, 44, 247–262. [Google Scholar] [CrossRef]
- Canisius, F.; Brisco, B.; Murnaghan, K.; Van Der Kooij, M.; Keizer, E. SAR Backscatter and InSAR Coherence for Monitoring Wetland Extent, Flood Pulse and Vegetation: A Study of the Amazon Lowland. Remote Sens. 2019, 11, 720. [Google Scholar] [CrossRef] [Green Version]
- Chen, Z.; Banks, S.; Behnamian, A.; White, L.; Montpetit, B.; Pasher, J.; Duffe, J. Characterizing the Great Lakes Coastal Wetlands with InSAR Observations from X-, C-, and L-Band Sensors. Can. J. Remote Sens. 2020, 46, 765–783. [Google Scholar] [CrossRef]
- Minotti, P.G.; Rajngewerc, M.; Alí Santoro, V.; Grimson, R. Evaluation of SAR C-band interferometric coherence time-series for coastal wetland hydropattern mapping. J. S. Am. Earth Sci. 2021, 106, 102976. [Google Scholar] [CrossRef]
- Liao, T.-H.; Simard, M.; Denbina, M.; Lamb, M.P. Monitoring Water Level Change and Seasonal Vegetation Change in the Coastal Wetlands of Louisiana Using L-Band Time-Series. Remote Sens. 2020, 12, 2351. [Google Scholar] [CrossRef]
- Liu, D.; Wang, X.; Aminjafari, S.; Yang, W.; Cui, B.; Yan, S.; Zhang, Y.; Zhu, J.; Jaramillo, F. Using InSAR to identify hydrological connectivity and barriers in a highly fragmented wetland. Hydrol. Process. 2020, 34, 4417–4430. [Google Scholar] [CrossRef]
- Oliver-Cabrera, T.; Wdowinski, S. InSAR-Based Mapping of Tidal Inundation Extent and Amplitude in Louisiana Coastal Wetlands. Remote Sens. 2016, 8, 393. [Google Scholar] [CrossRef] [Green Version]
- Amani, M.; Poncos, V.; Brisco, B.; Foroughnia, F.; DeLancey, E.R.; Ranjbar, S. InSAR Coherence Analysis for Wetlands in Alberta, Canada Using Time-Series Sentinel-1 Data. Remote Sens. 2021, 13, 3315. [Google Scholar] [CrossRef]
- Mohammadimanesh, F.; Salehi, B.; Mahdianpari, M.; Brisco, B.; Motagh, M. Multi-temporal, multi-frequency, and multi-polarization coherence and SAR backscatter analysis of wetlands. ISPRS J. Photogramm. Remote Sens. 2018, 142, 78–93. [Google Scholar] [CrossRef]
- TARNOCAI, C. The effect of climate change on carbon in Canadian peatlands. Glob. Planet. Change 2006, 53, 222–232. [Google Scholar] [CrossRef]
- Amani, M.; Mahdavi, S.; Kakooei, M.; Ghorbanian, A.; Brisco, B.; DeLancey, E.; Toure, S.; Reyes, E.L. Wetland Change Analysis in Alberta, Canada Using Four Decades of Landsat Imagery. IEEE J. Sel. Top. Appl. Earth Obs. Remote Sens. 2021, 14, 10314–10335. [Google Scholar] [CrossRef]
- Natural Regions Committee. Natural Regions and Subregions of Alberta; Natural Regions Committee: Edmonton, AB, Canada, 2006. [Google Scholar]
- Montgomery, J.; Mahoney, C.; Brisco, B.; Boychuk, L.; Cobbaert, D.; Hopkinson, C. Remote Sensing of Wetlands in the Prairie Pothole Region of North America. Remote Sens. 2021, 13, 3878. [Google Scholar] [CrossRef]
- Amani, M.; Mahdavi, S.; Afshar, M.; Brisco, B.; Huang, W.; Mohammad Javad Mirzadeh, S.; White, L.; Banks, S.; Montgomery, J.; Hopkinson, C. Canadian Wetland Inventory using Google Earth Engine: The First Map and Preliminary Results. Remote Sens. 2019, 11, 842. [Google Scholar] [CrossRef] [Green Version]
- ABMI. ABMI Human Footprint Inventory: Wall-to-Wall Human Footprint Inventory; ABMI: Edmonton, AB, Canada, 2018. [Google Scholar]
- Steward, R.E.; Kantrud, H.A. Classification of Natural Ponds and Lakes in the Glaciated Prairie Region; U.S. Fish and Wildlife Service: Washington, DC, USA, 1971. [Google Scholar]
- Braverman, M.; Quinton, W.L. Hydrological impacts of seismic lines in the wetland-dominated zone of thawing, discontinuous permafrost, Northwest Territories, Canada. Hydrol. Process. 2016, 30, 2617–2627. [Google Scholar] [CrossRef]
- DeLancey, E.R.; Simms, J.F.; Mahdianpari, M.; Brisco, B.; Mahoney, C.; Kariyeva, J. Comparing Deep Learning and Shallow Learning for Large-Scale Wetland Classification in Alberta, Canada. Remote Sens. 2019, 12, 2. [Google Scholar] [CrossRef] [Green Version]
- Volik, O.; Elmes, M.; Petrone, R.; Kessel, E.; Green, A.; Cobbaert, D.; Price, J. Wetlands in the Athabasca Oil Sands Region: The nexus between wetland hydrological function and resource extraction. Environ. Rev. 2020, 28, 246–261. [Google Scholar] [CrossRef]
- Webster, K.L.; Beall, F.D.; Creed, I.F.; Kreutzweiser, D.P. Impacts and prognosis of natural resource development on water and wetlands in Canada’s boreal zone. Environ. Rev. 2015, 23, 78–131. [Google Scholar] [CrossRef] [Green Version]
Figure 1.
(a) Study area (Alberta) and the distribution of in situ samples and the locations of the hydrological and meteorological stations; (b) an example of a coherence map from the province of Alberta produced in Ref. [30]; (c) Alberta-wide wetland map produced in Ref. [33].

Figure 2.
Examples of (a,b) flooded and (c,d) non-flooded wetlands recorded in the field.

Figure 3.
Flowchart of the method for analyzing the wetland hydroperiod using the InSAR coherence products.
Figure 3.
Flowchart of the method for analyzing the wetland hydroperiod using the InSAR coherence products.

Figure 4.
Optimum coherence threshold selection for the flooded and non-flooded vegetated wetlands: coherence values for the (a) flooded and (b) non-flooded wetland samples; omission and commission errors of different threshold values for the (c) flooded and (d) non-flooded wetlands. The red lines in (a,b) indicate the selected optimum threshold value (i.e., 0.45).

Figure 5.
(a) Total daily precipitation; (b) mean daily temperature; (c) daily river discharge; (d) flooded area for the Peace River at Peace River, Alberta. Discharge data were not available for 2017.
Figure 5.
(a) Total daily precipitation; (b) mean daily temperature; (c) daily river discharge; (d) flooded area for the Peace River at Peace River, Alberta. Discharge data were not available for 2017.

Figure 6.
(a) Total daily precipitation; (b) mean daily temperature; (c) daily river discharge; (d) flooded area for the South Saskatchewan River at Medicine Hat, Alberta.
Figure 6.
(a) Total daily precipitation; (b) mean daily temperature; (c) daily river discharge; (d) flooded area for the South Saskatchewan River at Medicine Hat, Alberta.

Figure 7.
(a) Hydroperiod map of wetlands in Alberta (based on percentage) using coherence products of 2017–2020; (b) a zoomed map from a portion of the Birch Mountains; (c) the corresponding high-resolution satellite image exported from ArcGIS software.
Figure 7.
(a) Hydroperiod map of wetlands in Alberta (based on percentage) using coherence products of 2017–2020; (b) a zoomed map from a portion of the Birch Mountains; (c) the corresponding high-resolution satellite image exported from ArcGIS software.

Figure 8.
Wetland hydroperiod classification for the entirety of Alberta using coherence maps produced in (a) 2017; (b) 2018; (c) 2019; (d) 2020.
Figure 8.
Wetland hydroperiod classification for the entirety of Alberta using coherence maps produced in (a) 2017; (b) 2018; (c) 2019; (d) 2020.

Figure 9.
Area and percentage cover of each hydroperiod class in different years.


Table 1.
Confusion matrix of the identification of the flooded and non-flooded wetlands using test samples.
Table 1.
Confusion matrix of the identification of the flooded and non-flooded wetlands using test samples.
| In-Situ Samples | |||||
|---|---|---|---|---|---|
| Flooded | Non-Flooded | User Accuracy (%) | Commission Error (%) | ||
| Mapped | Flooded | 8 | 1 | 89 | 11 |
| Non-Flooded | 2 | 8 | 80 | 20 | |
| Producer Accuracy (%) | 80 | 89 | Overall Accuracy = 84% | ||
| Omission Error (%) | 20 | 11 | |||
Table 2.
Areas of flooded wetlands between 2017 and 2020 for different hydroperiod categories.
| Flooded Percentage Category (%) | Area (Km2) | Percentage Cover (%) |
|---|---|---|
| 0–10 | 16,694 | 8.84 |
| 10–20 | 28,773 | 15.24 |
| 20–30 | 28,315 | 15.00 |
| 30–40 | 25,793 | 13.67 |
| 40–50 | 20,854 | 11.05 |
| 50–60 | 13,224 | 7.01 |
| 60–70 | 13,284 | 7.04 |
| 70–80 | 10,090 | 5.35 |
| 80–90 | 6360 | 3.37 |
| 90–100 | 25,368 | 13.44 |
Publisher’s Note: MDPI stays neutral with regard to jurisdictional claims in published maps and institutional affiliations. |
© 2022 by the authors. Licensee MDPI, Basel, Switzerland. This article is an open access article distributed under the terms and conditions of the Creative Commons Attribution (CC BY) license (https://creativecommons.org/licenses/by/4.0/).
Share and Cite
MDPI and ACS Style
Amani, M.; Brisco, B.; Warren, R.; DeLancey, E.R.; Seydi, S.T.; Poncos, V. Wetland Hydroperiod Analysis in Alberta Using InSAR Coherence Data. Remote Sens. 2022, 14, 3469. https://doi.org/10.3390/rs14143469
AMA Style
Amani M, Brisco B, Warren R, DeLancey ER, Seydi ST, Poncos V. Wetland Hydroperiod Analysis in Alberta Using InSAR Coherence Data. Remote Sensing. 2022; 14(14):3469. https://doi.org/10.3390/rs14143469
Chicago/Turabian StyleAmani, Meisam, Brian Brisco, Rebecca Warren, Evan R. DeLancey, Seyd Teymoor Seydi, and Valentin Poncos. 2022. "Wetland Hydroperiod Analysis in Alberta Using InSAR Coherence Data" Remote Sensing 14, no. 14: 3469. https://doi.org/10.3390/rs14143469
Note that from the first issue of 2016, this journal uses article numbers instead of page numbers. See further details here.