
UAV Video-Based Approach to Identify Damaged Trees in Windthrow Areas
by
 , and
, and
Flavio Furukawa
1,*, 
Junko Morimoto
1,
Nobuhiko Yoshimura
2,
Takashi Koi
3,
Hideaki Shibata
4 and
Masami Kaneko
2 1
Laboratory of Ecosystem Management, Graduate School of Agriculture, Hokkaido University, Sapporo 060-8587, Japan
2
Department of Environmental and Symbiotic Science, Rakuno Gakuen University, Ebetsu 069-8501, Japan
3
Center for Natural Hazards Research, Hokkaido University, Sapporo 060-8589, Japan
4
Field Science Center for Northern Biosphere, Hokkaido University, Sapporo 069-0809, Japan
*
Author to whom correspondence should be addressed.
Remote Sens. 2022, 14(13), 3170; https://doi.org/10.3390/rs14133170
Submission received: 27 May 2022
/
Revised: 26 June 2022
/
Accepted: 28 June 2022
/
Published: 1 July 2022
(This article belongs to the Special Issue UAV Applications for Forest Management: Wood Volume, Biomass, Mapping)
Abstract
:Disturbances in forest ecosystems are expected to increase by the end of the twenty-first century. An understanding of these disturbed areas is critical to defining management measures to improve forest resilience. While some studies emphasize the importance of quick salvage logging, others emphasize the importance of the deadwood for biodiversity. Unmanned aerial vehicle (UAV) remote sensing is playing an important role to acquire information in these areas through the structure-from-motion (SfM) photogrammetry process. However, the technique faces challenges due to the fundamental principle of SfM photogrammetry as a passive optical method. In this study, we investigated a UAV video-based technology called full motion video (FMV) to identify fallen and snapped trees in a windthrow area. We compared the performance of FMV and an orthomosaic, created by the SfM photogrammetry process, to manually identify fallen and snapped trees, using a ground survey as a reference. The results showed that FMV was able to identify both types of damaged trees due to the ability of video to deliver better context awareness compared to the orthomosaic, although providing lower position accuracy. In addition to its processing being simpler, FMV technology showed great potential to support the interpretation of conventional UAV remote sensing analysis and ground surveys, providing forest managers with fast and reliable information about damaged trees in windthrow areas.

1. Introduction
In Eastern Asia, typhoons are one of the main natural hazards affecting the forest ecosystem [1,2]. With the frequency of intense tropical cyclones predicted to increase by the end of the twenty-first century [3], an expansion of forest ecosystem disturbance is also expected. Understanding the ecological resilience of forest ecosystems to natural and human impact is critical for identifying the optimum management measures [4,5,6]. While some studies emphasize the importance of quick salvage logging to dampen insect outbreaks in windthrow areas [7,8], other studies emphasize the ecological importance of the deadwood caused by natural disturbances [9,10,11,12], and the importance of individual deadwood management to benefit the biodiversity of disturbed areas [13,14].
The development of remote sensing with different sensors onboard satellites, airborne, and unmanned aerial vehicles (UAVs) has brought many tools and techniques to manage areas affected by natural disturbances [15,16], that are able to acquire remotely sensed data to monitor disturbed areas. Recently, UAVs have been playing an important role in remote sensing because of their ability to capture a variety of very high-resolution datasets at any time [17,18]. A widely used UAV remote sensing technique is the structure from motion (SfM) photogrammetry [19], which enables the creation of two-dimensional (2D) and three-dimensional (3D) datasets to analyze areas affected by natural disasters [20,21].
However, UAV SfM photogrammetry faces challenges such as long processing time, difficulty visualizing high-resolution point clouds in GIS, reproduction of complex areas such as those found in forests and steep terrains, susceptibility to lighting conditions, and one viewing angle for orthomosaics [20,22,23,24]. Some of these challenges are often related to the fundamental principles of SfM photogrammetry as a passive optical method [19]. Goodbody et al. [25] stated that while digital aerial photogrammetry plays an important role in forest inventory frameworks in a variety of forested environments due to its high accuracy and lower cost compared to other technologies (i.e., lidar), further research and development of acquisition parameters, image-matching algorithms, and point cloud processing workflows are needed to help the establishment of the digital aerial photogrammetry as a logical data source for forest management. Lidar is an option to overcome some limitations of UAV SfM photogrammetry techniques, such as the complicated and unreliable matching process, especially when dealing with significant depth variation [26], but it is still expensive requiring high-skilled personnel and high computational processing [27,28].
Another way to overcome some of the limitations of SfM photogrammetry techniques is aerial videography; some studies using video streams combined with GIS were used for forest fire prevention [29] and to assess forest damage caused by hurricanes [30]. The development of video and GIS technology brought a technology called full motion video (FMV). The technology consists of automatically combining the video with GIS through a multiplexing process, generating a spatial-aware video. The FMV also provides telestration capabilities, by allowing the analysis and editing of feature data inside the video, and automatically generating features inside the GIS [31]. This technology is being used to assess remotely sensed satellite data [32], and by the military industries for intelligence, surveillance, and reconnaissance [33,34].
Considering the importance of managing individual deadwood, in this study we investigated the usage of FMV technology to identify fallen trees (i.e., uprooted trees and segments of downed trunks) and snapped trees in a windthrow area. Specifically, the feature data created from FMV and orthomosaic (produced by the UAV SfM photogrammetry process) were compared with a ground survey as a reference, to identify the strengths and weaknesses of the FMV technology in monitoring damaged trees in a windthrow area.
2. Materials and Methods
2.1. Study Area
In September 2004, the Typhoon Songda (no. 18) hit northern Japan and destroyed 369.6 km2 of forests. Of the total windthrow area, 30% occurred around Chitose City and Tomakomai City in Hokkaido, Japan [35]. For this study, we selected an area of 0.37 ha inside a management unit of the national forest in Chitose City located at 42°45′43.9”N, 141°30′03.3”E at 150 m of altitude (Figure 1).
The topography of the study area was flat, with the soil composed of volcanic ash and pumice, and annual temperature and precipitation averages of 7.1 °C and 1384 mm, respectively. The dominant tree species of the natural forest were Abies sachalinensis (F. Schmidt) Mast. and Quercus crispula Blume. After the typhoon, no human intervention was conducted; thus during the data collection, the deadwood and vegetation were found to have recovered during the years since the windthrow occurrence [36].
2.2. Data Acquisition
The data for this study were collected on 7 December 2021, 17 years after the hit of the Typhoon Songda. The aerial data for this study (still images and video), were taken using the DJI Phantom RTK UAV, with a 1-inch CMOS RGB sensor delivering images of 5472 × 3648 pixels and 4 K (4096 × 2160 pixels) resolution video [37]. The UAV was also coupled with a built-in Real-Time Kinematic (RTK) system connected to the ICHIMILL virtual reference station service provided by Softbank Japan [38] to improve the position and altitude accuracy of the aircraft [39].
To create the FMV compliant data, the UAV was flown using the Site Scan LE application for iPad [40]. This application was necessary to convert the geospatial metadata generated from the UAV to MISB standards [41] to be combined with the video file in the multiplexing process. The flight was performed at 30 m above the ground and automatically followed a predefined route, with the gimbal angle set at 20 degrees and the video set at 4 K resolution in 24 frames per second.
Apart from the video, a total of 145 images were taken at 30 m above the ground, with both overlap and sidelap at 80% used to create an orthomosaic. To improve the orthomosaic accuracy, 4 ground control points were placed at the corners of the study site (Figure 1c), and the position of each ground control point was collected using the DG-PRO1RWS RTK system (RTK system) delivering accuracies within centimeter-level [42].
A ground survey was also conducted on the same day. Because the high density of recovering juvenile trees [43] blocked the way, it was not possible to take samples of all fallen and snapped trees from the whole study area. The sample positions of fallen and snapped trees were taken in accessible areas using the RTK system, which corresponded to around 78% of the total area (Appendix A, Figure A1); for each fallen tree, two GNSS coordinates were taken (one at each end of a fallen tree), and for each snapped tree, one GNSS coordinate was taken. To understand the influence of the characteristics of snapped trees on their identification, the height and diameter of each snapped tree were measured from the photos taken on the ground survey with a reference pole.
2.3. Data Processing
The processing workflow is shown in Figure 2. We used three different sources to identify fallen and snapped trees in the study area: FMV, orthomosaic, and the ground survey.
2.3.1. Full Motion Video Processing
To create the FMV compliant data, we combined the video with the metadata generated from the SiteScan LE application on the iPad, using the video multiplexer tool inside the image analyst extension for ArcGIS Pro 2.8 [44]. The video was converted into full HD (1920 × 1080 pixels) resolution to improve the playback inside ArcGIS Pro, following ESRI’s recommendation [45]. Additionally, to align the video footprint in GIS, some adjustments to correct the UAV flight altitude data in the geospatial video log files had to be completed according to the parameters supplied by ESRI [46].
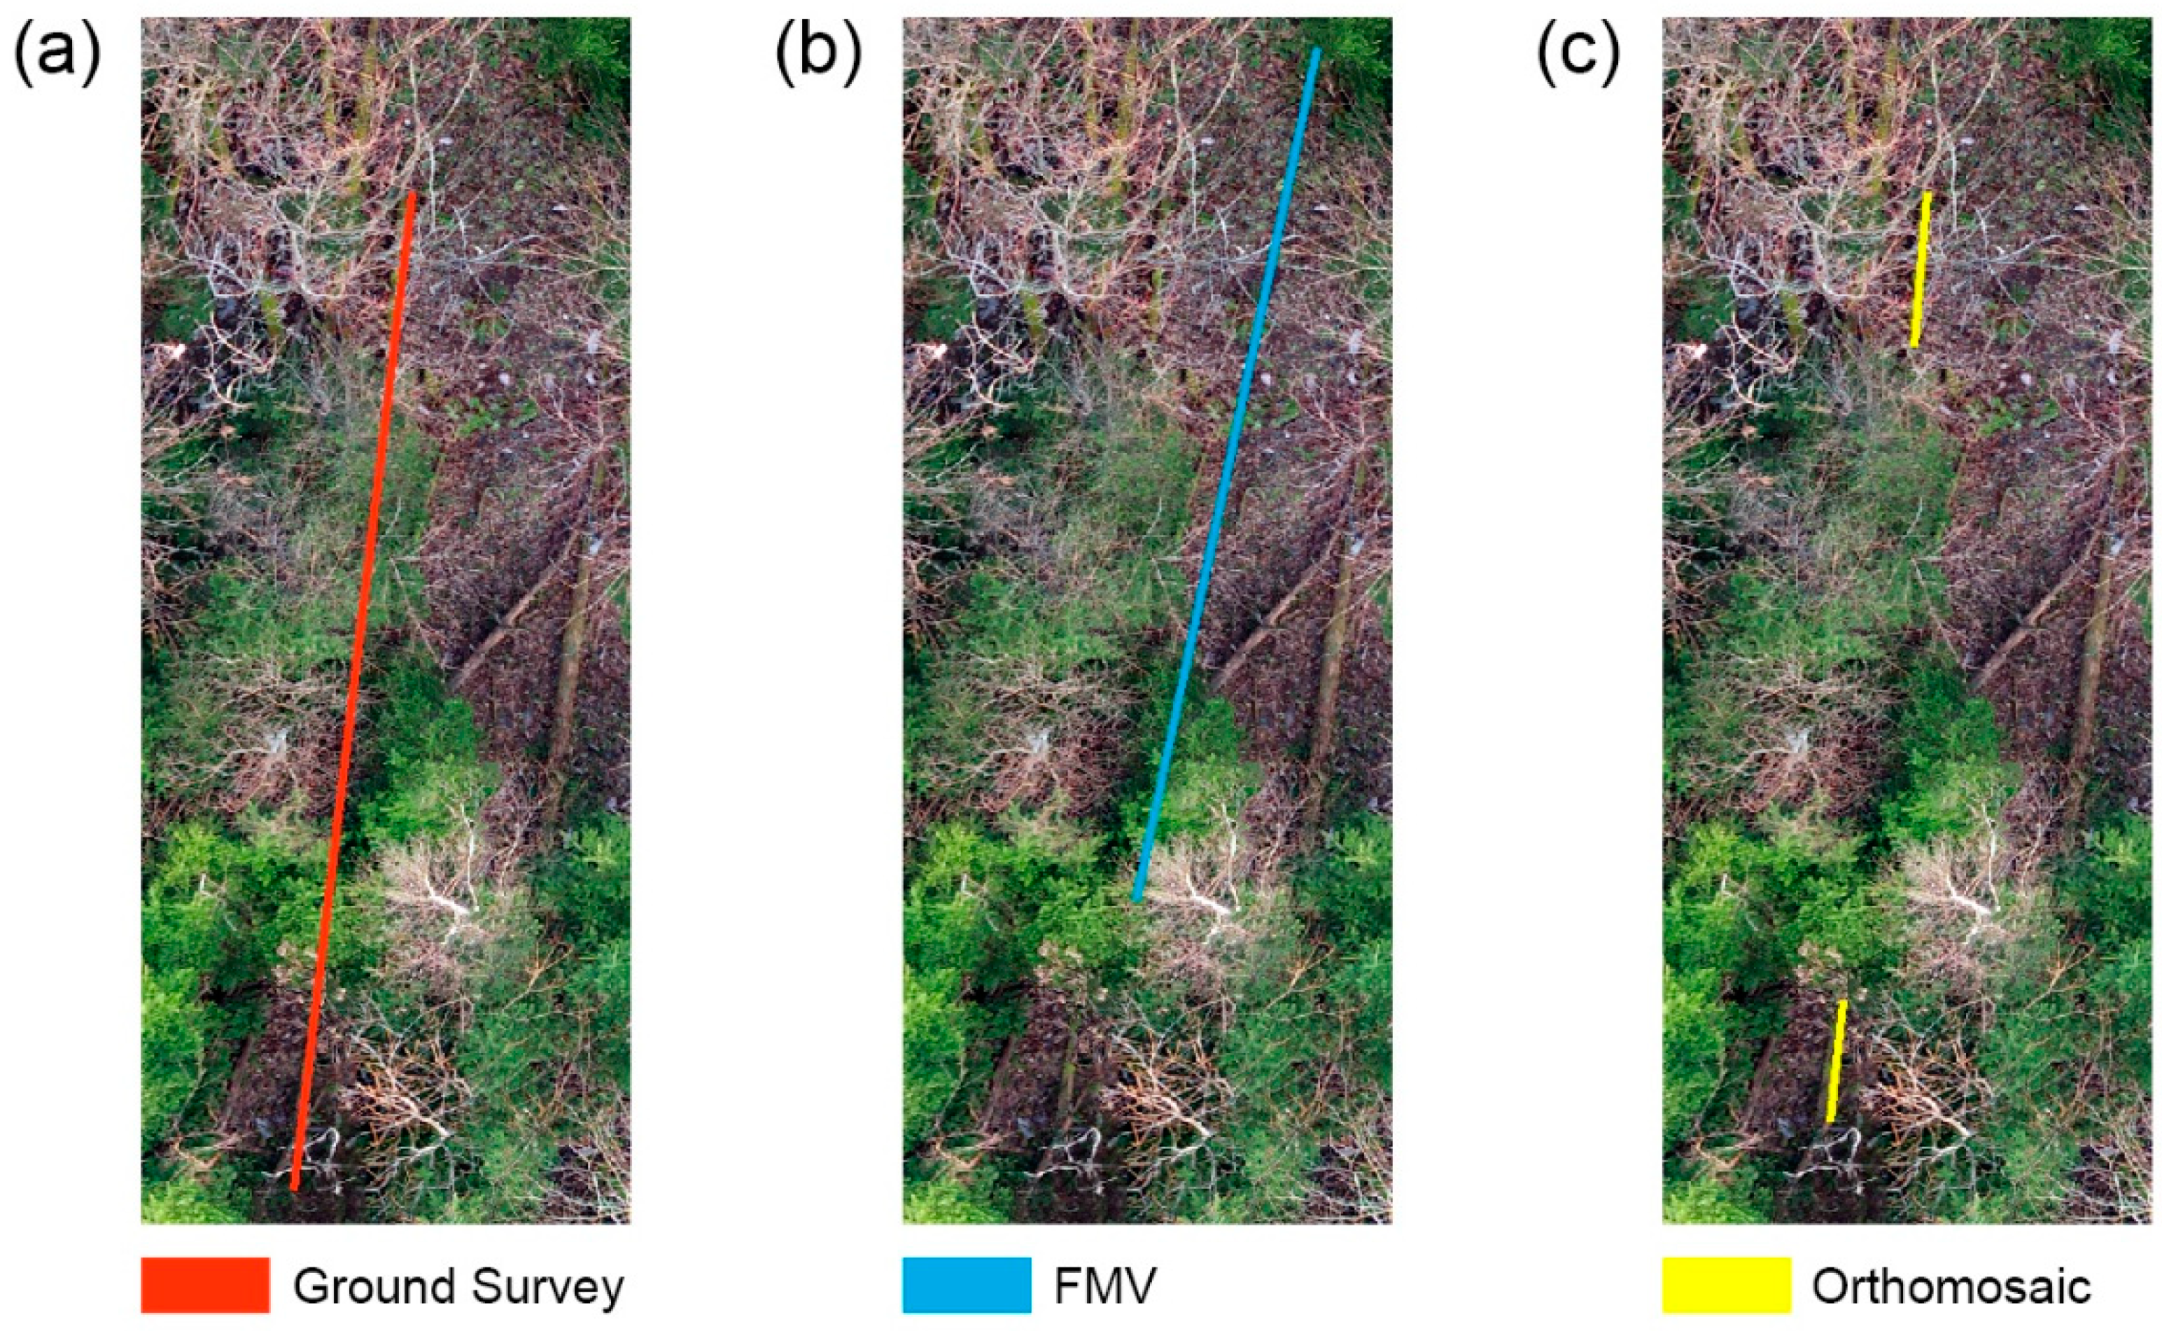
After combining the video with the metadata, we visually interpreted the whole study area throughout the video, frame by frame. The feature data were created inside the video, automatically generating feature data inside the GIS (Figure 3). One feature line was created for each fallen tree, and one feature point for each snapped tree.
2.3.2. SfM Photogrammetry Processing
To create the orthomosaic, we used the SfM technique [47] on Agisoft Metashape [48]. Combining all 145 images with the 4 ground control points, we generated an orthomosaic with 0.793 cm per pixel of spatial resolution, with a horizontal accuracy of 0.77 cm. Through visual interpretation of the generated orthomosaic, we manually created feature lines to identify fallen trees in the whole study area. For snapped trees, the identification was not possible since only the top of the snapped trees could be seen from the orthomosaic.
In addition, a classification map was also created from the orthomosaic to examine how the ground surface (considering the above view) affected the identification of fallen and snapped trees in the windthrow area. The classification map was divided into 3 different classes: vegetation with leaves, vegetation without leaves, and non-vegetation. The vegetation with leaves class consisted mostly of coniferous trees, while the vegetation without leaves class consisted of deciduous trees and shrubs. The non-vegetation class consisted of areas that were exposing everything on the ground, such as soil and deadwood.
2.3.3. Ground Survey Processing
After collecting the GNSS coordinates from the fallen and snapped trees with the RTK system on the field, we imported the data into ArcGIS Pro and converted the coordinates into feature data. For fallen trees, the coordinates located at each end of a fallen tree were connected, creating a feature line. For snapped trees, the coordinates were only converted into feature points with accuracy at centimeter-level [42].
2.4. Comparison
To compare the feature data extracted by the 3 types of processing (FMV, orthomosaic, and ground survey), pairs of fallen and snapped tree features were manually identified through visual interpretation using the ground survey as a reference. For paired damaged tree features between FMV and ground survey, and between orthomosaic and ground survey, we defined them as matched, while the non-paired features from the ground survey were defined as unmatched. In this study, position accuracy was defined from the distance determined in FMV or orthomosaic to that in the ground survey, as explained in detail below. The longer the distance, the lower the position accuracy, while the shorter the distance, the higher the position accuracy.
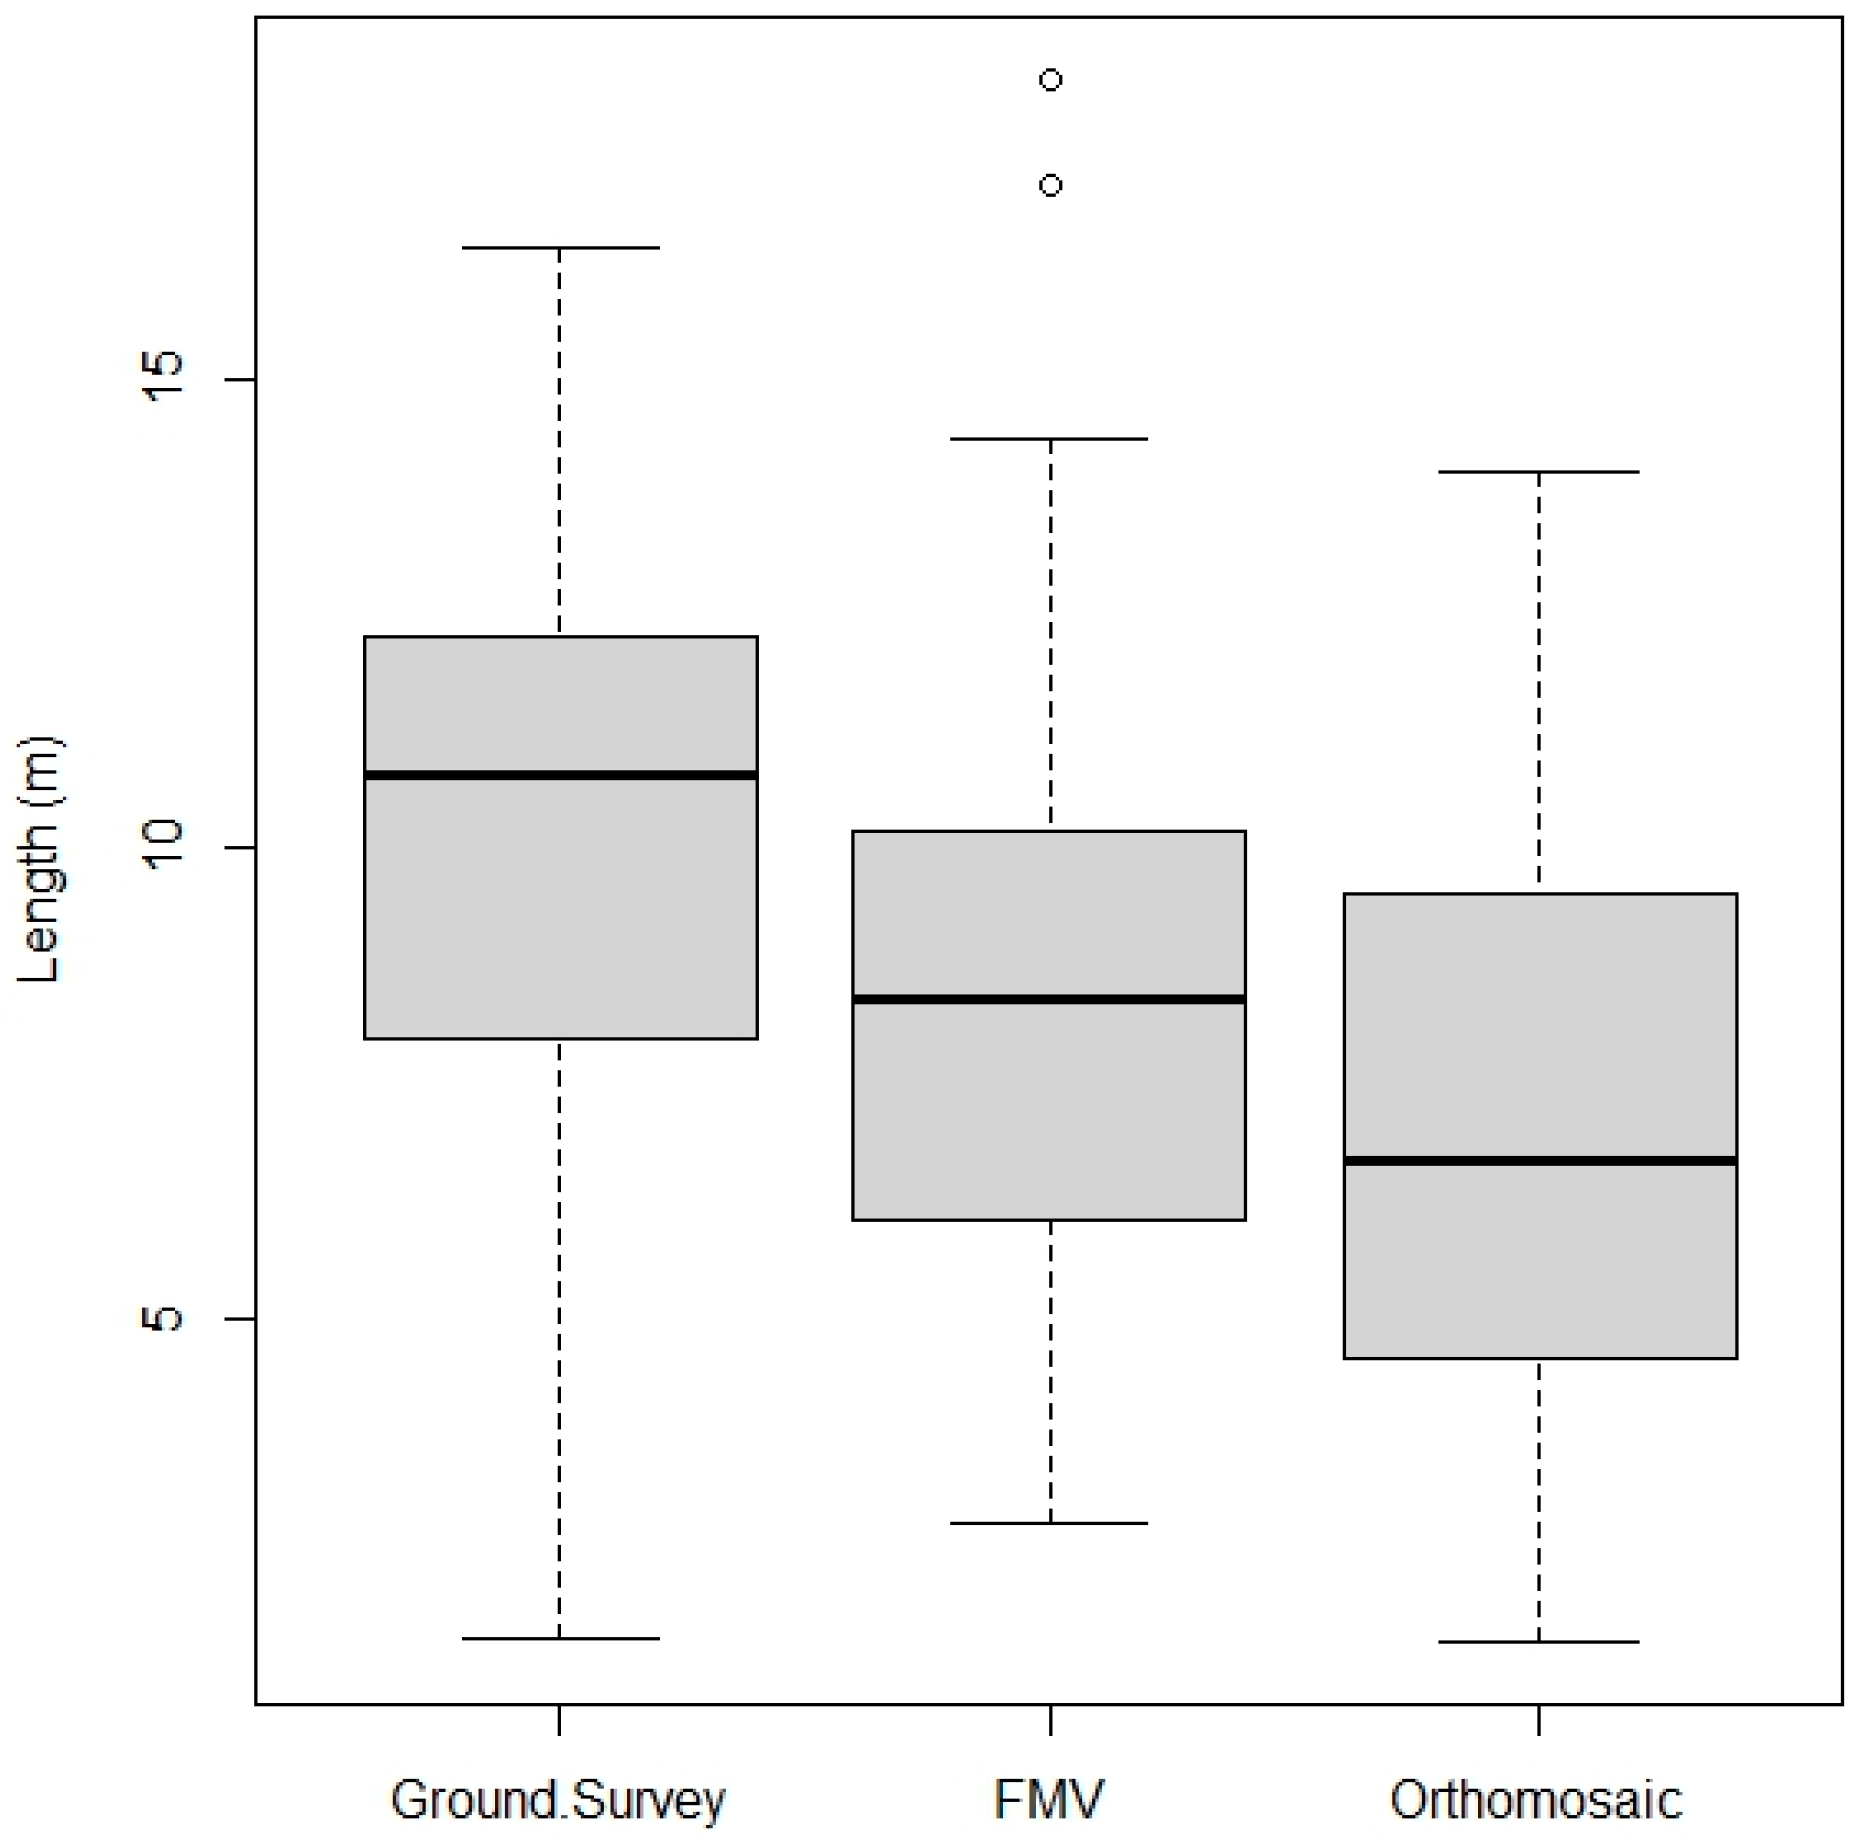
For fallen trees, the visual identification of the pairs was mainly based on their position and angle direction. We matched pairs between FMV and ground survey, and between orthomosaic and ground survey. For position accuracy, using the ground survey as a reference, a center point for each feature line was determined and the distance between the center points of matched pairs was measured. The length of feature lines acquired by FMV, orthomosaic, and ground survey was also compared to examine the characteristics of the feature data extracted by each type of processing.
For snapped trees, we defined the pairs considering the feature data position. We only identified pairs between FMV and ground survey since it was not possible to identify snapped trees from the orthomosaic. For position accuracy, we measured the distance between matched feature points between FMV and the ground survey. We also compared the physical characteristics (height and diameter) to understand the difference between matched and unmatched pairs.
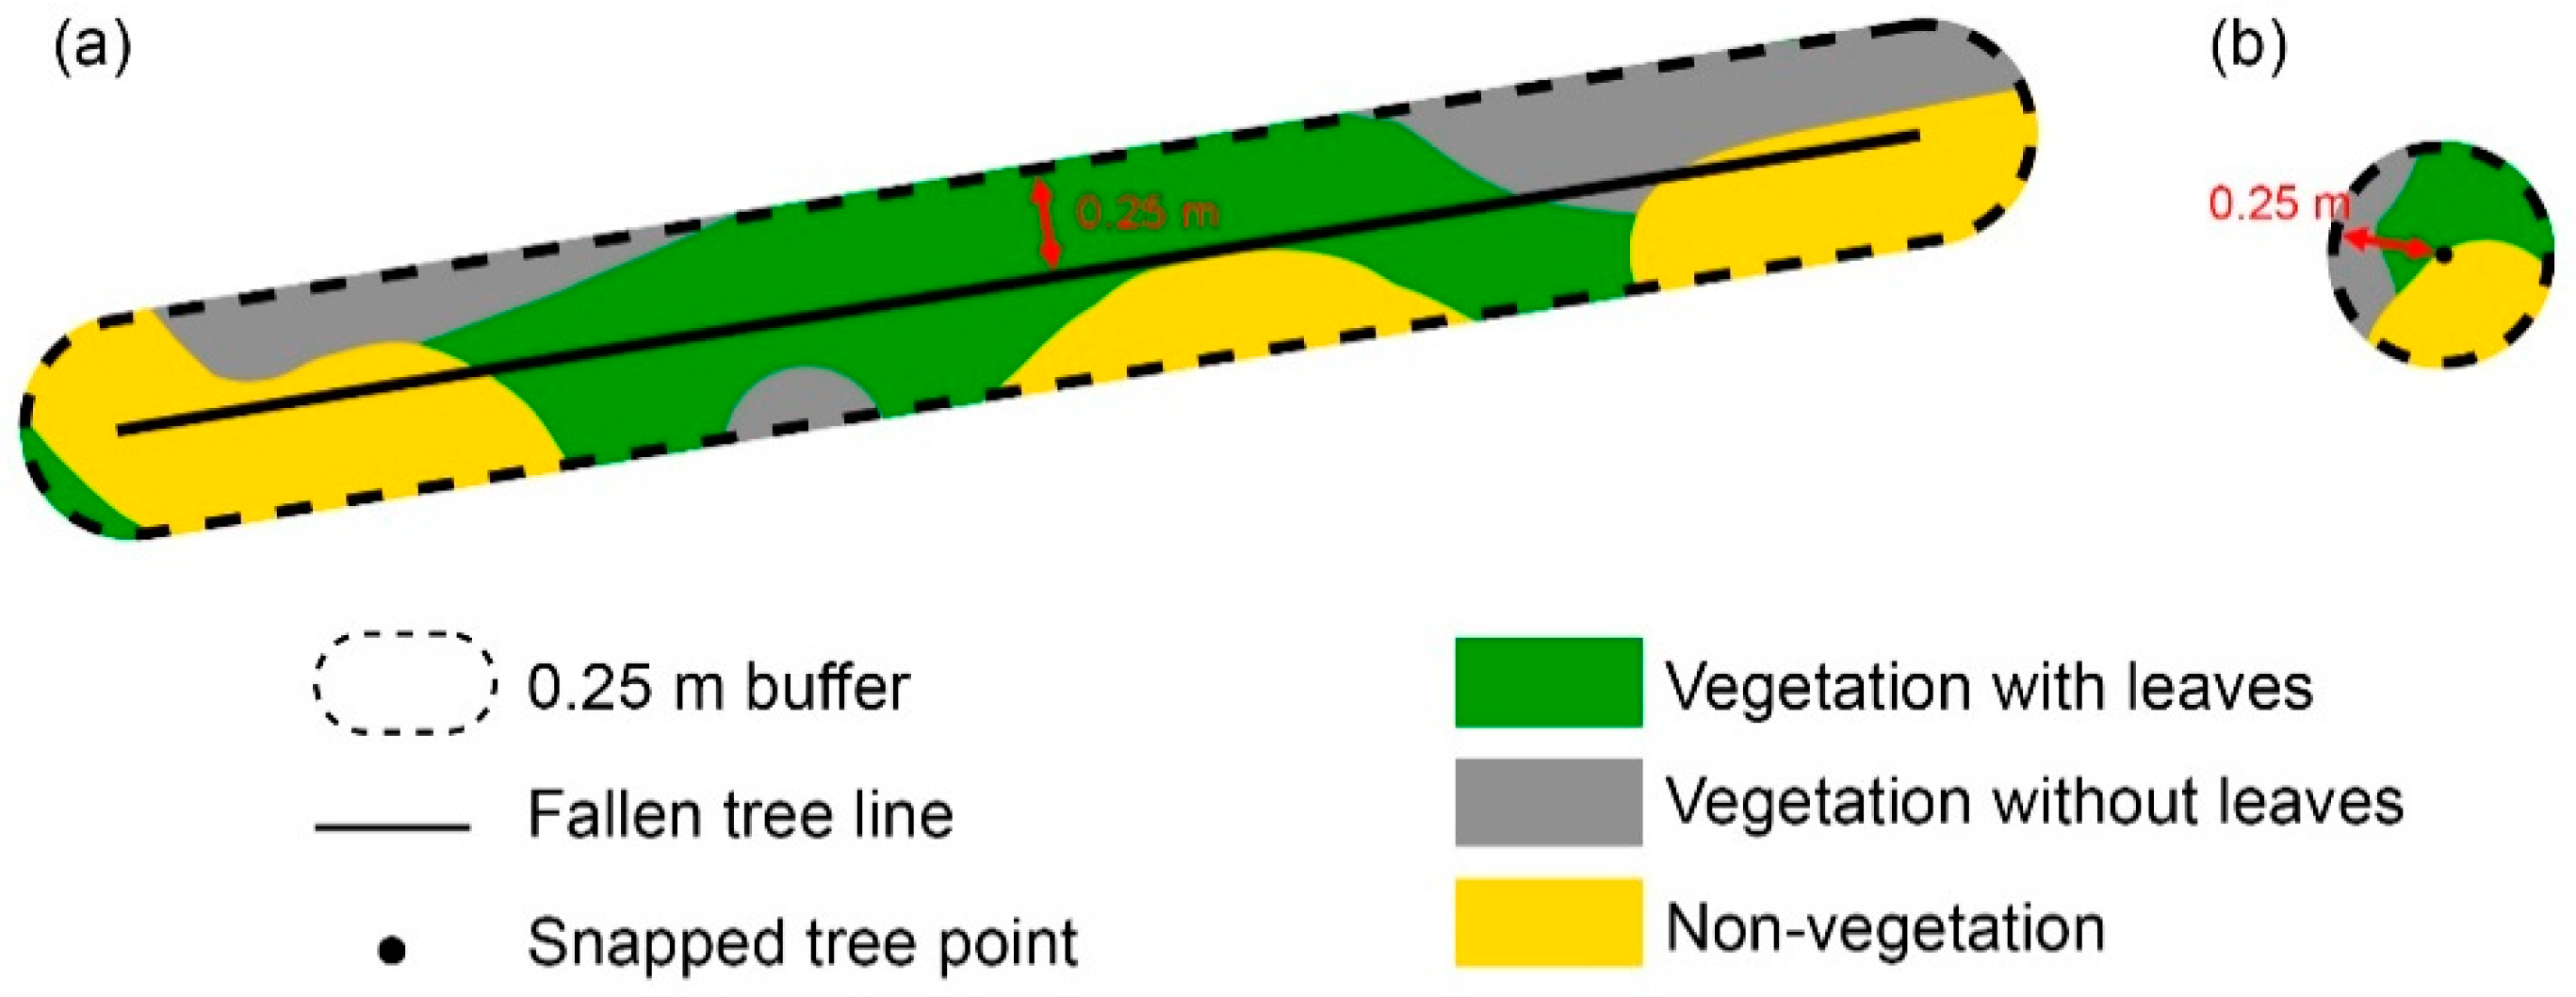
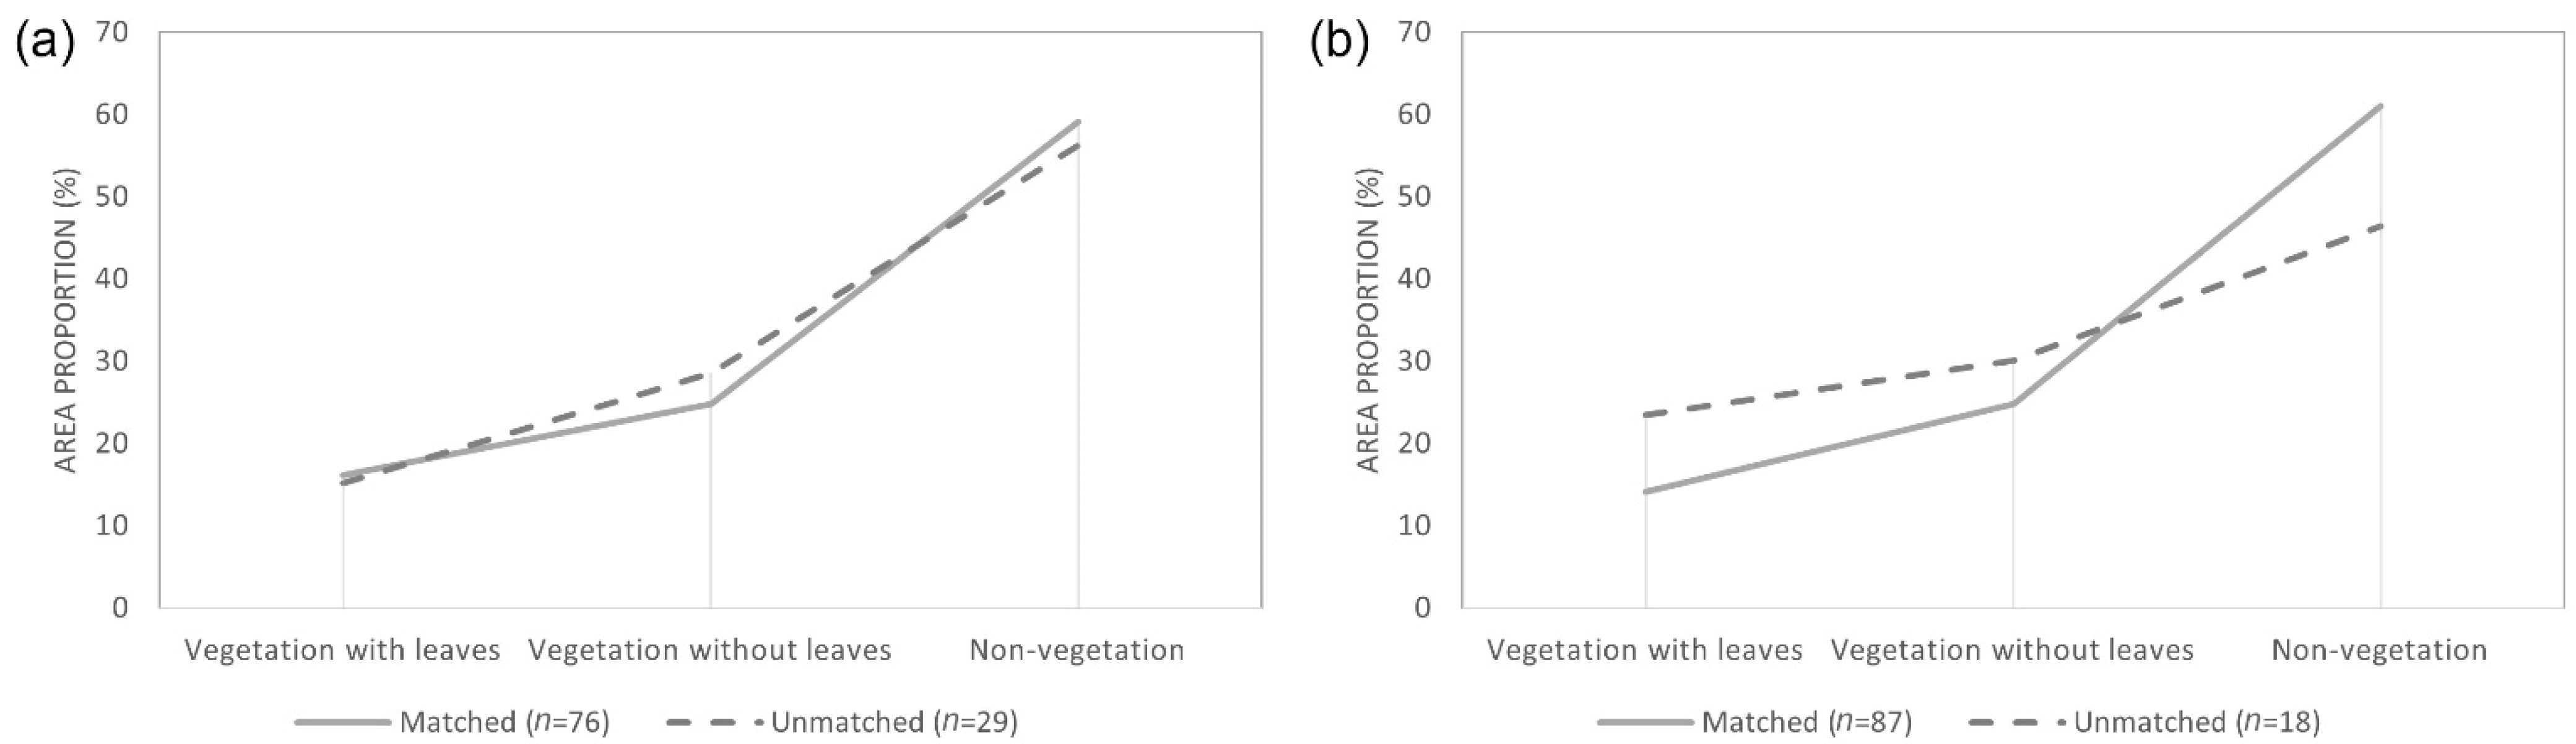
To examine the influence of ground surface on the identification of fallen and snapped trees through FMV and orthomosaic, a 0.25 m buffer was created for each fallen or snapped tree. According to Morimoto et al. [49], the average trunk diameter was 0.5 m in the same study area. Inside each buffer, the percentage of vegetation with leaves, vegetation without leaves, and non-vegetation were calculated from the classification map generated from the orthomosaic (Figure 4). This was necessary since the vegetation and branches frequently hide fallen and snapped trees when viewed from above [24]. To understand the differences in ground surface conditions between matched and unmatched fallen and snapped trees, we tested with the generalized linear models with beta distribution and logit link function [50]. When the p < 0.05, we considered the difference as significant. All data analyses were conducted with R v.4.2.0 [51] using “betareg” v.3.1.4 for generalized linear models [50].
3. Results
3.1. Fallen Trees
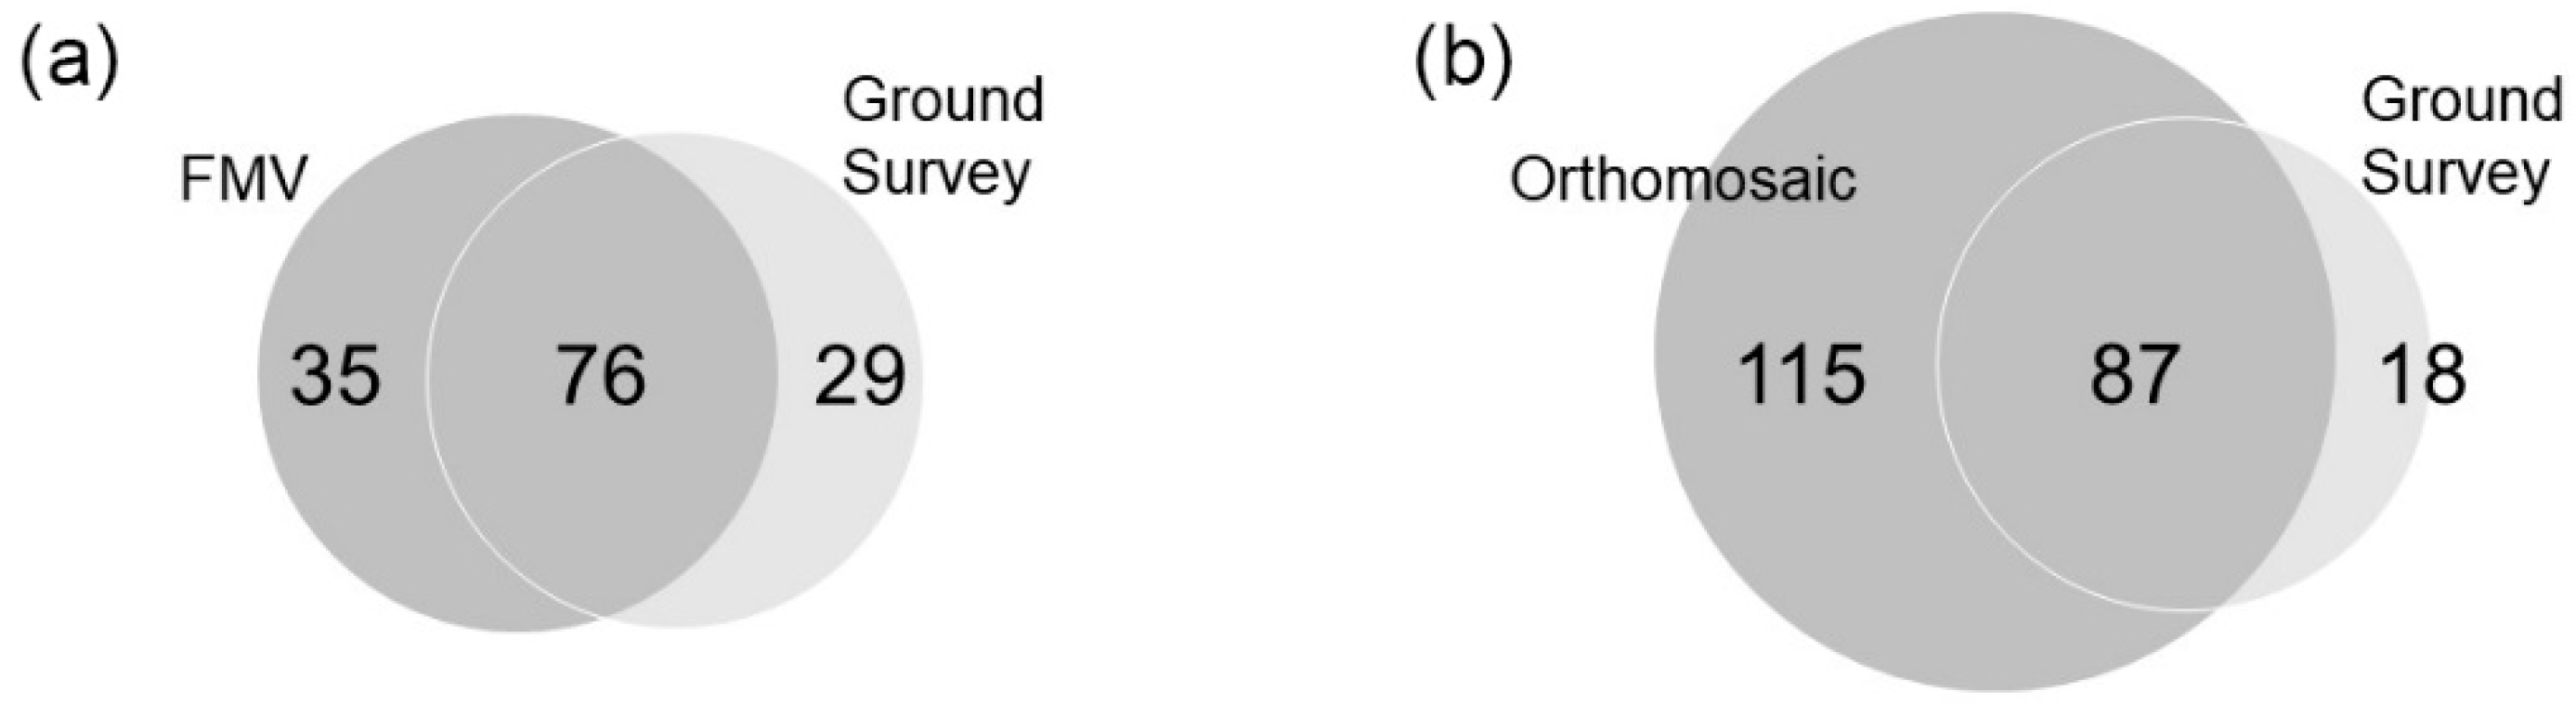
Figure 5 shows the matched and unmatched number of fallen trees identified by FMV and ground survey, and by the orthomosaic and ground survey.
Through FMV a total of 111 fallen trees were identified, while through orthomosaic and the ground survey a total of 202 and 105 fallen trees were identified, respectively. Between the FMV and ground survey, 76 fallen trees were matched, while for non-paired fallen trees, the FMV identified 35, and the ground survey 29 (unmatched). Between the orthomosaic and ground survey, 87 fallen trees were matched, while non-paired fallen trees were 115 and 18 (unmatched) in the orthomosaic and ground survey, respectively.
Considering the position accuracy measured through the distance between the center points of each matched pair of fallen trees, the FMV was 2.58 (s.d. 1.88) m on average, while by orthomosaic the average was 1.47 (s.d. 1.51) m. Mean lengths of fallen trees including all trees were 10.01 (s.d. 3.33) m, 8.25 (s.d. 3.16) m, and 6.96 (s.d. 3.21) m in the ground survey, FMV, and orthomosaic, respectively (Figure 6).
The ground surface conditions from matched and unmatched fallen trees (FMV and orthomosaic) are shown in Figure 7, with the respective p-values (Table 1).
In general, the results from FMV for matched and unmatched fallen trees were similar in all three classes (Figure 6a) with p-values showing no significant differences among all three classes (Table 1). For the vegetation with leaves class, the matched and unmatched fallen trees had an average of 16.14 (s.d. 14.4)% and 15.20 (s.d. 13.7)%, respectively, while for vegetation without leaves, the results presented an average of 24.77 (s.d. 17.6)% for matched fallen trees and 28.58 (s.d. 14.22) % for unmatched trees. The non-vegetation class had the highest percentage among all three classes, with an average of 59.09 (s.d. 19.07)% for matched fallen trees and 56.22 (s.d. 17.19)% for unmatched fallen trees (Figure 7a).
By comparison, the difference between matched and unmatched fallen trees was higher between the orthomosaic and ground survey (Figure 7b). For vegetation with leaves class, while the matched fallen trees presented an average of 14.10 (s.d. 13.36)%, the unmatched fallen trees presented an average of 23.44 (s.d. 15.23) %; the p-value showed that there was a significant difference between matched and unmatched fallen trees. The non-vegetation class also had a significant difference between matched and unmatched fallen trees, but the matched fallen trees average was higher compared to unmatched fallen trees (61.08 (s.d. 17.52) % and 46.47 (s.d. 18.49) %, respectively). For the vegetation without leaves class, the matched fallen trees had an average of 24.82 (s.d. 30.09) %, while unmatched fallen trees presented an average of 30.09 (s.d. 14.78) % with the p-value showing no significant difference between matched and unmatched fallen trees.
3.2. Snapped Trees
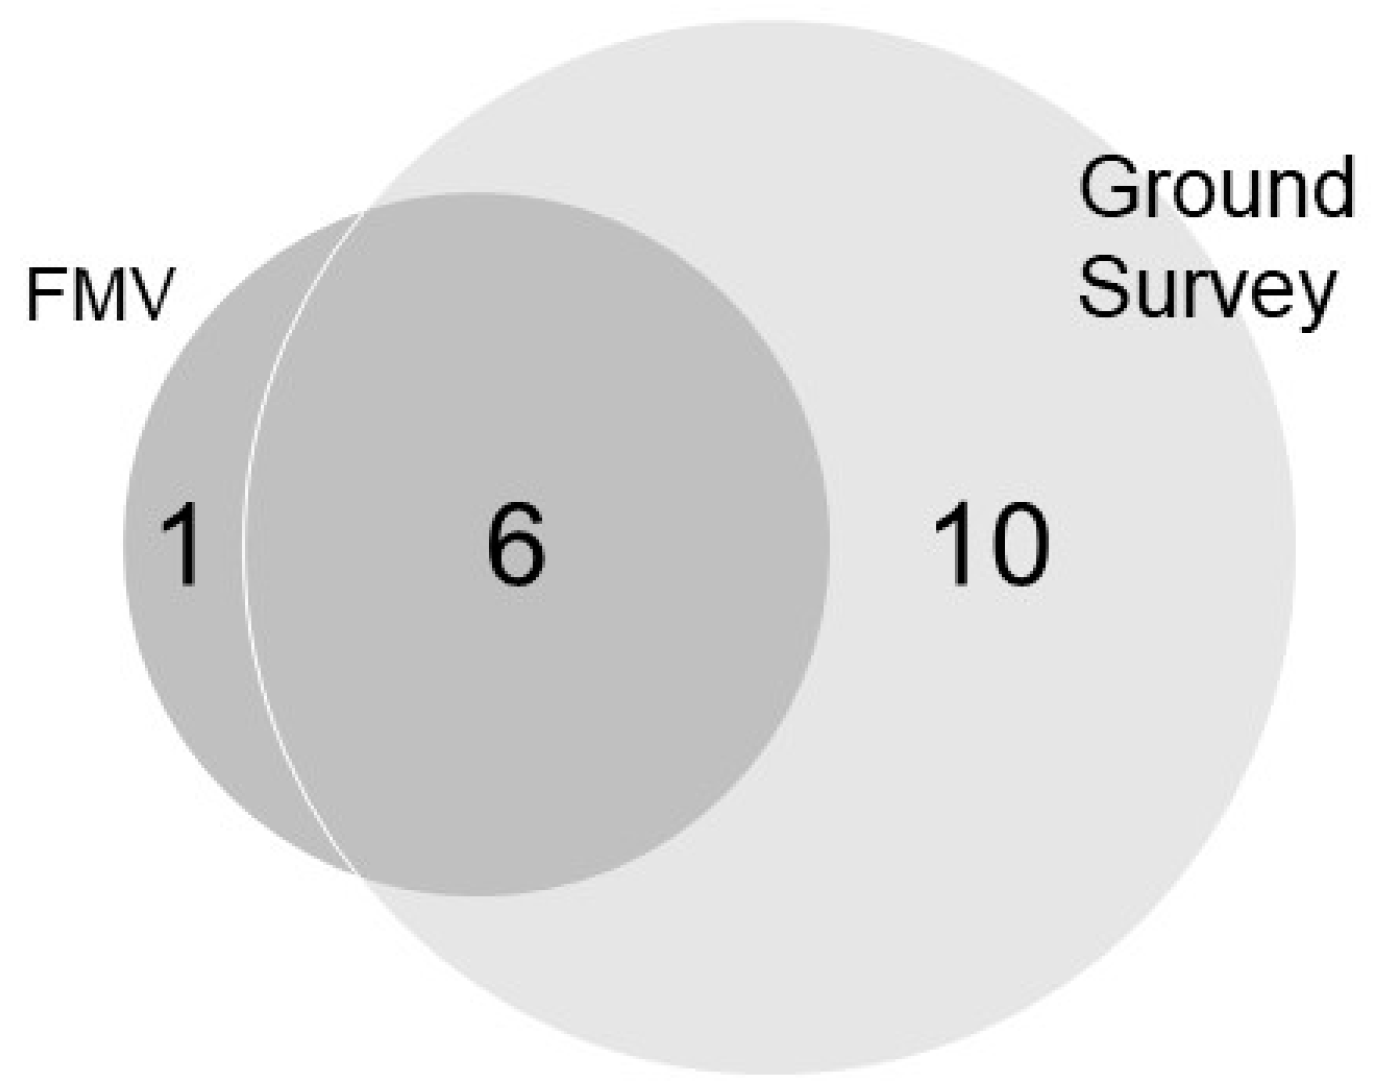
Figure 8 shows only the matched and unmatched number of snapped trees identified by FMV and ground survey. The identification of snapped trees between orthomosaic and ground survey was not possible.
Between the FMV and ground survey, 6 snapped trees were matched, while non-paired snapped trees, the FMV identified 1 snapped tree, and the ground survey 10 snapped trees (unmatched). Considering the ground survey as the reference, the position accuracy of FMV had an average of 2.31 (s.d. 0.61) m.
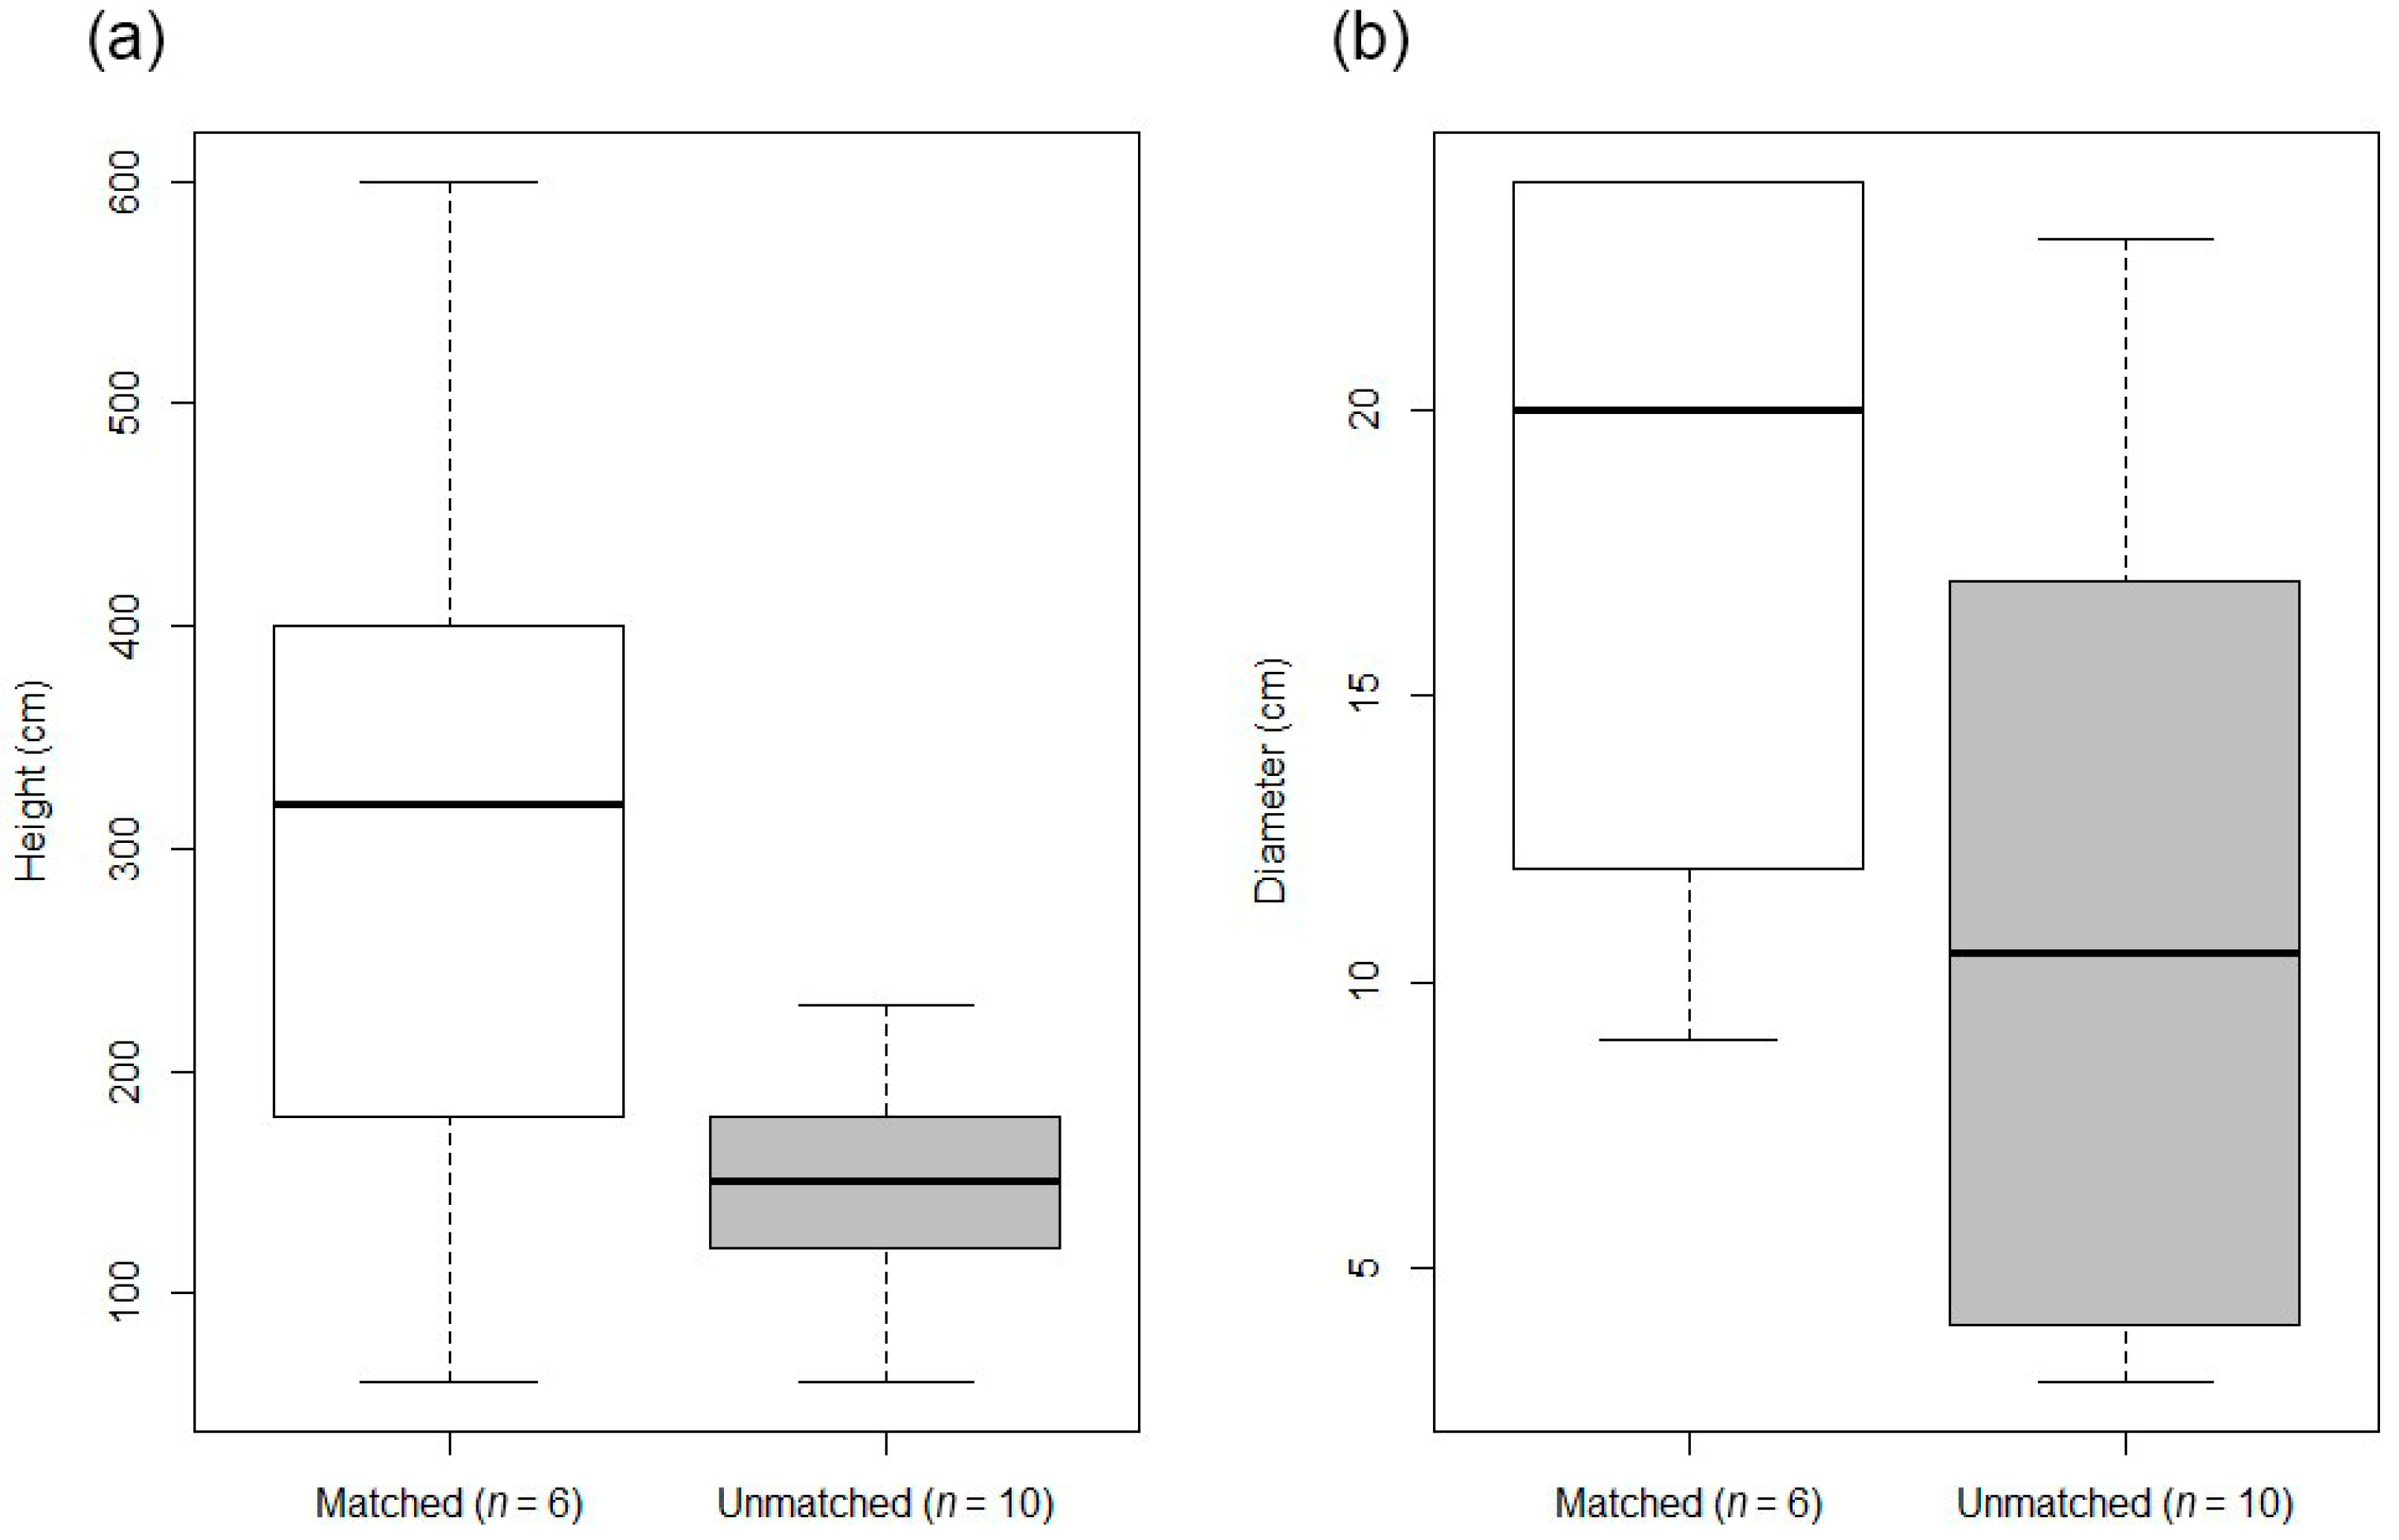
The physical characteristics of matched and unmatched trees between FMV and ground survey showed higher height averages for matched snapped trees (313.33 (s.d. 175.37) cm) compared to the unmatched snapped trees (149 (s.d. 46.36) cm). For diameter dimensions, the matched snapped trees had an average of 18.17 (s.d. 5.73) cm, while unmatched snapped trees had an average of 11.10 (s.d. 7.37) cm (Figure 9).
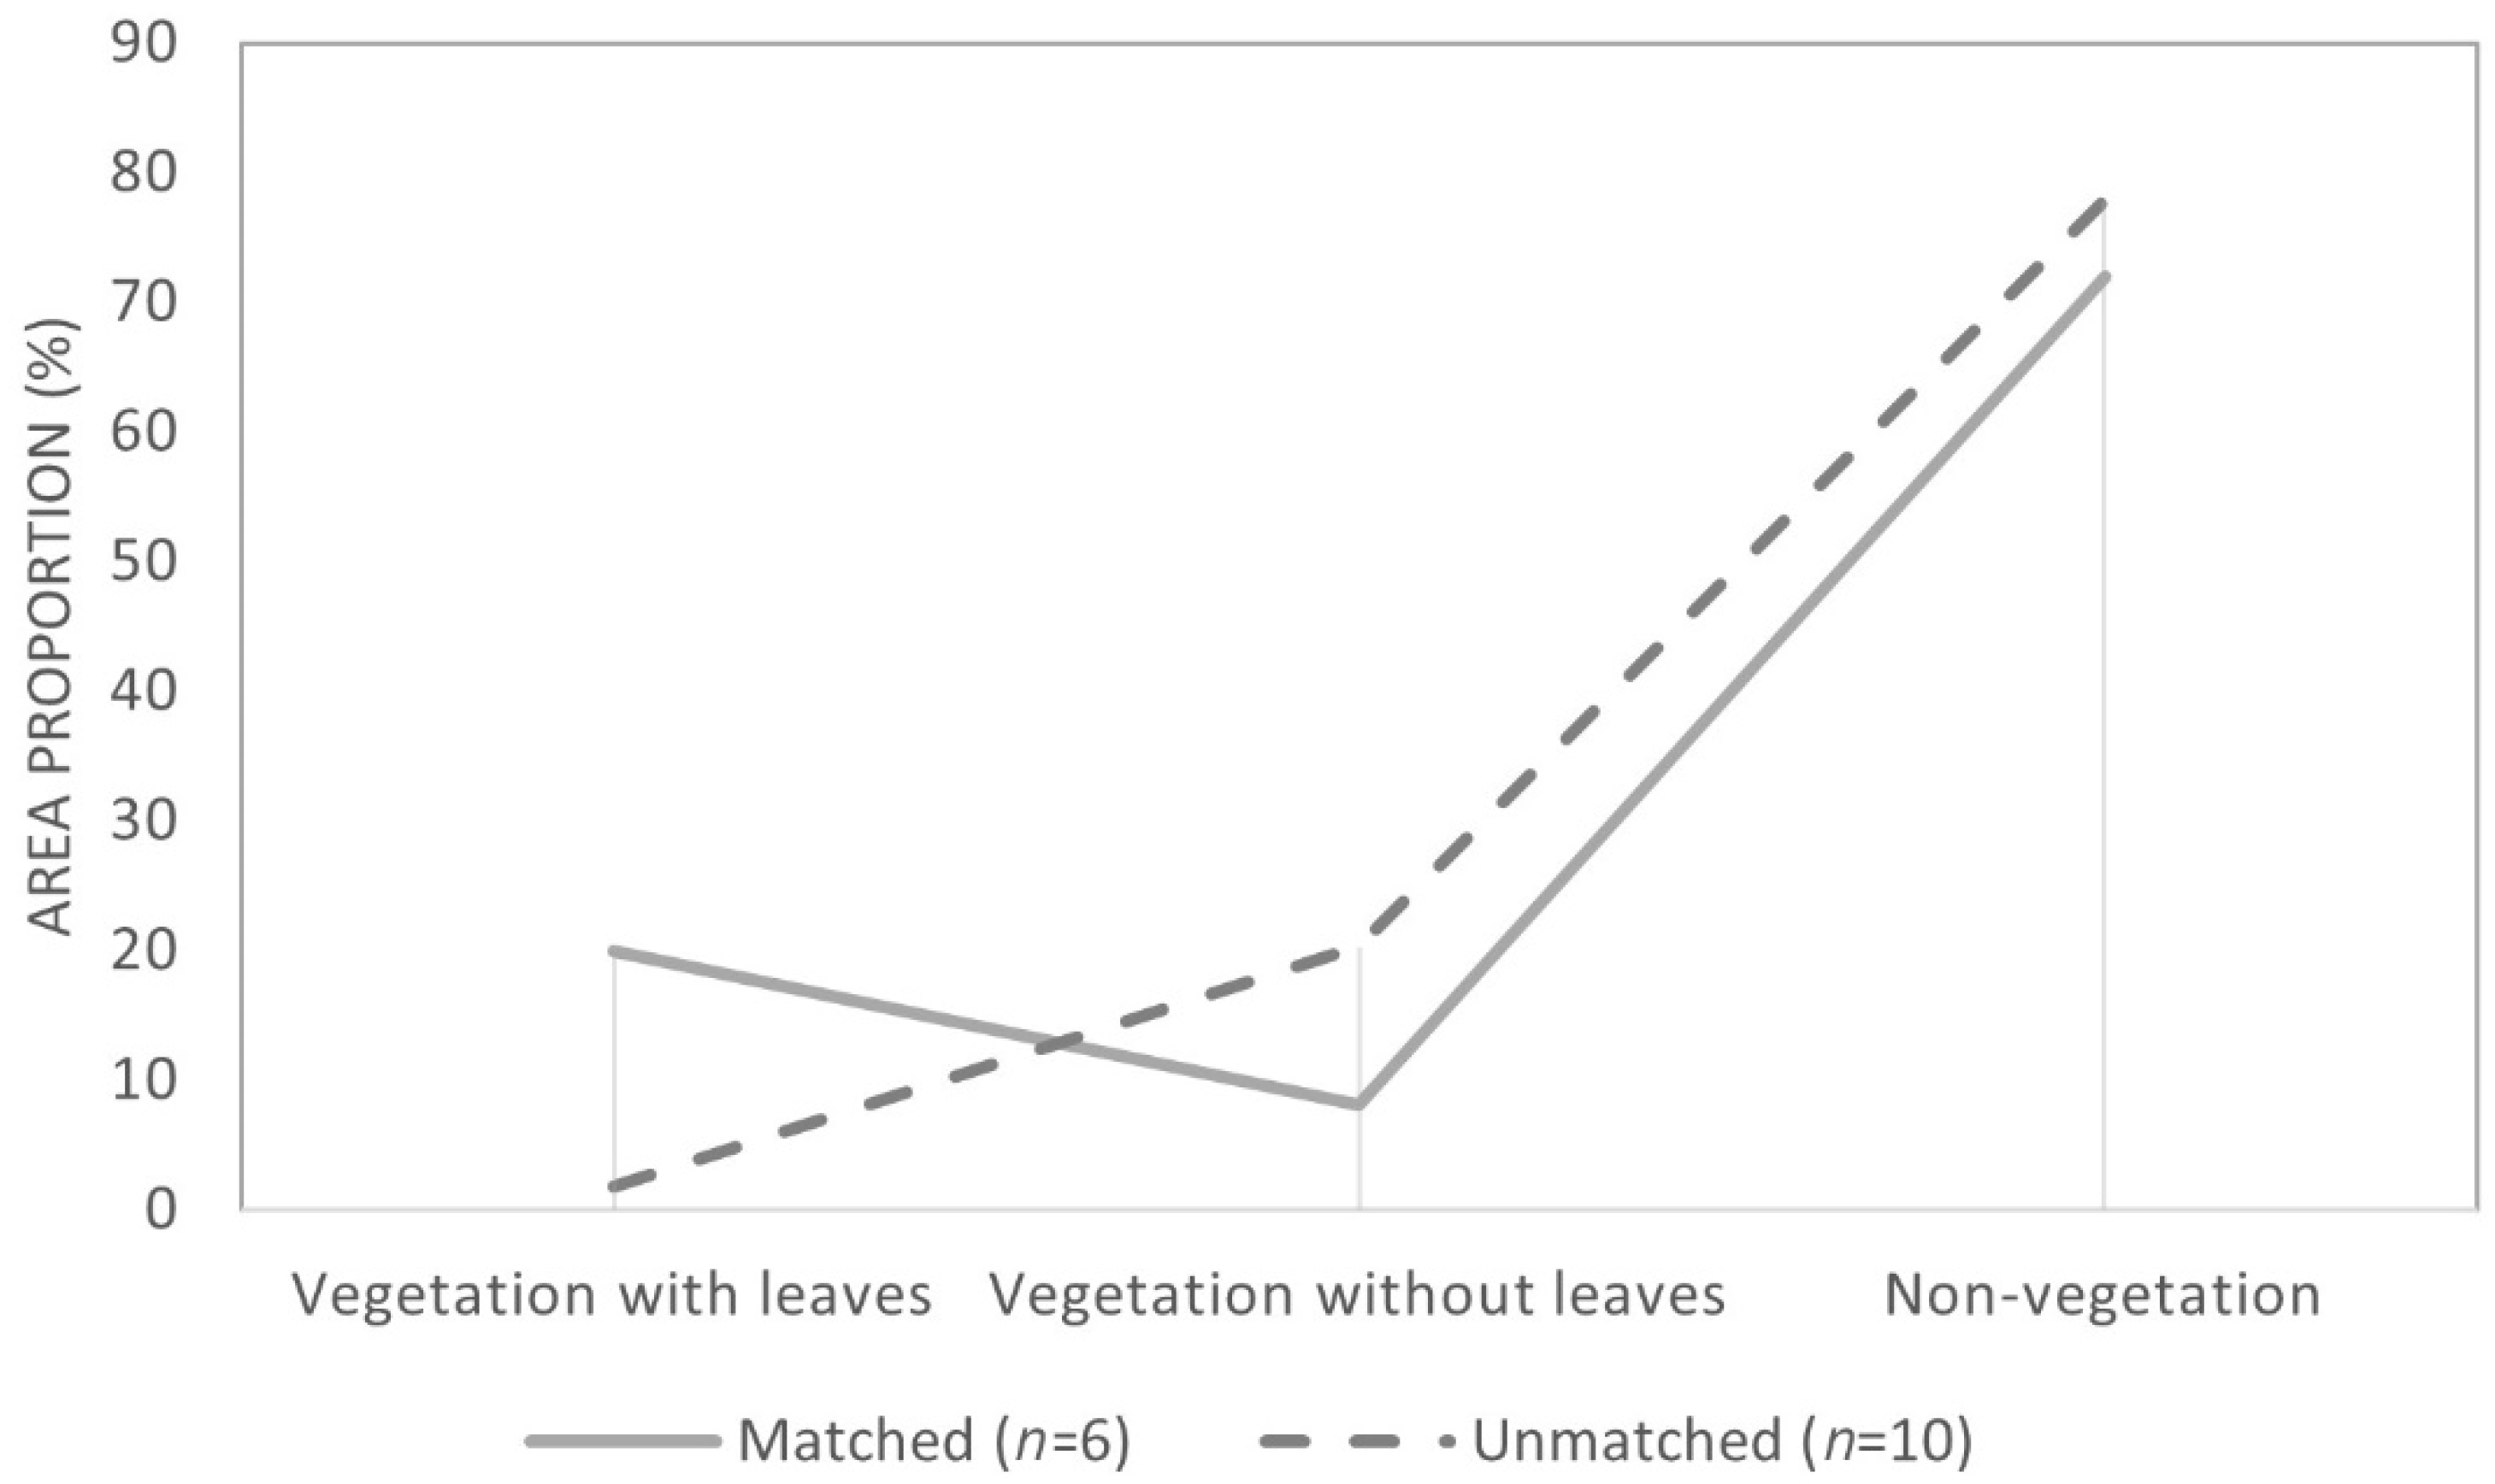
The coverage proportion of vegetation with leaves, vegetation without leaves, and non-vegetation for FMV is shown in Figure 10, with the respective p-values (Table 2):
Because of the small number of samples, the variance between matched and unmatched snapped trees was high. The p-value showed a non-significant difference between matched and unmatched trees. Although looking into the mean values, the vegetation with leaves class had higher average values (19.92 (s.d. 21.7) %) for the matched snapped trees and lower average values (1.84 (s.d. 3.08) %) for unmatched snapped trees. By comparison, the vegetation without leaves class had an average of 8.09 (s.d. 6.79) % for matched snapped trees, and 20.28 (s.d. 28.5) % for unmatched snapped trees. The non-vegetation class was also higher on unmatched snapped trees when compared to the matched snapped trees (77.87 (s.d. 30.86) % and 71.99 (s.d. 23.55) %, respectively).
4. Discussion
With the study conducted in December when deciduous trees have no leaves, the FMV technology was suitable to identify damaged trees in a windthrow area due to the ability of video to deliver better context-awareness, where views of the same point from different angles can provide more opportunities to find them underneath the canopies [24]. Although delivering lower position accuracies compared to the orthomosaic, the FMV was capable of identifying fallen trees even with the presence of vegetation with leaves and vegetation without leaves covering them. The identification of snapped trees was also possible through FMV, different to the orthomosaic, which could not identify snapped trees.
4.1. Performance of FMV and Orthomosaic for Fallen Trees Identification
In both FMV and orthomosaic we found more fallen trees than in the ground survey (Figure 5). This happened for two main reasons: it was possible to survey the whole study area [52], and because of the presence of vegetation with leaves, the orthomosaic identified one single fallen tree as multiple fallen trees (Appendix A, Figure A2).
For FMV, the graph in Figure 7a showed no differences in the three classes between matched and unmatched trees, evidencing that the environment did not have a significant influence on the identification of fallen trees. The camera angle and the different perspectives from the same target throughout the frames helped in the identification of fallen trees even with the presence of vegetation with leaves and vegetation without leaves.
For orthomosaic, the graph in Figure 7b showed a higher difference in vegetation with leaves and non-vegetation classes between matched and unmatched fallen trees compared to FMV. Apart from having fewer non-vegetation averages, the higher amount of vegetation with leaves for unmatched trees showed that the fallen trees were partially or fully covered, where one single fallen tree could be identified as multiple fallen trees (Appendix A, Figure A2). Thus, resulting in a higher number of fallen trees with a shorter length average, 6.96 (s.d. 3.21) m for orthomosaic compared to 10.01 (s.d. 3.33) m for the ground survey (Figure 6).
Overall, for fallen tree identification, the ability of video in delivering more context-awareness compared to the orthomosaic [31,53] shows the potential of FMV in identifying fallen trees in areas with vegetation coverage, while only visible trees could be identified by orthomosaics [54]. Although the frame movement delivered better context-awareness, it was also a hindrance to identifying fallen trees. Since the frame is always moving, consequently its position is also moving, generating a misalignment between some frames [55]. This led to a lower position accuracy when compared to the orthomosaic.
4.2. Performance of FMV for Snapped Trees Identification
The ability of FMV to see the same snapped tree in different frames (since the video is moving), made it possible to identify snapped trees through video [55]. Although the video movement made it possible to identify snapped trees, the position accuracy of snapped trees was similar to the fallen trees’ identification accuracy (2.58 (s.d. 1.88) m for fallen trees, and 2.31 (s.d. 0.61) m for snapped trees). This also happened because of the misalignment between video frames which are always moving.
The characteristics of matched snapped trees were taller and thicker compared to unmatched ones (Figure 9), and consequently shorter and thinner snapped trees were assumed to be harder to identify. Physical characteristics were not the only variables to affect their identification; the presence of vegetation without leaves was also a hindrance to the identification of snapped trees due to their similarity with the standing tree branches.
The combination of shorter and thinner snapped trees in areas with the presence of vegetation without leaves (branches of deciduous trees) made snapped trees difficult to identify in windthrow areas due to the similarity between tree branches and snapped trees. Despite higher averages of vegetation with leaves for matched snapped trees, the color difference between the snapped tree and the green vegetation was less of a hindrance to identifying snapped trees (Appendix A, Figure A3).
4.3. FMV advantages and limitations for Damaged Trees Identification
While the FMV delivered lower position accuracies compared to the orthomosaic, it was sufficient to calculate the number of damaged trees based on unit per area. In addition, since an RTK UAV was used for this study, the data taken from FMV yielded results with better accuracy (around 3 m) than common handheld GNSS devices, which generally vary between 5 to 10 m under favorable conditions [56]. Another limitation of FMV was observed in the identification of short and thin snapped trees, but larger segments of deadwood, which remain in the stand longer and play an important role in forest ecosystems [57], could be identified by using FMV.
In contrast to the orthomosaic, the FMV was able to identify snapped trees. The FMV showed a simpler workflow and faster processing time compared with the orthomosaic, mainly due to the ability to analyze the data by just combining the metadata with the video. Thus, the FMV method allows quick assessment of individual damaged trees, enabling the generation of fast and accurate information for forest managers to take quick actions, which is key in deciding the management of disturbed areas [7,8]. Furthermore, FMV technology also showed great potential to improve and support the interpretation of remote sensed data and ground surveys, due to the enhanced context-awareness provided by the video. This context awareness could potentially open up new possibilities for monitoring damaged trees in forested areas with complex vegetation and rich understory.
Overall, the FMV proved to be a powerful tool in the forest disaster management process due to its simple workflow, accuracy, and quick results—even with the presence of vegetation—providing detailed information on damaged trees in windthrow areas to identify optimum management measures. New studies using this technology combined with other technologies, such as object detection through deep learning, are encouraged to automatically detect damaged trees in windthrow areas.
Author Contributions
Conceptualization, F.F., J.M., and N.Y.; Data curation, F.F.; Formal analysis, N.Y.; Investigation, F.F.; Project administration, J.M.; Resources, H.S. and M.K.; Supervision, J.M. and M.K.; Validation, N.Y. and T.K.; Visualization, F.F.; Writing—original draft, F.F.; Writing—review and editing, F.F., J.M., N.Y. and T.K. All authors have read and agreed to the published version of the manuscript.
Funding
This research received JSPS KAKENHI Grant Number JP17H01516 and TOUGOU Grant Number JPMXD0717935498. This work was also supported by MEXT-Program for the advanced studies of climate change projection (SENTAN) Grant Number JPMXD0722678534.
Data Availability Statement
Not applicable.
Acknowledgments
The authors would like to thank FRS Corporation, Sapporo, Japan, and ESRI for providing the necessary technology to make this study possible.
Conflicts of Interest
The authors declare no conflict of interest.
Appendix A
Figure A1.
The surveyed area in the ground survey.

Figure A2.
Fallen trees identified through (a) ground survey, (b) FMV, and (c) orthomosaic.

Figure A3.
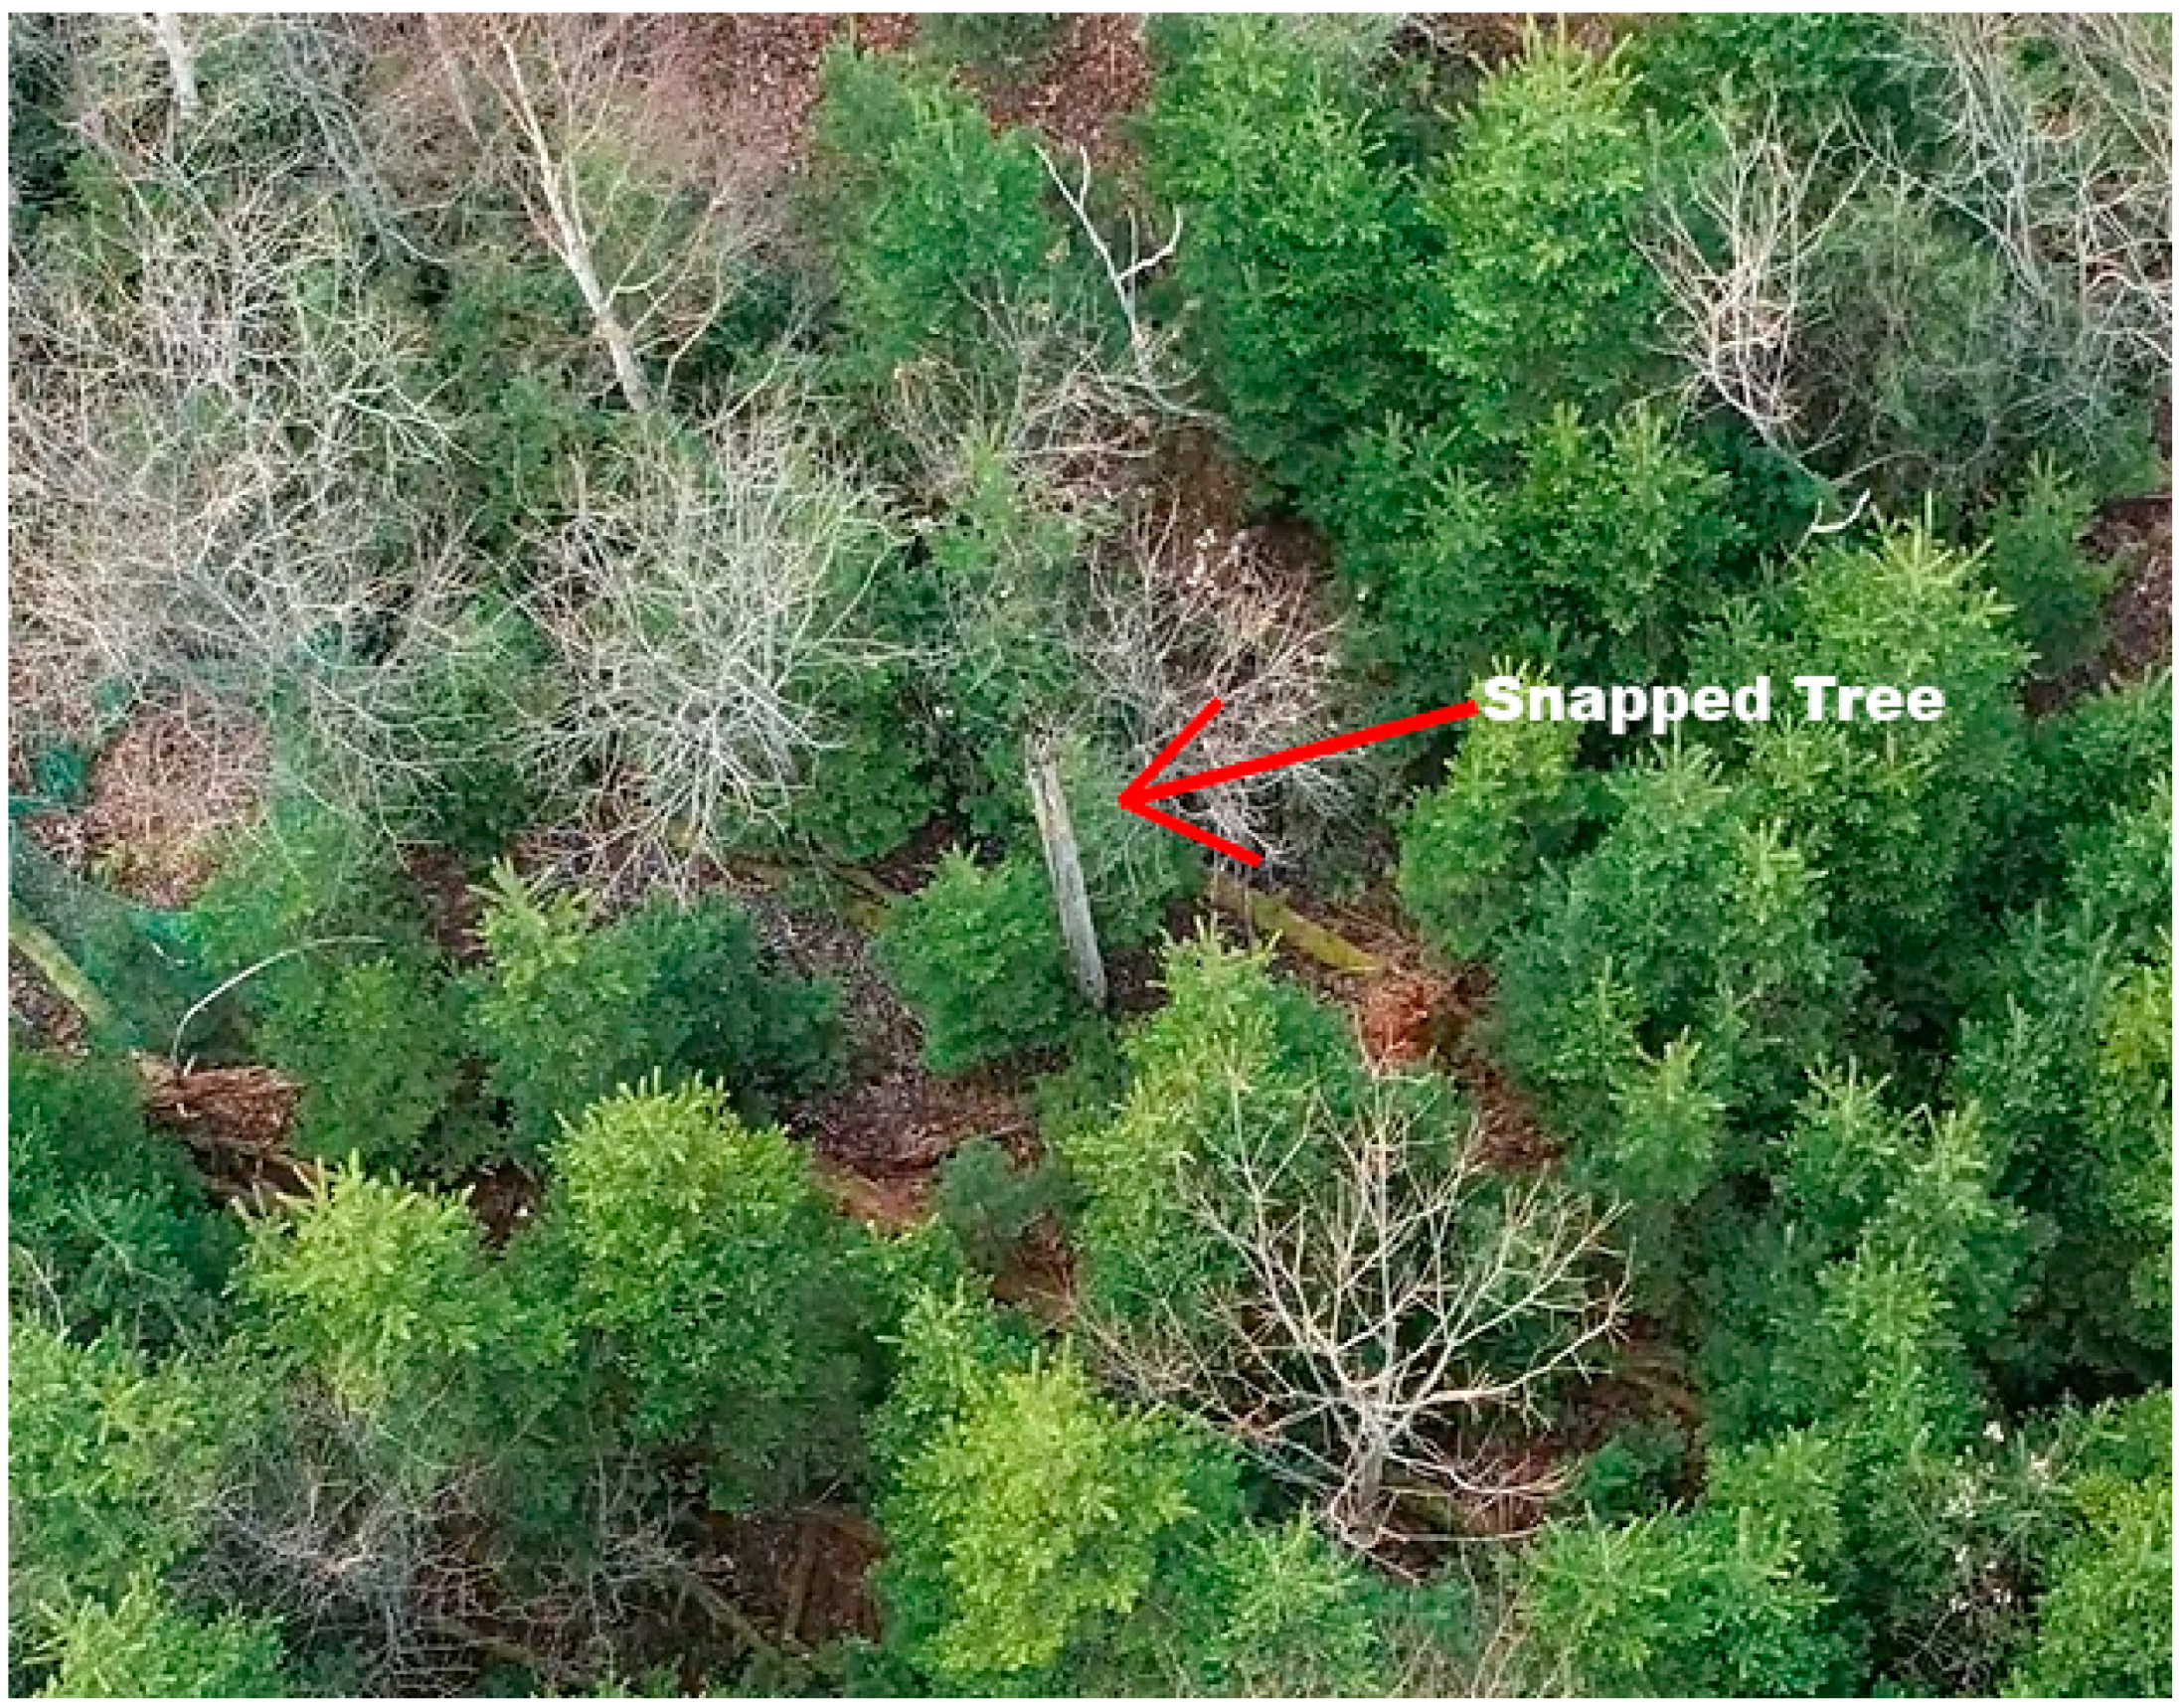
Video frame from a snapped tree.

References
- Dale, V.H.; Joyce, L.A.; McNulty, S.; Neilson, R.P.; Ayres, M.P.; Flannigan, M.D.; Hanson, P.J.; Irland, L.C.; Lugo, A.E.; Peterson, C.J.; et al. Climate Change and Forest Disturbances. Bioscience 2001, 51, 723. [Google Scholar] [CrossRef] [Green Version]
- Mabry, C.M.; Hamburg, S.P.; Lin, T.-C.; Horng, F.-W.; King, H.-B.; Hsia, Y.-J. Typhoon Disturbance and Stand-level Damage Patterns at a Subtropical Forest in Taiwan1. Biotropica 1998, 30, 238–250. [Google Scholar] [CrossRef]
- Murakami, H.; Wang, Y.; Yoshimura, H.; Mizuta, R.; Sugi, M.; Shindo, E.; Adachi, Y.; Yukimoto, S.; Hosaka, M.; Kusunoki, S.; et al. Future Changes in Tropical Cyclone Activity Projected by the New High-Resolution MRI-AGCM. J. Clim. 2012, 25, 3237–3260. [Google Scholar] [CrossRef]
- Morimoto, J.; Negishi, J. Ecological resilience of ecosystems to human impacts: Resilience of plants and animals. Landsc. Ecol. Eng. 2019, 15, 131–132. [Google Scholar] [CrossRef] [Green Version]
- Thompson, I.; Mackey, B.; Mcnulty, S.G.; Mosseler, A. Forest Resilience, Biodiversity, and Climate Change. A Synthesis of the Biodiversity/Resilience/Stability Relationship in Forest Ecosystems; Secretariat of the Convention on Biological Diversity: Montreal, QC, Canada, 2009; ISBN 9292251376. [Google Scholar]
- Waldron, K.; Ruel, J.-C.; Gauthier, S. Forest structural attributes after windthrow and consequences of salvage logging. For. Ecol. Manag. 2013, 289, 28–37. [Google Scholar] [CrossRef]
- Dobor, L.; Hlásny, T.; Rammer, W.; Zimová, S.; Barka, I.; Seidl, R. Is salvage logging effectively dampening bark beetle outbreaks and preserving forest carbon stocks? J. Appl. Ecol. 2020, 57, 67–76. [Google Scholar] [CrossRef]
- Leverkus, A.B.; Buma, B.; Wagenbrenner, J.; Burton, P.J.; Lingua, E.; Marzano, R.; Thorn, S. Tamm review: Does salvage logging mitigate subsequent forest disturbances? For. Ecol. Manag. 2021, 481, 118721. [Google Scholar] [CrossRef]
- Cooper-Ellis, S.; Foster, D.R.; Carlton, G.; Lezberg, A. Forest response to catastrophic wind: Results from an experimental hurricane. Ecology 1999, 80, 2683–2696. [Google Scholar] [CrossRef]
- Mori, A.S.; Lertzman, K.P.; Gustafsson, L. Biodiversity and ecosystem services in forest ecosystems: A research agenda for applied forest ecology. J. Appl. Ecol. 2017, 54, 12–27. [Google Scholar] [CrossRef]
- Morimoto, J.; Umebayashi, T.; Suzuki, S.N.; Owari, T.; Nishimura, N.; Ishibashi, S.; Shibuya, M.; Hara, T. Long-term effects of salvage logging after a catastrophic wind disturbance on forest structure in northern Japan. Landsc. Ecol. Eng. 2019, 15, 133–141. [Google Scholar] [CrossRef]
- Siitonen, J. Forest Management, Coarse Woody Debris and Saproxylic Organisms: Fennoscandian Boreal Forests as an Example. Ecol. Bull. Ecol. Woody Debris Boreal For. 2001, 49, 11–41. [Google Scholar] [CrossRef]
- Vítková, L.; Bače, R.; Kjučukov, P.; Svoboda, M. Deadwood management in Central European forests: Key considerations for practical implementation. For. Ecol. Manag. 2018, 429, 394–405. [Google Scholar] [CrossRef]
- Jonsson, B.; Kruys, N.; Ranius, T. Ecology of species living on dead wood—Lessons for dead wood management. Silva Fenn. 2005, 39, 289–309. [Google Scholar] [CrossRef] [Green Version]
- Furukawa, F.; Morimoto, J.; Yoshimura, N.; Kaneko, M. Comparison of Conventional Change Detection Methodologies Using High-Resolution Imagery to Find Forest Damage Caused by Typhoons. Remote Sens. 2020, 12, 3242. [Google Scholar] [CrossRef]
- Im, J.; Park, H.; Takeuchi, W. Advances in Remote Sensing-Based Disaster Monitoring and Assessment. Remote Sens. 2019, 11, 2181. [Google Scholar] [CrossRef] [Green Version]
- Alvarez-Vanhard, E.; Corpetti, T.; Houet, T. UAV & satellite synergies for optical remote sensing applications: A literature review. Sci. Remote Sens. 2021, 3, 100019. [Google Scholar] [CrossRef]
- Mohd Daud, S.M.S.; Mohd Yusof, M.Y.P.; Heo, C.C.; Khoo, L.S.; Chainchel Singh, M.K.; Mahmood, M.S.; Nawawi, H. Applications of drone in disaster management: A scoping review. Sci. Justice 2022, 62, 30–42. [Google Scholar] [CrossRef]
- Iglhaut, J.; Cabo, C.; Puliti, S.; Piermattei, L.; O’Connor, J.; Rosette, J. Structure from Motion Photogrammetry in Forestry: A Review. Curr. For. Rep. 2019, 5, 155–168. [Google Scholar] [CrossRef] [Green Version]
- Furukawa, F.; Laneng, L.A.; Ando, H.; Yoshimura, N.; Kaneko, M.; Morimoto, J. Comparison of RGB and Multispectral Unmanned Aerial Vehicle for Monitoring Vegetation Coverage Changes on a Landslide Area. Drones 2021, 5, 97. [Google Scholar] [CrossRef]
- Gomez, C.; Purdie, H. UAV- based Photogrammetry and Geocomputing for Hazards and Disaster Risk Monitoring—A Review. Geoenviron. Disasters 2016, 3, 23. [Google Scholar] [CrossRef] [Green Version]
- Berra, E.F.; Peppa, M.V. Advances and Challenges of UAV SFM MVS Photogrammetry and Remote Sensing: Short Review. In Proceedings of the 2020 IEEE Latin American GRSS & ISPRS Remote Sensing Conference (LAGIRS), Santiago, Chile, 22–26 March 2020; pp. 533–538. [Google Scholar]
- Rothmund, S.; Vouillamoz, N.; Joswig, M. Mapping slow-moving alpine landslides by UAV—Opportunities and limitations. Lead. Edge 2017, 36, 571–579. [Google Scholar] [CrossRef]
- Inoue, T.; Nagai, S.; Yamashita, S.; Fadaei, H.; Ishii, R.; Okabe, K.; Taki, H.; Honda, Y.; Kajiwara, K.; Suzuki, R. Unmanned aerial survey of fallen trees in a deciduous broadleaved forest in eastern Japan. PLoS ONE 2014, 9, e109881. [Google Scholar] [CrossRef] [PubMed] [Green Version]
- Goodbody, T.R.H.; Coops, N.C.; White, J.C. Digital Aerial Photogrammetry for Updating Area-Based Forest Inventories: A Review of Opportunities, Challenges, and Future Directions. Curr. For. Rep. 2019, 5, 55–75. [Google Scholar] [CrossRef] [Green Version]
- Habib, A.F.; Ghanma, M.S.; Tait, M. Integration of Lidar and Photogrammetry for Close Range Applications. Int. Arch. Photogramm. Remote Sens. Spat. Inf. Sci. 2004, 170, 1045–1050. [Google Scholar]
- Chirici, G.; Bottalico, F.; Giannetti, F.; Del Perugia, B.; Travaglini, D.; Nocentini, S.; Kutchartt, E.; Marchi, E.; Foderi, C.; Fioravanti, M.; et al. Assessing forest windthrow damage using single-date, post-event airborne laser scanning data. For. Int. J. For. Res. 2018, 91, 27–37. [Google Scholar] [CrossRef] [Green Version]
- Dandois, J.P.; Ellis, E.C. Remote Sensing of Vegetation Structure Using Computer Vision. Remote Sens. 2010, 2, 1157–1176. [Google Scholar] [CrossRef] [Green Version]
- Fang, L.; Xu, A.; Tang, L. A Study of the Key Technology of Forest Fire Prevention Based on a Cooperation of Video Monitor and GIS. In Proceedings of the 2008 Fourth International Conference on Natural Computation, Jinan, China, 18–20 October 2008; Volume 5, pp. 391–396. [Google Scholar]
- Jacbos, D.M.; Eggen-McIntosh, S. Airborne Videography and GPS for Assessment of Forest Damage in Southern Louisiana from Hurricane AndrEW. In Proceedings of the ILJFRO Conference on Inventory and Management Techniques in the Context of Catastrophic Events, University Park, PA, USA, 21–24 June 1993. [Google Scholar]
- Esri Introduction to Full Motion Video. Available online: https://pro.arcgis.com/en/pro-app/2.7/help/analysis/image-analyst/introduction-to-full-motion-video-in-arcgis-pro.htm (accessed on 14 February 2022).
- Azmi, M.Z.M.; Sharom, M.A.A.M.; Numpang, W.; Jamil, M.; Yahaya, K.; Muazah, S.; Zin, M.; Abd, C.; Sipit, R. Landfill Identification Through High-Resolution Satellite Images and Verification Using Drone Full Motion Video (FMV). ASM Sci. J. 2022, 17, 7:1–7:11. [Google Scholar] [CrossRef]
- Demirtas, U.; Turk, Y.Z.; Ozer, M. The Role Of Intelligence, Surveillance, And Reconnaissance In Disaster And Public Health Emergency. Prehosp. Disaster Med. 2014, 29, 549–550. [Google Scholar] [CrossRef] [Green Version]
- Bennett, B.; Beliveau, D.; Snellings, M.; Harding, M.; Bussert, D. DISN Video Services for Full Motion Video. In Proceedings of the MILCOM 2008—2008 IEEE Military Communications Conference, IEEE, San Diego, CA, USA, 16–19 November 2008; pp. 1–5. [Google Scholar]
- Tsushima, T.; Saitoh, K. Background to the Windthrow by Typhoon No. 18. In Reports on the Analyses of the Windthrow by Remote Sensing; Research Group on Forest Disasters in Hokkaido: Sapporo, Japan, 2005; pp. 3–6. (In Japanese) [Google Scholar]
- Morimoto, J.; Morimoto, M.; Nakamura, F. Initial vegetation recovery following a blowdown of a conifer plantation in monsoonal East Asia: Impacts of legacy retention, salvaging, site preparation, and weeding. For. Ecol. Manag. 2011, 261, 1353–1361. [Google Scholar] [CrossRef] [Green Version]
- DJI Phantom 4 RTK. Available online: https://www.dji.com/phantom-4-rtk?site=brandsite&from=nav (accessed on 28 February 2022).
- Softbank Ichimill IoT Service. Available online: https://www.softbank.jp/biz/iot/service/ichimill/ (accessed on 16 July 2021).
- Feng, Y.; Wang, J. GPS RTK Performance Characteristics and Analysis. J. Glob. Position. Syst. 2008, 7, 1–8. [Google Scholar] [CrossRef] [Green Version]
- Esri Site Scan for ArcGIS. Available online: https://www.esri.com/en-us/arcgis/products/site-scan-for-arcgis/overview (accessed on 28 February 2022).
- Geospatial Intelligence Standards Working Group NSG Standards Registry. Available online: https://nsgreg.nga.mil/doc/view?i=5093 (accessed on 28 February 2022).
- BizStation Corp DG-PRO1RWS RTK W-Band Gnss Receiver. Available online: https://www.bizstation.jp/ja/drogger/dg-pro1rws_index.html (accessed on 14 July 2021).
- Morimoto, J.; Sugiura, M.; Morimoto, M.; Nakamura, F. Restoration of Natural Forests After Severe Wind Disturbance in a Cold, Snowy Region With a Deer Population: Implications From 15 Years of Field Experiments. Front. For. Glob. Chang. 2021, 4, 82. [Google Scholar] [CrossRef]
- Esri ArcGIS Pro. Available online: https://www.esri.com/en-us/arcgis/products/arcgis-pro/overview (accessed on 17 March 2022).
- Esri How To: Use Geospatial Log Files from Video Flights Captured with Site Scan Flight for ArcGIS. Available online: https://support.esri.com/en/technical-article/000024386 (accessed on 19 June 2022).
- Esri How To: Correct Drone Flight Altitude Data in Geospatial Video Log (GVL) Files in Site Scan Flight for ArcGIS. Available online: https://support.esri.com/en/technical-article/000027161 (accessed on 19 June 2022).
- Remondino, F.; Barazzetti, L.; Nex, F.; Scaioni, M.; Sarazzi, D. Uav Photogrammetry For Mapping and 3D Modeling—Current Status and Future Perspectives. Int. Arch. Photogramm. Remote Sens. Spat. Inf. Sci. 2012, XXXVIII-1, 25–31. [Google Scholar] [CrossRef] [Green Version]
- Agisoft Metashape. Available online: https://www.agisoft.com/downloads/installer/ (accessed on 4 July 2021).
- Morimoto, J.; Kajihara, K.; Shida, Y. Environment and plant regeneration at microsites created by fallen logs in plantation forests downed by wind (In Japanese with English abstract). J. Jpn. Soc. Reveg. Technol. 2014, 40, 124–129. [Google Scholar] [CrossRef] [Green Version]
- Cribari-Neto, F.; Zeileis, A. Beta Regression in R. J. Stat. Softw. 2010, 34, 1–24. [Google Scholar] [CrossRef] [Green Version]
- R Core Team. R: A Language and Environment for Statistical Computing. Available online: https://www.r-project.org/ (accessed on 26 May 2022).
- Lechner, A.M.; Foody, G.M.; Boyd, D.S. Applications in Remote Sensing to Forest Ecology and Management. One Earth 2020, 2, 405–412. [Google Scholar] [CrossRef]
- Meisner, D. Fundamentals of airborne video remote sensing. Remote Sens. Environ. 1986, 19, 63–79. [Google Scholar] [CrossRef]
- Koi, T.; Hotta, N.; Tanaka, Y.; Katsura, S. Generation and Subsequent Transport of Landslide-driven Large Woody Debris Induced by the 2018 Hokkaido Eastern Iburi Earthquake. Front. Earth Sci. 2022, 9, 10:1–10:16. [Google Scholar] [CrossRef]
- Lipton, A.J.; Fujiyoshi, H.; Patil, R.S. Moving target classification and tracking from real-time video. In Proceedings of the Fourth IEEE Workshop on Applications of Computer Vision. WACV’98 (Cat. No.98EX201), Princeton, NJ, USA, 19–21 October 1998; pp. 8–14. [Google Scholar]
- Garmin GPS Accuracy. Available online: https://support.garmin.com/en-US/?faq=aZc8RezeAb9LjCDpJplTY7#:~:text=Garmin (accessed on 2 February 2022).
- Lachat, T.; Bouget, C.; Bütler, R.; Müller, J.; Kraus, D.; Krumm, F. Deadwood: Quantitative and qualitative requirements for the conservation of saproxylic biodiversity. In Integrative Approaches as an Opportunity for the Conservation of Forest Biodiversity; European Forest Institute: Freiburg, Germany, 2013; pp. 92–102. [Google Scholar]
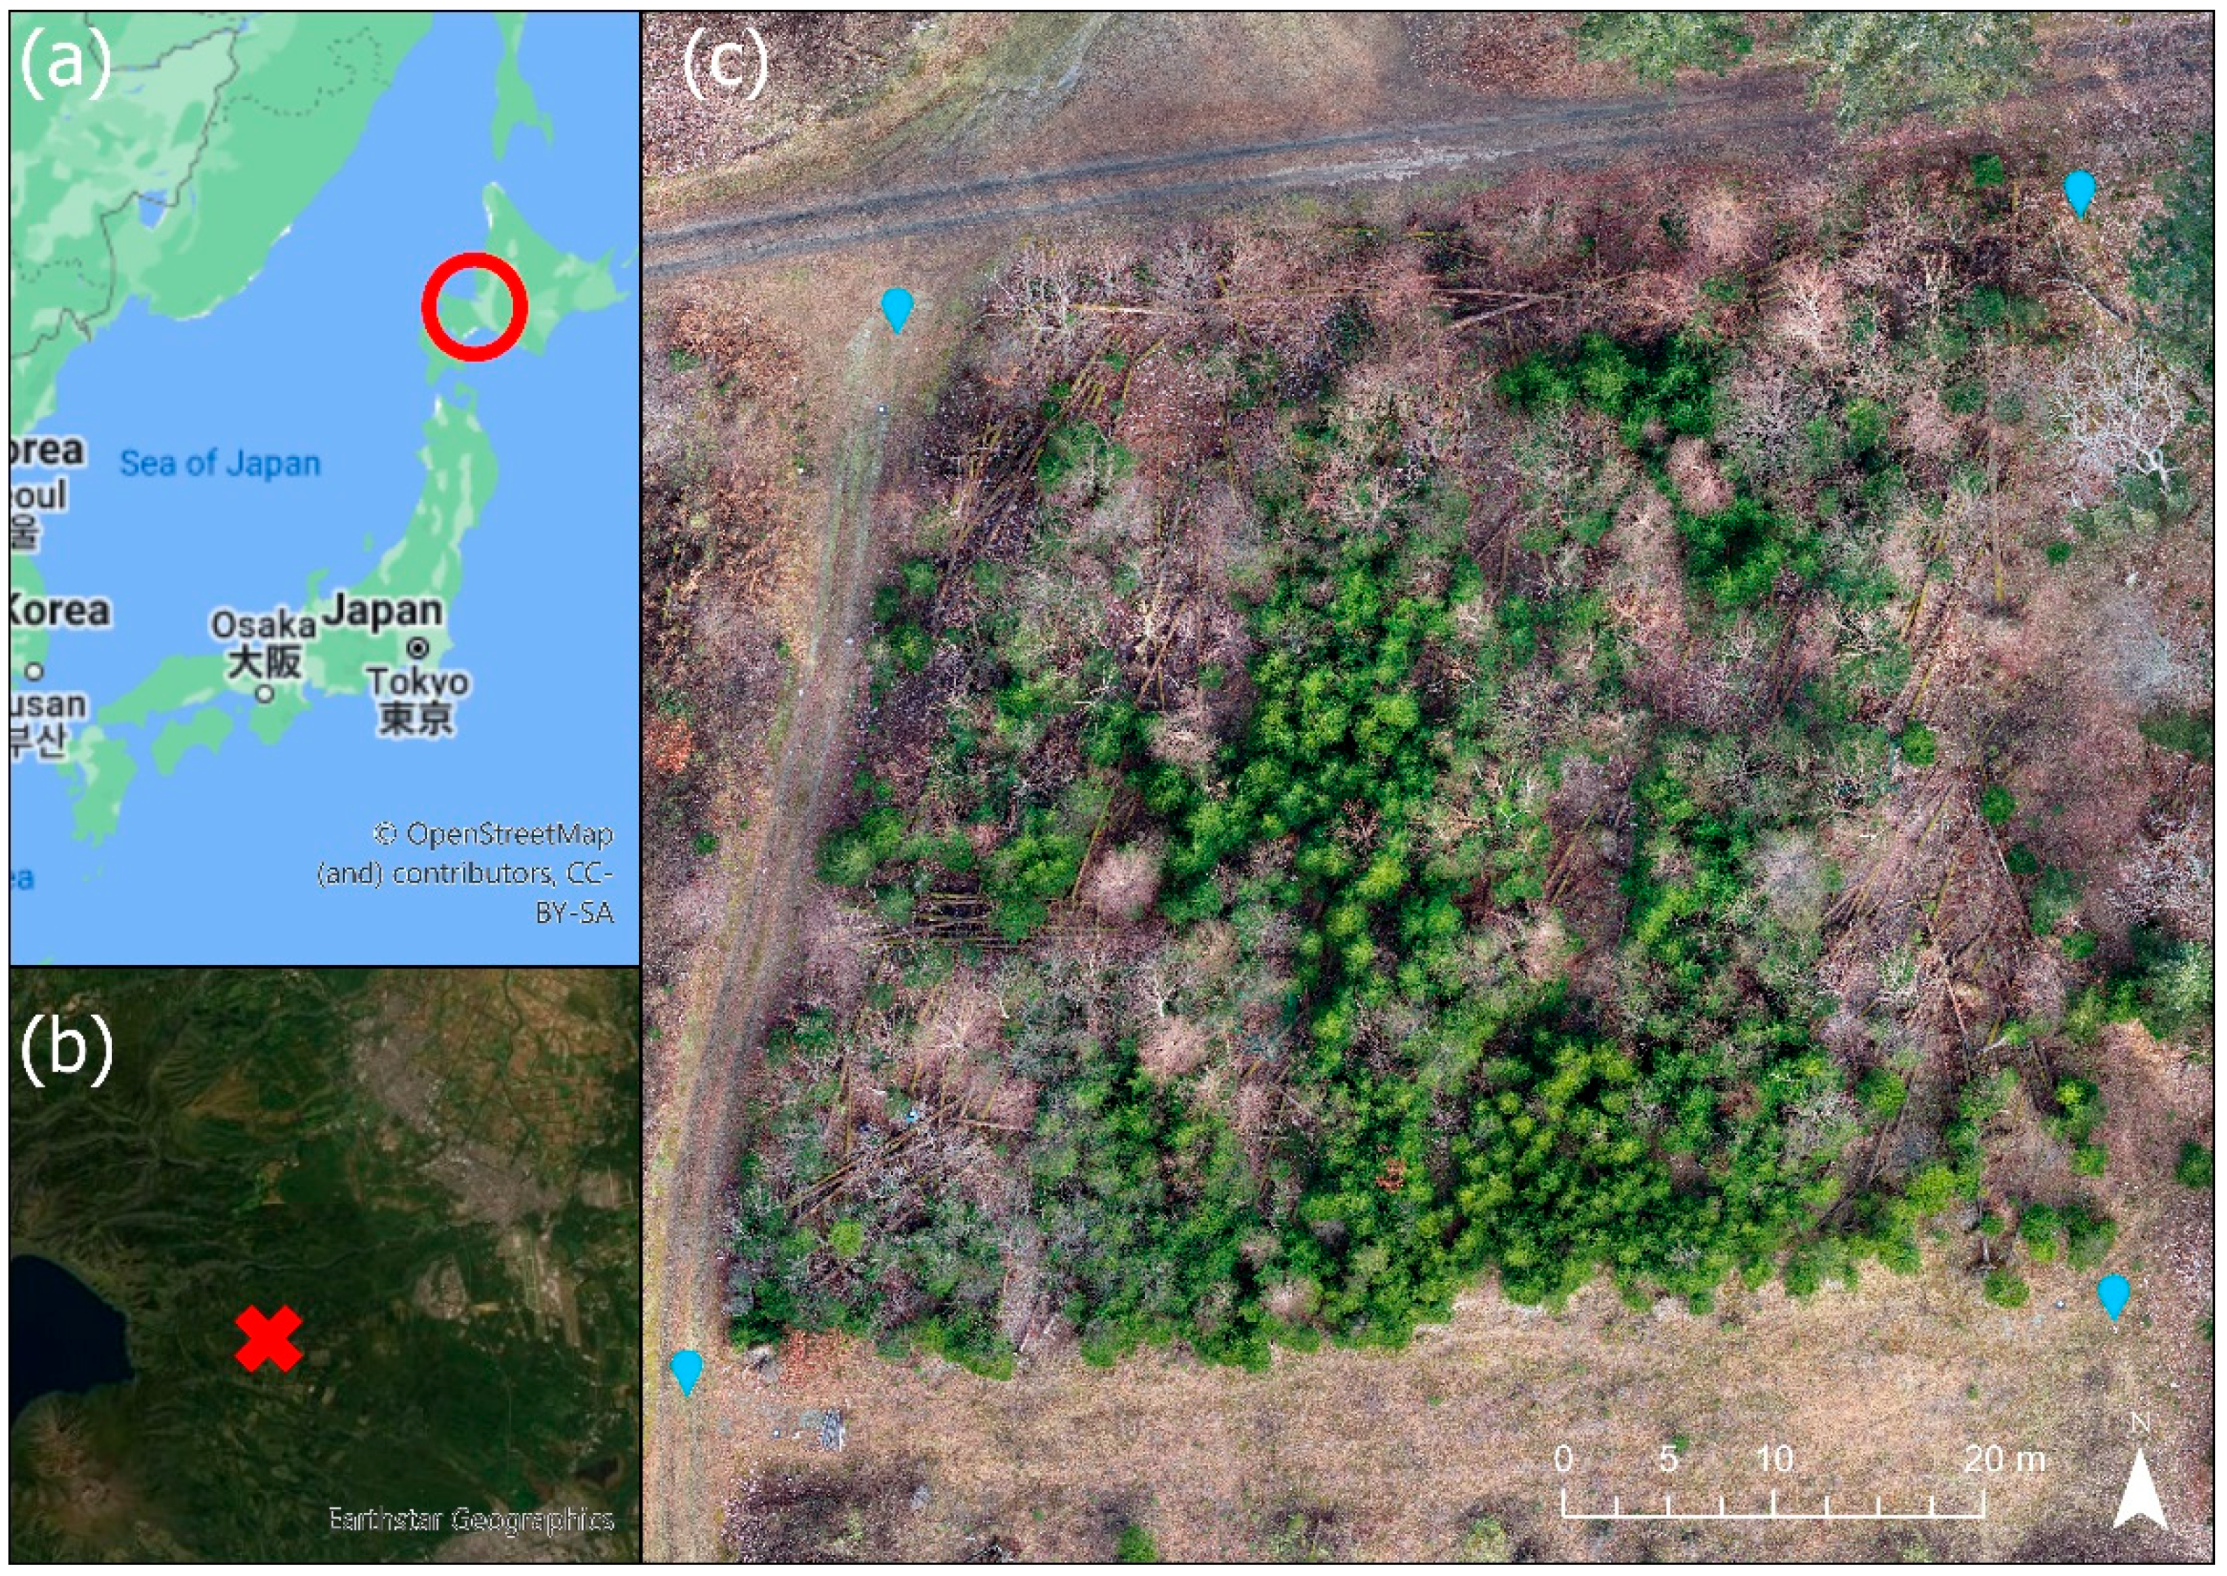
Figure 1.
(a) The study area located in Hokkaido, Japan (red circle), (b) inside the national forest in Chitose City (red cross), and (c) the orthomosaic with the ground control points (in blue).
Figure 1.
(a) The study area located in Hokkaido, Japan (red circle), (b) inside the national forest in Chitose City (red cross), and (c) the orthomosaic with the ground control points (in blue).

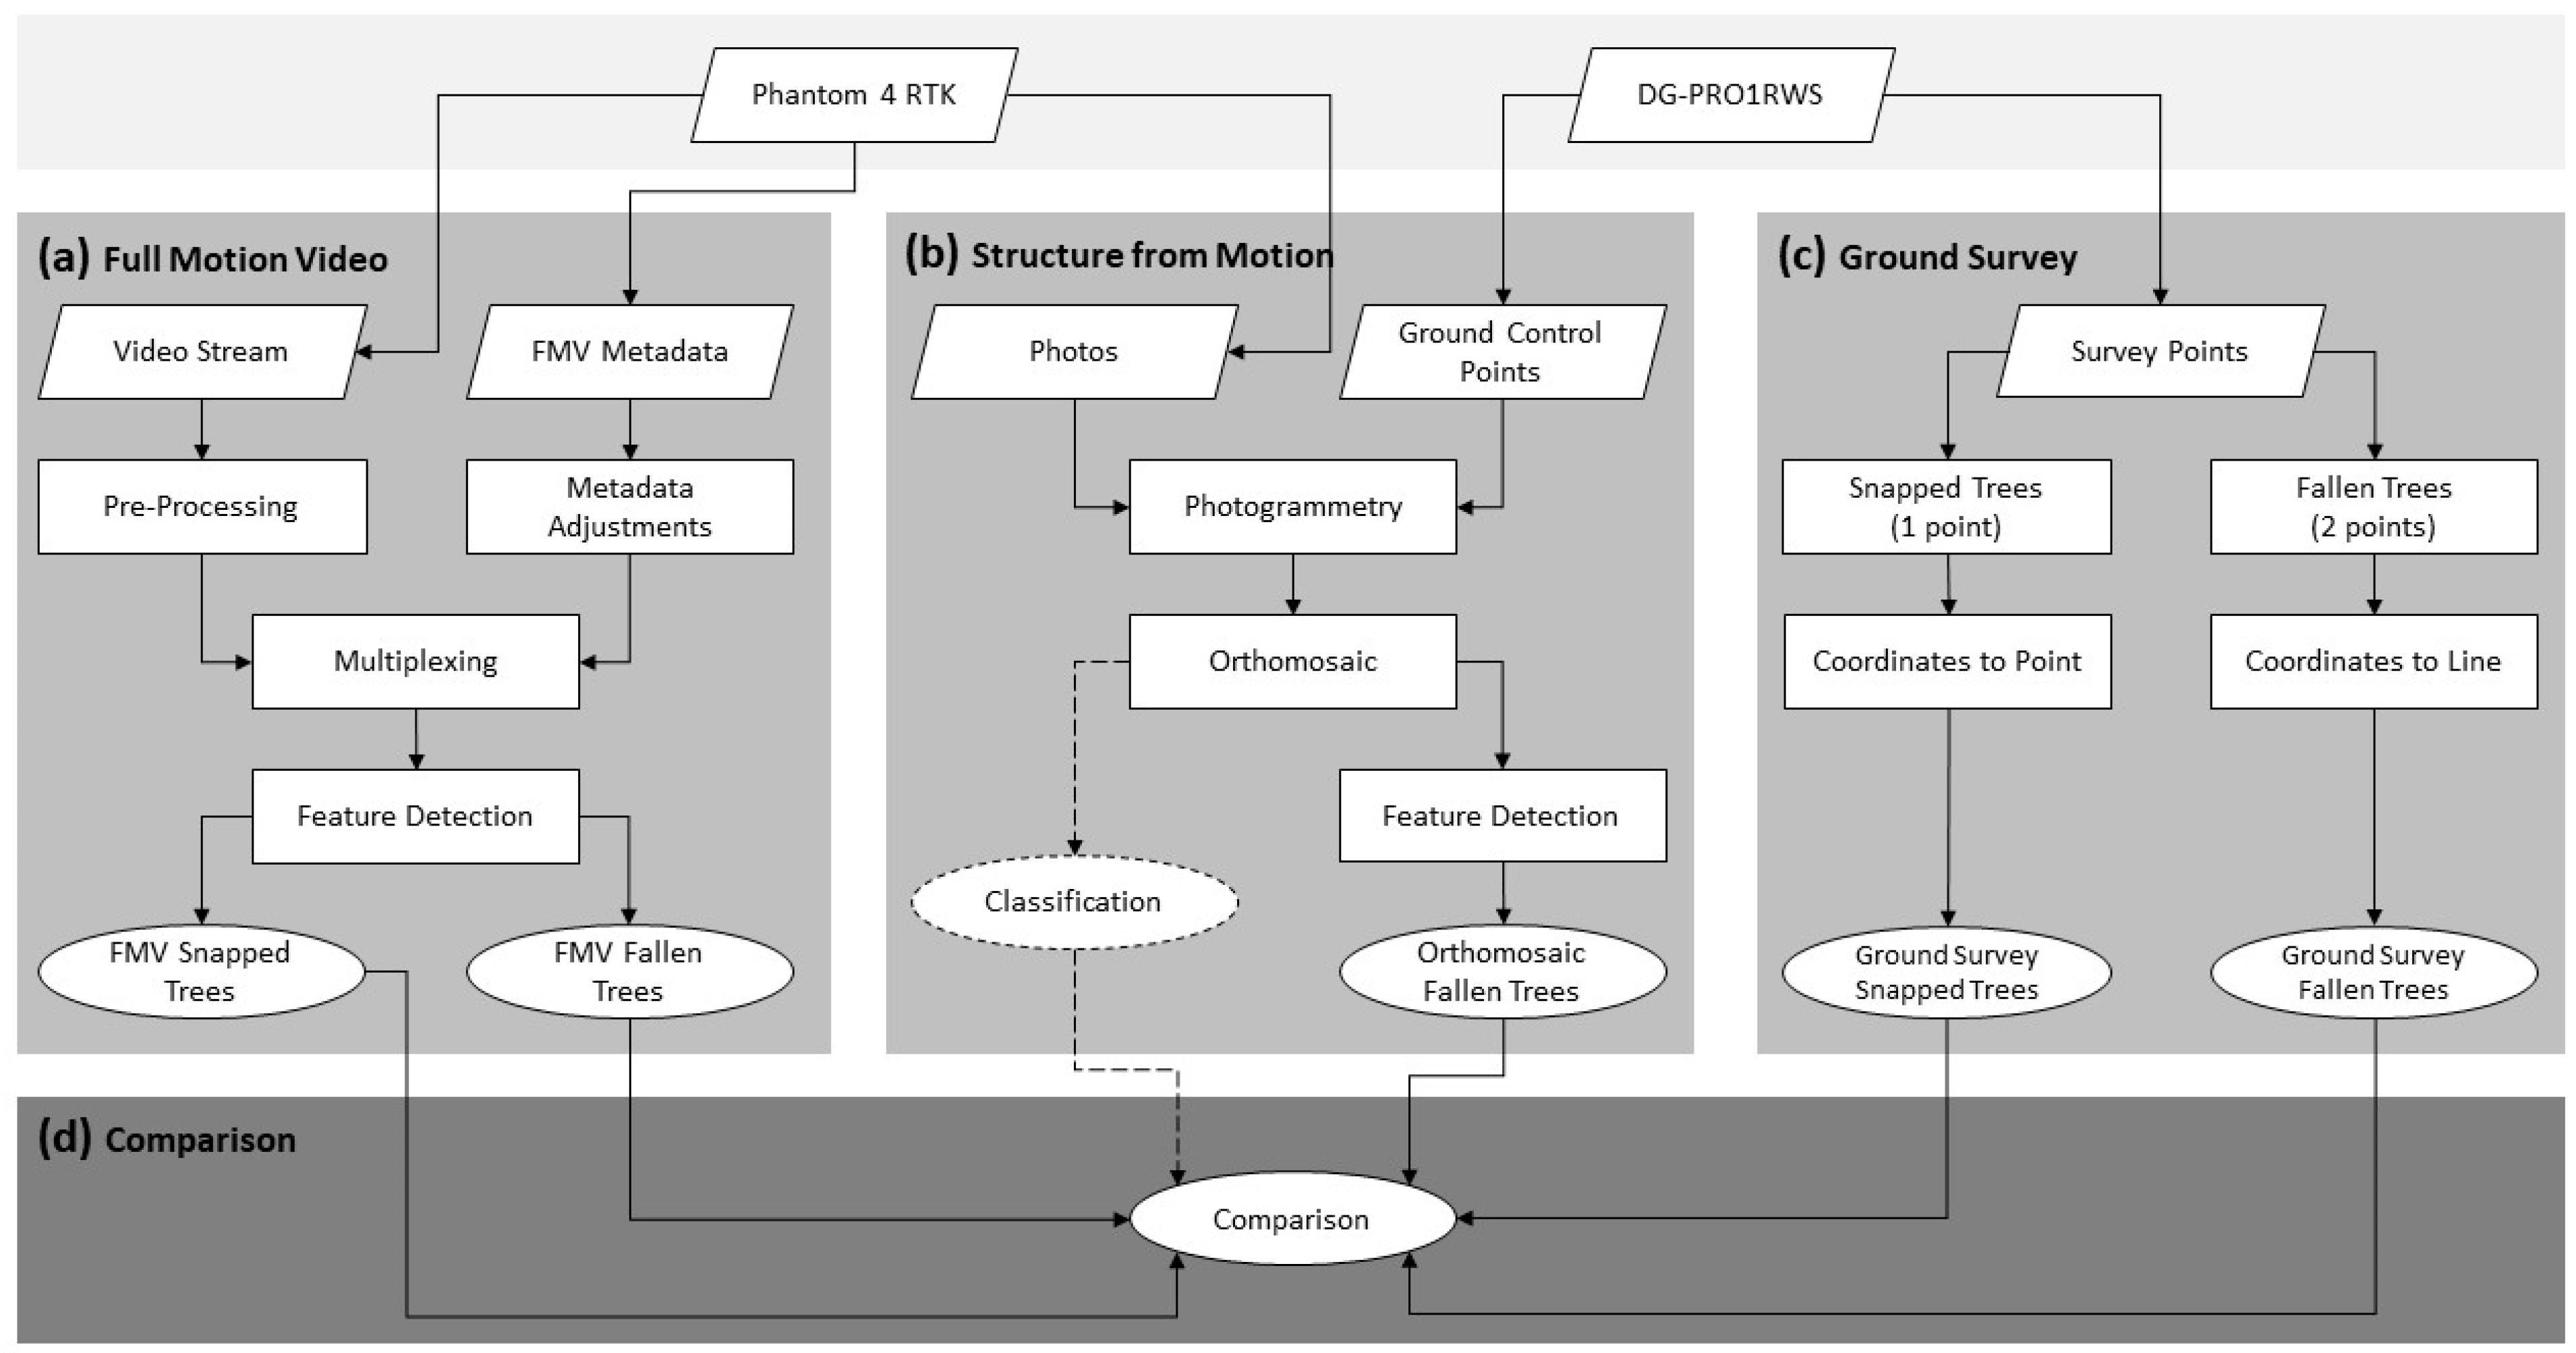
Figure 2.
The processing workflow for this study: (a) FMV processing, (b) SfM processing, (c) ground survey processing, and (d) comparison of the methods.
Figure 2.
The processing workflow for this study: (a) FMV processing, (b) SfM processing, (c) ground survey processing, and (d) comparison of the methods.

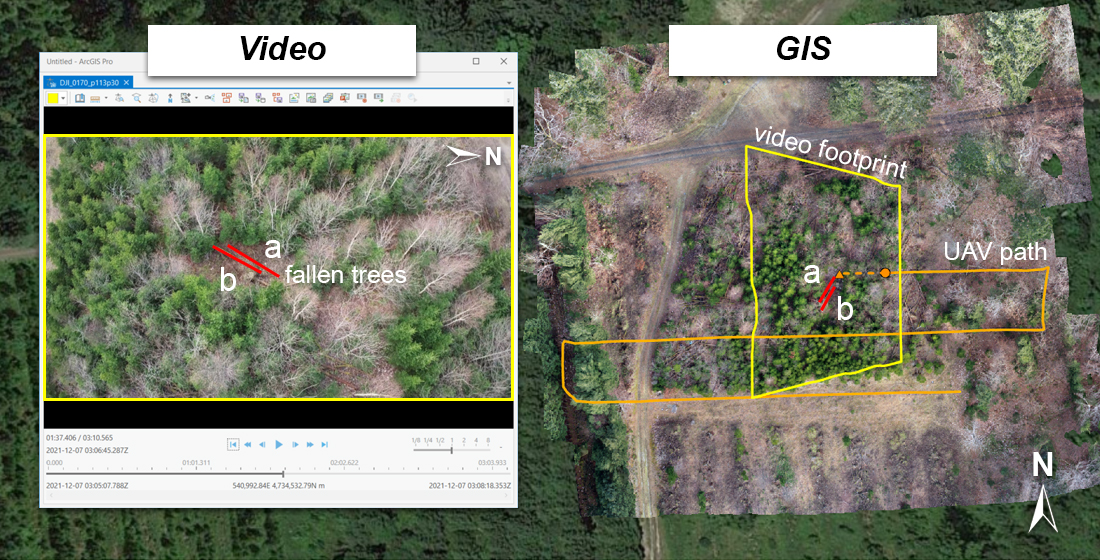
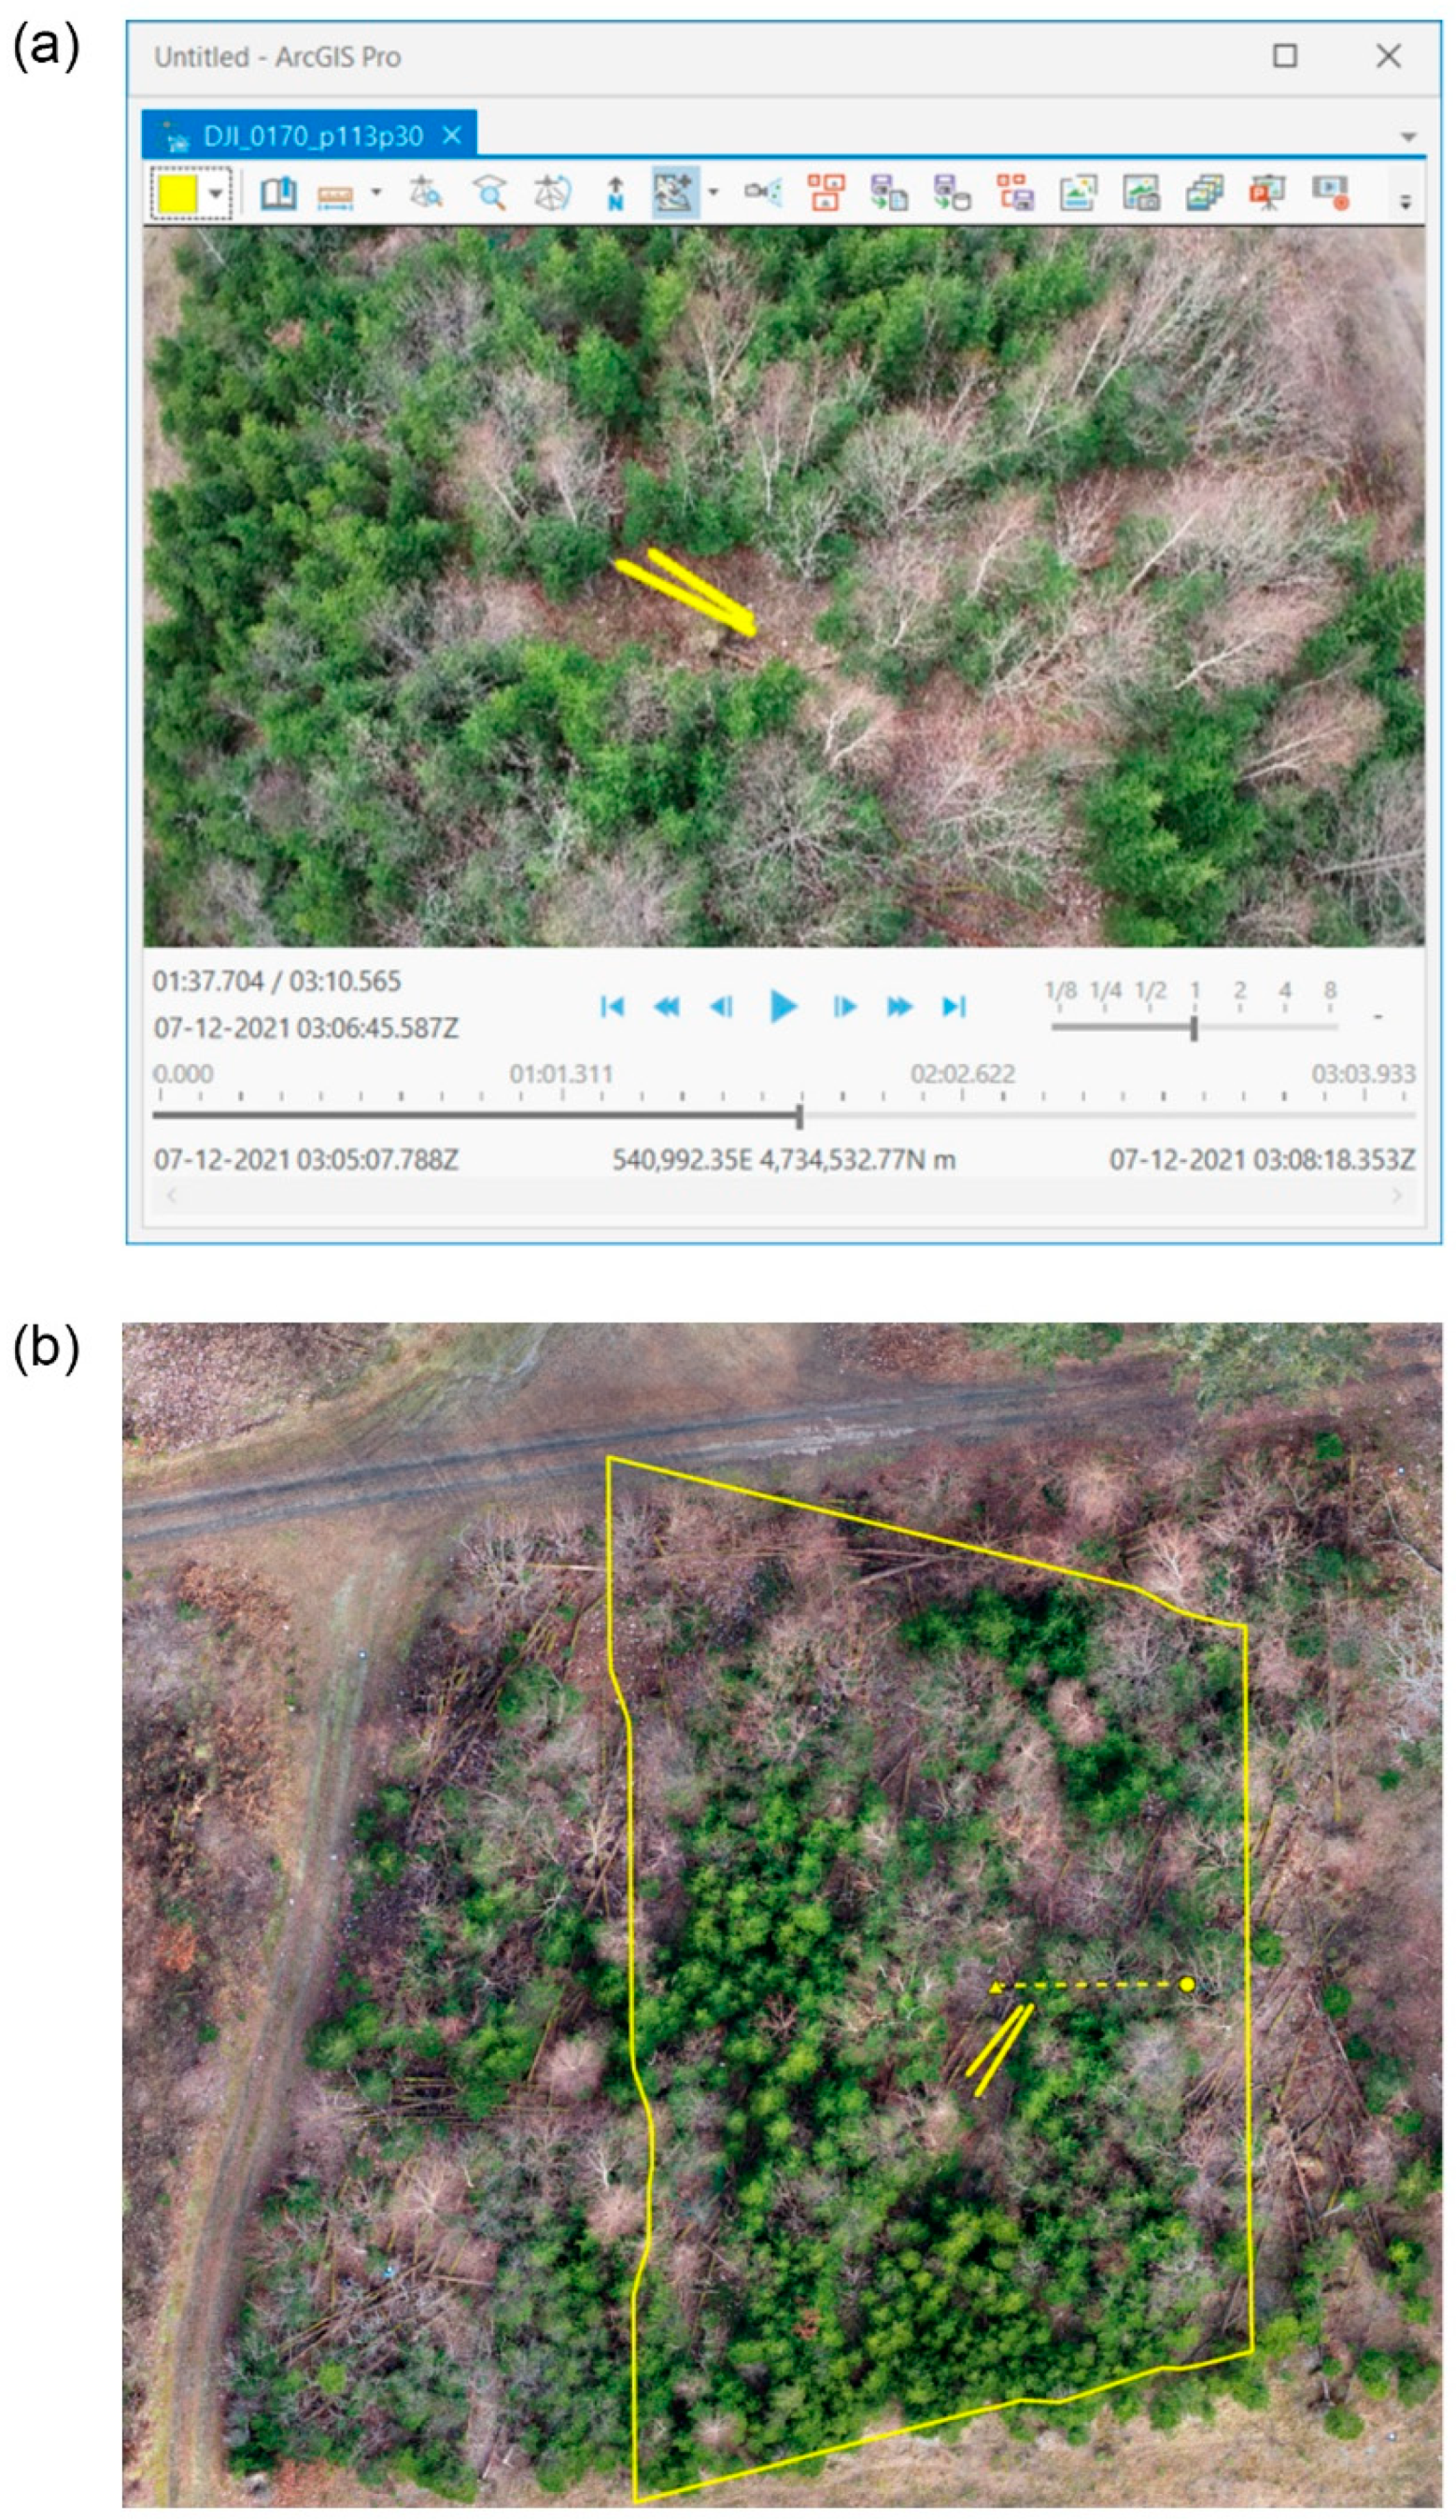
Figure 3.
(a) The video player where we identified the fallen (in yellow) and snapped tree, (b) GIS with the orthomosaic and the video footprint with the respective feature lines (in yellow).
Figure 3.
(a) The video player where we identified the fallen (in yellow) and snapped tree, (b) GIS with the orthomosaic and the video footprint with the respective feature lines (in yellow).

Figure 4.
Example of the proportion of vegetation with leaves, vegetation without leaves, and non-vegetation inside (a) fallen and (b) snapped trees 0.25 m buffer.
Figure 4.
Example of the proportion of vegetation with leaves, vegetation without leaves, and non-vegetation inside (a) fallen and (b) snapped trees 0.25 m buffer.

Figure 5.
The number of fallen trees identified by (a) FMV and ground survey, and (b) orthomosaic and ground survey.
Figure 5.
The number of fallen trees identified by (a) FMV and ground survey, and (b) orthomosaic and ground survey.

Figure 6.
Mean lengths of feature lines extracted from the ground survey, FMV, and orthomosaic.

Figure 7.
The average proportion of each class inside the buffer of matched and unmatched fallen trees for (a) FMV and (b) orthomosaic, with the ground survey as reference.
Figure 7.
The average proportion of each class inside the buffer of matched and unmatched fallen trees for (a) FMV and (b) orthomosaic, with the ground survey as reference.

Figure 8.
The number of snapped trees identified by FMV and ground survey.

Figure 9.
Physical characteristics of snapped trees in cm: (a) height and (b) diameter.

Figure 10.
The average proportion of each class inside the buffer of matched and unmatched snapped trees.
Figure 10.
The average proportion of each class inside the buffer of matched and unmatched snapped trees.


Table 1.
p-values between matched and unmatched fallen trees for each class.
| FMV | Orthomosaic | |
|---|---|---|
| Vegetation with leaves | 0.82 | 0.002 |
| Vegetation without leaves | 0.83 | 0.72 |
| Non-vegetation | 0.62 | 0.001 |
Table 2.
p-values between matched and unmatched snapped trees for each class.
| FMV | |
|---|---|
| Vegetation with leaves | 0.25 |
| Vegetation without leaves | 0.71 |
| Non-vegetation | 0.25 |
Publisher’s Note: MDPI stays neutral with regard to jurisdictional claims in published maps and institutional affiliations. |
© 2022 by the authors. Licensee MDPI, Basel, Switzerland. This article is an open access article distributed under the terms and conditions of the Creative Commons Attribution (CC BY) license (https://creativecommons.org/licenses/by/4.0/).
Share and Cite
MDPI and ACS Style
Furukawa, F.; Morimoto, J.; Yoshimura, N.; Koi, T.; Shibata, H.; Kaneko, M. UAV Video-Based Approach to Identify Damaged Trees in Windthrow Areas. Remote Sens. 2022, 14, 3170. https://doi.org/10.3390/rs14133170
AMA Style
Furukawa F, Morimoto J, Yoshimura N, Koi T, Shibata H, Kaneko M. UAV Video-Based Approach to Identify Damaged Trees in Windthrow Areas. Remote Sensing. 2022; 14(13):3170. https://doi.org/10.3390/rs14133170
Chicago/Turabian StyleFurukawa, Flavio, Junko Morimoto, Nobuhiko Yoshimura, Takashi Koi, Hideaki Shibata, and Masami Kaneko. 2022. "UAV Video-Based Approach to Identify Damaged Trees in Windthrow Areas" Remote Sensing 14, no. 13: 3170. https://doi.org/10.3390/rs14133170
Note that from the first issue of 2016, this journal uses article numbers instead of page numbers. See further details here.