Article

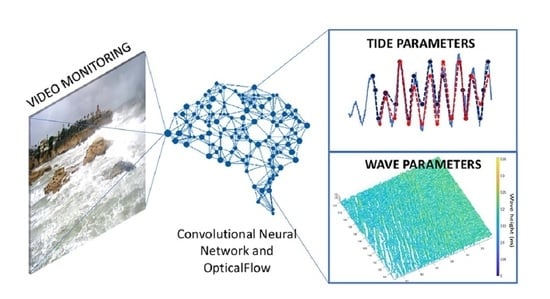
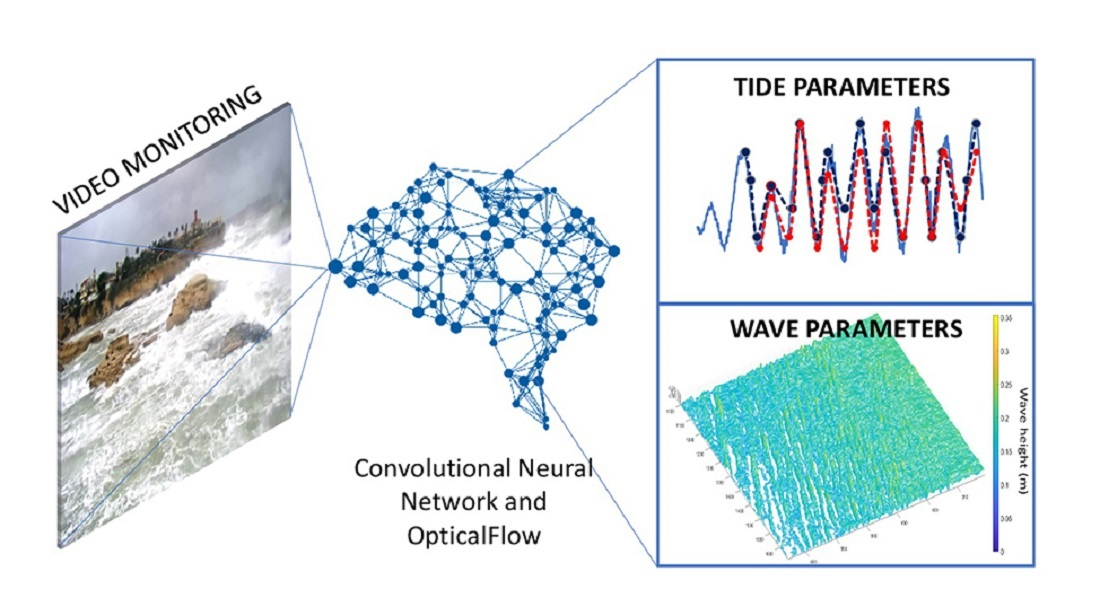
Convolutional Neural Network and Optical Flow for the Assessment of Wave and Tide Parameters from Video Analysis (LEUCOTEA): An Innovative Tool for Coastal Monitoring

by
Giovanni Scardino
1,2,
Giovanni Scicchitano
1,2,*,
Marco Chirivì
3,
Pedro J. M. Costa
4,5,
Antonio Luparelli
3 and
Giuseppe Mastronuzzi
1,2
1
Department of Earth and Geo-Environmental Sciences, University of Bari Aldo Moro, 70125 Bari, Italy
2
Interdepartmental Research Center for Coastal Dynamics, University of Bari Aldo Moro, 70125 Bari, Italy
3
CETMA Centro di Ricerca Europeo di Tecnologie Design e Materiali, 72100 Brindisi, Italy
4
Department of Earth Sciences, Faculty of Sciences and Technology, University of Coimbra, 3030-790 Coimbra, Portugal
5
Instituto Dom Luiz, Faculty of Sciences, University of Lisbon, 1749-016 Lisboa, Portugal
*
Author to whom correspondence should be addressed.
Remote Sens. 2022, 14(13), 2994; https://doi.org/10.3390/rs14132994
Submission received: 17 May 2022 / Revised: 3 June 2022 / Accepted: 21 June 2022 / Published: 22 June 2022
(This article belongs to the Special Issue Remote Sensing Application in Coastal Geomorphology and Processes)

Abstract

:
Coastal monitoring is a topic continuously developing, which has been applied using different approaches to assess the meteo-marine features, for example, to contribute to the development of improved management strategies. Among these different approaches, coastal video monitoring coupled with recent machine learning and computer vision techniques has spread widely to assess the meteo-marine features. Video monitoring allows to obtain large spatially and temporally datasets well-distributed along the coasts. The video records can compile a series of continuous frames where tide phases, wave parameters, and storm features are clearly observable. In this work, we present LEUCOTEA, an innovative system composed of a combined approach between Geophysical surveys, Convolutional Neural Network (CNN), and Optical Flow techniques to assess tide and storm parameters by a video record. Tide phases and storm surge were obtained through CNN classification techniques, while Optical Flow techniques were used to assess the wave flow and wave height impacting the coasts. Neural network predictions were compared with tide gauge records. Furthermore, water levels and wave heights were validated through spatial reference points obtained from pre-event topographic surveys in the proximity of surveillance cameras. This approach improved the calibration between network results and field data. Results were evaluated through a Root Mean Square Error analysis and analyses of the correlation coefficient between results and field data. LEUCOTEA system has been developed in the Mediterranean Sea through the use of video records acquired by surveillance cameras located in the proximity of south-eastern Sicily (Italy) and subsequently applied on the Atlantic coasts of Portugal to test the use of action cameras with the CNN and show the difference in terms of wave settings when compared with the Mediterranean coasts. The application of CNN and Optical Flow techniques could represent an improvement in the application of monitoring techniques in coastal environments, permitting to automatically collect a continuous record of data that are usually not densely distributed or available.

Graphical Abstract

1. Introduction

Video monitoring is becoming widely used on coastal systems, considering that a huge amount of data can be collected over a long-time range [1,2,3]. Ongoing widespread dissemination of digital systems for video monitoring allowed the development of innovative approaches to automatically obtain and process data along coastal areas. Previous studies have considered the time series of optical images to extract hydrodynamic properties of nearshore waves and currents, swash and runup [4], breaking wave, measures of breaking intensity [5,6], wave period, and wavelength (by monitoring a single pixel in the image over time), wave celerity [7], wave dissipation [8], attenuation [9], and alongshore currents [10]. These studies followed a supervised approach to establish or detect the physical wave parameters. The widespread of machine learning allows to automatically analyze a large amount of data [11,12,13]. The machine learning techniques can represent innovative approaches for coastal video monitoring, considering the computational gain that can be obtained from analyzing the long time series of video records.
On the other hand, conventional machine learning methods require manual image feature selection and need image data transformation so that they are more amenable to specific algorithms [14,15]. With the wide spread of deep learning methods, Earth-system processes began to be studied through new architectures and artificial intelligence methods to automatically obtain the meteo-marine data [16]. Deep learning architectures represent a set of learning methods attempting to model data with complex architectures combining different non-linear transformations in computer vision. The combination of different types of neural networks constitutes the bases of deep learning architecture [17,18]. Before the development of deep learning for computer vision, machine learning was based on extracting variables of interest, called features, throughout image processing training processes. The Convolutional Neural Network (CNN) introduced by LeCun [19] has revolutionized image processing and removed the manual extraction of features. CNNs act directly on matrices, or even on tensors for images with three RGB color channels, with Infrared channels, or hyperspectral images. CNNs are now widely used for image classification, image segmentation, object recognition, and face recognition [20,21,22]. Many improvements of CNN were obtained in the video monitoring field, like object recognition, action recognition, and classification of identified actions into categories like anomalous or normal [23,24]. Usually, CNN obtains the low-frequency data of sea motion, such as tide and storm surge. Alternatively, optical methods are used to obtain high-frequency data, to identify contrasting surface features to act as targets that are assumed to move from frame to frame. Foam is the predominant target traced within the surf zone through Optical Flow [3,25]. Moreover, optical images will also sense light reflections from sloped water surfaces and turbidity that alters background water colors [26]. Furthermore, alongshore currents have been estimated by extracting alongshore pixel time stacks from video [27,28].
In this work, we present a new monitoring system, called LEUCOTEA (convolutionaL nEUral networks for assessing COasTal hazard by video analyses), developed to assess tide, wave, and storm parameters from a video record. In this system, CNN was implemented into a MATLAB environment to obtain the tide phases and storm surge from specific frames of the video records. Subsequently, Optical Flow techniques were used to extract the wave flow and wave height from the wave motion recorded in the video. In the last decade, the Ionian coast of Sicily and the Atlantic coast of Portugal have been studied. Portugal’s coast has been influenced by the impact of hurricanes (Ophelia, 2017, Leslie 2018, Alpha 2020), while Sicily’s coast has been influenced by the impact of medicanes (Zorbas 2018; Trudy 2019; Ianos 2020; Apollo 2021).
Most importantly, both hurricanes and medicanes occurring in the two selected areas are related to a Tropical Transition able to transform an extratropical system into a tropical system [29,30]. Several authors predict that, soon, climate changes could modify hurricanes and medicanes, increasing their intensity and eventually also frequency along the coast of the Ionian Sea and the Atlantic coast of Portugal [31,32]. The combined method of deep CNN and Optical Flow, proposed in this work, has been developed to automatically obtain tide phases, surge, and physical wave parameters, useful for monitoring and studying hurricanes and medicanes, and which could also represent an innovative approach for early warning systems.

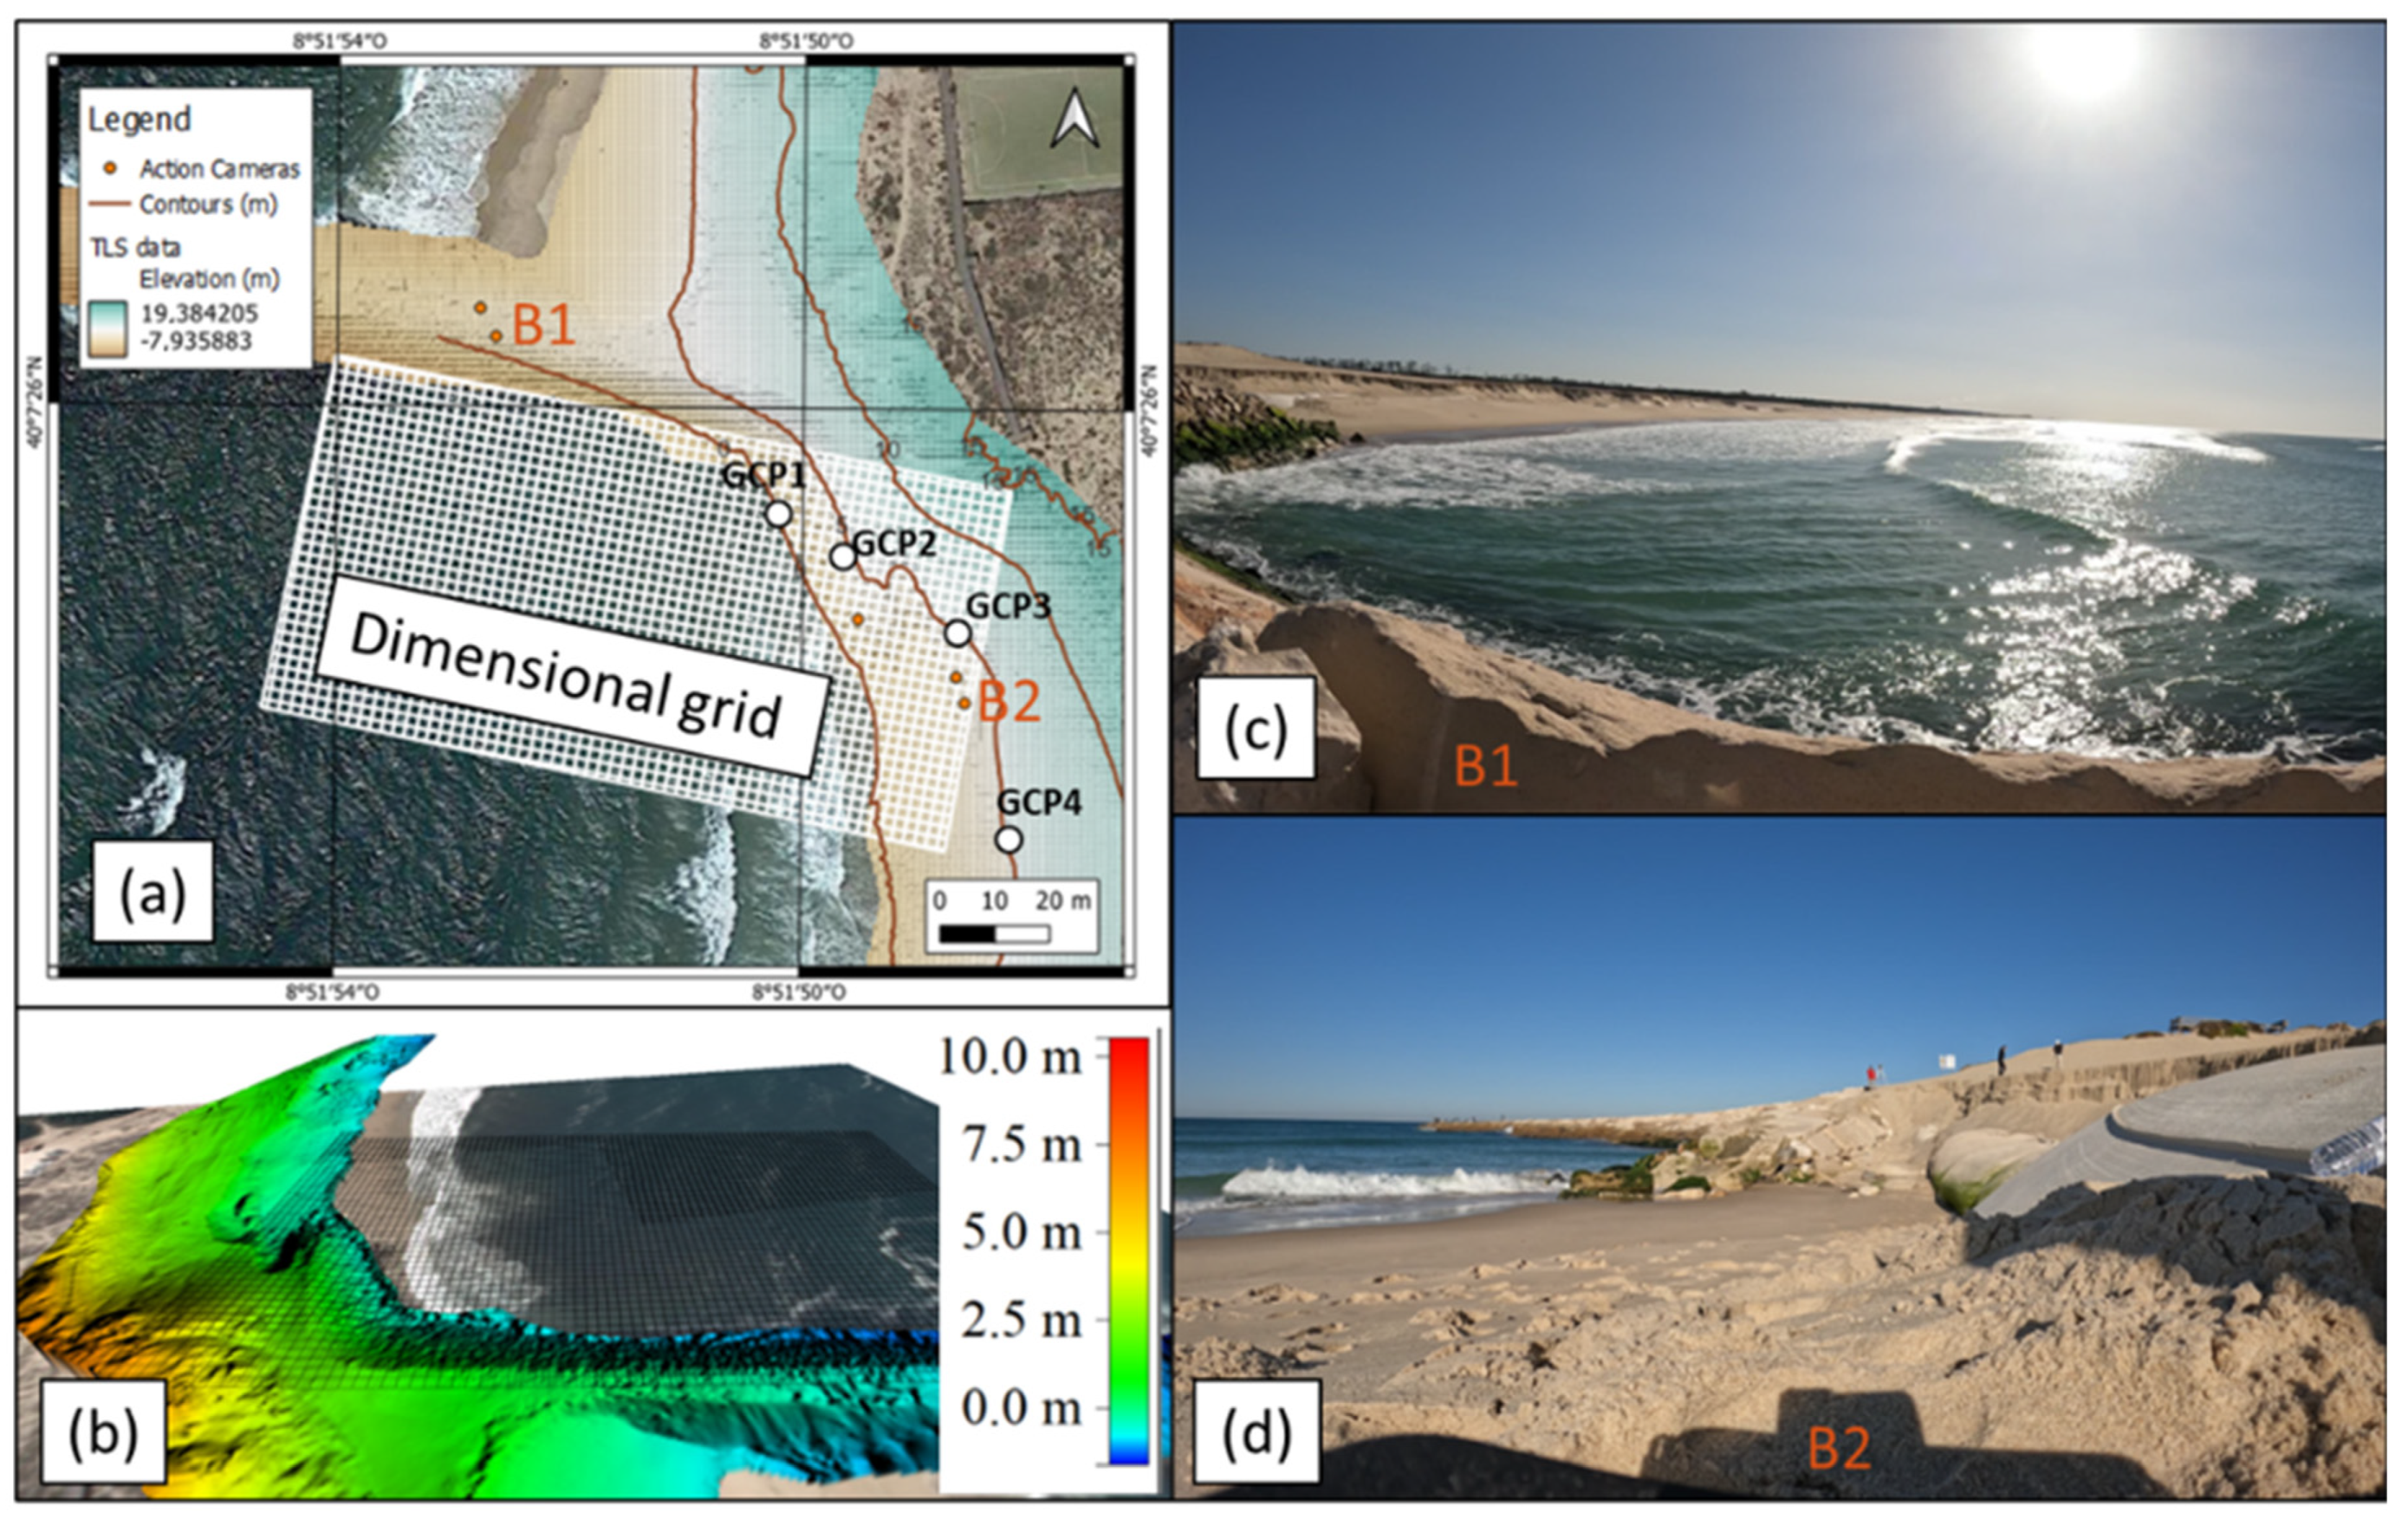
2. Geographic Framework

The Mediterranean area studied in this work is located along the coasts of the Maddalena Peninsula (south-eastern Sicily) (Figure 1). In contrast, the Atlantic areas are located along the central coast of Portugal, between Costa Nova in the north and Coxos in the south (Figure 2).
The coastal area of south-eastern Sicily is extended for about 300 km and is undergoing a heavy coastal retreat (shoreline erosion rate of about 5 m/year [33]). This area has been exposed to severe storms during the last decades (wave height of about 6 m and storm surge greater than 1 m [34,35]). The studied coastal area is characterized by an alternation of small rocky promontories and low-lying beach systems (pocket beaches) often bordering the coastal lagoon. Effects of several tsunamis have been reconstructed from the analyses of boulder accumulations [36,37,38], high-energy deposits [39,40,41], and lithostratigraphic analysis inside lagoonal areas [42,43]. The analyzed area also experienced the effects of several storms over the last decades, mainly translated by boulder and cobble dislocation along the coastal fringe [36,37,39]. As described for other Mediterranean coastal areas [44,45], this suggests that storms can produce effects comparable to other previous extreme marine events (i.e., tsunamis).
Scicchitano et al. [37,46] analyzed data recorded by the wave buoy of Catania (RON—Rete Ondametrica Nazionale; www.idromare.com accessed on 23 March 2018) and identified the strongest storm that has occurred in south-eastern Sicily since 1990 was characterized by significant wave height (H0) of about 6.2 m and peak period Tp = 11.3 s. Several medicanes impacted the coasts of south-eastern Sicily, and in the last decades, these events produced stronger effects when compared to common seasonal storms [35]. Between 2014 and 2021, five medicanes developed in the Ionian Sea. Three of these, called Qendresa (2014), Zorbas (2018), and Apollo (2021), strongly impacted the coast of south-eastern Sicily, in particular in Massolivieri, Maddalena Peninsula, and Varco 11 (Figure 2), with duration ranging from 4 to 7 days. As the Ionian Sea is not an area eligible for the formation of Tropical Cyclones, these phenomena occur due to a Tropical Transition (TT) process that can change an extratropical system into a tropical system or induce a hybrid cyclone [47,48]. However, several authors predict that, soon, climate changes could modify medicanes, decreasing the frequency of their occurrence but increasing the strength of their impacts [49]. However, in the Ionian basin, since 2018, a medicane has developed each year.
The Portuguese coastline extends for approximately 990 km. It is divided into different geomorphological units represented by sandy beaches, dunes, sand, and rocky cliffs, combined with river mouths, estuaries, lagoonal systems, and anthropogenic areas (Figure 2a,b). We selected four sites between Costa Nova in the north and Coxos in the south (Costa Nova, Cova Gala, Nazaré, and Coxos).
Costa Nova is located South of the Ria de Aveiro mouth (Figure 2b) and is part of the southern dune barrier of the Ria de Aveiro complex [50,51]. The dune system of Costa Nova is becoming more exposed to wave action due to the increasing erosion of this coastal stretch. On the other hand, some intervention strategies have been performed in Costa Nova, building several groynes, rock armor revetments, and shoreface nourishment [52]. On the other hand, and slightly to the south, Cova Gala is located south of the Figueira da Foz port (Figure 2c). The port was built inside the Mondego River estuary and has caused a great impact on the sediment dynamics along this coastal fringe, namely on its southern sector, which has led to an increase in erosion episodes over recent times [53]. A series of cross-shore groynes were constructed in the 1990s to mitigate the increasing effects of erosion in this area. South of the last breakwater, approximately 250 m of exposed geotextile sandbags protect the sand dunes. Similar to the previous locations, dominant waves are from the NW-W and frequently exceed significant wave height values of 6 m [53,54]. Nazaré’s Norte beach is located on the central west coast of Portugal (Figure 2d); more precisely, in the southward limit of the littoral cell that extends from the Douro river mouth and the Nazaré Canyon head [55]. This coastal stretch is exposed to the North Atlantic wave regime characterized by a predominant swell from the NW quadrant superimposed with a generally less energetic local wind sea with a wider directional spread [55].
Coxos is located on the Atlantic central west-facing coast of Portugal (Figure 2e). This is an irregular coastline section with an N-S general trend, where 20–50 m-high cliffs alternate with pocket beaches and structurally controlled rocky platforms [56]. There are only a few shore platforms at the toe of the cliffs, and they mostly correspond to plunging cliffs. These features allow for moderately high waves approaching the shoreline to preserve most of their energy until breaking or surging at the cliff face [56].
From a hydrodynamic point of view, the central Atlantic coast of Portugal is a high-energy system characterized by a swell-dominated stretch of coast that is fully exposed to waves generated far out in the Atlantic. The yearly mean significant wave height and peak period offshore the north-western coast is 2–2.5 m and 9–11 s, and the modal height and period range between 1.5–3 m and 9–14 s; this wave regime corresponds with WNW to NNW swell generated in high latitudes in the North Atlantic [57]. Costa et al. [58], based on the several wave buoy data along the Portuguese coast, were able to characterize the mean wave conditions for Figueira da Foz. They concluded that the annual average period was 6.6 s, and the most common peak values observed were 11.4 s.
The Atlantic studied area has been affected by several extreme marine events in historical times. Research undertaken in Portugal on extreme events and their recurrence is essentially based on historical data, roughly covering the last two millennia, and on geological data extending further in time. Besides major storms and hurricanes, tsunami events have impinged the Portuguese coast. Baptista and Miranda [59] and Andrade et al. [60] list historical and geological imprints of past tsunamis that impacted the Portuguese coast and concluded on a list of 17 reliable events since 60 before the Common Era. Hurricanes have increased in frequency and have caused widespread impact along the Portuguese coast and in some of the study areas. For example, Storm Christina in Coxos and Hurricane Leslie in Cova Gala caused extensive inland inundation, sediment erosion and transport, and huge economic damages [61,62].
As with south-eastern Sicily, the central Atlantic coast of Portugal is not an area where Tropical Cyclones form. Tropical Transition is the natural process responsible for the transformation of an extra tropical system into a tropical system. In addition, a recent study [61,63], based on a climate change scenario showing 1 °C less global warming than the SRES A1B scenario [64,65], suggests an eastward extension of the development region of tropical storms. In the current climate, the main genesis region for hurricanes is confined to the western tropical Atlantic, where sea surface temperatures are above the threshold (27 °C) required for tropical cyclones to develop. Future tropical storms that reach western European coasts (and cause hurricane-force storms) predominantly originate from the eastern part of the tropical Atlantic. This is because climate warming in the eastern tropical Atlantic causes sea surface temperatures to rise well above the 27 °C threshold.

3. Materials and Methods

LEUCOTEA system is composed of four different phases. The first step is dedicated to the video dataset definition, the second is related to the acquisition of field data, and the other two are the video analysis with CNN and Optical Flow, respectively.

3.1. Video Dataset Definition
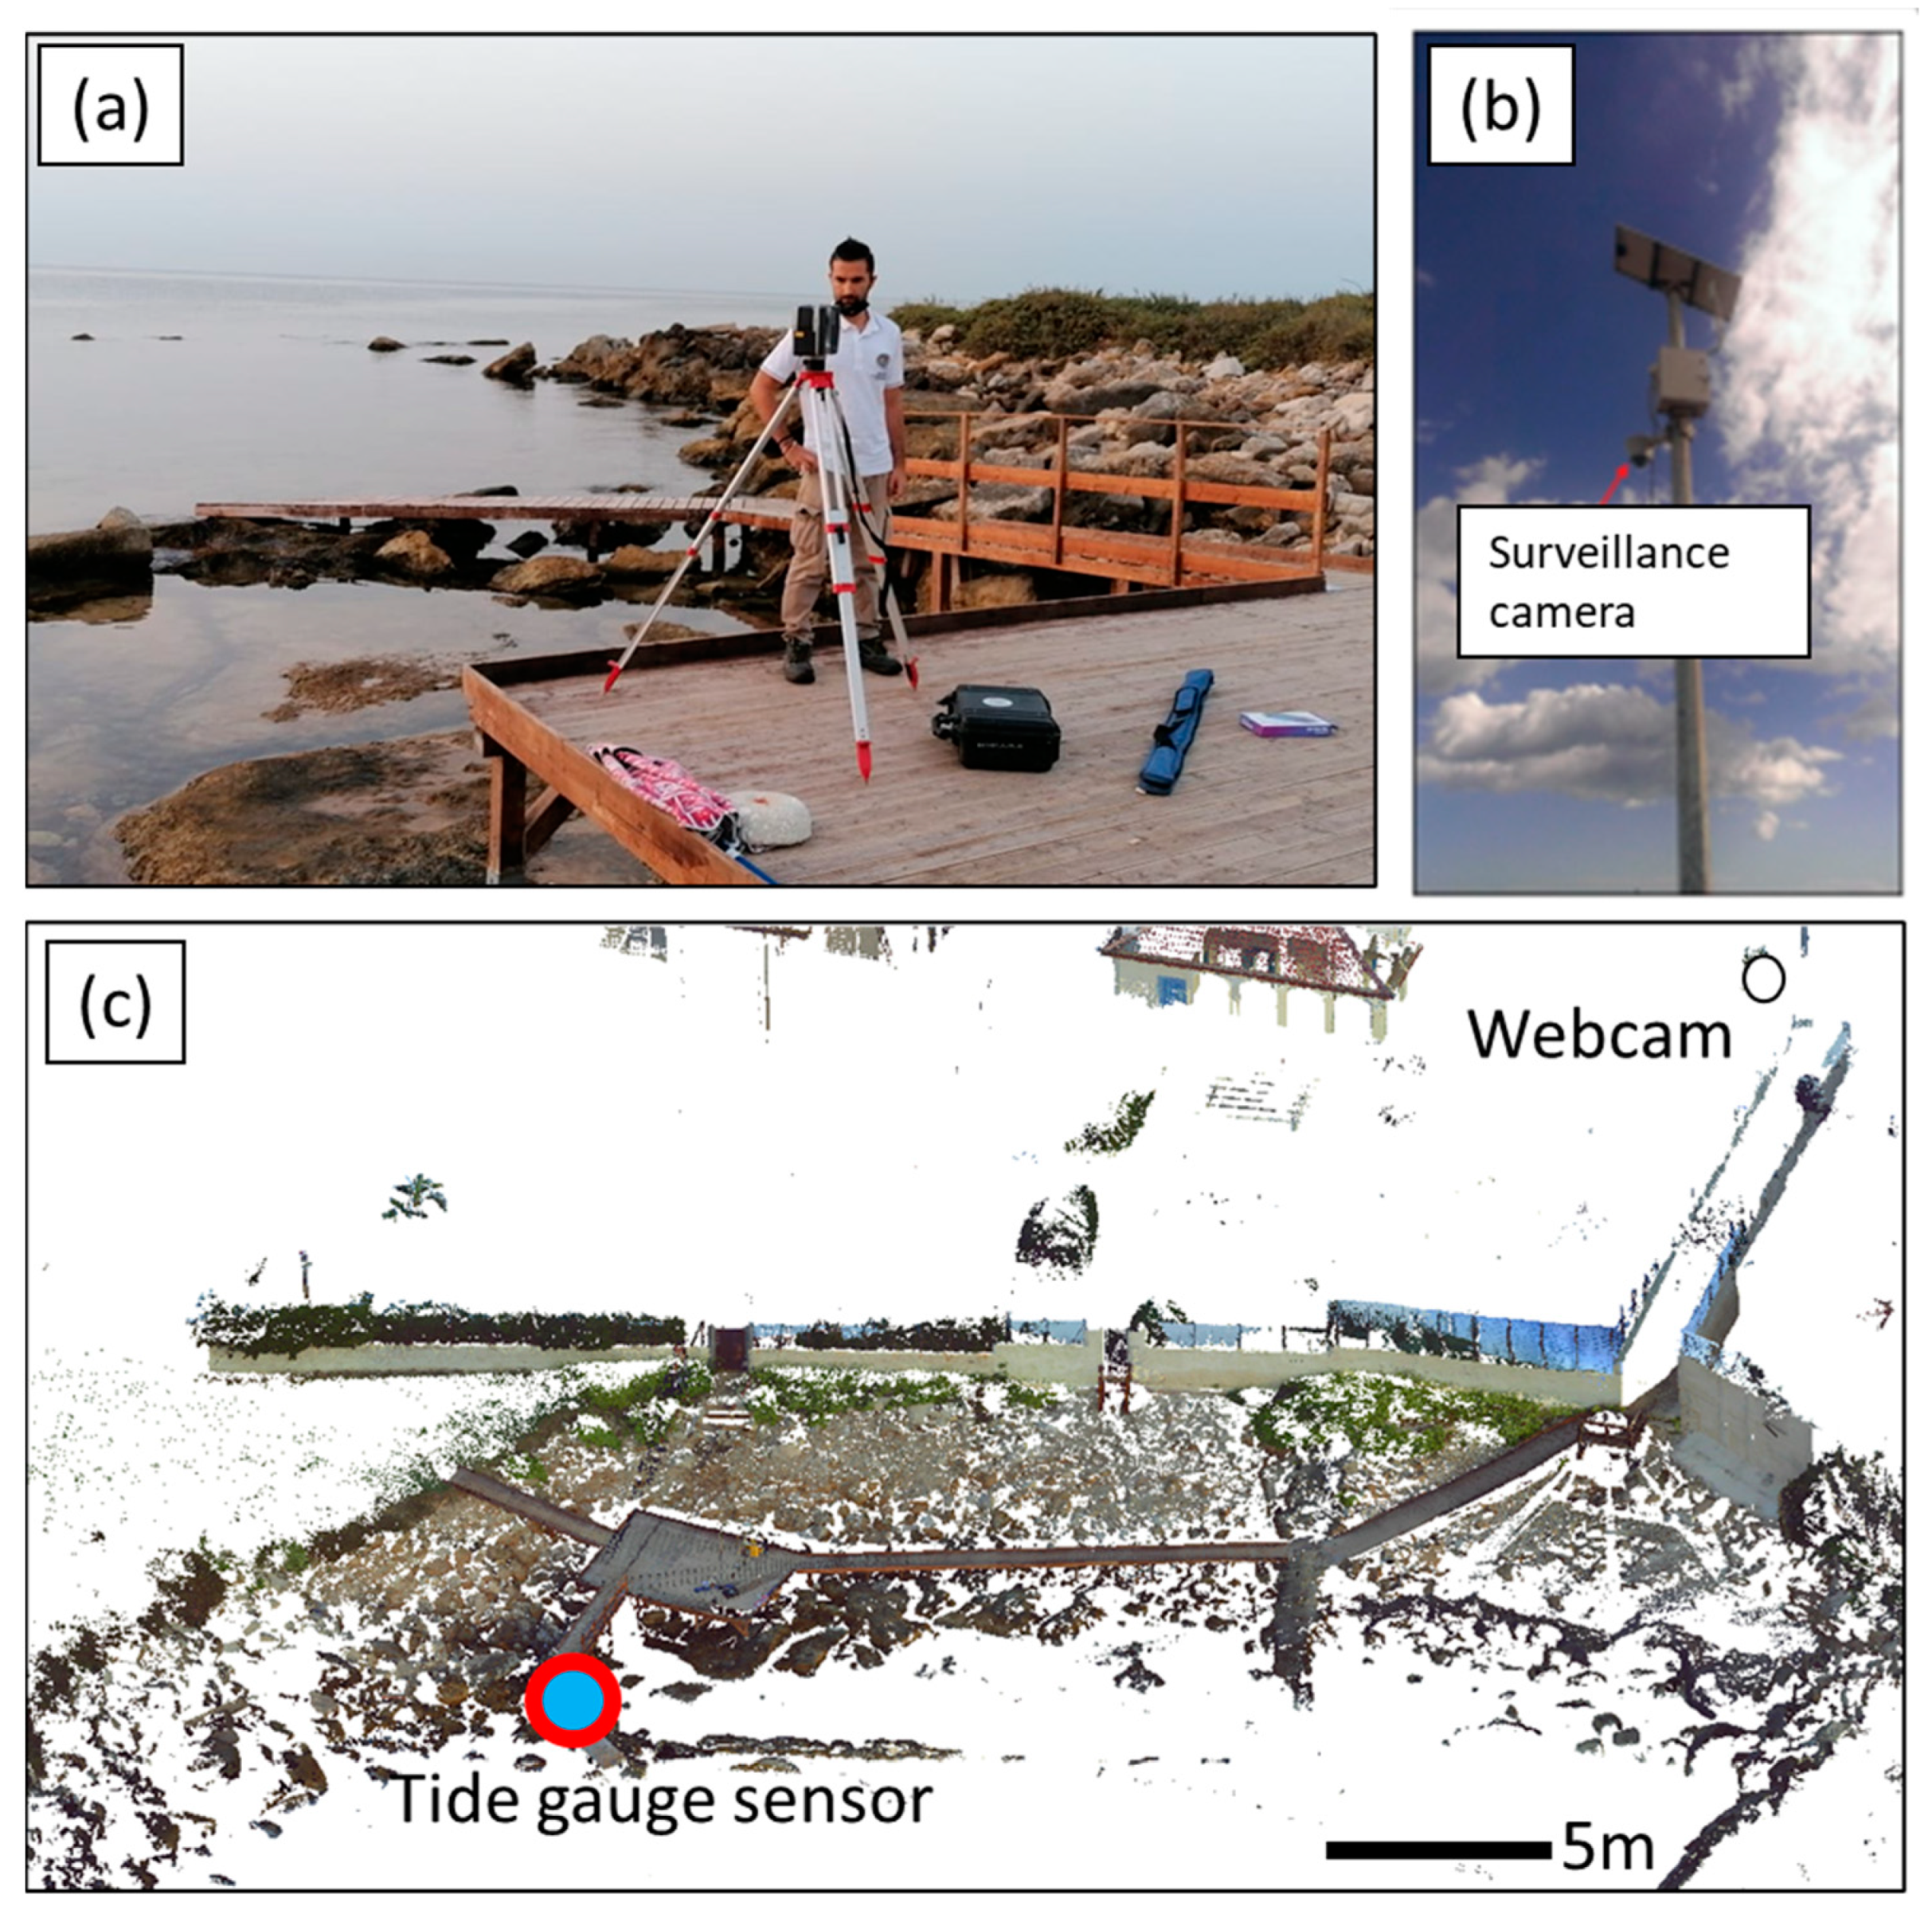
The tide and wave parameters were assessed by applying deep learning and computer vision techniques to videos recorded in the areas reported in Table 1. The data was acquired with two different systems: fixed remote-controlled cameras and action HD cameras. Continuous 24 h video recorded by the surveillance camera system on the Marine Protected Area of Plemmirio, along the coasts of Maddalena Peninsula in south-eastern Sicily, were used to develop the Convolutional Neural Network (CNN). This was later used to obtain tide values and storm surge, and the Optical Flow was applied to assess the wave flow, period, and length and to derive wave height. In 2003, the technicians of the Marine Protected Area of Plemmirio installed 10 surveillance camera stations intending to detect illegal fishing operations and monitor sea conditions. The stations are mounted on 9 m high poles and equipped with an HDTV camera AXIS P5635-E Mk II with 30× optical zoom framing the coastal area (lens 4.3–129 mm; F1.6–4.7; horizontal field of view: 65.6–2.0; vertical field of view: 39.0–1.2). In 2018, during the impact of medicane Zorbas, the video from the camera Santa Lucia (Figure 1a) was used to detect several boulders displacement occurring during the storm induced by the Mediterranean hurricane. Since 2021, continuous video from three distinct cameras (Massolivieri, Santa Lucia, and Varco 11) has been collected.
Along the Atlantic coast of Portugal, we tested the use of Action HD Cameras instead of a fixed remote-controlled cameras system. In this case, we used three GoPro Hero Black10, installed in distinct positions along the studied coastal areas, to define the wave setting from different points of view, perpendicular to the shoreline. Each GoPro Hero Black10 recorded about 3 h of video, with a resolution of 5.3 k and frame rate of 60 fps, in each one of the four selected sites (Figure 1b). The acquisition with action cameras was performed to test the difference in the Optical Flow results compared to the fixed remote-controlled cameras.

3.2. Field Data

Topographic data were acquired through a phase-shifting Laser Scanner Faro Focus X130, obtaining the point clouds useful to calibrate the geometrical elements on the webcam perspective. The point clouds were georeferenced with GPS-RTK (Leica Geosystem) acquisitions and corrected for the geodetic elevation. Furthermore, GPS—RTK acquisitions were used to obtain Ground Control Points (GCPs) needed for calibrating deep learning and Optical Flow outputs. The georeferencing of point clouds with GCPs showed a root mean square (RMS) equal to 0.014 m.
To validate the deep learning results with field data on the Italian sites, a tide gauge sensor was installed in the Varco 11 coastal area. The tide data were obtained using a pressure gauge Valeport, installed on a wood brick on the Varco 11 (Figure 3), acquiring data from 15 September 2021 to 20 September 2021, with a sampling rate of 10 min. Offsets of the pressure sensor were assessed through the 3D cloud points reconstructed with Laser Scanner; measured tide gauge data were compared with the Catania tide gauge records to highlight the semidiurnal phases in the area of Siracusa.

3.3. CNN for the Tide Assessment

The CNN developed in this work is based on the assumption that it is possible to assign a tide value for each video frame recorded by webcam. From the video records, images were automatically sampled each 10 min and resized with a 224 × 224 pixel size. The architecture of the classification network requires the tide classes to represent the tide height during the acquisition of the video frames. Tide classes were chosen using the tide records of Varco 11 and Catania and the vertical spatial reference measured through TLS data. For these reasons, the tide classes were divided with a sample pass of 0.05 m, ranging from 0 to 1.2 m, the highest limit measured by water level during the extreme marine events recorded in video. For each class, a set of 20 images was extracted every 15 min from video frames for a global training set composed of 540 images for each surveyed area of south-eastern Sicily.
The architecture of the classification network was developed in a MATLAB environment (version 2021b), following the architecture of GoogleNET [66] (Figure 4a, Table 2). The network development was performed with the following hardware device: CPU Intel Core i5 10th generation, GPU Intel® UHD Graphics, 12 GB of RAM running on Windows 10. The first layer corresponds to the input image of the sea-state recorded by webcam. The images are analyzed with a continuous series of layers of three types: convolutional layers, pooling layers, and fully connected layers. The convolutional layers for 2-Dimensional signals (such as images) are properly called 2D-convolutional layers, in which a convolution kernel is applied to an image. At each position, convolution between the kernel and the part of the image that is processed. Then, the kernel moves by a number n of pixels, n is called the stride. When the stride is referred to few numbers of pixels (from 5 to 10), redundant information is obtained. A zero padding is added, a margin of size l containing zero values around the image to control the output size. The convolution operations were combined with an activation function called Rectified Linear Unit (ReLU), generally the ReLU activation layer [67]. ReLU is a piecewise linear function that returns 0 if it receives any negative input, but for any positive value x, it returns that value. Thus, it provides an output with a range from 0 to infinity.
Furthermore, a cross-channel normalization operation was used for different channels to normalize each activation. CNN also has pooling layers, which allow for reducing the dimension, also referred to as subsampling, by taking the mean or the maximum on patches of the image (mean-pooling or max-pooling). Like the convolutional layers, pooling layers act on small patches of the image, producing a stride. In the deep learning network, pooling layers were used, which returned the maximum patches (max-pooling 2D layer) [68]. The depth concatenation layers use inputs with the same height and width and concatenate them along the third dimension (the channel dimension). The CNN ends with a fully connected layer, where each element of the previous layer is connected to each element of the softmax layer. The softmax layer is a function that estimates the relative probabilities and determines the final probable value. The architecture of the deep neural network is based on the Inception modules [69] (Figura 4b), which allow the network to choose between multiple convolutional filter sizes in each block. An Inception network stacks these modules on top of each other, with occasional max-pooling layers with stride 2 to halve the resolution of the grid. The CNN was trained with 70% of training images and 30% of validation images. The maximum number of epochs for training is 20, and a mini-batch with 42 observations was used at each iteration. The total number of iterations equals 80, with 4 iterations for each epoch. The final layer provides the probability of the tide classes annexed to a given image. Considering the micro-tidal regime of the Mediterranean coast, the entire range of tide phases has been classified. Thus, the highest probability was used as a classification criterion for a given time frame. On the other hand, extreme values of temporary sea-level rise are given by storm surge, which could exceed 1 m, as showed by historical tide records and direct field surveys [35].

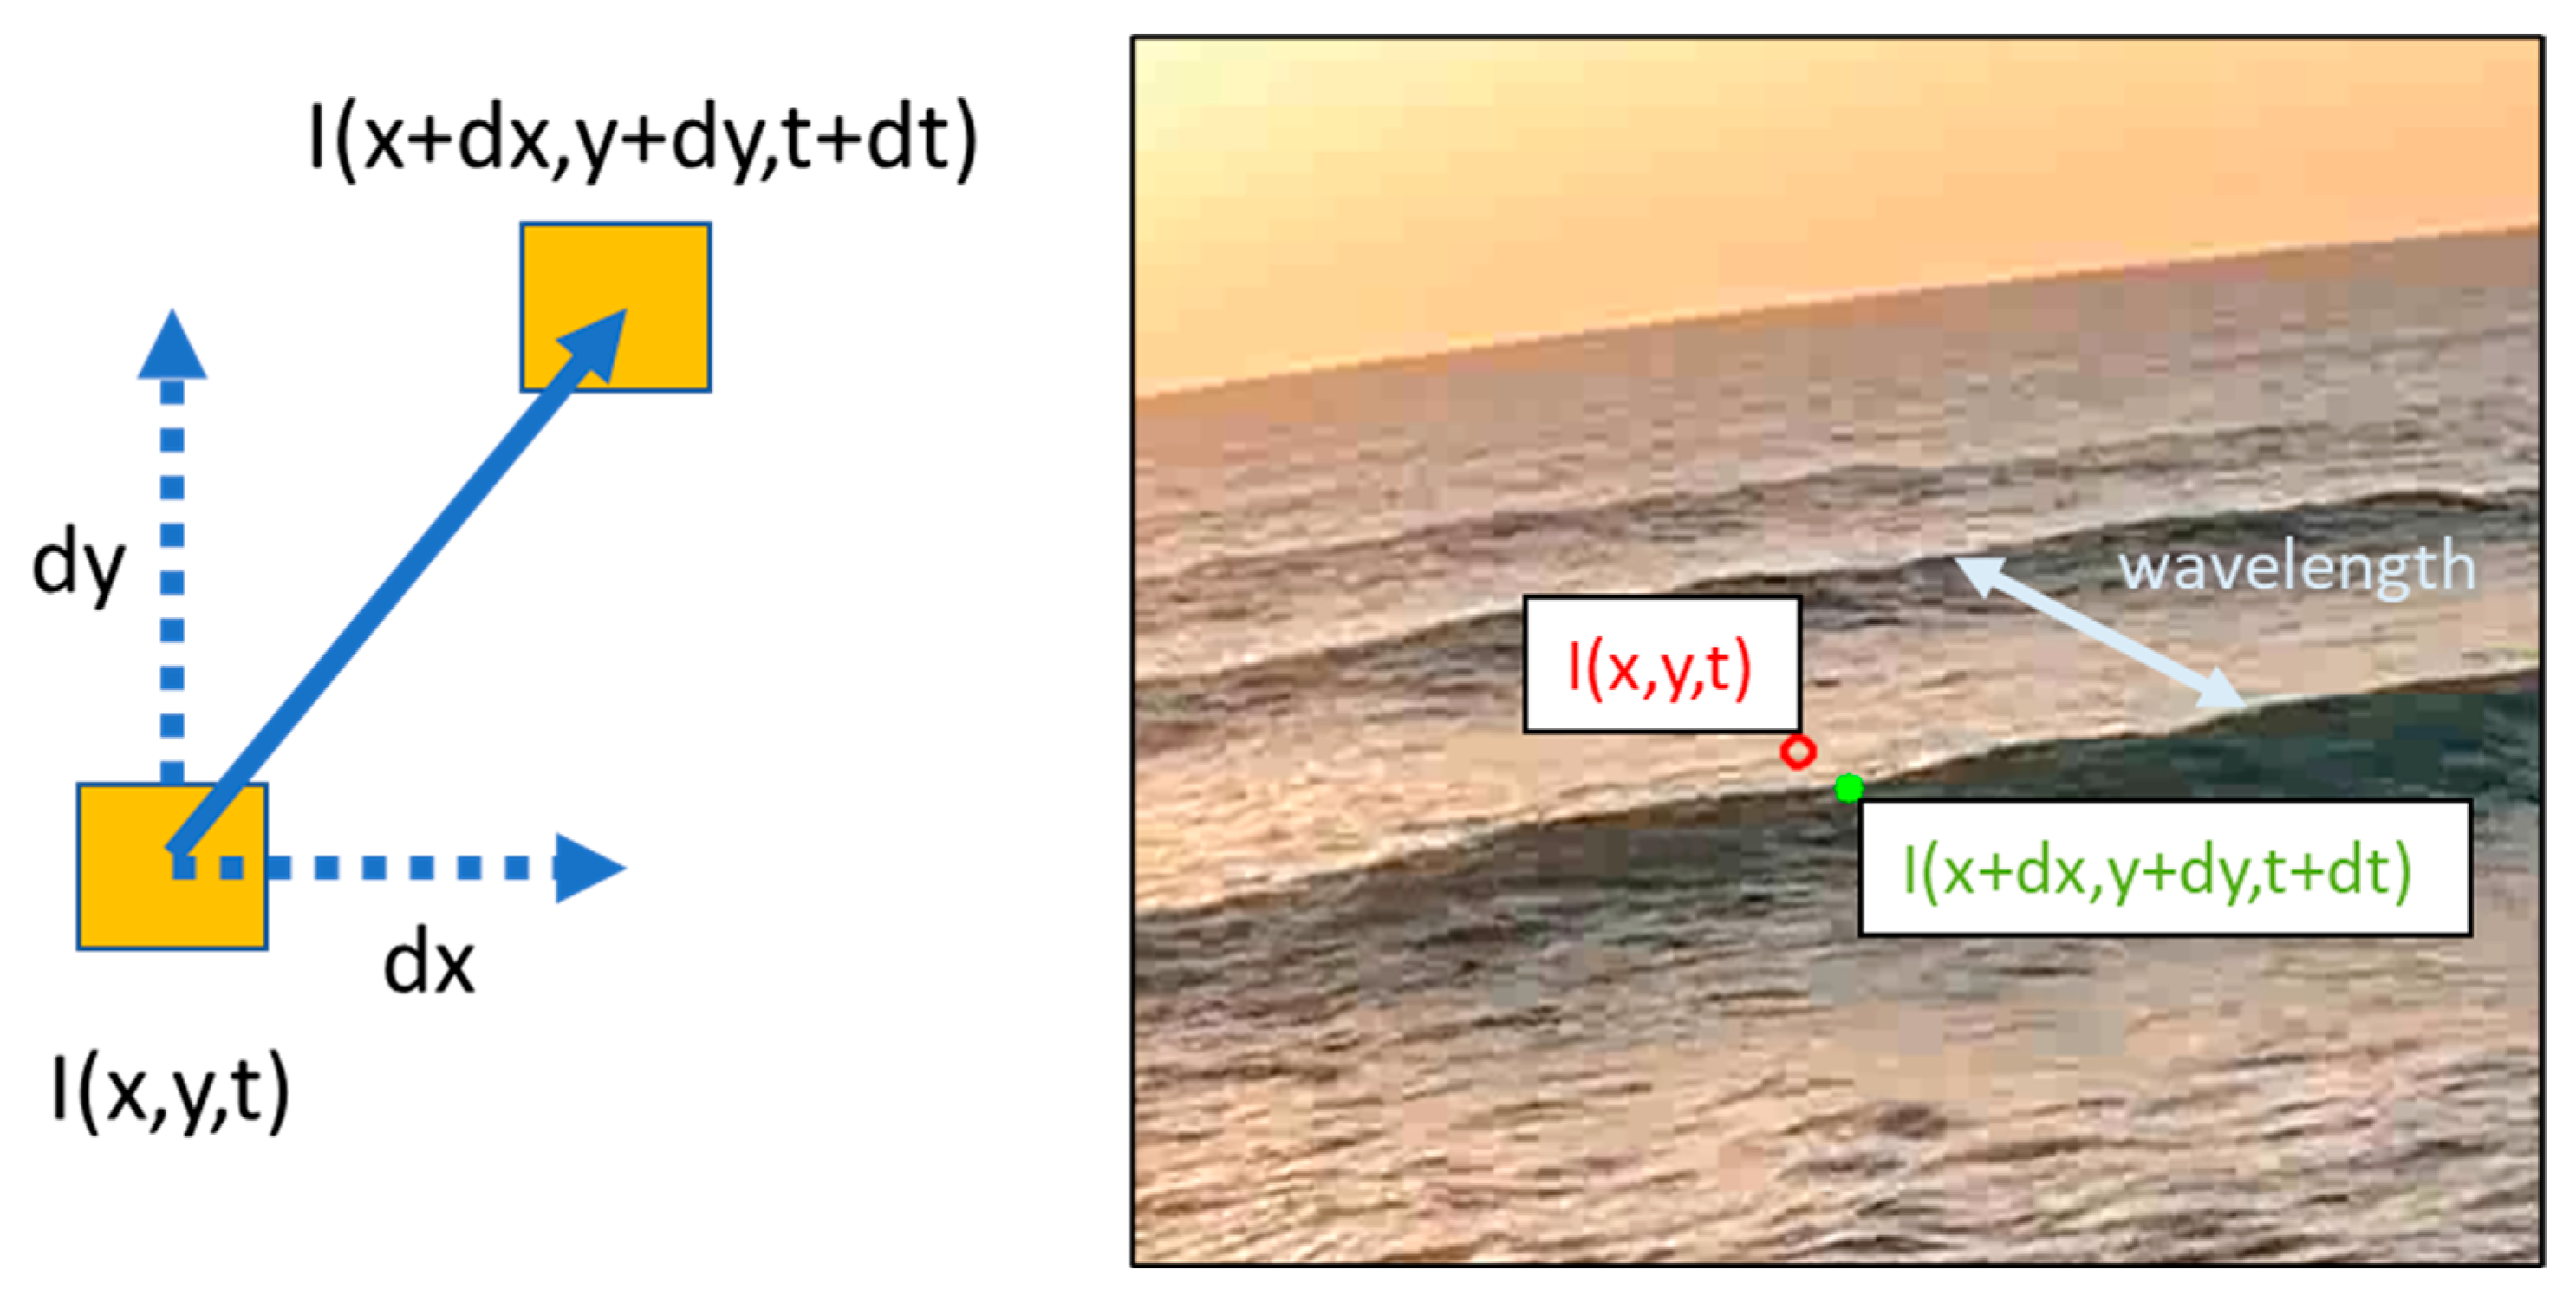
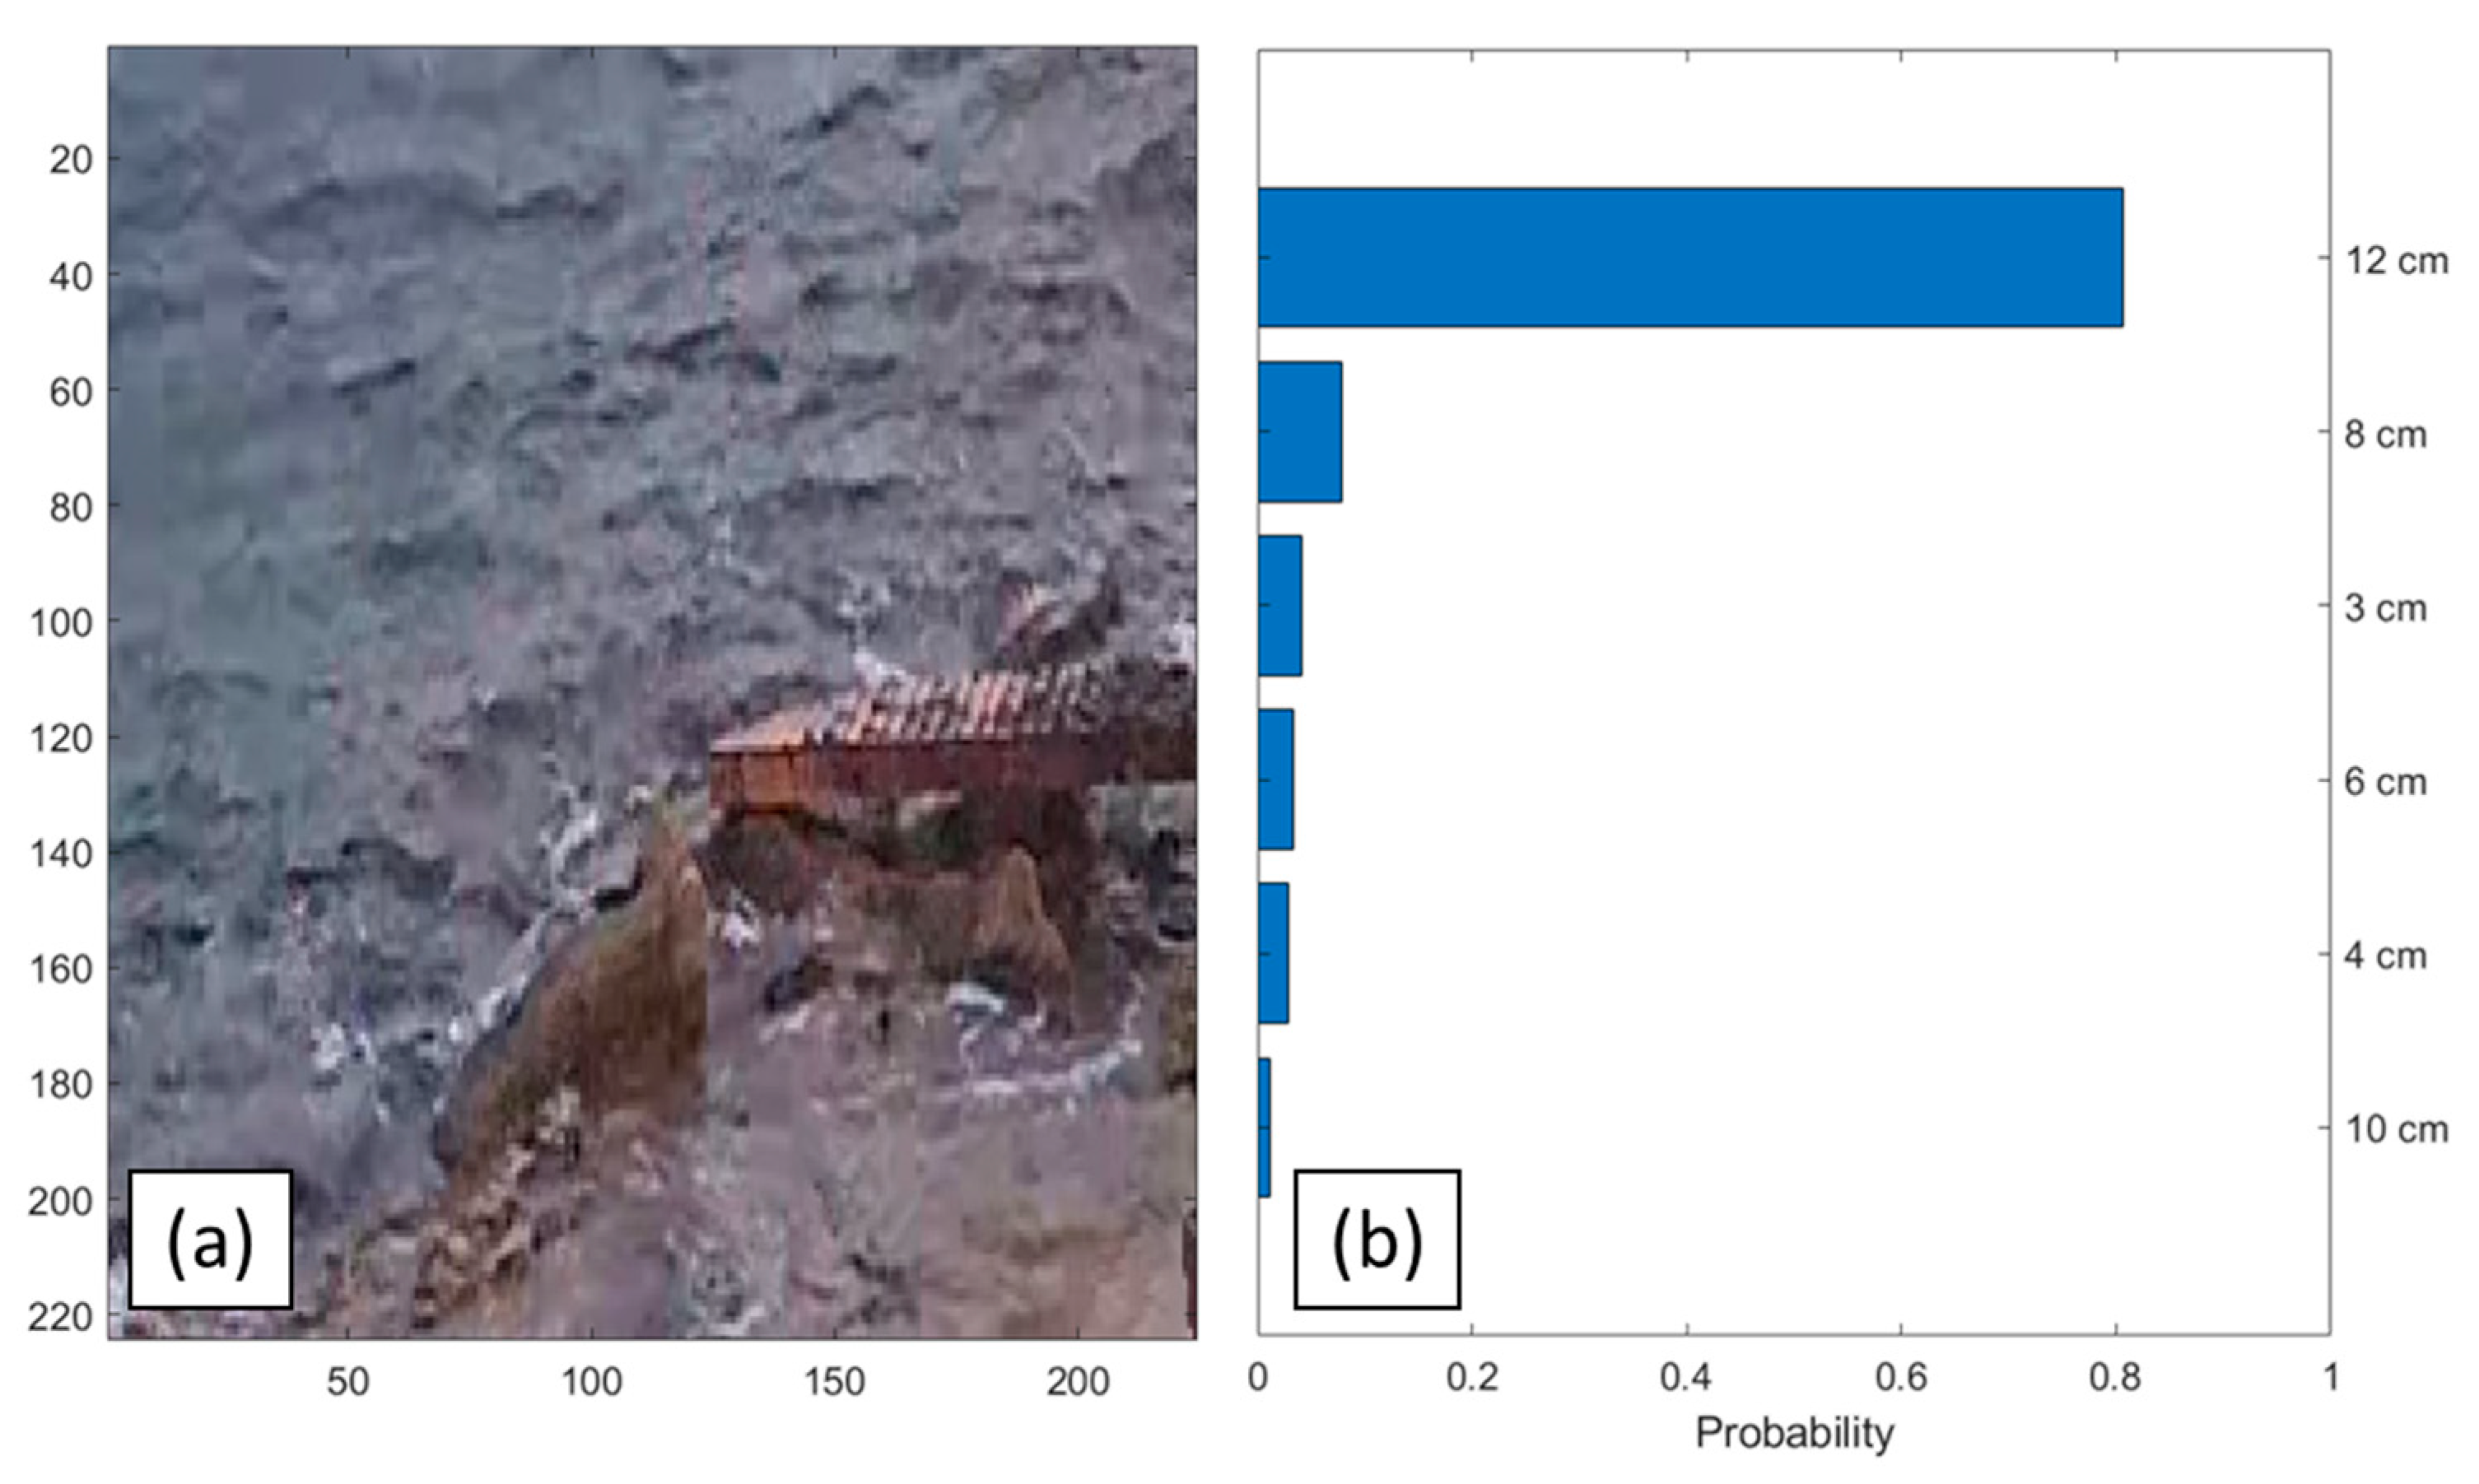
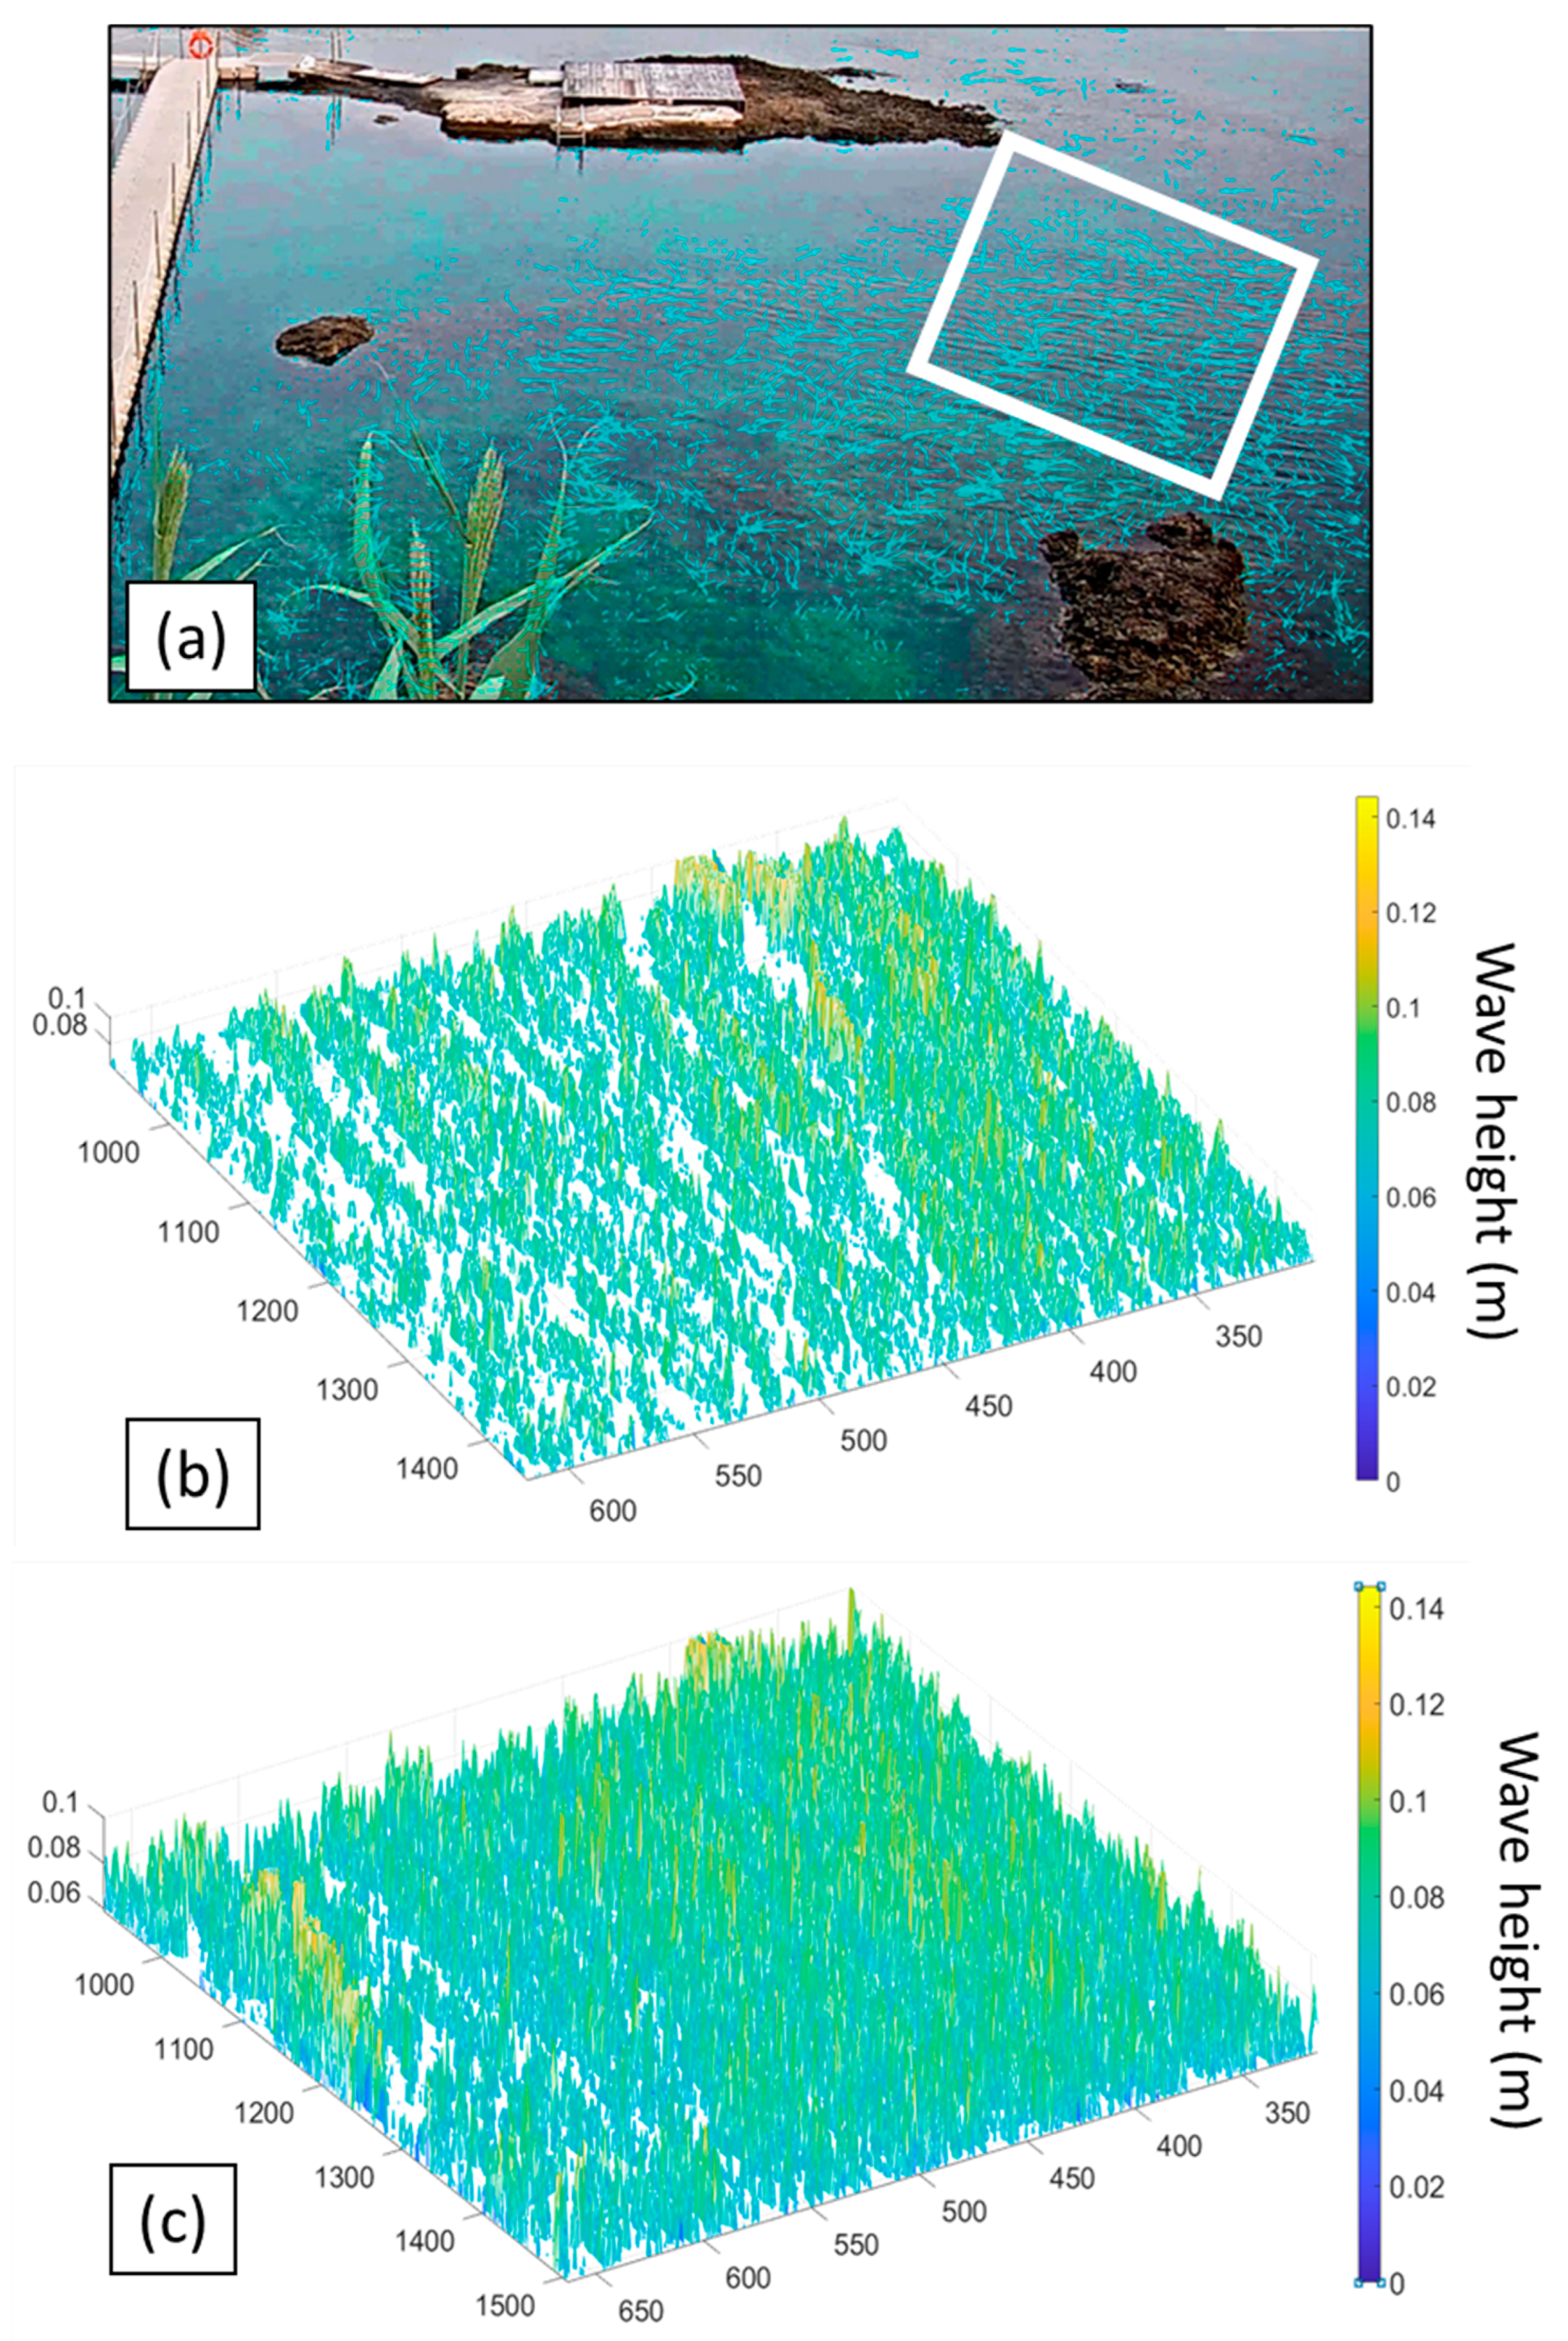
3.4. Tracking Waves via Optical Flow

The wave features were assessed through a dense Optical Flow module in a MATLAB environment, with the same approach followed by Wu et al. [26]. The Optical Flow assessment is based on the object motion estimation observed between consecutive sequence frames caused by the relative movement between the object and camera. Considering the pixel I(x, y, t) within a frame of an image, the pixel has moved by a certain distance (dx, dy) in the next frame, taken in the time increment dt (Figure 5).
In the work presented here, webcams are fixed, so the motion of objects is only relative to the objects themselves. The original image resolutions of the captured videos were 1080 × 1920 pixels. To obtain the wave motion parameters, the Farneback method was used [70,71]. With the GPU acceleration, the processing was performed for 25 frames per second (fps). First, the video frames were converted from RGB to greyscale to obtain the pixel intensity of the images. In the MATLAB environment, the Farneback algorithm generates an image pyramid of the pixel intensity, where each level has a lower resolution than the previous level. Then, the sequence of videoframes is analyzed as the pixel intensity changes during the time step. From pixel intensity images, the flow vectors were assessed by computing spatio-temporal image brightness derivatives using the Farneback technique. This method approximates the windows of image frames by quadratic polynomial expansion transform and approximates the neighborhood of both frames at consecutive times using a polynomial function. The Optical Flow outputs provide the flow vectors in x-y directions, the magnitude of flow vectors, and the vectors’ orientations. The square root of the magnitude of flow vectors represents the wave flow on the water surface. The difference in the pixel intensity was observed on the water surface, allowing us to detect the different wave fronts through videos. Outputs of Optical Flow showed the wave flow with dimensional units of pixel/frames. To convert the pixel/frame units in meters/second, the TLS data were used to obtain the dimensional grid on the water surface (Figure 6), and the frame rate was converted in seconds. This way, the distance between the wave fronts can be measured in metric units. The distance between the wave front allowed for assessing the wavelength, and the time measured between two consecutive crests (one wavelength) to a given point provided the wave period. Knowing the wave flow, wavelength, and wave period, it is possible to obtain the wave height by applying different relationships. In this work, the wave heights were obtained through the linear theory of Airy on shallow water [72,73,74], and breaking-wave height was obtained through empirical formulas [75]. The airy theory is based on the functions to their first order (hence linear) only, which provide the wave height in shallow water with the following relationship:
H = 4 π g T   cos 1 ( σ t k x )
where g is the gravity acceleration, T is the wave period, σ is the wave frequence, k is the wave number, x is the linear length on the orthogonal direction of the wave front, and t is the temporal range between two video frames.
To compare the linear theory results with empirical studies, formulas for assessing breaking-wave height were considered. The relationships of the breaking-wave height are based on the bottom slope and wave characteristics (Table 3). Rattanapitikon and Shibayama [6,76] have analyzed different formulas for the breaking-wave height and showed that the best match between formula results and observational data was obtained by the following relationship:
H b = 0.17 L 0 [ 1 e x p ( π d b L 0 ( 16.21 m 2 7.07 m 1.55 ) ) ]
where:
  • H b is the wave break height (m);
  • L 0 is the wavelength in offshore (m);
  • d b is the water depth with breaker conditions (m);
  • m is the bottom slope (radiant).
For each area of the Mediterranean and Atlantic coast, average bottom slopes m were obtained from available bathymetric surveys [54,77,78,79,80]. Bathymetric data were obtained for the winter seasons (during 2015–2016 [77,78,79,80]) to assess a range value of coastal slope m similar to the coastal slope and wave climate recorded during the video monitoring. Wavelength in offshore L 0 was assessed through wave propagation modeled for the offshore areas of Sicily [35] and Portugal [81]. The water depth at the breaker zone was derived from literature [82,83] (Table 3).
Table 3. Parameters used for the assessment of breaking-wave height at the offshore conditions. Average bottom slope m was obtained through available bathymetric surveys. The water depth at the breaker zone was derived from literature [78,82,83,84,85]; wavelength in deep water was assessed from the SWAN model (reported in Scicchitano et al. [35]) and wave model of Spanish Harbor Authority (SIMAR 1,041,058 point—9.75° W and 39.50° N; SIMAR 1,042,065 point—9.5° W and 41.25° N [81]).
Coastal AreaAverage Bottom Slope m (Radiant)Wavelength in Deep Water L0 (m)Water-Depth db at the Breaker Zone (m)References
Massolivieri0.03–0.05306[79,82]
S.Lucia0.05–0.06306[46,79,82]
Varco 110.10–0.12306[46,79,82]
Cova Gala0.02–0.05455.5[54,83]
Costa Nova0.02–0.05455.5[3,62,83]
Nazaré0.19–0.057012[78,80,85]
Coxos0.2–0.237015[78,80,85]

4. Results

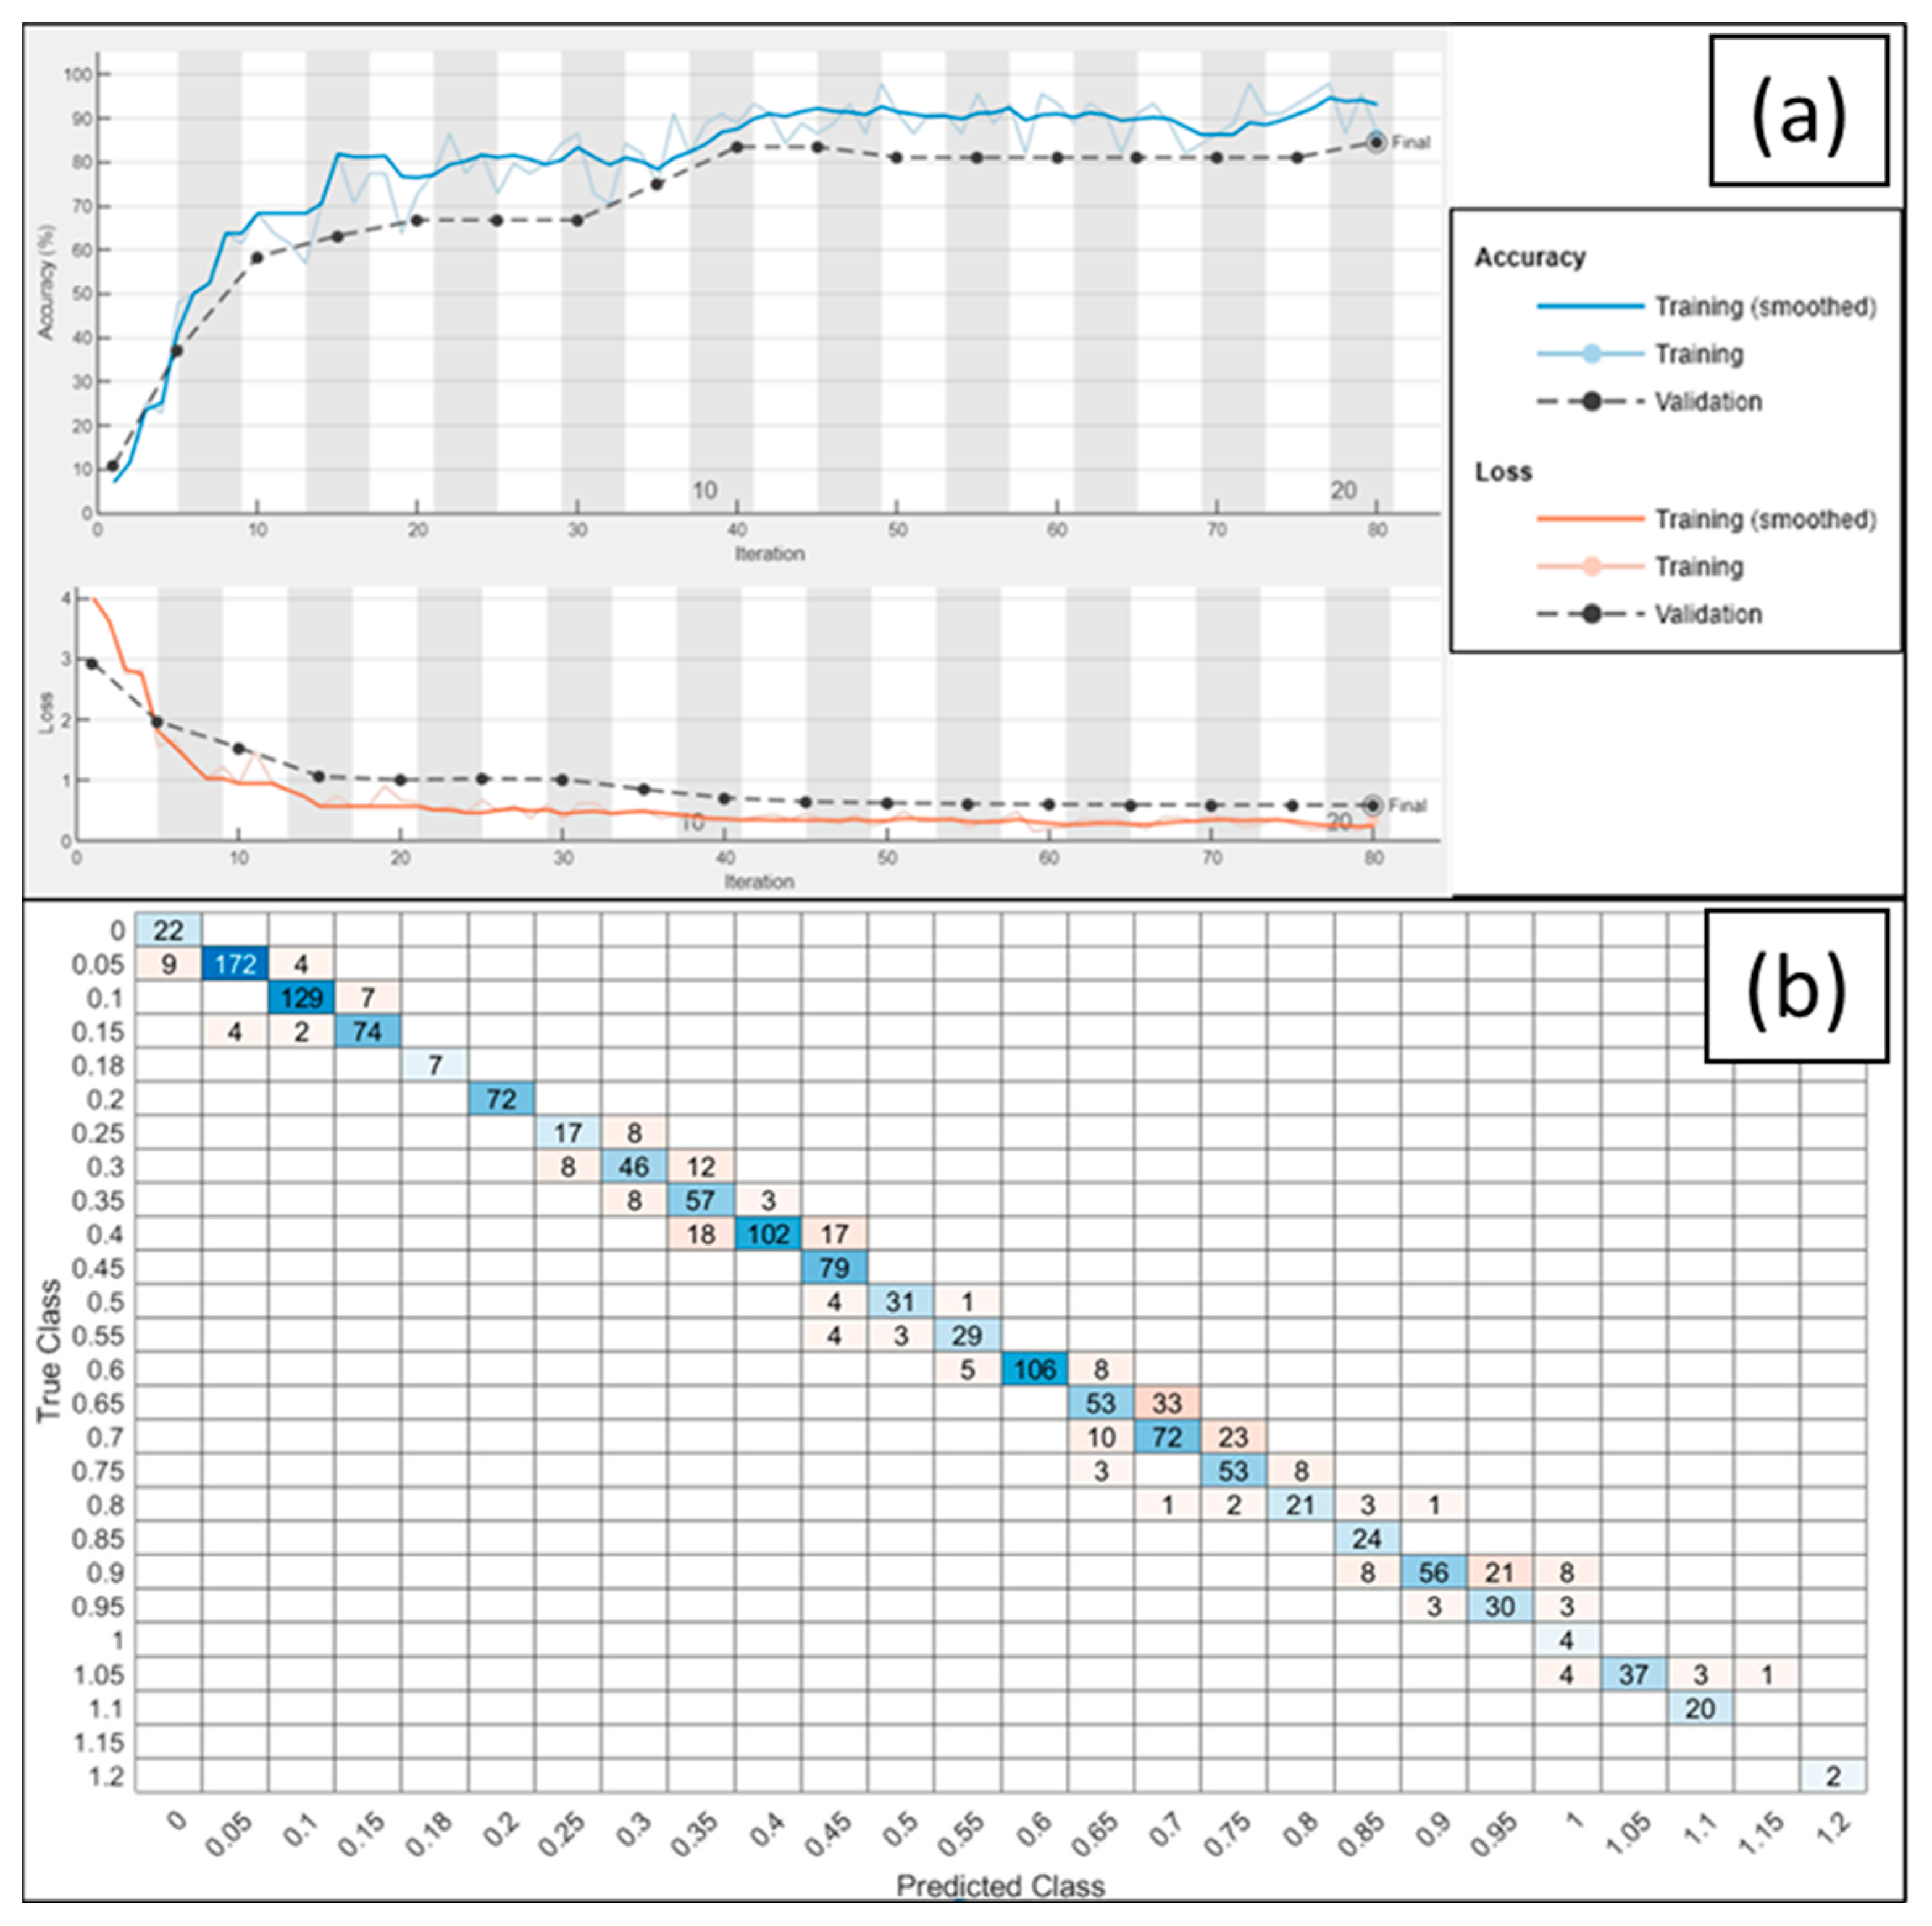
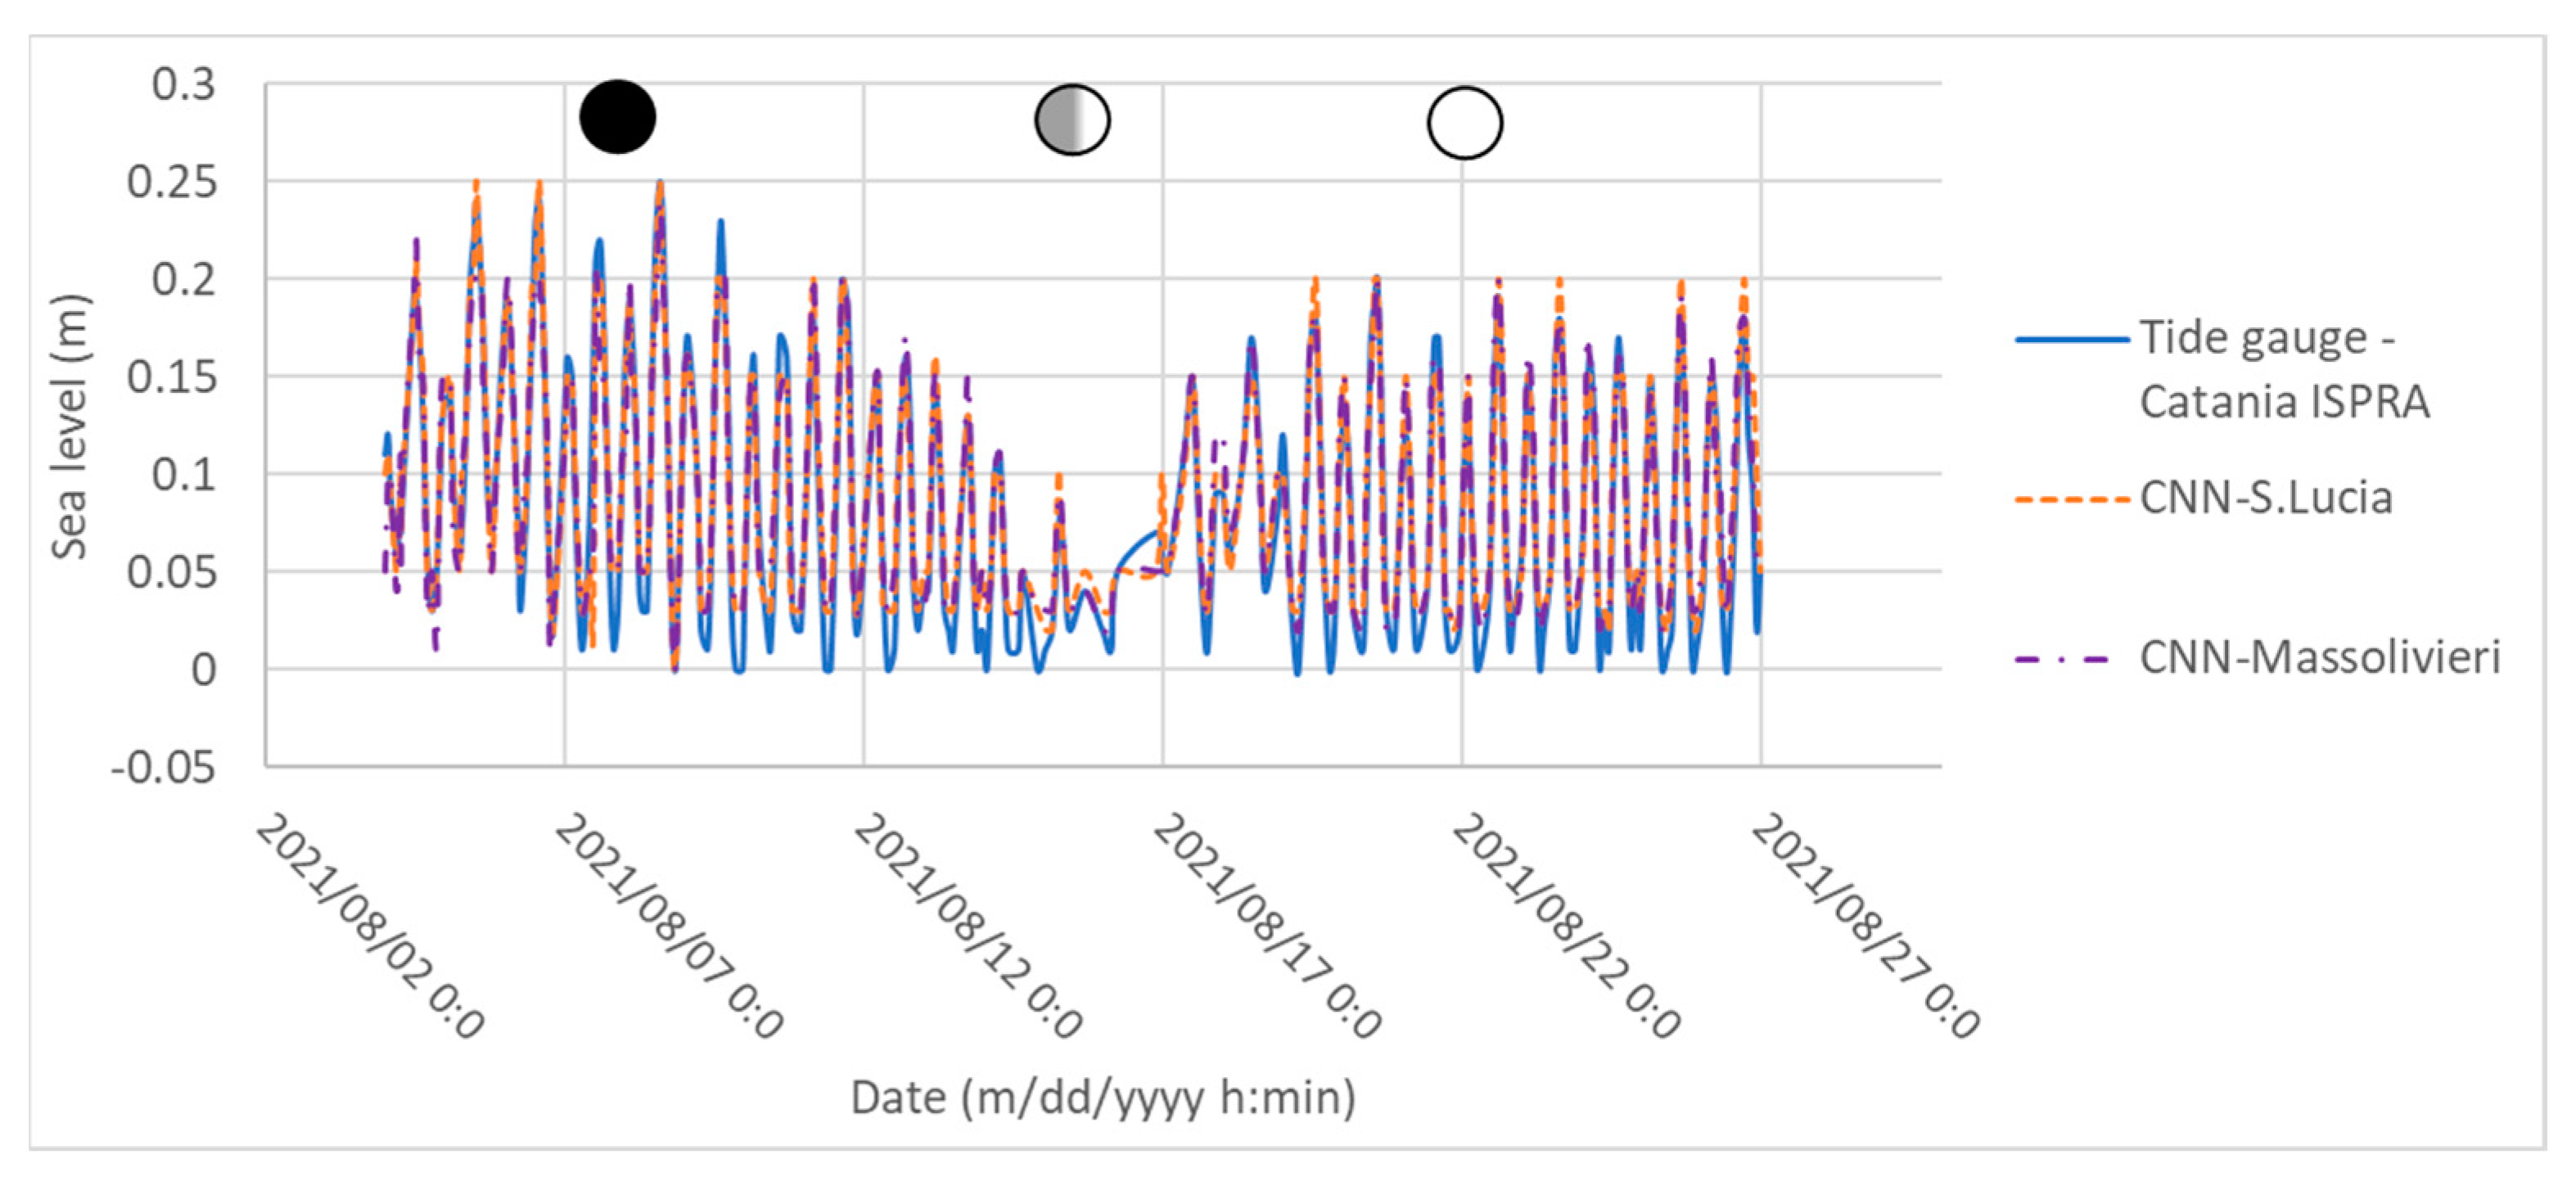
4.1. Tide Assessment through CNN Classification Technique

The CNN outputs provide the probability for the tide classes annexed to a given video frame of the webcams. In Figure 7, a snapshot of Varco 11 is shown with the probability of tide classes associated with that image. To represent the tide phases in a continuous temporal range, different snapshots were automatically extracted from the video records, and tide classes were associated to each image of three rocky coasts (Varco 11, Massolivieri, Santa Lucia). The accuracy reached by the CNN is 84.5%, with a Categorical Cross Entropy Loss function that provided a value of 0.75 at the end of iterations (Figure 8a). The CNN predictions were compared with the actual values of the tide signal recorded in Varco 11 and Catania through a Root Mean Square Error (RMSE) analysis. An RMSE analysis was performed to assess the error between the CNN prediction and the actual value of the tide signal, showing an RMSE equal to 0.12 m. A three-order polynomial interpolation was applied to the tide values obtained from the CNN to reproduce the tide phases. The results were compared with the tide data acquired in Varco 11 (Figure 8 and Figure 9). The metrics of the CNN output were assessed through the confusion matrix between predicted classes (tide classes obtained from CNN) and true classes (tide values obtained from spatial reference) (Figure 8b). Since the class distribution is unbalanced data, the F1-Score was used, which provides an excellent compromise between precision and recall [86]. F1-Score was assessed from the confusion matrix, obtaining a value of 0.81, representing the percentage of the model reliability. Since tide classes are mutually exclusive and cover all possible tide phases, the highest probability of predicted class was selected as reliable tide values. However, extreme values can occur during storms and medicanes, where predicted classes are associated with higher values than common tide phases, reaching values greater than 1 m.
To highlight the relation between the CNN predictions and different tide phases, such as neap tide and spring tide, the CNN was applied for a longer record of 1 month, acquired in August 2021 from Santa Lucia and Massolivieri cameras. The RMSE assessed for the two areas showed 0.018 m for Santa Lucia and 0.027 m for Massolivieri.

4.2. Wave Flow and Wave Height

Through Optical Flow, it was possible to obtain the wave flow for each video frame recorded by surveillance and action cameras. The Optical Flow module provides the wave flow vectors of sea–surface (Figure 10a). Once the values of wave flow vectors are known for a given area, and through the application of the Airy linear theory, it was possible to obtain the tensors of wave heights for the area (Figure 10b,c). An RMSE analysis was performed considering the wave height assessed through the linear theory with reference points assessed throughout the TLS data for all studied areas, showing an error of 0.1 m. The application of Optical Flow on the continuous video records allowed us to obtain the wave heights impacting the coasts for the entire duration of the video records. Furthermore, it was possible to assess the wave break heights that impacted the coasts. In Figure 11, it is reported the automatic extraction of wave break heights on the Cova Gala coast, showing the greatest wave heights recorded in the video. The Optical Flow allowed assessing for all surveyed areas (Supplementary Material—Optical Flow Wave Height), showing the results for the different records of surveillance cameras and action HD cameras.

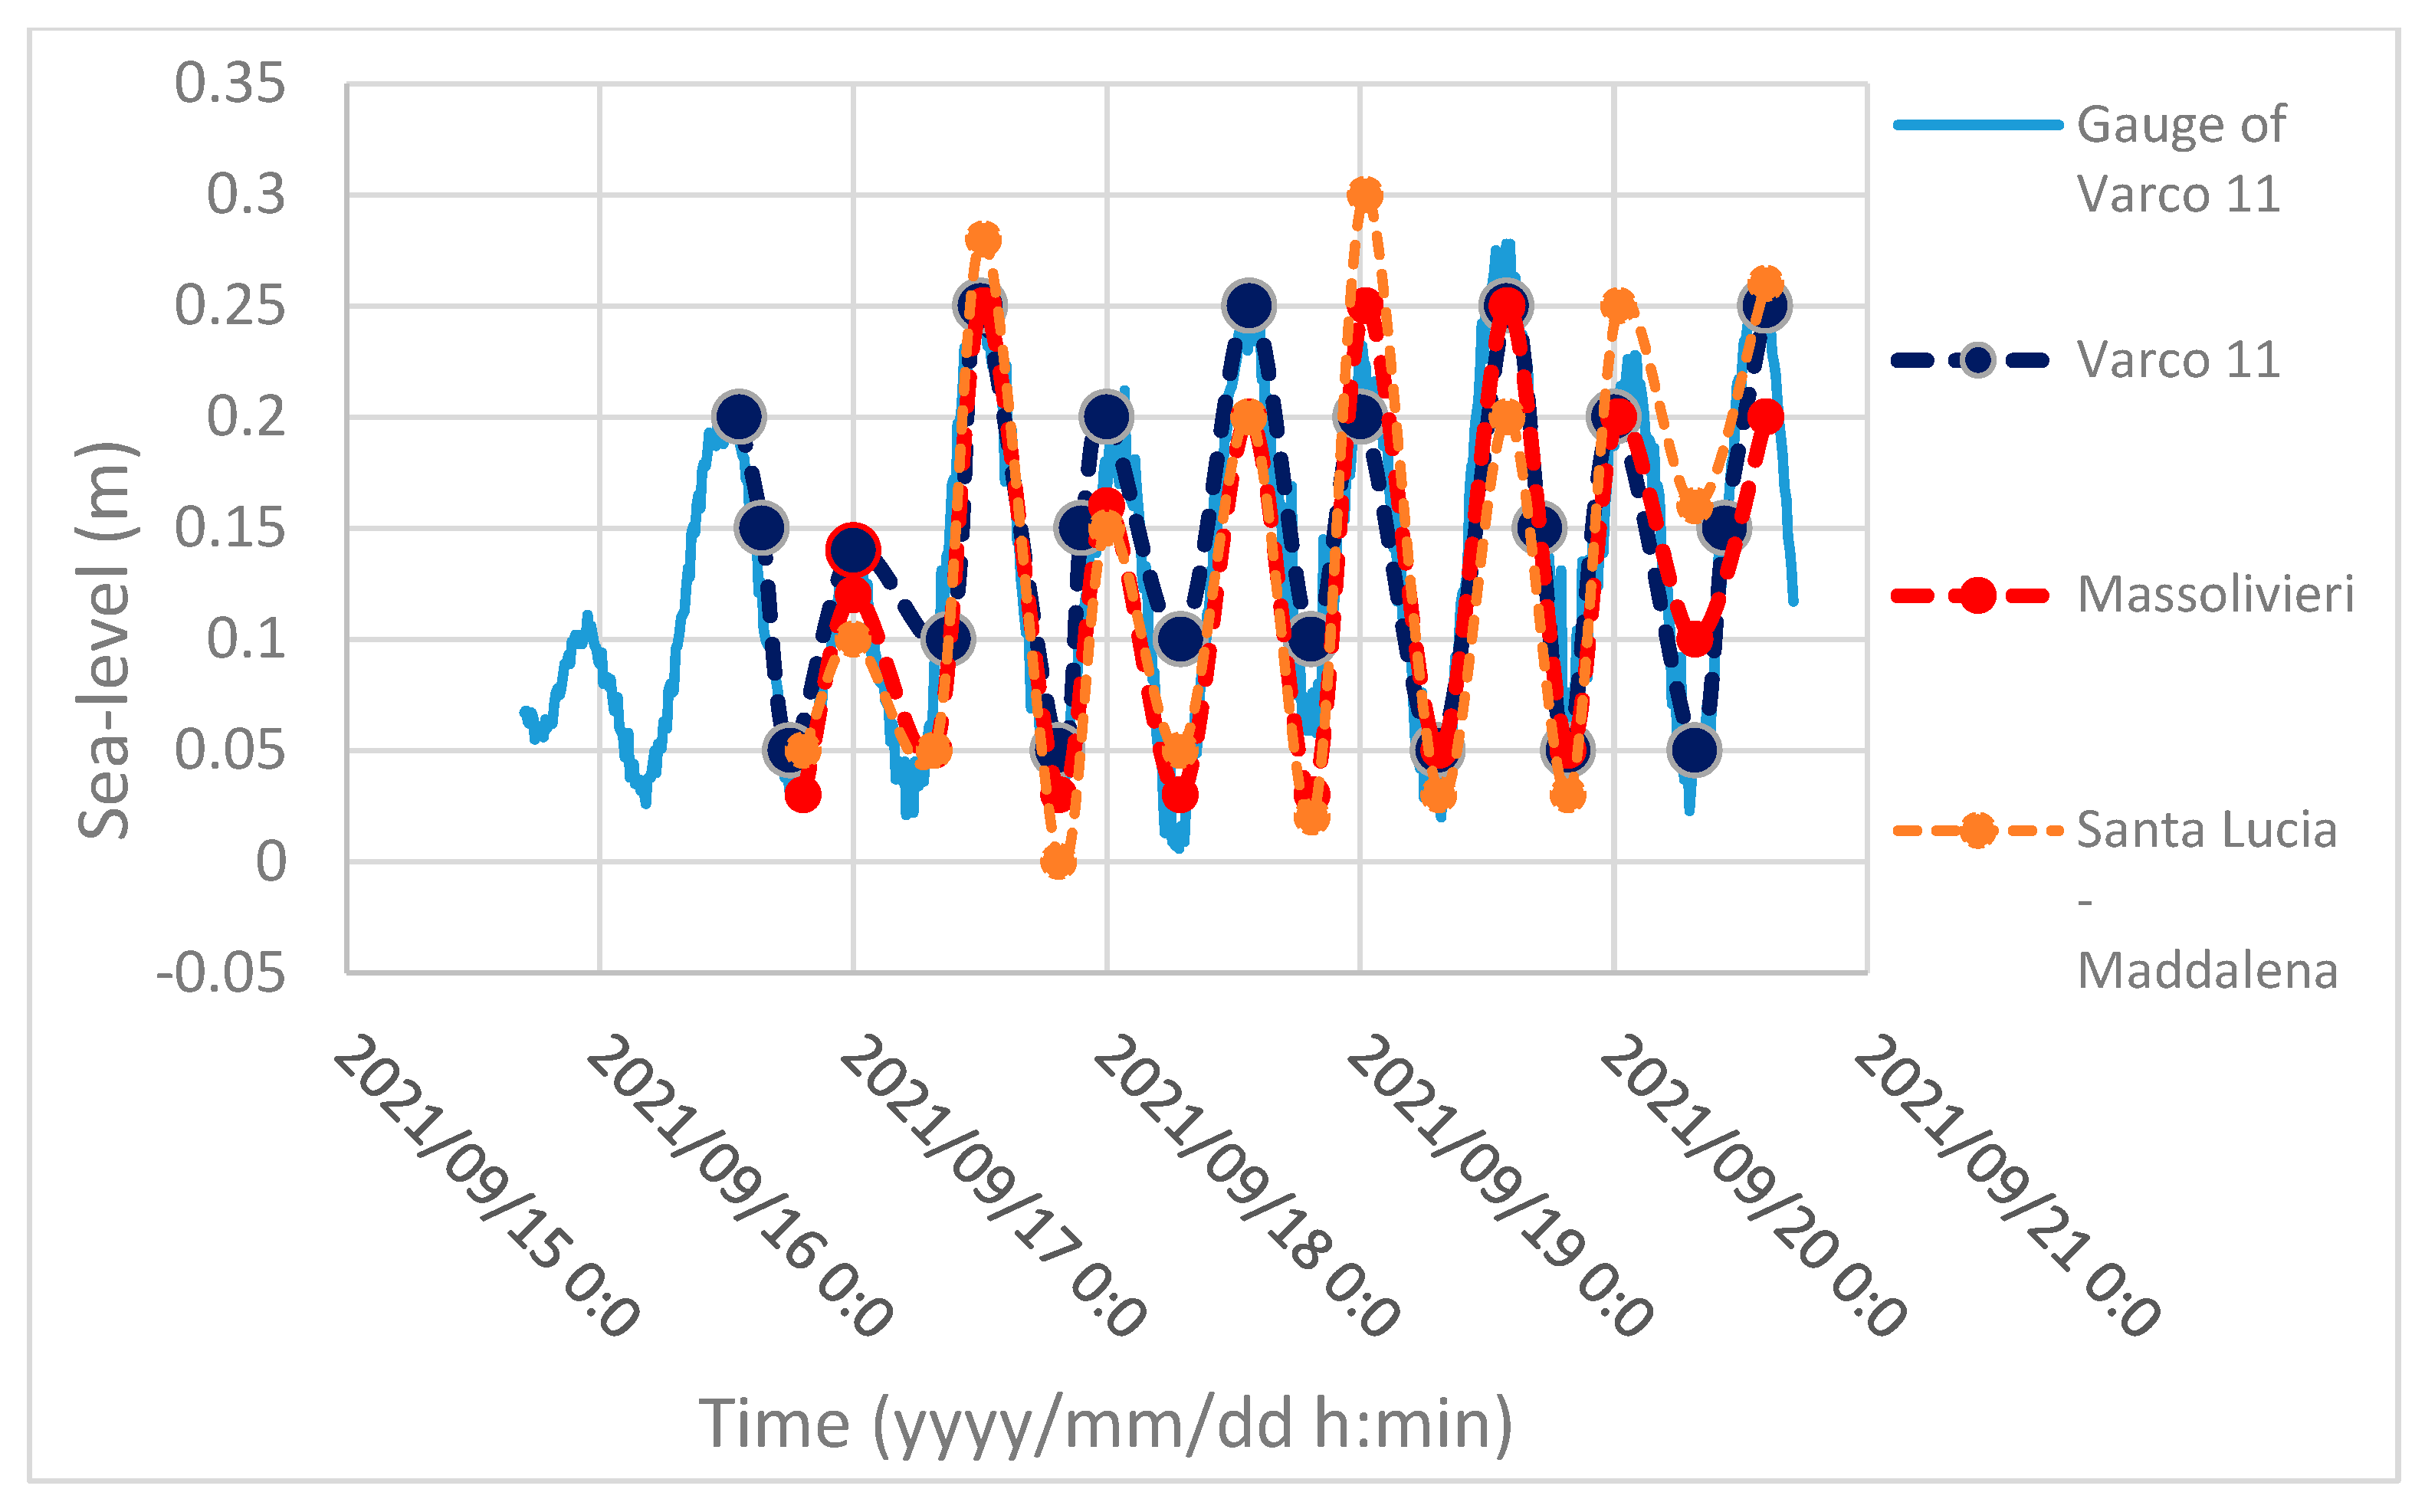
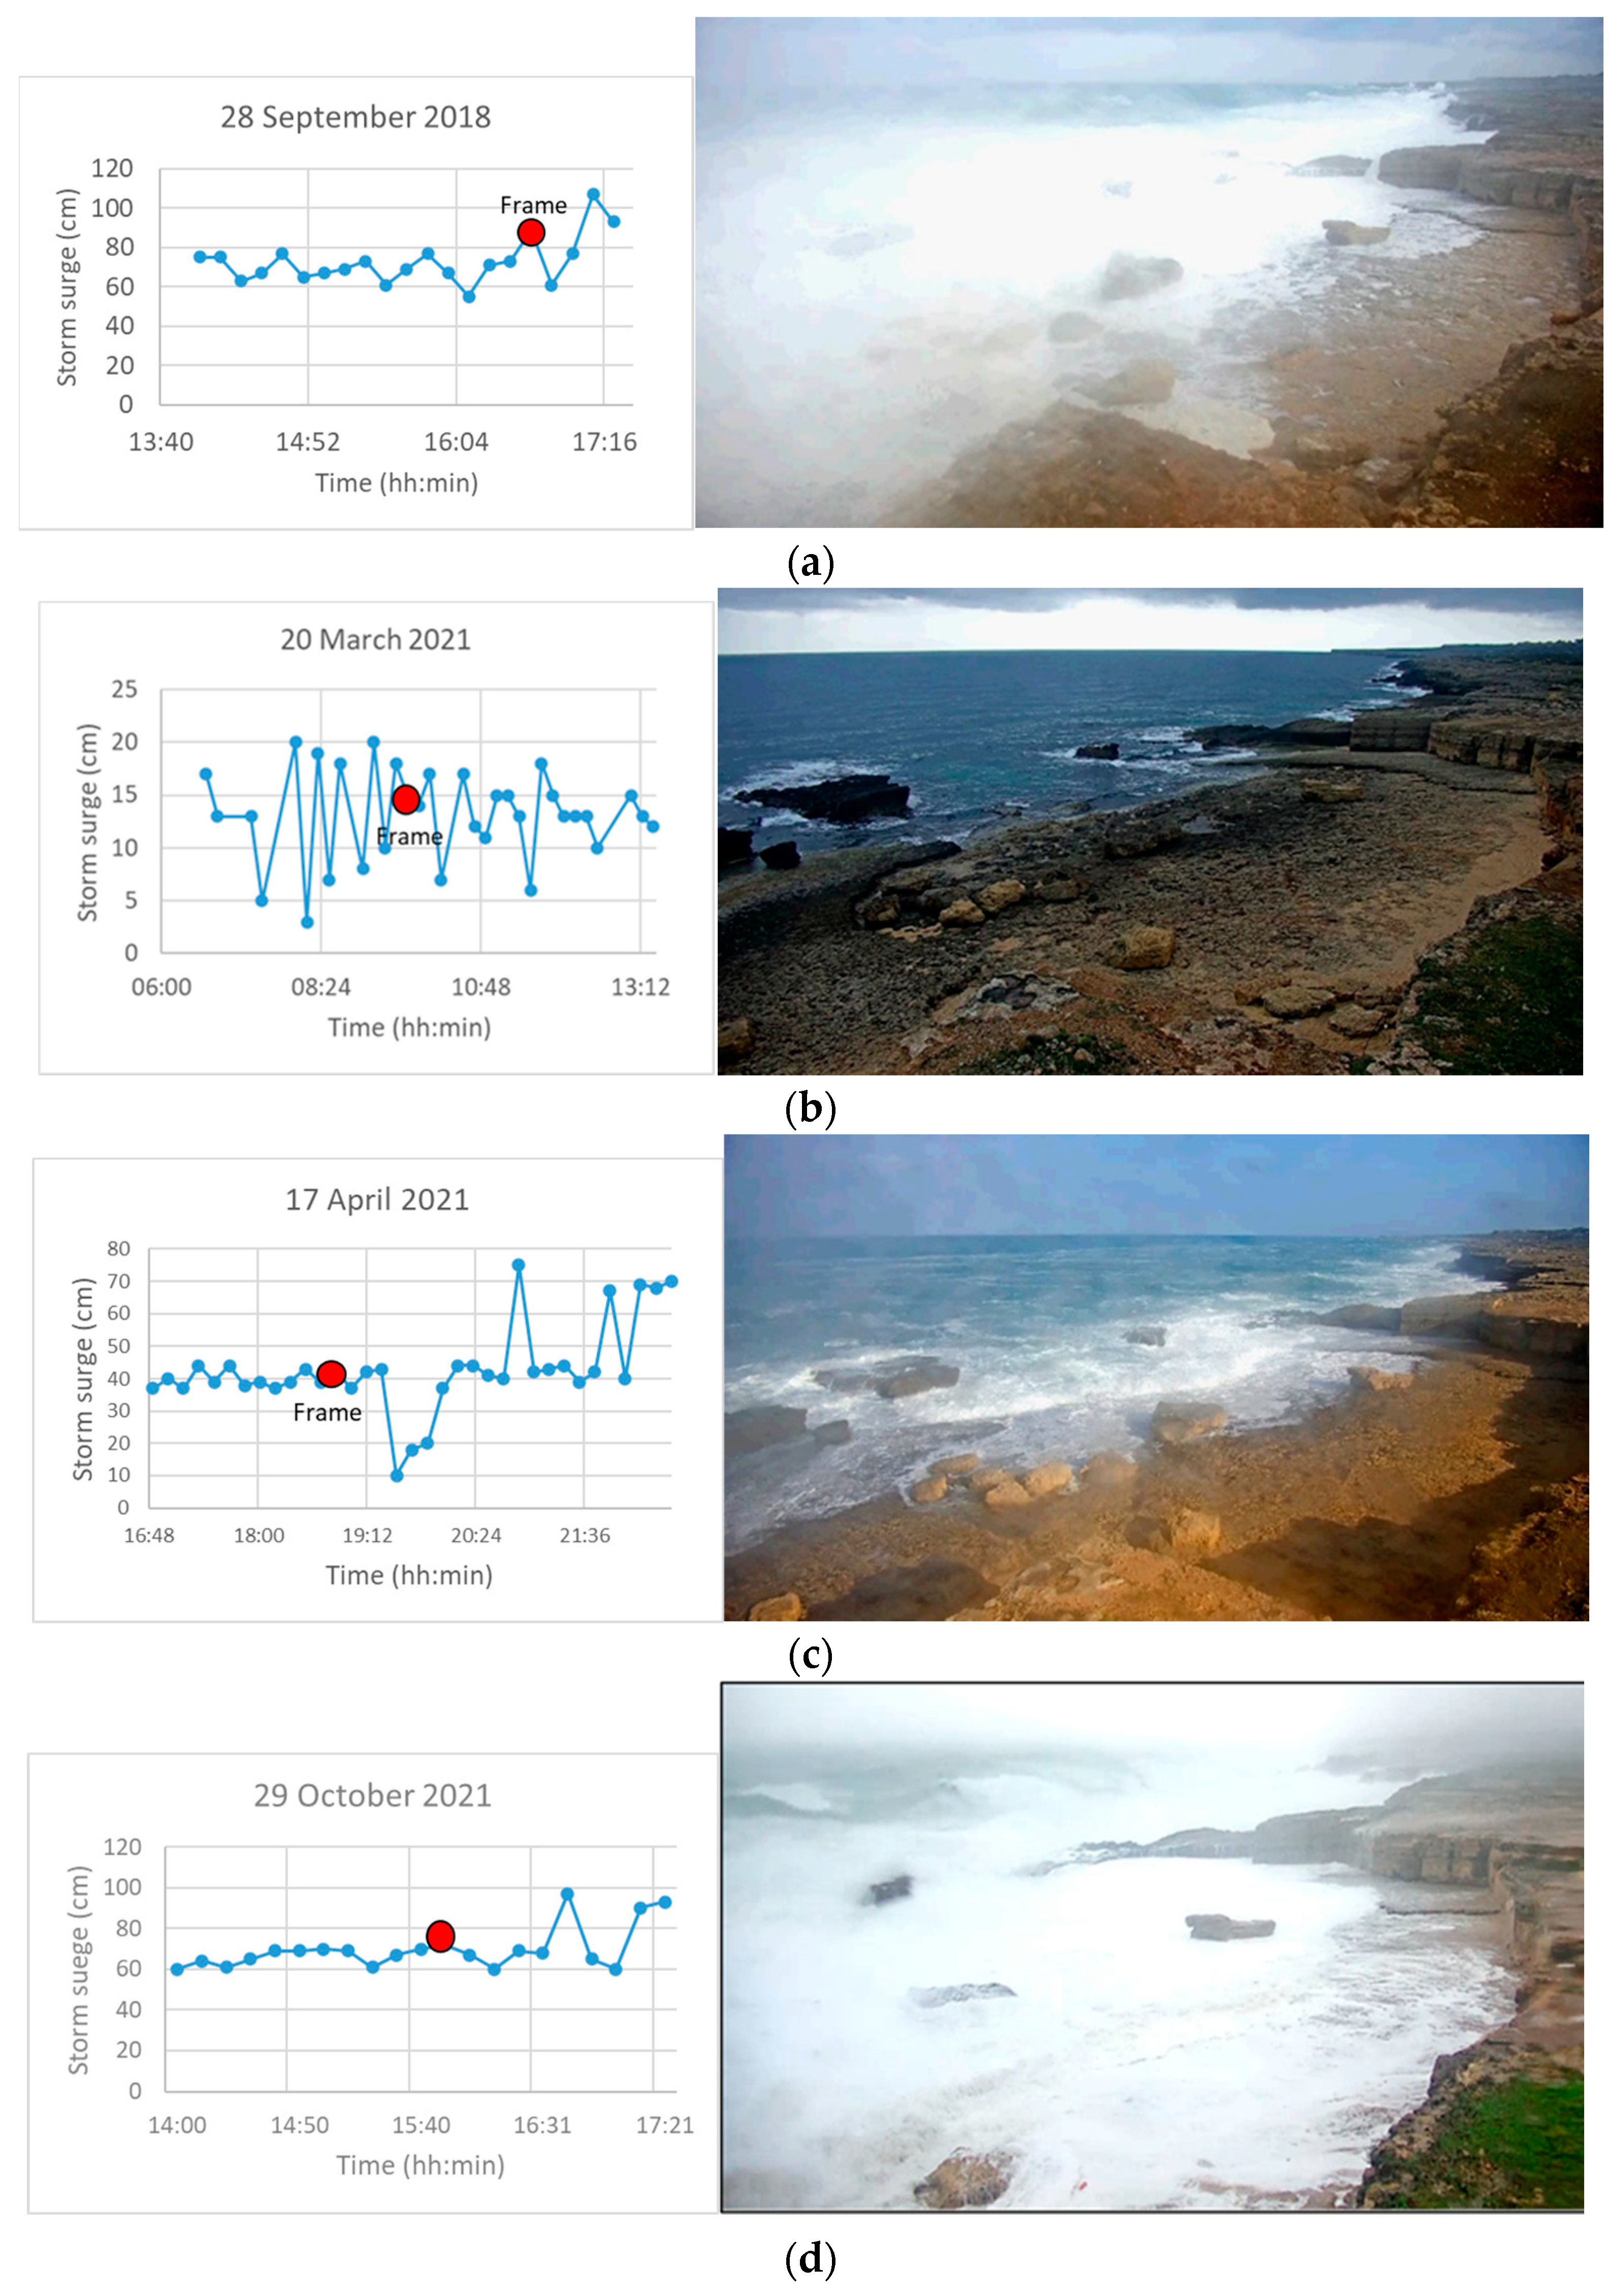
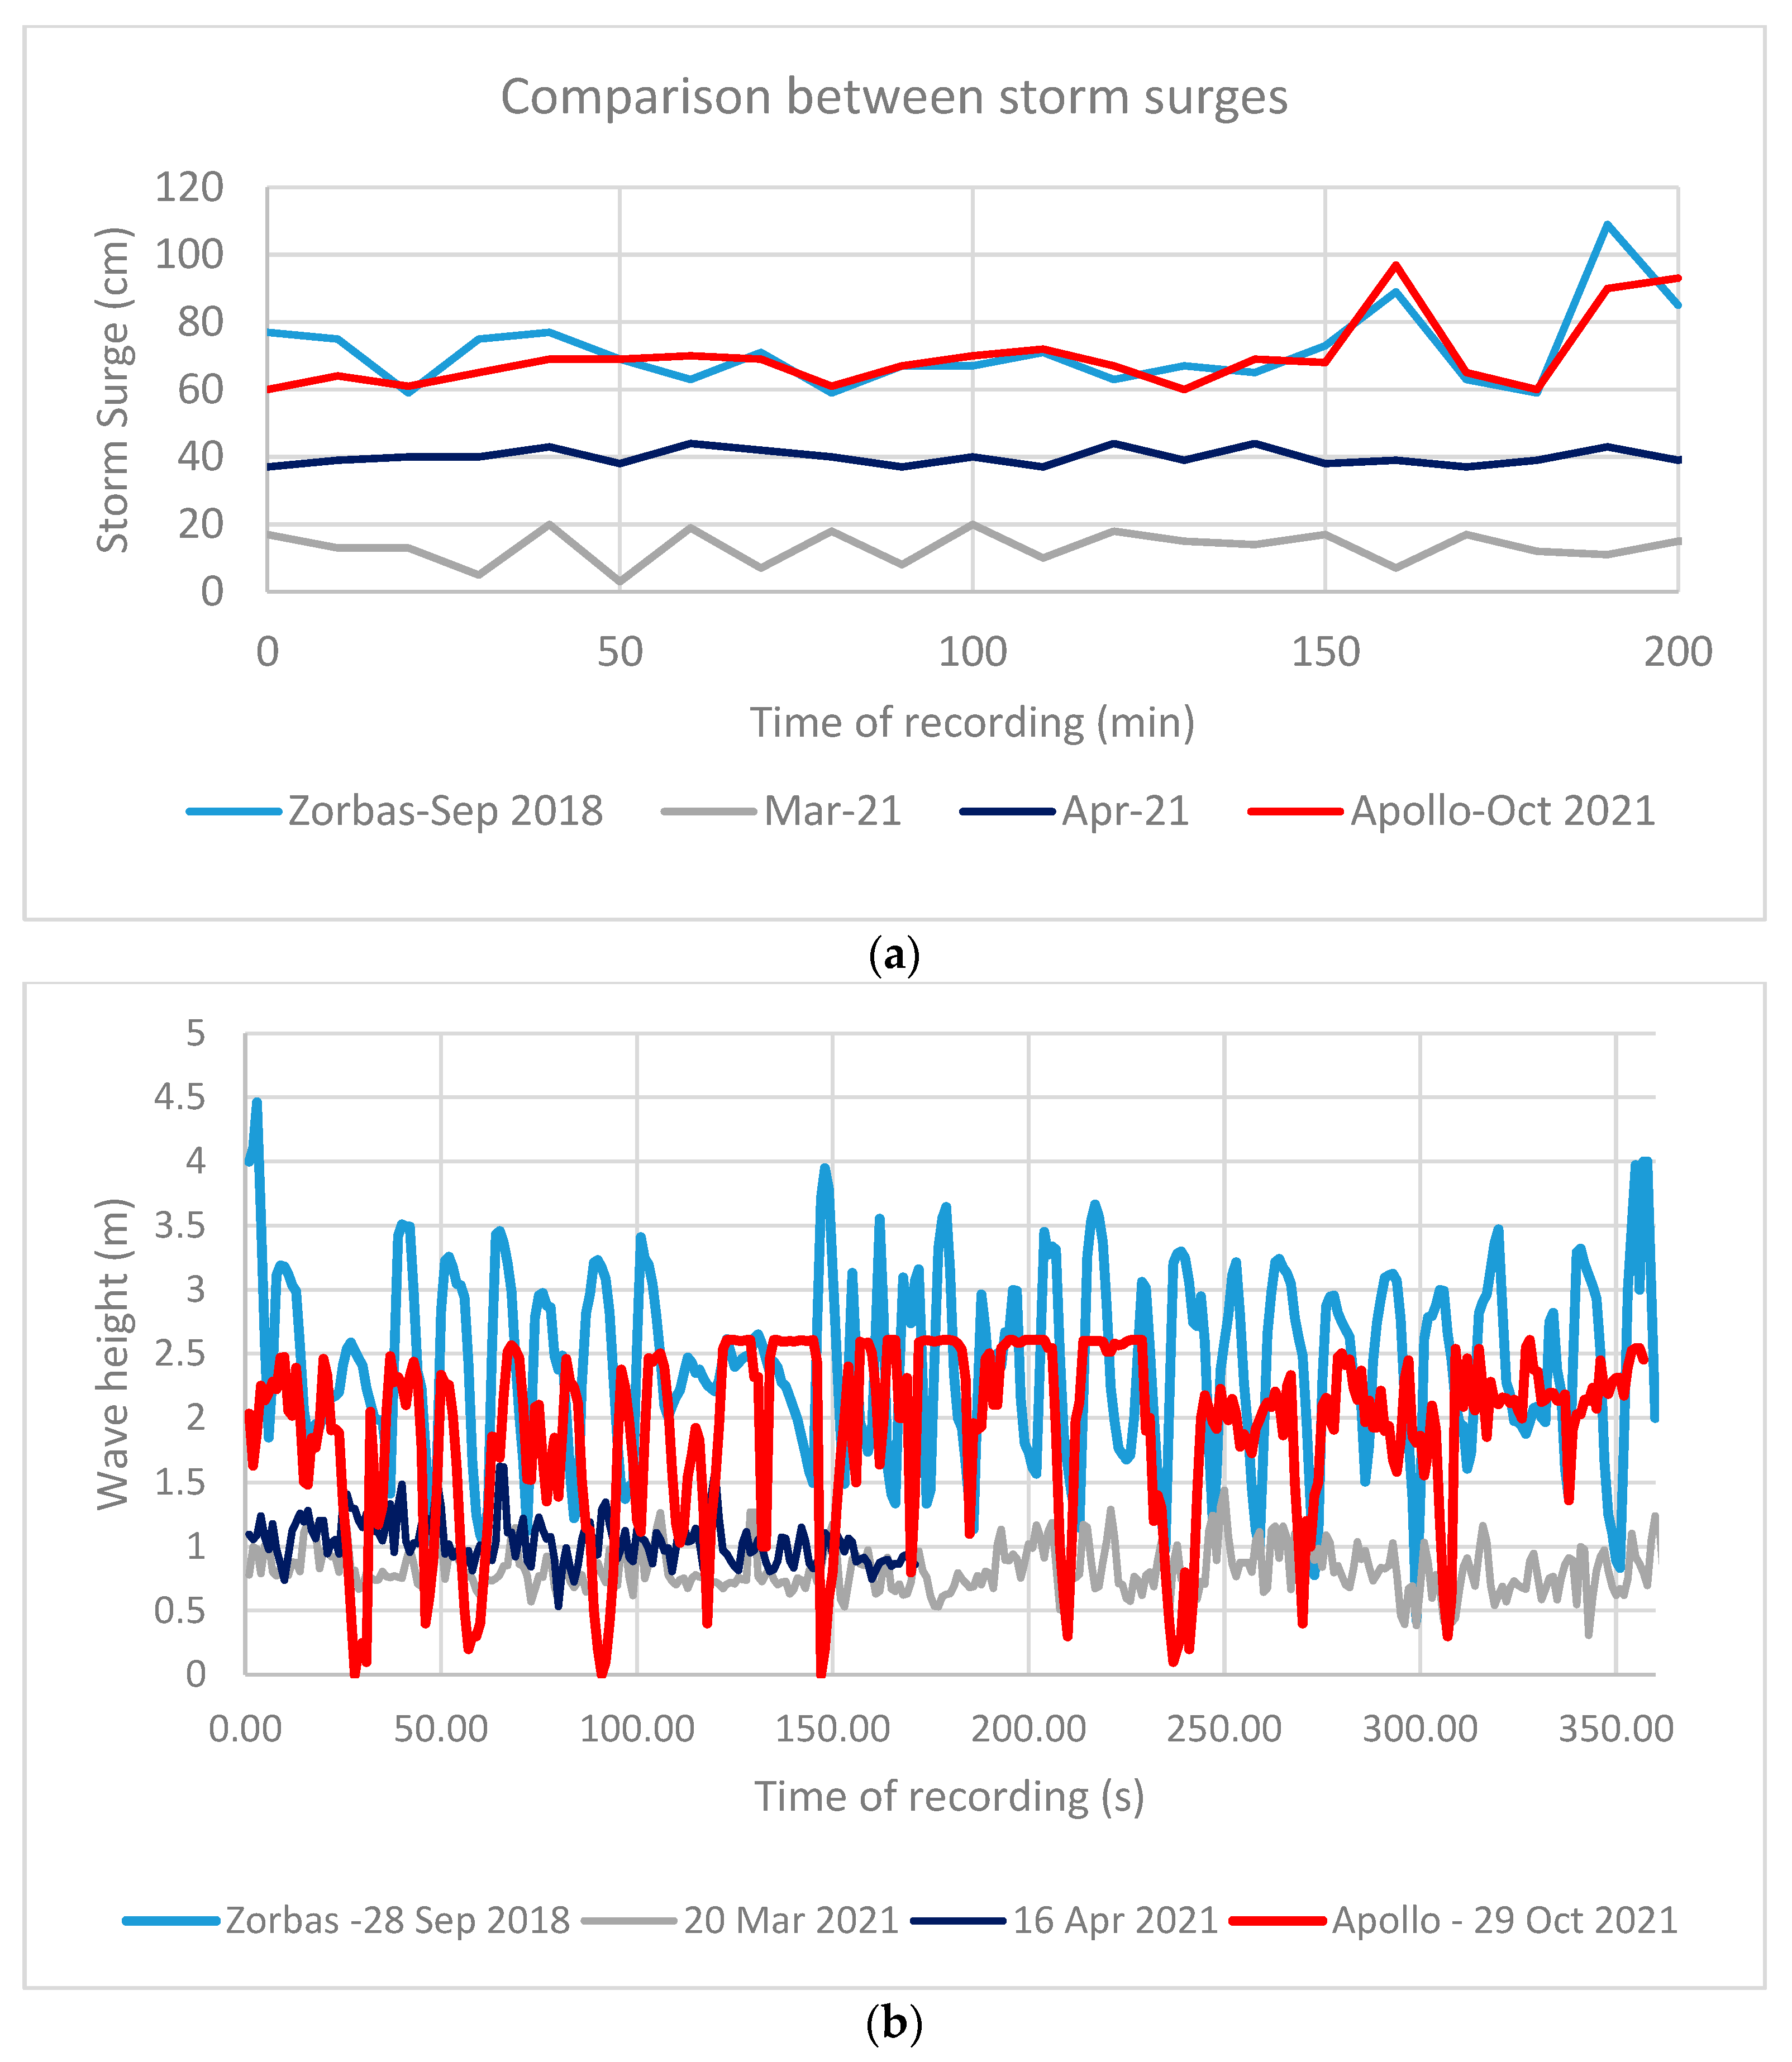
4.3. Wave Insights during Storm Events

CNN and Optical Flow were applied to assess the storm features recorded by the webcam located in the Greek quarry of Santa Lucia (Figure 1b). In particular, four extreme marine events were analyzed: medicane Zorbas of 2018, two storms in 2021, and medicane Apollo 2021. Medicane Zorbas was the strongest recorded and determined a significant surge of about 1.0 ± 0.2 m, measured by spatial reference of TLS data and GPS-RTK acquisitions by Scicchitano et al. [35] and Nandasena et al. [38]. Furthermore, during medicane Zorbas, the movements of several boulders were identified inside the Greek quarry of Santa Lucia [46]. The classification techniques provided the height of the storm surges (Figure 12), showing maximum storm surge values for Zorbas and Apollo, respectively, equal to 1.0 ± 0.2 m and 0.9± 0.2 m, and lower values for the two other analyzed storms (Figure 13a, Table 4). Furthermore, Optical Flow allowed us to assess wave height impacting during the storm events (Figure 13b). The wave heights impacting during medicane Zorbas showed an average value of 3.3 ± 0.4 m, compared to 1 m in wave height recorded during the storms of 2021.

5. Discussions

During the last few decades, the studies about the video monitoring of the coasts followed a supervised approach to obtain results from video records [4,46,87,88]. Considering the large amount of data contained in a video, procedures able to process data without a supervised approach are fundamental to improving the video monitoring of coastal environments. This approach was previously performed to classify the type of breaking wave [7,89,90], detect the physical units of the landscape [89], for the beach attendance prediction [91], and to monitor the marine and beach litter [21]. In this work, we developed a combined method of deep CNN with Optical Flow to assess, from video recorded with different systems, important hydrodynamic parameters such as tide phases, storm surge level, wave flow, and wave height impacting the Ionian coast of south-eastern Sicily and the Atlantic coast of Portugal. Video has been acquired using two different systems: fixed remote-controlled cameras and action HD cameras. Continuous 24 h video recorded by the surveillance camera system of the Marine Protected Area of Plemmirio, along the coasts of Maddalena Peninsula in south-eastern Sicily, were used to develop the Convolutional Neural Network (CNN), used to obtain tide phases and storm surge levels, and of the Optical Flow, applied to assess the wave flow, period and wavelength and to derive wave height. Nets composed by action HD cameras were tested along the Atlantic coast of Portugal to evaluate their efficiency in the assessment of the wave flow, period, and length through the use of the Optical Flow developed in south-eastern Sicily. Although the fixed surveillance camera allowed for assessing the low-frequency components of the sea-state [92], such as the tide phases and storm surge, action cameras represent a more versatile system for coastal monitoring and allow acquisitions from multiple views. The different views calibrated with spatial reference allow for assessing the value of surge and wave setup [1,3,93,94].
Several studies have attempted to assess the tide values based on historical tide records to predict tide phases using machine learning with regression functions [95,96]. However, these studies are based on neural networks which predict tide values using previously recorded data and astronomical factors [97,98]. In our study, we developed a CNN able to assess tide phases from video recorded along the coasts, using a specific classification of tide classes. The tide classes were chosen through the tidal signal recorded with a tide sensor and through the spatial reference measured by tide data. The tide classes were only obtained during diurnal hours when the tide phases are observable. The missing tide values during the night were assessed through a three-order polynomial interpolation of diurnal tide classes.
This intense classification let our CNN accurately assess the tide phases for a long-time record (about 1 month), using videos recorded continuously for 24 h by three different cameras located along the Maddalena Peninsula (south-eastern Sicily). The long-time record was compared with the tide signal of the Catania tide gauge (ISPRA), showing the difference in amplitude between neap tide and spring tide (Figure 14).
Although this method, requiring continuous video monitoring, was not applicable with the action HD cameras along the Atlantic coast of Portugal, it provided important results along the Ionian coasts of south-eastern Sicily. Considering that this area is characterized by a micro-tidal regime and by a coast extended for about 300 km with only three tide stations, located in Messina, Catania, and Porto Palo di Capo Passero, the use of light-weighted video records for tide assessment could allow for the possibility of increasing the monitoring points and thus increase spatial resolution. On the other hand, widespread video monitoring stations could improve the assessment of storm surge parameters, in which the tide gauges are unevenly distributed along the coasts and mainly located in the harbors, meaning that video monitoring could assess the storm surge directly impacting the coasts [4,99]. This is particularly important to predict the effect of coastal flooding and submersion in susceptible areas, such as wetlands [100], deltas [101], low-lying coasts [33], and highly populated coastal cities [33,102].
Similarly, these methods can also be applied on the mesotidal and macrotidal coasts of the Atlantic to monitor its higher tidal phase [92]. However, these methods need continuous video monitoring that did not apply to the action cameras. Thus, the application of CNN for tide assessment was made through surveillance cameras that continuously record the state of the sea.
Optical Flow techniques have been used to determine wave setting in the proximity of the coast. In particular, wave flow has been determined by detecting the pixel intensity of the wave front recorded in the videos [26,27]. The conversion of the pixel width into spatial scales, using topographic data detected with a Laser scanner, allowed for evaluating the wave flow vectors. Later, it also allowed applying the linear Airy wave theory to assess the wave height impact on the coast. A comparison between spatial reference and wave height obtained by the model showed a coefficient of determination equal to 0.97 (Figure 15). The Optical Flow module allowed us to assess continuously and automatically the wave heights for the entire duration of video records. The assessed wave heights showed the high frequency of wave oscillations (see Figures S2 and S3 in Supplementary Material) and the heights reached by breaking waves (see Figures S4 and S7 in Supplementary Material). The outputs of Optical Flow are integrated with linear Airy theory and breaking-wave relationship [6,76] that provide the time series plot of wave height impacting, useful to discriminate the storm wave parameters.
This combined approach between CNN and Optical Flow was particularly useful for detecting oceanographic parameters in the proximity of the shoreline. Moreover, it is useful to assess the wave’s physical parameters and its behavior during extreme marine events.
The coast of south-eastern Sicily and the Atlantic side of Portugal are greatly influenced by storm events, medicanes [46,103,104], and hurricanes [32,62,63]. Both areas are characterized by the development of Tropical Like Cyclone for the Tropical transition of an extratropical system. This characteristic makes the two areas highly vulnerable to hurricane impact, especially under the ongoing climate change scenarios. Regarding the end of the 21st century, several studies suggest a modification in the frequency and energy of the medicanes and hurricanes that will occur along the coast of south-eastern Sicily and the Atlantic coast of Portugal [31,32,105]. With this scenario in mind, our deep learning methods seem to be able to measure hydrodynamical parameters from video records. They could represent a very important tool for monitoring and studying these events, and potentially for developing early warning systems.
The impacts of medicane Zorbas during 27–29 September 2018 and storm events of 2021 were recorded by webcams of MPA of Plemmirio, and data obtained through CNN and Optical Flow techniques highlighted two main features of these events: the storm surge and wave features from the nearshore to the coastline. The CNN predictions for the storm surge of medicane Zorbas match the field data collected by Scicchitano et al. [35], where the storm surge showed a value of 1.1 ± 0.2 m. Furthermore, according to Scicchitano et al. [35], measured storm surge values of medicane presented comparable to those measured by the tide gauge. On the other hand, the Optical Flow showed accurate average wave height values during medicane Zorbas, greater than storm events. However, the Sicilian coasts experienced the impact of common seasonal storms with wave heights comparable to medicane Zorbas, and even higher than medicanes [36,82,104]. The coastal flooding during medicane was characterized by a greater inland inundation than common seasonal storms. This difference in inland inundation was attributed to high storm surge during medicane occurrence [103,104,106].

Further Developments

Although LEUCOTEA allowed to assess some parameters of the energetic balance on the coasts, further studies are needed to integrate the deep learning techniques with other architectures to assess the mass balance [16,91,107]. The assessment of mass balance requires the implementation of different machine learning models, which could involve classification and segmentation techniques for the quantitative evaluation of coastal landforms and sediment typologies [108,109]. For the energetic balance, a full framework of all components must be realized through a joint assessment of current, tide, wave, and wind parameters. This latter topic can be addressed through experimental studies with tanks integrating pressure sensors and sea-surface temperatures with machine learning models [75]. These approaches can be easily applied to the long-time video records, for example, in the surveillance system of south-eastern Sicily. On the other hand, the LEUCOTEA system will also be improved for the Atlantic coast to increase the tide class and storm surge values for mesotidal and macrotidal coasts. Currently, applying machine learning models for climate changes and sea-level rise is of great interest [20,92,110]. Several machine learning models have already been implemented to predict sea-level rise through regression functions [111,112] or track Hurricane forecasting [113,114]. Integrating the different machine learning models can improve the prediction of sea-level rise scenarios, allowing the application of new strategies for coastal management.

6. Conclusions

LEUCOTEA system has been developed to derive meteo-marine insights from video records using CNN with Optical Flow techniques on the Mediterranean and Atlantic coasts, which might be helpful for local stakeholders. The classification algorithm of the CNN allowed us to obtain:
  • the tide phases from video frames.
  • the storm surge values during the occurrence of an extreme marine event.
The application of Optical Flow module was applied to obtain the high-frequency component of the marine parameters, allowing us to calculate:
  • the wave flow vectors from pixel intensity values converted in m/s units through TLS data.
  • the wave height, wave period, and wavelength obtained for each position of wave flow vectors.
For coastal monitoring, the application of deep learning and object detection represents a low-cost tool to increase the amount of data that usually are not densely distributed along the coasts. On the other hand, video records highlight the high-energy events, such as storms or medicanes, as happened in south-eastern Sicily for medicane Zorbas (September 2018). The application of CNN and Optical Flow for these events allowed us to evaluate their hydrodynamic features, like storm surge and wave height impact, which are difficult to assess in the field during the occurrence of the events. Prediction models concerning the increase in the intensity of future extreme marine events need a large amount of data, and applying deep learning to coastal monitoring can be useful to increase the available dataset for coastal monitoring.

Supplementary Materials

The following supporting information can be downloaded at: https://www.mdpi.com/article/10.3390/rs14132994/s1, Figure S1: Assessment of wave height impacting on Santa Lucia (Italy); Figure S2: Assessment of wave height impacting on Varco 11 (Italy); Figure S3: Assessment of wave height impacting on Massolivieri (Italy); Figure S4: Assessment of wave height impacting on Coxos (Portugal); Figure S5: Assessment of wave height impacting on Nazaré (Portugal); Figure S6: Assessment of wave height impacting on Costa Nova (Portugal); Figure S7: Assessment of wave height impacting on Cova Gala (Portugal).

Author Contributions

Conceptualization, G.S. (Giovanni Scicchitano) and G.S. (Giovanni Scardino); methodology, G.S. (Giovanni Scicchitano) and G.S. (Giovanni Scardino); software, G.S. (Giovanni Scardino), M.C. and A.L.; validation, P.J.M.C., M.C. and A.L.; formal analysis, G.S. (Giovanni Scardino) and G.S. (Giovanni Scicchitano); investigation, G.S. (Giovanni Scicchitano), G.S. (Giovanni Scardino) and P.J.M.C.; resources, G.M. and G.S. (Giovanni Scicchitano); data curation, G.S. (Giovanni Scardino); writing—original draft preparation, G.S. (Giovanni Scardino); writing—review and editing, G.S. (Giovanni Scicchitano); visualization, M.C., G.M. and A.L.; supervision, G.S. (Giovanni Scicchitano); project administration, G.S. (Giovanni Scicchitano); funding acquisition, G.S. (Giovanni Scicchitano), G.M. and P.J.M.C. All authors have read and agreed to the published version of the manuscript.

Funding

This research received no external funding.

Institutional Review Board Statement

Not applicaple.

Informed Consent Statement

Not applicaple.

Data Availability Statements

The video presented in this study is openly available in Microsoft OneDrive at https://unibari-my.sharepoint.com/:f:/g/personal/giovanni_scardino_uniba_it/Eg5Gi9_O7KhBvz2rezTHDVEBhdrqREtaWhXlYoF2PdzlTw?e=wteRbF (accessed 21 June 2022).

Acknowledgments

This study has been developed within the activities of the Research Agreement stipulated between the University of Bari “Aldo Moro” and the Marine Protected Area of Plemmirio (SR, Italy) (Scientific Coordinator G. Scicchitano). Many thanks are due to the personnel of the Marine Protected Area of Plemmirio (Gianfranco Mazza and Sabrina Zappalà) for their technical and logistic contributions. We are grateful to CETMA Centro di Ricerca Europeo di Tecnologie Design e Materiali (Dott. Italo Spada) and to ENSU srl, Spinoff of the University of Bari (Dott. Arcangelo Piscitelli) for their support in the development of Machine Learning model. This work was partially funded by the I-STORMS Project from the Department of Earth and Geo-environmental Sciences—the University of Bari and Regione Puglia Civil Protection (scientific coordinator G. Mastronuzzi).

Conflicts of Interest

The authors declare no conflict of interest.

References

  1. Taborda, R.; Silva, A. COSMOS: A Lightweight Coastal Video Monitoring System. Comput. Geosci. 2012, 49, 248–255. [Google Scholar] [CrossRef]
  2. Callens, A.; Morichon, D.; Liria, P.; Epelde, I.; Liquet, B. Automatic Creation of Storm Impact Database Based on Video Monitoring and Convolutional Neural Networks. Remote Sens. 2021, 13, 1933. [Google Scholar] [CrossRef]
  3. Andriolo, U.; Sánchez-García, E.; Taborda, R. Operational Use of Surfcam Online Streaming Images for Coastal Morphodynamic Studies. Remote Sens. 2019, 11, 78. [Google Scholar] [CrossRef] [Green Version]
  4. Ibaceta, R.; Almar, R.; Catalán, P.A.; Blenkinsopp, C.E.; Almeida, L.P.; Cienfuegos, R. Assessing the Performance of a Low-Cost Method for Video-Monitoring the Water Surface and Bed Level in the Swash Zone of Natural Beaches. Remote Sens. 2018, 10, 49. [Google Scholar] [CrossRef] [Green Version]
  5. Goda, Y. Reanalysis of Regular and Random Breaking Wave Statistics. Coast. Eng. J. 2010, 52, 71–106. [Google Scholar] [CrossRef]
  6. Rattanapitikon, W.; Shibayama, T. Breaking Wave Formulas for Breaking Depth and Orbital to Phase Velocity Ratio. Coast. Eng. J. 2006, 48, 395–416. [Google Scholar] [CrossRef]
  7. Eadi Stringari, C.; Harris, D.L.; Power, H. A Novel Machine Learning Algorithm for Tracking Remotely Sensed Waves in the Surf Zone. Coast. Eng. 2019, 147, 149–158. [Google Scholar] [CrossRef]
  8. Aarninkhof, S.G.J.; Ruessink, B.G. Video Observations and Model Predictions of Depth-Induced Wave Dissipation. IEEE Trans. Geosci. Remote Sens. 2004, 42, 2612–2622. [Google Scholar] [CrossRef]
  9. Pereira, P.; Calliari, L.J.; Holman, R.; Holland, K.; Guedes, R.; Amorin, C.K.; Cavalcanti, P.G. Video and Field Observations of Wave Attenuation in a Muddy Surf Zone. Mar. Geol. 2011, 279, 210–221. [Google Scholar] [CrossRef]
  10. Chickadel, C.; Holman, R.; Freilich, M. An Optical Technique for the Measurement of Longshore Currents. J. Geophys. Res. 2003, 108, 3364. [Google Scholar] [CrossRef] [Green Version]
  11. Wu, F.; Duan, J.; Chen, S.; Ye, Y.; Ai, P.; Yang, Z. Multi-Target Recognition of Bananas and Automatic Positioning for the Inflorescence Axis Cutting Point. Front. Plant Sci. 2021, 12, 705021. [Google Scholar] [CrossRef] [PubMed]
  12. Chen, Z.; Wu, R.; Lin, Y.; Li, C.; Chen, S.; Yuan, Z.; Chen, S.; Zou, X. Plant Disease Recognition Model Based on Improved YOLOv5. Agronomy 2022, 12, 365. [Google Scholar] [CrossRef]
  13. Tang, Y.; Zhu, M.; Chen, Z.; Wu, C.; Chen, B.; Li, C.; Li, L. Seismic Performance Evaluation of Recycled Aggregate Concrete-Filled Steel Tubular Columns with Field Strain Detected via a Novel Mark-Free Vision Method. Structures 2022, 37, 426–441. [Google Scholar] [CrossRef]
  14. Beuzen, T.; Splinter, K. Machine Learning and Coastal Processes. In Sandy Beach Morphodynamics; Elsevier: Amsterdam, The Netherlands, 2020; pp. 689–710. ISBN 978-0-08-102927-5. [Google Scholar]
  15. Calkoen, F.; Luijendijk, A.; Rivero, C.R.; Kras, E.; Baart, F. Traditional vs. Machine-Learning Methods for Forecasting Sandy Shoreline Evolution Using Historic Satellite-Derived Shorelines. Remote Sens. 2021, 13, 934. [Google Scholar] [CrossRef]
  16. Reichstein, M.; Camps-Valls, G.; Stevens, B.; Jung, M.; Denzler, J.; Carvalhais, N. Prabhat Deep Learning and Process Understanding for Data-Driven Earth System Science. Nature 2019, 566, 195–204. [Google Scholar] [CrossRef]
  17. Rusk, N. Deep Learning. Nat. Methods 2016, 13, 35. [Google Scholar] [CrossRef]
  18. Tran, H.-D.; Yang, X.; Manzanas Lopez, D.; Musau, P.; Nguyen, L.V.; Xiang, W.; Bak, S.; Johnson, T.T. NNV: The Neural Network Verification Tool for Deep Neural Networks and Learning-Enabled Cyber-Physical Systems. In Proceedings of the Computer Aided Verification, Los Angeles, CA, USA, 21–24 July 2020; Lahiri, S.K., Wang, C., Eds.; Springer International Publishing: Cham, Switzerland, 2020; pp. 3–17. [Google Scholar]
  19. Le Cun, Y.; Jackel, L.D.; Boser, B.; Denker, J.S.; Graf, H.P.; Guyon, I.; Henderson, D.; Howard, R.E.; Hubbard, W. Handwritten Digit Recognition: Applications of Neural Net Chips and Automatic Learning. In Proceedings of the Neurocomputing; Soulié, F.F., Hérault, J., Eds.; Springer: Berlin/Heidelberg, Germany, 1989; pp. 303–318. [Google Scholar]
  20. Hieronymus, M.; Hieronymus, J.; Hieronymus, F. On the Application of Machine Learning Techniques to Regression Problems in Sea Level Studies. J. Atmos. Ocean. Technol. 2019, 36, 1889–1902. [Google Scholar] [CrossRef]
  21. Garcia-Garin, O.; Monleón-Getino, T.; López-Brosa, P.; Borrell, A.; Aguilar, A.; Borja-Robalino, R.; Cardona, L.; Vighi, M. Automatic Detection and Quantification of Floating Marine Macro-Litter in Aerial Images: Introducing a Novel Deep Learning Approach Connected to a Web Application in R. Environ. Pollut. 2021, 273, 116490. [Google Scholar] [CrossRef]
  22. Miniello, G.; La Salandra, M. A New Method for Geomorphological Studies and Land Cover Classification Using Machine Learning Techniques. In Proceedings of the International Symposium on Grids & Clouds 2021, Taipei, China, 22–26 March 2021; Volume 378. [Google Scholar]
  23. Qin, L.; Yu, N.; Zhao, D. Applying the Convolutional Neural Network Deep Learning Technology to Behavioural Recognition in Intelligent Video. Tehnicki Vjesnik 2018, 25, 528–535. [Google Scholar] [CrossRef] [Green Version]
  24. Sreenu, G.; Saleem Durai, M.A. Intelligent Video Surveillance: A Review through Deep Learning Techniques for Crowd Analysis. J. Big Data 2019, 6, 48. [Google Scholar] [CrossRef]
  25. Anderson, D.; Bak, A.S.; Brodie, K.L.; Cohn, N.; Holman, R.A.; Stanley, J. Quantifying Optically Derived Two-Dimensional Wave-Averaged Currents in the Surf Zone. Remote Sens. 2021, 13, 690. [Google Scholar] [CrossRef]
  26. Wu, H.; Zhao, R.; Gan, X.; Ma, X. Measuring Surface Velocity of Water Flow by Dense Optical Flow Method. Water 2019, 11, 2320. [Google Scholar] [CrossRef] [Green Version]
  27. Ghalenoei, E.; Sharifi, M.A.; Hasanlou, M. Investigation of Optical Flow Techniques for Extracting Non-Rigid Sea Surface Currents. Int. Arch. Photogramm. Remote Sens. Spatial Inf. Sci. 2014, XL-2/W3, 121–126. [Google Scholar] [CrossRef] [Green Version]
  28. Philip, S.; Pang, A. Detecting and Visualizing Rip Current Using Optical Flow; The Eurographics Association: Reims, France, 2016; ISBN 978-3-03868-014-7. [Google Scholar]
  29. Reale, O.; Atlas, R. Tropical Cyclone–Like Vortices in the Extratropics: Observational Evidence and Synoptic Analysis. Weather Forecast. 2001, 16, 7–34. [Google Scholar] [CrossRef]
  30. Ritchie, E.A.; Elsberry, R.L. Simulations of the Extratropical Transition of Tropical Cyclones: Phasing between the Upper-Level Trough and Tropical Cyclones. Mon. Weather Rev. 2007, 135, 862–876. [Google Scholar] [CrossRef] [Green Version]
  31. Bengtsson, L.; Hodges, K.I.; Keenlyside, N. Will Extratropical Storms Intensify in a Warmer Climate? J. Clim. 2009, 22, 2276–2301. [Google Scholar] [CrossRef] [Green Version]
  32. Michaelis, A.C.; Willison, J.; Lackmann, G.M.; Robinson, W.A. Changes in Winter North Atlantic Extratropical Cyclones in High-Resolution Regional Pseudo–Global Warming Simulations. J. Clim. 2017, 30, 6905–6925. [Google Scholar] [CrossRef]
  33. Anzidei, M.; Scicchitano, G.; Scardino, G.; Bignami, C.; Tolomei, C.; Vecchio, A.; Serpelloni, E.; De Santis, V.; Monaco, C.; Milella, M.; et al. Relative Sea-Level Rise Scenario for 2100 along the Coast of South Eastern Sicily (Italy) by InSAR Data, Satellite Images and High-Resolution Topography. Remote Sens. 2021, 13, 1108. [Google Scholar] [CrossRef]
  34. Anzidei, M.; Scicchitano, G.; Tarascio, S.; de Guidi, G.; Monaco, C.; Barreca, G.; Mazza, G.; Serpelloni, E.; Vecchio, A. Coastal Retreat and Marine Flooding Scenario for 2100: A Case Study along the Coast of Maddalena Peninsula (Southeastern Sicily). Geogr. Fis. E Din. Quat. 2018, 41, 5–16. [Google Scholar] [CrossRef]
  35. Scicchitano, G.; Scardino, G.; Monaco, C.; Piscitelli, A.; Milella, M.; De Giosa, F.; Mastronuzzi, G. Comparing Impact Effects of Common Storms and Medicanes along the Coast of South-Eastern Sicily. Mar. Geol. 2021, 439, 106556. [Google Scholar] [CrossRef]
  36. Scicchitano, G.; Pignatelli, C.; Spampinato, C.R.; Piscitelli, A.; Milella, M.; Monaco, C.; Mastronuzzi, G. Terrestrial Laser Scanner Techniques in the Assessment of Tsunami Impact on the Maddalena Peninsula (South-Eastern Sicily, Italy). Earth Planets Space 2012, 64, 889–903. [Google Scholar] [CrossRef] [Green Version]
  37. Scicchitano, G.; Monaco, C.; Tortorici, L. Large Boulder Deposits by Tsunami Waves along the Ionian Coast of South-Eastern Sicily (Italy). Mar. Geol. 2007, 238, 75–91. [Google Scholar] [CrossRef]
  38. Nandasena, N.A.K.; Scicchitano, G.; Scardino, G.; Milella, M.; Piscitelli, A.; Mastronuzzi, G. Boulder Displacements along Rocky Coasts: A New Deterministic and Theoretical Approach to Improve Incipient Motion Formulas. Geomorphology 2022, 407, 108217. [Google Scholar] [CrossRef]
  39. Scicchitano, G.; Costa, B.; Di Stefano, A.; Longhitano, S.G.; Monaco, C. Tsunami and Storm Deposits Preserved within a Ria-Type Rocky Coastal Setting (Siracusa, SE Sicily). Zeitschrift Geomorphol. Suppl. Issues 2010, 54, 51–77. [Google Scholar] [CrossRef] [Green Version]
  40. Scardino, G.; Piscitelli, A.; Milella, M.; Sansò, P.; Mastronuzzi, G. Tsunami Fingerprints along the Mediterranean Coasts. Rend. Fis. Acc. Lincei 2020, 31, 319–335. [Google Scholar] [CrossRef]
  41. Scardino, G.; Rizzo, A.; De Santis, V.; Kyriakoudi, D.; Rovere, A.; Vacchi, M.; Torrisi, S.; Scicchitano, G. Insights on the Origin of Multiple Tsunami Events Affected the Archaeological Site of Ognina (South-Eastern Sicily, Italy). Quat. Int. 2021, 40, 121. [Google Scholar] [CrossRef]
  42. De Martini, P.M.; Barbano, M.S.; Pantosti, D.; Smedile, A.; Pirrotta, C.; Del Carlo, P.; Pinzi, S. Geological Evidence for Paleotsunamis along Eastern Sicily (Italy): An Overview. Nat. Hazards Earth Syst. Sci. 2012, 12, 2569–2580. [Google Scholar] [CrossRef]
  43. De Martini, P.M.; Barbano, M.S.; Smedile, A.; Gerardi, F.; Pantosti, D.; Del Carlo, P.; Pirrotta, C. A Unique 4000year Long Geological Record of Multiple Tsunami Inundations in the Augusta Bay (Eastern Sicily, Italy). Mar. Geol. 2010, 276, 42–57. [Google Scholar] [CrossRef] [Green Version]
  44. Biolchi, S.; Furlani, S.; Antonioli, F.; Baldassini, N.; Causon Deguara, J.; Devoto, S.; Di Stefano, A.; Evans, J.; Gambin, T.; Gauci, R.; et al. Boulder Accumulations Related to Extreme Wave Events on the Eastern Coast of Malta. Nat. Hazards Earth Syst. Sci. 2016, 16, 737–756. [Google Scholar] [CrossRef] [Green Version]
  45. Biolchi, S.; Furlani, S.; Devoto, S.; Scicchitano, G.; Korbar, T.; Vilibic, I.; Sepic, J. The Origin and Dynamics of Coastal Boulders in a Semi-Enclosed Shallow Basin: A Northern Adriatic Case Study. Mar. Geol. 2019, 411, 62–77. [Google Scholar] [CrossRef]
  46. Scicchitano, G.; Scardino, G.; Tarascio, S.; Monaco, C.; Barracane, G.; Locuratolo, G.; Milella, M.; Piscitelli, A.; Mazza, G.; Mastronuzzi, G. The First Video Witness of Coastal Boulder Displacements Recorded during the Impact of Medicane “Zorbas” on Southeastern Sicily. Water 2020, 12, 1497. [Google Scholar] [CrossRef]
  47. Bentley, A.M.; Keyser, D.; Bosart, L.F. A Dynamically Based Climatology of Subtropical Cyclones That Undergo Tropical Transition in the North Atlantic Basin. Mon. Weather Rev. 2016, 144, 2049–2068. [Google Scholar] [CrossRef]
  48. Flaounas, E.; Davolio, S.; Raveh-Rubin, S.; Pantillon, F.; Miglietta, M.M.; Gaertner, M.A.; Hatzaki, M.; Homar, V.; Khodayar, S.; Korres, G.; et al. Mediterranean Cyclones: Current Knowledge and Open Questions on Dynamics, Prediction, Climatology and Impacts. Weather Clim. Dyn. 2022, 3, 173–208. [Google Scholar] [CrossRef]
  49. Romera, R.; Gaertner, M.Á.; Sánchez, E.; Domínguez, M.; González-Alemán, J.J.; Miglietta, M.M. Climate Change Projections of Medicanes with a Large Multi-Model Ensemble of Regional Climate Models. Glob. Planet. Chang. 2017, 151, 134–143. [Google Scholar] [CrossRef]
  50. Dias, J.M.; Pereira, F.; Picado, A.; Lopes, C.L.; Pinheiro, J.P.; Lopes, S.M.; Pinho, P.G. A Comprehensive Estuarine Hydrodynamics-Salinity Study: Impact of Morphologic Changes on Ria de Aveiro (Atlantic Coast of Portugal). J. Mar. Sci. Eng. 2021, 9, 234. [Google Scholar] [CrossRef]
  51. Carvalho, P.; Bettencourt, J.; Pinto Coelho, I. The Maritime Cultural Landscape of the Ria de Aveiro Lagoon (Portugal) in the Early Modern Period: A First Approach; Ministerio de Educacion Cultura Y Deporte: Madrid, Spain, 2018.
  52. Pinto, C.A.; Taborda, R.; Andrade, C.; Baptista, P.; Silva, P.A.; Mendes, D.; Pais-Barbosa, J. Morphological Development and Behaviour of a Shoreface Nourishment in the Portuguese Western Coast. J. Mar. Sci. Eng. 2022, 10, 146. [Google Scholar] [CrossRef]
  53. Ponte Lira, C.; Nobre Silva, A.; Taborda, R.; Freire de Andrade, C. Coastline Evolution of Portuguese Low-Lying Sandy Coast in the Last 50 Years: An Integrated Approach. Earth Syst. Sci. Data 2016, 8, 265–278. [Google Scholar] [CrossRef] [Green Version]
  54. Cunha, P.; Almeida, A.; Ramos, A.; Cunha, L.; Dinis, J. Geomorphology and Coastal Dynamics of the Figueira Da Foz Region. Publicações Da APGEOM 2006, IV, 35–46. [Google Scholar]
  55. Silva, A.M.A.N.; Taborda, R.P.M. Integration of Beach Hydrodynamic and Morphodynamic Modelling in a GIS Environment. J. Coast. Conserv. 2013, 17, 201–210. [Google Scholar] [CrossRef]
  56. Costa, P.J.M.; Andrade, C. Field Trip Guide. In Proceedings of the 5th International Tsunami Field Symposium—Field Guide, Lisbon, Portugal, 3–7 September 2017; p. 97. [Google Scholar]
  57. Carvalho, J.R.; Barcelo, J. Agitacao Marıtima Na Costa Oeste de Portugal Metropolitano-Contribuicao Para o Seu Estudo. Memorias do Laboratorio Nacional de Engenharia Civil Lisbon 1966, 290, 1–34. (In Portuguese) [Google Scholar]
  58. Costa, M.; Silva, R.; Vitorino, J. Contribuição Para o Estudo Do Clima de Agitação Marítima Na Costa Portuguesa (in Portuguese). In Proceedings of the 2ªs Jornadas Portuguesas de Engenharia Costeira e Portuária, AIPCN/PIANC Secção, Lisboa, Portugal, 17–19 October 2001; pp. 1–20. [Google Scholar]
  59. Baptista, M.A.; Miranda, J.M. Revision of the Portuguese Catalog of Tsunamis. Nat. Hazards Earth Syst. Sci. 2009, 9, 25–42. [Google Scholar] [CrossRef] [Green Version]
  60. Andrade, C.; Freitas, M.; Oliveira, M.A.; Costa, P. On the Sedimentological and Historical Evidences of Seismic-Triggered Tsunamis on the Algarve Coast of Portugal. In Plate Boundaries and Natural Hazards; John Wiley & Sons, Inc.: Hoboken, NJ, USA, 2016; pp. 219–238. ISBN 978-1-119-05397-2. [Google Scholar]
  61. Haarsma, R.J.; Hazeleger, W.; Severijns, C.; de Vries, H.; Sterl, A.; Bintanja, R.; van Oldenborgh, G.J.; van den Brink, H.W. More Hurricanes to Hit Western Europe Due to Global Warming. Geophys. Res. Lett. 2013, 40, 1783–1788. [Google Scholar] [CrossRef]
  62. Feist, L.; Frank, S.; Bellanova, P.; Laermanns, H.; Cämmerer, C.; Mathes-Schmidt, M.; Biermanns, P.; Brill, D.; Costa, P.J.M.; Teichner, F.; et al. The Sedimentological and Environmental Footprint of Extreme Wave Events in Boca Do Rio, Algarve Coast, Portugal. Sediment. Geol. 2019, 389, 147–160. [Google Scholar] [CrossRef]
  63. Stojanovic, M.; Gonçalves, A.; Sorí, R.; Vázquez, M.; Ramos, A.M.; Nieto, R.; Gimeno, L.; Liberato, M.L.R. Consecutive Extratropical Cyclones Daniel, Elsa and Fabien, and Their Impact on the Hydrological Cycle of Mainland Portugal. Water 2021, 13, 1476. [Google Scholar] [CrossRef]
  64. IPCC Special Report on the Ocean and Cryosphere in a Changing Climate; Pörtner, H.-O.; Roberts, D.C.; Masson-Delmotte, V.; Zhai, P.; Tignor, M.; Poloczanska, E.; Mintenbeck, K.; Alegría, A.; Nicolai, M.; Okem, A.; et al. (Eds.) Working Group II Technical Support Unit; Cambridge University Press: Cambridge, UK; New York, NY, USA, 2019; p. 765. [Google Scholar]
  65. IPCC Summary for Policymakers. In Climate Change 2021: The Physical Science Basis. Contribution of Working Group I to the Sixth Assessment Report of the Intergovernmental Panel on Climate Change; Masson-Delmotte, V.; Zhai, P.; Pirani, A.; Connors, S.L.; Péan, C.; Berger, S.; Caud, N.; Chen, Y.; Goldfarb, L.; Gomis, M.I.; et al. (Eds.) Cambridge University Press: Cambridge, UK; New York, NY, USA, 2021; p. 3949. [Google Scholar]
  66. Yu, Z.; Dong, Y.; Cheng, J.; Sun, M.; Su, F. Research on Face Recognition Classification Based on Improved GoogleNet. Secur. Commun. Netw. 2022, 2022, e7192306. [Google Scholar] [CrossRef]
  67. Agarap, A.F. Deep Learning Using Rectified Linear Units (ReLU). arXiv 2019, arXiv:1803.08375. [Google Scholar]
  68. Gholamalinezhad, H.; Khosravi, H. Pooling Methods in Deep Neural Networks, a Review. arXiv 2020, arXiv:2009.07485. [Google Scholar]
  69. Szegedy, C.; Liu, W.; Jia, Y.; Sermanet, P.; Reed, S.; Anguelov, D.; Erhan, D.; Vanhoucke, V.; Rabinovich, A. Going Deeper with Convolutions. arXiv 2019, arXiv:1409.4842. [Google Scholar]
  70. Farnebäck, G. Very High Accuracy Velocity Estimation Using Orientation Tensors Parametric Motion and Simultaneous Segmentation of the Motion Field. In Proceedings of the ICCV, Vancouver, BC, Canada, 7–14 July 2001; pp. 171–177. [Google Scholar]
  71. Farnebäck, G. Two-Frame Motion Estimation Based on Polynomial Expansion. In Proceedings of the Image Analysis, Halmstad, Sweden, 29 June–2 July 2003; Bigun, J., Gustavsson, T., Eds.; Springer: Berlin/Heidelberg, Germany, 2003; pp. 363–370. [Google Scholar]
  72. Whitham, G.B. Linear and Nonlinear Waves; Wiley: New York, NY, USA, 1974. [Google Scholar]
  73. Carter, R.W.G. Coastal Evolution: Late Quaternary Shoreline Morphodynamics; Reprint edizione; Cambridge University Press: Cambridge, UK, 1997; ISBN 978-0-521-59890-3. [Google Scholar]
  74. Salameh, E.; Frappart, F.; Almar, R.; Baptista, P.; Heygster, G.; Lubac, B.; Raucoules, D.; Almeida, L.P.; Bergsma, E.W.J.; Capo, S.; et al. Monitoring Beach Topography and Nearshore Bathymetry Using Spaceborne Remote Sensing: A Review. Remote Sens. 2019, 11, 2212. [Google Scholar] [CrossRef] [Green Version]
  75. Yun, M.; Kim, J.; Do, K. Estimation of Wave-Breaking Index by Learning Nonlinear Relation Using Multilayer Neural Network. J. Mar. Sci. Eng. 2022, 10, 50. [Google Scholar] [CrossRef]
  76. Rattanapitikon, W.; Shibayama, T. Verification and Modification of Breaker Height Formulas. Coast. Eng. J. 2000, 42, 389–406. [Google Scholar] [CrossRef]
  77. Fernández-Fernández, S.; Ferreira, C.; Silva, P.; Baptista, P.; Romão, S.; Bouzas, Á.; Abreu, T.; Bertin, X. Assessment of Dredging Scenarios for a Tidal Inlet in a High-Energy Coast. J. Mar. Sci. Eng. 2019, 7, 395. [Google Scholar] [CrossRef] [Green Version]
  78. Cunha, P.; Porto Gouveia, M.M. The Nazaré Coast, the Submarine Canyon and the Giant Waves—A Synthesis; Universidade de Coimbra: Coimbra, Portuga, 2015. [Google Scholar]
  79. Scicchitano, G.; Berlinghieri, E.F.C.; Antonioli, F.; Spampinato, C.R.; Monaco, C. Sacred Landscapes and Changing Sea Levels: New Interdisciplinary Data from the Early Neolithic to the Present in South-Eastern Sicily. In Under the Sea: Archaeology and Palaeolandscapes of the Continental Shelf; Bailey, G.N., Harff, J., Sakellariou, D., Eds.; Coastal Research Library; Springer International Publishing: Cham, Switzerland, 2016; pp. 233–253. ISBN 978-3-319-53160-1. [Google Scholar]
  80. Duarte, J.; Taborda, R.; Ribeiro, M.; Cascalho, J.; Silva, A.; Bosnic, I. Evidences of Sediment Bypassing at Nazaré Headland Revealed by a Large Scale Sand Tracer Experiment. Actas Das 3as Jorn. De Eng. Hidrográfica 2014, 1, 289–292. [Google Scholar]
  81. Prediccion De Oleaje, Nivel Del Mar; Boyas Y Mareografos|Puertos. Es. Available online: https://www.puertos.es/es-es/oceanografia/Paginas/portus.aspx (accessed on 1 June 2022).
  82. Inghilesi, R.; Corsini, S.; Guiducci, F.; Arseni, A. Statistical Analysis of Extreme Waves on the Italian Coasts from 1989 to 1999. Bollettino di Geofisica Teorica ed Applicata 2000, 41, 315–337. [Google Scholar]
  83. Andriolo, U.; Mendes, D.; Taborda, R. Breaking Wave Height Estimation from Timex Images: Two Methods for Coastal Video Monitoring Systems. Remote Sens. 2020, 12, 204. [Google Scholar] [CrossRef] [Green Version]
  84. Coelho, I.B. Nearshore Sedimentary Dynamics in a Wave-Dominated Coast. Ph.D. Thesis, University of Lisbon, Lisbon, Portugal, 2017. [Google Scholar]
  85. Duarte, J.; Taborda, R.; Ribeiro, M. Evidences of Headland Sediment Bypassing at Nazaré Norte Beach, Portugal. In Proceedings of the International Conference on Coastal Sediments 2019, Tampa/St. Petersburg, FL, USA, 27–31 May 2019; p. 2694. [Google Scholar]
  86. Grandini, M.; Bagli, E.; Visani, G. Metrics for Multi-Class Classification: An Overview. arXiv 2020, arXiv:2008.05756. [Google Scholar]
  87. Holman, R.; Haller, M.C. Remote Sensing of the Nearshore. Ann. Rev. Mar. Sci. 2013, 5, 95–113. [Google Scholar] [CrossRef] [Green Version]
  88. Brodie, K.L.; Palmsten, M.L.; Hesser, T.J.; Dickhudt, P.J.; Raubenheimer, B.; Ladner, H.; Elgar, S. Evaluation of Video-Based Linear Depth Inversion Performance and Applications Using Altimeters and Hydrographic Surveys in a Wide Range of Environmental Conditions. Coast. Eng. 2018, 136, 147–160. [Google Scholar] [CrossRef] [Green Version]
  89. Buscombe, D.; Carini, R.J. A Data-Driven Approach to Classifying Wave Breaking in Infrared Imagery. Remote Sens. 2019, 11, 859. [Google Scholar] [CrossRef] [Green Version]
  90. Kim, J.; Kim, J.; Kim, T.; Huh, D.; Caires, S. Wave-Tracking in the Surf Zone Using Coastal Video Imagery with Deep Neural Networks. Atmosphere 2020, 11, 304. [Google Scholar] [CrossRef] [Green Version]
  91. Domingo, M.C. Deep Learning and Internet of Things for Beach Monitoring: An Experimental Study of Beach Attendance Prediction at Castelldefels Beach. Appl. Sci. 2021, 11, 10735. [Google Scholar] [CrossRef]
  92. Ondoa, G.A.; Almar, R.; Castelle, B.; Testut, L.; Léger, F.; Sohou, Z.; Bonou, F.; Bergsma, E.W.J.; Meyssignac, B.; Larson, M. Sea Level at the Coast from Video-Sensed Waves: Comparison to Tidal Gauges and Satellite Altimetry. J. Atmos. Ocean. Technol. 2019, 36, 1591–1603. [Google Scholar] [CrossRef]
  93. Stockdon, H.F.; Holman, R.A. Estimation of Wave Phase Speed and Nearshore Bathymetry from Video Imagery. J. Geophys. Res. Ocean. 2000, 105, 22015–22033. [Google Scholar] [CrossRef]
  94. Stockdon, H.F.; Holman, R.A.; Howd, P.A.; Sallenger, A.H. Empirical Parameterization of Setup, Swash, and Runup. Coast. Eng. 2006, 53, 573–588. [Google Scholar] [CrossRef]
  95. Granata, F.; Di Nunno, F. Artificial Intelligence Models for Prediction of the Tide Level in Venice. Stoch. Environ. Res. Risk Assess. 2021, 35, 2537–2548. [Google Scholar] [CrossRef]
  96. Guillou, N.; Chapalain, G. Machine Learning Methods Applied to Sea Level Predictions in the Upper Part of a Tidal Estuary. Oceanologia 2021, 63, 531–544. [Google Scholar] [CrossRef]
  97. Hegde, J.; Rokseth, B. Applications of Machine Learning Methods for Engineering Risk Assessment—A Review. Saf. Sci. 2020, 122, 104492. [Google Scholar] [CrossRef]
  98. Riazi, A. Accurate Tide Level Estimation: A Deep Learning Approach. Ocean. Eng. 2020, 198, 107013. [Google Scholar] [CrossRef]
  99. Davidson, M.A.; Aarninkhof, S.G.J.; Van Koningsveld, M.; Holman, R.A. Developing Coastal Video Monitoring Systems in Support of Coastal Zone Management. J. Coast. Res. 2006, 39, 49–56. [Google Scholar]
  100. Margiotta, S.; Marini, G.; Fay, S.; D’Onghia, F.M.; Liso, I.S.; Parise, M.; Pinna, M. Hydro-Stratigraphic Conditions and Human Activity Leading to Development of a Sinkhole Cluster in a Mediterranean Water Ecosystem. Hydrology 2021, 8, 111. [Google Scholar] [CrossRef]
  101. Anthony, E.J.; Besset, M.; Zainescu, F.; Sabatier, F. Multi-Decadal Deltaic Land-Surface Changes: Gauging the Vulnerability of a Selection of Mediterranean and Black Sea River Deltas. J. Mar. Sci. Eng. 2021, 9, 512. [Google Scholar] [CrossRef]
  102. Mattei, G.; Di Luccio, D.; Benassai, G.; Anfuso, G.; Budillon, G.; Aucelli, P. Characteristics and Coastal Effects of a Destructive Marine Storm in the Gulf of Naples (Southern Italy). Nat. Hazards Earth Syst. Sci. 2021, 21, 3809–3825. [Google Scholar] [CrossRef]
  103. Portmann, R.; González-Alemán, J.J.; Sprenger, M.; Wernli, H. Medicane Zorbas: Origin and Impact of an Uncertain Potential Vorticity Streamer. Weather Clim. Dyn. Discuss. 2019, 1–30. [Google Scholar] [CrossRef]
  104. Fita, L.; Flaounas, E. Medicanes as Subtropical Cyclones: The December 2005 Case from the Perspective of Surface Pressure Tendency Diagnostics and Atmospheric Water Budget. Q. J. R. Meteorol. Soc. 2018, 144, 1028–1044. [Google Scholar] [CrossRef]
  105. Hansom, J.; Hall, A. Magnitude and Frequency of Extra-Tropical North Atlantic Cyclones. Quat. Int. 2009, 195, 42–52. [Google Scholar] [CrossRef]
  106. Bouin, M.-N.; Lebeaupin Brossier, C. Surface Processes in the 7 November 2014 Medicane from Air–Sea Coupled High-Resolution Numerical Modelling. Atmos. Chem. Phys. 2020, 20, 6861–6881. [Google Scholar] [CrossRef]
  107. Splinter, K.D.; Harley, M.D.; Turner, I.L. Remote Sensing Is Changing Our View of the Coast: Insights from 40 Years of Monitoring at Narrabeen-Collaroy, Australia. Remote Sens. 2018, 10, 1744. [Google Scholar] [CrossRef] [Green Version]
  108. Yang, T.; Jiangde, S.; Hong, Z.; Zhang, Y.; Han, Y.; Zhou, R.; Wang, J.; Yang, S.; Tong, X.; Kuc, T. Sea-Land Segmentation Using Deep Learning Techniques for Landsat-8 OLI Imagery. Mar. Geod. 2020, 43, 105–133. [Google Scholar] [CrossRef]
  109. Aryal, B.; Escarzaga, S.; Vargas Zesati, S.; Velez-Reyes, M.; Fuentes, O.; Tweedie, C. Semi-Automated Semantic Segmentation of Arctic Shorelines Using Very High-Resolution Airborne Imagery, Spectral Indices and Weakly Supervised Machine Learning Approaches. Remote Sens. 2021, 13, 4572. [Google Scholar] [CrossRef]
  110. Nieves, V.; Radin, C.; Camps-Valls, G. Predicting Regional Coastal Sea Level Changes with Machine Learning. Sci. Rep. 2021, 11, 7650. [Google Scholar] [CrossRef]
  111. Balogun, A.-L.; Adebisi, N. Sea Level Prediction Using ARIMA, SVR and LSTM Neural Network: Assessing the Impact of Ensemble Ocean-Atmospheric Processes on Models’ Accuracy. Geomat. Nat. Hazards Risk 2021, 12, 653–674. [Google Scholar] [CrossRef]
  112. Žust, L.; Fettich, A.; Kristan, M.; Ličer, M. HIDRA 1.0: Deep-Learning-Based Ensemble Sea Level Forecasting in the Northern Adriatic. Geosci. Model Dev. 2021, 14, 2057–2074. [Google Scholar] [CrossRef]
  113. Asthana, T.; Krim, H.; Sun, X.; Roheda, S.; Xie, L. Atlantic Hurricane Activity Prediction: A Machine Learning Approach. Atmosphere 2021, 12, 455. [Google Scholar] [CrossRef]
  114. Boussioux, L.; Zeng, C.; Guénais, T.; Bertsimas, D. Hurricane Forecasting: A Novel Multimodal Machine Learning Framework. arXiv 2022, arXiv:2011.06125. [Google Scholar] [CrossRef]
Figure 1. Rocky coastal areas on Maddalena Peninsula monitored by webcams set up on the Marine Protected Area (MPA) of Plemmirio (Siracusa, south-eastern Sicily); (a) locations of study areas in the Ionian Sea; (b) Greek quarry of Santa Lucia; (c) rocky coast of Massolivieri; (d) rocky coast of Varco 11.
Remotesensing 14 02994 g001
Figure 2. Coastal areas surveyed in Portugal; (a) locations of study areas; (b) sandy coast of Costa Nova; (c) sandy coast of Cova Gala; (d) sandy coast of Nazaré; (e) rocky coast of Coxos.
Remotesensing 14 02994 g002
Figure 3. Topographic data: (a)-Topographic survey performed through TLS on Varco 11; (b)—surveillance camera of MPA; (c)—point clouds of TLS data of Varco 11 with ubications of the webcam and tide gauge sensor.
Remotesensing 14 02994 g003
Figure 4. Structure of network (a) Network Architecture of CNN developed for assessing tidal values from video frames; (b) Inception module with dimension reductions used to decrease the computational expense.
Remotesensing 14 02994 g004
Figure 5. Motion estimation using Optical Flow on the video frames; I(x,y,t): pixel at position x,y at time t; I(x + dx,y + dy,t + dt): pixel at position x + dx,y + dy at time t + dt.
Remotesensing 14 02994 g005
Figure 6. Dimensional features assessed on the Portuguese coast of Cova Gala; (a) dimensional grid used for the assessment of physical wave parameters; (b) dimensional grid and Digital Terrain Model of the beach; (c,d) point of view of the action cameras used to record the wave height impacting.
Remotesensing 14 02994 g006
Figure 7. Probability of the tide classes obtained through CNN classification techniques applied on a webcam snapshot of Varco 11; (a) image of the time frame automatically extracted by webcam; (b) probability of the tide classes attributed to the time frame.
Remotesensing 14 02994 g007
Figure 8. Metrics of the CNN; (a) accuracy and loss reached by the CNN models for the tide assessment on the frames sampled by webcams of MPA of Plemmirio (Siracusa, south-eastern Sicily); (b) confusion matrix of all true classes (obtained from spatial reference) and CNN predicted classes (tide classes predicted by CNN).
Remotesensing 14 02994 g008
Figure 9. Tide values obtained from CNN outputs for Varco 11, Massolivieri, and Santa Lucia, compared with data from tide gauge sensor installed in Varco 11.
Remotesensing 14 02994 g009
Figure 10. Wave parameters assessed on Massolivieri; (a) flow vectors assessment through Optical Flow Farneback technique, the white inset represents the area of interest for the wave height assessment; (b) wave height assessment through linear relationship (1) in the white inset; (c) breaking-wave height assessment through relationship (2) in the white inset.
Remotesensing 14 02994 g010
Figure 11. Time series of wave height impacting on Cova Gala (Portugal); (a) time series plot of wave height obtained by Optical Flow following the relationship (1); (b) frames of action camera at 119 s from starting video; (c) frames of action camera at 479 s from starting video; (d) frames of action camera at 741 s from starting video; (e) frames of action camera at 970 s from starting video.
Remotesensing 14 02994 g011
Figure 12. Storm surge assessed through CNN in Santa Lucia; (a) storm surge values of medicane Zorbas (28 September 2018); (b) storm event of 20 March 2021; (c) storm event of 16 April 2021; (d) medicane Apollo (29 October 2021).
Remotesensing 14 02994 g012
Figure 13. Comparison between common storms and medicane: (a) Comparison between storm surge values extracted by CNN; (b) Wave height assessed through Optical Flow (relationship [1]) for the storm events that occurred in Santa Lucia.
Remotesensing 14 02994 g013
Figure 14. Tide gauge records of Catania (ISPRA) for August 2021 compared with the CNN prediction of S.Lucia and Massolivieri. Black and with circles represents the phases of spring tides, while gray half circle represents the phase of neap tide.
Remotesensing 14 02994 g014
Figure 15. Validation of model results on Varco 11 with spatial reference; (a) reference transects extracted by TLS point clouds to obtain spatial reference in Sicily; (b) comparison of spatial reference of Sicily with wave height obtained by models; (c) reference transects extracted by TLS point clouds to obtain spatial reference in Portugal; (d) comparison of spatial reference of Portugal with wave height obtained by models.
Remotesensing 14 02994 g015
Table 1. Datasets of Mediterranean and Atlantic video records used to assess tide phases, surge, and physical wave parameters.
SitesCoastal TypeAcquisitionTideStorm SurgeWave Height—Wave Length—Wave Flow
Varco 11—Sicily, ItalyConvex sloping rocky coastFixed remote-controlled camera15–22 September 202120 March 2021
14 April 2021
15–22 September 2021
Santa Lucia—Sicily, ItalyConvex sloping rocky coastFixed remote-controlled camera4–28 August 2021
15–22 September 2021
28 September 2018
20 March 2021
14 April 2021
28 September 2018
15–22 September 2021
Massolivieri—Sicily, ItalyConvex sloping rocky coastFixed remote-controlled camera4–28 August 2021
15–22 September 2021
20 March 2021
14 April 2021
15–22 September 2021
Coxos—Lisboa, PortugalHigh rocky coastAction cameraN/AN/A25 January 2022
Nazaré—Leiria, PortugalSandy coastAction cameraN/AN/A25 January 2022
Costa Nova—Aveiro, PortugalSandy coastAction cameraN/AN/A26 January 2022
Cova Gala—Coimbra, PortugalSandy coastAction cameraN/AN/A27 January 2022
Table 2. Structure of GoogleNET modified for LEUCOTEA to assess the tide classes from video records.
LayerPatch Size/StrideFunction
Input images of time frames sampled each 10 min
Conv2D7 × 7/2ReLU
Max pool3 × 3/2Normalization
Conv2D3 × 3/1ReLU + Normalization
Max pool3 × 3/2
Inception module
Inception module
Max pool3 × 3/2
Inception module
Inception module
Inception module
Inception module
Max pool3 × 3/2
Inception module
Avg pool7 × 7/1
Fully connected
Softmax
Classification—output of tide class
Table 4. Average values of marine parameters obtained through CNN and Optical Flow (relationship (1)) on the video records of medicanes and storm events.
Storm Surge (m)Wave Height (m)Wavelength (m)Wave Flow (m/s)
medicane Zorbas (September 2018)1.1 ± 0.23.3 ± 0.425 ± 0.25.1 ± 0.5
Storm (March 2021)0.15 ± 0.051.1 ± 0.413 ± 0.54.2 ± 0.5
Storm (April 2021)0.4 ± 0.10.9 ± 0.413 ± 0.54.0 ± 0.5
medicane Apollo (October 2021)0.9 ± 0.22.5 ± 0.422 ± 0.25.1 ± 0.5
Publisher’s Note: MDPI stays neutral with regard to jurisdictional claims in published maps and institutional affiliations.

