Article

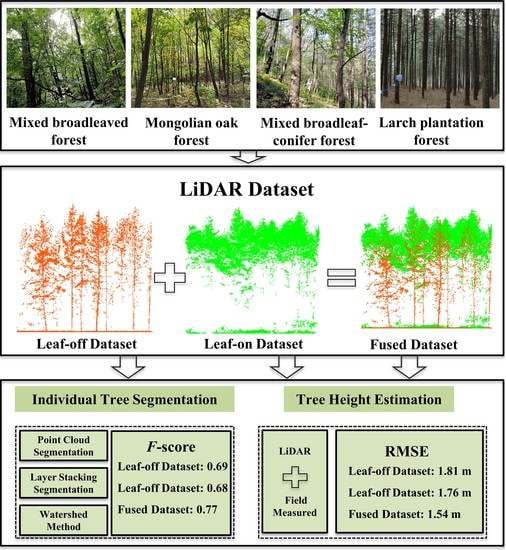
Individual Tree Segmentation and Tree Height Estimation Using Leaf-Off and Leaf-On UAV-LiDAR Data in Dense Deciduous Forests

1
Qingyuan Forest CERN, National Observation and Research Station, Shenyang 110016, China
2
CAS Key Laboratory of Forest Ecology and Management, Institute of Applied Ecology, Chinese Academy of Sciences, Shenyang 110016, China
3
University of Chinese Academy of Sciences, Beijing 100049, China
4
Academy of Inventory and Planning, National Forestry and Grassland Administration, Beijing 100714, China
5
Agronomy College, Shenyang Agricultural University, Shenyang 110866, China
*
Author to whom correspondence should be addressed.
These authors contributed equally to this work.
Remote Sens. 2022, 14(12), 2787; https://doi.org/10.3390/rs14122787
Submission received: 30 April 2022 / Revised: 31 May 2022 / Accepted: 6 June 2022 / Published: 10 June 2022
(This article belongs to the Section Forest Remote Sensing)

Abstract

:
Accurate individual tree segmentation (ITS) is fundamental to forest management and to the studies of forest ecosystem. Unmanned Aerial Vehicle Light Detection and Ranging (UAV-LiDAR) shows advantages for ITS and tree height estimation at stand and landscape scale. However, dense deciduous forests with tightly interlocked tree crowns challenge the performance for ITS. Available LiDAR points through tree crown and appropriate algorithm are expected to attack the problem. In this study, a new UAV-LiDAR dataset that fused leaf-off and leaf-on point cloud (FULD) was introduced to assess the synergetic benefits for ITS and tree height estimation by comparing different types of segmentation algorithms (i.e., watershed segmentation, point cloud segmentation and layer stacking segmentation) in the dense deciduous forests of Northeast China. Field validation was conducted in the four typical stands, including mixed broadleaved forest (MBF), Mongolian oak forest (MOF), mixed broadleaf-conifer forest (MBCF) and larch plantation forest (LPF). The results showed that the combination of FULD and the layer stacking segmentation (LSS) algorithm produced the highest accuracies across all forest types (F-score: 0.70 to 0.85). The FULD also showed a better performance on tree height estimation, with a root mean square error (RMSE) of 1.54 m at individual level. Compared with using the leaf-on dataset solely, the RMSE of tree height estimation was reduced by 0.22 to 0.27 m, and 12.3% more trees were correctly segmented by the FULD, which are mainly contributed by improved detection rate at nearly all DBH levels and by improved detection accuracy at low DBH levels. The improvements are attributed to abundant points from the bole to the treetop of FULD, as well as each layer point being included for segmentation by LSS algorithm. These findings provide useful insights to guide the application of FULD when more multi-temporal LiDAR data are available in future.

Graphical Abstract

1. Introduction

Accurate individual tree segmentation (ITS) and tree height estimation are critical in updating forest inventory, forest management and estimating growth and yield of forests [1,2]. Over large spatial scales, ITS from remote sense data is a prerequisite to extracting forest structural information at individual tree level. Once an individual tree has been segmented correctly, tree location and relevant structural parameters (e.g., tree height, crown diameter and crown volume) can be obtained [3]. Tree functional parameters, such as tree volume and above-ground biomass (AGB) [4], and attributes that link to canopy gap [5] and rainfall interception [6] can be estimated. In addition, an accuracy delineation of individual tree crowns can advance stand- and landscape-wise forest inventory without time-consuming labor work, which is of great practical significance to forest management [7,8].
ITS derived from remote sense images was traditionally achieved by delineating tree crown boundary from two-dimensional information [9,10]. Selectively, aerial photography interpretation could be used to derive indirect three-dimensional information from forest canopy [11]. Compared with optical imaging, Unmanned Aerial Vehicle (UAV) Light Detection and Ranging (LiDAR) can measure three-dimensional coordinates of forest canopy directly and provide a promising approach to detect individual trees. Since laser beams can penetrate forest canopy effectively, UAV-LiDAR can provide detailed forest floor topography information and show the good performance of estimation of individual tree height [12,13].
Various methods of UAV-LiDAR data-derived ITS can be broadly grouped into two categories: Canopy Height Model (CHM)-based methods and point cloud-based methods [13,14]. The CHM-based method is to delineate the tree crown edge through a CHM generated by interpolation of the original point clouds. This method primarily assumes that a single tree has only one treetop with a general ellipsoidal shape [13]. As such, detecting individual treetops correctly from CHM is crucial for delineation of individual tree crown [15]. Once treetops are identified, tree crowns are delineated by algorithms, such as the marker-controlled watershed algorithm [15,16,17] or seeded region-growing [17,18]. Various efforts were made to improve ITS accuracy by the CHM-based methods [19,20]. However, these methods have limitations due to information loss in interpolation possesses from point clouds [21,22]. In addition, inappropriate window sizes for a CHM-based method can lead to segmentation errors [15]. Unlike the CHM-based method, point cloud-based methods are developed to process on the normalized UAV-LiDAR point data [8,23]. Reitberger et al. [24] used the normalized cut segmentation combined with a detection of tree stems and tested the method in the stands dominated by coniferous species. By detecting the relative spacing between trees, Li et al. [22] developed a top-to-bottom region growing algorithm from the LiDAR point cloud, which showed a good performance of ITS in mixed-coniferous forests. Ayrey et al. [25] introduced the layer stacking segmentation algorithm, which slices the whole normalized point cloud and segments the tree in each layer, and the algorithm performed well in stands with much fewer prominent crowns. In general, these methods were designed to detect individual trees by developing manners that aggregated by three-dimensional geometry (e.g., crown shape and structure) or spatial information between trees.
Although numerous methods have been developed to enhance the accuracy of ITS, their performances are challenged by various types of forest stands. Most previous studies for ITS paid more attention to coniferous forests [22,26,27], planted forests [28], and savanna woodlands [15]. These forest types were characterized by distinct tree crown shapes and boundary, which may allow tree crown to be delineated clearly. However, the performance of ITS has been hampered when they are used in natural deciduous forest primarily because of tree branch interlacing [8]. Particularly, the detection rates of the most methods were not exceeded 70% in the dense deciduous forests [29,30,31]. The methods’ performances are strongly dependent on the density and complexity of forest stand.
Generally, a good accuracy is easier to be achieved in stands with a low tree density and a simple stand structure (e.g., less tree species and sparser understory) [8,32]. For closed and dense forests in mountainous areas (e.g., East Asia), tightly interlocked tree crowns enhance the difficulty in ITS. Rugged terrain and dense understory vegetation may also increase the difficulty of tree bole extraction for some special approaches of ITS (e.g., a bottom-up method reported by Lu et al. [8]). Furthermore, as it is difficult for laser pulses to penetrate a dense stand with a closed canopy and flourish understory vegetation in leaf-on condition, forest floor cannot be detected well, leading to an incorrect estimation of tree height. UAV-LiDAR data acquiring in leaf-off and leaf-on conditions are expected to provide more information useful for ITS and tree height estimation in deciduous forests. Most previous studies developed and tested the algorithms on UAV-LiDAR data, capturing in mono-temporal stage, but few studies reported the performances of a fused UAV-LiDAR dataset acquiring in leaf-off and leaf-on conditions. Knowledge about the performance of the methods in leaf-off and leaf-on point cloud data, as well as the influence of different stand types on the accuracy, is required to improve UAV-LiDAR-based extraction of forest structural information.
Here, we assume that a fused UAV-LiDAR dataset obtained in leaf-off and leaf-on conditions performs better for ITS than the dataset acquiring in a single condition for deciduous forests. We acquired the leaf-off and leaf-on UAV-LiDAR data in dense deciduous forests, and a fused leaf-off and leaf-on UAV-LiDAR dataset (FULD) was generated. Using the leaf-off UAV-LiDAR dataset (OLD), leaf-on UAV-LiDAR dataset (LLD) and FULD, a comprehensive comparison of algorithms was conducted to test their performance of ITS and tree height estimation. This study can provide a reference for the application of multi-temporal point cloud datasets.

2. Materials and Methods

2.1. Study Area

The study site is a mountainous temperate forest, located in eastern region of Liaoning Province, Northeast China (41°49′34″ to 41°51′08″ N, 124°53′53″ to 124°56’35″ E) (Figure 1). The site covers approximately 350 ha of forest stands and is part of field sites of the Qingyuan Forest CERN (Chinese Ecosystem Research Network). The area is 500 to 1100 m above sea level with a slope range of 10° to 34° [33]. The region has a continental monsoon climate. The annual mean air temperature was 4.3 °C and annual mean rainfall was 758 mm during 2010–2021. The study area is dominated by broadleaved deciduous forests with mosaic coniferous plantations. The species composition mainly includes Quercus mongolica Fisch., Acer spp., Betula platyphylla Suk., Fraxinus mandshurica Rupr., Fraxinus rhynchophylla Hance., Juglans mandshurica Maxim., Populus davidiana Dode., Tilia spp., Ulmus spp., etc.; the plantation species include Larix kaempferi and Pinus koraiensis Siebold & Zucc [34].

2.2. Field Data Collection

Four typical stand types, including mixed broadleaved forest (MBF), mixed broadleaf-conifer (larch) forest (MBCF), Mongolian oak (Quercus mongolica) forest (MOF) and larch (Larix kaempferi) plantation forest (LPF), were selected in the study area (Table 1). Five to eight rectangular plots (30 m × 20 m) were set up for each of stand type. Ground reference data were collected for 25 plots in May 2019, and their central locations were obtained with the ultrasound-based Haglöf PosTex positioning instrument (Långsele, Sweden) and Trimble GeoXH6000 global positioning system (GPS) (Trimble, Sunnyvale, CA, USA) units. The tree diameter at breast height (DBH) and tree height (Vertex V® hypsometer (Langsele, Sweden)) were measured for all live trees with a DBH that is greater than 5 cm, and average Lorey’s height (basal-area-weighted average height) was calculated. Crown class (dominant, co-dominant, intermediate and overtopped) of a tree was recorded by a visual comparison with the crown heights of its neighboring trees. Tree species and stem density (tree·ha−1) were recorded. Tree positions within 15 sample plots were acquired by the Haglöf PosTex positioning instrument [28]. The average Lorey’s height is 19.3 m, and the average stand density is 935.7 tree·ha−1.

2.3. LiDAR Data Collection

Two LiDAR datasets were acquired on 15 April 2018 (leaf-off condition) and on 22 August 2018 (leaf-on condition), respectively. Both datasets were collected using a Riegl VUX-1LR sensor, which operates at 1550 nm and transmits 750,000 pts∙s−1 for leaf-off condition and 500,000 pts∙s−1 for leaf-on condition (Table 2). The averaged point densities of the two LiDAR datasets were 110 pts∙m−2 for leaf-off condition and 280 pts∙m−2 for leaf-on condition. The extent of the two datasets was approximately overlapped by 350 ha, covering all the sampling plots (Figure 1). A differential global position system was introduced to obtain accurate position information, as well as to reduce positional difference between the two datasets.
The swaths matching of both OLD and LLD were performed by Green Valley International LiDAR360 (v3.2) software. A total of 100 ground control points, which locates buildings, flux towers and huts with different elevations in the overlapped area, were manually selected for co-registration of the two datasets. The co-registration accuracy of the OLD and LLD was 0.12 m.

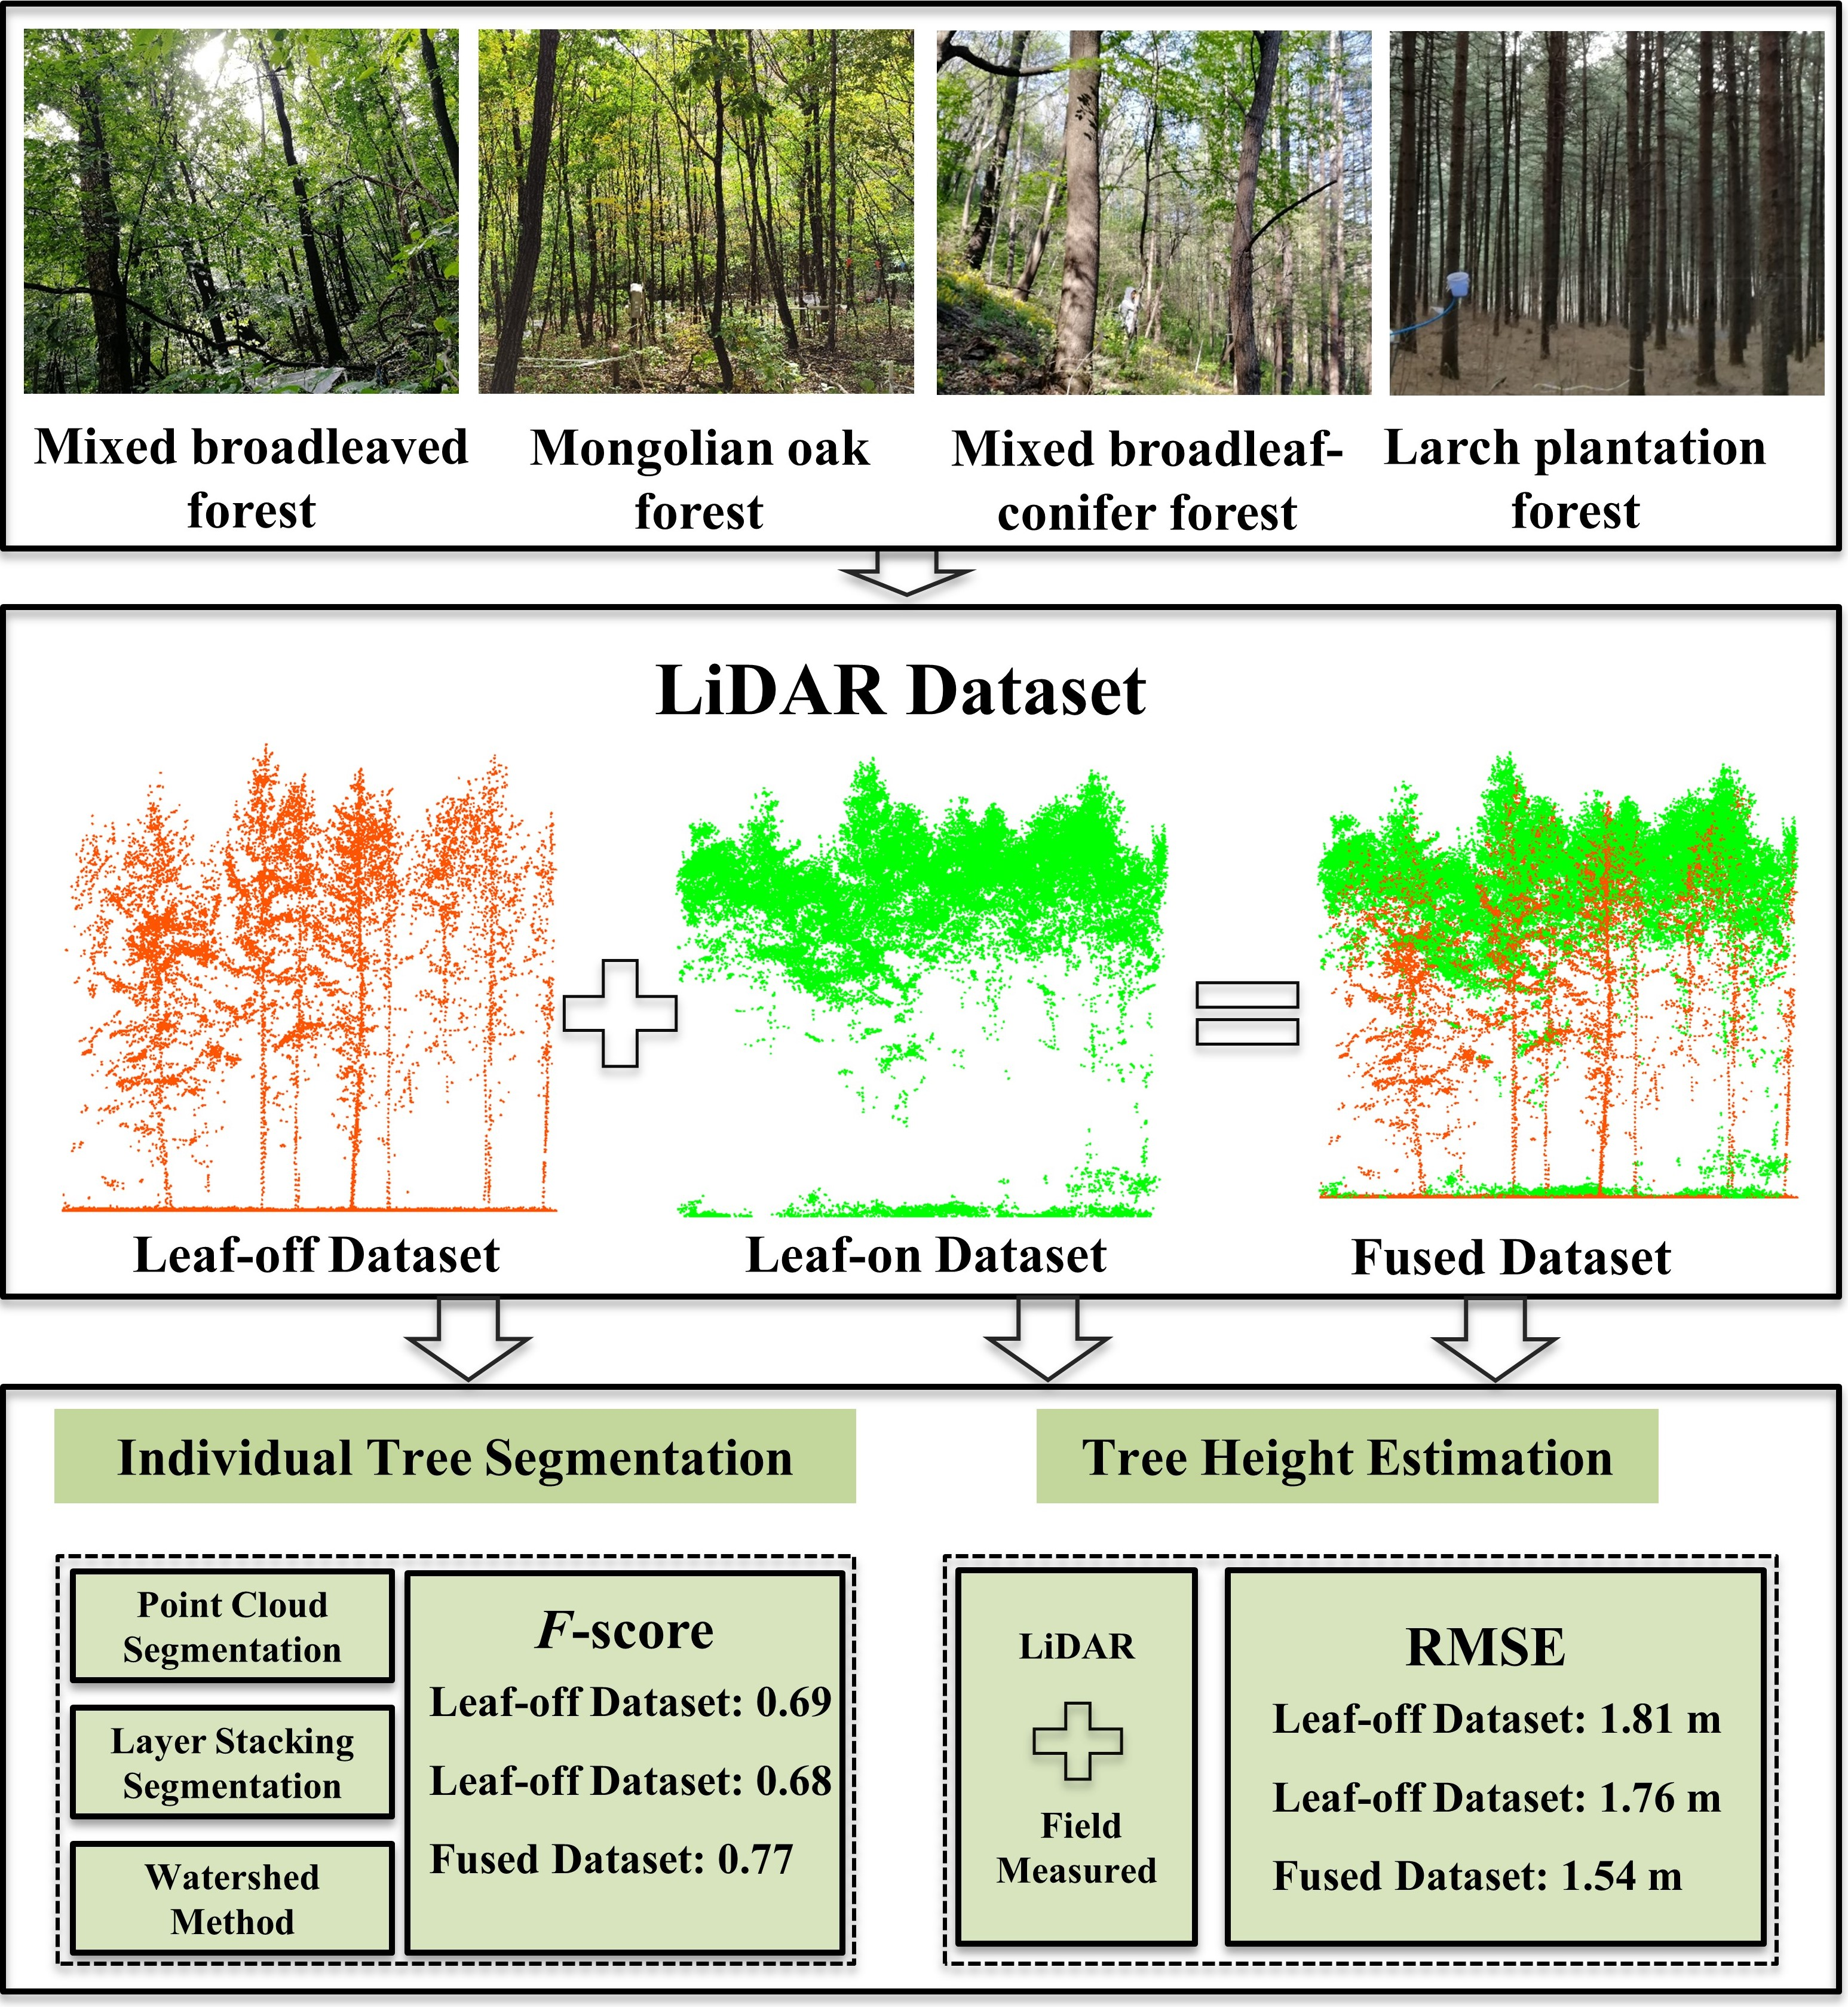
2.4. Data Preprocessing

A new LiDAR dataset was fused by the OLD and LLD, and the three datasets were used for segmentation (Figure 2). The point cloud of each plot was clipped according to the plot boundary point location acquired in the ground survey.
The subsequent analysis and processing of point cloud can be directly affected by the quality of data preprocessing [35]. First, the noise points of the raw data were removed through the distance threshold method. Second, the data were filtered into ground and vegetation points through the progressive triangulated irregular network (TIN) densification. Then, digital elevation model (DEM) and digital surface model (DSM) with 0.5 m spatial resolution were generated [21,28], and CHM was derived by subtracting DEM from DSM. Finally, the normalized point cloud data were generated by DEM [36] (Figure 2). The preprocessing steps were performed by the commercial software, LiDAR 360 v3.2 (Green Valley International, Ltd., Merced, CA, USA).

2.5. Individual Tree Segmentation Algorithms

Three segmentation algorithms were employed for comparison with the three datasets in the four forest types (Figure 2). Based on CHM, the boundary of the individual tree canopy is generated via the watershed algorithm, and then the local maximum is identified as the treetops. Minimum tree height, Gaussian smoothing factor, and Gaussian smoothing radius are three important parameters for the watershed algorithm. The minimum tree height was set to 2 m [37]; Gaussian smoothing factor was set to a range of 0.8 to 2 and the radius was set to a range of 5 to 9 pixels. The parameters were set depending on the specific conditions of each plot [38,39].
Point cloud segmentation (PCS) is an algorithm based on normalized point cloud data through a regional growth generally as the following steps: identifying a treetop, including the points within a specified relative distance from the treetop of the target tree and excluding the points with a distance greater than a specified threshold from the target tree [22]. We set the spacing threshold (0.8–2 m) according to the average distance of trees in the plots [22].
Layer stacking segmentation (LSS) is an algorithm that combines the layer stacking and PCS algorithm. The tree position of each tree in the plot was obtained by determining local maxima through k-means clustering of each layer. Then, seed points that generated by the local maxima were used to detect the individual tree by PCS algorithm. The layer thickness was set to 1 m [25].

2.6. Estimation of Tree Height

Tree height was estimated at individual tree level (tree height ≥ 10 m) and at stand level. The individual tree height was estimated based on correct results of ITS. The treetop can be identified when an individual tree has been segmented correctly, and individual tree height can be calculated from normalized point clouds. For an estimation of Lorey’s mean height (stand level), LiDAR metrics, which were extracted from the normalized point clouds of 25 plots through the Matlab processing, were used to establish tree height estimation models [40]. These metrics included (Table 3): (1) height-based metrics (H25, H50, H75, H95, Hmean, Hcv and Hkur); (2) density-based metrics (D3, D5, D7 and D9); (3) canopy volume metrics (C1.3). The metrics were selected as they have been found to be more sensitive to changes in forest canopy [41]. The “randomForest” package in statistical software R 4.1.3 was employed, and the increase in the mean-squared error (%IncMSE) and Var explained were calculated [42].

2.7. Accuracy Assessment

The performances of the three segmentation algorithms were assessed at individual tree level according to the spatially corresponding trees that were recorded in the field. It was considered to be correct when a segmented tree was located within the boundary of ground-referenced tree crown [28,43]. The evaluation can produce three types of segmentation results: (1) If a tree exists and is identified successfully, it will be labeled as true positive (TP), representing correct segmentation; (2) If a tree exists but is not detected, it will be labeled as false negative (FN), representing under-segmentation [44]; (3) If a tree is detected by the algorithm but does not exist on the ground, it will be labeled as false positive (FP), representing over-segmentation. The F-score represents the overall accuracy, which is calculated as follows [45,46]:
r = TP TP + FN
p = TP TP + FP
F - score = 2 × r × p r + p
where recall (r) represents detection rate (omission); precision (p) represents detection accuracy (commission); and F-score is the weight average taking both detection rate and detection accuracy into consideration.
The adjusted R-square (Adj-R2), root-mean-squared error (RMSE) and relative root-mean-squared error (rRMSE) were applied to evaluate height estimation with field reference data. The calculation equations are as follows:
Adj - R 2 = 1 n 1 n p 1 ( 1 R 2 )
R M S E = 1 n i = 1 n ( x i x i ^ ) 2
r R M S E = R M S E x ¯ × 100 %
where x i is the ground measured tree height; x ¯ i is the average tree height of ground measured; x ^ i represents the tree height estimated by the model; x ¯ represents the average tree height of all the sampling plots; p represents the number of intendant variables; n is the number of the sampling plots.

3. Results

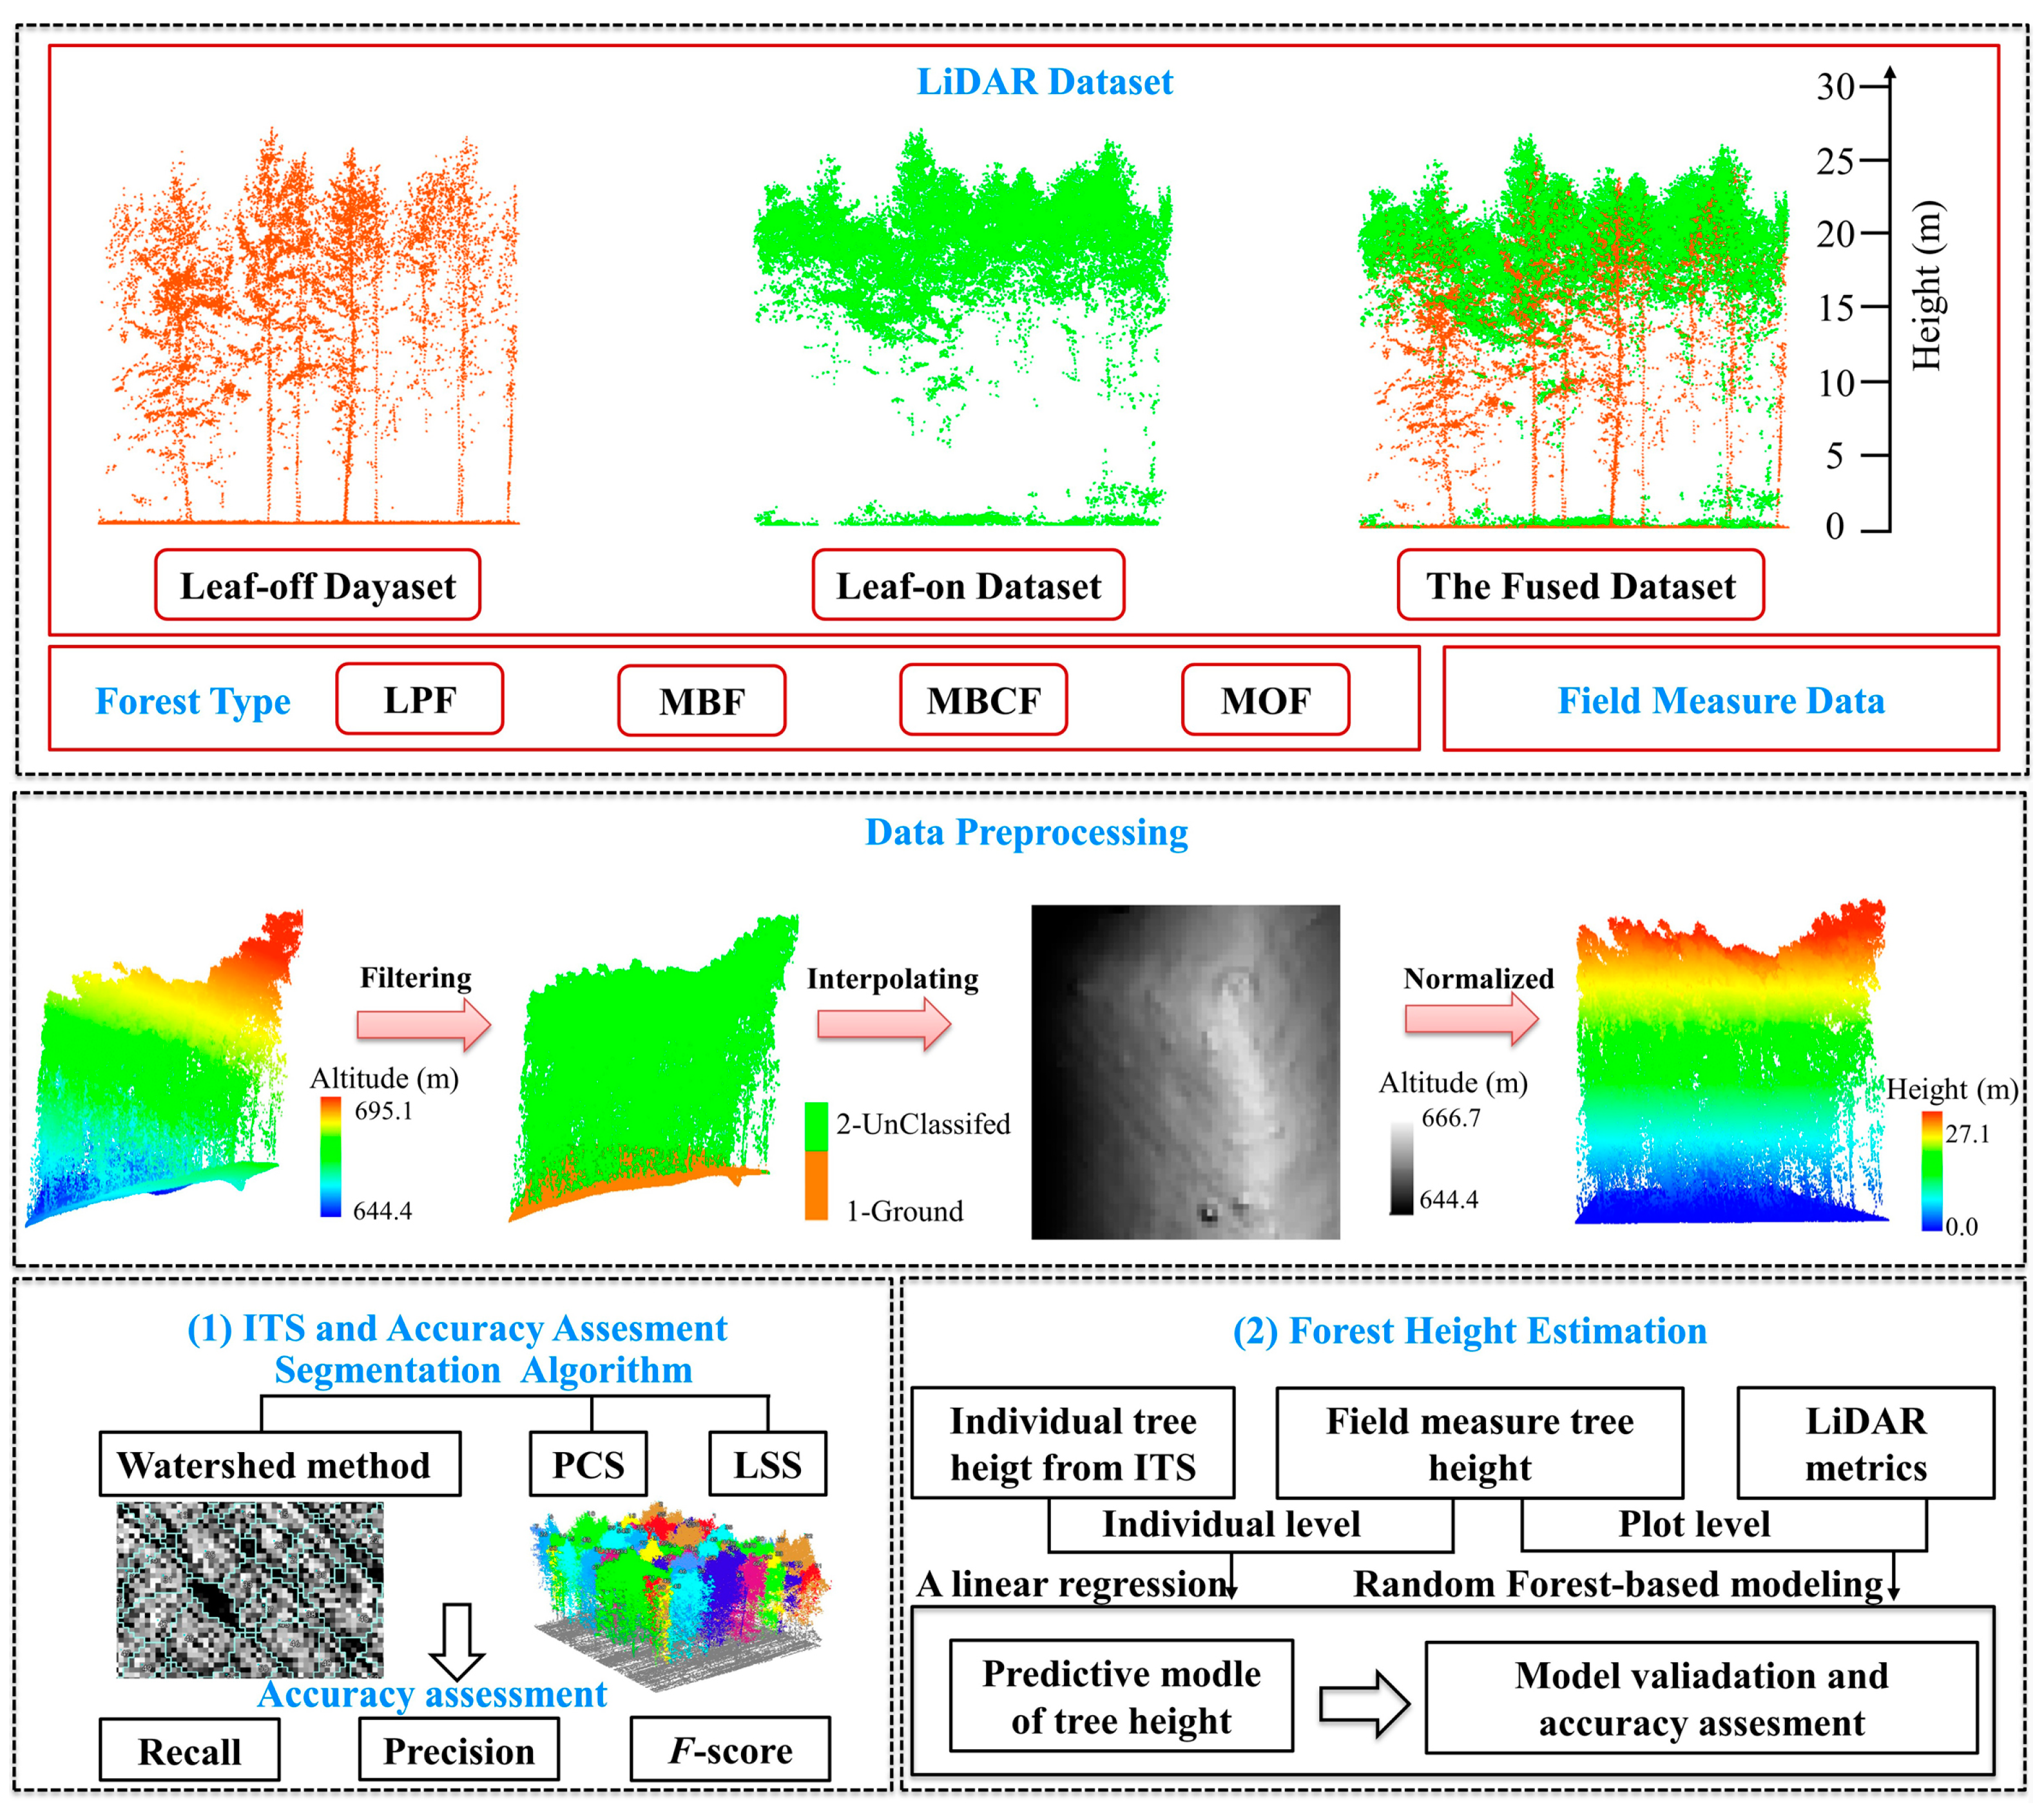
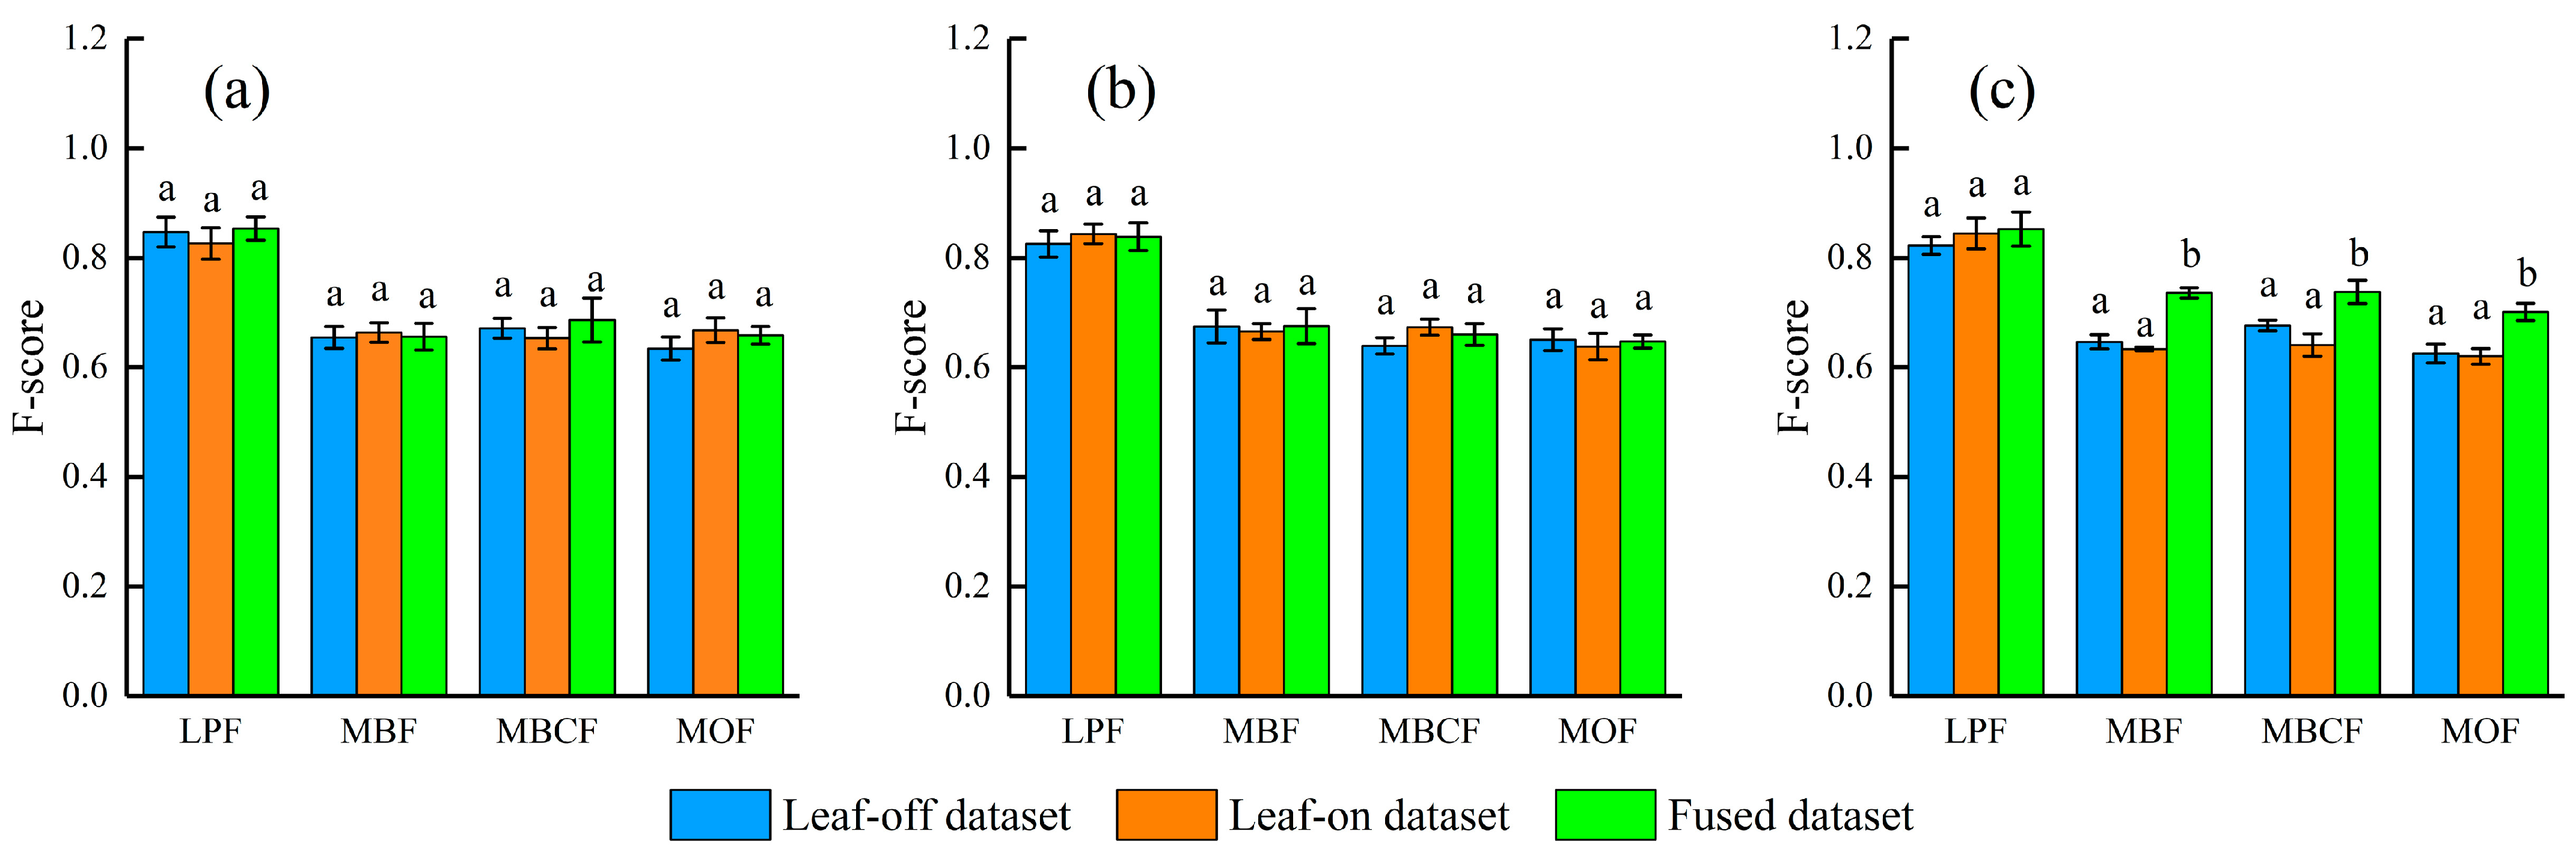
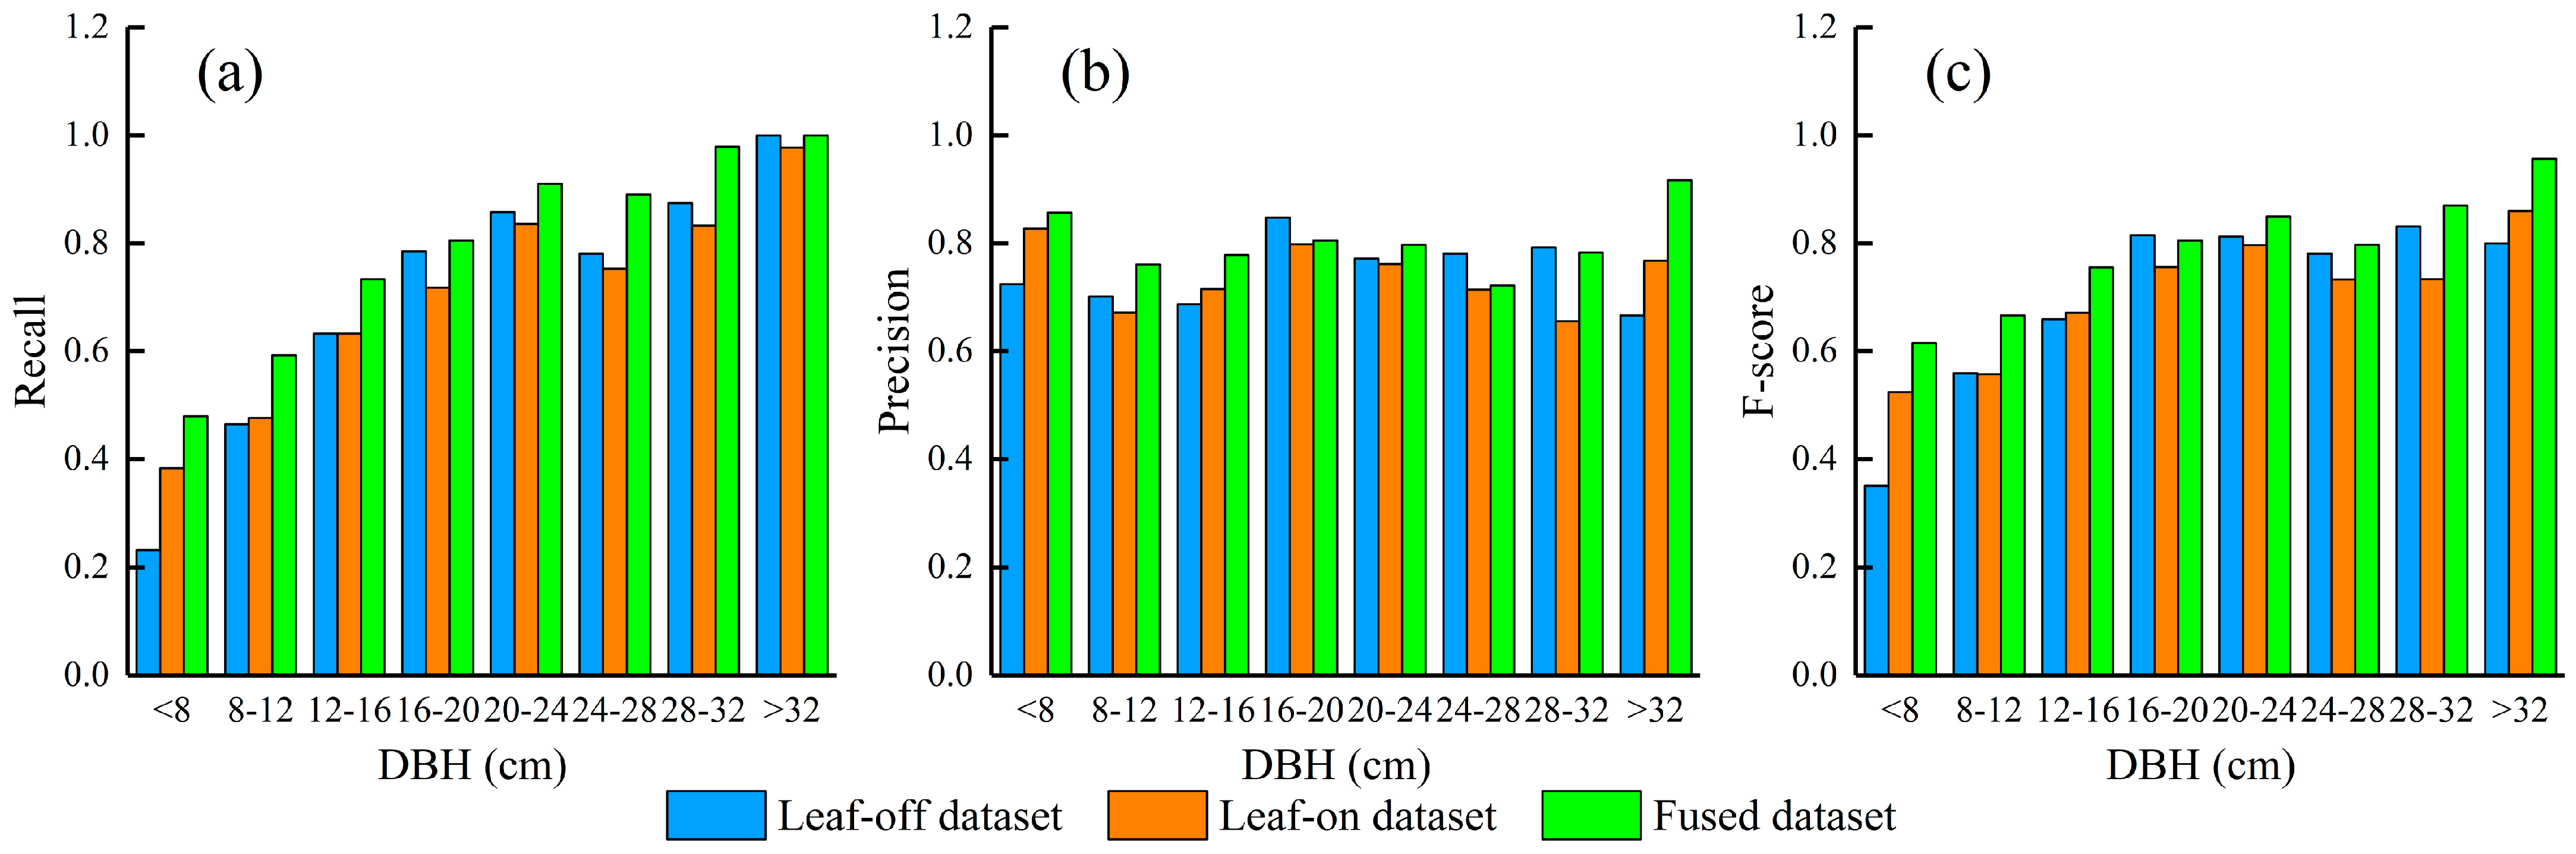
3.1. Performance of ITS

A total of 884 individual tree positions were recorded in the 15 field plots, and 763, 780 and 819 trees were segmented through OLD, LLD and FULD, respectively (by LSS algorithm, Table 4). Overall, FN was higher than FP, indicating a trend toward an underestimation. The FULD performed best among the three datasets, and its FN (238) and FP (173) were lower than those of FN (311 and 309) and FP (190 and 205) from OLD and LLD, respectively. FULD can improve the correct detect rate of ITS, and a total of 573, 575 and 646 trees were detected correctly by OLD, LLD and FULD, respectively. Compared with segmentation using LLD solely, the FULD correctly segmented 15.7% more trees in MBF, 16.5% more in MOF, 18.2% more in MBCF and 4.4% more in LPF.
The Watershed, PCS and LSS algorithms showed a similar performance using OLD or LLD (Figure 3). LPF showed a higher F-score (0.84 ± 0.01) than those in MBF (0.66 ± 0.01), MBCF (0.66 ± 0.02) and MOF (0.64 ± 0.02) when using OLD or LLD solely. When the FULD was introduced, LSS algorithm significantly improved F-score while the improvements were not observed for Watershed and PCS algorithms (Figure 3). Compared with OLD or LLD, the FULD can improve F-score by 0.10 ± 0.02, 0.08 ± 0.02, 0.08 ± 0.02 for MBF, MBCF and MOF, respectively. A relatively small improvement in F-score (0.03 ± 0.01) was observed for LPF.
Segmentation accuracies depended on different forest types and characteristics. Using FULD and LSS algorithm (the same algorithm and dataset hereinafter), the F-score of the coniferous stands (LPF) was 0.85 ± 0.03; the accuracy of broadleaved or broadleaved-dominated stands was lower, with F-score of 0.74 ± 0.01, 0.74 ± 0.02 and 0.70 ± 0.02, for MBF, MBCF and MOF, respectively. The two broadleaved stands showed a higher value of precision (0.76 ± 0.03) than recall (0.67 ± 0.05), while the differences between precision and recall of LPF and MBCF were small. In addition, F-score was also hampered by an increase in tree density (R2 = 0.39, p = 0.039) for MBF, MBCF and MOF. In particular, recall negatively related to tree density (R2 = 0.65, p = 0.003), whereas precision positively related to tree density (R2 = 0.45, p = 0.023) for the broadleaved or broadleaved-dominated stands.
The F-score was positively related to tree DBH (Figure 4). The increasing trend of F-score (R2 = 0.90, p < 0.001) was mainly contributed by the increase in recall along the DBH gradient, whereas no significant trend of precision was found. Small trees (DBH < 12 cm) contributed to 60.8% (135 trees) of the undetected trees, with a recall of 54.5%, which was much lower than the overall recall level (74.9%). The F-score of FULD was higher than those of OLD and LLD. The improvements are mainly contributed by the improved detection rate at nearly all tree DBH levels and by the improved detection accuracy at the low tree DBH levels.

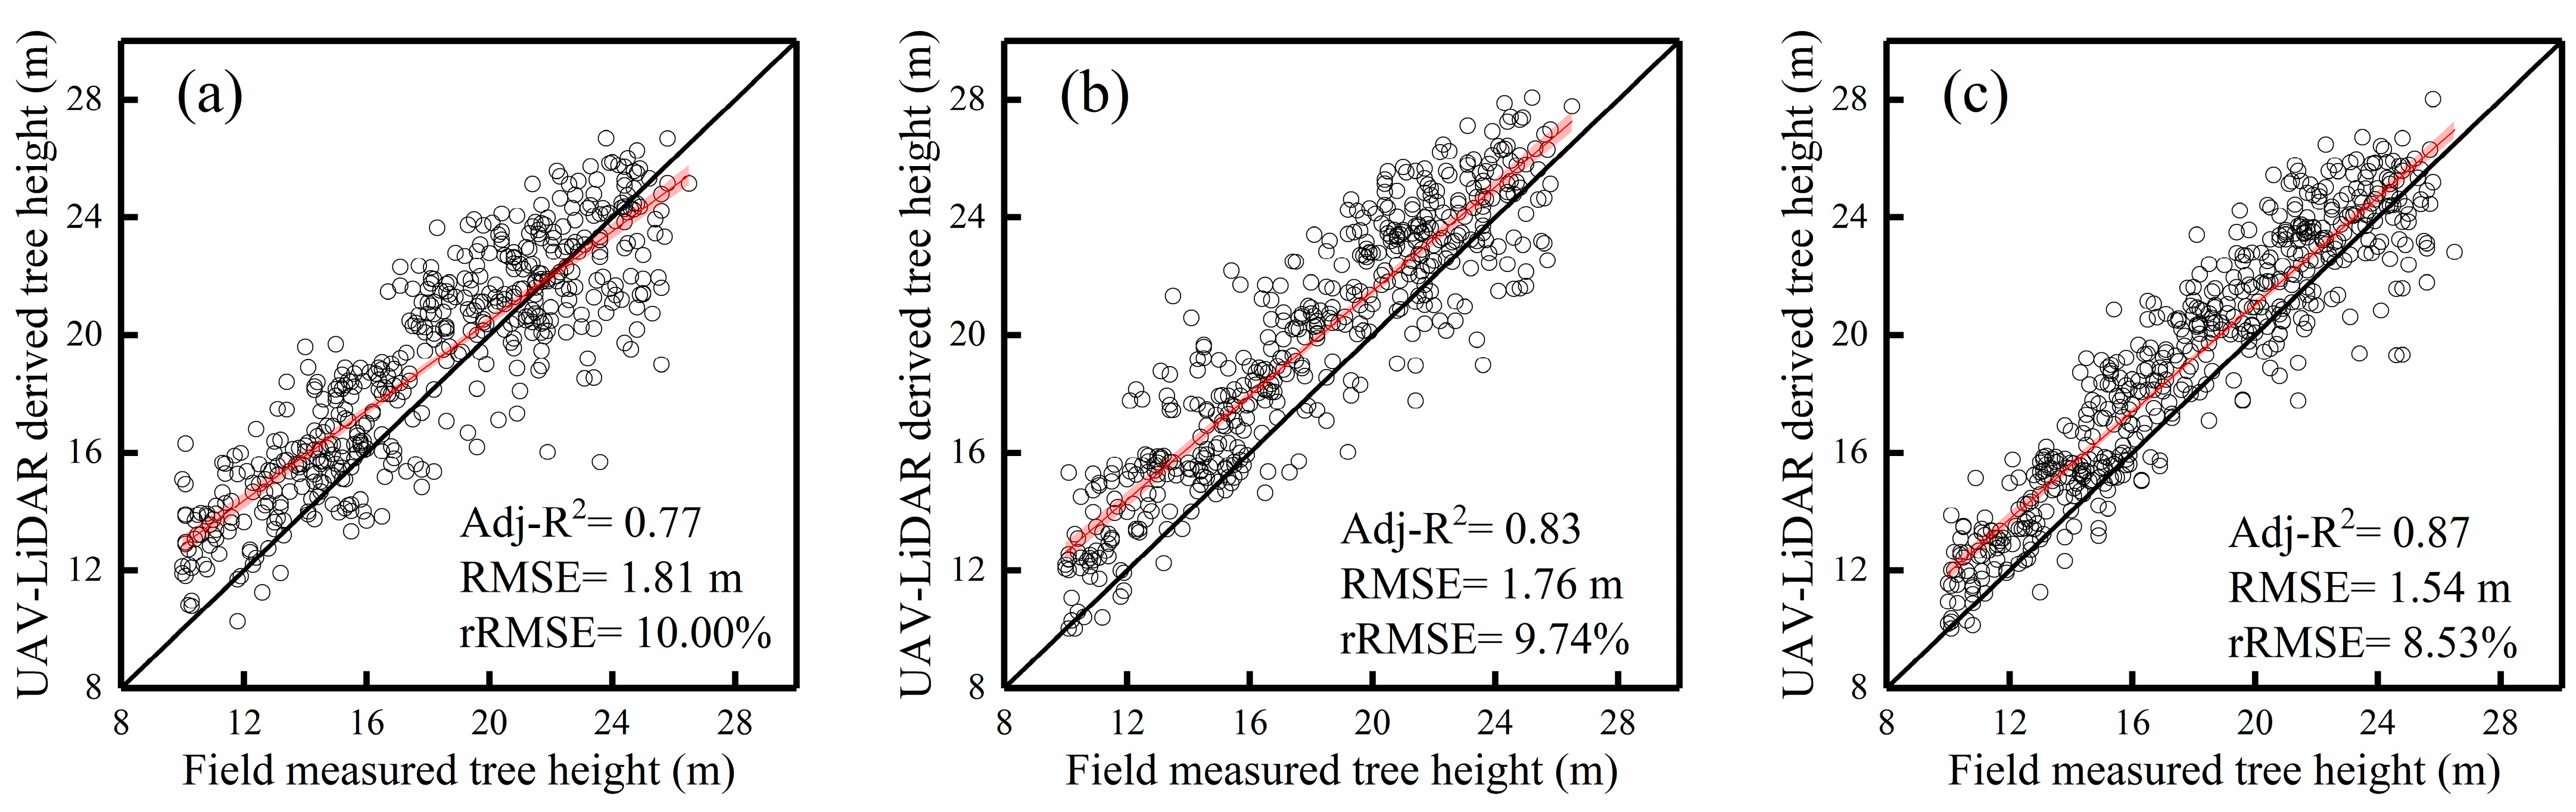
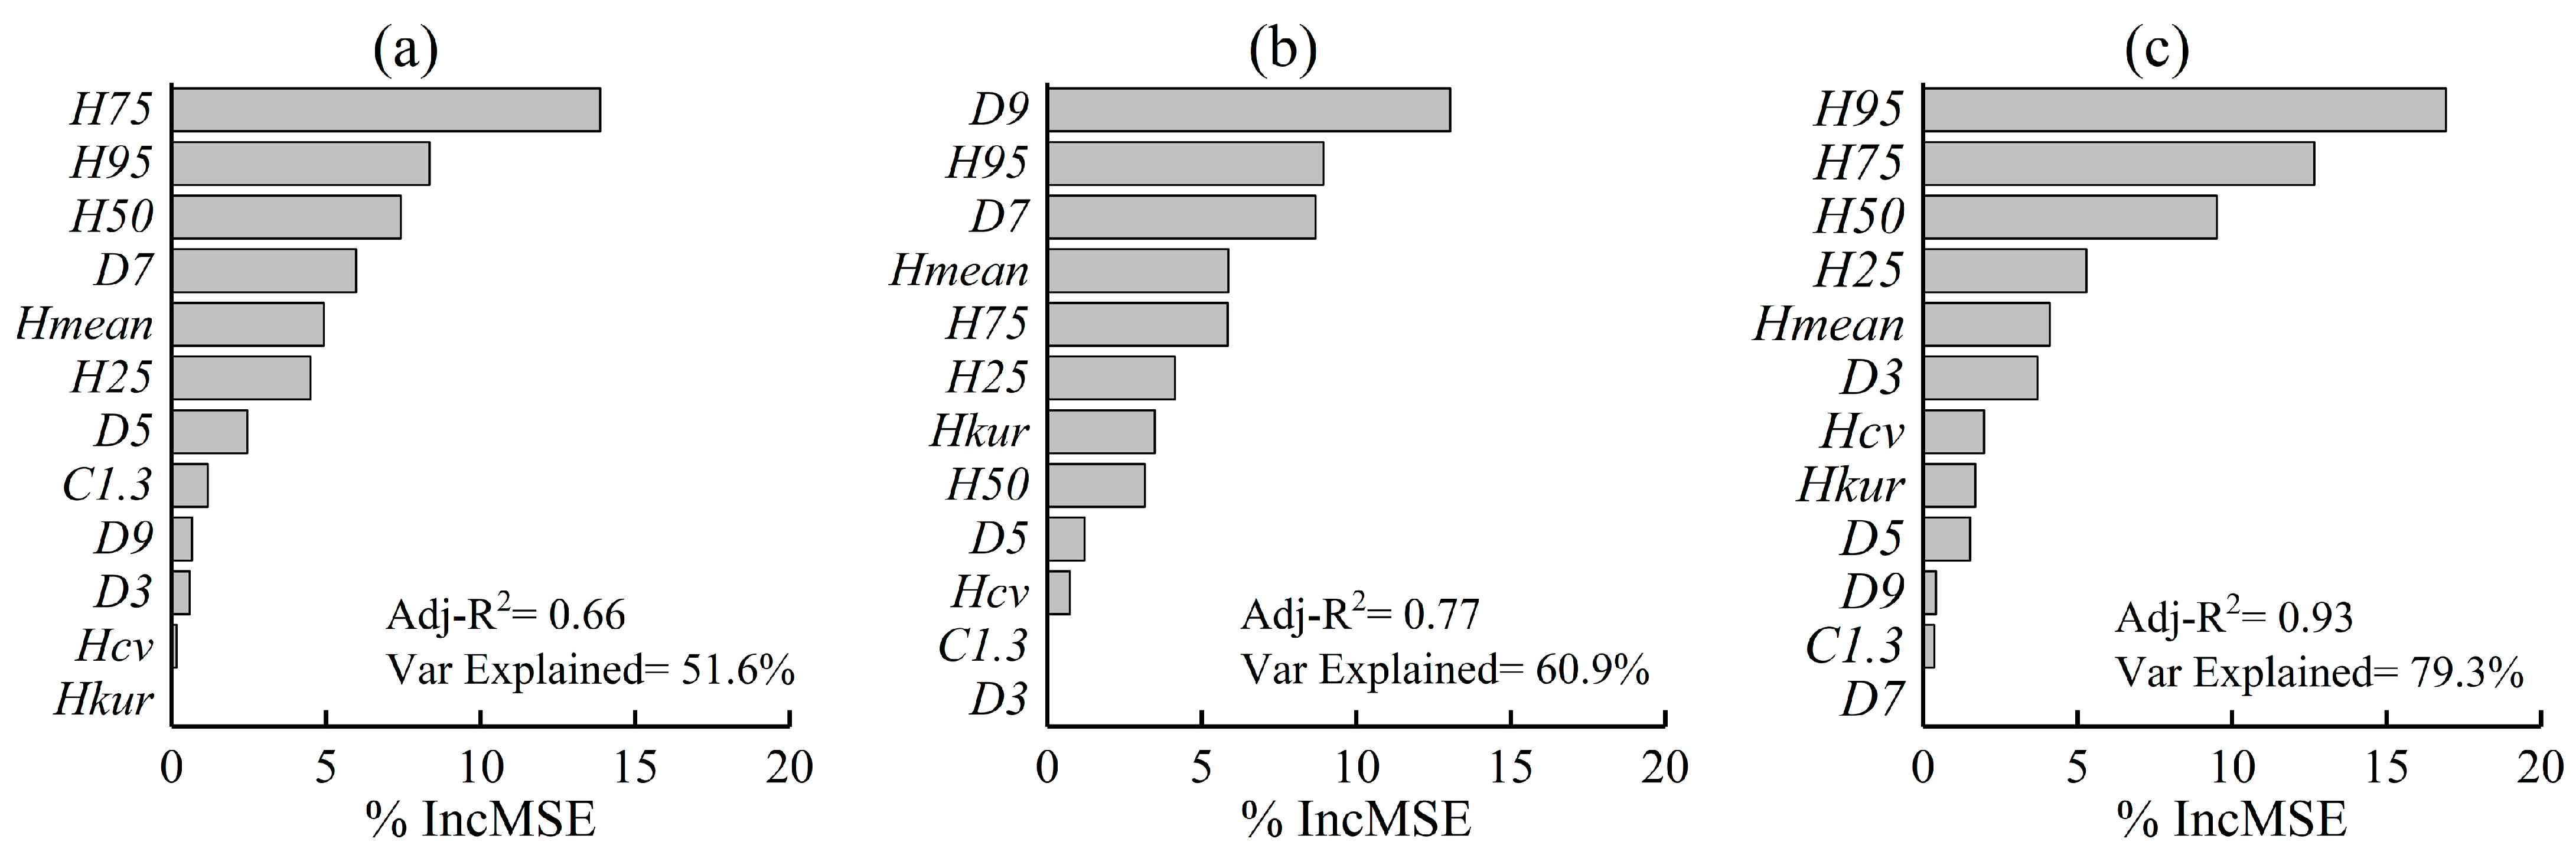
3.2. Estimation of Tree Height

The comparison of the field-measured tree height and estimated tree height based on the three UAV-LiDAR datasets with LSS algorithm is shown in Figure 5. The individual tree height estimated by FULD (Adj-R2 = 0.87, RMSE = 1.54 m, rRMSE = 8.53%) was better than OLD (Adj-R2 = 0.77, RMSE = 1.81 m, rRMSE = 10.00%) and LLD (Adj-R2 = 0.83, RMSE = 1.76 m, rRMSE = 9.74%). All the datasets showed overestimations of individual tree heights.
Figure 6 presents an accuracy assessment of models for the RF-based Lorey’s mean tree height estimation at plot level with different combinations of LiDAR metrics by the percentage increase in the mean-squared error (%IncMSE), Adj-R2 and Var Explained. The prediction accuracy based on the FULD was the highest (Adj-R2 = 0.93), followed by that of the LLD (Adj-R2 = 0.77), and the accuracy of the OLD was the lowest (Adj-R2 = 0.66). The performance of the LiDAR metrics for estimation of Lorey’s mean tree height was varied with datasets. The FULD was most influenced by H95 (%IncMSE = 16.92%), LLD was most controlled by D9 (%IncMSE = 13.04%), and OLD was most determined by H75 (%IncMSE = 13.87%). Overall, H95 was the most important variable in the RF-based Lorey’s mean tree height estimation (%IncMSE = 11.4), indicating that H95 is sensitive and informative for tree height estimation.

4. Discussion

4.1. ITS Accuracy

This study highlights that the FULD shows an excellent performance on ITS. The FULD robustly improved the accuracy of ITS in broadleaved deciduous forest in comparison with the performance of cloud data acquiring in mono-temporal condition. The performance of the FULD is better than the results of Koch et al. [20], Jing et al. [30] and Tochon et al. [31] (Table 5). Because FULD that captures at leaf-off and leaf-on conditions can provide abundant canopy structure information, it is more advantageous for ITS than point cloud dataset captured at mono-temporal condition [47]. It should be noted that this study was carried out in dense forests with a high average tree density (935.7 tree∙ha−1) and a high canopy coverage (94.8%), which could increase the difficulty of ITS [37]. High accuracies (not less than 80%) of ITS were easy to be achieved for a low density stand. In addition, the minimum tree DBH for field sampling for verification also influences the accuracy. As small trees are difficult to be detected, only recording bigger trees (ex. DBH is greater than 8 cm) in field surveys can enhance the verification accuracy. Considering that natural uneven-aged forests are widespread, it is necessary to cover a great range of the tree DBH for segmentation of the natural forests.
The performances of the three algorithms on the FULD were different in the four stand types. By using the watershed and PCS algorithms, FULD did not improve the accuracy of ITS in comparison with OLD or LLD, while a significant improvement was found by using the LSS algorithm in the three deciduous broadleaved tree-dominated stands. The key to the improvement in accuracy is whether the points below the canopy surface can be used for ITS. The watershed algorithm mainly uses crown surface information to detect individual trees based on CHM. The PCS algorithm is a top-to-bottom approach through identifying treetop to the lowest point [22]. As the two algorithms cannot effectively use the points from bole to treetop, their performance of ITS was not improved by FULD. The LSS algorithm slices the point cloud within a plot into multi-layers, and points of FULD from the bottom and the treetop can be used for ITS [25]. For natural uneven-aged stands, some trees are more likely to be undetected due to a larger possibility that they are shielded by neighboring taller trees with dominant crowns, leading to an under-segmentation [49]. The under-segmentation can be effectively mitigated by the LSS algorithm, especially for trees with a DBH < 16 cm (Figure 4a), and the recall was improved by 0.10 to 0.25. For natural broadleaved stands with irregularly shaped and interlocked tree crowns, LSS algorithm can identify a tree’s center by slicing its bole into multi-layers although the tree’s crown is not markedly above the stand canopy, which gives the LSS algorithm an advantage over the other algorithms [25]. Note that, the watershed algorithm and PCS algorithm can perform nearly as well as the LSS algorithm in even-aged conifer stands with a higher computational efficiency. The results suggest that selecting segmentation algorithms should take stand types and property of point cloud into consideration. LSS algorithm is recommended when abundant cloud data from bole to treetop are available in dense uneven-aged stands of broadleaved deciduous trees.
The ground measured positions of trees provide valuable information for a better understanding of how error is generated in segmentation. More than 60% of undetectable trees were small trees (here defined as DBH < 12 cm), mainly contributing to omission errors in natural uneven-aged stands, although the under-segmentation was mitigated to some degree by FULD. Because LiDAR struggles to penetrate canopy and to hit small trees [8], there are insufficient points reflected from small trees and point cloud cannot generate enough layers to assemble for generating seed points. These points from a small tree are likely to be segmented as a part of a neighboring tall tree. A possible and feasible resolution is increasing the point density of the leaf-off LiDAR dataset so that enough layers of bole can be generated for identifying the seed point of a small tree. However, the increases in point density should be weighed against the UAV-LiDAR scanning time and computational efficiency, because LSS computation time increases with point cloud density [25]. It might be suited for some specific research purposes, such as forest regeneration when a low omission is required. In addition, almost all of the commission errors were contributed by irregularly shaped tree crowns in natural stands, which are likely to be over-segmented. For example, the points from the irregular branch of a tree and a bush under the tree are likely to be over-segmented as a tree.
The reliable ITS has significant implications of forest ecology and management and an accurate estimation of AGB or biomass carbon stocks [8]. Based on ITS, AGB can be estimated at tree’s individual level [50,51,52]. Meanwhile, error in ITS would be transferred to AGB estimation. For example, tree density is easier to be underestimated by ITS, which can result in an underestimation of AGB. Compared with using the leaf-off or leaf-on UAV-LiDAR dataset solely, the underestimation was alleviated by FULD with an improvement of 2.6–10.0% in accuracy of estimation of AGB (data not shown). We recommend that the FULD should be used for ITS-based AGB estimation in dense deciduous forest.

4.2. Uncertainty of Tree Height Estimation

The accuracy of tree height estimation can be improved by FULD as well. Due to the advantage that can detect tree base and treetop efficiently, individual tree height can be estimated by FULD better than by OLD or LLD in the four stand types. Treetop cannot be detected well by OLD due to leafless branches, while ground cannot be detected well by LLD due to the dense understory. Both shortcomings are expected to lead to the under-estimation of tree height. Unexpectedly, significant over-estimations were found for OLD and LLD, although the over-estimations were alleviated by FULD. The possible reasons are as follow. First, although these trees were segmented correctly (only correctly segmented trees were included for tree height estimation), their treetops may be not identified well. For example, due to an irregular crown, high LiDAR points from a tall tree crown may be misclassified as a neighboring small tree, and the incorrect treetop can result in an over-estimation of height for the small tree. This situation may often happen in an uneven-aged stand due to overlapping tree crowns. Second, rugged terrain influences tree height estimation. Tree crowns tend to develop toward the slope direction to maximize their light interception, which results in stem inclination [53], and the DEM-based normalized point cloud might further lead to a systematic overestimation of tree height [54]. Khosravipour et al. [55] reported that the terrain effect on tree height estimation closely links to crown shape, which is species-dependent. The tree species are various in this study, and the effect on tree height estimation may be complex. Understanding how crown morphology affects UAV-LiDAR-based tree estimation would be interesting [55]. Finally, a possible uncertainty is from field measurement of tree height. In dense broadleaved forests, some treetops were difficult to be identified because of occlusion from branches and leaves [56,57]. The temporal difference (1 year) between field measured data and LiDAR data acquisition may also introduce error for tree height accuracy assessment. Considering the short temporal difference and the growth of temperate forest, this error may be expected to be small.

5. Conclusions

We used a new UAV-LiDAR dataset that fused leaf-off and leaf-on point cloud datasets to detect individual trees and to estimate tree height in dense deciduous stands that we consider to be challenging. Compared with segmentation using the leaf-on UAV-LiDAR dataset solely, the FULD correctly segmented 16.7% more trees in the dense stands dominated by broadleaved deciduous trees and 4.4% more trees in the coniferous stands. The improvements are attributed to abundant points from the bole to the treetop of FULD, which can be included for segmentation by the LSS algorithm. The segmentation performance depends on stand characteristics and tree size. Undetectable small trees are the main error source, although their detection rate are improved to some degree by FULD. Increasing the scanning point density at leaf-off condition should be a possible and feasible resolution to detect small trees better. The FULD, promoted by the LSS algorithm, appears to be well suited for ITS and tree height estimation in dense deciduous broadleaved stands and forest ecology research or inventory, in which a high accuracy is required. These findings provide useful insights to guide the application of FULD when more multi-temporal LiDAR data are used for estimation of stand structure.

Author Contributions

Conceptualization, J.Z.; data curation, Q.C.; formal analysis, Q.C.; investigation, Q.C., T.G., D.L. and F.Y.; methodology, Q.C. and T.G.; project administration, J.Z., T.G. and F.W.; resources, J.Z., T.G. and X.L.; writing—original draft, Q.C. and T.G.; writing—review and editing, J.Z. and T.G. All authors have read and agreed to the published version of the manuscript.

Funding

This research was funded by National Natural Science Foundation of China (32192435, 31870533), Application and Demonstration Project of Network Security and Informatization Technology, Chinese Academy of Sciences (CAS-WX2021PY-0108), Strategic Priority Research Program of the Chinese Academy of Sciences (XDA19030204), and National Forestry and Grassland Administration independent RESEARCH and Development Program “Research and Demonstration Application of Key Technologies for Forest Resources Investigation and Monitoring coupled with Aerial and Backpack LiDAR” (LC-1-01).

Data Availability Statement

The data are available with the permission of the corresponding author.

Acknowledgments

We thank the Green Valley International company assisted with UAV-LiDAR data collection.

Conflicts of Interest

The authors declare no conflict of interest.

References

  1. Wolf, J.A.; Fricker, G.A.; Meyer, V.; Hubbell, S.P.; Gillespie, T.W.; Saatchi, S.S. Plant Species Richness is Associated with Canopy Height and Topography in a Neotropical Forest. Remote Sens. 2012, 4, 4010–4021. [Google Scholar] [CrossRef] [Green Version]
  2. Yu, X.; Huang, B.; Zhou, Z.; Tang, J.; Yu, Y. Involvement of Caspase3 in the Acute Stress Response to High Temperature and Elevated Ammonium in Stony Coral Pocillopora Damicornis. Gene 2017, 637, 108–114. [Google Scholar] [CrossRef] [PubMed]
  3. Ayrey, E.; Hayes, D.J.; Fraver, S.; Kershaw, J.A.; Weiskittel, A.R. Ecologically-Based Metrics for Assessing Structure in Developing Area-Based, Enhanced Forest Inventories from LiDAR. Can. J. Remote Sens. 2019, 45, 88–112. [Google Scholar] [CrossRef]
  4. Zhao, Y.; Ma, Y.; Quqckenbush, L.J.; Zhen, Z. Estimation of Individual Tree Biomass in Natural Secondary Forests Based on ALS Data and WorldView-3 Imagery. Remote Sens. 2022, 14, 1305–1311. [Google Scholar] [CrossRef]
  5. Lu, D.; Zhu, J.; Wu, D.; Chen, Q.; Yu, Y.; Wang, J.; Zhu, C.; Liu, H.; Gao, T.; Wang, G.G. Detecting dynamics and variations of crown asymmetry induced by natural gaps in a temperate secondary forest using terrestrial laser scanning. For. Ecol. Manag. 2020, 473, 118289. [Google Scholar] [CrossRef]
  6. Yu, Y.; Gao, T.; Zhu, J.; Wei, X.; Guo, Q.; Su, Y.; Li, Y.; Deng, S.; Li, M. Terrestrial Laser Scanning-Derived Canopy Interception Index for Predicting Rainfall Interception. Ecohydrology 2020, 13, e2212. [Google Scholar] [CrossRef]
  7. Itakura, K.; Hosoi, F. Automatic Individual Tree Detection and Canopy Segmentation from Three-Dimensional Point Cloud Images Obtained from Ground-Based Lidar. J. Agric. Meteorol. 2018, 74, 109–113. [Google Scholar] [CrossRef] [Green Version]
  8. Lu, X.; Guo, Q.; Li, W.; Flanagan, J. A Bottom-up Approach to Segment Individual Deciduous Trees Using Leaf-off Lidar Point Cloud Data. ISPRS J. Photogramm. Remote Sens. 2014, 94, 1–12. [Google Scholar] [CrossRef]
  9. Ardila, J.P.; Bijker, W.; Tolpekin, V.A.; Stein, A. Context-Sensitive Extraction of Tree Crown Objects in Urban Areas Using VHR Satellite Images. Int. J. Appl. Earth Obs. Geoinf. 2012, 15, 57–69. [Google Scholar] [CrossRef] [Green Version]
  10. Song, C.; Dickinson, M.B.; Su, L.; Zhang, S.; Yaussey, D. Estimating Average Tree Crown Size Using Spatial Information from Ikonos and QuickBird Images: Across-Sensor and Across-Site Comparisons. Remote Sens. Environ. 2010, 114, 1099–1107. [Google Scholar] [CrossRef]
  11. Gong, P.; Sheng, Y.; Biging, G.S. 3D Model-Based Tree Measurement from High-Resolution Aerial Imagery. Photogramm. Eng. Remote Sens. 2002, 68, 1203–1212. [Google Scholar]
  12. Rahman, M.F.; Onoda, Y.; Kitajima, K. Forest canopy height variation in relation to topography and forest types in central Japan with LiDAR. For. Ecol. Manag. 2022, 503, 199792. [Google Scholar] [CrossRef]
  13. Yang, J.; Kang, Z.; Cheng, S.; Yang, Z.; Akwensi, P.H. An Individual Tree Segmentation Method Based on Watershed Algorithm and Three-Dimensional Spatial Distribution Analysis From Airborne LiDAR Point Clouds. IEEE J. Sel. Top Appl. Earth Obs. Remote Sens. 2020, 13, 1055–1067. [Google Scholar] [CrossRef]
  14. Chen, W.; Xiang, H.; Moriya, K. Individual Tree Position Extraction and Structural Parameter Retrieval Based on Airborne LiDAR Data: Performance Evaluation and Comparison of Four Algorithms. Remote Sens. 2020, 12, 571. [Google Scholar] [CrossRef] [Green Version]
  15. Chen, Q.; Baldocchi, D.; Gong, P.; Kelly, M. Isolating Individual Trees in a Savanna Woodland Using Small Footprint Lidar Data. Photogramm. Eng. Remote Sens. 2006, 72, 923–932. [Google Scholar] [CrossRef] [Green Version]
  16. Ene, L.; Naesset, E.; Gobakken, T. Single Tree Detection in Heterogeneous Boreal Forests Using Airborne Laser Scanning and Area-Based Stem Number Estimates. Int. J. Remote Sens. 2012, 33, 5171–5193. [Google Scholar] [CrossRef]
  17. Hyyppa, J.; Kelle, O.; Lehikoinen, M.; Inkinen, M. A Segmentation-Based Method to Retrieve Stem Volume Estimates from 3-D Tree Height Models Produced by Laser Scanners. Int. J. Remote Sens. 2001, 39, 969–975. [Google Scholar] [CrossRef]
  18. Zhen, Z.; Quackenbush, L.J.; Zhang, L. Impact of Tree-Oriented Growth Order in Marker-Controlled Region Growing for Individual Tree Crown Delineation Using Airborne Laser Scanner (ALS) Data. Remote Sens. 2014, 6, 555–579. [Google Scholar] [CrossRef] [Green Version]
  19. Hamraz, H.; Contreras, M.A.; Zhang, J. A Robust Approach for Tree Segmentation in Deciduous Forests Using Small-Footprint Airborne LiDAR Data. Int. J. Appl. Earth Obs. Geoinf. 2016, 52, 532–541. [Google Scholar] [CrossRef] [Green Version]
  20. Koch, B.; Heyder, U.; Weinacker, H. Detection of Individual Tree Crowns in Airborne Lidar Data. Photogramm. Eng. Remote Sens. 2006, 72, 357–363. [Google Scholar] [CrossRef] [Green Version]
  21. Guo, Q.; Li, W.; Yu, H.; Alvarez, O. Effects of Topographic Variability and Lidar Sampling Density on Several DEM Interpolation Methods. Photogramm. Eng. Remote Sens. 2010, 76, 701–712. [Google Scholar] [CrossRef] [Green Version]
  22. Li, W.; Guo, Q.; Jakubowski, M.K.; Kelly, M. A New Method for Segmenting Individual Trees from the Lidar Point Cloud. Photogramm. Eng. Remote Sens. 2012, 78, 75–84. [Google Scholar] [CrossRef] [Green Version]
  23. Jakubowski, M.K.; Li, W.; Guo, Q.; Kelly, M. Delineating Individual Trees from Lidar Data: A Comparison of Vector- and Raster-based Segmentation Approaches. Remote Sens. 2013, 5, 4163–4186. [Google Scholar] [CrossRef] [Green Version]
  24. Reitberger, J.; Schnoerr, C.; Krzystek, P.; Stilla, U. 3D Segmentation of Single Trees Exploiting Full Waveform LIDAR Data. ISPRS J. Photogramm. Remote Sens. 2009, 64, 561–574. [Google Scholar] [CrossRef]
  25. Ayrey, E.; Fraver, S.; Kershaw, J.A.; Kenefic, L.S.; Hayes, D.; Weiskittel, A.R.; Roth, B.E. Layer Stacking: A Novel Algorithm for Individual Forest Tree Segmentation from LiDAR Point Clouds. Can. J. Remote Sens. 2017, 43, 16–27. [Google Scholar] [CrossRef]
  26. Barnes, C.; Balzter, H.; Barrett, K.; Eddy, J.; Milner, S.; Suárez, J. Individual Tree Crown Delineation from Airborne Laser Scanning for Diseased Larch Forest Stands. Remote Sens. 2017, 9, 231. [Google Scholar] [CrossRef] [Green Version]
  27. Dai, W.; Yang, B.; Dong, Z.; Shaker, A. A New Method for 3D Individual Tree Extraction Using Multispectral Airborne LiDAR Point Clouds. ISPRS J. Photogramm. Remote Sens. 2018, 144, 400–411. [Google Scholar] [CrossRef]
  28. Wu, X.; Shen, X.; Cao, L.; Wang, G.; Cao, F. Assessment of Individual Tree Detection and Canopy Cover Estimation Using Unmanned Aerial Vehicle based Light Detection and Ranging (UAV-LiDAR) Data in Planted Forests. Remote Sens. 2019, 11, 908. [Google Scholar] [CrossRef] [Green Version]
  29. Duncanson, L.I.; Cook, B.D.; Hurtt, G.C.; Dubayah, R.O. An Efficient, Multi-Layered Crown Delineation Algorithm for Mapping Individual Tree Structure Across Multiple Ecosystems. Remote Sens. Environ. 2014, 154, 378–386. [Google Scholar] [CrossRef]
  30. Jing, L.; Hu, B.; Li, J.; Noland, T. Automated Delineation of Individual Tree Crowns from Lidar Data by Multi-Scale Analysis and Segmentation. Photogramm. Eng. Remote Sens. 2012, 78, 1275–1284. [Google Scholar] [CrossRef]
  31. Tochon, G.; Feret, J.B.; Valero, S.; Martin, R.E.; Knapp, D.E.; Salembier, P.; Chanussot, J.; Asner, G.P. On the Use of Binary Partition Trees for The Tree Crown Segmentation of Tropical Rainforest Hyperspectral Images. Remote Sens. Environ. 2015, 159, 318–331. [Google Scholar] [CrossRef] [Green Version]
  32. Nuijten, R.J.G.; Coops, N.C.; Goodbody, T.R.H.; Pelletier, G. Examining the Multi-Seasonal Consistency of Individual Tree Segmentation on Deciduous Stands Using Digital Aerial Photogrammetry (DAP) and Unmanned Aerial Systems (UAS). Remote Sens. 2019, 11, 739. [Google Scholar] [CrossRef] [Green Version]
  33. Yan, Q.; Gang, Q.; Zhu, J. Size-Dependent Patterns of Seed Rain in Gaps in Temperate Secondary Forests, Northeast China. Forests 2019, 10, 123. [Google Scholar] [CrossRef] [Green Version]
  34. Zhu, J.; Mao, Z.; Hu, L.; Zhang, J. Plant Diversity of Secondary Forests in Response to Anthropogenic Disturbance Levels in Montane Regions of Northeastern China. J. For. Res. 2007, 12, 403–416. [Google Scholar] [CrossRef]
  35. Smith, A.M.S.; Falkowski, M.J.; Hudak, A.T.; Evans, J.S.; Robinson, A.P.; Steele, C.M. A Cross-Comparison of Field, Spectral, and Lidar Estimates of Forest Canopy Cover. Can. J. Remote Sens. 2009, 35, 447–459. [Google Scholar] [CrossRef]
  36. Lee, H.; Slatton, K.C.; Roth, B.E.; Cropper, W.P., Jr. Adaptive Clustering of Airborne LiDAR Data to Segment Individual Tree Crowns in Managed Pine Forests. Int. J. Remote Sens. 2010, 31, 117–139. [Google Scholar] [CrossRef]
  37. Yang, Q.; Su, Y.; Jin, S.; Kelly, M.; Hu, T.; Ma, Q.; Li, Y.; Song, S.; Zhang, J.; Xu, G.; et al. The Influence of Vegetation Characteristics on Individual Tree Segmentation Methods with Airborne LiDAR Data. Remote Sens. 2019, 11, 2880. [Google Scholar] [CrossRef] [Green Version]
  38. Mesev, V. Morphological Image Analysis: Principles and Applications. Environ. Plann. B-Plann. Des. 2001, 28, 800–801. [Google Scholar]
  39. Pitkänen, J.; Maltamo, M.; Hyyppä, J.; Yu, X. Adaptive Methods for Individual Tree Detection on Airborne Laser Based Canopy Height Model. Int. Arch. Photogram. Remote Sens. Spat. Inf. Sci. 2004, 36, 187–191. [Google Scholar]
  40. Cao, L.; Liu, K.; Shen, X.; Wu, X.; Liu, H. Estimation of Forest Structural Parameters Using UAV-LiDAR Data and a Process-Based Model in Ginkgo Planted Forests. IEEE J. Sel. Top Appl. Earth Obs. Remote Sens. 2019, 12, 4175–4190. [Google Scholar] [CrossRef]
  41. Næsset, E.; Gobakken, T. Estimating Forest Growth Using Canopy Metrics Derived from Airborne Laser Scanner Data. Remote Sens. Environ. 2005, 96, 453–465. [Google Scholar] [CrossRef]
  42. Liaw, A.; Wiener, M. Classification and Regression by Randomforest. R News 2002, 2, 18–22. [Google Scholar]
  43. Nevalainen, O.; Honkavaara, E.; Tuominen, S.; Viljanen, N.; Hakala, T.; Yu, X.; Hyyppä, J.; Saari, H.; Pölönen, I.; Imai, N.; et al. Individual Tree Detection and Classification with UAV-Based Photogrammetric Point Clouds and Hyperspectral Imaging. Remote Sens. 2017, 9, 185. [Google Scholar] [CrossRef] [Green Version]
  44. Ahongshangbam, J.; Roell, A.; Ellsaesser, F.; Hendrayanto; Hoelscher, D. Airborne Tree Crown Detection for Predicting Spatial Heterogeneity of Canopy Transpiration in a Tropical Rainforest. Remote Sens. 2020, 12, 651. [Google Scholar] [CrossRef] [Green Version]
  45. Goutte, C.; Gaussier, E. A Probabilistic Interpretation of Precision, Recall and F-score, with Implication for Evaluation. In Advances in Information Retrieval; Losada, D.E., FernandezLuna, J.M., Eds.; Springer: Berlin/Heidelberg, Germany, 2005; Volume 3408, pp. 345–359. [Google Scholar]
  46. Sokolova, M.; Japkowicz, N.; Szpakowicz, S. Beyond Accuracy, F-Score and ROC: A Family of Discriminant Measures for Performance Evaluation. In Ai 2006: Advances in Artificial Intelligence, Proceedings; Sattar, A., Kang, B.H., Eds.; Springer: Berlin/Heidelberg, Germany, 2006; Volume 4304, pp. 1015–1021. [Google Scholar]
  47. Hill, R.A.; Broughton, R.K. Mapping the Understorey of Deciduous Woodland from Leaf-on and Leaf-off Airborne LiDAR Data: A Case Study in Lowland Britain. ISPRS J. Photogramm. Remote Sens. 2009, 64, 223–233. [Google Scholar] [CrossRef]
  48. Smits, I.; Prieditis, G.; Dagis, S.; Dubrovskis, D. Individual Tree Identification Using Different LIDAR and Optical Imagery Data Processing Methods. Biosyst. Inf. Technol. 2012, 1, 19–24. [Google Scholar] [CrossRef]
  49. Magnussen, S.; Eggermont, P.; LaRiccia, V.N. Recovering Tree Heights from Airborne Laser Scanner Data. For. Sci. 1999, 45, 407–422. [Google Scholar]
  50. Bazezew, M.N.; Hussin, Y.A.; Kloosterman, E.H. Integrating Airborne LiDAR and Terrestrial Laser Scanner Forest Parameters for Accurate Above-Ground Biomass/Carbon Estimation in Ayer Hitam Tropical Forest, Malaysia. Int. J. Appl. Earth Obs. Geoinf. 2018, 73, 638–652. [Google Scholar] [CrossRef]
  51. Lu, J.; Wang, H.; Qin, S.; Cao, L.; Pu, R.; Li, G.; Sun, J. Estimation of Aboveground Biomass of Robinia Pseudoacacia Forest in The Yellow River Delta Based on UAV and Backpack LiDAR Point Clouds. Int. J. Appl. Earth Obs. Geoinf. 2020, 86, 102014. [Google Scholar] [CrossRef]
  52. Zhao, K.; Popescu, S.; Nelson, R. Lidar Remote Sensing of Forest Biomass: A Scale-Invariant Estimation Approach Using Airborne Lasers. Remote Sens. Environ. 2009, 113, 182–196. [Google Scholar] [CrossRef]
  53. Lang, A.C.; Hardtle, W.; Bruelheide, H.; Geissler, C.; Nadrowski, K.; Schuldt, A.; Yu, M.J.; von Oheimb, G. Tree Morphology Responds to Neighbourhood Competition and Slope in Species-Rich Forests of Subtropical China. For. Ecol. Manag. 2010, 260, 1708–1715. [Google Scholar] [CrossRef]
  54. Vega, C.; Durrieu, S. Multi-Level Filtering Segmentation to Measure Individual Tree Parameters Based on Lidar Data: Application to A Mountainous Forest with Heterogeneous Stands. Int. J. Appl. Earth Obs. Geoinf. 2011, 13, 646–656. [Google Scholar] [CrossRef] [Green Version]
  55. Khosravipour, A.; Skidmore, A.K.; Wang, T.; Isenburg, M.; Khoshelham, K. Effect of Slope on Treetop Detection Using A LiDAR Canopy Height Model. ISPRS J. Photogrammetry Remote Sens. 2015, 104, 44–52. [Google Scholar] [CrossRef]
  56. Andersen, H.E.; Reutebuch, S.E.; McGaughey, R.J. A Rigorous Assessment of Tree Height Measurements Obtained Using Airborne Lidar and Conventional Field Methods. Can. J. Remote Sens. 2006, 32, 355–366. [Google Scholar] [CrossRef]
  57. Itakura, K.; Kamakura, I.; Hosoi, F. Calculation of Moving Distance when Measuring Tree Height Using Portable Scanning Lidar and Tree Height Measurement by Using Registration of Images Obtained on the Ground and High Places. Eco-Engineering 2018, 30, 7–14. [Google Scholar] [CrossRef]
Figure 1. The study area and distribution of plots.
Remotesensing 14 02787 g001
Figure 2. Workflow for data processing and analysis in this study. LPF, larch plantation forest; MBF, mixed broadleaved forest; MBCF, mixed broadleaf-conifer forest; MOF, Mongolian oak forest; PCS: Point cloud segmentation; LSS: Layer stacking segmentation.
Remotesensing 14 02787 g002
Figure 3. Accuracy comparison of the three datasets in different forest types. (a) Watershed algorithm; (b) PCS algorithm; (c) LSS algorithm. Different lowercase letters indicate significance among different UAV-LiDAR datasets at p < 0.05 level.
Remotesensing 14 02787 g003
Figure 4. The performance of layer stacking segmentation algorithm on the leaf-off LiDAR dataset, leaf-on LiDAR dataset and the fused LiDAR dataset along a DBH gradient. (a) Recall; (b) Precision; (c) F-score.
Remotesensing 14 02787 g004
Figure 5. Comparison of the field-measured tree heights (tree height ≥ 10 m) and estimated individual tree heights from leaf-off dataset (507 trees). (a), leaf-on dataset (481 trees) (b), and the fused dataset (537 trees) (c). Black and red solid lines are the 1:1 and regression lines, respectively.
Remotesensing 14 02787 g005
Figure 6. Variable importance and accuracy assessment of random forest-based estimation of Lorey’s mean tree height. (a) leaf-off dataset; (b) leaf-on dataset; (c) the fused dataset.
Remotesensing 14 02787 g006
Table 1. General description of the study plots.
Forest
Type
Number of PlotsLorey’s Height (m)DBH (cm)Stem Density (Tree·ha−1)Stem Density in the Dominant Canopy (Tree·ha−1)
MBF619.8 ± 2.216.9 ± 1.3841.7 ± 269.7483.3 ± 128.4
MOF514.8 ± 1.714.6 ± 1.51060 ± 60.2800 ± 35.0
MBCF *821.8 ± 0.819.1 ± 1.2843.8 ± 172.0579.2 ± 153.2
LPF620.7 ± 2.019.1 ± 2.3997.2 ± 317.6952.8 ± 320.2
MBF, mixed broadleaved forest; MOF, Mongolian oak forest; MBCF, mixed broadleaf-conifer forest; LPF, larch plantation forest; * The proportions of basal area of conifer tree species and broadleaf ratio of MBCF are 42.0% ± 23.1% and 58.0% ± 23.1%, respectively.
Table 2. LiDAR acquisition and sensor specifications from leaf-off and leaf-on datasets.
AttributeLeaf-Off DatasetLeaf-On Dataset
Acquisition date15 April 201822 August 2018
Scan sensorRiegl VUX-1LRRiegl VUX-1LR
Flight altitude (m asl)300300
Flight speed (m∙s−1)3.63.6
Maximum effective measurement rate (pts∙s−1)750,000500,000
Footprint (cm)2525
Side overlap (%)3030
Average point density (pts∙m−2)110280
Maximum field of view angle (°)330330
Absolute accuracy (mm)±50±50
Table 3. Description of metrics derived from the three UAV-LiDAR datasets.
MetricsDescription
Height-basedHeight percentiles (H25, H50, H75, H95)The percentiles of the canopy height distributions
(25th, 50th, 75th and 95th) above 2 m.
Mean height (Hmean)The mean height of all points after normalized.
Coefficient of variation of heights (Hcv)Coefficient of variation of heights of non-ground LiDAR returns above 2 m.
Kurtosis height (Hkur)The kurtosis of the heights of all points.
Density-basedCanopy return density (D3, D5, D7, D9)The proportion of points above the height percentiles (30th, 50th, 70th and 90th).
Canopy volumeCanopy cover above 1.3 m (C1.3 m)Percentages of LiDAR returns above 1.3 m.
Table 4. Performance of tree segmentations by LLS algorithm on the filed plots.
Forest TypeField Plot Density (Tree∙ha−1)Number of Field Surveyed Trees Number of Segmented Trees *Leaf-Off DatasetLeaf-On DatasetThe Fused Dataset
TPFPFNTPFPFNTPFPFN
LPF6333835/38/36305833553246
12507468/70/6758101660101458916
9335651/46/58438134151547119
13838375/75/8467816696147598
MBF11677076/73/63463024452825491421
10336250/54/54371325371725421220
7174337/39/4826111726131734149
MBCF7504542/41/4930121528131736139
8174941/49/49301119301919351414
7674646/45/44311515301516331113
MOF10836549/58/58361329382027431522
9675844/44/49311327331125391019
11006649/48/53361330351331421124
11336857/51/57381930361532431425
10176143/49/5034927341527381223
TP: True positive; FN: False negative; FP: False positive. * The three numbers indicate the numbers of segmented trees by leaf-off dataset, leaf-on dataset and the fused dataset, respectively.
Table 5. Comparison of performance of individual tree segmentation using airborne-LiDAR.
ReferenceForest TypeStem Density (Tree·ha−1)Segmentation AlgorithmAccuracy (%)Evaluation Method
Koch et al. (2006) [20]Conifer, broadleaved457Watershed61.7Manual to automated recognition accuracy
Jing et al. (2012) [30]Conifer, broadleaved398Watershed69.0Commission, omission
Smits et al. (2012) [48]Conifer, broadleaved560Local maxima87.5Detection
Ayrey et al. (2017) [25]Conifer, broadleaved737Layer stacking segmentation72.0Detection, commission, omission
Tochon et al. (2015) [31]Conifer, broadleaved--Watershed69.9Detection, under-segmentation, over-segmentation, miss
Lu et al. (2014) [8]Broadleaved238Bottom-up region growing84.0F-score
Yang et al. (2019) [37]Conifer, broadleaved330Watershed, Point cloud segmentation, Layer stacking segmentation75.5F-score
Wu et al. (2019) [28]Broadleaved561Watershed, Point cloud segmentation, Polynomial fitting80.3F-score
Dai et al. (2018) [27]Broadleaved436Mean shift segmentation82.5Detection rate
Publisher’s Note: MDPI stays neutral with regard to jurisdictional claims in published maps and institutional affiliations.

