
An Investigation on Super- and Sub-Terminal Drops in Two Different Rain Categories and Climate Regimes


1
Department of Astronomy, Astrophysics and Space Engineering, Indian Institute of Technology, Indore 452020, India
2
Department of Physics and Astronomy “Augusto Righi”, Alma Mater Studiorum University of Bologna, 40127 Bologna, Italy
*
Author to whom correspondence should be addressed.
Remote Sens. 2022, 14(11), 2515; https://doi.org/10.3390/rs14112515
Submission received: 22 April 2022
/
Revised: 20 May 2022
/
Accepted: 22 May 2022
/
Published: 24 May 2022
(This article belongs to the Special Issue New Developments in Remote Sensing for the Environment)
Abstract
:The pressing need for accurate and reliable precipitation measurements and forecasting poses theoretical and technological problems. Remote-sensing instruments with increased coverage and sensitivity (such as space-borne and ground-based radar) are available; however, their full exploitation requires physical calibration and validation based on a deep knowledge of precipitation microphysics. This study reports a detailed analysis of the evidence of non-terminal velocities in a mid-latitude (Bologna, Italy) and a tropical location (Kolkata, India). The data from two identical disdrometers OTT-Parsivel2 were analyzed to shed light on the nature of the raindrops that fall at a velocity that is significantly higher (i.e., super-terminal drops) or lower (sub-terminal drops) than the terminal velocity expected for the raindrop sizes. The results show a significant fraction of super- and sub-terminal drops in both locations. The percentages of both super- and sub-terminal drops were higher in Kolkata. However, the difference was more notable for convective rain. The percentages of both super- and sub-terminal drops were found to be high within a drop diameter of 1 mm. The number of sub-terminal drops seemed to increase with an increase in diameter for drops larger than ~2.5 mm. The natural rain in Bologna showed stronger evidence of drop break-up in correspondence with the evolution of non-terminal velocities. Moreover, this study once again pointed toward the fact that the process of break-up cannot be neglected in natural rain of tropical or mid-latitude locations. We found that 7% and 10% of rain samples in Bologna and Kolkata seemed to be subjected to drop break-up. The results indicate that radar measurements of rain in the tropics or mid-latitude regions, relying on the Gunn–Kinzer relationship between velocity and diameter, should be verified by observations of disdrometers for a high precision QPE.
1. Introduction
One of the major challenges in operational meteorology and its applications is to provide accurate and reliable measurements of the precipitation rate and precipitation characteristics at different spatial and temporal scales, which are of interest for several disciplines, such as climatology, hydrology, agriculture, soil science, water management and the prevention and mitigation of hydrogeological disasters.
In this respect, ground-based rain gauges fail to provide measurements with the required frequency, spatial density and coverage, especially in places with unfavorable topography [1]. On the other hand, ground-based weather radars provide spatially and temporally continuous, quantitatively reliable precipitation fields [2], especially if organized in networks [3], which can also be assimilated into numerical weather prediction models to improve performances [4].
However, radar-based Quantitative Precipitation Estimation (QPE) is challenging due to uncertainties associated with the true rain Drop Size Distribution (DSD) and also due to spatiotemporal variation of rain microphysics [5].
Two significant technological advancements emerged in the last decade to substantially upgrade the QPE capabilities: a wider spread of new disdrometric measurements and the exploitation of precipitation-focused satellite missions. The recent availability of limited-cost disdrometers boosted the interest in precipitation microphysics for both theoretical and application studies [6,7,8], making available datasets acquired in dedicated experimental campaigns directly devoted to the calibration of remote sensing algorithms [9] and even in nearly operational regional networks [10].
Precipitation-focused satellite missions, such as the Tropical Rainfall Measurement Mission [11] and the Global Precipitation Measurement [12], make available radar observations from space, increasing the chance of: (1) high-quality precipitation monitoring over the global ocean [13]; (2) passive microwave sensor calibration for high-resolution algorithms [14]. High-resolution, high-quality, near-real-time, global operational products are available directly from GPM [15] and other entities [16,17] and are widely used by a growing community [18].
Since a radar detects the power backscattered by falling raindrops (i.e., reflectivity), the accuracy of the rainfall estimation depends, among others, on the relation between the measured reflectivity and rainfall rate, which is strongly related to the rain microphysical structure, that disdrometric measurements can infer. Raindrops, having a wide range of diameters from some hundreds of micrometers to some millimeters, fall with different terminal velocities due to gravitational pull, buoyancy and air resistance.
Their fall speed is strictly related to the drop size; however, the knowledge of a theoretical form of the relationship linking fall speed and size is hindered by the complex interplay between falling drops and turbulent air fluxes. Experimental studies provided empirical velocity-diameter (V-D) relationships, making the measurement of the drop fall speed a valuable proxy to infer the drop size. However, the large spatiotemporal variability of rain microphysics makes the statistical studies of rain DSD crucial for different locations, rain types and climates [19].
Even though there are instruments capable of measuring the raindrop velocity and diameter separately (i.e., laser/optical devices), a large class of widely used instruments, such as Joss–Waldvogel disdrometers [20] or vertical pointing Doppler radars [21], entirely depends on the statement that each drop falls at its specific terminal velocity. Therefore, the measurement of rain DSD is governed by the relationship between the raindrop diameter and terminal velocity: the first form of this relation evolved from laboratory experiments [22]. Later, several researchers [23,24,25] tested and modified this relation for natural rain events.
The Gunn–Kinzer relation (GK hereafter) assumes the air density to be the same as that of sea level. This inadequacy, crucial in radar calibration, is resolved by an empirical factor applied to the original equation for locations other than sea level [26,27]. However, even then, the presence of drops with velocity outside the expected terminal velocity range has been reported by several works [28,29,30]: drops with a fall velocity lower than 70% of their terminal velocity are labelled as sub-terminal, whereas drops falling at larger than 130% of the terminal velocity are considered super-terminal [28].
In natural rain, very large raindrops, grown by coalescence, break-up into smaller drops as a result of their unstable nature (hydrodynamical break-up) or, more frequently, after collisions with smaller drops (collisional break-up) [31,32]. Break-up usually produces many smaller drops that, because of inertia, fall at the same high speed as the bigger original drop, at least right after the break-up: this is a possible source for super-terminal raindrops. On the other hand, the coalescence after the collision of two smaller drops produces a single large drop that travels with the speed of the bigger drop colliding and thus can be labelled as sub-terminal.
The non-terminal velocity is expected to be revealed right after the generating process, break-up or coalescence and eventually relaxes toward GK or similar values. It was argued that the presence of super-terminal drops in the drop spectra may have been due to some erroneous measurements; however, several studies have confirmed the existence of super-terminal drops in different locations all over the world with several instruments, including Parsivel and 2DVD disdrometers [33,34]. The authors in [35] reported a substantial fraction of super-terminal drops during each of the six rain events studied using a network of laser disdrometers.
Despite using different instruments, such findings align with the results in [28]. Moreover, large raindrops with low speed turned out to be evident above 3 mm drop diameter [29,36]. Wind turbulence was reported to have a significant impact on the presence of non-terminal velocities. The authors in [30] reported a decrease in the drop velocity, i.e., the presence of more sub-terminal drops with increasing wind turbulence. Researchers identified 9.4% of the raindrops larger than 1.0 mm in volume equivalent diameter as sub-terminal during the passage of a tornado [37]. The authors in [38] reported a notable correspondence between the rain rate and super/sub-terminal drop abundances. On the other hand, super-terminal velocities are reported to increase with altitude because of the lower air density [39].
Several studies have presented evidence of non-terminal drops over different regions around the globe [28,36]. The studies were mostly case-based ones. The DSD characteristics of natural rain have significant spatiotemporal variations due to several reasons, including topography, wind circulation and climatic conditions [40]. This feature is particularly prominent between tropical and temperate locations [41,42]. Hence, the DSD shape modification and modelling errors inevitably differ in different climatic regions.
Furthermore, populations of large drops are reported to differ largely over different parts of the globe, with the highest concentration in tropical rain [43]. Therefore, it is interesting to study the occurrence of super-/sub-terminal raindrops in natural rain in contrasting climate regions. However, studies on the variation of DSD characteristics and velocity–diameter relationships for different rain categories and climatic regions are extremely limited. The very few studies that attempted a variation of non-terminal raindrops over different sites were also based on sites in the near vicinity [33].
Numerous laboratory experiments and numerical studies have attempted the understanding of collisional break-up as one of the most important processes in rain formation. The authors in [6] reported notable evidence of drop break-up in natural rain. Studies on drop break-up in natural rain over tropics, however, are rare. Therefore, it is of valid interest to investigate the occurrences of drop break-up in natural rain over different latitudes and to understand the role of drop break-up in the percentage of non-terminal drop witnessed.
The current study, for the first time, presents a rigorous investigation of the evidence of non-terminal raindrops on a statistically robust extensive rain database over two completely different climatic regimes, one over mid-latitude and another in tropics, namely Bologna (Italy) and Kolkata (India). The present work describes a thorough study on the deviation of actual fall velocities from the empirical relations using a rain dataset measured by Parsivel disdrometers.
The study presents a comparative analysis of the deviation in V-D relationship from the GK relation between the two locations along with the quantitative analysis of super- and sub-terminal drops. The evidence of drop break-up in natural rain of the two places is investigated. The current work also investigates the role of break-up and coalescence in the percentage of super- and sub-terminal drops in these two locations.
2. Materials and Methods
2.1. Location and Experimental Setup
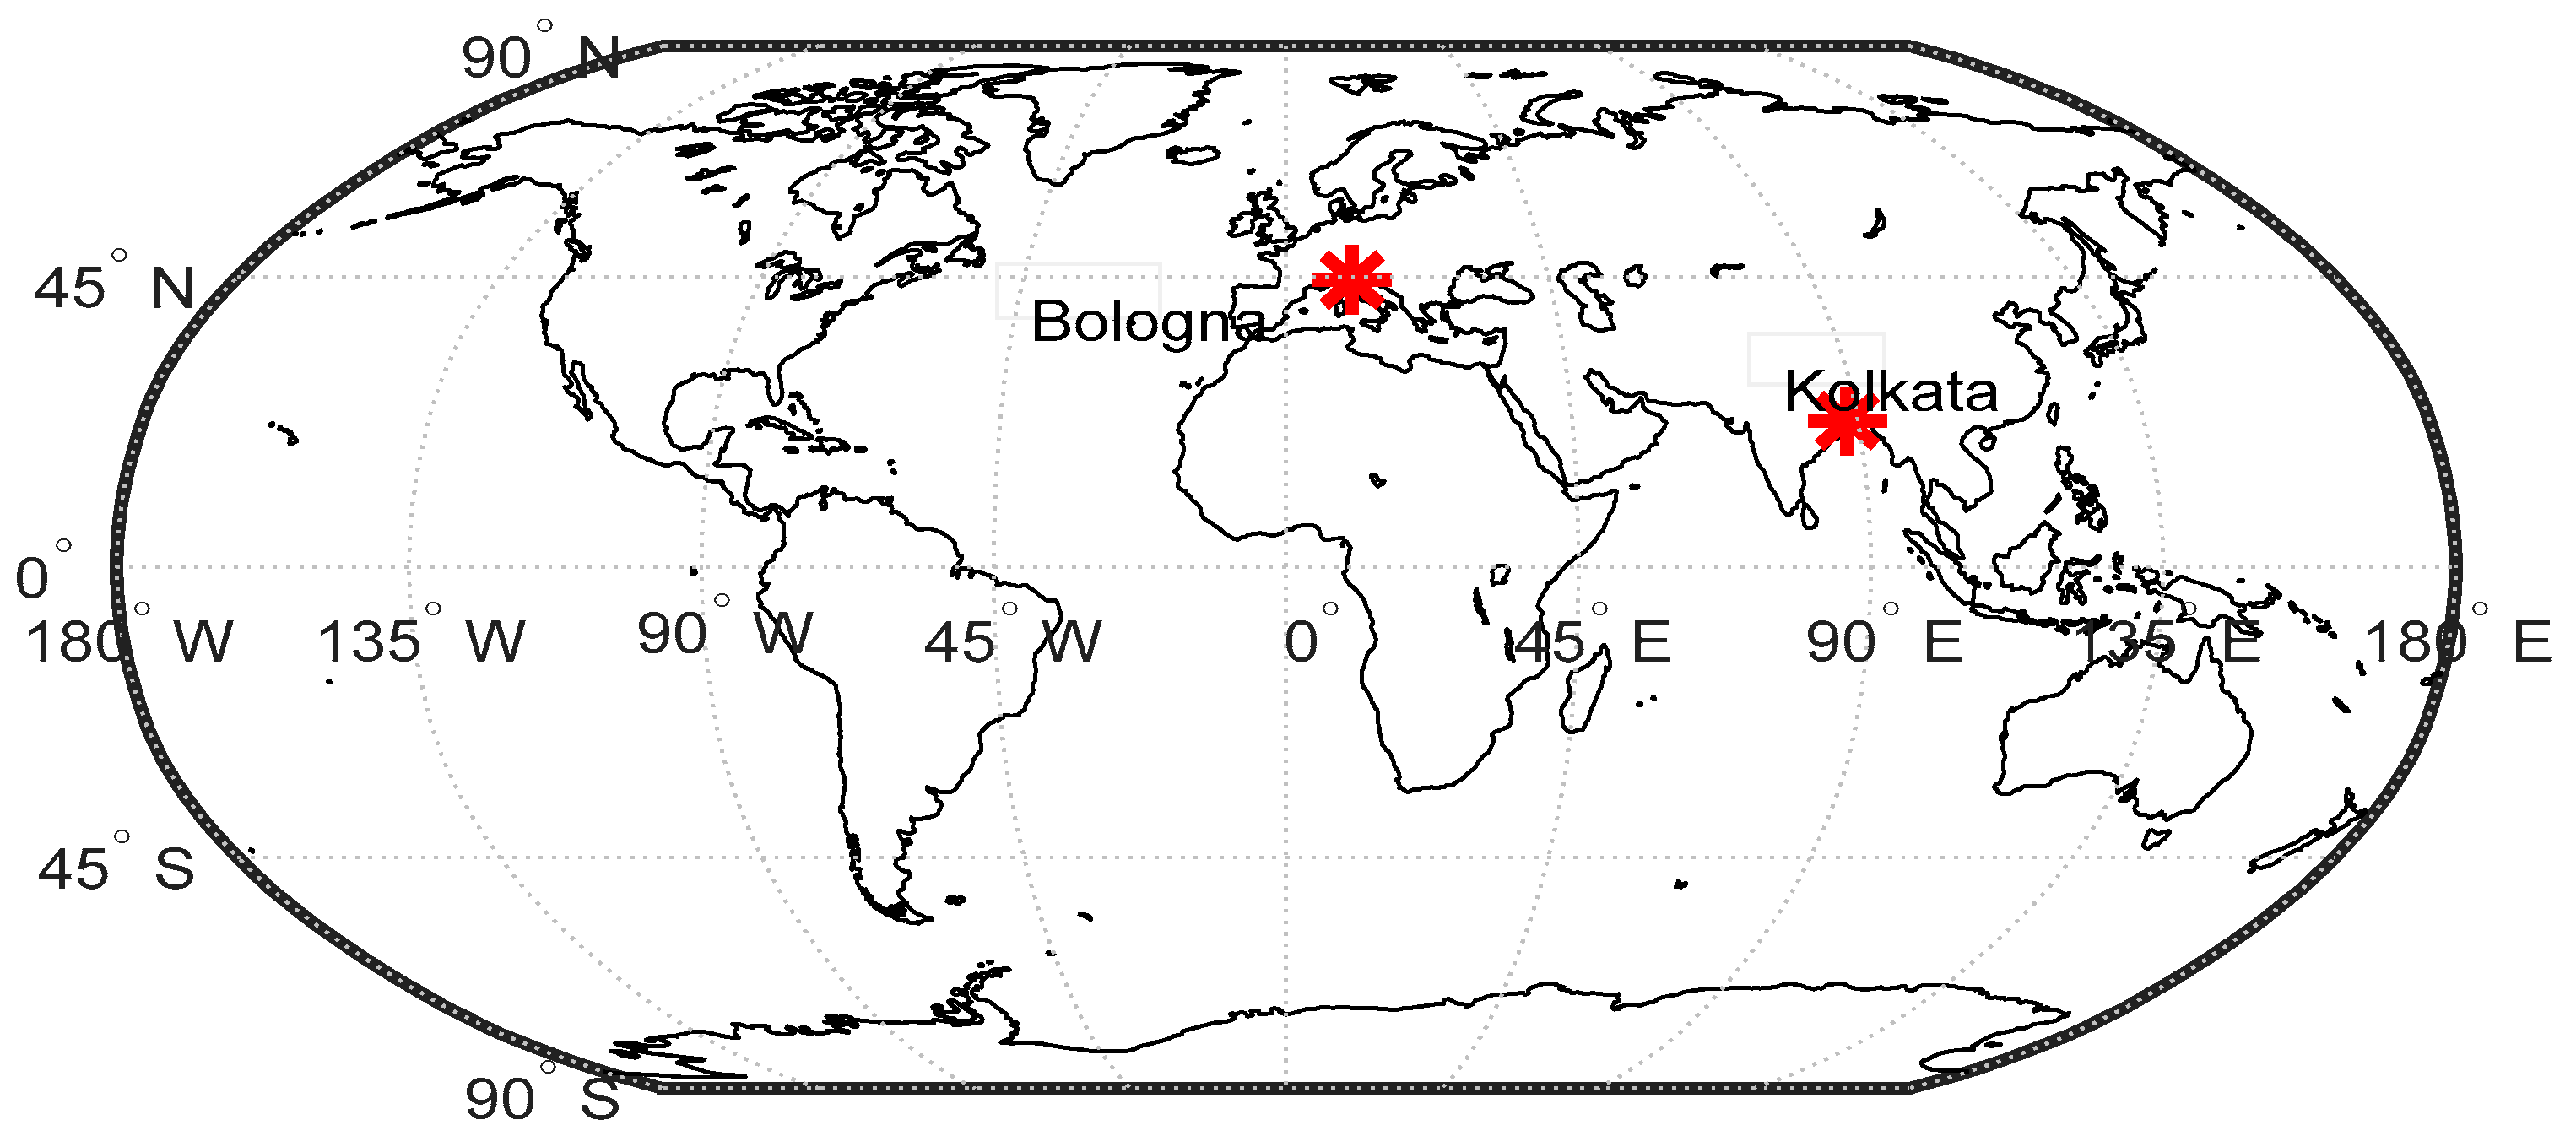
The rain DSD information is retrieved by two optical laser-based disdrometers OTT-Parsivel2, installed at the Department of Physics and Astronomy “Augusto Righi” of the University of Bologna (Bologna, Italy, 44.49°N, 11.34°E, 65 m a.s.l.) and at the Indian Statistical Institute (Kolkata, India, 22.68°N, 88.38°E, 9 m a.s.l.). The study locations of this work are shown in Figure 1. Bologna has a humid subtropical climate with an annual rainfall ranging between 460 and 900 mm.
The city is situated at the foot of the Apennine Mountains and maintains a maximum and minimum temperature profile of about 18 and 8 °C. On the other hand, Kolkata, located on the eastern bank of the Hoogly River, has a tropical wet and dry climate with an average temperature of 26 °C. The city receives most of its rainfall because of the Bay of Bengal branch of the southwest monsoon from June to September. The annual rainfall is around 1760 mm.
The two disdrometers used in this work are particle-size- and velocity-measuring devices: these disdrometers can measure the raindrops in 32 diameter bins with mid values ranging from 0.062 to 24.5 mm and non-uniform bin sizes of 0.125, 0.5, 1, 2 and 3 mm. The device is capable of measuring raindrop velocities in 32 bins within 0.05 to 20.8 m/s with bin spreads of 0.1, 0.2, 0.4, 0.8, 1.6 and 3.2 m/s. The instrument provides the count of the falling raindrops structured in a matrix of 32 × 32 diameter and velocity bins [42]. The disdrometer consists of two sensor heads (transmitter and receiver), and a horizontal laser beam is continuously transmitted toward the receiver head. A reduction of laser voltage is produced by raindrops crossing the laser beam.
The duration of the signal decrease is used to compute the drop speed (V), while the amplitude of signal decrease is used to calculate the drop diameter (D). Advanced digital signal processing makes it capable of measuring rain intensities from as low as drizzle to as high as tropical thunderstorms. Small drops measured by Parsivel disdrometers were known to underestimate the actual count as it misses some small drops; however, Parsivel2 improved this significantly from its predecessors [44]. In addition, the surface of Parsivel2 sensor heads is equipped with a particular splash protector that breaks up the raindrop-impacting sensor heads, thus, preventing the undesirable passing of raindrop fragments across a laser beam. In this way, no secondary rainfall spectra are detected by the disdrometer. Furthermore, the sampling time of the measurements is set as 60 s to mitigate statistical fluctuations.
2.2. Methodology
The Bologna dataset consisting 4965 rain minutes within the period of April 2019 to January 2021 as well as 3263 rain minutes during November 2017 to October 2018 from Kolkata are considered here. For both locations, rain minutes with intensities less than 1 mm/h were removed to minimize noise and non-significant events. The GK relationship was used to compute the terminal velocities of the drops in this analysis. The deviation of the V-D curve is studied from the GK relation. However, the first two diameter bins of Parsivel are not considered here to minimize erroneous measurements due to the low signal-to-noise ratio [44].
This analysis was performed focusing, first, on the effect of precipitation type on the variation of the V-D relationship. The datasets for both the locations are separated into the two major precipitation types, i.e., convective/stratiform, see Table 1, to study the impact of precipitation type on the super- and sub-terminal drop occurrence. The convective/stratiform separation for Kolkata was performed, minute by minute, based on the empirical relation between N0-R as proposed by [45] for tropical rain, whereas the Bologna database was classified in convective and stratiform rain based on the classification scheme using N0-λ relationship as proposed by [46] for mid-latitude rain.
This study considered both deep and shallow convection. The V-D spread and deviation of the mean V-D line from the GK relationship were studied for both locations. The analysis was performed for the entire dataset and separately for convective and stratiform rain as well. Further, the quantification of super- and sub-terminal drops was attempted. This analysis also was performed for all rain types separately. The drops with a velocity below 0.7 Vterminal were considered sub-terminal drops, whereas drops with a velocity beyond 1.3 Vterminal were termed as sub-terminal drops [28]. Here, the distribution of wind speed, measured at a sampling rate of 30 min, was studied.
The rain datasets were further investigated for the evidence of break-up of drops based on the highest slope (HS) algorithm proposed by [6] in order to assess the relationship between break-up and super-terminal drop occurrence. The HS analysis was performed only for rain samples with higher rain intensity (>5 mm/h) as proposed in [6]. The HS algorithm analyses the DSD spectrum between 1.0 and 2.6 mm diameters by computing the slope of the linear best fit. The use of the slope of the linear fit was observed to be reliable and robust in identifying the changes in the slope of DSD. This can avoid isolated spikes that exist due to the natural DSD variability. The 1 min disdrometer measurements were averaged over 2 min to achieve a more stable sampling and to maintain a large-enough dataset. The rain databases were classified according to the highest slope observed in the drop-size distribution.
Next, event-wise analysis was conducted instead of the rain sample-based method used until now. For the following analysis, the entire datasets were grouped into “events”: an event is defined as a series of consecutive rain minutes, where rain minutes are defined as minutes with rain exceeding 0.01 mm/h or having more than 10 drops in the DSD. Furthermore, if two events are separated by a dry period shorter than 60 min, they are grouped in a single event. A total of 54 events were studied in Bologna, whereas 41 events were studied in Kolkata. The fraction of super- and sub-terminal drops were studied in each of these events in both locations.
Thereafter, the events with only average rain intensity higher than 3 mm/h were chosen to investigate the role of break-up and coalescence on the percentage of non-terminal drop in the natural rain of these two study locations. The filtering of events was done in this way because break-up is expected more in events with high rain intensity [47]. This has resulted in 26 events in Kolkata and 14 events in Bologna for this particular analysis.
Here, a baseline approach was attempted. The event databases in each of the two regions were divided into two classes: (1) events with an average super-terminal fraction of drops (within 0.3–1.6 mm) higher than the average super-terminal percentage of all these events and (2) events with a fraction of super- terminal drops lower than the all-event average.
Next, the relation between the fraction of break-up minutes, i.e., break-up minutes divided by total rain minutes and the fraction of super-terminal drops in a particular event were studied for these events. Finally, to investigate the relationship between sub-terminal drops and increased coalescence, the peak value of the mass-averaged drop diameter (Dm), defined as the ratio between the fourth and the third moment of the DSD for each minute, was studied. The relation between the peak value of Dm in a particular event and the fraction of sub-terminal drops in that event was studied to investigate whether any direct correspondence exists between the two. The procedure can be summarized as follows:
- a.
- Data are collected in Bologna and Kolkata.
- b.
- The bulk analysis is performed on samples with at least R > 1 mm/h.
- c.
- Convective/Stratiform classification performed.
- d.
- Velocity–diameter relationship in natural rain of the two places is studied.
- e.
- Super- and sub-terminal fractions of drops are computed.
- f.
- Highest slope of DSD is computed for samples with R > 5 mm/h after averaging DSD in 2 min samples.
- g.
- Events are selected as continuous minutes of rain with at least 10 drops/minute with gaps lesser than 60 min.
- h.
- For the impact of break-up and coalescence, we considered only events with at least average rain intensity of 3 mm/h.
- i.
- The non-terminal drops were studied as a function of the peak mean volume diameter and fraction of break-up minutes.
3. Results
3.1. Comparative Rain Microphysical Structure and Non-Terminal Drop Occurrence
A comparative analysis is initially performed between the DSDs in the two study locations to determine the basic rain microphysical similarities/dissimilarities. A higher concentration of small raindrops up to 1 mm was noticed in Bologna compared to Kolkata (Figure 2a). Kolkata appeared to show a higher population of medium and large raindrops above 1 mm, with the difference increasing with diameter. Large drops reaching approximately 5 mm in diameter were observed in Kolkata, whereas Bologna showed the largest raindrops around 4 mm in diameter.
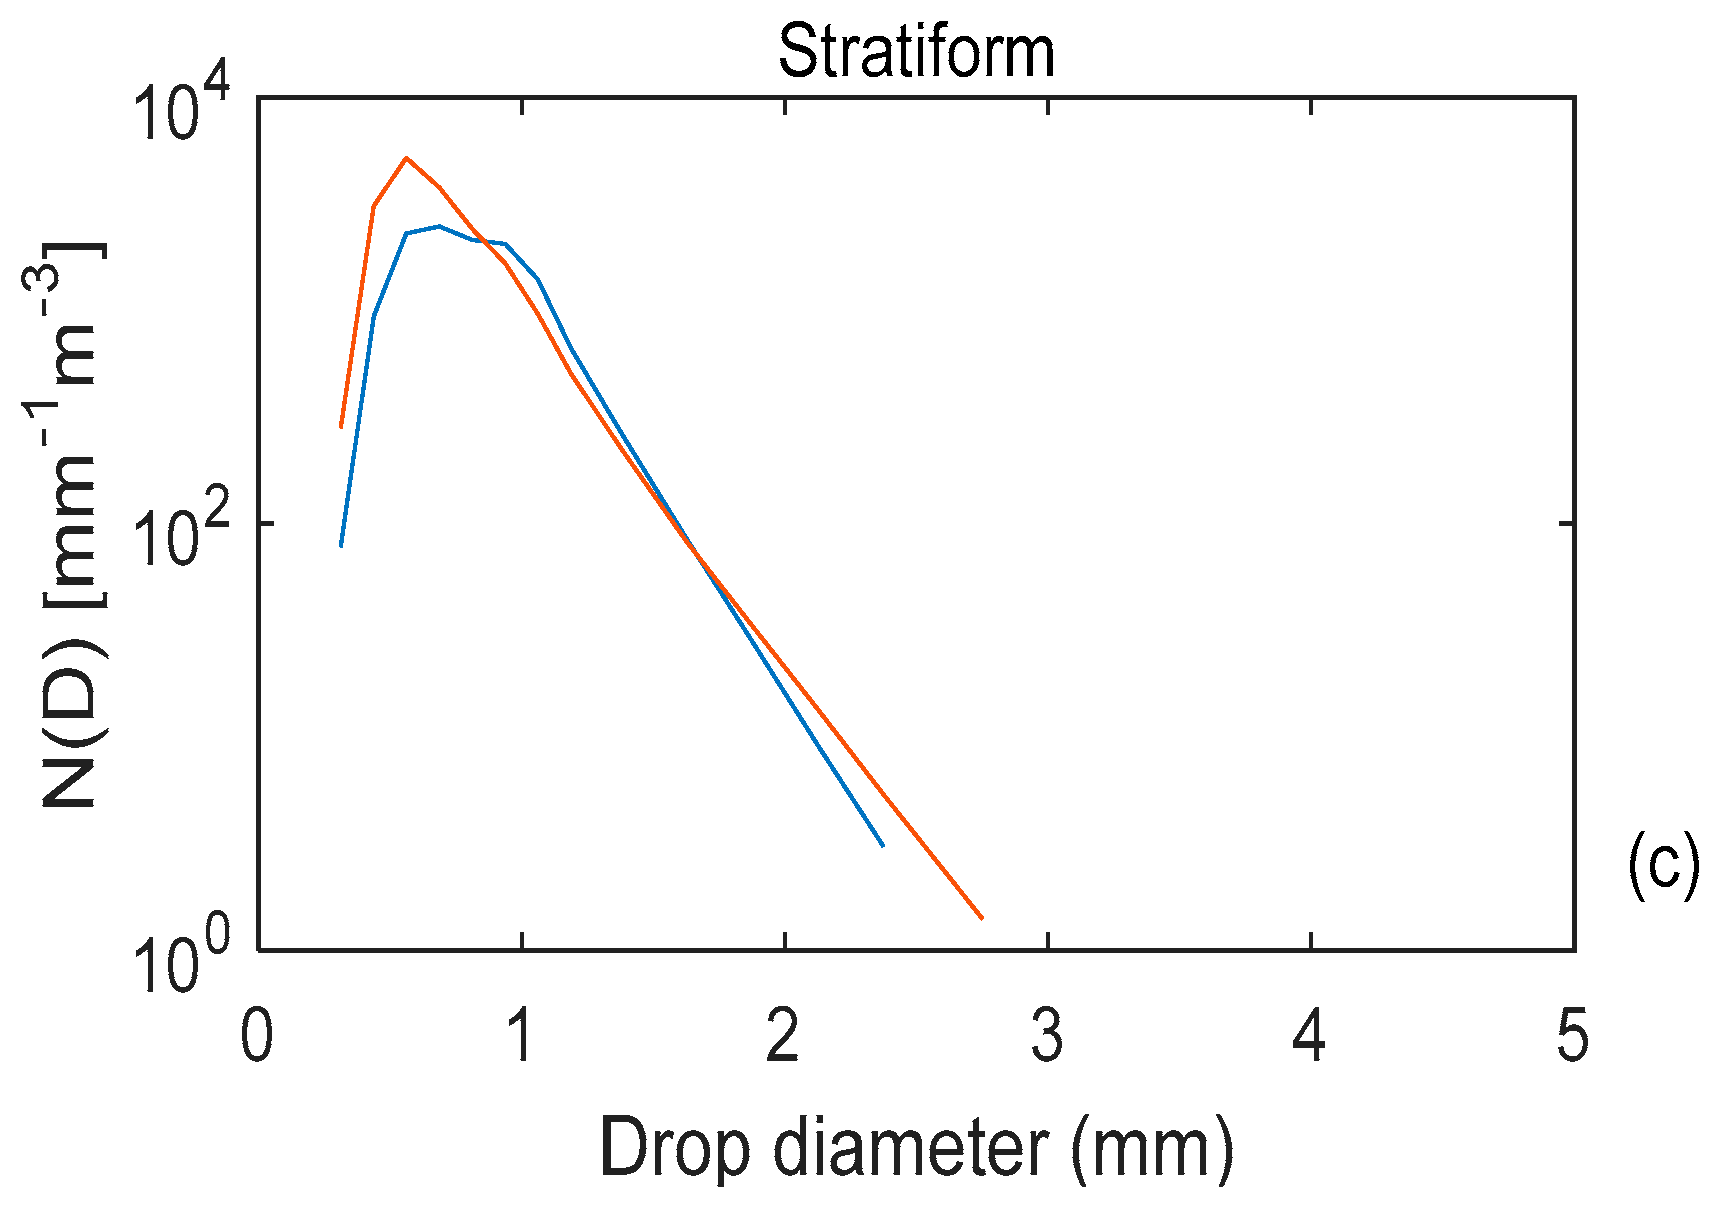
The number concentration was further compared for the two locations separately for the broad categories of rain: convective and stratiform. The DSD for convective rain showed (Figure 2b) almost comparable number concentrations for the small drops (<1 mm) in the two places. Higher population of drops was observed in natural rain of Kolkata for drops greater than 1 mm. Large drops around 5 mm in diameter were noticed in convective rain at Kolkata, whereas Bologna showed large drops approximately around 4.5 mm in diameter. The stratiform rain presented a higher number concentration in Bologna for small and large drops, whereas an abundance of medium-sized drops is noticed in Kolkata (Figure 2c).
The stratiform rain in Bologna has raindrops up to as large as 3 mm in diameter. On the other hand, the DSD of stratiform rain in Kolkata did not show any drops larger than 2.5 mm in diameter.
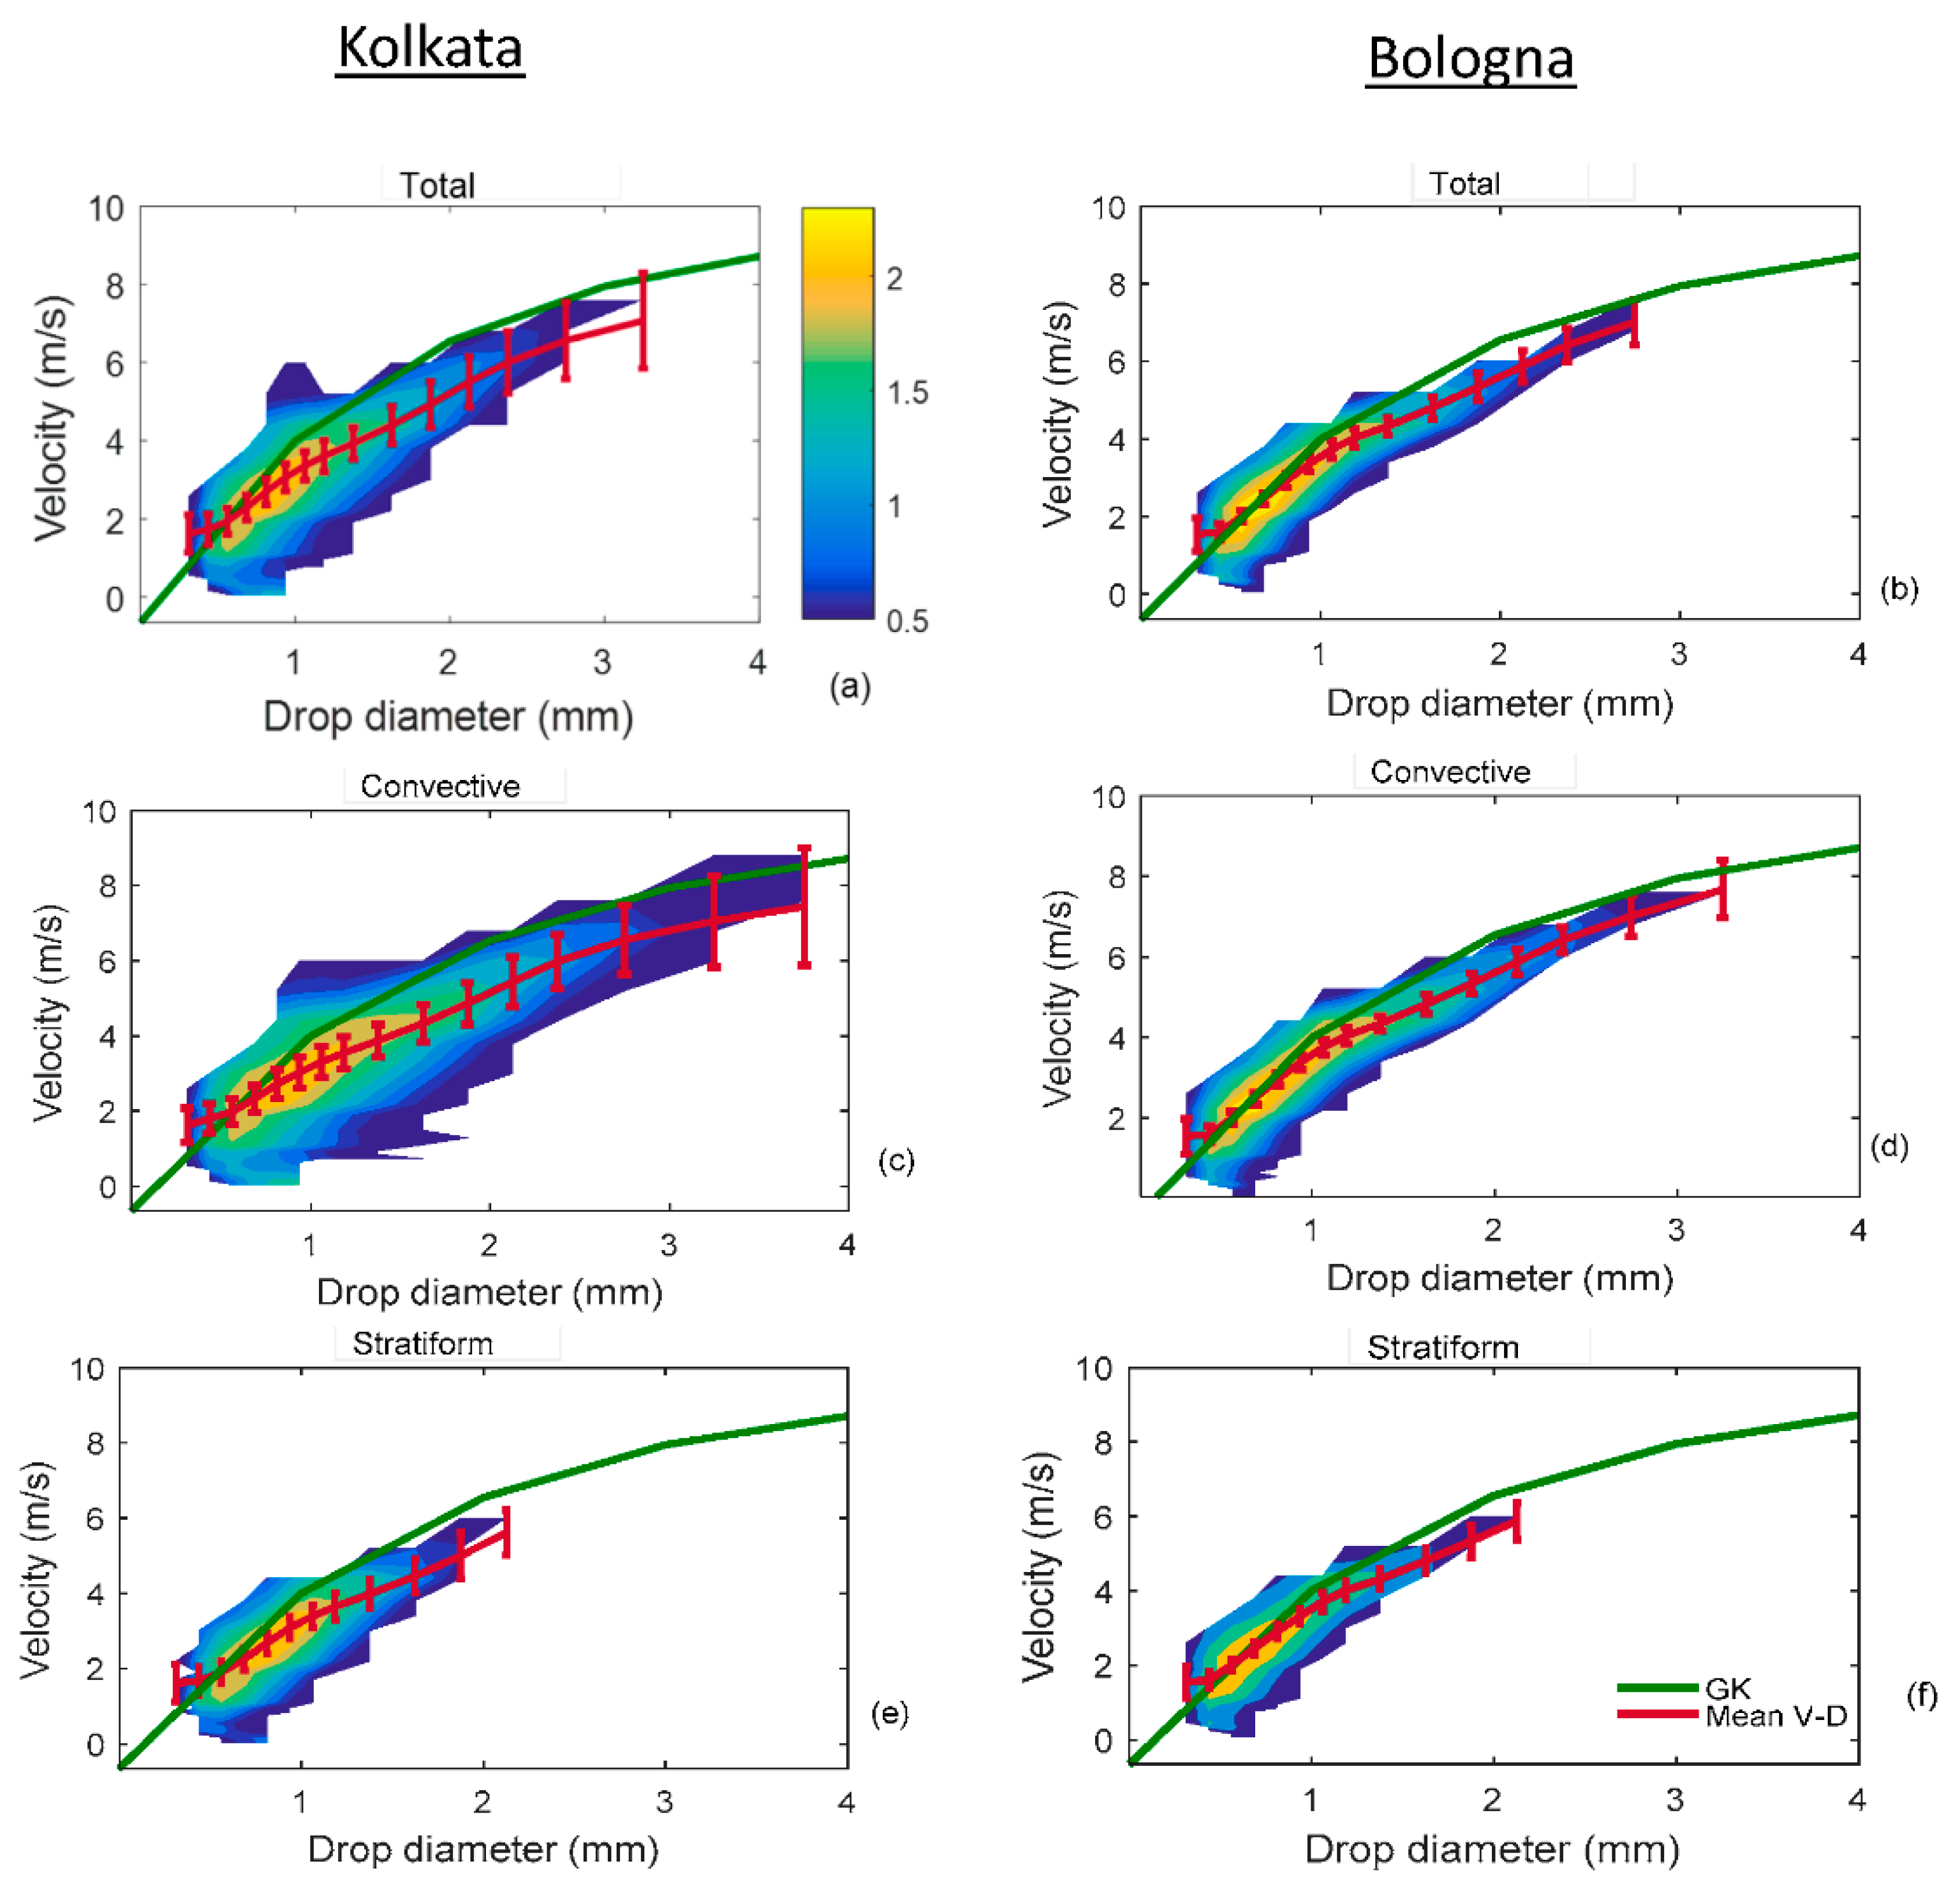
Next, the spread of the raindrop velocity–diameter relation in the two study locations was studied for the whole datasets and separately for the convective and stratiform rain as well (Figure 3). The average velocity-diameter (V-D) spread in natural rain in the two places was studied for up to a significant level of drop concentration along with the mean velocity–diameter relation obtained by studying the drop population in different diameter and velocity bins where velocity and diameter are sampled keeping the original Parsivel2 classes (Figure 3a–f). Figure 3a shows the V-D spread for the whole rain datasets in Kolkata and Bologna.
In both the places, the mean V-D curve went beyond the GK line for very small drops, which signifies the presence of velocities higher than the terminal velocity. Subsequently, for drops greater than 1 mm, the mean V-D curve deviates toward values lower than GK line, which increases with the increasing diameter. This lowering indicates velocity values lower than the expected ones for a particular raindrop diameter. A wider spread of the V-D spectra was noticed in Kolkata. A similar analysis was repeated for convective and stratiform categories of rain to investigate the influence of convection on the V-D relationship. The V-D spectra for convective rain (Figure 3b) were wider than the mean rain spectra for the entire dataset, both in tropical (Kolkata) and mid-latitude locations (Bologna).
However, the spread was wider in Kolkata as in the case of the whole rain dataset. The stratiform rain, on the other hand, showed slightly less deviation of the mean V-D curve from GK line in comparison with the convective rain for both locations. In both cases, the deviation was more prominent in Kolkata (Figure 3c–f). This analysis points toward the presence of a significant amount of non-terminal raindrops in both locations.
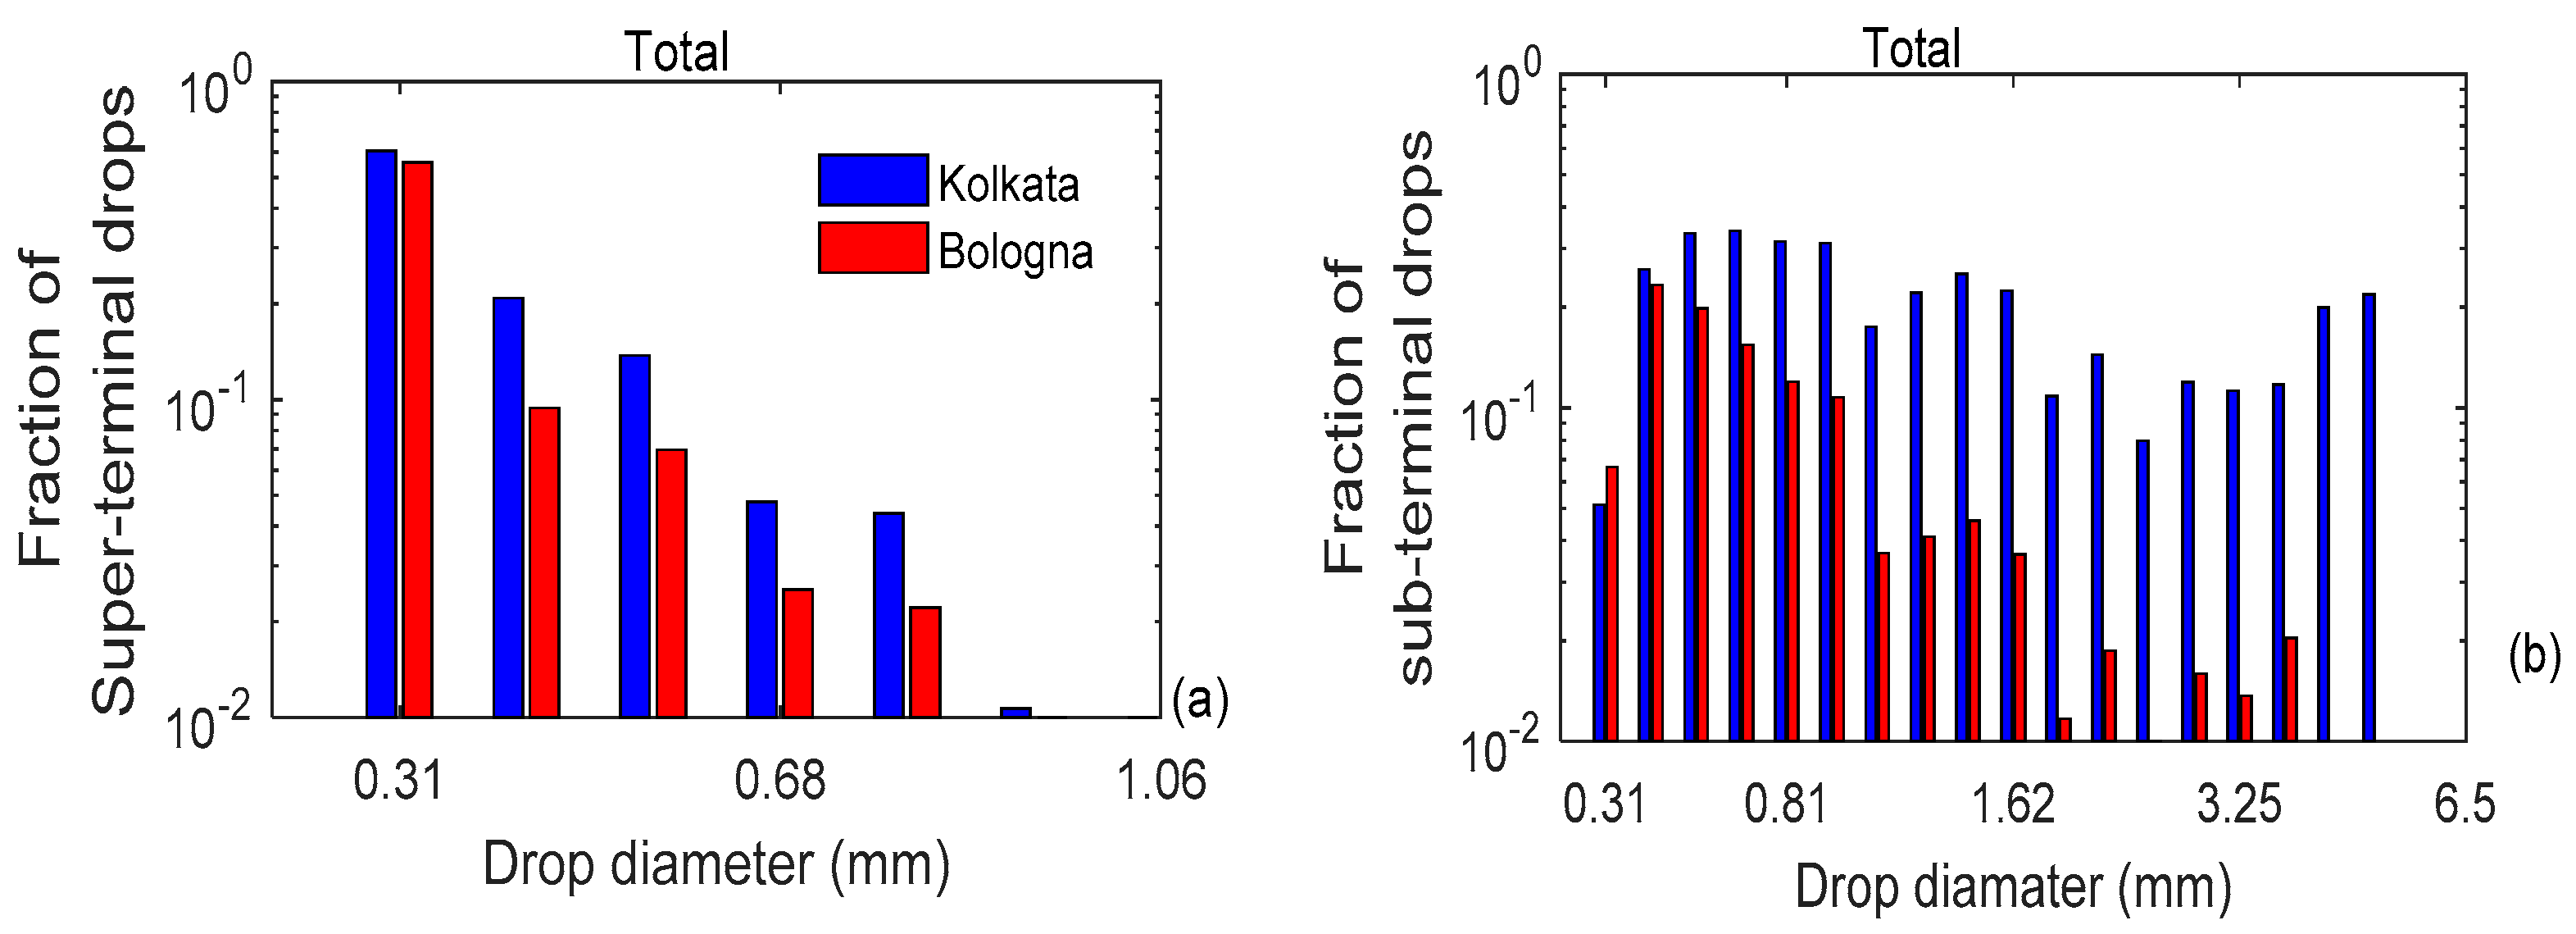
Therefore, a quantitative analysis of super- and sub-terminal drops in the rain spectrum was performed to have a deeper view of the matter. Figure 4 shows the fraction of super- and sub-terminal drops in the different diameter bins in both the study locations. The presence of super-terminal drops was witnessed for small drops (up to around 1 mm in diameter) in both cities. A slightly higher super-terminal drop fraction was noticed in Kolkata (Figure 4a).
On the other hand, the sub-terminal drops were significant for drops larger than ~0.8 mm in both the locations (Figure 4b), which became lowest around 2.5 mm of diameter and again started increasing. Similar signatures were noticed in the sub-terminal drops for both locations; however, the percentage of sub-terminal drops was higher in Kolkata in comparison with that in Bologna.
The DSD samples were studied further to quantify super- and sub-terminal drops separately in convective and stratiform rain. The super-terminal drop fraction in convective rain was slightly higher in Kolkata (Figure 5a). The stratiform rain also showed a similar signature. However, the difference was smaller in this case (Figure 5b). In addition, the percentage of super-terminal drops was slightly higher in convective rain in both locations, likely due to drop break-up, which is dominant in highly convective rain events [6]. Sub-terminal drops are reportedly significant for drops larger than 3 mm [29].
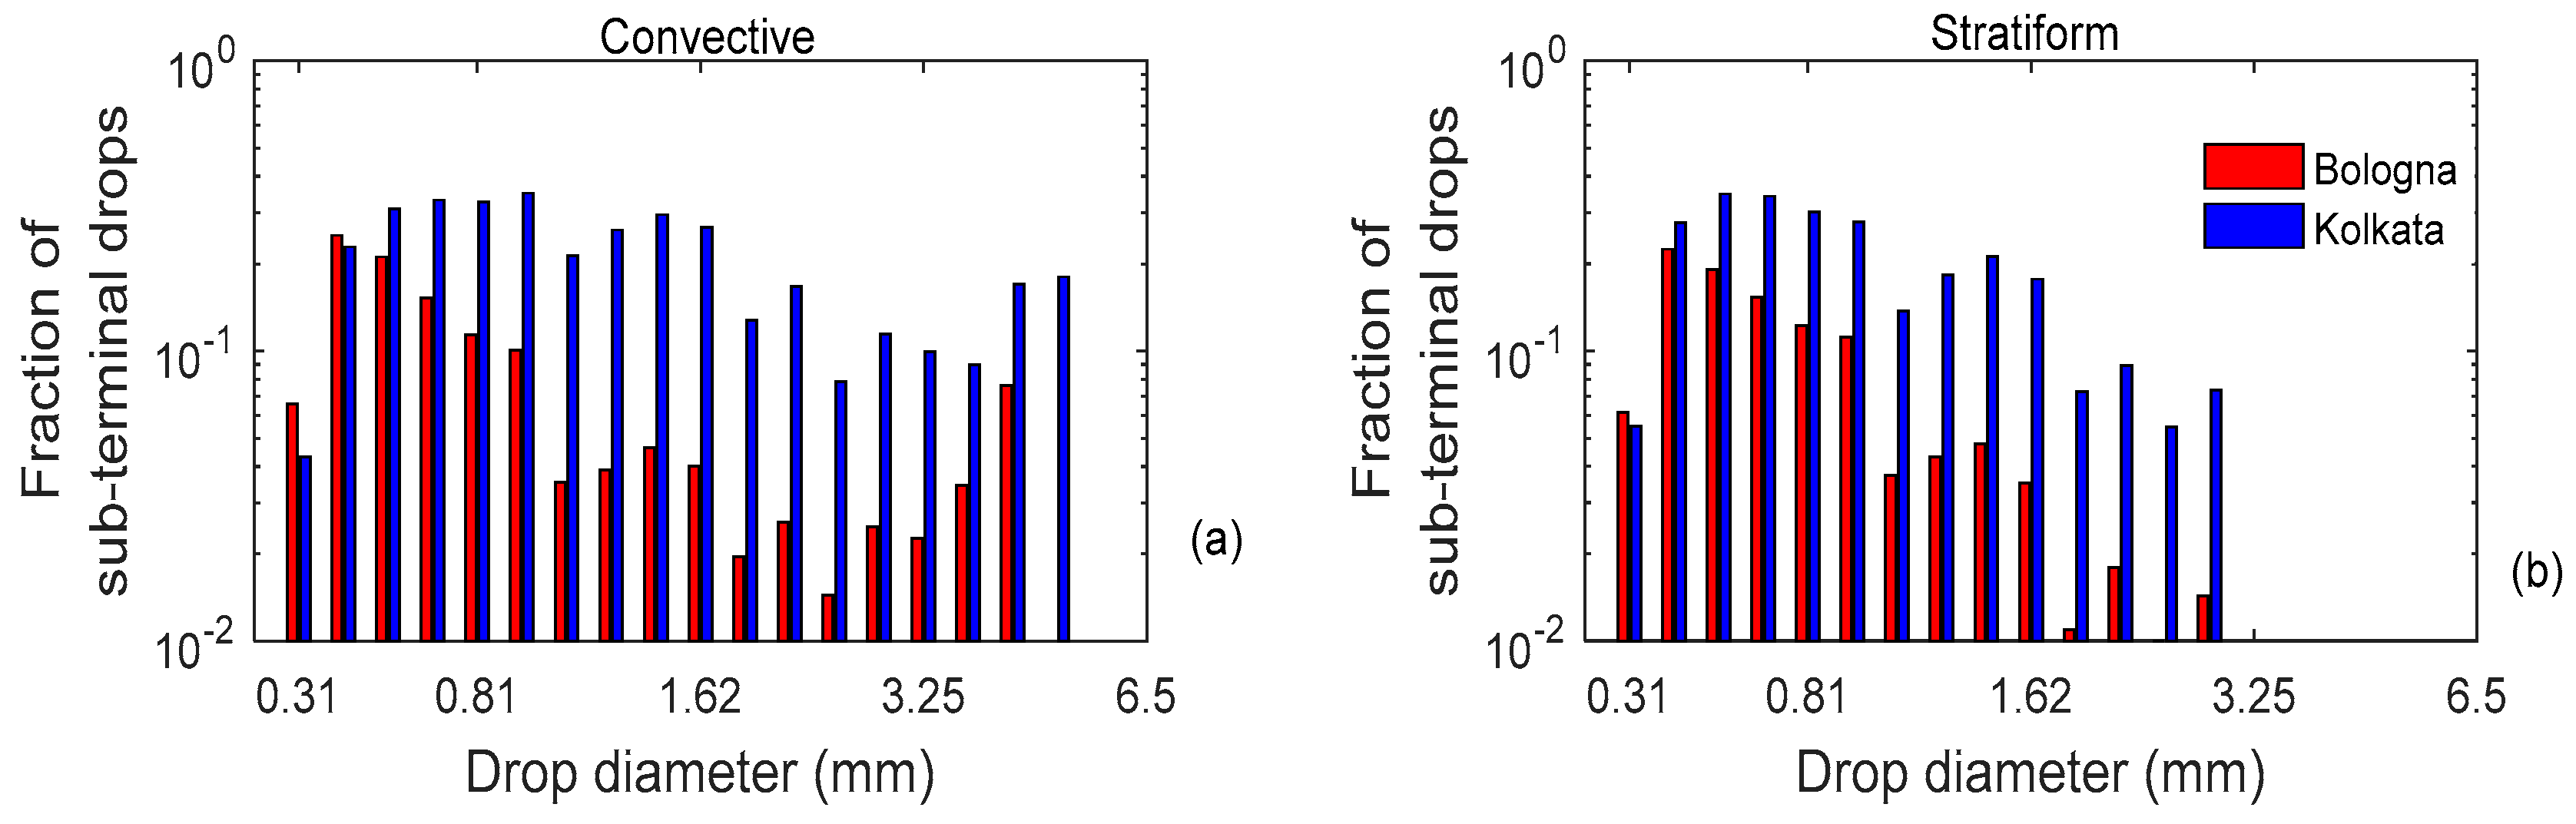
Figure 6a,b shows the fraction of sub-terminal drops in convective and stratiform rain in the two study locations considered. In both types of rain, Kolkata showed a higher percentage of sub-terminal drops, more evident for larger drops. The fraction of sub-terminal drops decreased with drop diameter until 3 mm and then started increasing in convective rain for both places (Figure 6a). On the other hand, the stratiform rain showed drops until 3 mm in diameter, and the fraction of drops decreased with the increasing diameter (Figure 6b). However, the decrease of sub-terminal fraction with diameters (until 3 mm) was much steeper in stratiform rain.
The above analysis suggests significantly high super- and sub-terminal drop fractions in the natural rain of Kolkata in both the rain types. However, the behavior of non-terminal drops was similar in the two places.
3.2. Investigation of Physical Processes Involved in Presence of Non-Terminal Raindrops
The probable mechanism that can significantly influence the raindrop velocity is the break-up of drops [33]. Therefore, an investigation was performed next to check for the signature of drop break-up in rain DSD. Since the break-up is more likely to occur in intense rain [48], rain samples with an intensity lower than 5 mm/h were not considered in this particular analysis.
The highest slope (HS) of DSD was studied within a drop diameter range of 1–2.6 mm to assess the signature of the break-up, based on the algorithm proposed by [7]. The slope of the linear best fit is computed and considered as the highest slope of that instant.
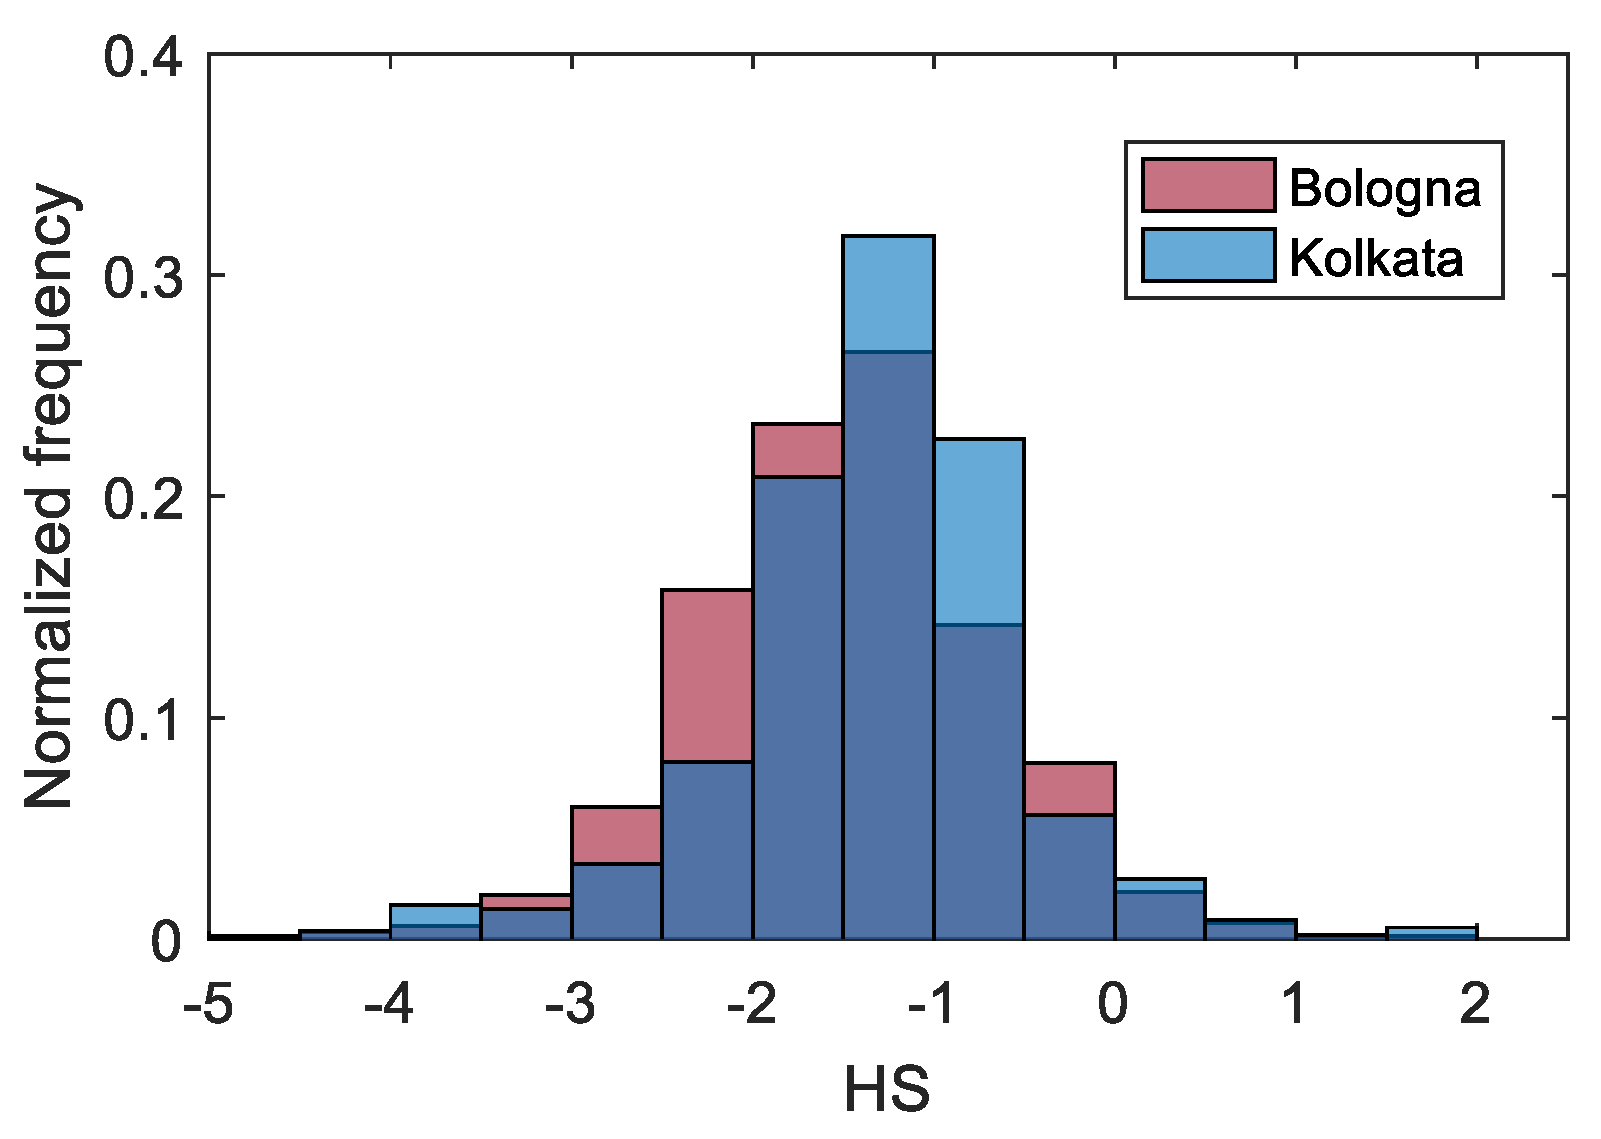
Here, the HS algorithm was implemented after a 2 min averaging of the DSD samples in order to minimize the undesired instabilities. The distribution of HS values in the two places looked comparable except for a slightly wider spread in Bologna (Figure 7). The HS, in most of the instances, showed a value within the range of −2 to 0 for both the places. Therefore, this interval is subdivided into four uniform classes, and two other classes were defined outside this range (Table 2). The drop break-up is expected to exist for HS > −0.5 [6].
It is interesting to note that almost 7% and 10% of the rain samples in Bologna and Kolkata correspond to fifth and sixth HS classes, i.e., showed evidence of drop break-up (Table 2). Therefore, the break-up in natural rain in these two places cannot be neglected.
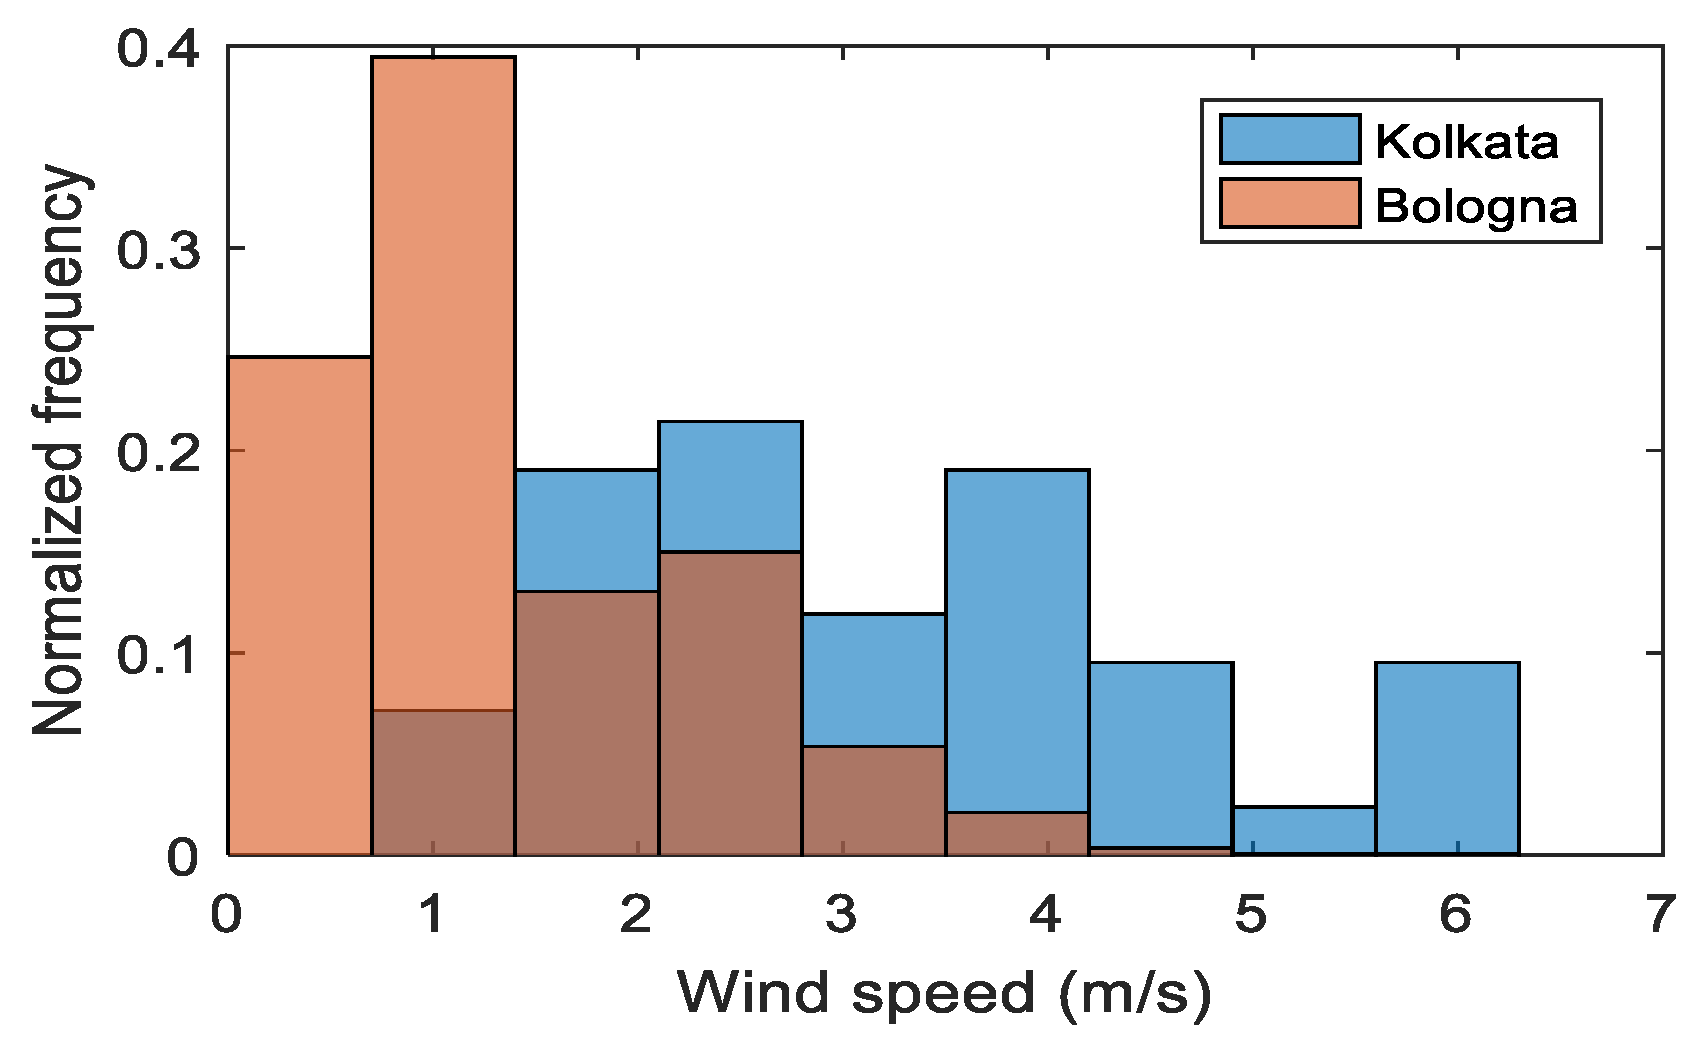
Wind turbulence is reported to be a major influencer in the modulation of raindrop velocities and also in the capability of the disdrometers to perform reliable measurements [48]. An increase in wind speed during rain episodes was reported to cause an enhancement in the number of collisional-break-up events, producing larger proportions of super-terminal drops, whereas turbulence can lead to sub-terminal drops [35].
Therefore, it was of valid interest to look at the wind speed during the events considered. Here, wind speed data measured at an interval of 30 min were obtained from the automatic weather station at the Kolkata airport within an aerial distance of 6 km, whereas, in Bologna, the wind measurements were procured with a cup anemometer placed close to the disdrometer, with a 30 min sampling rate.
The wind speed distribution (Figure 8) showed the dominance of windy events in Kolkata, which can be a possible catalyst behind the higher non-terminal drops in natural rain of the location.
3.3. Identification of Causes behind Non-Terminal Drops in Individual Events
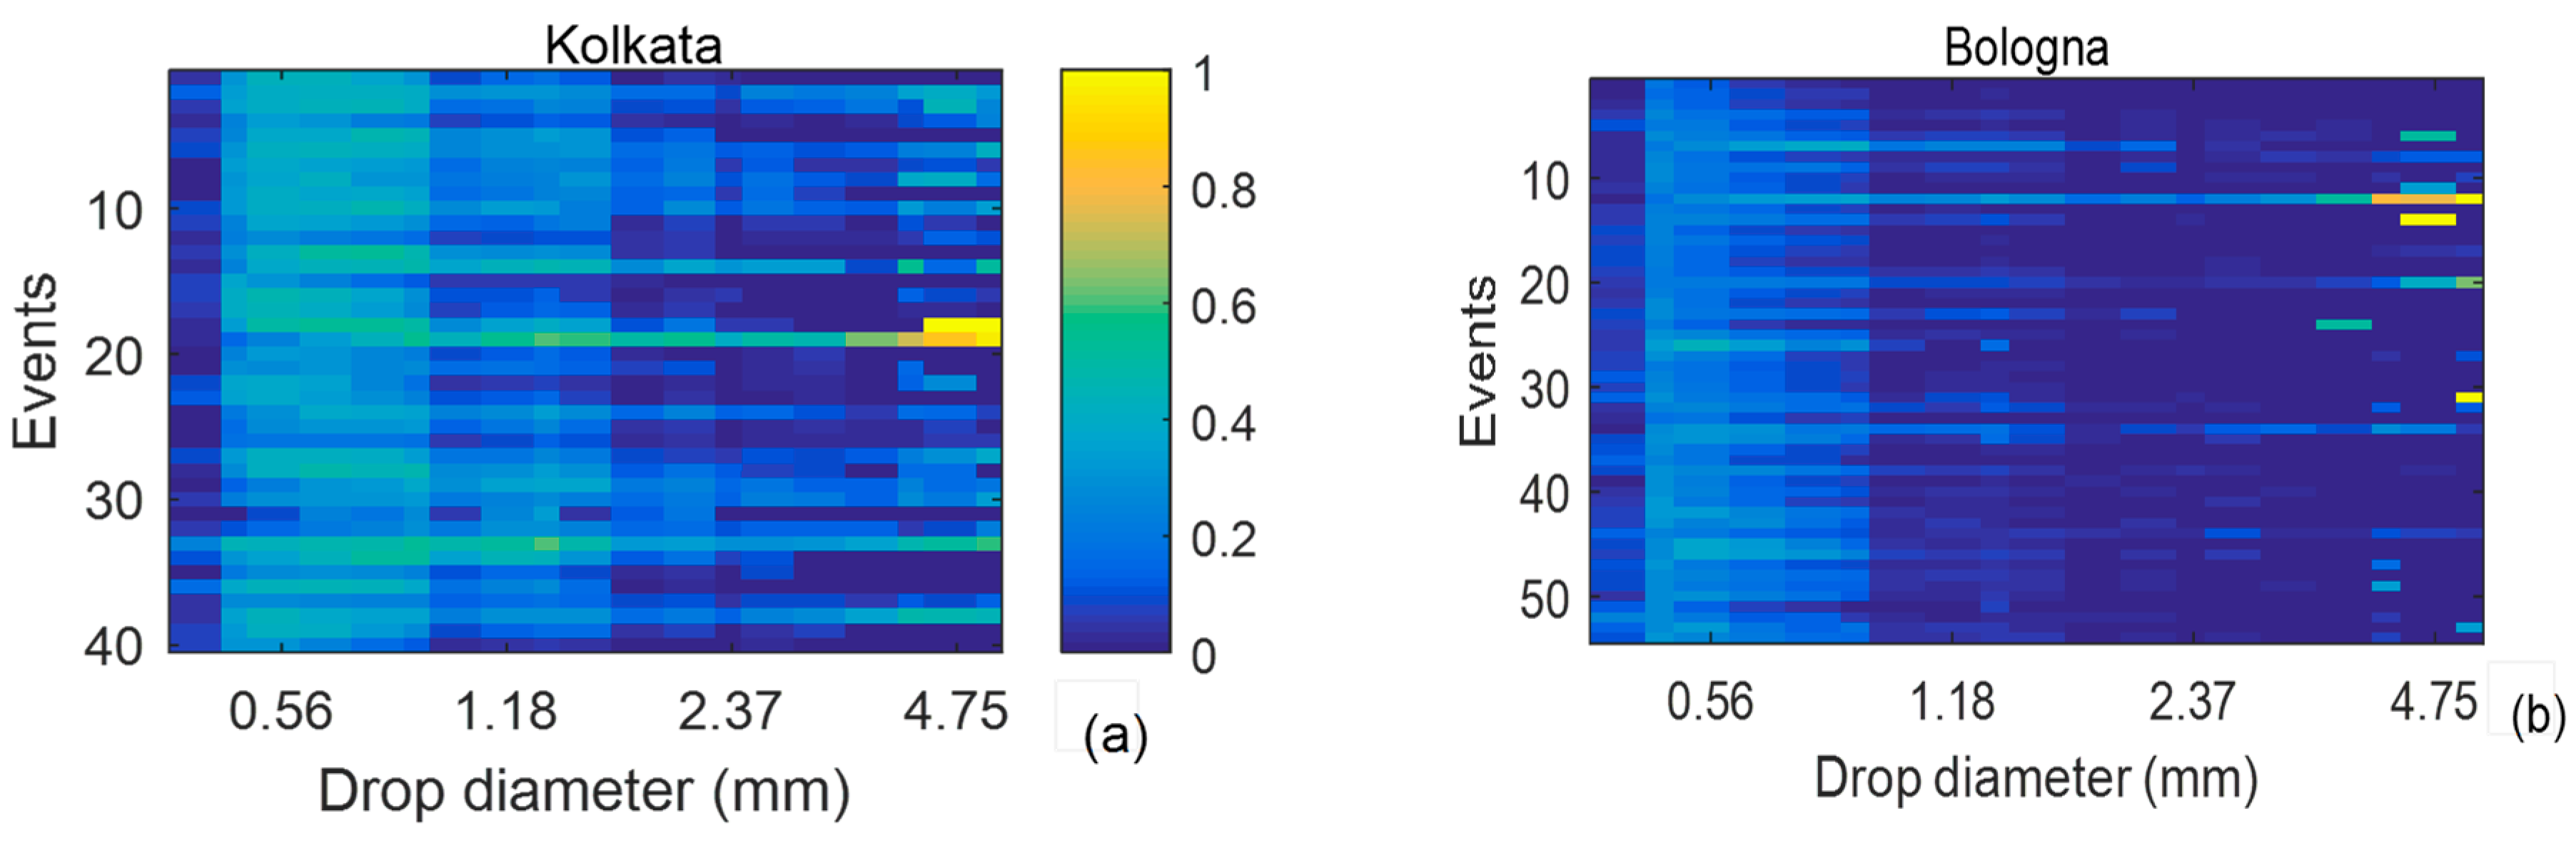
The results showing the evidence of non-terminal velocities and the presence of drop break-up in the natural rain of the two places interested us in further event-wise analysis. Therefore, the fraction of non-terminal drops in individual events was studied next for all the events. Figure 9a,b show the fraction of super-terminal drops witnessed in each of the events (along vertical axis) in Kolkata and Bologna, respectively, as a function of the drop size.
Few events in Kolkata showed signs of super-terminal drops up to a diameter of 1.2 mm, whereas some events witnessed super-terminal velocity only in tiny drops less than 0.9 mm (Figure 9a). On the other hand, super-terminal drops were witnessed in Bologna for small (<0.6 mm) drops during most of the events. However, even though the different events studied showed a significantly varied fraction of super-terminal drops (Figure 9b), it is evident that the presence of super-terminal drops was not an event-specific phenomenon.
The event-wise analysis agrees with the previous findings of a higher super-terminal raindrop fraction in Kolkata. Figure 10a,b showed the fraction of sub-terminal drops witnessed in each of the events in Kolkata and Bologna, respectively. The diversity among rain events was well evidenced in sub-terminal spectra, which is more prominent in events in Bologna (Figure 10b). Most of the events in Bologna showed approximately 20% of sub-terminal drops within a diameter of around 2 mm, and few of them continued until longer in the diameter spectrum and witnessed a much higher percentage of sub-terminal drops. In Kolkata, a higher percentage of sub-terminal drops were observed in almost all the events, which varied between 20% and 40%.
The presence of sub-terminal drops was generally consistent in all events until a drop diameter of 2 mm, after which it varied for the different events. However, the percentage of sub-terminal drops was lower within a drop diameter of 2–3 mm, after which it again started increasing. The variation among the different events was slightly less in Kolkata than in Bologna (Figure 10a).
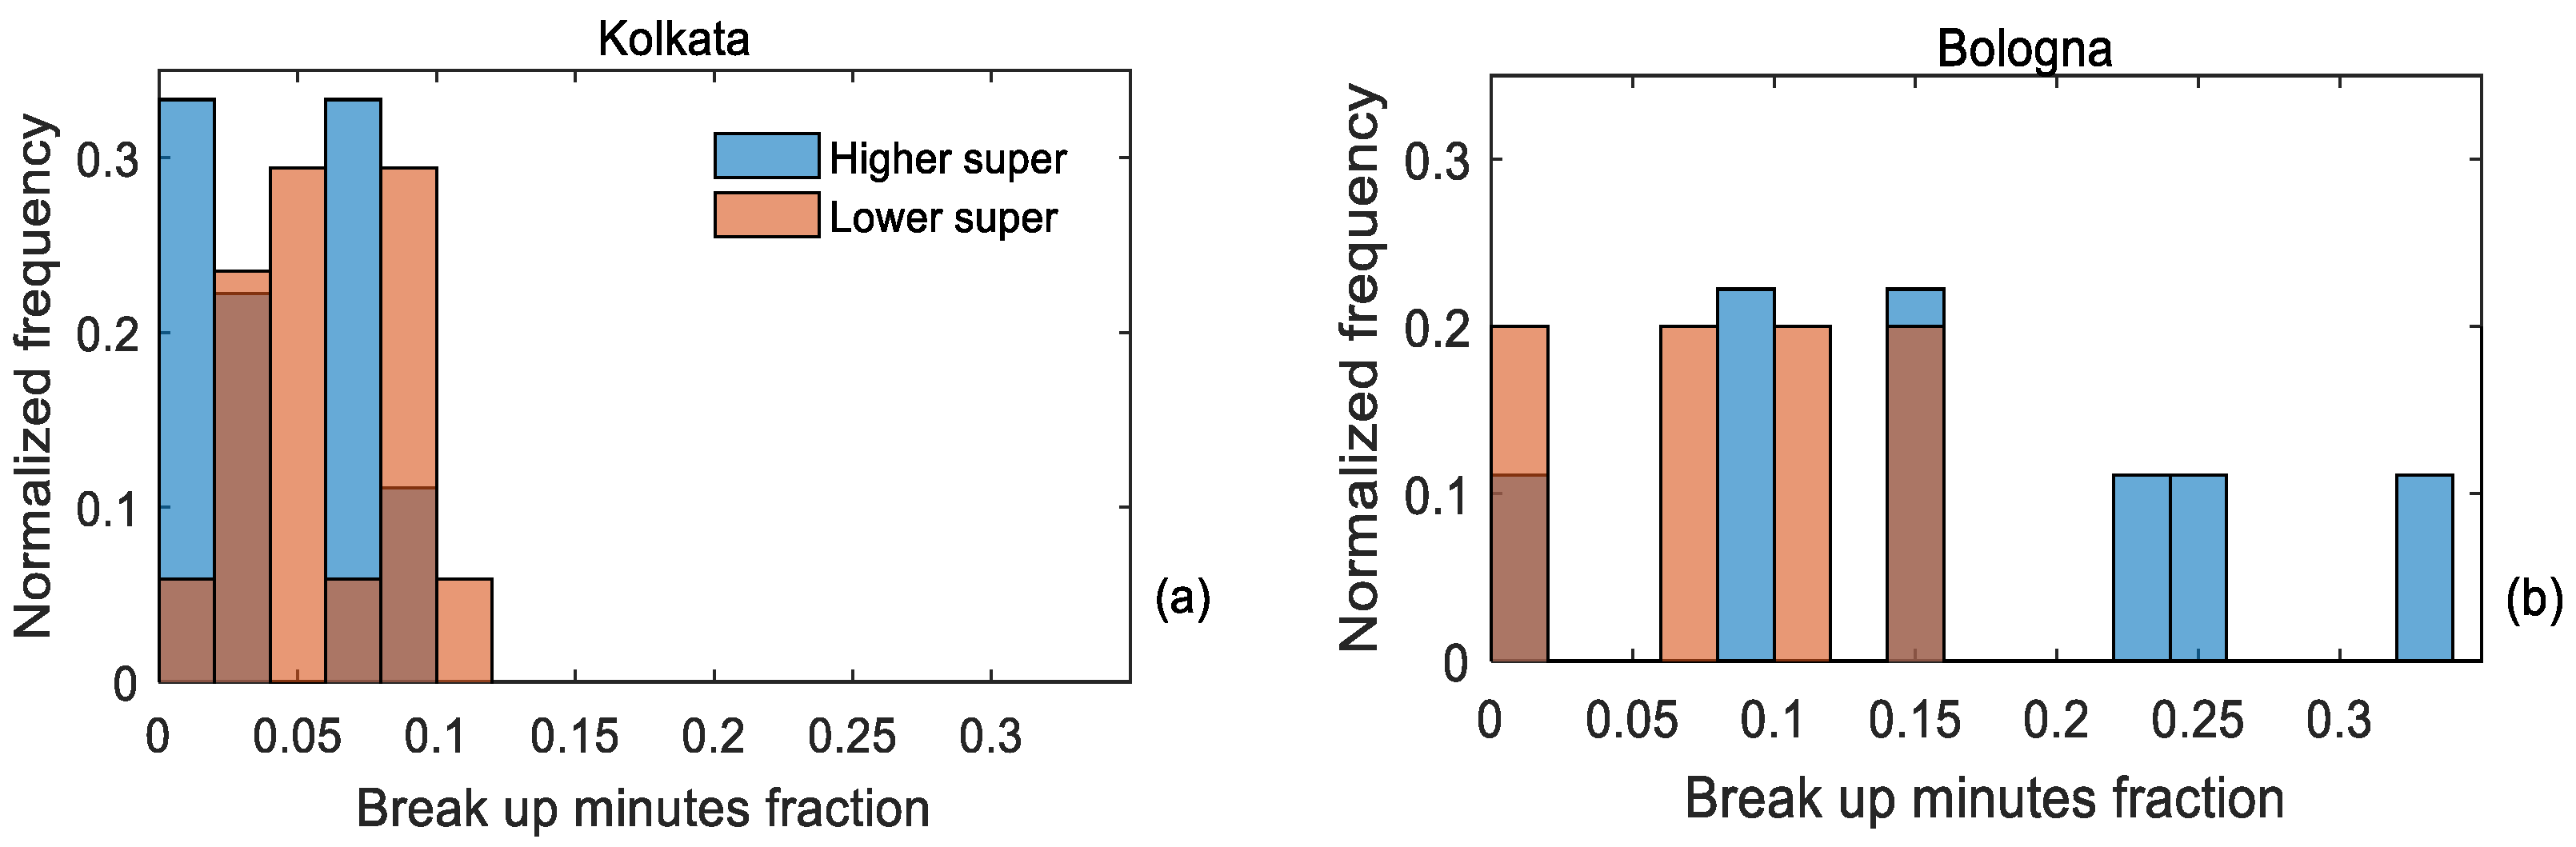
This study attempted a baseline approach to look at the contribution of break-up in the presence of super-terminal drops in the rain events. This study was performed for only rain events with an average rain intensity greater than 3 mm/h since the process of break-up and coalescence are dominant in the higher rain intensities [47]. In both locations, the events were classified into two categories: (1) events with an average super-terminal fraction of drops (within 0.3–1.6 mm) higher than the average super-terminal percentage of the entire dataset and (2) events with a fraction of super- terminal drops lower than the average (Table 3).
When −0.5 < HS < 0, this class can be considered as a transition where the break-up is negligible compared to the equilibrium DSD. When HS > 0, the break-up starts becoming dominant [6]. Here, for analyzing the role of break-up in the super-terminal fraction of drops, we considered minutes with HS > 0.25 where the break-up will be significant. A clear dominance of break-up occurrences was noticed in Bologna in the first class (Figure 11b), whereas the signature was not very identifiable in Kolkata. The fraction of break-up minutes was notably high in Bologna.
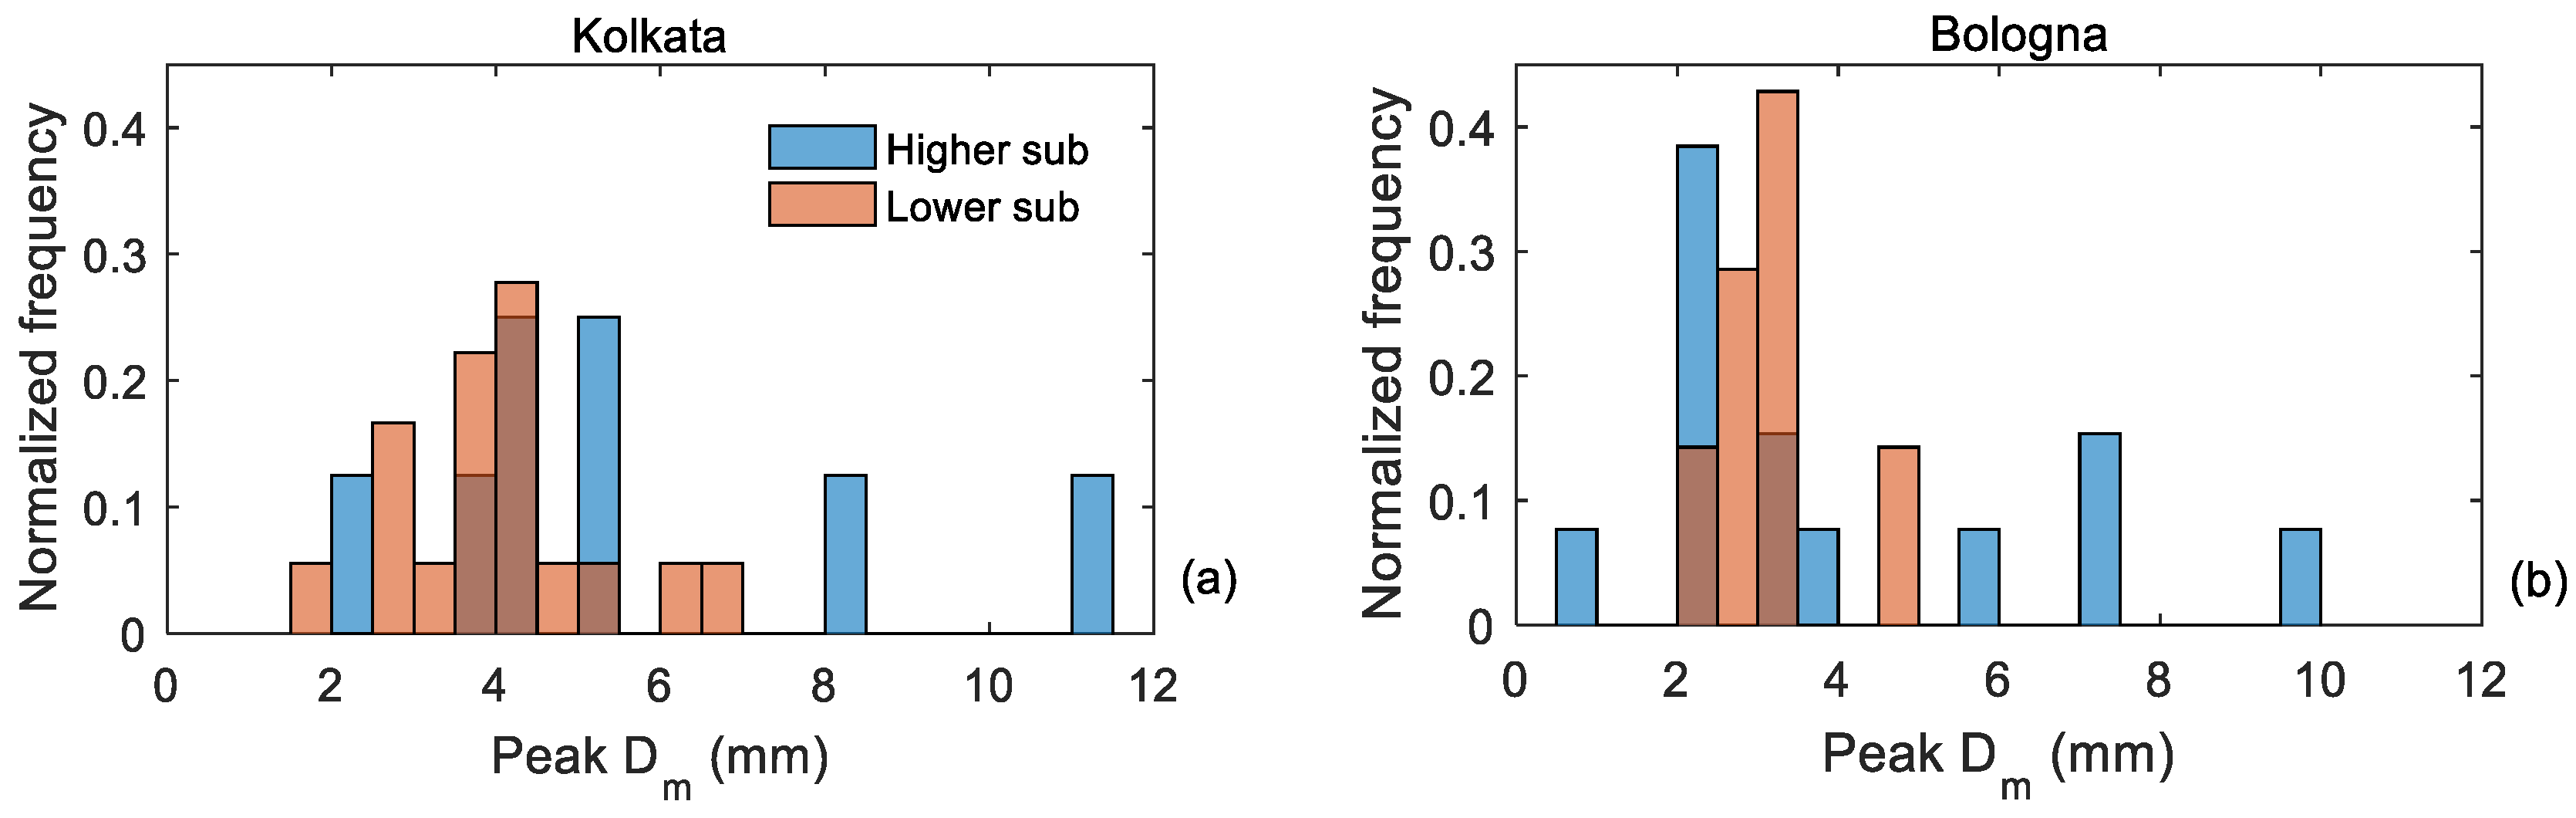
A similar approach was repeated in the case of sub-terminal drops to verify if the process of coalescence had any visible role in it. The peak mean volume diameter (Dm) appeared to have a dominance of higher values in the rain class, with a higher sub-terminal fraction in both places (Figure 12a,b). Although this study is not sufficient to infer the coalescence as the sole reason behind the process, this abundance of medium and large drops in the rain spectra points toward the occurrence of coalescence in the natural rain of the two locations.
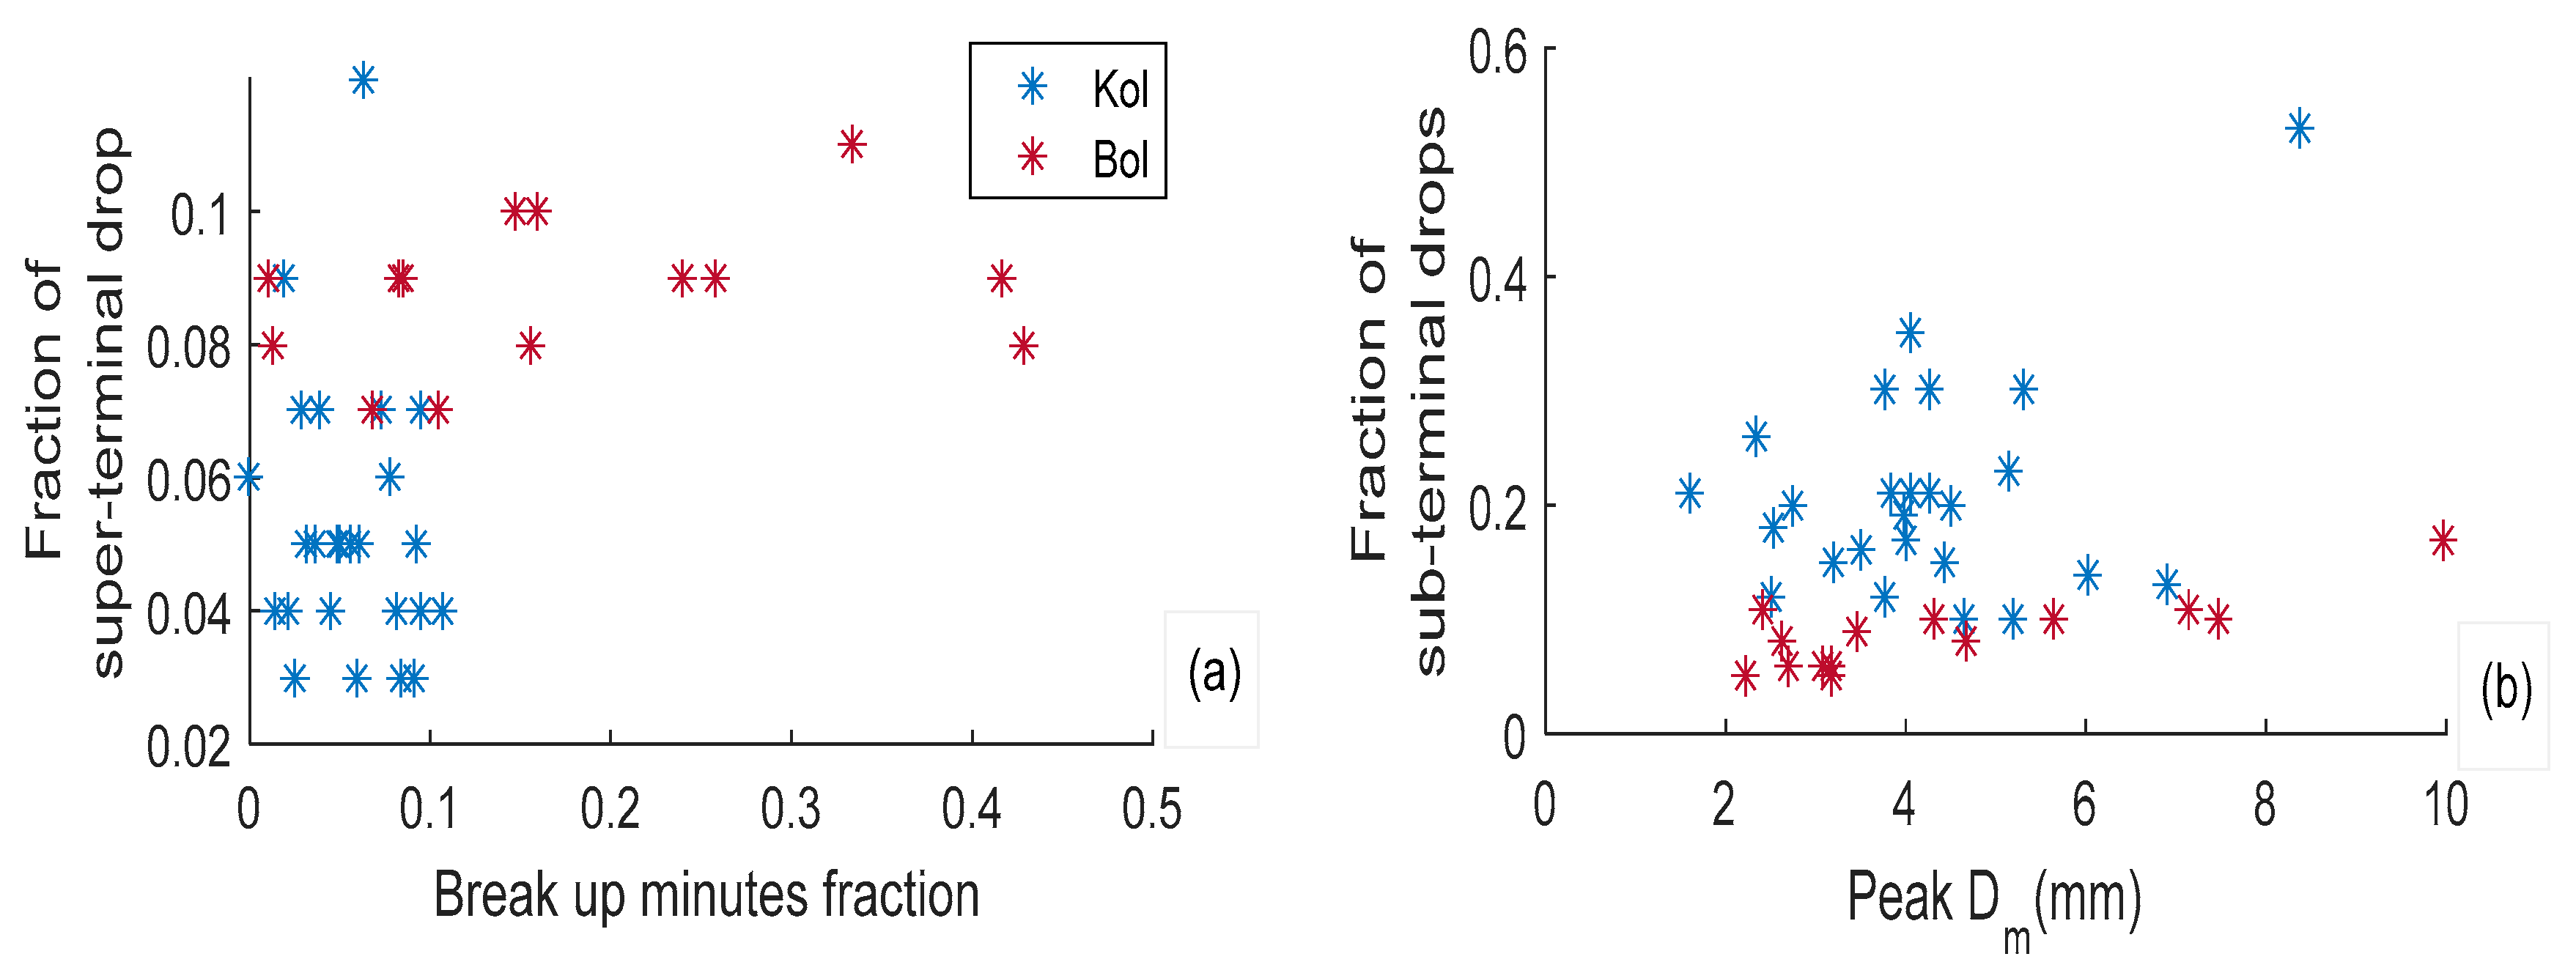
Therefore, the event-wise correspondence between non-terminal drops and evidence of significant dros break (HS > 0.25) and coalescence were further investigated. Figure 13, reported for both sites and for each event, the fraction of non-terminal drops as a function of break-up minute fraction and peak Dm. Our previous findings were further supported with a good association between the break-up minute fraction (ratio of the number of break-up minutes and total rain minutes) in Bologna, whereas it did not look that imperative in Kolkata (Figure 13a). Furthermore, a significant correspondence was noticed between the peak Dm and sub-terminal drops in both places (Figure 13b), which indicated the major role of the coalescence process in the presence of the sub-terminal drop fraction in natural rain in these locations.
4. Discussion
This study reports the basic microphysical differences between rainfall in tropical and temperate locations (Kolkata and Bologna). The tropical site showed an abundance of medium and large drops in general and convective rain, whereas Bologna presented a much higher concentration of small drops. The results find good agreement with an abundance of large drops in tropical rainfall as reported by [43]. The stratiform rain in Bologna appeared to have larger drops (~3 mm) than in Kolkata (~2.6 mm). In addition, the concentration of large and medium drops was higher in stratiform rain in Bologna. The V-D curve showed visible deviation from the GK line in both places. The spread of the V-D curve was much higher in convective rain.
It is an established fact that natural rain is accompanied by complex air motions, and this can deviate the shape, size and velocity of raindrops [49,50,51]. The authors in [52] also reported the deviation of V-D spread from the GK relationship. However, this area of research still demands extensive investigation. This current work attempted a rigorous analysis on a statistically robust large dataset for the quantification of non-terminal drops in tropics and mid-latitude. Clouds are usually extremely turbulent systems [53] and rainfall is associated with different scales of upward and downward air.
Here, a wider spread and deviation of the V-D curve was observed in convective rain, which finds good agreement with our general understanding of convection. The deviation was larger in Kolkata in all rain types. To be specific, the quantification of non-terminal drops, both super- and sub-terminal drops, showed a higher percentage in Kolkata. However, the difference was more prominent in convective rain. Evidence of a significant amount of super- and sub-terminal drops was reported over the Indian region by [54] as well. The percentage of sub-terminal drops was found to be high within a drop diameter of 1 mm, which continued to decrease until ~2.5 mm and then started to increase again. [29,36] also reported a high percentage of sub-terminal drops for raindrop diameters larger than 3 mm.
A higher probability of wind speed over Kolkata location is likely to serve as one of the major influencers here, which is also in accordance with the results reported in [30]. The event-wise analysis confirmed the occurrences of non-terminal drops were not an event-specific phenomenon in the natural rain of these two places. It is to be noted that the rain databases consist of rain events from all the seasons. All the events presented a significant percentage of both sub- and super-terminal drops below 1 mm diameter. [54] reported very similar outcomes over the Indian region, whereas [36] also reported a significant fraction of super-terminal drops for drops smaller than 1 mm.
DSD is the most fundamental property of precipitation and, therefore, can facilitate many kinds of numerical modelling and field studies. In-depth knowledge of DSD structure and its variation is therefore extremely crucial in remote-sensing-based precipitation retrieval algorithms [55]. A couple of physical processes and their interplay were reported to dictate the shape of DSD in case of natural rain [56]. Collisional break-up and coalescence are the two major mechanisms involved in said process [31]. Moreover, 7% and 10% of the natural rain samples in Bologna and Kolkata appeared to be subjected to drop break-up.
Notable correspondence was observed between drop break-up occurrences in an event and the percentage of super-terminal drops in Bologna. The results fall in line with previous reports [29]. On the other hand, both places showed good agreement between the sub-terminal drop fraction and the presence of a large mean volume diameter, which signifies the occurrence of coalescence. Comparative studies reporting the microphysical differences between tropical and mid-latitude rain are limited. The current study can be useful in understanding the characteristic differences in natural rain in the two regions.
Moreover, the comparative evidence of non-terminal velocities between tropical and mid-latitude regions and the role of the break-up and coalescence in the same can propose better insight into the improvement of radar rain meteorology in a global aspect. Incorporating measurements from different rain measuring instruments from a few more climatic regions can be an excellent future goal to facilitate a pathway to understanding this process in a more robust manner.
5. Conclusions
The current work discusses the necessity of reconsidering the terminal velocity notion in velocity–diameter relationships of natural rain. The study reports a thorough analysis of evidence of non-terminal velocities in a tropical and a mid-latitude location. The effects of influential parameters, such as convection and wind speed, are also analyzed regarding the deviation of the velocity–diameter relation from standard approximation. The study reveals an abundance of large- and medium-sized drops in the convective rain of Kolkata, whereas Bologna appeared to have a clear dominance of small raindrops. On the other hand, the stratiform rain in Bologna presented larger drops (~3 mm) than in Kolkata (~2.6 mm).
Significant lowering of the mean V-D curve was noticed from the GK line in both Bologna and Kolkata, which increased towards larger raindrops starting from 1 mm in diameter. The study ascertained the presence of a significant amount of super- and sub-terminal drops in the natural rain of both tropical and mid-latitude regions in all types of rain (convective and stratiform). The percentages of both super- and sub-terminal drops were higher in Kolkata. However, the difference was more notable for convective rain. The percentage of super- and sub-terminal drops was found to be high within a drop diameter of 1 mm.
The number of sub-terminal drops showed an increase with an increase in the drop diameter for drops larger than ~2.5 mm. This study also found a notable drop break-up occurrence in natural rain in the two sites. We found that 7% and 10% of the natural rain samples, respectively, in Bologna and Kolkata appeared to be subjected to drop break-up. The event-wise study performed in each site confirmed that the non-terminal drops were not event-specific.
A significant correspondence was observed between the drop break-up and the percentage of super-terminal drops in natural rain of Bologna. Both places showed a good correlation between the sub-terminal drop fraction and large mean volume diameter, which signifies the role of coalescence in the percentage of slower drops. The findings imply that ground-based or satellite-borne radars relying on the GK relationships should therefore be verified by disdrometers for the calibration of precipitation remote-sensing algorithms. The outcomes of this study once again suggest the need for retrieved raindrop size and velocity instead of the consideration of standard velocity–diameter relationships, such as Gunn–Kinzer, for precise measurements.
Author Contributions
Conceptualization, F.P. and A.B.; Methodology, F.P.; Software, C.C. and A.B.; Validation: F.P. and A.B.; Data Curation: C.C. and A.B.; Writing—Original Draft Preparation, C.C; Writing—Review and Editing, F.P., A.B. and S.D.; Visualization, C.C.; Supervision, F.P. and S.D.; Funding Acquisition, F.P. All authors have read and agreed to the published version of the manuscript.
Funding
This work was partially funded by OPERANDUM (OPEn-air laboRAtories for Nature baseD solUtions to manage hydro-meteo risks) project, funded by the European Union’s Horizon 2020 research and innovation programme under the Grant Agreement No: 776848.
Data Availability Statement
This article has used ground rain measurements acquired at two places, i.e., the Indian Statistical Institute, Kolkata and University of Bologna, Bologna. The data can be provided by the Authors if required.
Acknowledgments
The authors thankfully acknowledge the financial assistance received from OPERANDUM.
Conflicts of Interest
The authors declare no conflict of interest.
References
- Ouyang, L.; Lu, H.; Yang, K.; Leung, L.R.; Wang, Y.; Zhao, L.; Zhou, X.; Chen, Y.; Jiang, Y.; Yao, X.; et al. Characterizing uncertainties in ground “truth” of precipitation over complex terrain through high-resolution numerical modeling. Geophys. Res. Lett. 2021, 48, e2020GL091950. [Google Scholar] [CrossRef]
- Lengfeld, K.; Kirstetter, P.E.; Fowler, H.J.; Yu, J.; Becker, A.; Flamig, Z.; Gourley, J. Use of radar data for characterizing extreme precipitation at fine scales and short durations. Environ. Res. Lett. 2020, 15, 085003. [Google Scholar] [CrossRef]
- Thorndahl, S.; Einfalt, T.; Willems, P.; Nielsen, J.E.; Veldhuis, M.C.; Arnbjerg-Nielsen, K.; Rasmussen, M.R.; Molnar, P. Weather Radar Rainfall Data in Urban Hydrology. Hydrol. Earth Syst. Sci. 2017, 21, 1359–1380. [Google Scholar] [CrossRef] [Green Version]
- Thomas, G.; Mahfouf, J.F.; Montmerle, T. Toward a variational assimilation of polarimetric radar observations in a convective-scale numerical weather prediction (NWP) model. Atmos. Meas. Tech. 2020, 13, 2279–2298. [Google Scholar] [CrossRef]
- Chu, Z.; Ma, Y.; Zhang, G.; Wang, Z.; Han, J.; Kou, L.; Li, N. Mitigating Spatial Discontinuity of Multi-Radar QPE Based on GPM/KuPR. Hydrology 2018, 5, 48. [Google Scholar] [CrossRef] [Green Version]
- D’Adderio, L.P.; Porcù, F.; Tokay, A. Identification and Analysis of Collisional Breakup in Natural Rain. J. Atmos. Sci. 2015, 72, 3404–3416. [Google Scholar] [CrossRef]
- Adirosi, E.; Roberto, N.; Montopoli, M.; Gorgucci, E.; Baldini, L. Influence of Disdrometer Type on Weather Radar Algorithms from Measured DSD: Application to Italian Climatology. Atmosphere 2018, 9, 360. [Google Scholar] [CrossRef] [Green Version]
- Guyot, A.; Pudashine, J.; Protat, A.; Uijlenhoet, R.; Pauwels, V.R.N.; Seed, A.; Walker, J.P. Effect of disdrometer type on rain drop size distribution characterisation: A new dataset for south-eastern Australia. Hydrol. Earth Syst. Sci. 2019, 23, 4737–4761. [Google Scholar] [CrossRef] [Green Version]
- Tokay, A.; D’Adderio, L.P.; Porcù, F.; Wolff, D.B.; Petersen, W.A. A field study of footprint-scale variability of raindrop size distribution. J. Hydrometeorol. 2017, 18, 3165–3179. [Google Scholar] [CrossRef]
- Adirosi, E.; Montopoli, M.; Bracci, A.; Porcù, F.; Capozzi, V.; Annella, C.; Budillon, G.; Bucchignani, E.; Zollo, A.L.; Cazzuli, O.; et al. Validation of GPM Rainfall and Drop Size Distribution Products through Disdrometers in Italy. Remote Sens. 2021, 13, 2081. [Google Scholar] [CrossRef]
- Huffman, G.J.; Bolvin, D.T.; Nelkin, E.J.; Wolff, D.B.; Adler, R.F.; Gu, G.; Hong, Y.; Bowman, K.P.; Stocker, E.F. The TRMM Multisatellite Precipitation Analysis (TMPA): Quasi-Global, Multiyear, Combined-Sensor Precipitation Estimates at Fine Scales. J. Hydrometeorol. 2007, 8, 38–55. [Google Scholar] [CrossRef]
- Arthur, Y.H.; Ramesh, K.K.; Steven, N.; Ardeshir, A.A.; Christian, D.K.; Masahiro, K.; Riko, O.; Kenji, N.; Toshio, I. The Global Precipitation Measurement (GPM) Mission. Bull. Amer. Meteor. Soc. 2014, 95, 701–722. [Google Scholar]
- Seo, E.; Hristova-Veleva, S.; Liu, G.; Ou, M.; Ryu, G. Long-Term Comparison of Collocated Instantaneous Rain Retrievals from the TRMM Microwave Imager and Precipitation Radar over the Ocean. J. Appl. Meteorol. Climatol. 2015, 54, 867–879. [Google Scholar] [CrossRef]
- Skofronick-Jackson, G.; Petersen, W.A.; Berg, W.; Kidd, C.; Stocker, E.F.; Kirschbaum, D.B.; Kakar, R.; Braun, S.A.; Huffman, G.J.; Iguchi, T.; et al. The Global Precipitation Measurement (GPM) Mission for Science and Society. Bull. Am. Meteorol. Soc. 2017, 98, 1679–1695. [Google Scholar] [CrossRef] [PubMed]
- Zhou, Y.; Nelson, K.; Mohr, K.I.; Huffman, G.J.; Levy, R.; Grecu, M. A spatial-temporal extreme precipitation database from GPM IMERG. J. Geophys. Res. Atmos. 2019, 124, 10344–10363. [Google Scholar] [CrossRef]
- Nguyen, P.; Shearer, E.J.; Tran, H.; Ombadi, M.; Hayatbini, N.; Palacios, T.; Huynh, P.; UpdegZaff, G.; Hsu, K.; Kuligowski, B.; et al. The CHRS Data Portal, an easily accessible public repository for PERSIANN global satellite precipitation data. Nat. Sci. Data 2019, 6, 180296. [Google Scholar] [CrossRef] [Green Version]
- Joyce, R.J.; Janowiak, J.E.; Arkin, P.A.; Xie, P. CMORPH: A method that produces global precipitation estimates from passive microwave and infrared data at high spatial and temporal resolution. J. Hydromet. 2004, 5, 487–503. [Google Scholar] [CrossRef]
- Kucera, P.A.; Lapeta, B. Leading efforts to improve global quantitative precipitation estimation. Bull. Am. Meteorol. Soc. 2014, 95, ES26–ES29. [Google Scholar] [CrossRef]
- Das, S.; Maitra, A. Characterization of tropical precipitation using drop size distribution and rain rate-radar reflectivity relation. Theor. Appl. Climatol. 2018, 132, 275–286. [Google Scholar] [CrossRef]
- Joss, J.; Waldvogel, A. Ein Spektrograph fur Niederschlagstrophen mit automatischer Auswertung. Pure Appl. Geophys. 1967, 68, 240–246. [Google Scholar] [CrossRef]
- Sheppard, B. Effect of Irregularities in the Diameter Classification of Raindrops by the Joss-Waldvogel Disdrometer. J. Atmos. Ocean. Technol. 1990, 7, 180–183. [Google Scholar] [CrossRef] [Green Version]
- Gunn, R.; Kinzer, G.D. The Terminal Velocity Of Fall For Water Droplets In Stagnant Air. J. Meteorol. 1949, 6, 243–248. [Google Scholar] [CrossRef] [Green Version]
- Beard, K.V.; Pruppacher, H.R. A Determination of the Terminal Velocity and Drag of Small Water Drops by Means of a Wind Tunnel. J. Atmosph. Sci. 1969, 26 Pt 2, 1066. [Google Scholar] [CrossRef] [Green Version]
- Atlas, D.; Srivastava, R.C.; Sekhon, R.S. Doppler radar characteristics of precipitation at vertical incidence. Rev. Geophys. Space Phys. 1973, 11, 1–35. [Google Scholar] [CrossRef]
- Hosking, J.G.; Stow, C.D. Ground-based measurements of raindrop fall speeds. J. Atmos. Ocean. Technol. 1991, 8, 137–147. [Google Scholar] [CrossRef]
- Foote, G.B.; DuToit, P.S. Terminal velocity of raindrops aloft. J. Appl. Meteor. 1969, 8, 249–253. [Google Scholar] [CrossRef] [Green Version]
- Beard, K.V. Terminal velocity and shape of cloud and precipitation drops aloft. J. Atmos. Sci. 1967, 33, 851–864. [Google Scholar] [CrossRef] [Green Version]
- Montero-Martínez, G.; Kostinski, A.B.; Shaw, R.A.; García-García, F. Do all raindrops fall at terminal speed? Geophys. Res. Lett. 2009, 36, L11818. [Google Scholar] [CrossRef] [Green Version]
- Thurai, M.; Bringi, V.N.; Peterson, W.A.; Gatlin, P.N. Drop shapes and fall speeds in rain: Two contrasting examples. J. Appl. Meteorol. Climatol. 2013, 52, 2567–2581. [Google Scholar] [CrossRef]
- Thurai, M.; Bringi, V.; Gatlin, P.; Wingo, M. Raindrop fall velocity in turbulent flow: An observational study. Adv. Sci. Res. 2021, 18, 33–39. [Google Scholar] [CrossRef]
- Low, T.B.; List, R. Collision, coalescence, and breakup of raindrops. Part I: Experimentally established coalescence efficiencies and fragment size distributions in breakup. J. Atmos. Sci. 1982, 39, 1591–1606. [Google Scholar] [CrossRef] [Green Version]
- Pruppacher, H.R.; Klett, J.D. Microphysics of Clouds and Precipitation. D. Reidel 1978, 714. [Google Scholar] [CrossRef]
- Bringi, V.; Thurai, M.; Baumgardner, D. Raindrop fall velocities from an optical array probe and 2-D video disdrometer. Atmos. Meas. Tech. 2018, 11, 1377–1384. [Google Scholar] [CrossRef] [Green Version]
- Florian, W.; Martin, B.; Michael, S.; Detlef, D.; Oliver, B.; Peter, F. Uncertainties in rainfall kinetic energy-intensity relations for soil erosion modelling. Catena 2018, 171, 234–244. [Google Scholar]
- Larsen, M.L.; Kostinski, A.B.; Jameson, A.R. Further evidence for super-terminal drops. Geophys. Res. Lett. 2014, 41, 6914–6918. [Google Scholar] [CrossRef] [Green Version]
- Montero-Martínez, G.; García-García, F. On the behaviour of raindrop fall speed due to wind. Q. J. R. Meteorol. Soc. 2016, 142, 2013–2020. [Google Scholar] [CrossRef]
- Bolek, A.; Testik, F.Y. Rainfall Microphysics Influenced by Strong Wind during a Tornadic Storm. J. Hydrometeorol. 2021, 23, 733–746. [Google Scholar] [CrossRef]
- Ierace, B.; Larsen, M.; O’Dell, K.; Kostinski, A.B. Exploring the Possible Physical Origins of Raindrops falling at Non-Terminal Fallspeeds. In Proceedings of the AGU Fall Meeting, Chicago, IL, USA, 12–16 December 2020. [Google Scholar]
- Montero-Martínez, G.; Fernando, G.; Stefany, A. The change of rainfall kinetic energy content with altitude. J. Hydrol. 2020, 584, 124685. [Google Scholar] [CrossRef]
- Chatterjee, C.; Das, S. On the Association Between Lightning and Precipitation Microphysics. J. Atmos. Sol.-Terr. Phys. 2020, 207, 105350. [Google Scholar] [CrossRef]
- Smith, P.L.; Liu, Z.; Joss, J. A study of sampling-variability effects in raindrop size observations. J. Appl. Meteor. 1993, 32, 1259–1269. [Google Scholar] [CrossRef] [Green Version]
- Jaffrain, J.; Berne, A. Quantification of the small-scale spatial structure of the raindrop size distribution from a network of disdrometers. J. Appl. Meteorol. Climatol. 2012, 51, 941–953. [Google Scholar] [CrossRef]
- Gatlin, P.N.; Thurai, M.; Bringi, V.N.; Petersen, W.; Wolff, D.; Tokay, A.; Carey, L.; Wingo, M. Searching for Large Raindrops: A Global Summary of Two-Dimensional Video Disdrometer Observations. J. Appl. Meteorol. Climatol. 2015, 54, 1069–1089. [Google Scholar] [CrossRef]
- Tokay, A.; Wolff, D.B.; Petersen, W.A. Evaluation of the New Version of the Laser-Optical Disdrometer, OTT Parsivel2. J. Atmos. Ocean. Technol. 2014, 31, 1276–1288. [Google Scholar] [CrossRef]
- Tokay, A.; Short, D.A. Evidence from tropical raindrop spectra of the origin of rain from stratiform versus convective clouds. J. Appl. Meteor. 1996, 35, 355–371. [Google Scholar] [CrossRef] [Green Version]
- Caracciolo, C.; Prodi, F.; Battaglia, A.; Porcù, F. Analysis of the moments and parameters of a gamma DSD to infer precipitation properties: A convective stratiform discrimination algorithm. Atm. Res. 2006, 80, 165–186. [Google Scholar] [CrossRef]
- Li, X.; Tao, W.; Khain, A.P.; Simpson, J.; Johnson, D.E. Sensitivity of a cloud-resolving model to bulk and explicit bin microphysical schemes. Part II: Cloud microphysics and storm dynamics interactions. J. Atmos. Sci. 2009, 66, 22–40. [Google Scholar] [CrossRef] [Green Version]
- Friedrich, K.; Kalina, E.; Masters, F.; Lopez, C. Drop-Size Distributions in Thunderstorms Measured by Optical Disdrometers during VORTEX2. Mon. Weather Rev. 2013, 141, 1182–1203. [Google Scholar] [CrossRef]
- Niu, S.; Jia, X.; Sang, J.; Liu, X.; Lu, C.; Liu, Y. Distributions of Raindrop Sizes and Fall Velocities in a Semiarid Plateau Climate: Convective versus Stratiform Rains. J. Appl. Meteorol. Climatol. 2010, 49, 632–645. [Google Scholar] [CrossRef]
- Kinnell, P. Some observations on the Joss–Waldvogel rainfall disdrometer. J. Appl. Meteor. 1976, 15, 499–502. [Google Scholar] [CrossRef]
- Donnadieu, G. Comparison of results obtained with the VIDIAZ spectropluviometer and the Joss–Waldvogel rainfall disdrometer in a “rain of a thundery type”. J. Appl. Meteor. 1980, 19, 593–597. [Google Scholar] [CrossRef]
- Löffler-Mang, M.; Joss, J. An optical disdrometer for measuring size and velocity of hydrometeors. J. Atmos. Ocean. Technol. 2000, 17, 130–139. [Google Scholar] [CrossRef]
- Voida, A.; Judith, S.; Gary, M. Turbulence in the clouds: Challenges of cloud-based information work. In Proceedings of the SIGCHI Conference on Human Factors in Computing Systems, Paris, France, 27 April–2 May 2013. [Google Scholar]
- Das, S.K.; Simon, S.; Kolte, Y.K.; Krishna, U.V.M.; Deshpande, S.M.; Hazra, A. Investigation of Raindrops Fall Velocity During Different Monsoon Seasons Over the Western Ghats, India. Earth Space Sci. 2020, 7, e2019EA000956. [Google Scholar] [CrossRef] [Green Version]
- Tokay, A.; D’Adderio, L.P.; Wolff, D.B.; Petersen, W.A. A Field Study of Pixel-Scale Variability of Raindrop Size Distribution in the Mid-Atlantic Region. J. Hydrometeorol. 2016, 17, 1855–1868. [Google Scholar] [CrossRef] [PubMed]
- Radhakrishna, B.; Rao, T.N. Statistical characteristics of multipeak raindrop size distributions at the surface and aloft in different rain regimes. Mon. Weather Rev. 2009, 137, 3501–3518. [Google Scholar] [CrossRef]
Figure 1.
Location of the two study areas (red stars).

Figure 2.
Raindrop size distribution in Kolkata and Bologna for (a) the whole dataset, (b) convective rain and (c) stratiform rain.
Figure 2.
Raindrop size distribution in Kolkata and Bologna for (a) the whole dataset, (b) convective rain and (c) stratiform rain.


Figure 3.
Spread of velocity–diameter spectra for the whole dataset in (a) Kolkata and (b) Bologna; for convective rain in (c) Kolkata and (d) Bologna and for stratiform rain in (e) Kolkata and (f) Bologna. The colors represent the number of drops on the log10 scale. In the x- and y-axis, the diameters and velocities are sampled with the original Parsivel2 classes. The green line is the GK line, and the red line is the mean of the V-D relationship observed for the dataset with the standard deviations shown as error bars.

Figure 4.
Fraction of (a) the super- and (b) sub-terminal drops in the natural rain of Kolkata and Bologna. The fraction of sub- and super-terminal drops represents the ratio between these drops and the total number of drops.
Figure 4.
Fraction of (a) the super- and (b) sub-terminal drops in the natural rain of Kolkata and Bologna. The fraction of sub- and super-terminal drops represents the ratio between these drops and the total number of drops.

Figure 5.
Fraction of super-terminal drops for (a) convective and (b) stratiform rain in Kolkata and Bologna. The fraction of super-terminal drops represents the ratio of these drops and the total number of drops.
Figure 5.
Fraction of super-terminal drops for (a) convective and (b) stratiform rain in Kolkata and Bologna. The fraction of super-terminal drops represents the ratio of these drops and the total number of drops.

Figure 6.
Fraction of sub-terminal drops for (a) convective and (b) stratiform rain in Kolkata and Bologna. The fraction of sub-terminal drops represents the ratio of these drops and the total number of drops.
Figure 6.
Fraction of sub-terminal drops for (a) convective and (b) stratiform rain in Kolkata and Bologna. The fraction of sub-terminal drops represents the ratio of these drops and the total number of drops.

Figure 7.
Distribution of HS values in natural rain of Bologna and Kolkata.

Figure 8.
Distribution of wind speed during rain events.

Figure 9.
Fraction of super-terminal drops in the rain events in (a) Kolkata and (b) Bologna. The color bar represents the fraction of drops. The x-axis represents the drop diameters binned by Parsivel2 classes, whereas the y-axis shows the different events for each site.
Figure 9.
Fraction of super-terminal drops in the rain events in (a) Kolkata and (b) Bologna. The color bar represents the fraction of drops. The x-axis represents the drop diameters binned by Parsivel2 classes, whereas the y-axis shows the different events for each site.

Figure 10.
The fractions of sub-terminal drops in the rain events in (a) Kolkata and (b) Bologna. The color bar represents the fraction of drops. The x-axis represents the drop diameters binned by Parsivel2 classes, whereas the y-axis shows the different events for each site.
Figure 10.
The fractions of sub-terminal drops in the rain events in (a) Kolkata and (b) Bologna. The color bar represents the fraction of drops. The x-axis represents the drop diameters binned by Parsivel2 classes, whereas the y-axis shows the different events for each site.

Figure 11.
Distribution of the fractions of break-up minutes in events with lower (than average) and higher (than average) percentage of super-terminal drops in (a) Kolkata and (b) Bologna. The break-up minute fraction represents the ratio of the number of break-up minutes with the total rain minutes.

Figure 12.
Distribution of the peak Dm in events with a lower (than average) and higher (than average) percentage of sub-terminal drops in (a) Kolkata and (b) Bologna.
Figure 12.
Distribution of the peak Dm in events with a lower (than average) and higher (than average) percentage of sub-terminal drops in (a) Kolkata and (b) Bologna.

Figure 13.
Relation between (a) the break-up minute fraction and fraction of super-terminal drops and (b) peak Dm and fraction of sub-terminal drops in Kolkata and Bologna. The break-up minute fraction represents the ratio of the number of break-up minutes with the total rain minutes.
Figure 13.
Relation between (a) the break-up minute fraction and fraction of super-terminal drops and (b) peak Dm and fraction of sub-terminal drops in Kolkata and Bologna. The break-up minute fraction represents the ratio of the number of break-up minutes with the total rain minutes.


Table 1.
Number of DSDs in the C/S classes.
| Kolkata | Bologna | |
|---|---|---|
| Convective | 1503 | 2137 |
| Stratiform | 1760 | 2828 |
| Total | 3263 | 4965 |
Table 2.
Number of DSD samples (2 min) in different HS classes. Cells in grey represent classes where break-up exists.
Table 2.
Number of DSD samples (2 min) in different HS classes. Cells in grey represent classes where break-up exists.
| Kolkata | Bologna | |
|---|---|---|
| HS < −2 | 88 | 176 |
| −2 < HS < −1.5 | 124 | 164 |
| −1.5 < HS < −1 | 201 | 187 |
| −1 < HS < −0.5 | 120 | 100 |
| −0.5 < HS < 0 | 39 | 56 |
| HS > 0 | 26 | 22 |
Table 3.
Statistics of non-terminal drops in Bologna and Kolkata **.
| Average Non-Terminal Fraction | No. of Events Higher Non-Terminal Fraction | No. of Events Lower Non-Terminal Fraction | ||
|---|---|---|---|---|
| Bologna | Super | 0.09 | 9 | 5 |
| Sub | 0.08 | 7 | 7 | |
| Kolkata | Super | 0.05 | 9 | 17 |
| Sub | 0.21 | 8 | 18 |
** The events with higher non-terminal fraction represent events with higher than average non-terminal drops.
Publisher’s Note: MDPI stays neutral with regard to jurisdictional claims in published maps and institutional affiliations. |
© 2022 by the authors. Licensee MDPI, Basel, Switzerland. This article is an open access article distributed under the terms and conditions of the Creative Commons Attribution (CC BY) license (https://creativecommons.org/licenses/by/4.0/).
Share and Cite
MDPI and ACS Style
Chatterjee, C.; Porcù, F.; Das, S.; Bracci, A. An Investigation on Super- and Sub-Terminal Drops in Two Different Rain Categories and Climate Regimes. Remote Sens. 2022, 14, 2515. https://doi.org/10.3390/rs14112515
AMA Style
Chatterjee C, Porcù F, Das S, Bracci A. An Investigation on Super- and Sub-Terminal Drops in Two Different Rain Categories and Climate Regimes. Remote Sensing. 2022; 14(11):2515. https://doi.org/10.3390/rs14112515
Chicago/Turabian StyleChatterjee, Chandrani, Federico Porcù, Saurabh Das, and Alessandro Bracci. 2022. "An Investigation on Super- and Sub-Terminal Drops in Two Different Rain Categories and Climate Regimes" Remote Sensing 14, no. 11: 2515. https://doi.org/10.3390/rs14112515
Note that from the first issue of 2016, this journal uses article numbers instead of page numbers. See further details here.