Article

Vertical Structure of Dust Aerosols Observed by a Ground-Based Raman Lidar with Polarization Capabilities in the Center of the Taklimakan Desert

1
Key Laboratory for Semi-Arid Climate Change of the Ministry of Education, College of Atmospheric Sciences, Lanzhou University, Lanzhou 730000, China
2
Collaborative Innovation Center for West Ecological Safety (CIWES), Lanzhou University, Lanzhou 730000, China
3
Institute of Desert Meteorology, China Meteorological Administration, Urumqi 830002, China
4
National Observation and Research Station of Desert Meteorology, Taklimakan Desert of Xinjiang, Bayingol Mongolian Autonomous Prefecture, Korla 841000, China
5
Xinjiang Key Laboratory of Desert Meteorology and Sandstorm, Urumqi 830002, China
*
Author to whom correspondence should be addressed.
Remote Sens. 2022, 14(10), 2461; https://doi.org/10.3390/rs14102461
Submission received: 9 April 2022 / Revised: 9 May 2022 / Accepted: 17 May 2022 / Published: 20 May 2022

Abstract

:
The vertical structure of dust properties in desert sources is crucial for evaluating their long-range transportation and radiative forcing. To investigate vertical profiles of dust optical properties in the Taklimakan Desert, we conducted ground-based polarization Raman lidar measurements in Tazhong (83.39°E, 38.58°N, 1103 m above sea level), located at the center of the Taklimakan Desert in the summer of 2019. The lidar system developed by Lanzhou University for continuous network observation is capable of measuring polarization at 532 and 355 nm and detecting Raman signals at 387, 407, and 607 nm. The results indicate that dust aerosols in the central Taklimakan Desert were regularly lifted over 6 km during the summer with a mass concentration of 400–1000 µg m−3, while the majority of the dust remained restricted within 2 km. Moreover, the height of the boundary layer can reach 5–6 km in the afternoon under the strong convention. Above 3 km, dust is composed of finer particles with an effective radius (Reff.) less than 3 μm and a Ångström exponent (AE) related to the extinction coefficient (AEE)532,355 greater than 4; below 3 km, however, dust is dominated by coarser particles. In addition, the particle depolarization ratios (PDR) of Taklimakan dust are 0.32 ± 0.06 at 532 nm and 0.27 ± 0.04 at 355 nm, while the lidar ratios (LRs) are 49 ± 19 sr at 532 nm and 43 ± 12 sr at 355 nm. This study firstly provides information on dust vertical structure and its optical properties in the center of the desert, which may aid in further evaluating their associated impacts on the climate and ecosystem.

Graphical Abstract

1. Introduction

Dust is a significant component of the environmental and atmospheric system in the northern hemispheric dust belt, which stretches from the Sahara in northern Africa to the Taklimakan and Gobi deserts in China [1,2]. At present, dust accounts for approximately one-third of all naturally-formed aerosols on a worldwide scale [3], which equates to approximately 600 Mt annually [4]. Globally, natural dust sources account for 75% of emissions, while anthropogenic sources account for 25% [5]. East Asia is estimated to be the third largest contributor to the global dust budget, accounting for 11% and 6% of the total global dust emission and dust load, respectively [6]. The Taklimakan Desert is the world’s second-largest shifting sand desert, formed by tectonic activity [7]. Dust particles from the Taklimakan Desert can be entrained at elevations exceeding 7000 m and subsequently transported over long distances (~5000 km) by the westerlies [8,9]. Taklimakan dust can reach altitudes of up to 6 km in all seasons [9], reaching nearby sites such as Korla [10], Kashi [11], Aksu [12], the Tibetan Plateau [13], and Mongolia [6]. For instance, long-range transport to Hanoi accounted for 76% of extreme events [14]. Additionally, it was transported in some form to North America [12], with easterly directions propagating dust plumes affecting Korea, Japan, the Arctic, and eventually reaching the United States after crossing the Pacific Ocean [15,16].
The dust has significant impacts on the climate, radiative budgets, cirrus clouds formation and marine ecosystems, rainfall patterns, and human health [17,18,19,20,21]. Dust affects atmospheric radiation in three ways: (1) directly by absorbing, reflecting, and scattering short- and long-wave radiation; (2) semi-directly by warming clouds, increasing the evaporation of liquid water droplets, and further reducing the cloud water path; and (3) indirectly by aerosol–cloud interactions [22,23]. Dust particles contribute to the formation of ice nuclei particles and mixed-phase clouds. Mineral dust is the dominant natural ice-nucleating aerosol, and even a trace amount of a highly soluble component significantly enhances the potential of fine particles of dust to act as cloud condensation nuclei [24]. Additionally, coating natural dust ice nuclei with soluble material derived from anthropogenic sources can result in a quasi-deactivation of nuclei [25]. Gobi dust impacts climate change in coastal East Asia by affecting spring water clouds at higher latitudes as water nuclei, whereas Taklimakan dust impacts climate change in coastal East Asia by altering convective clouds and precipitation as ice nuclei at lower latitudes [26]. Long-range-transported mineral dust affects convective clouds and precipitation by acting as ice-nucleating particles [27].
The contribution of the lidar technique to our understanding of the composition and structure of a variety of particles has been demonstrated through modeling, theoretical, and experimental results [28,29]. Then, lidar continued to evolve toward multi-wavelength high-precision measurements, eventually developing into spaceborne lidar capable of recording more precise observations of dust from multiple angles, widely used [30,31,32,33]. Lidar is being used to further investigate the mass concentration, optical depth, and other microphysical characteristics of dust [34,35]. The variance in depolarization ratios and backscattered light enables the spatial correlation between layer-integrated attenuated backscatter and layer-integrated particulate depolarization ratio to be used to distinguish between different types and phases of particles (e.g., clouds and dust plumes) [36]. The polarization technique reveals significant differences for various types of aerosols and clouds [37], allowing for the separation of mineral dust and non-dust aerosol components, as well as for the separation of dust backscatter components into fine and coarse dust fractions [38]. The LR of Asian dust varies between 42 and 55 sr in most cases, with a mean of 51 sr, as recorded for the first time in the springs of 1998 using high-spectral-resolution lidar and Raman lidar [39].
Although the Taklimakan Desert is a hotspot for severe environmental problems that dramatically affect human life due to profound climate change, only a few studies have been performed thus far on the optical–microphysical properties of aerosols using multi-wavelength Raman polarization lidar. The multi-wavelength Raman polarization lidar system, developed by Lanzhou University for continuous network observation, is deployed in the central Taklimakan Desert to simultaneously detect Mie backscattering signals at visible and ultraviolet wavelengths, as well as vibrational Raman signals at 387 and 607 nm. This remainder of this study is organized as follows: The measurements, instrumentation, and methodology are described in Section 2. The results are presented and discussed in Section 3 and Section 4. The summary and conclusions are provided in Section 5.

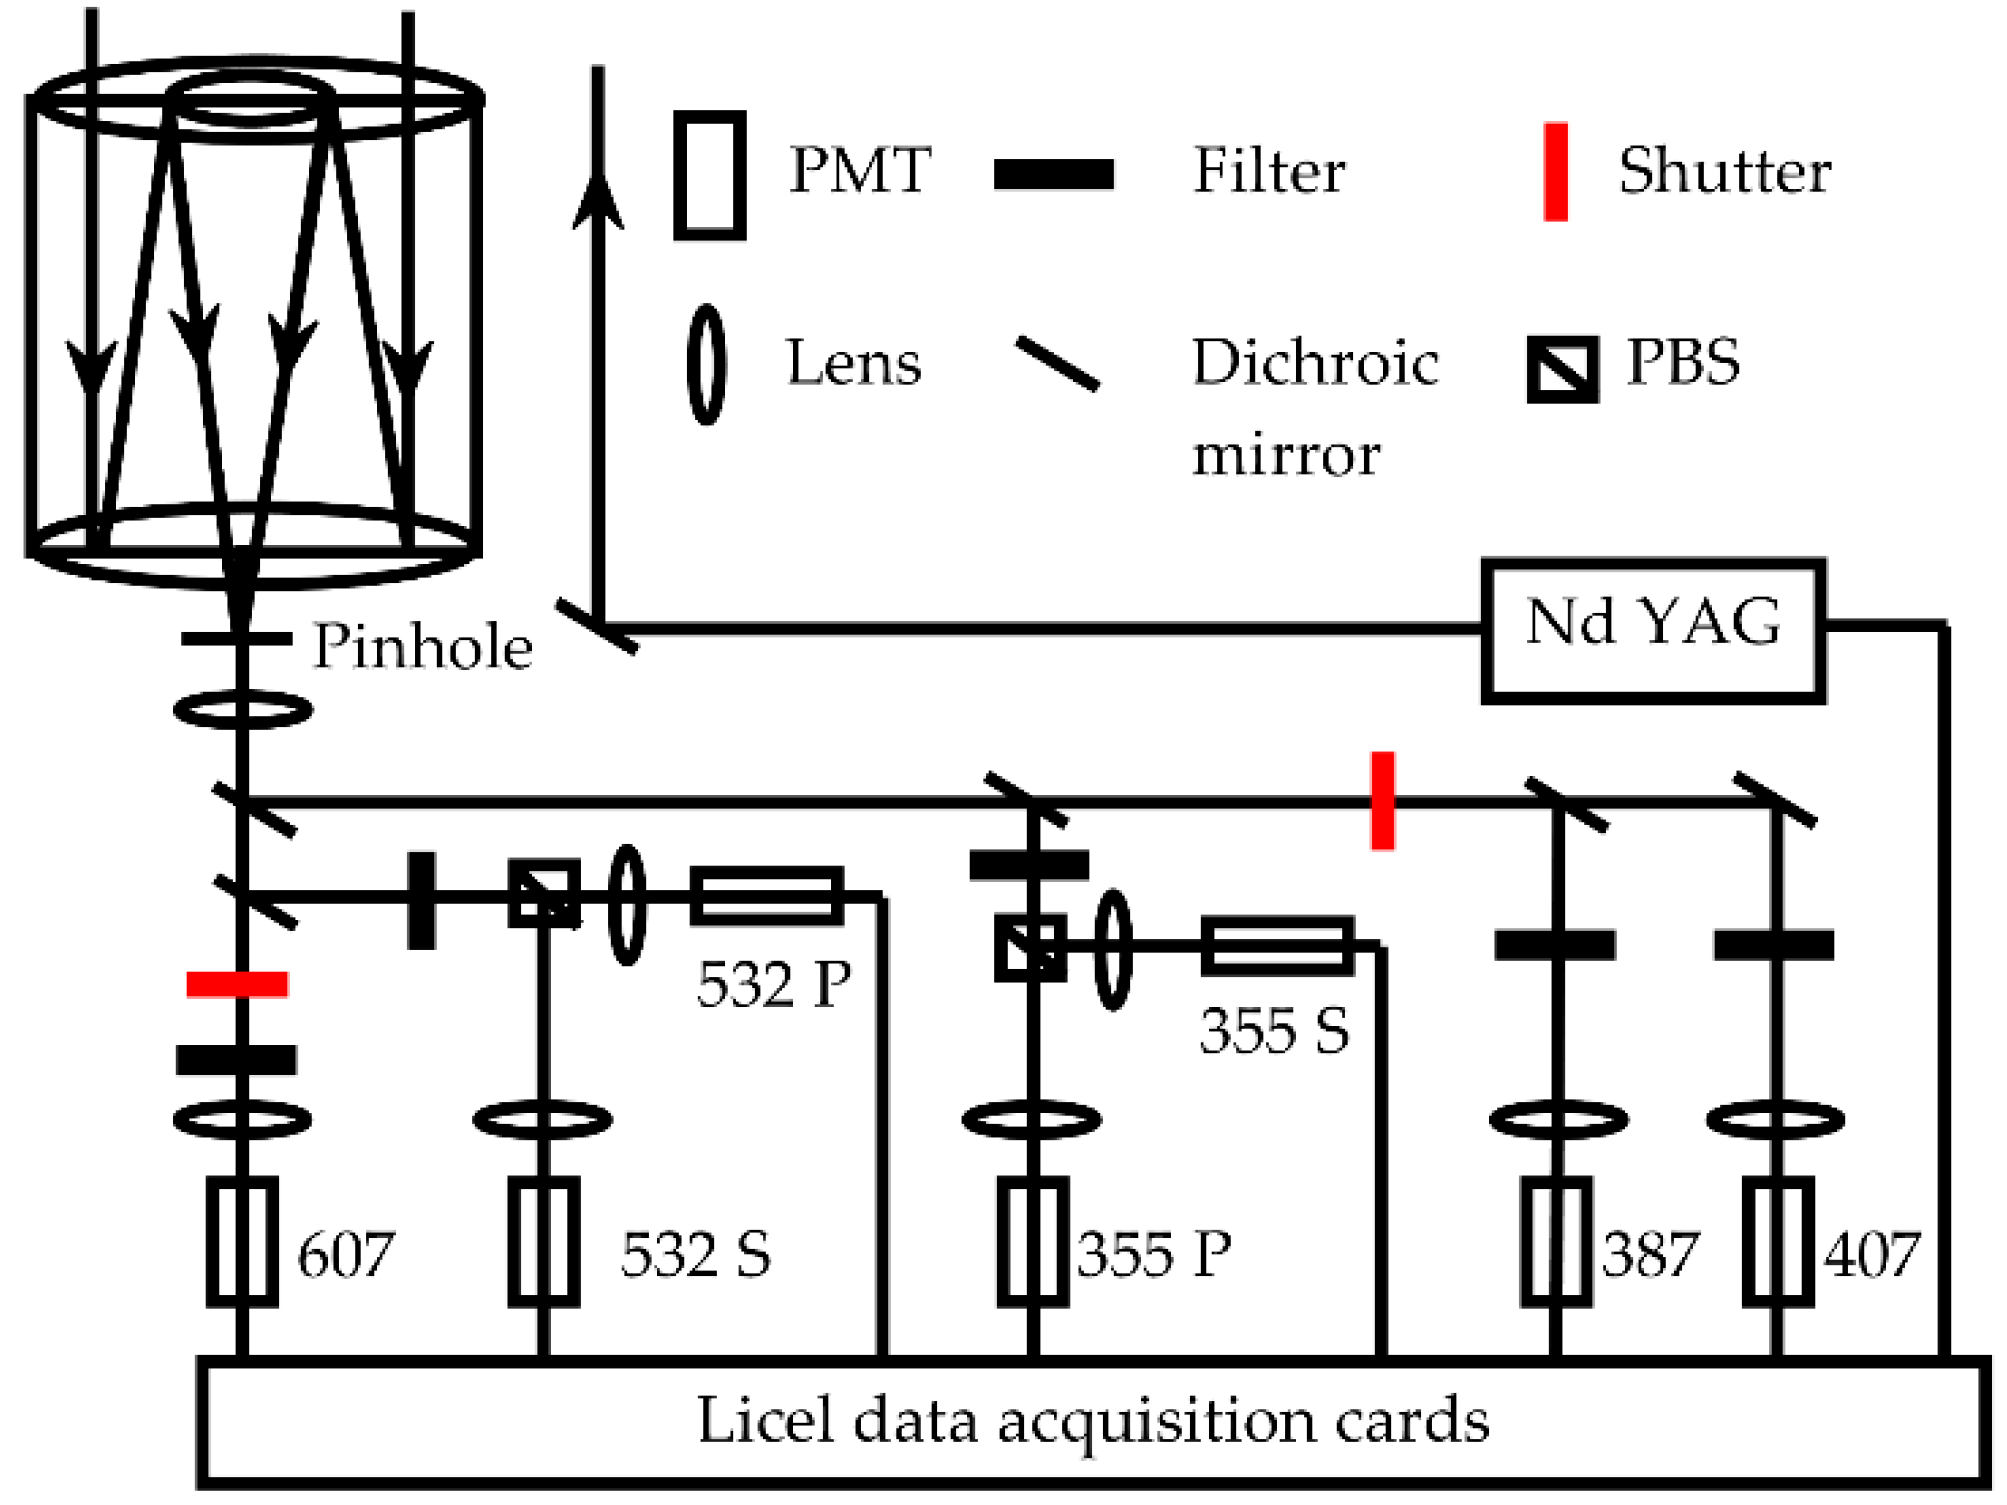
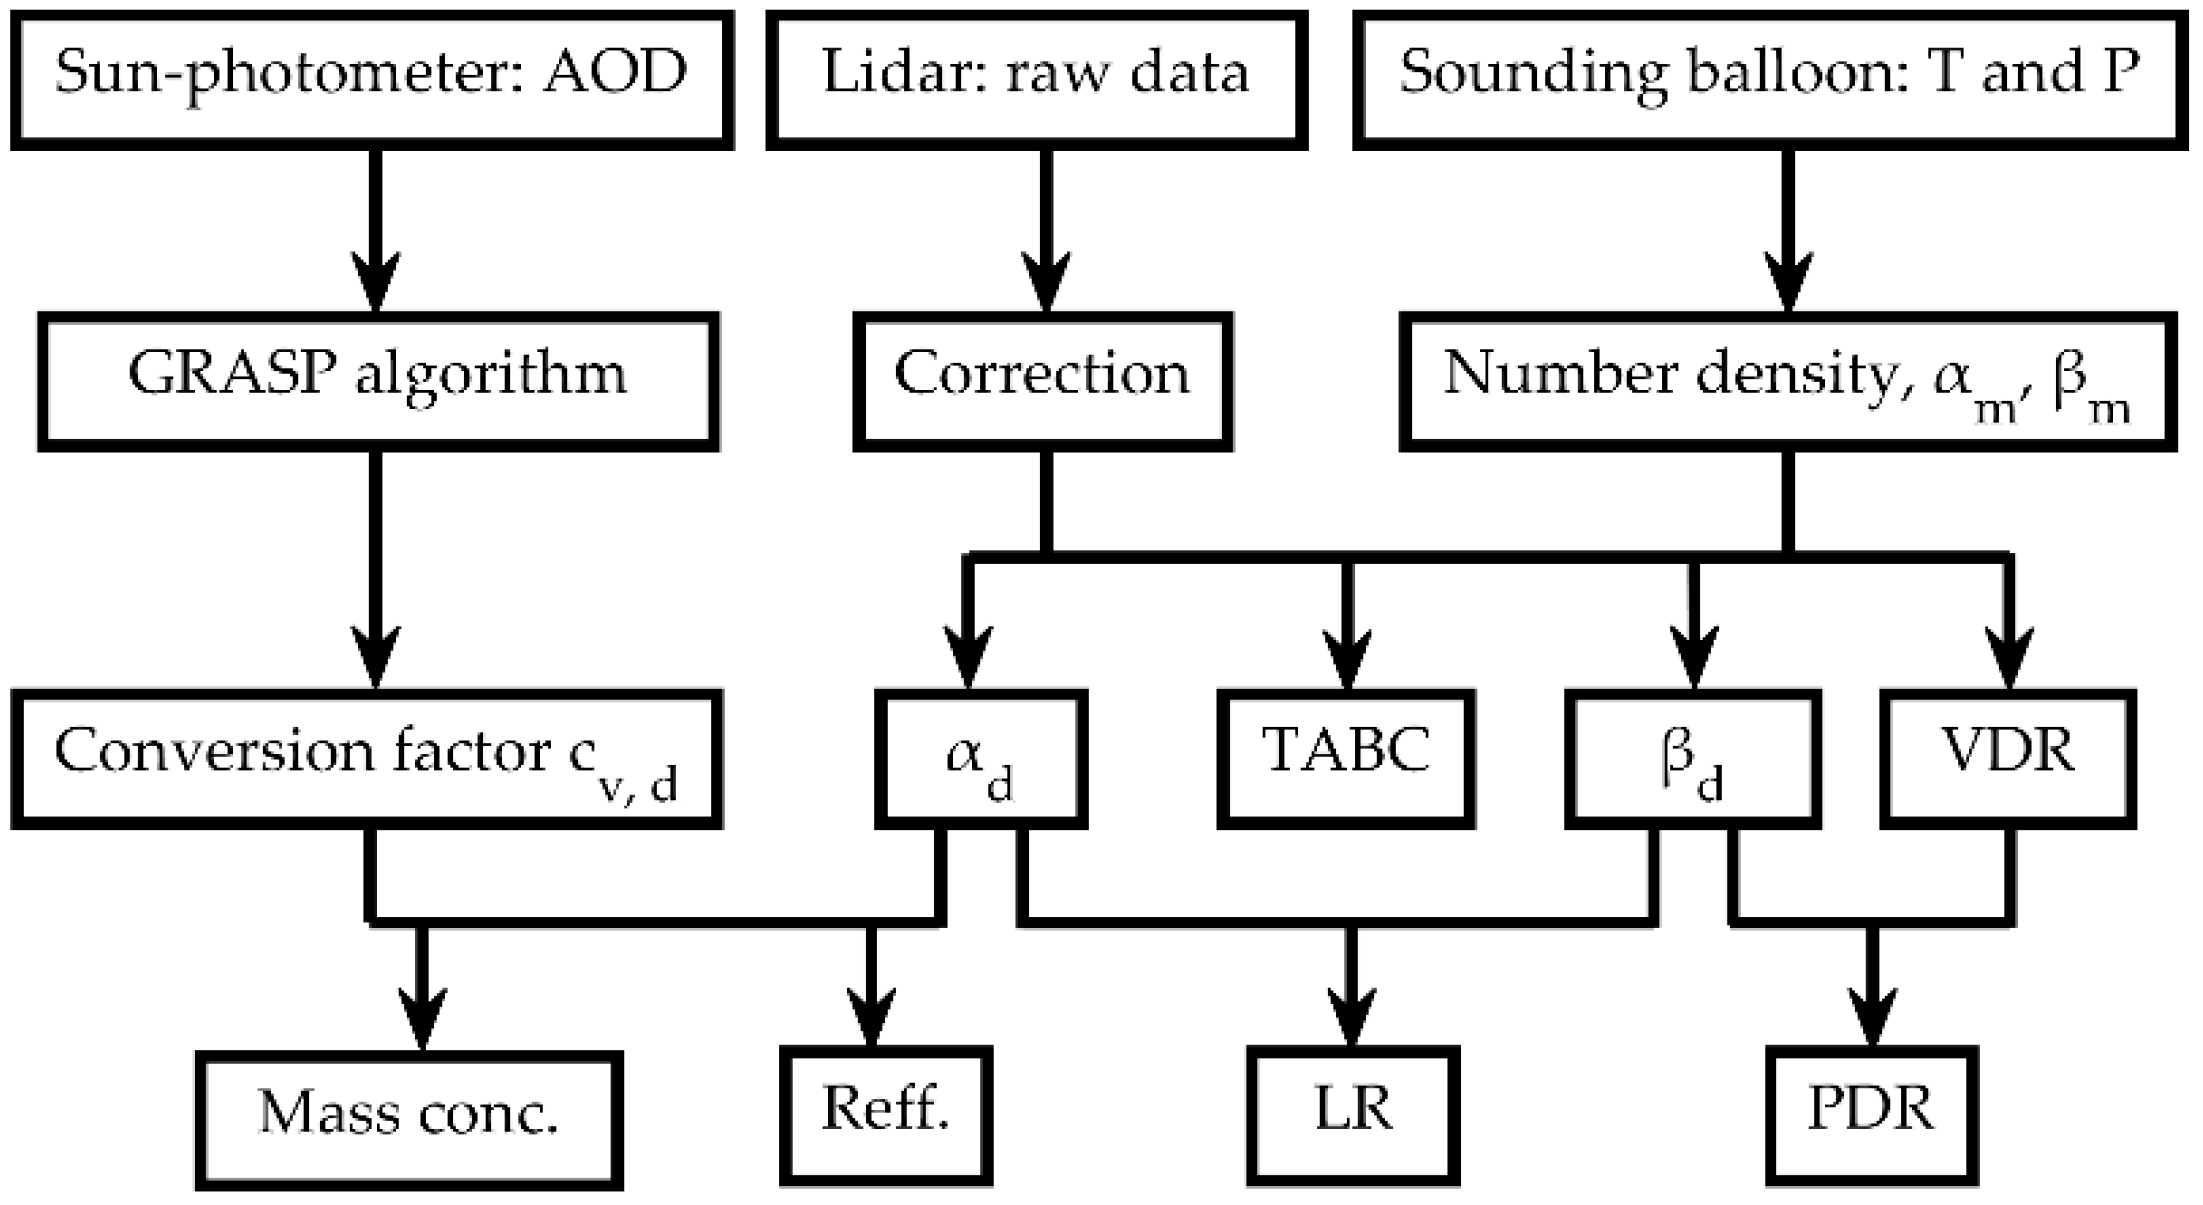
2. Lidar Systems and Methods

The Raman-polarization lidar system is composed of two components: a transmitting and a receiving system. The transmitting system includes: an Nd: YAG laser emitting a 1064 nm laser, a double and triple frequency amplifier converting the 1064 nm laser to 532 and 355 nm lasers. The receiving system includes: a 400 mm diameter telescope for receiving the laser scatter from the atmosphere, photomultiplier tubes (PMT), and polarization beam splitters (PBS). Photon counting mode was employed at wavelengths of 387, 407, and 607 nm with a vertical resolution of 7.5 m, while both photon counting and analog modes were used at wavelengths of 532 and 355 nm with a vertical resolution of 3.75 m. The observed data has a temporal resolution of 3 min. Original signals were pre-processed by background subtraction, photon-counting signal dead-time correction, and overlap correction [40,41]. Then, the lidar polarization calibration ratio (K) and the lidar system constant (C) are calculated for each wavelength [36]. Figure 1 illustrates the schematic diagram of the developed multi-wavelength Raman polarization lidar used in this paper.
The LR can be retrieved using the sun photometer [42] or by integrating cloud-aerosol lidar with orthogonal polarization (CALIOP) total attenuated backscatter coefficients (TABC) and moderate resolution imaging spectroradiometer (MODIS) aerosol optical depths (AOD) [43]. Additionally, it can be derived by constraining the lidar solution using column AOD from co-located ground-based photometers and calculating a layer-averaged LR based on aircraft-based observations [44]. The vibrational Raman method is highly accurate, simple to manufacture, and requires no additional parameters in this experiment. The dust extinction coefficient ( α d ), the dust backscatter coefficient ( β d ), and the profile of the LR utilized in this study were computed using the method proposed by Albert Ansmann [45]. The molecules extinction coefficient ( α m ), the dust backscatter coefficient ( β m ), and the height profile of the molecules density are estimated using air pressure (P) and temperature (T) detected at various heights by a sounding balloon [46]. The dust mass concentration Md,z can be computed using Equation (1).
M d , z = ρ d × α d , z × c v , d ,
where ρd is the dust particle density, ρd = 2.9 g cm−3 for Asian dust, and cv,d is obtained from a sun photometer observation [47]. The AOD was used as an input to retrieve the effective radius (Reff) using the GRASP algorithm (https://www.grasp-open.com, (accessed on 1 October 2021)) [48]. The vertical structure of Reff was determined using linear estimation [49].
The PDR was calculated by Equation (2) of reference [50]. The planetary boundary height (BLH) was calculated using a maximum difference search algorithm that incorporated the TABC and volume polarization ratio (VDR) measured by multi-wavelength polarization lidar at wavelengths of 532 and 355 nm, respectively [51]. TABC and VDR were given by Equations (2) and (3).
T A B C λ , r = P , λ , r / K λ + P , λ , r C λ , r G λ , r ,
V D R λ , r = P , λ , r P ,   λ , r K λ
where P‖,λ,r and P⊥,λ,r are the horizontal and polarization signals, respectively, at various wavelengths λ in the distance r. Kλ, Cλ, and Gλ,r are the lidar polarization calibration ratio, the system lidar constant, and the overlap factor of Raman lidar at wavelength λ in the distance r. AEE aid in the differentiation of fine mode particles (e.g., smoke and industrial aerosols) from coarse mode particles (e.g., dust, sea salt, and cloud). Although fine mode particles show a higher AEE than coarse mode particles, the value of AEE for particles with a significant coarse mode (e.g., desert dust) provides relevant information on the relative influence of coarser particles [52]. A diagram of the data analysis and methods is provided in Figure 2.
Throughout the study period, ground-based PM10 (particles with an aerodynamic diameter of less than 10 mm) concentrations were measured in conjunction with a sun photometer and lidar to determine the size distribution of Taklimakan Desert dust.
Moderate Resolution Imaging Spectroradiometer (MODIS) satellite remote sensing aerosol optical depth (AOD) not only benefits from a high correlation between spatial scale and ground particulate matter, but also from a high inversion accuracy [53]. This paper makes use of AOD at 550 nm (combined dark target and deep blue) and AE412–470 (deep blue) provided by MODIS on the Aqua satellite (https://ladsweb.modaps.eosdis.nasa.gov/search/, (accessed on 1 July 2020)) to present an overview of Tazhong and its surrounding areas.

3. Results

The number of days with dust storms in the Taklimakan Desert decreased from 1960 to 2005 [54], and the spring dust storm frequency index exhibited a decadal trend from 1960 to 2003 [55]. An increase in precipitation, strong wind (wind speed ≥ 5 m s−1), and T all contributed to the decrease in dust storms, with precipitation and T having a detrimental effect, and strong wind having a positive impact on the occurrence of dust storm events in the Taklimakan region [56]. The annual AOD in Tazhong decreased by −0.00051 year−1 (R2 = 0.01) from 2003 to 2020, while temperature decreased by 0.17 °C year−1 (R2 = 0.30), RH increased by 0.31% year−1 (R2 = 0.37), and wind speed increased by 0.0035 m s−1 year−1 (R2 = 0.52). The enhanced probability of dust storms in Africa [57] and the western United States [58] is associated with human activity. The Taklimakan Desert, a significant source of natural dust in East Asia, is characterized by a lack of human activity and more absorptive of solar radiation compared with the aerosols of Saharan dust [23]. On a multi-decadal to centennial timeline, the increase in human activity during the late Holocene resulted in a shift from natural to anthropogenic forcing of dust storms [4]. Throughout the summer, considerable rainfall occurs in the southeast coastal areas, having a significant impact on the economy and people’s lives. Identifying the specific characteristics of summer dust in the Taklimakan Desert that contribute to summer precipitation and the formation of convective clouds is a critical issue to address. Using Taklimakan’s central site as a research station, we will explore the characteristics of summer dust in the region.

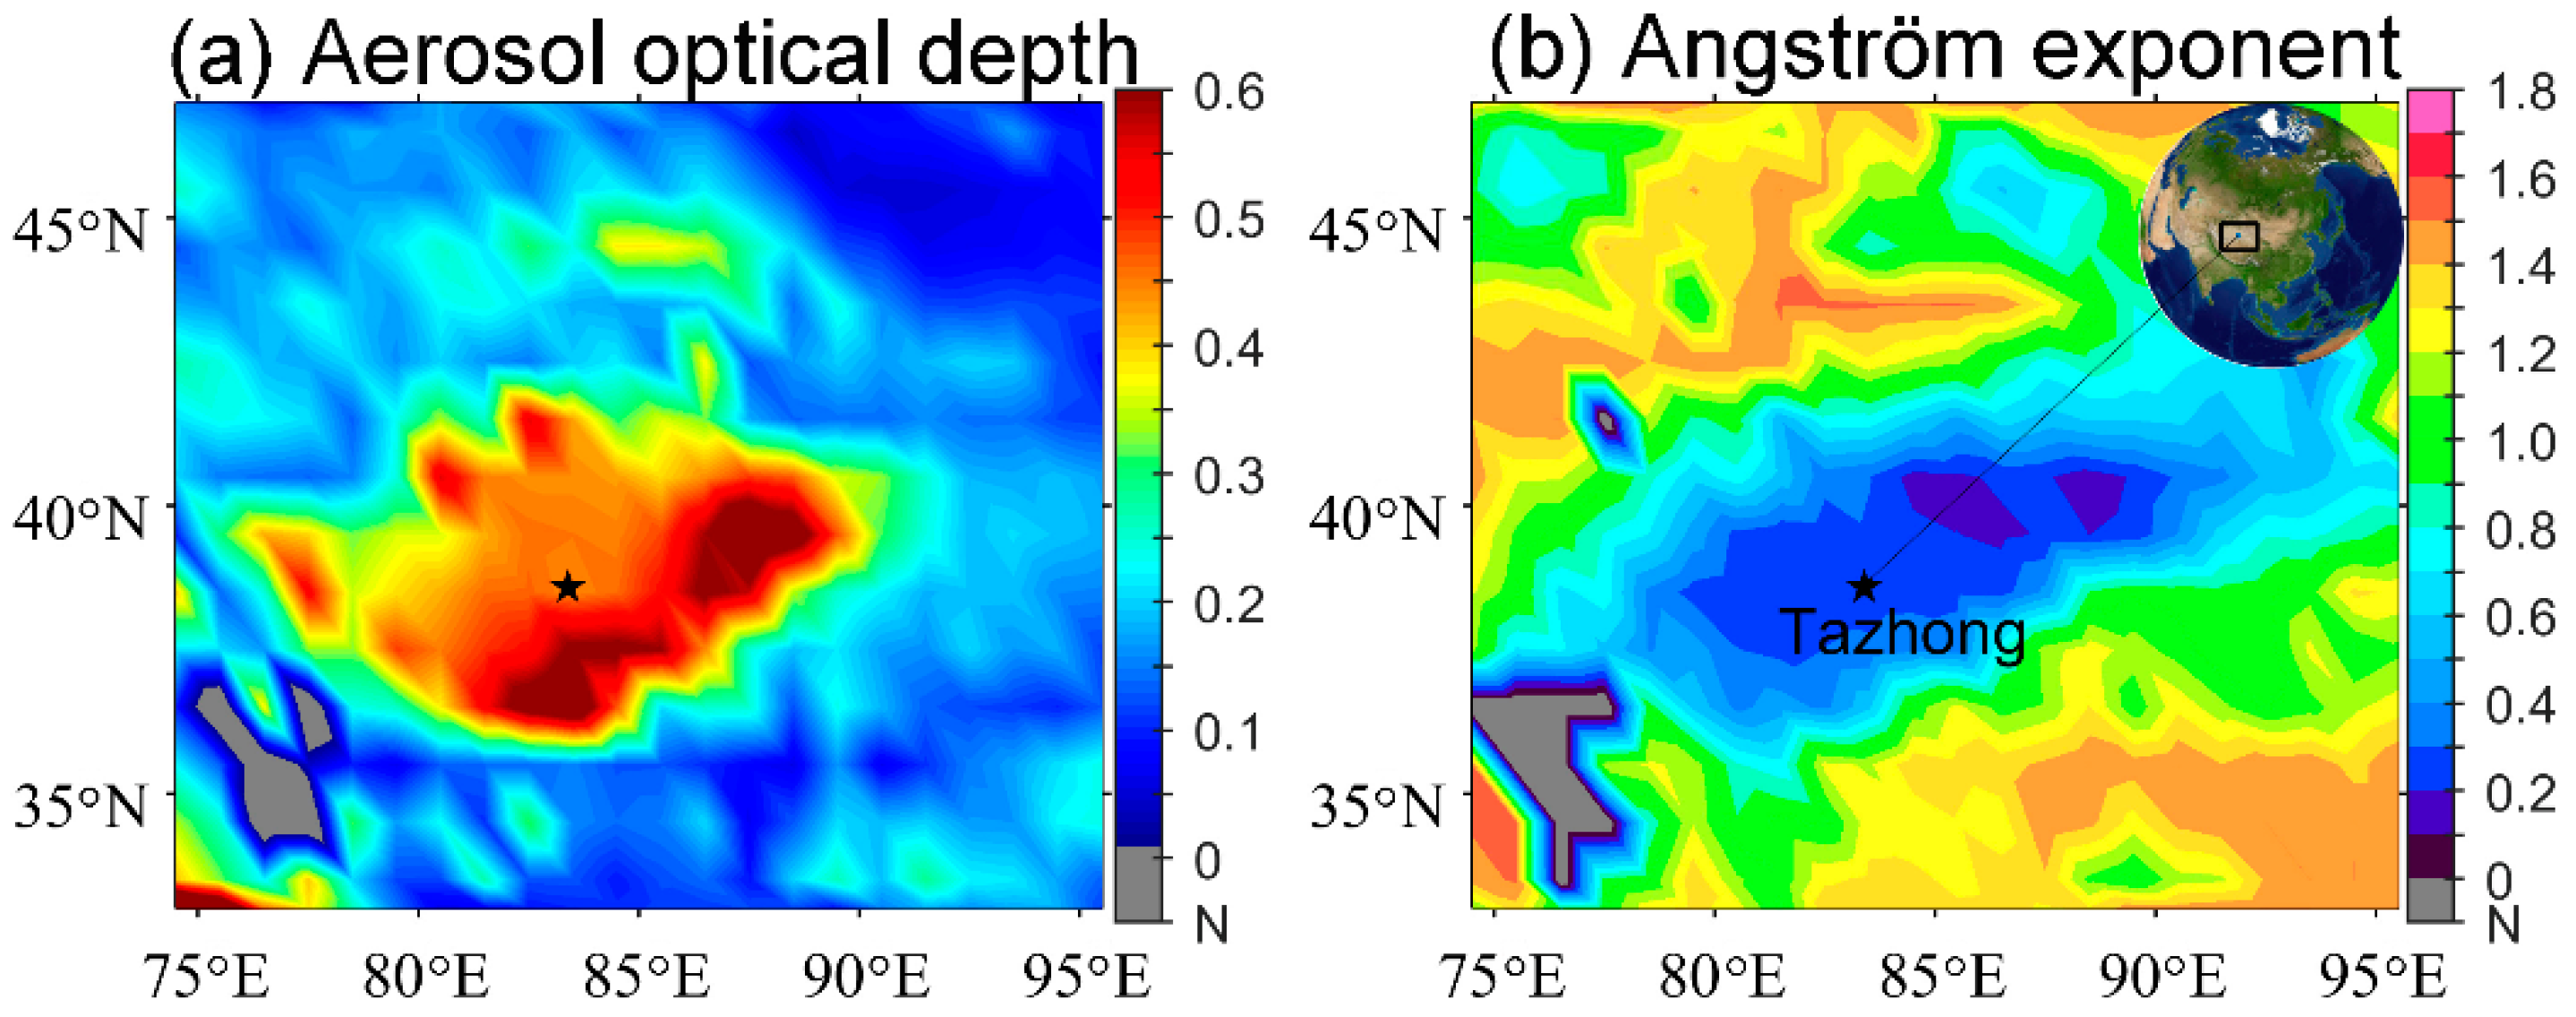
3.1. Dust Optical Properties from MODIS and Ground-Based Sun Photometer Observations

The geographic location of the study site is shown in Figure 3 and is denoted by a black star.
Aerosols in the Taklimakan Desert are more concentrated and coarser than those in the surrounding area. The average AOD from 2003 to 2020 in the Tazhong area (radius < 5°) of the 550 nm wavelength channel is 0.40, with a seasonal distribution of spring (March, April, May; 0.77) > summer (June, July, August; 0.44) > winter (December, January, February; 0.21) > autumn (September, October, November; 0.17) from MODIS, indicating that spring is the season with the most dust in the Taklimakan Desert. Figure 3b shows that the average AE412–470 in Tazhong from 2003 to 2020 is 0.46, with a seasonal distribution of winter (0.74) > autumn (0.63) > summer (0.25) > spring (0.21). The average aerosol single scattering albedo at 483.5 nm measured by MODIS in Tazhong is 0.895 from 2003 to 2020, with a seasonal distribution of winter (0.913) > spring (0.905) > autumn (0.895) > summer (0.868) at wavelengths up to 470 nm.
Figure 4a depicts the AOD at 532 nm and the AE measured during the East Asian dust observation campaign in July 2019. The AOD varies between 0.03 and 3.60, while the AE varies between 0.0 and 3.4. The average mean AE440–870 from the sun photometer and the average AOD at wavelengths of 340 and 532 nm are 0.63, 0.81, and 0.71, respectively, at Tazhong from 3 to 31 July 2019. The AOD varies between 0.07 and 4.70, while the AE varies between 0.0 and 0.8 in Kashi in April 2019 [2]. An extreme dust event with an AOD of 1.5 and an AE of 0.12 occurred in Dushanbe, while the pollution aerosol of local origin had an AE of 2.07 [2]. According to MODIS, the AOD exceeded 5.0 at 550 nm over a large portion of the eastern Mediterranean [59]. Dust is a dominant contributor to AOD over West Africa during the monsoon season [60]. AOD values were found to be between 0.6 and 0.8 during an episode of Sahara-originated dust in the Anatolian Peninsula of Turkey [61]. Gkikas et al. [62] classified dust events in the Mediterranean region based on the long-term average of the AOD measured by satellite MODIS and ground stations (sun-photometric). According to this standard, AOD levels are defined for each geographical cell, separately for strong (mean + 2standard deviation (STDV) ≤ AOD550 < mean + 4STDV) and extreme (AOD550 ≥ mean + 4STDV) aerosol episodes. This classification can be applied to the station in Tazhong using MODIS data from July 2010 to July 2020 (216 months) at 550 nm and sun-photometric (level 1.5, cloud screened) data from July 3 to July 31, 2019 (29 days) at a wavelength of 532 nm to account for the multi-wavelength Raman-polarization lidar. The average AOD at 550 nm for the month is 0.40, with an STDV of 0.29. Thus, in Tazhong, days with an AOD ≥ 0.98 are regarded as strong dust events, while those with an AOD ≥ 1.57 at 550 nm are classified as extreme dust events. As measured by sun photometer at wavelength 550 nm from 3 July to 31 July 2019, there were four episodes of strong dust and six episodes of extreme dust according to this classification.
Taklimakan Desert dust contains a high proportion of coarse-mode and giant particles (radius > 20 µm) [13,63]. Therefore, PM10 can only represent the dust intensity to a certain extent. According to Theodosi et al. [64], PM10 concentrations were apportioned to natural sources (27%), traffic and industrial activities (22%), fuel oil combustion (16%), secondary sources (10%), and ammonium sulfate (7%). When examining the AOD-PM2.5 relationships, aerosol type, relative humidity, planetary boundary layer height, wind speed and direction, and the vertical structure of the aerosol distribution should be taken into account [65]. Dust aerosols contributed between 31% and 40% of PM10 during dusty days, which was significantly more than the 10–20% contribution from local soil dust during non-dusty days [66]. Kabatas et al. estimated that desert dust accounted for 96.6% of PM10 concentrations [61]. To distinguish “dusty days” from other days, a threshold for PM10 concentration (e.g., 100 mg m−3) was used in this study [67]. During Saharan dust, daily mean PM10 concentrations reach 180 and 160 µg m−3 in the Marmara and Aegean Regions, respectively [68]. At Cabo Verde, following the long-range transport of dust over 1000–3000 km, the ratio of total suspended particle (TSP) to PM10 particle mass concentration was found to be mostly between 1.2 and 1.5 [69]. It is proportional to a peak particle α of 6000 Mm−1 and a peak total suspended particles (TSP) mass concentration of 10,000 µg m−3 [59]. This peak TSP value is approximately 1.25–1.3 times the maximum hourly mean PM10 value measured in situ, which is approximately 7600 µg m−3, hourly and in situ means of PM10 and TSP listed in Tazhong from 1 July to 31 August in Table 1. Hourly mean is calculated from in situ observation with a temporal resolution of 5 min.
According to Yang et al., Taklimakan sandstorms occur more frequently during daylight hours [70]. The stable boundary layer at nighttime was approximately 400–800 m thick, and the residual mixing layer above it could reach a thickness of over 3000 m, with a supernormal thickness existing over the Taklimakan Desert during the summer when it rained [71]. Taklimakan has a higher BLH than the Tibetan Plateau above 2000 m [72], while Wuhan has 90% of daytime BLHs between 400 and 1800 m [73]. BLH has a distinct peak at 1500 local standard time (LST) and a morning (afternoon) transition at 0600 (2100) LST. The evening transition is more distinct and abrupt at 1800 LST than the morning rise at 0900 LST, reaching a daily peak around 15:00 LST [74]. The global annual BLH has been increasing on average (38.9–42.1 m decade−1), and dry and hot soil in the summer exhibits a deeper BLH than wet and cool soil [75]. Aerosols are concentrated primarily within the PBL; when compared to the AOD of the entire atmosphere, the AOD below 500 m has a stronger correlation with PM2.5, with an R2 of 0.77 [65].

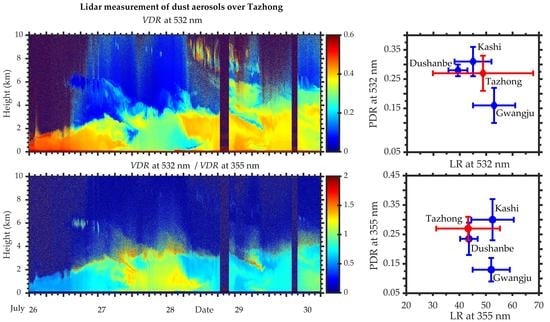
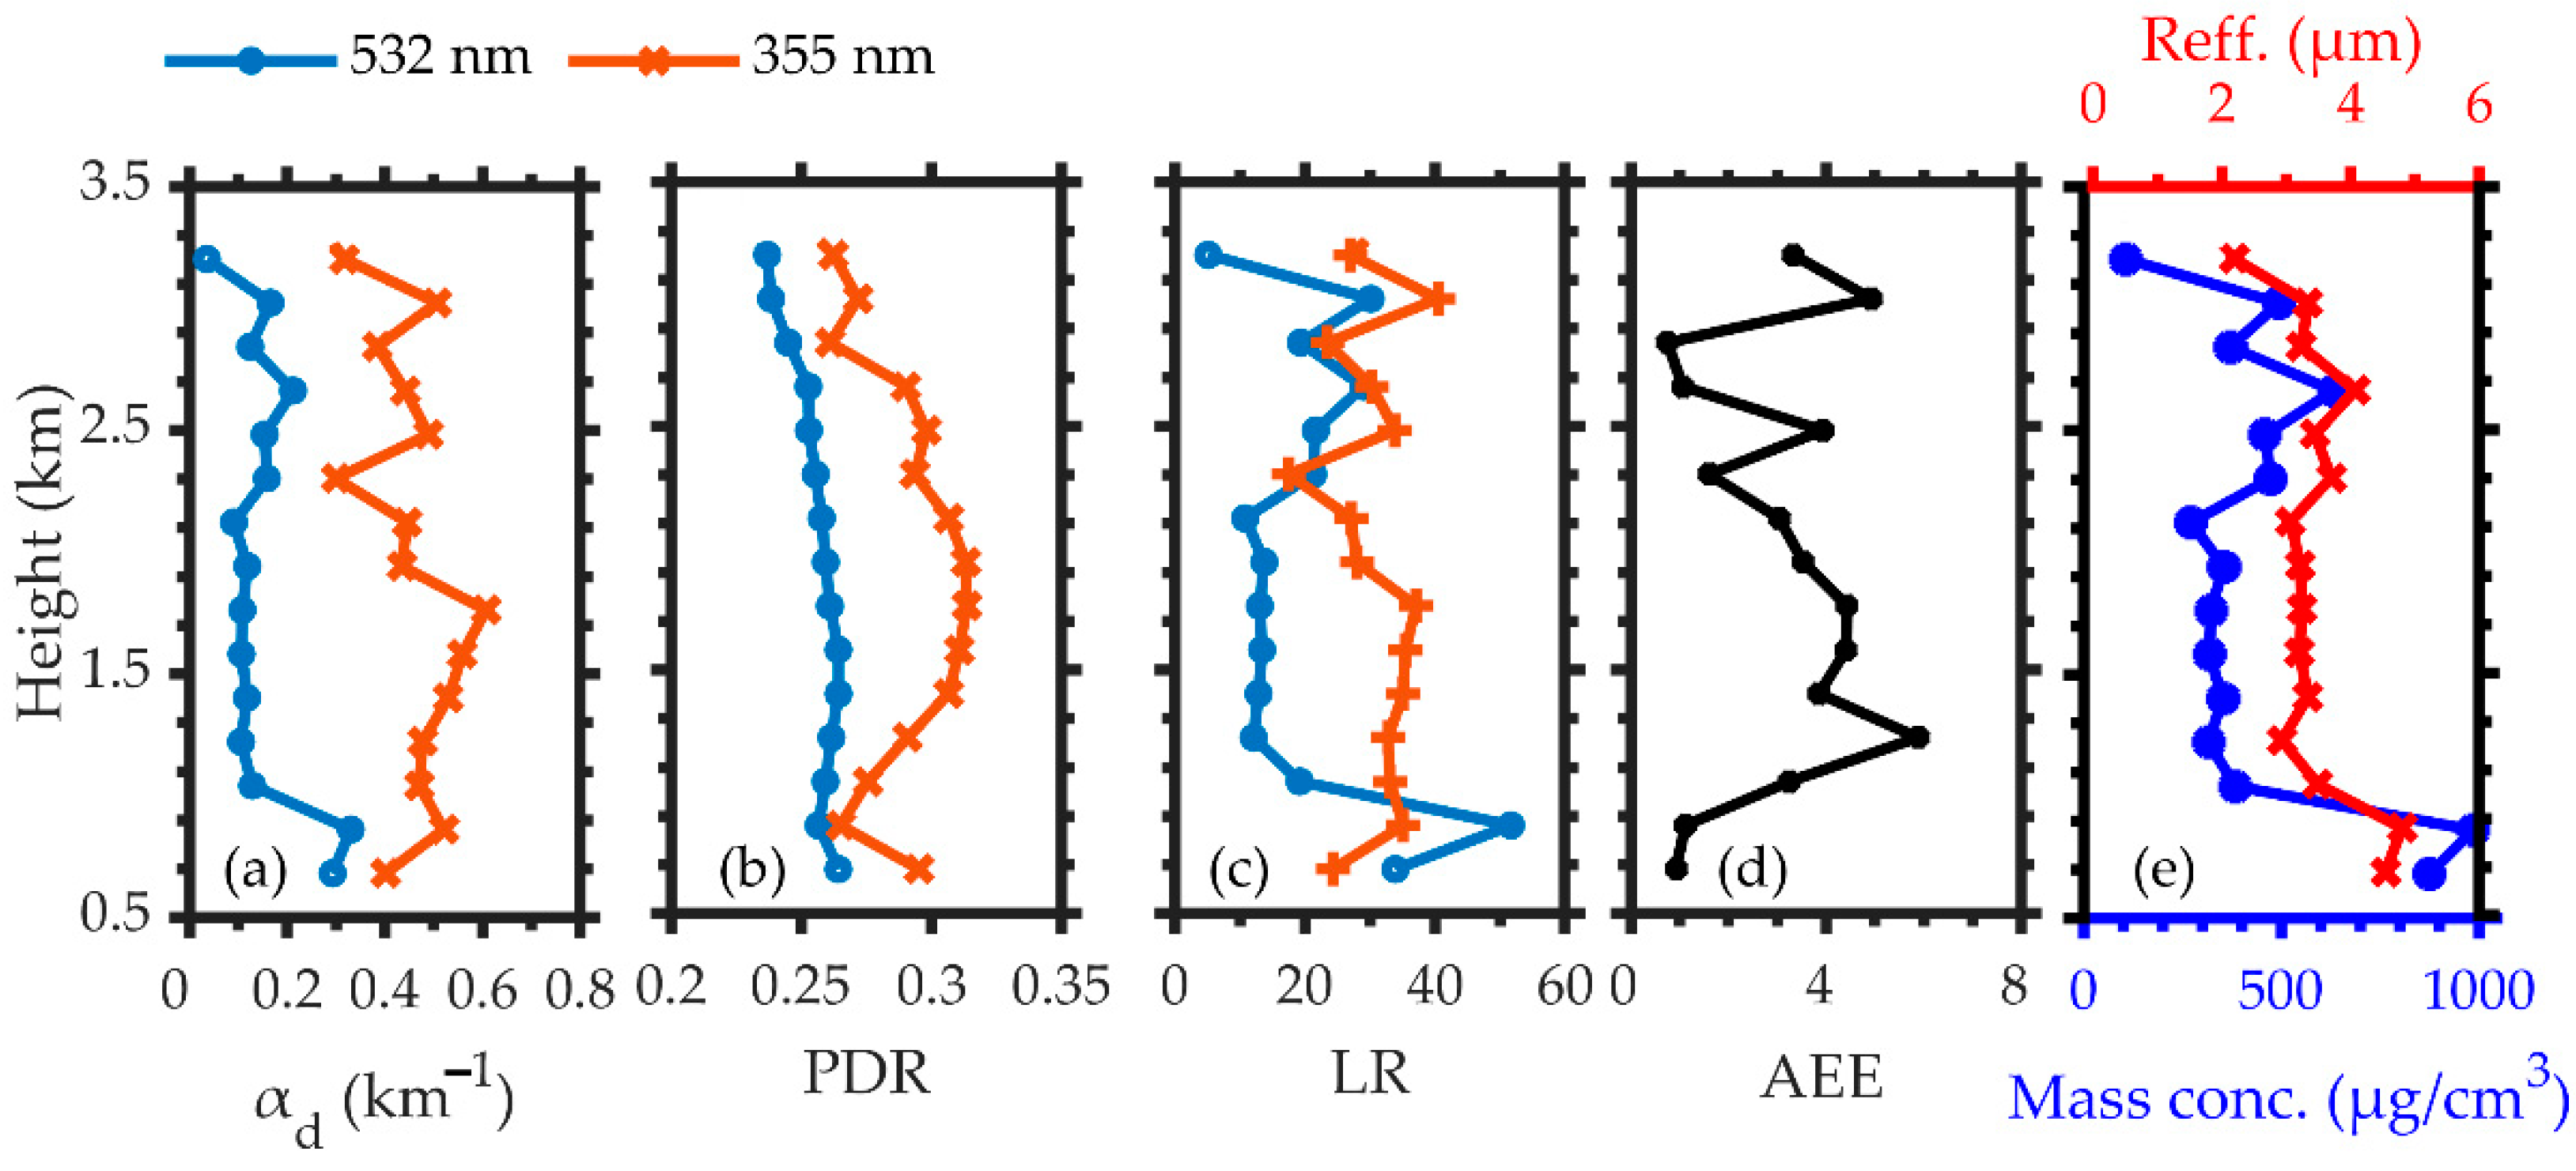
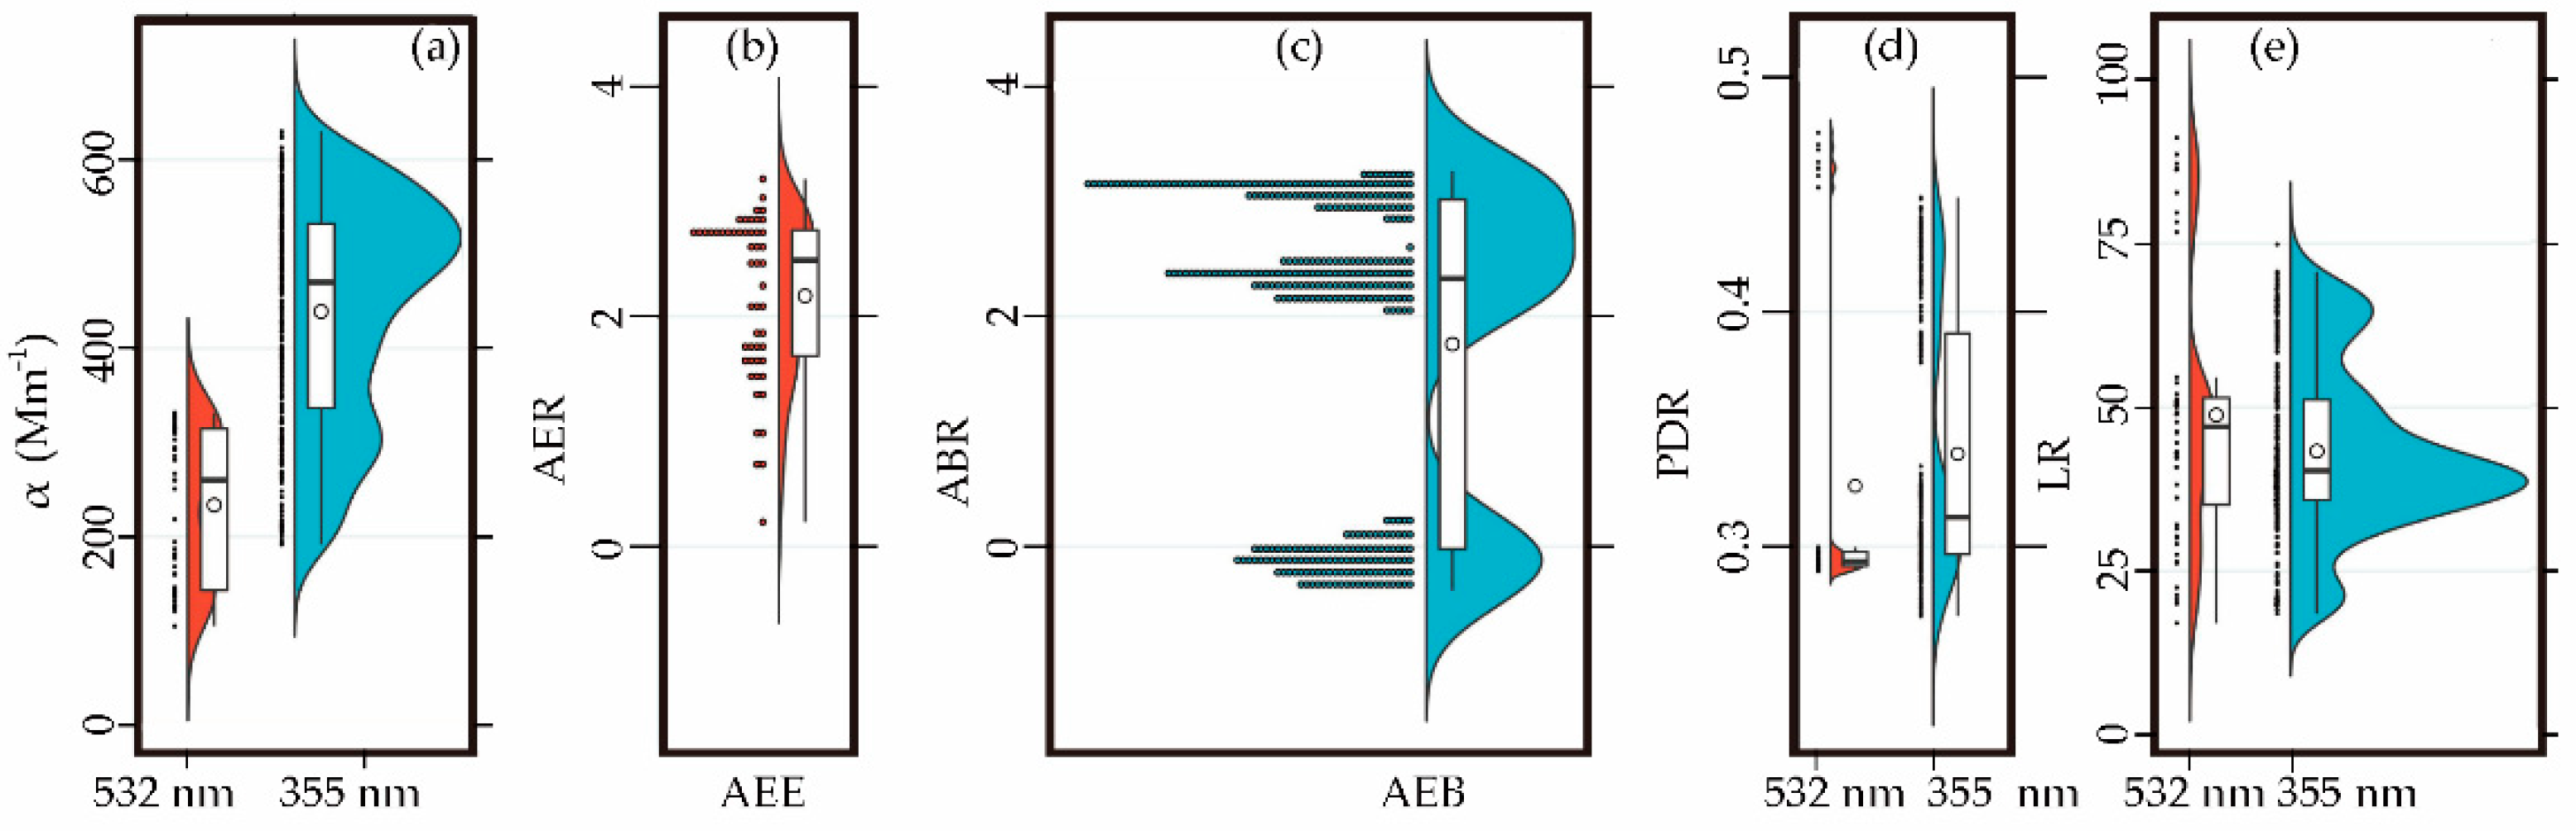
3.2. Vertical Structure of Dust Aerosols in the Center of the Taklimakan Desert
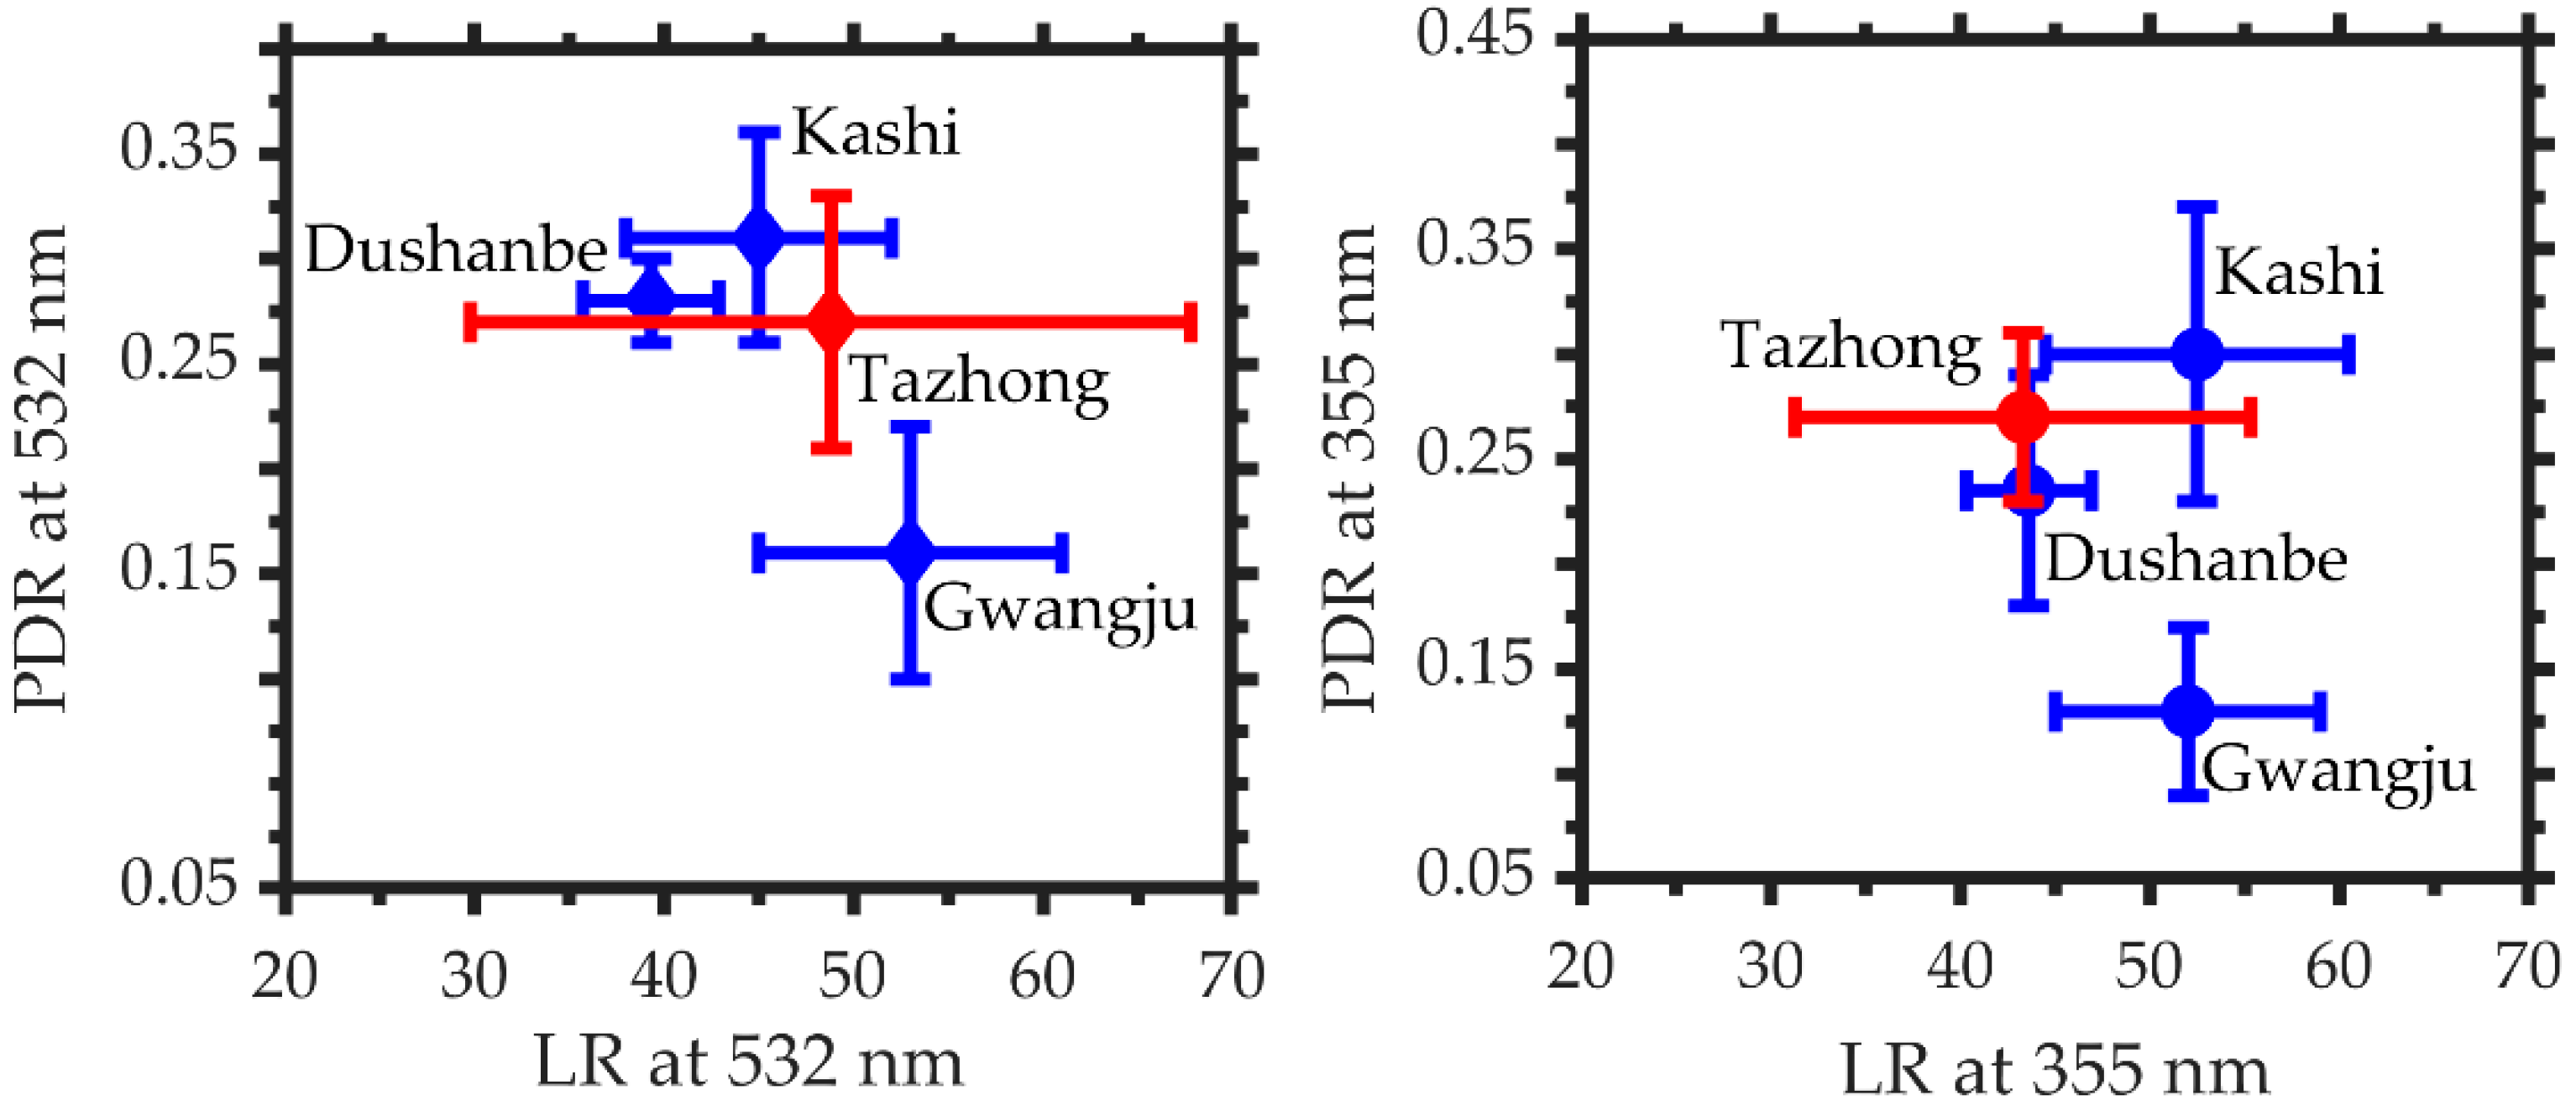
Based on methods for separating mineral dust and non-dust aerosol components [36,76], three strongly contrasting cases are discussed in greater detail in the following sections: (1) a lofted layer of extreme Tazhong dust, occurred on 29 July 2019 (Case 1; Figure 4 and Figure 5); (2) a dust event comprising Tazhong dust, recorded on 7 July 2019 (Case 2; Figure 4 and Figure 6); (3) the strong dust event, recorded during the east Asian dust observation campaign on 10 July 2019 (not shown).
According to Hu et al., Taklimakan pure dust is characterized as having an AEE355–532 value of less than 0.1 and a VDR532 value of greater than 0.32 at 532 nm, while polluted dust has a VDR value of less than 0.30 at 532 nm and an AEE value of no less than 0.2 [13]. Dust and non-dust are distinguished by their typical particle linear depolarization ratios of greater than 0.31 for dust and less than 0.05 for non-dust [76]. Non-dust depolarization ratios can vary from 0.02 to 0.15 with an average of 0.05 [77]. On 29 July 2019, the dust layer spread to a height of around 5–6 km, while on top of the layer, a thinner aerosol layer stretched to a height of approximately 6 km. The dust layer can extend up to 7 km in Kashi [11]. PM10 is over 500 µg m−3, VDR532 is approximately 0.35, TABC532 is over 10 Mm−1 sr−1, and σ532,355 ≥ 0.8. Manual records indicate that a trace of floating dust occurred throughout the day. Due to the special geographical location of Tazhong (in the center of the Taklimakan Desert), all aerosols present are classified as dust-dominated and pure natural dust aerosols. Microphysical parameters of dust are retrieved by combining Figure 5a–c and manual records. The temporal and spatial resolutions of the backscatter signals at wavelength 532 nm are 3 min and 3.75 m, respectively, whereas the spatial resolution of the nitrogen Raman signals detected at 387 and 387 nm is 7.5 m. To make the Mie signal compatible with the Raman signal, the resolution is reduced by an interval value. When calculating the α d profile using Raman signals, the signals must decrease with height, and there must be no multi-layer dust. According to this feature, vertical case 2 for 7 July 2019 is shown in Figure 6.
Due to the noise induced by sunlight, it is impossible to derive Raman profiles under daylight conditions [40]. To attain a satisfactory signal-to-noise ratio, Raman signals are averaged every hour when calculating the vertical profile depicted in Figure 7. To minimize the error, it is necessary to select uniform dust in the vertical direction within the average time range with a slight shift in the time scale. The Raman signals at wavelengths of 607 and 387 nm were used to compute the profiles of α d at wavelengths of 532 and 355 nm, respectively. When the Raman signals are used to determine the β d , the lower height should be selected as the reference height to ensure a sufficient signal-to-noise ratio. According to Figure 6, the β d is assumed to be equal to that of β m at 4.05 km height. At that height, β d = β m assumed. Then, LR   =   α / β . Below 300 m, the signals are considered to originate from the lidar blind zone. When the slope of Raman signals is estimated by the least square method, the vertical resolution of lidar is reduced to 187.5 m. The vertical structure characteristics of dust in Tazhong are depicted in Figure 7 from 0.5 to 3.4 km.
The vertical profiles of the aerosol optical properties are presented in Figure 7. Pure dust can be distinguished using particle linear depolarization ratios of 0.3–0.35 [78]. As illustrated in Figure 7a, at the height of 0.5–3.5 km, the α d at a wavelength of 355 nm is higher than that at 532 nm, with the α d at wavelength 532 nm being 0.2 km−1 and the α d at 355 nm being 0.4 km−1. There is an extremely dusty layer at 0.5–0.7 km, with LR532 (55 sr) > LR355 (35 sr), AEE ≤ 4, a dust mass concentration of about 1000 μg cm−3, effective radius of approximately 4 μm, and PDR355 (0.3) ≥ PDR532 (0.27). The LRs at 532 nm less than 20 sr at 0.8–1.8 km height are lower than typical LR values for Saharan dust of 50–60 sr and Middle Eastern or west-Asian dust LR of 35–40 sr and even lower for regional background dust conditions of less than 25 sr suggesting that direct emission and emission of resuspended salt dust have a sensitive impact on the aerosol background optical properties over Tazhong [76], which contain finer particles than particles of 0.5–0.7 km.

4. Discussion

Dust days are statistically examined in three strongly contrasting cases, as shown in Figure 8.
The half-violin plot is a statistical graph that is used to display the (a) α (Mm−1), (b) AEE, (c) and AEB, (d) PDR, and (e) LR distribution and probability density of three cases by replacing the left part with the data frequency count graph on the basis of keeping the right part of the violin graph in Figure 8. The black horizontal line in the box indicates the median for each dataset. The black horizontal line in the box shows the median, and the upper and lower edges in the white box represent the upper and lower quartiles in the data set. The distribution of observable numerical points is presented on the left half. Additionally, the violin graph can represent the data density, with a fatter graph indicating a more concentrated data set. The mean dust LR is about 43 ± 12 sr at 355 nm and 49 ± 19 sr at 532 nm, which is consistent with the observation by Julian Hofer et al. (2020) that dust LR at 532 nm accumulated around 35–40 sr, lower than typical LR values for Saharan dust (50–60 sr) [76]. The mean α d is 439 Mm−1 at 355 nm and 233 Mm−1 at 532 nm. The mean β d is 10.4 Mm−1 sr−1 at 355 nm and 5.43 Mm−1 sr−1 at 532 nm. The mean PDR is 0.32 ± 0.06 at 355 nm and 0.27 ± 0.04 at 532 nm. The mean AEE is 1.8, and the AEB is 2.2. The mean radius of an effective particle is 0.71 µm.
The average α d and β d at the wavelength of 355 nm are higher than those at 532 nm, which is consistent with the theory that the smaller the particle size parameter, the stronger the Rayleigh scattering when the particles have the same radius [79]. However, the PDR and LR at the wavelength of 532 nm are higher than those at 355 nm. PDR and LR are related to particle size and shape. LR and PDR over East Asian dust are listed in Table 2.
Table 2. LR and PDR of East Asian dust in this study and reported in the literature.
LR (sr)PDRLocationReference
532 nm355 nm532 nm355 nm
49 ± 1943 ± 120.32 ± 0.060.27 ± 0.04Current study-
--0.34 ± 0.040.25 ± 0.003Ruoqiang[50]
45 ± 751–56 ± 80.36 ± 0.050.28–0.32 ± 0.07Kashi[11]
47 ± 4---Wuhan[80]
53 ± 852 ± 70.21 ± 0.060.13 ± 0.04Gwangju[81]
-52 ± 9-0.13 ± 0.05Beijing[82]
47.7 ± 2.863 ± 4.5--Yinchuan[83]
54 ± 950 ± 7--Fukuoka[84]
35.7−42.940.3−46.90.31−0.350.18−0.29Dushanbe[85]
32.666.9--Deajoen[86]
4349--Tokyo[87]
List by time.
The sites that simultaneously detect LR and PDR at 532 and 355 nm are shown in Figure 9.
As shown in Figure 9, the LR in the Tazhong area varies significantly at 532 nm, and the LR variation range of the other three stations is within the range of the LR variation in the Tazhong area, with an average value more than that of Kashi and Dushanbe but less than that of Gwangju. The average LR at 355 nm is larger than that of Dushanbe, but smaller than that of Gwangju and Kashi, and the range of variation covers the average of the three stations. The PDR in the Tazhong has a small variation range at wavelength of 532 nm, covering the mean value of Kashi and Dushanbe, which is less than that of Gwangju. Additionally, the mean value is larger than that of Gwangju and smaller than that of Kashi and Dushanbe. The PDR at 355 nm is larger than that in Gwangju and Dushanbe and smaller than that in Kashi, and the range of variation covers the mean values in Kashi and Dushanbe.

5. Conclusions

To investigate vertical profiles of dust optical properties in the Taklimakan Desert, we conducted ground-based polarization Raman lidar measurements at Tazhong (83.39°E, 38.58°N, 1103 m above sea level), located at the center of the desert in summer 2019. The lidar system developed by Lanzhou University for continuous network observation is capable of measuring polarization at both visible and ultraviolet wavelengths and detecting Raman signals at 387, 407, and 607 nm. The characteristics of dust aerosols in Tazhong were analyzed using lidar, sounding balloon, and sun photometer observations.
The results indicate that dust aerosols in the center of the Taklimakan Desert were regularly raised to 6 km in summer with a mass concentration of 400–1000 µg cm−3, although the majority of dust remained within 2 km. Moreover, the height of the boundary layer can reach 5–6 km in the afternoon by strong convention. The PDRs of Taklimakan dust at 532 and 355 nm are 0.32 ± 0.06 and 0.27 ± 0.04, respectively. LR is 49 ± 19 sr at 532 nm and 43 ± 12 sr at 355 nm. Dust above 3 km in height is composed of finer particles, while dust below 3 km is dominated by coarser particles. The maximum hourly mean PM10 is 7618.2 µg cm−3. The peak TSP value observed in situ is 9994.6 µg cm−3. The mean hourly mean PM10 is 491.41 ± 6.43 µg cm−3. The mean TSP value measured in situ is 4580.5 ± 19.87 µg cm−3 in Tazhong during the summer.
This is the first study to investigate the dust vertical characteristics of the Taklimakan Desert in the dust hinterland by use of a ground-based polarization Raman lidar, which establishes a baseline for future academics to investigate the dust characteristics of the Taklimakan Desert and conduct dust-related research through the model.

Author Contributions

Designed experiment, Z.H.; carried out the data collection, S.Z. and M.L.; initial analysis and drafted the initial manuscript under the guidance of Z.H., S.Z.; the sounding data were provided, J.Z.; the sun photometer data were provided, J.B.; contributed to the lidar device maintenance and data collection, X.S. (Xingtai Shen), Q.D., Y.W., W.L., Z.L. and X.S. (Xiaodong Song). All authors have read and agreed to the published version of the manuscript.

Funding

This research was supported by the Second Tibetan Plateau Scientific Expedition and Research Program (STEP), Grant No. 2019QZKK0602, National Natural Science Foundation of China (41875029, 42030612) and Higher Education Discipline Innovation Project-111 Project (B 13045).

Data Availability Statement

Not applicable.

Acknowledgments

The authors thank Fan Yang from Institute of Desert Meteorology, China Meteorological Administration, Urumqi Desert Research Institute and Honglin Pan from Lanzhou University for providing data support. The data of ground-based Raman lidar provided by the corresponding author. Thanks relative contributors for gridded AOD products of MODIS (https://giovanni.gsfc.nasa.gov/giovanni/, (accessed on 10 January 2020)). Thanks for NCEP Reanalysis Derived meteorological data provided by the NOAA/OAR/ESRL PSL, Boulder, Colorado, USA, from their Web site (https://www.psl.noaa.gov/data/gridded/data.ncep.reanalysis.derived.html (accessed on 10 January 2020)). We thank Openbiox Community and Hiplot Team (https://hiplot.com.cn (accessed on 10 January 2022)) for providing technical assistance and valuable tools for data analysis and visualization.

Conflicts of Interest

The authors declare no conflict of interest.

References

  1. Kok, J.F.; Ridley, D.A.; Zhou, Q.; Miller, R.L.; Zhao, C.; Heald, C.L.; Ward, D.S.; Albani, S.; Haustein, K. Smaller Desert Dust Cooling Effect Estimated from Analysis of Dust Size and Abundance. Nat. Geosci. 2017, 10, 274–278. [Google Scholar] [CrossRef] [PubMed]
  2. Hofer, J.; Ansmann, A.; Althausen, D.; Engelmann, R.; Baars, H.; Abdullaev, S.F.; Makhmudov, A.N. Long-Term Profiling of Aerosol Light Extinction, Particle Mass, Cloud Condensation Nuclei, and Ice-Nucleating Particle Concentration over Dushanbe, Tajikistan, in Central Asia. Atmos. Chem. Phys. 2020, 20, 4695–4711. [Google Scholar] [CrossRef] [Green Version]
  3. Müller, D.; Wandinger, U.; Althausen, D.; Fiebig, M. Comprehensive Particle Characterization from Three-Wavelength Raman-Lidar Observations: Case Study. Appl. Opt. 2001, 40, 4863. [Google Scholar] [CrossRef] [PubMed]
  4. Chen, S.; Liu, J.; Wang, X.; Zhao, S.; Chen, J.; Qiang, M.; Liu, B.; Xu, Q.; Xia, D.; Chen, F. Holocene Dust Storm Variations over Northern China: Transition from a Natural Forcing to an Anthropogenic Forcing. Sci. Bull. 2021, 66, 2516–2527. [Google Scholar] [CrossRef]
  5. Ginoux, P.; Prospero, J.M.; Gill, T.E.; Hsu, N.C.; Zhao, M. Global-Scale Attribution of Anthropogenic and Natural Dust Sources and Their Emission Rates Based on MODIS Deep Blue Aerosol Products. Rev. Geophys. 2012, 50, 1–36. [Google Scholar] [CrossRef]
  6. Tanaka, T.Y.; Chiba, M. A Numerical Study of the Contributions of Dust Source Regions to the Global Dust Budget. Glob. Planet. Chang. 2006, 52, 88–104. [Google Scholar] [CrossRef]
  7. Sun, J.; Liu, T. The Age of the Taklimakan Desert. Science 2006, 312, 1621. [Google Scholar] [CrossRef] [Green Version]
  8. Huang, Z.; Nee, J.-B.; Chiang, C.-W.; Zhang, S.; Jin, H.; Wang, W.; Zhou, T. Real-Time Observations of Dust--Cloud Interactions Based on Polarization and Raman Lidar Measurements. Remote Sens. 2018, 10, 1017. [Google Scholar] [CrossRef] [Green Version]
  9. Liu, D.; Wang, Z.; Liu, Z.; Winker, D.; Trepte, C. A Height Resolved Global View of Dust Aerosols from the First Year CALIPSO Lidar Measurements. J. Geophys. Res. Atmos. 2008, 113, 1–15. [Google Scholar] [CrossRef]
  10. Yang, H.; Fang, Z.; Cao, Y.; Xie, C.; Zhou, T.; Wang, B.; Xing, K.; Lolli, S. Impacts of Transboundary Dust Transport on Aerosol Pollution in the Western Yangtze River Delta Region, China: Insights Gained From Ground-Based Lidar and Satellite Observations. Earth Sp. Sci. 2021, 8, e2020EA001533. [Google Scholar] [CrossRef]
  11. Hu, Q.; Wang, H.; Goloub, P.; Li, Z.; Veselovskii, I.; Podvin, T.; Li, K.; Korenskiy, M. The Characterization of Taklamakan Dust Properties Using a Multiwavelength Raman Polarization Lidar in Kashi, China. Atmos. Chem. Phys. 2020, 20, 13817–13834. [Google Scholar] [CrossRef]
  12. Cottle, P.; Mueeller, D.; Shin, D.-H.; Zhang, X.X.; Feng, G.; McKendry, I.; Strawbridge, K. Studying Taklamakan Aerosol Properties with Lidar (STAPL). In Lidar Technologies, Techniques, and Measurements for Atmospheric Remote Sensing IX; Singh, U.N., Pappalardo, G., Eds.; SPIE: Bellingham, WA, USA, 2013; Volume 8894, ISBN 978-0-8194-9762-8. [Google Scholar] [CrossRef]
  13. Hu, Z.; Huang, J.; Zhao, C.; Jin, Q.; Ma, Y.; Yang, B. Modeling Dust Sources, Transport, and Radiative Effects at Different Altitudes over the Tibetan Plateau. Atmos. Chem. Phys. 2020, 20, 1507–1529. [Google Scholar] [CrossRef] [Green Version]
  14. Cohen, D.D.; Crawford, J.; Stelcer, E.; Vuong Thu, B. Long Range Transport of Fine Particle Windblown Soils and Coal Fired Power Station Emissions into Hanoi between 2001 to 2008. Atmos. Environ. 2010, 44, 3761–3769. [Google Scholar] [CrossRef]
  15. Sugimoto, N.; Shimizu, A.; Nishizawa, T.; Jin, Y.; Yumimoto, K. Long-Range-Transported Mineral Dust From Africa and Middle East to East Asia Observed with the Asian Dust and Aerosol Lidar Observation Network (AD-Net). EPJ Web Conf. 2020, 237, 05009. [Google Scholar] [CrossRef]
  16. Huang, Z.; Huang, J.; Hayasaka, T.; Wang, S.; Zhou, T.; Jin, H. Short-Cut Transport Path for Asian Dust Directly to the Arctic: A Case Study. Environ. Res. Lett. 2015, 10, 114018. [Google Scholar] [CrossRef] [Green Version]
  17. Kröpelin, S.; Verschuren, D.; Lézine, A.M.; Eggermont, H.; Cocquyt, C.; Francus, P.; Cazet, J.P.; Fagot, M.; Rumes, B.; Russell, J.M.; et al. Climate-Driven Ecosystem Succession in the Sahara: The Past 6000 Years. Science 2008, 320, 765–768. [Google Scholar] [CrossRef] [Green Version]
  18. Uno, I.; Eguchi, K.; Yumimoto, K.; Takemura, T.; Shimizu, A.; Uematsu, M.; Liu, Z.; Wang, Z.; Hara, Y.; Sugimoto, N. Asian Dust Transported One Full Circuit around the Globe. Nat. Geosci. 2009, 2, 557–560. [Google Scholar] [CrossRef]
  19. Mahowald, N. Aerosol Indirect Effect on Biogeochemical Cycles and Climate. Science 2011, 334, 794–796. [Google Scholar] [CrossRef]
  20. Tang, K.; Huang, Z.; Huang, J.; Maki, T.; Zhang, S.; Ma, X.; Shi, J.; Bi, J.; Zhou, T.; Wang, G.; et al. Characterization of Atmospheric Bioaerosols along the Transport Pathway of Asian Dust during the Dust-Bioaerosol 2016 Campaign. Atmos. Chem. Phys. 2017, 18, 1–41. [Google Scholar] [CrossRef] [Green Version]
  21. Liu, Y.; Zhu, Q.; Hua, S.; Alam, K.; Dai, T.; Cheng, Y. Tibetan Plateau Driven Impact of Taklimakan Dust on Northern Rainfall. Atmos. Environ. 2020, 234, 117583. [Google Scholar] [CrossRef]
  22. Huang, J.; Lin, B.; Minnis, P.; Wang, T.; Wang, X.; Hu, Y.; Yi, Y.; Ayers, J.K. Satellite-Based Assessment of Possible Dust Aerosols Semi-Direct Effect on Cloud Water Path over East Asia. Geophys. Res. Lett. 2006, 33. [Google Scholar] [CrossRef] [Green Version]
  23. Huang, J.; Wang, T.; Wang, W.; Li, Z.; Yan, H. Climate Effects of Dust Aerosols over East Asian Arid and Semiarid Regions. J. Geophys. Res. 2014, 119, 11398–11416. [Google Scholar] [CrossRef]
  24. Kelly, J.T.; Chuang, C.C.; Wexler, A.S. Influence of Dust Composition on Cloud Droplet Formation. Atmos. Environ. 2007, 41, 2904–2916. [Google Scholar] [CrossRef] [Green Version]
  25. Hoose, C.; Lohmann, U.; Erdin, R.; Tegen, I. The Global Influence of Dust Mineralogical Composition on Heterogeneous Ice Nucleation in Mixed-Phase Clouds. Environ. Res. Lett. 2008, 3, 25003. [Google Scholar] [CrossRef]
  26. Zhang, Z.; Zhou, W.; Wenig, M.; Yang, L. Impact of Long-Range Desert Dust Transport on Hydrometeor Formation over Coastal East Asia. Adv. Atmos. Sci. 2017, 34, 101–115. [Google Scholar] [CrossRef]
  27. Zhang, Y.; Yu, F.; Luo, G.; Fan, J.; Liu, S. Impacts of Long-Range-Transported Mineral Dust on Summertime Convective Cloud and Precipitation: A Case Study over the Taiwan Region. Atmos. Chem. Phys. 2021, 21, 17433–17451. [Google Scholar] [CrossRef]
  28. Karyampudi, V.M.; Palm, S.P.; Reagan, J.A.; Fang, H.; Melfi, S.H. Validation of the Saharan Dust Plume Conceptual Model Using Lidar, Meteosat, and ECMWF Data. Bull. Am. Meteorol. Soc. 1967, 80, 1045–1075. [Google Scholar] [CrossRef] [Green Version]
  29. Gardner, C.S.; Sechrist, C.F., Jr.; Shelton, J.D. Lidar Observations of the Mount St. Helens Dust Layers over Urbana, Illinois. Appl. Opt. 1980, 19, A192. [Google Scholar] [CrossRef]
  30. Sugimoto, N.; Huang, Z.; Nishizawa, T.; Matsui, I.; Tatarov, B. Fluorescence from Atmospheric Aerosols Observed with a Multi-Channel Lidar Spectrometer. Opt. Express 2012, 20, 20800. [Google Scholar] [CrossRef]
  31. Sugimoto, N.; Huang, Z. Lidar Methods for Observing Mineral Dust. J. Meteorol. Res. 2014, 28, 173–184. [Google Scholar] [CrossRef]
  32. Lolli, S.; Khor, W.Y.; Matjafri, M.Z.; Lim, H.S. Monsoon Season Quantitative Assessment of Biomass Burning Clear-Sky Aerosol Radiative Effect at Surface by Ground-Based Lidar Observations in Pulau Pinang, Malaysia in 2014. Remote Sens. 2019, 11, 2660. [Google Scholar] [CrossRef] [Green Version]
  33. Zhang, H.; Zhang, Y.; Li, Z.; Liu, B.; Yin, B.; Wu, S. Small Angle Scattering Intensity Measurement by an Improved Ocean Scheimpflug Lidar System. Remote Sens. 2021, 13, 2390. [Google Scholar] [CrossRef]
  34. Gobbi, G.P.; Barnaba, F.; Blumthaler, M.; Labow, G.; Herman, J.R. Observed Effects of Particles Nonsphericity on the Retrieval of Marine and Desert Dust Aerosol Optical Depth by Lidar. Atmos. Res. 2002, 61, 1–14. [Google Scholar] [CrossRef]
  35. Mattis, I.; Ansmann, A.; Muller, D.; Wandinger, U.; Althausen, D. Dual-Wavelength Raman Lidar Observations of the Extinction-to-Backscatter Ratio of Saharan Dust. Geophys. Res. Lett. 2002, 29, 20-1–20-4. [Google Scholar] [CrossRef]
  36. Huang, Z.; Huang, J.; Bi, J.; Wang, G.; Wang, W.; Fu, Q.; Li, Z.; Tsay, S.-C.; Shi, J. Dust Aerosol Vertical Structure Measurements Using Three MPL Lidars during 2008 China-U.S. Joint Dust Field Experiment. J. Geophys. Res. 2010, 115, 1–12. [Google Scholar] [CrossRef] [Green Version]
  37. Qi, S.; Huang, Z.; Ma, X.; Huang, J.; Zhou, T.; Zhang, S.; Dong, Q.; Bi, J.; Shi, J. Classification of Atmospheric Aerosols and Clouds by Use of Dual-Polarization Lidar Measurements. Opt. Express 2021, 29, 23461. [Google Scholar] [CrossRef]
  38. Mamouri, R.E.; Ansmann, A. Fine and Coarse Dust Separation with Polarization Lidar. Atmos. Meas. Technol. 2014, 7, 3717–3735. [Google Scholar] [CrossRef] [Green Version]
  39. Liu, Z.; Sugimoto, N.; Murayama, T. Extinction-to-Backscatter Ratio of Asian Dust Observed with High-Spectral-Resolution Lidar and Raman Lidar. Appl. Opt. 2002, 41, 2760–2767. [Google Scholar] [CrossRef] [Green Version]
  40. Wang, W.; Gong, W.; Mao, F.; Pan, Z. Physical Constraint Method to Determine Optimal Overlap Factor of Raman Lidar. J. Opt. 2017, 47, 83–90. [Google Scholar] [CrossRef]
  41. Mei, L.; Ma, T.; Zhang, Z.; Fei, R.; Liu, K.; Gong, Z.; Li, H. Experimental Calibration of the Overlap Factor for the Pulsed Atmospheric Lidar by Employing a Collocated Scheimpflug Lidar. Remote Sens. 2020, 12, 1227. [Google Scholar] [CrossRef] [Green Version]
  42. Pietruczuk, A.; Podgorski, J. The Lidar Ratio Derived from Sun-Photometer Measurements at Belsk Geophysical Observatory. Acta Geophys. 2009, 57, 476–493. [Google Scholar] [CrossRef]
  43. Kim, M.-H.; Kim, S.-W.; Omar, A.H. Dust Lidar Ratios Retrieved from the CALIOP Measurements Using the MODIS AOD as a Constraint. Remote Sens. 2020, 12, 251. [Google Scholar] [CrossRef] [Green Version]
  44. Kuzmanoski, M.; Box, M.A.; Schmid, B.; Box, G.P.; Wang, J.; Russell, P.B.; Bates, D.; Jonsson, H.H.; Welton, E.J.; Seinfeld, J.H. Aerosol Properties Computed from Aircraft-Based Observations during the ACE-Asia Campaign: 2. A Case Study of Lidar Ratio Closure. Aerosol Sci. Technol. 2007, 41, 231–243. [Google Scholar] [CrossRef] [Green Version]
  45. Ansmann, A.; Riebesell, M.; Wandinger, U.; Weitkamp, C.; Voss, E.; Lahmann, W.; Michaelis, W. Combined Raman Elastic-Backscatter LIDAR for Vertical Profiling of Moisture, Aerosol Extinction, Backscatter, and LIDAR Ratio. Appl. Phys. B 1992, 55, 18–28. [Google Scholar] [CrossRef]
  46. Hostetler, C.A.; Liu, Z.; Reagan, J.; Vaughan, M.; Winker, D.; Osborn, M.; Hunt, W.H.; Powell, K.A.; Trepte, C. CALIOP Algorithm Theoretical Basis Document, Calibration and Level 1 Data Products. Available online: https://www-calipso.larc.nasa.gov/resources/pdfs/PC-SCI-201v1.0.pdf (accessed on 10 January 2022).
  47. He, Y.; Zhang, Y.; Liu, F.; Yin, Z.; Yi, Y.; Zhan, Y.; Yi, F. Retrievals of Dust-Related Particle Mass and Ice-Nucleating Particle Concentration Profiles with Ground-Based Polarization Lidar and Sun Photometer over a Megacity in Central China. Atmos. Meas. Technol. 2021, 14, 5939–5954. [Google Scholar] [CrossRef]
  48. Dubovik, O.; Herman, M.; Holdak, A.; Lapyonok, T.; Tanré, D.; Deuzé, J.L.; Ducos, F.; Sinyuk, A.; Lopatin, A. Statistically Optimized Inversion Algorithm for Enhanced Retrieval of Aerosol Properties from Spectral Multi-Angle Polarimetric Satellite Observations. Atmos. Meas. Tech. 2011, 4, 975–1018. [Google Scholar] [CrossRef] [Green Version]
  49. Veselovskii, I.; Dubovik, O.; Kolgotin, A.; Korenskiy, M.; Whiteman, D.N.; Allakhverdiev, K.; Huseyinoglu, F. Linear Estimation of Particle Bulk Parameters from Multi-Wavelength Lidar Measurements. Atmos. Meas. Technol. 2012, 5, 1135–1145. [Google Scholar] [CrossRef] [Green Version]
  50. Dong, Q.; Huang, Z.; Li, W.; Li, Z.; Song, X.; Liu, W.; Wang, T.; Bi, J.; Shi, J. Polarization Lidar Measurements of Dust Optical Properties at the Junction of the Taklimakan Desert–Tibetan Plateau. Remote Sens. 2022, 14, 1653. [Google Scholar] [CrossRef]
  51. Liu, B.; Ma, Y.; Liu, J.; Gong, W.; Wang, W.; Zhang, M. Graphics Algorithm for Deriving Atmospheric Boundary Layer Heights from CALIPSO Data. Atmos. Meas. Tech. 2018, 11, 5075–5085. [Google Scholar] [CrossRef] [Green Version]
  52. Wu, Y.; Nehrir, A.R.; Ren, X.; Dickerson, R.R.; Huang, J.; Stratton, P.R.; Gronoff, G.; Kooi, S.A.; Collins, J.E.; Berkoff, T.A.; et al. Synergistic Aircraft and Ground Observations of Transported Wildfire Smoke and Its Impact on Air Quality in New York City during the Summer 2018 LISTOS Campaign. Sci. Total Environ. 2021, 773, 145030. [Google Scholar] [CrossRef]
  53. Koelemeijer, R.B.A.; Homan, C.D.; Matthijsen, J. Comparison of Spatial and Temporal Variations of Aerosol Optical Thickness and Particulate Matter over Europe. Atmos. Environ. 2006, 40, 5304–5315. [Google Scholar] [CrossRef]
  54. Xiao, F.; Zhou, C.; Liao, Y. Dust Storms Evolution in Taklimakan Desert and Its Correlation with Climatic Parameters. J. Geogr. Sci. 2008, 18, 415–424. [Google Scholar] [CrossRef]
  55. Ding, R.; Li, J.; Wang, S.; Ren, F. Decadal Change of the Spring Dust Storm in Northwest China and the Associated Atmospheric Circulation. Geophys. Res. Lett. 2005, 32. [Google Scholar] [CrossRef] [Green Version]
  56. Yang, B.; Braeuning, A.; Zhang, Z.; Dong, Z.; Esper, J. Dust Storm Frequency and Its Relation to Climate Changes in Northern China during the Past 1000 Years. Atmos. Environ. 2007, 41, 9288–9299. [Google Scholar] [CrossRef]
  57. Mulitza, S.; Heslop, R.; Pittauerova, R.; Fischer, R.W.; Meyer, R.; Stuut, R.B.; Zabel, M.; Mollenhauer, R.; Collins, R.A.; Kuhnert, R. Increase in African Dust Flux at the Onset of Commercial Agriculture in the Sahel Region. Nature 2010, 466, 226–228. [Google Scholar] [CrossRef]
  58. Neff, J.C.; Ballantyne, A.P.; Farmer, G.L.; Mahowald, N.M.; Conroy, J.L.; Landry, C.C.; Overpeck, J.T.; Painter, T.H.; Lawrence, C.R.; Reynolds, R.L. Increasing Eolian Dust Deposition in the Western United States Linked to Human Activity. Nat. Geosci. 2008, 1, 189–195. [Google Scholar] [CrossRef]
  59. Mamouri, R.-E.; Ansmann, A.; Nisantzi, A.; Solomos, S.; Kallos, G.; Hadjimitsis, D.G. Extreme Dust Storm over the Eastern Mediterranean in September 2015: Satellite, Lidar, and Surface Observations in the Cyprus Region. Atmos. Chem. Phys. 2016, 16, 13711–13724. [Google Scholar] [CrossRef] [Green Version]
  60. Zhao, C.; Liu, X.; Ruby Leung, L.; Hagos, S. Radiative Impact of Mineral Dust on Monsoon Precipitation Variability over West Africa. Atmos. Chem. Phys. 2011, 11, 1879–1893. [Google Scholar] [CrossRef] [Green Version]
  61. Kabatas, B.; Unal, A.; Pierce, R.B.; Kindap, T.; Pozzoli, L. The Contribution of Saharan Dust in PM10 Concentration Levels in Anatolian Peninsula of Turkey. Sci. Total Environ. 2014, 488–489, 413–421. [Google Scholar] [CrossRef]
  62. Georgoulias, A.K.; Alexandri, G.; Kourtidis, K.A.; Lelieveld, J.; Zanis, P.; Pöschl, U.; Levy, R.; Amiridis, V.; Marinou, E.; Tsikerdekis, A. Spatiotemporal Variability and Contribution of Different Aerosol Types to the Aerosol Optical Depth over the Eastern Mediterranean. Atmos. Chem. Phys. 2016, 16, 13853–13884. [Google Scholar] [CrossRef] [Green Version]
  63. Ma, X.; Huang, Z.; Qi, S.; Huang, J.; Zhang, S.; Dong, Q.; Wang, X. Ten-Year Global Particulate Mass Concentration Derived from Space-Borne CALIPSO Lidar Observations. Sci. Total Environ. 2020, 721, 137699. [Google Scholar] [CrossRef] [PubMed]
  64. Theodosi, C.; Im, U.; Bougiatioti, A.; Zarmpas, P.; Yenigun, O.; Mihalopoulos, N. Aerosol Chemical Composition over Istanbul. Sci. Total Environ. 2010, 408, 2482–2491. [Google Scholar] [CrossRef] [PubMed]
  65. Zheng, C.; Zhao, C.; Zhu, Y.; Wang, Y.; Shi, X.; Wu, X.; Chen, T.; Wu, F.; Qiu, Y. Analysis of Influential Factors for the Relationship between PM2.5 and AOD in Beijing. Atmos. Chem. Phys. 2017, 17, 13473–13489. [Google Scholar] [CrossRef] [Green Version]
  66. Liu, Q.; Liu, Y.; Yin, J.; Zhang, M.; Zhang, T. Chemical Characteristics and Source Apportionment of PM10 during Asian Dust Storm and Non-Dust Storm Days in Beijing. Atmos. Environ. 2014, 91, 85–94. [Google Scholar] [CrossRef]
  67. Givehchi, R.; Arhami, M.; Tajrishy, M. Contribution of the Middle Eastern Dust Source Areas to PM10 Levels in Urban Receptors: Case Study of Tehran, Iran. Atmos. Environ. 2013, 75, 287–295. [Google Scholar] [CrossRef]
  68. Agacayak, T.; Kindap, T.; Unal, A.; Pozzoli, L.; Mallet, M.; Solmon, F. A Case Study for Saharan Dust Transport over Turkey via RegCM4. 1 Model. Atmos. Res. 2015, 153, 392–403. [Google Scholar] [CrossRef]
  69. Kandler, K.; Schütz, L.; Jäckel, S.; Lieke, K.; Emmel, C.; Müller-Ebert, D.; Ebert, M.; Scheuvens, D.; Schladitz, A.; Šegvić, B.; et al. Ground-Based off-Line Aerosol Measurements at Praia, Cape Verde, during the Saharan Mineral Dust Experiment: Microphysical Properties and Mineralogy. Tellus Ser. B Chem. Phys. Meteorol. 2011, 63, 459–474. [Google Scholar] [CrossRef] [Green Version]
  70. Yang, X.; He, Q.; Mamtimin, A.; Huo, W.; Liu, X. Diurnal Variations of Saltation Activity at Tazhong: The Hinterland of Taklimakan Desert. Meteorol. Atmos. Phys. 2013, 119, 177–185. [Google Scholar] [CrossRef] [Green Version]
  71. Wang, M.; Wei, W.; He, Q.; Yang, Y.; Fan, L.; Zhang, J. Summer Atmospheric Boundary Layer Structure in the Hinterland of Taklimakan Desert, China. J. Arid Land 2016, 8, 846–860. [Google Scholar] [CrossRef] [Green Version]
  72. Che, J.; Zhao, P. Characteristics of the Summer Atmospheric Boundary Layer Height over the Tibetan Plateau and Influential Factors. Atmos. Chem. Phys. 2021, 21, 5253–5268. [Google Scholar] [CrossRef]
  73. Zhu, Z.; Zhang, M.; Huang, Y.; Zhu, B.; Han, G.; Zhang, T.; Liu, B. Characteristics of the Planetary Boundary Layer above Wuhan, China Based on CALIPSO. Atmos. Res. 2018, 214, 204–212. [Google Scholar] [CrossRef]
  74. Zhao, H.; Che, H.; Xia, X.; Wang, Y.; Wang, H.; Wang, P.; Ma, Y.; Yang, H.; Liu, Y.; Wang, Y.; et al. Multiyear Ground-Based Measurements of Aerosol Optical Properties and Direct Radiative Effect Over Different Surface Types in Northeastern China. J. Geophys. Res. Atmos. 2018, 123, 13887–13916. [Google Scholar] [CrossRef]
  75. Li, Y.; Li, J.; Zhao, Y.; Lei, M.; Zhao, Y.; Jian, B.; Zhang, M.; Huang, J. Long-Term Variation of Boundary Layer Height and Possible Contribution Factors: A Global Analysis Science of the Total Environment Long-Term Variation of Boundary Layer Height and Possible Contribution Factors: A Global Analysis. Sci. Total Environ. 2021, 796, 148950. [Google Scholar] [CrossRef]
  76. Hofer, J.; Ansmann, A.; Althausen, D.; Engelmann, R.; Baars, H.; Fomba, K.W.; Wandinger, U.; Abdullaev, S.F.; Makhmudov, A.N. Optical Properties of Central Asian Aerosol Relevant for Spaceborne Lidar Applications and Aerosol Typing at 355 and 532 Nm. Atmos. Chem. Phys. 2020, 20, 9265–9280. [Google Scholar] [CrossRef]
  77. Huang, Z.; Qi, S.; Zhou, T.; Dong, Q.; Ma, X.; Zhang, S.; Bi, J.; Shi, J. Investigation of Aerosol Absorption with Dual-Polarization Lidar Observations. Opt. Express 2020, 28, 7028–7035. [Google Scholar] [CrossRef] [PubMed]
  78. Ansmann, A.; Mamouri, R.-E.; Hofer, J.; Baars, H.; Althausen, D.; Abdullaev, S.F. Dust Mass, CCN, and INP Profiling with Polarization Lidar: Updated POLIPHON Conversion Factors from Global AERONET Analysis. Atmos. Meas. Technol. Discuss. 2019, 1–28. [Google Scholar] [CrossRef]
  79. Bates, D.R. Rayleigh-scattering by air. Planet. Space Sci. 1984, 32, 785–790. [Google Scholar] [CrossRef]
  80. Peng, L.; Yi, F.; Liu, F.; Yin, Z.; He, Y. Optical Properties of Aerosol and Cloud Particles Measured by a Single-Line-Extracted Pure Rotational Raman Lidar. Opt. Express 2021, 29, 21947–21964. [Google Scholar] [CrossRef]
  81. Shin, S.-K.; Müller, D.; Lee, C.; Lee, K.H.; Shin, D.; Kim, Y.J.; Noh, Y.M. Vertical Variation of Optical Properties of Mixed Asian Dust/Pollution Plumes According to Pathway of Air Mass Transport over East Asia. Atmos. Chem. Phys. 2015, 15, 6707–6720. [Google Scholar] [CrossRef] [Green Version]
  82. Wang, Z.; Liu, C.; Dong, Y.; Hu, Q.; Liu, T.; Zhu, Y.; Xing, C. Profiling of Dust and Urban Haze Mass Concentrations during the 2019 National Day Parade in Beijing by Polarization Raman Lidar. Remote Sens. 2021, 13, 3326. [Google Scholar] [CrossRef]
  83. Zhao, H.; Hua, D.; Mao, J.; Zhou, C. Investigate the Relationship between Multiwavelength Lidar Ratios and Aerosol Size Distributions Using Aerodynamic Particle Sizer Spectrometer. J. Quant. Spectrosc. Radiat. Transf. 2017, 188, 12–19. [Google Scholar] [CrossRef]
  84. Hara, Y.; Nishizawa, T.; Sugimoto, N.; Matsui, I.; Pan, X.; Kobayashi, H.; Osada, K.; Uno, I. Optical Properties of Mixed Aerosol Layers over Japan Derived with Multi-Wavelength Mie–Raman Lidar System. J. Quant. Spectrosc. Radiat. Transf. 2017, 188, 20–27. [Google Scholar] [CrossRef]
  85. Hofer, J.; Althausen, D.; Abdullaev, S.F.; Makhmudov, A.N.; Nazarov, B.I.; Schettler, G.; Engelmann, R.; Baars, H.; Fomba, K.W.; Müller, K.; et al. Long-Term Profiling of Mineral Dust and Pollution Aerosol with Multiwavelength Polarization Raman Lidar at the Central Asian Site of Dushanbe, Tajikistan: Case Studies. Atmos. Chem. Phys. 2017, 17, 14559–14577. [Google Scholar] [CrossRef] [Green Version]
  86. Song, I.; Kim, Y.; Baik, S.H.; Park, S.K.; Cha, H.; Choi, S.; Chung, C.M.; Kim, D. Measurement of Aerosol Parameters with Altitude by Using Two Wavelength Rotational Raman Signals. J. Opt. Soc. Korea 2010, 14, 221–227. [Google Scholar] [CrossRef] [Green Version]
  87. Murayama, T.; Mueller, D.; Sekiguchi, M. Study of Tropospheric Aerosols and Clouds with Raman Lidar Technique. In Proceedings of the 13th International School on Quantum Electronics: Laser Physics and Applications, Bourgas, Bulgaria, 20 September 2004; Volume 5830, pp. 317–326. [Google Scholar] [CrossRef]
Figure 1. The schematic diagram of the Raman polarization lidar developed in this study.
Remotesensing 14 02461 g001
Figure 2. An overview of the data analysis scheme in this study.
Remotesensing 14 02461 g002
Figure 3. (a) AOD550 and (b) AE412–470. Measured by MODIS from 2003 to 2020 in the Tazhong area during the summer. The X-axis indicates longitude, while the Y-axis represents latitude. The black arrow in (b) represents the Taklimakan Desert region on the world map. The black pentacle in the figure indicates the geographic location of the study site.
Remotesensing 14 02461 g003
Figure 4. (a) AOD532 and AE470–870 obtained from a sun photometer in July of 2019. The X-axis indicates the days of July in China Standard Time (CST); (b) PM10 mass concentration in July of 2019. The X-axis indicates the days of July in CST, and the Y-axis represents the PM10 (μg m−3). Note that the color scale has been converted to log 10 PM 10 for better visualization.
Remotesensing 14 02461 g004
Figure 5. An overview of (a) TABC532 (lg, m−1 sr−1), (b) VDR532, and (c) δ 532 ,   355 = VDR532/VDR355 on 26–30 July 2019.
Remotesensing 14 02461 g005
Figure 6. An overview of (a) TABC532 (lg, m−1 sr−1), (b) VDR532, and (c) σ532,355 = VDR532/VDR355 at 00:00–07:00 on 7 July 2019.
Remotesensing 14 02461 g006
Figure 7. Case 2: lidar-derived parameters on 7 July 2019, between 00:00 and 06:58 CST. (a) α d , (b) PDR, (c) LR, (d) AEE532,355, and (e) dust mass concentration (µg cm−3) and effective radius of dust (µm).
Remotesensing 14 02461 g007
Figure 8. Statistical result of (a) α (Mm−1), (b) AEE, (c) and Ångström exponent related to the particle backscatter coefficient (AEB), (d) PDR, and (e) LR for three selected cases. The black horizontal line in the box shows the median gene expression level in each tumor, and the upper and lower edges in the white box represent the upper and lower quartiles in the data set. The distribution of observable numerical points on the left half.
Remotesensing 14 02461 g008
Figure 9. Relationship between dust LR and PDR at wavelengths of 355 and 532 nm, observed by multi-wavelength polarization Raman lidars in the current study and reported in the literature.
Remotesensing 14 02461 g009
Table 1. Hourly and in situ means of PM10 and TSP in Tazhong from 1 July to 31 August 2019.
Mass Conc.PM10TSP
(μg m−3)Hourly MeanIn SituHourly MeanIn Situ
Max7618.276009994.69994.6
Mean491.41 ± 6.43-4580.5 ± 19.87-
Publisher’s Note: MDPI stays neutral with regard to jurisdictional claims in published maps and institutional affiliations.

