Article

Magnetometric Surveys for the Non-Invasive Surface and Subsurface Interpretation of Volcanic Structures in Planetary Exploration, a Case Study of Several Volcanoes in the Iberian Peninsula

by
Marina Díaz Michelena
1,*,
Rolf Kilian
2,†,
Miguel Ángel Rivero
3,
Sergio Fernández Romero
1,
Francisco Ríos
2,
José Luis Mesa
1 and
Andrés Oyarzún
4
1
Space Magnetism Area, Payloads and Space Sciences Department, INTA, 28850 Torrejón de Ardoz, Spain
2
Geology Department, University of Trier, 54296 Trier, Germany
3
ISDEFE as External Consultant for INTA, 28040 Madrid, Spain
4
Departamento de Ciencias de la Tierra, Universidad de Concepción, Concepción 78349, Chile
*
Author to whom correspondence should be addressed.
Deceased.
Remote Sens. 2022, 14(9), 2039; https://doi.org/10.3390/rs14092039
Submission received: 28 March 2022 / Revised: 18 April 2022 / Accepted: 19 April 2022 / Published: 24 April 2022

Abstract

:
Volcanoes are typical features of the solar system that offer a window into the interior of planets. Thus, their study can improve the understanding of the interiors and evolution of planets. On Earth, volcanoes are monitored by multiple sensors during their dormant and active phases. Presently, this is not feasible for other planets’ volcanoes. However, robotic vehicles and the recent technological demonstration of Ingenuity on Mars open up the possibility of using the powerful and non-destructive geophysical tool of magnetic surveys at different heights, for the investigation of surfaces and subsurfaces. We propose a methodology with a view to extract information from planetary volcanoes in the short and medium term, which comprises an analysis of the morphology using images, magnetic field surveys at different heights, in situ measurements of magnetic susceptibility, and simplified models for the interpretation of geological structures. This methodology is applied successfully to the study of different examples of the main volcanic zones of the Iberian Peninsula, representative of the Martian intraplate volcanism and similar to Venus domes, as a preparatory action prior to the exploration of the rocky planets’ surfaces.

Graphical Abstract

1. Introduction

Historically, volcanic activity on Earth has been an important focus of attention and profound study. Furthermore, their activity might cause serious damage to nearby populations with consequent socioeconomic losses [1]. Therefore, the study of volcanoes on Earth implies the real-time monitoring of multiple magnitudes, including ground movements such as earthquakes, the variation of the atmosphere composition, the chemistry of rocks and waters, and remote sensing observations, such as thermal, visible, as well as synthetic aperture radar (SAR) imaging. However, this exhaustive monitoring requires the vast deployment of instrumentation and its maintenance by volcanoes. In contrast, the study of active volcanism in the different bodies of the solar system is limited to observations from Earth or in-situ spacecraft [2,3,4]. In present times, the analysis of non-active volcanoes in the solar system can only be performed via available orbital datasets prior to the arrival of specific exploration missions [5,6,7].
These pioneering missions will have to be based on robust technologies capable of providing as much information as possible concerning the volcanic edifices under study [8]. This might imply a balance between near observations of the structures and coverage of their extension, which could be a niche for drones as well as rovers [9]. NASA has pioneered the flights of drones on Mars with the inclusion of the Ingenuity drone in the Mars 2020 mission [10]. It is expected that this is only a starting point in the use of such platforms in planetary exploration, increasing the outcome of current exploration missions with rovers.
The drones will have to be equipped with baseline instrumentation such as high-resolution cameras and infrared spectrometers. For the study of the subsurface, they could have gravimetric instrumentation and SARs or magnetometers on board [11,12]. SARs seem to be suitable instruments for monitoring volcanic activity on Earth due to their high precision in the determination of subsurface layer structures. However, magnetometry can offer additional information concerning the paleovector, i.e., the ambient field in the moment of the eruption, which is especially useful in the study of the geological history of planets covered with non-active volcanoes, such as Mars [13].
Lavas are the main feature on the surfaces of terrestrial planets. They cover about 90%, 50%, and 70% of the Venus, Martian, and terrestrial surfaces, respectively [14], indicating that extensive parts of the surface of these planets have been created and shaped by the transference of energy and matter from planetary interiors to their surface through volcanism. The whole understanding of the process requires profound knowledge of the full system, from the deep core to the atmosphere, which might have important differences in different planets.
When planets sustain a global magnetic field, lavas record the information of this field in their magnetization as they cool down through their transition temperature. On Earth, paleomagnetic investigations are focused on the study of the record of the core field in rocks, sediments, and even in archeological materials [15]. These records have been used to prove the plate tectonics and the planet’s magnetic field reversals, and are often applied in geological investigations for geochronology and to improve the knowledge on different geological structures such as volcanoes’ origin and evolution.
Among the terrestrial planets, orbital magnetic field data acquired by the MESSENGER mission revealed that Mercury has a weak global magnetic field consistent with an axial dipole offset of 20% of the planetary radius towards the north [16]. Low-altitude measurements of the same mission also revealed crustal magnetic field signals of ~10 nT maximum intensity, consistent with crustal rocks being heterogeneously magnetized [17,18,19]. Some of these crustal fields, specifically those associated with impact craters, have been used to constrain the evolution of the core magnetic field of Mercury [20]. New constraints on the internal magnetic field intensity, geometry, and nature will be further unveiled with the upcoming BepiColombo mission [21].
Today, Venus does not stand an internal (global and crustal) magnetic field [22] observable at spacecraft altitude. Because there is no observable crustal magnetic field signal, it is not possible to know whether that planet had a dynamo operating in its early stages. However, a more ambitious mission targeting specific surface areas of the Venusian surface could provide important insights about a dynamo existing in the past [23].
Mars Global Surveyor registered a vector magnetic field in its orbit around Mars at a nominal altitude of 400 km (± 40 km) between 1996 and 2006, and measured strong crustal magnetic field signals, demonstrating that Mars had a magnetic core field in its past [24]. This implies that lavas sourced in ancient Mars became magnetized when the rocks cooled down. Meteorites that impacted the Red Planet surface at that age should have partially erased the information of the former magnetic field in the target surface rocks and newly recorded with the evolved magnetic field [25], while impacts produced after the demise of the main field should not have led to a re-magnetization of the rocks. All of this information can be used to understand geodynamics on Mars as is done on Earth.
Since presently Mars does not stand a core field, the sources of the field are the crustal contribution as well as the external field. The map generated with the measurements taken at night and comprising a long observation period (2 years) can constrain the contribution of the crustal magnetization [26]. At a glance, the main characteristics revealed in this map are: the high intensity of crustal magnetic anomalies compared to those of Earth; the difference in the magnetic anomaly between the northern lowlands (magnetically weak) and the southern highlands (with a higher magnetic signature); and the appearance of alternate polarity bands parallel to the Equator in the region of Meridiani Terra. The first characteristic was originally attributed to the resurfacing and reshaping of the surface, which occurred during the Noachian and Hesperian eras, erasing the old pre-Noachian magnetization. Based on this map, the lack of magnetic signature of the major visible impact basins such as Hellas, Argyre, Isidis, Utopia, and Chryse, as well as in volcanic provinces like Elysium, Olympus Mons, Tharsis Montes, and Alba Patera, was also used to constrain the timing of the Martian dynamo up to 4.13 Ga [27]. Recent studies that use higher spatial resolution data from Mars Atmospheric and Volatile EvolutioN (MAVEN) span the duration up to 3.7 Gyr ago [28] based on the measurable magnetic contrast associated with the Lucus Planum pyroclastic flows of up to 3.7 Ga old. Other models have been produced combining vector field measurements and intensity estimates, including MAVEN data, to increase the observation period to nearly 20 years. The extrapolation of the model to the surface has allowed the detection of a weak magnetic contrast associated with the northern large basins Borealis, Utopia, and Isidis, but reflects a limitation in spatial resolution in the order of 140 km due to the minimum distance of the data registers (~130 km). This restricts the capability for the interpretation of smaller structures. Therefore, high spatial resolution magnetometry performed at closer distances could significantly benefit the study of Martian planetary structures such as volcanoes.
On Earth, the majority of volcanoes are found along divergent and convergent plate boundaries, and a certain number of volcanoes are fed by mantle plumes. Mars and Venus are characterized by a single global lithospheric plate and the volcanic activity has been linked with mantle plumes, which, in some cases, generate linear zones of mantle upwelling and lithospheric extension [3,29,30,31,32,33].
Volcanism on Mars is predominantly basaltic in nature [34]. However, diverse igneous compositions revealed by remote sensing [5], meteorites [35], and landed missions [36,37,38,39,40,41,42] indicate that ancient Mars differentiated and experienced varied igneous processes that generated heterogenous distributions of volatile and incompatible elements [34]. Therefore, the presence of effusive alkaline rocks is evidence of the igneous diversity on Mars [43]. Major volcanic landforms on Mars include large volcanic provinces and associated shield volcanoes [44], pyroclastic cones [45], lava flows [46], domes [47], calderas [48,49], and fall-out deposits [50].
The lack of Venusian plate tectonics is also implied by the global dominance of a basaltic composition of the crust. On a geodynamically active planet that lacks modern-day plate tectonics, upwelling plumes and their related surface expressions are its dominant volcanic traits. The primary volcanic products on Venus are extensive tholeiitic–alkali basalt plains [29,51]. However, the surface of Venus displays volcanic features indicating the eruption of lavas with a wide range of viscosities [52]. Typical volcanic landforms include lava flow fields [53], steep-sided domes [54], and lava channels [55]. Other volcanic features include shield volcanoes, calderas, and complex topographic annular features such as coronae and arachnoids [54].
Despite the many differences, the knowledge of planetary volcanoes significantly benefits from investigations of terrestrial volcanoes. The study of terrestrial analogs is part of the preparatory actions taken to be ready for the interpretation of the volcano data of other planets like Mars, when they are available. In this sense, the high-resolution magnetic signature of analog edifices, obtained with measurements on the surface or at a low height, and a preliminary in-depth interpretation of their structures using digital elevation models derived from high-resolution imaging can help in understanding their origin, with implications for the Martian crust and mantle, as well as the global magnetic field if it was active in the moment of the eruptions.
In this work, we focus on three different Neogene volcanic zones of the Iberian Peninsula (Figure 1): Campo de Calatrava Volcanic Province and the Catalonian Volcanic Zone, both with intra-plate magmatism geochemical characteristics [56], and a third, Cabo de Gata in the SE Volcanic Province, which is associated with back-arc extension [57]. The eruptive products at these zones cover a wide compositional range, from basalts to rhyolites with alkaline, calc-alkaline, tholeiitic, and shoshonitic geochemical affinities [58,59,60].
The selected sites have been used to test the equipment in its different stages of progress and to improve the methodology of work. Therefore, different setups have been used in different example sites.

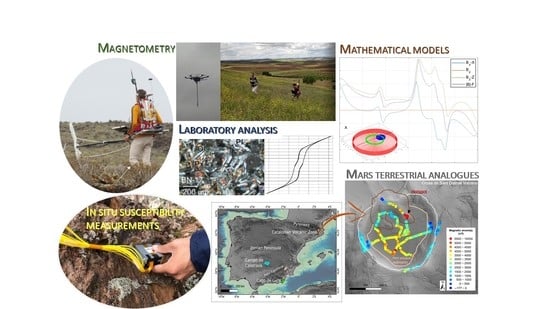
2. Materials and Methods

In this work, we combine different geophysical methods that we will develop in more detail in this section:
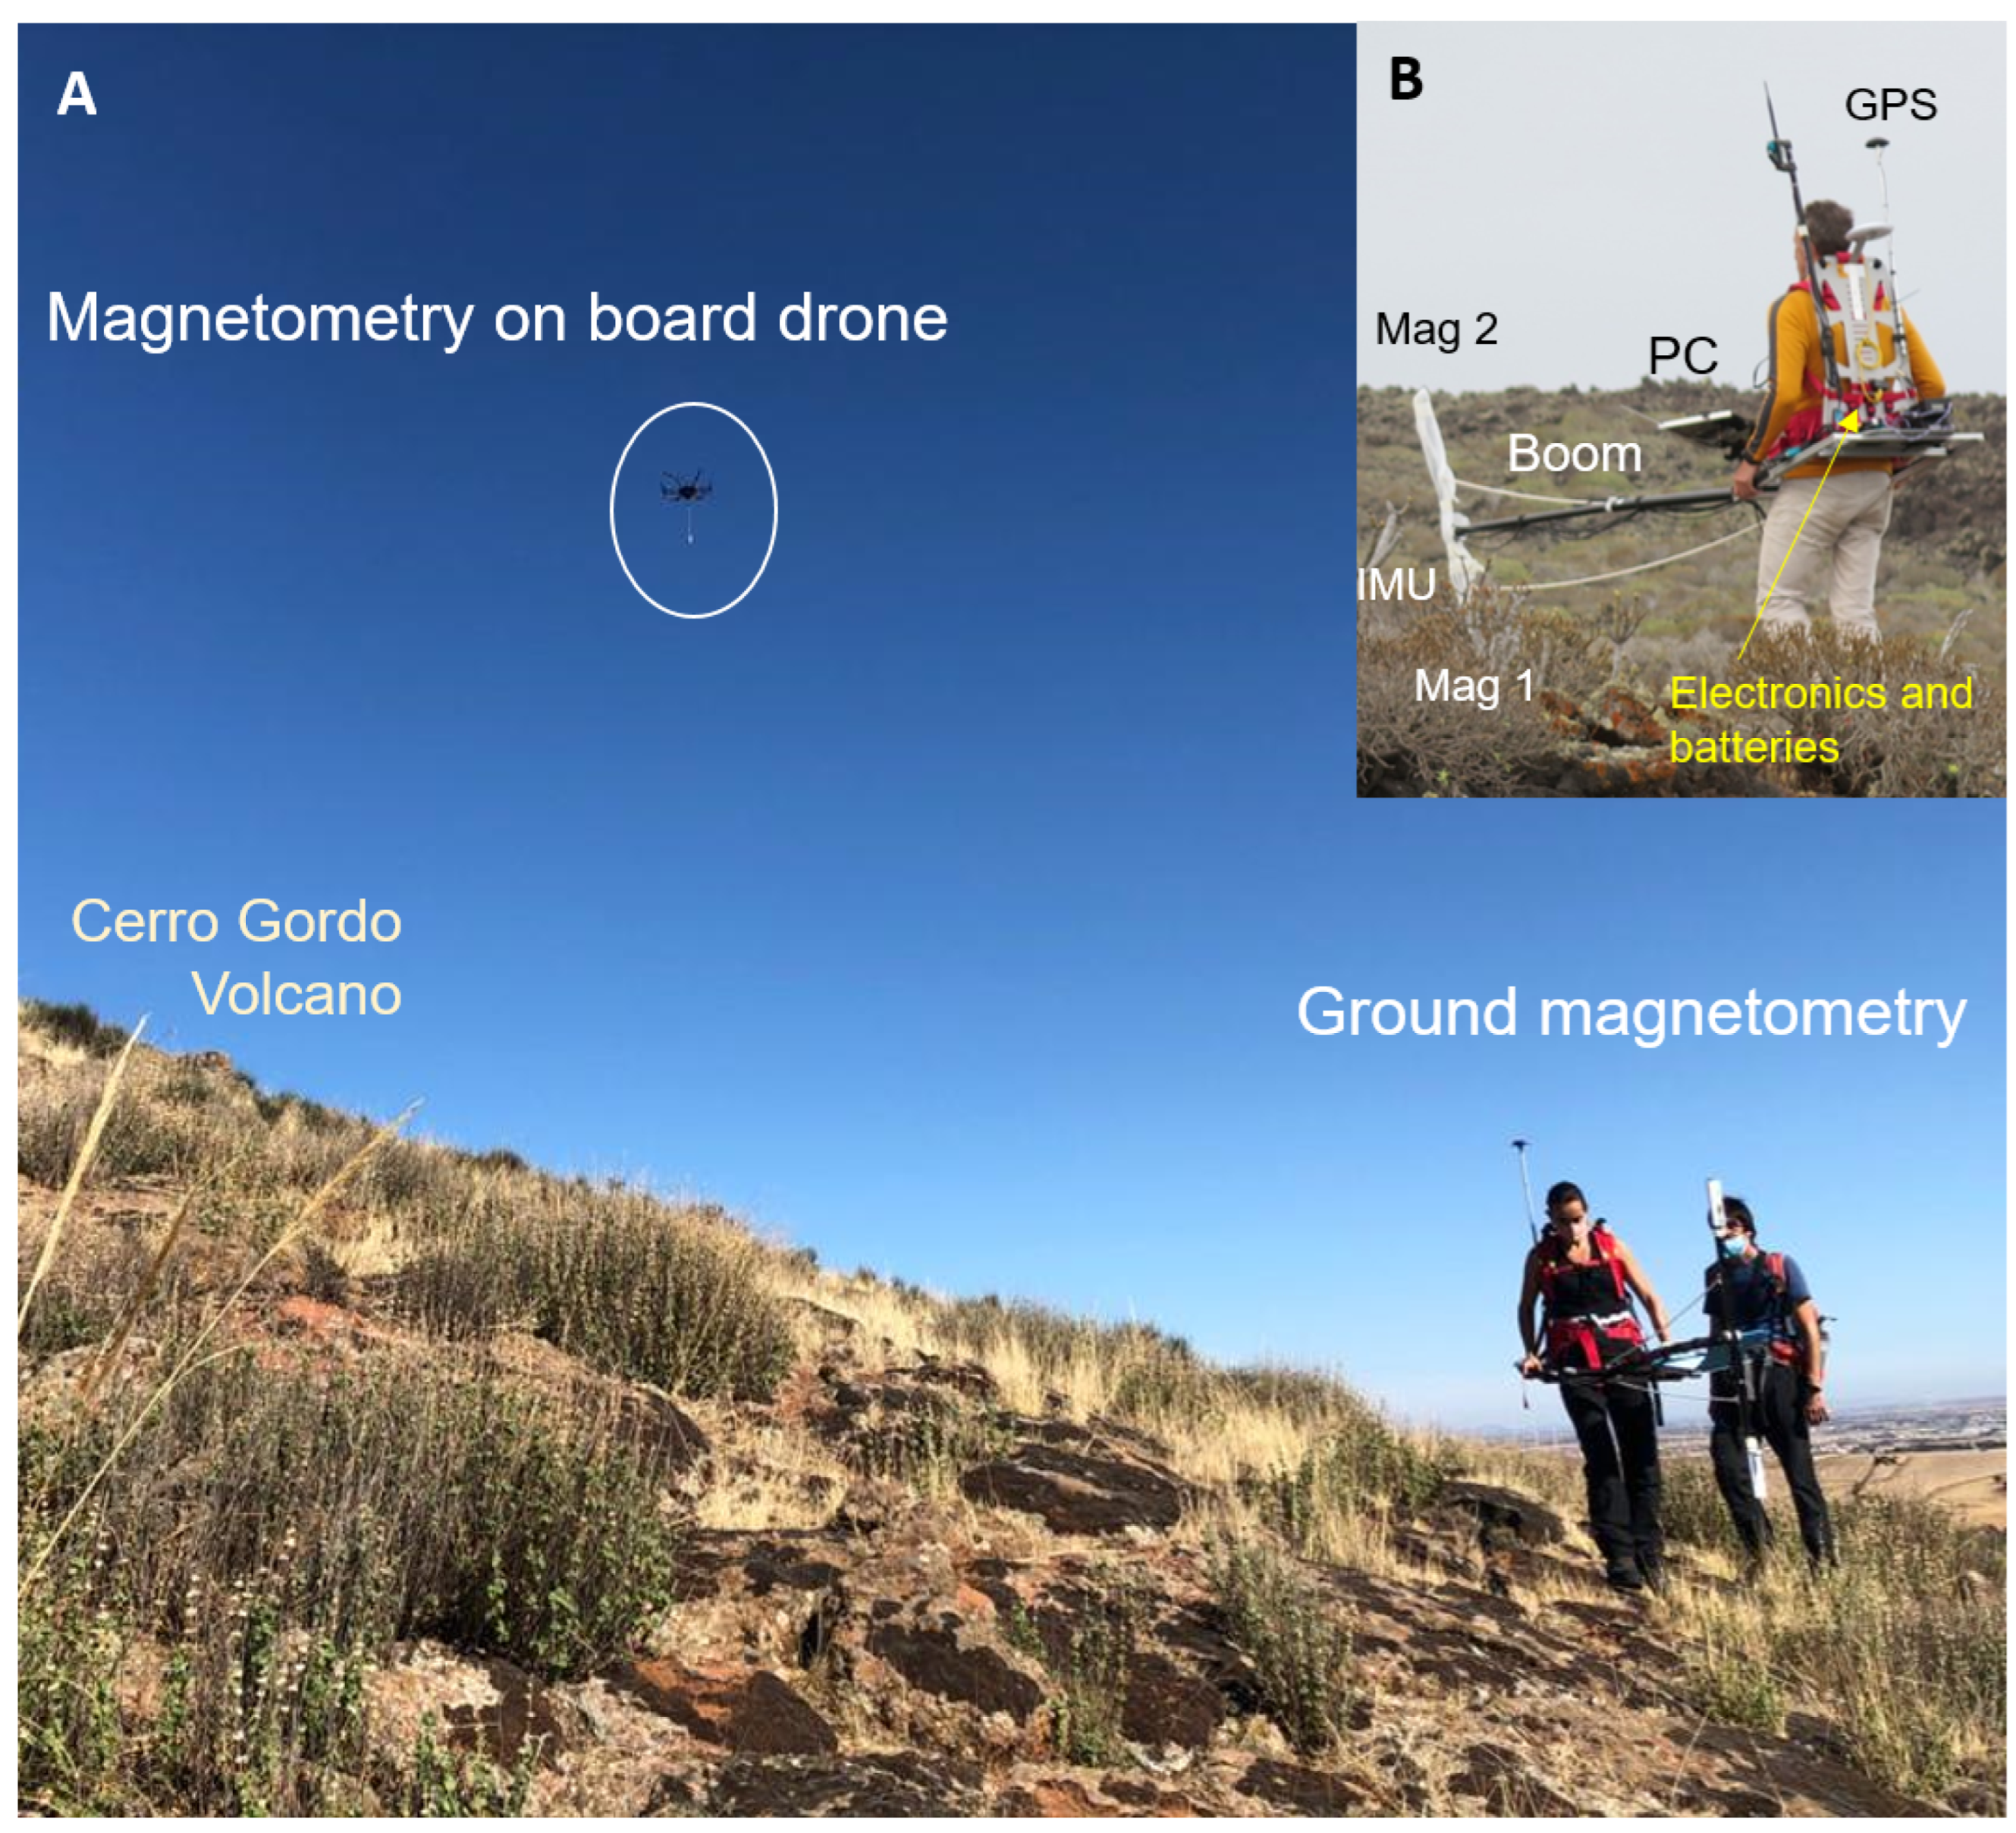
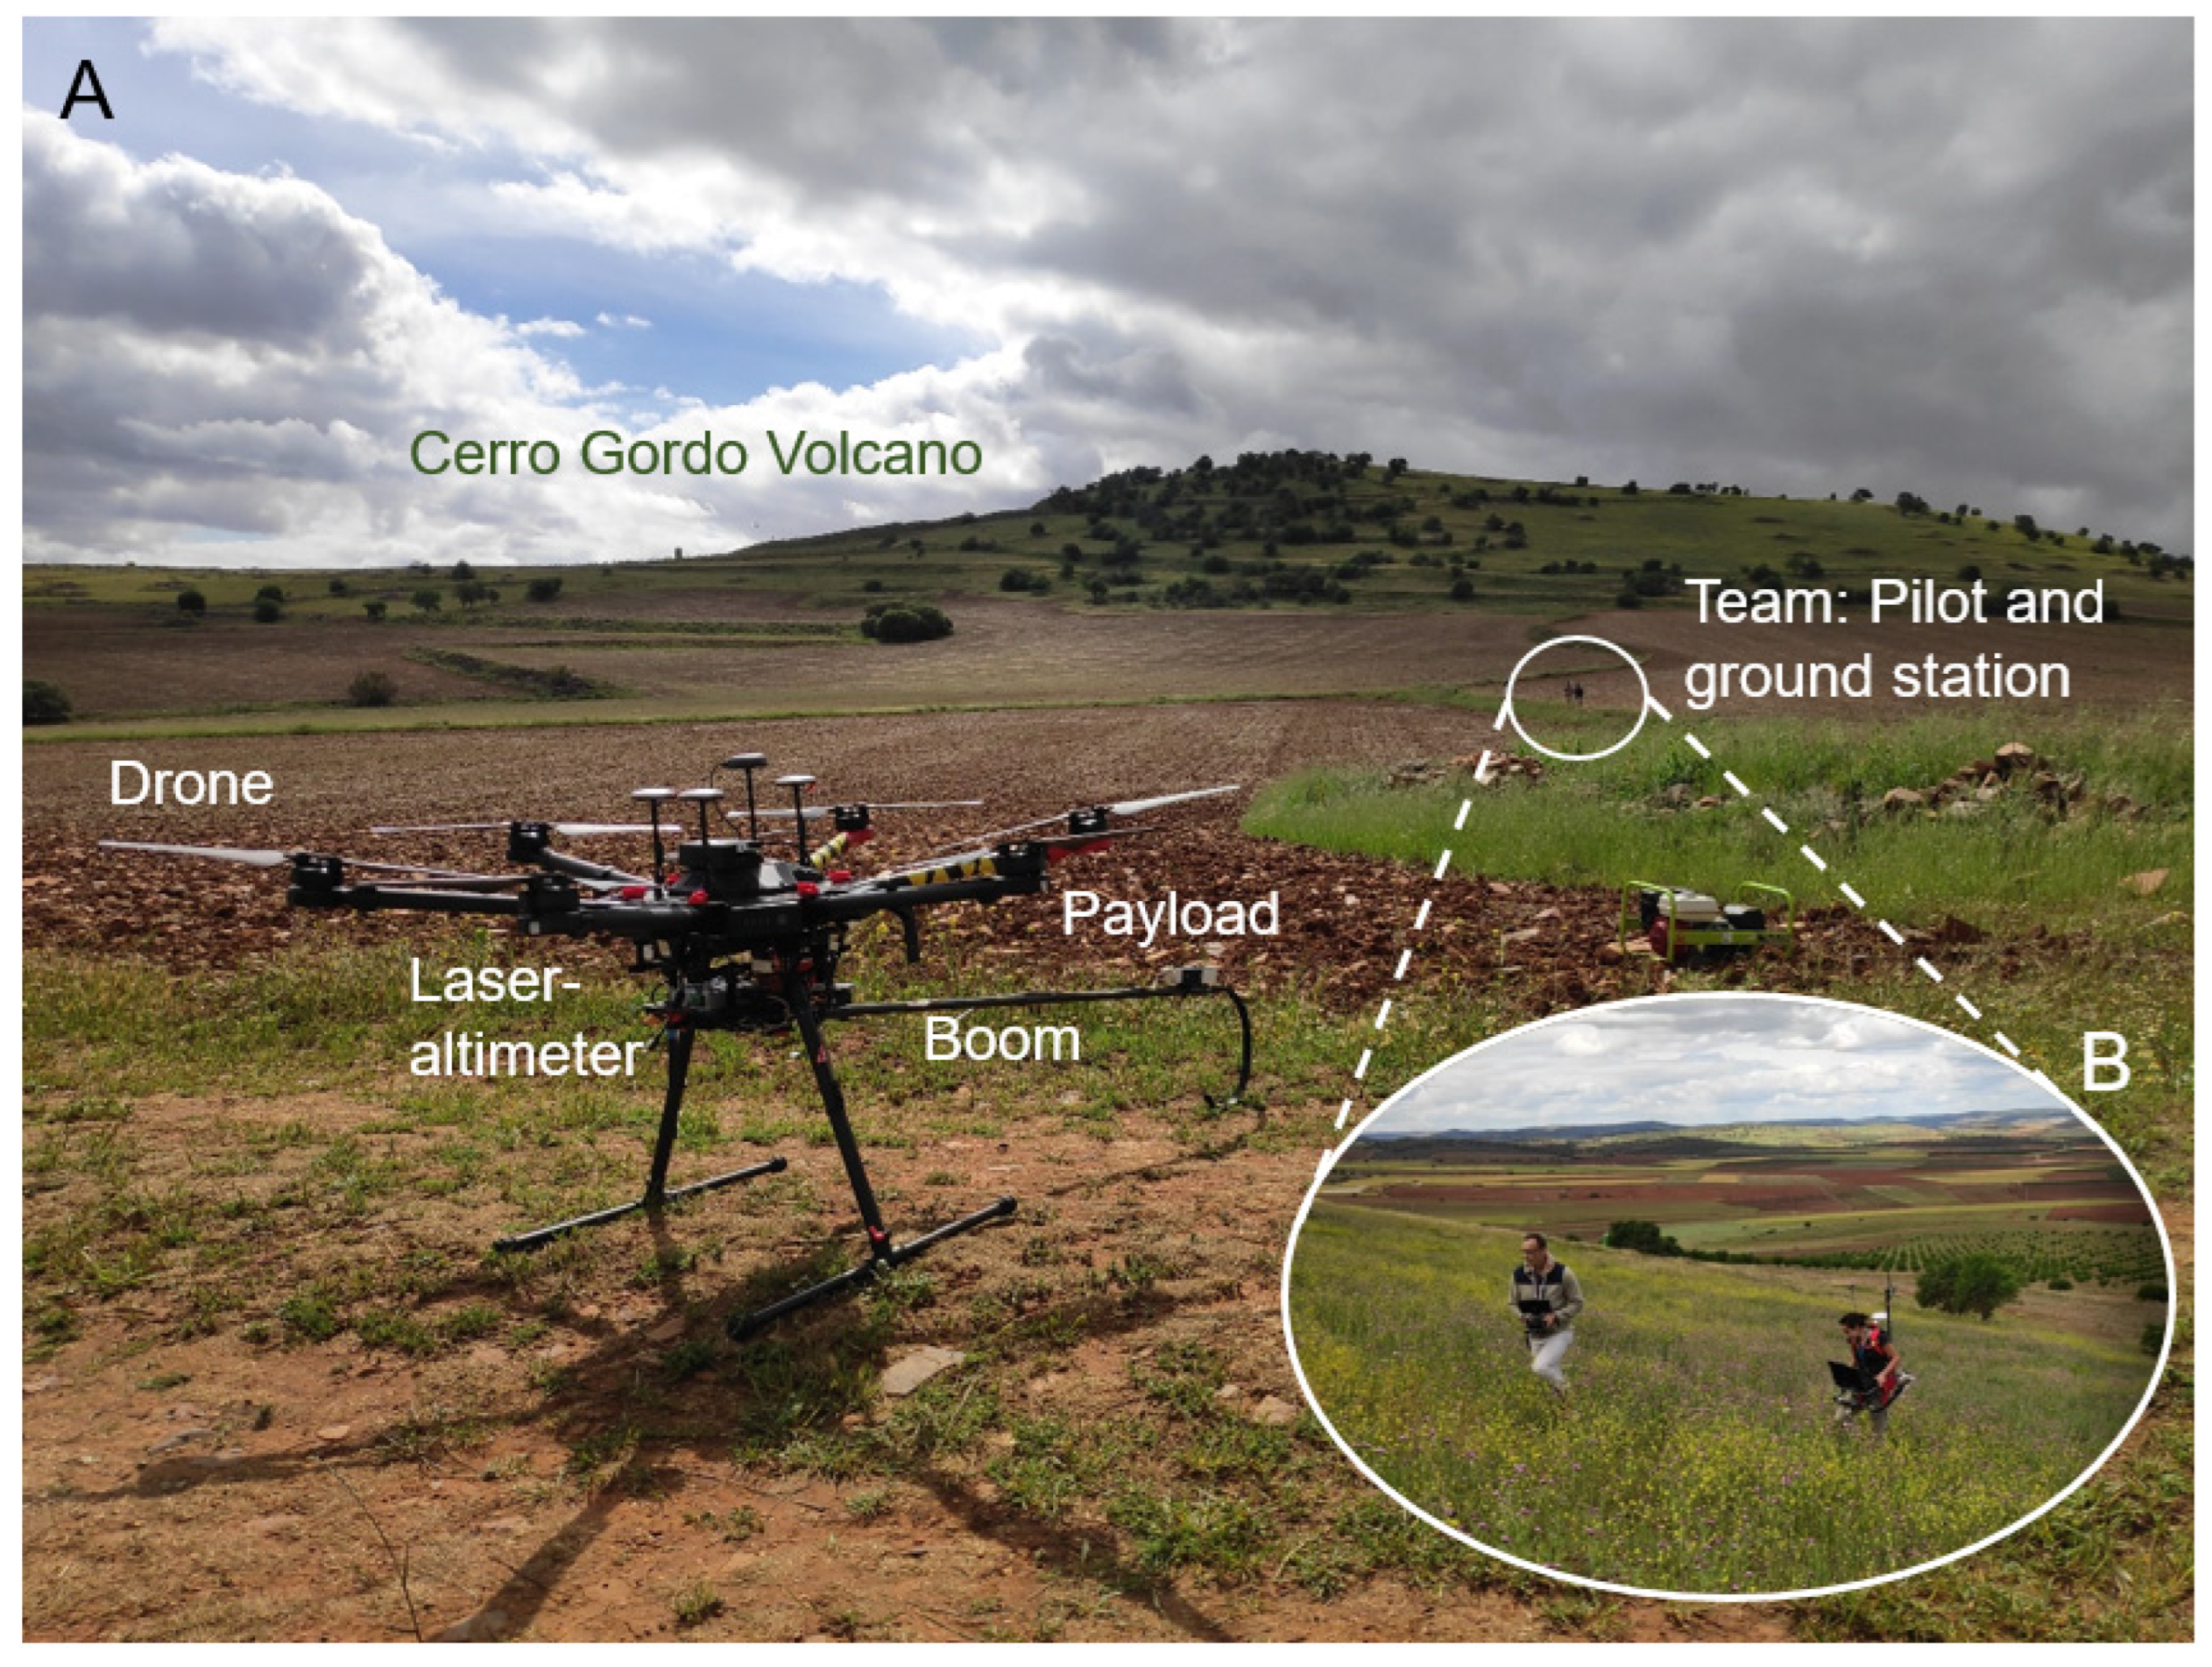
  • Magnetic surveys. We use on ground and vector magnetometry (Figure 2), a remote sensing tool, to measure the magnetic signature of different structures, both on the ground and onboard a remote-piloted aircraft (RPA) (Figure 3A). This allows for the determination of the intensity and direction of the magnetic field. Additionally, we measure the magnetic susceptibility in situ to determine the induced magnetization of different elements.
  • The in situ observations of the morphology of the structures, constituent rocks, and the collection of samples.
  • The generation of mathematical models based on the observations and measurements of the magnetic field and susceptibility. The aim of the modeling is to test how the predicted magnetic field matches the measured one, taking into account the observed geological data and measured magnetization characteristics. In cases where the in situ magnetic characterization of rocks is not available, approximate expected values are used according to the type of rock obtained in previous measurements.

2.1. On-Ground Magnetometry Equipment Description

The equipment for on-ground magnetometry is transported by a person (Figure 2B). The full system of approximately 15 kg comprises two parts separated by a 2 m boom. The sensing subsystem is a set of two vector magnetometers attached to a pole with an inertial measurement unit (IMU) in such a way that the magnetometers are at distances of 0.1 m and 1 m from the ground, and vector data can be referenced to geographic coordinates. The auxiliary subsystem comprises batteries to power the system, a GPS, electronics to condition and process the data, wiring, and a laptop to register and visualize the data. The magnetic moment of the auxiliary equipment is lower than 200 mAm2, giving rise to a maximum magnetic field in the position of the magnetometer of 3 nT, which is a systematic error due to the remanent nature of the magnetization.
This situation permits the development of tracks in different orientations with respect to the geomagnetic field, which is not often possible due to the morphology of the terrain and the limitation of areas for walking. Therefore, the measurements presented in this work, except for the Cerro Gordo survey, which follows a single line, were conducted in a semi-discrete mode. The recording of the field is continuous, but the data presented are discrete measurements at certain points when the system has been oriented to the geographical north determined by the auxiliary equipment. The data provided in the graphs average more than 200 measurements within −1 and 1° with respect to the geographical north acquired when the system is oriented.

2.2. Onboard Drones Magnetometry Equipment Description

The system for the magnetometry onboard drones has been developed to improve the interpretation with measurements at different heights and to partially overcome the problems derived from the difficulties of walking on the terrain and their risk, as well as the time taken and the derived cost. The RPA is a hexacopter with a capability of 5.5 kg available for payloads [62,63].
The auxiliary electronics are accommodated on a pod below the RPA body and include the batteries, control electronics for the boom, acquisition system, and communications.
The payload subsystem needs to accommodate the vector magnetometer at a high distance from the body of the drone, the auxiliary equipment, and the engines to minimize their magnetic signature at the position of the sensor. The magnetic moment of the drone with the equipment is <160 mAm2 in DC, and the engines generate a component in the order of 20 nT rms in the position of the magnetometer in the band between 30 and 107 Hz. Thus, the drone is provided with a retractile 1.2 m boom with the magnetometer at its free end (Figure 3A,B), the sampling frequency is tuned at 10 Hz, and an antialiasing filter is implemented. Therefore, the height of the magnetometer during the flights is 1.2 m lower than the flying height.
During the take-off and landing, the boom is held horizontally by a servo, and during the flight, the boom is in a vertical position (Figure 3B and Figure 4A).
The operation is visual and designed for constant altitude flights of the drone to maintain the distance to the surface sources using a laser altimeter. The height for the flights ranges between 20 and 5 m, as the dimensions of the examples under study are in the order of hundreds of meters of diameter. Ideally, the flying tracks are parallel lines north–south or south–north, with spacing related to the height for moderate- to high-resolution measurements.
The ground control station has evolved from a static base (Figure 3A) to a mobile platform (Figure 4B) to guarantee vision of the drones at the flying heights of 20 and 5 m in the abrupt terrain of the volcanoes.

2.3. Magnetic Susceptibility Meter Description

The determination of the susceptibility is performed by means of the NEWTON instrument. NEWTON is a portable and compact magnetic susceptibility meter developed to improve the characterization of rocks and regoliths in the planetary exploration of Mars and the Moon [64].
It measures the real magnetic susceptibility by means of the change in inductance in a resonant circuit by the approach of a sample to a ferrite open core. The system comprises a sensor box (S-box) and an electronic box (E-box), both of which are powered with a battery. A laptop is used for the early visualization of the data (Figure 5).

2.4. Magnetic Modeling Description

The graphics for the magnetic anomalies are performed with an ad hoc software developed by the team [62], which uses the orthogonal representation of the geomagnetic field, i.e., X points to the geographic north, Y points to the geographic east, and Z is the radial component pointing down into Earth.
A preliminary interpretation is performed based on models that use the georeferenced magnetic data and corresponding observations in the field.
The mathematical model is based on the magnetic charges or poles of the different elements, and the calculation is conducted through the scalar magnetic potential [65]. The models are created on different simple geometrical forms, which mimic the different elements observed in the structure.
In the models, we attribute the values of the magnetization to different elements that correspond to induced (through the susceptibility value and the present geomagnetic field intensity in the SI) and remanent components (Mx, My, Mz) in Am−1. The induced part can be experimental when susceptibility measurements are available. In cases where we do not have the magnetic characterization of the rocks, we attribute magnetization in the order indicated by our database of the collection of rocks or through the inversion of the field data. As an example of the application of this technique, reference [66] compares the results of two magnetic models using similar techniques with magnetic measurements made in the Barda Negra crater in Argentina.
Due to the age of the volcanoes under study and the availability of the data, the natural remanent magnetization is aligned either with the present geomagnetic field or inverted, depending on the case. Therefore, in this study, we did not take into account the magnetic declination.

3. Results

In this section, we present the case studies of several volcanoes in the Iberian Peninsula as potential terrestrial analogs of other rocky planet structures.
The case studies of this work are different volcanoes considered to be representative of the three main volcanic areas of the Iberian Peninsula: the Catalonian Volcanic Zone (CVZ) in the northeast, Campo de Calatrava Volcanic Province (CCVP), slightly south from the center [67] (Figure 6A), and the Almería–Murcia Region (A–MR) in the southeast. The whole set offers great compositional variety with examples all along the TAS diagram [68,69,70,71,72,73,74] and for the analysis of the aptitude of the proposed methodology.
The compositional range from the basaltic magmas with 45–55 wt% of SiO2, with a high composition of Fe, Mg, and Ca and a low content of K and Na, to rhyolitic magmas with 65–75 wt% of SiO2, with a high content of K and Na and a low content of Fe, Mg, and Ca, implies that basaltic magmas have a greater capability to store magnetization than andesitic and rhyolitic ones. In spite of this, in the study, all of the structures investigated cast a measurable magnetic contrast, which can be used together with the observed morphology for the models.
The volcanic activity of the four main Cenozoic volcanic provinces of the Iberian Peninsula began in the Oligocene–Miocene (ca. 25 Ma), with volcanism that evolved from subalkaline to ultrapotassic affinities in the Upper Miocene (8.7–5.7 Ma) and alkaline as well as ultra-alkaline in the later stages (from the Pliocene to recent years) [67].
The oldest volcanic activity was concentrated in the A–MR. In particular, the surveyed sites are placed at Cabo de Gata, considered a part of the volcanic arc of the Betic-Rif Orogen [75]. The other two examples, the CVZ (Figure 6B) and CCVP, correspond to the most recent activity related to the Neogene–Quaternary alkaline volcanism of extensive rift systems in Europe [76,77].
Despite the global moderate relevance of the Iberian Peninsula volcanism, the areas of study have common petrological, structural, and volcanological characteristics with those of the European Neogene–Quaternary rifts systems; some of them are intraplate volcanism and therefore constitute the terrestrial analogs of Mars [30]. Furthermore, the different types of volcanic eruptions in the A–MR examples have generated similar morphological features to those on other planets, such as the domes of Venus.
The presentation of the sites follows a reverse chronological order, starting with the most recent volcanism with better-preserved structures.

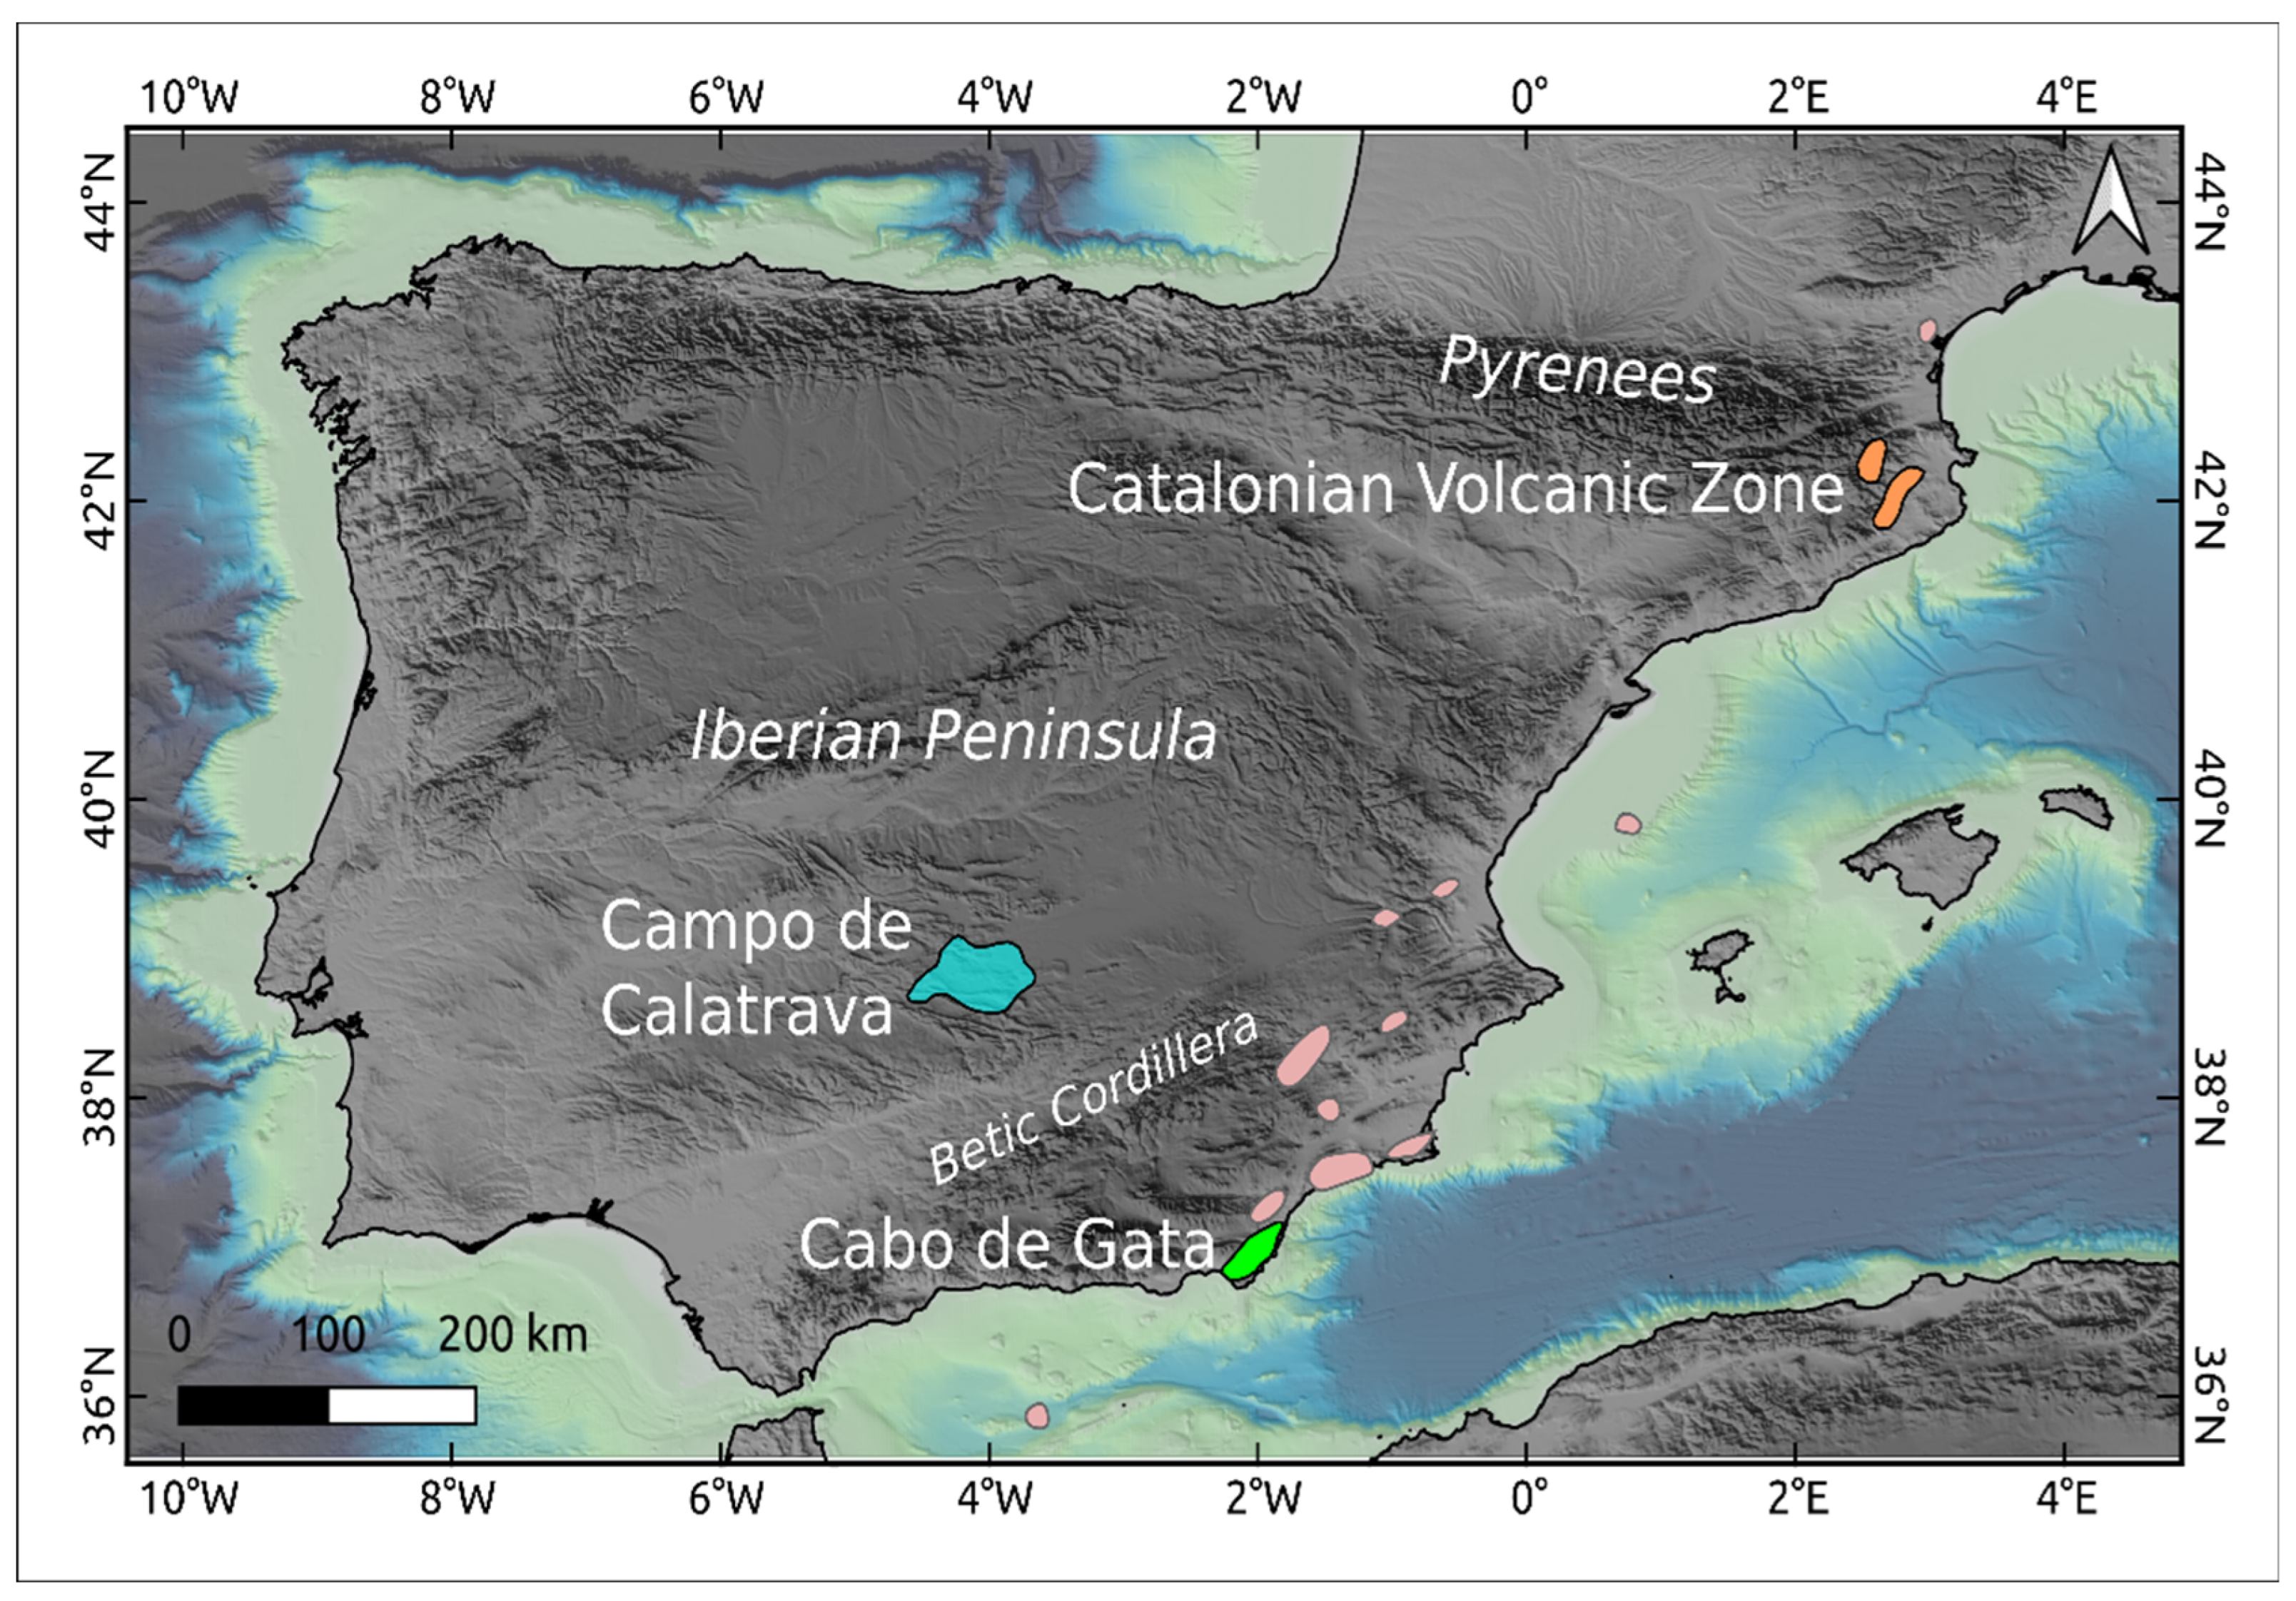
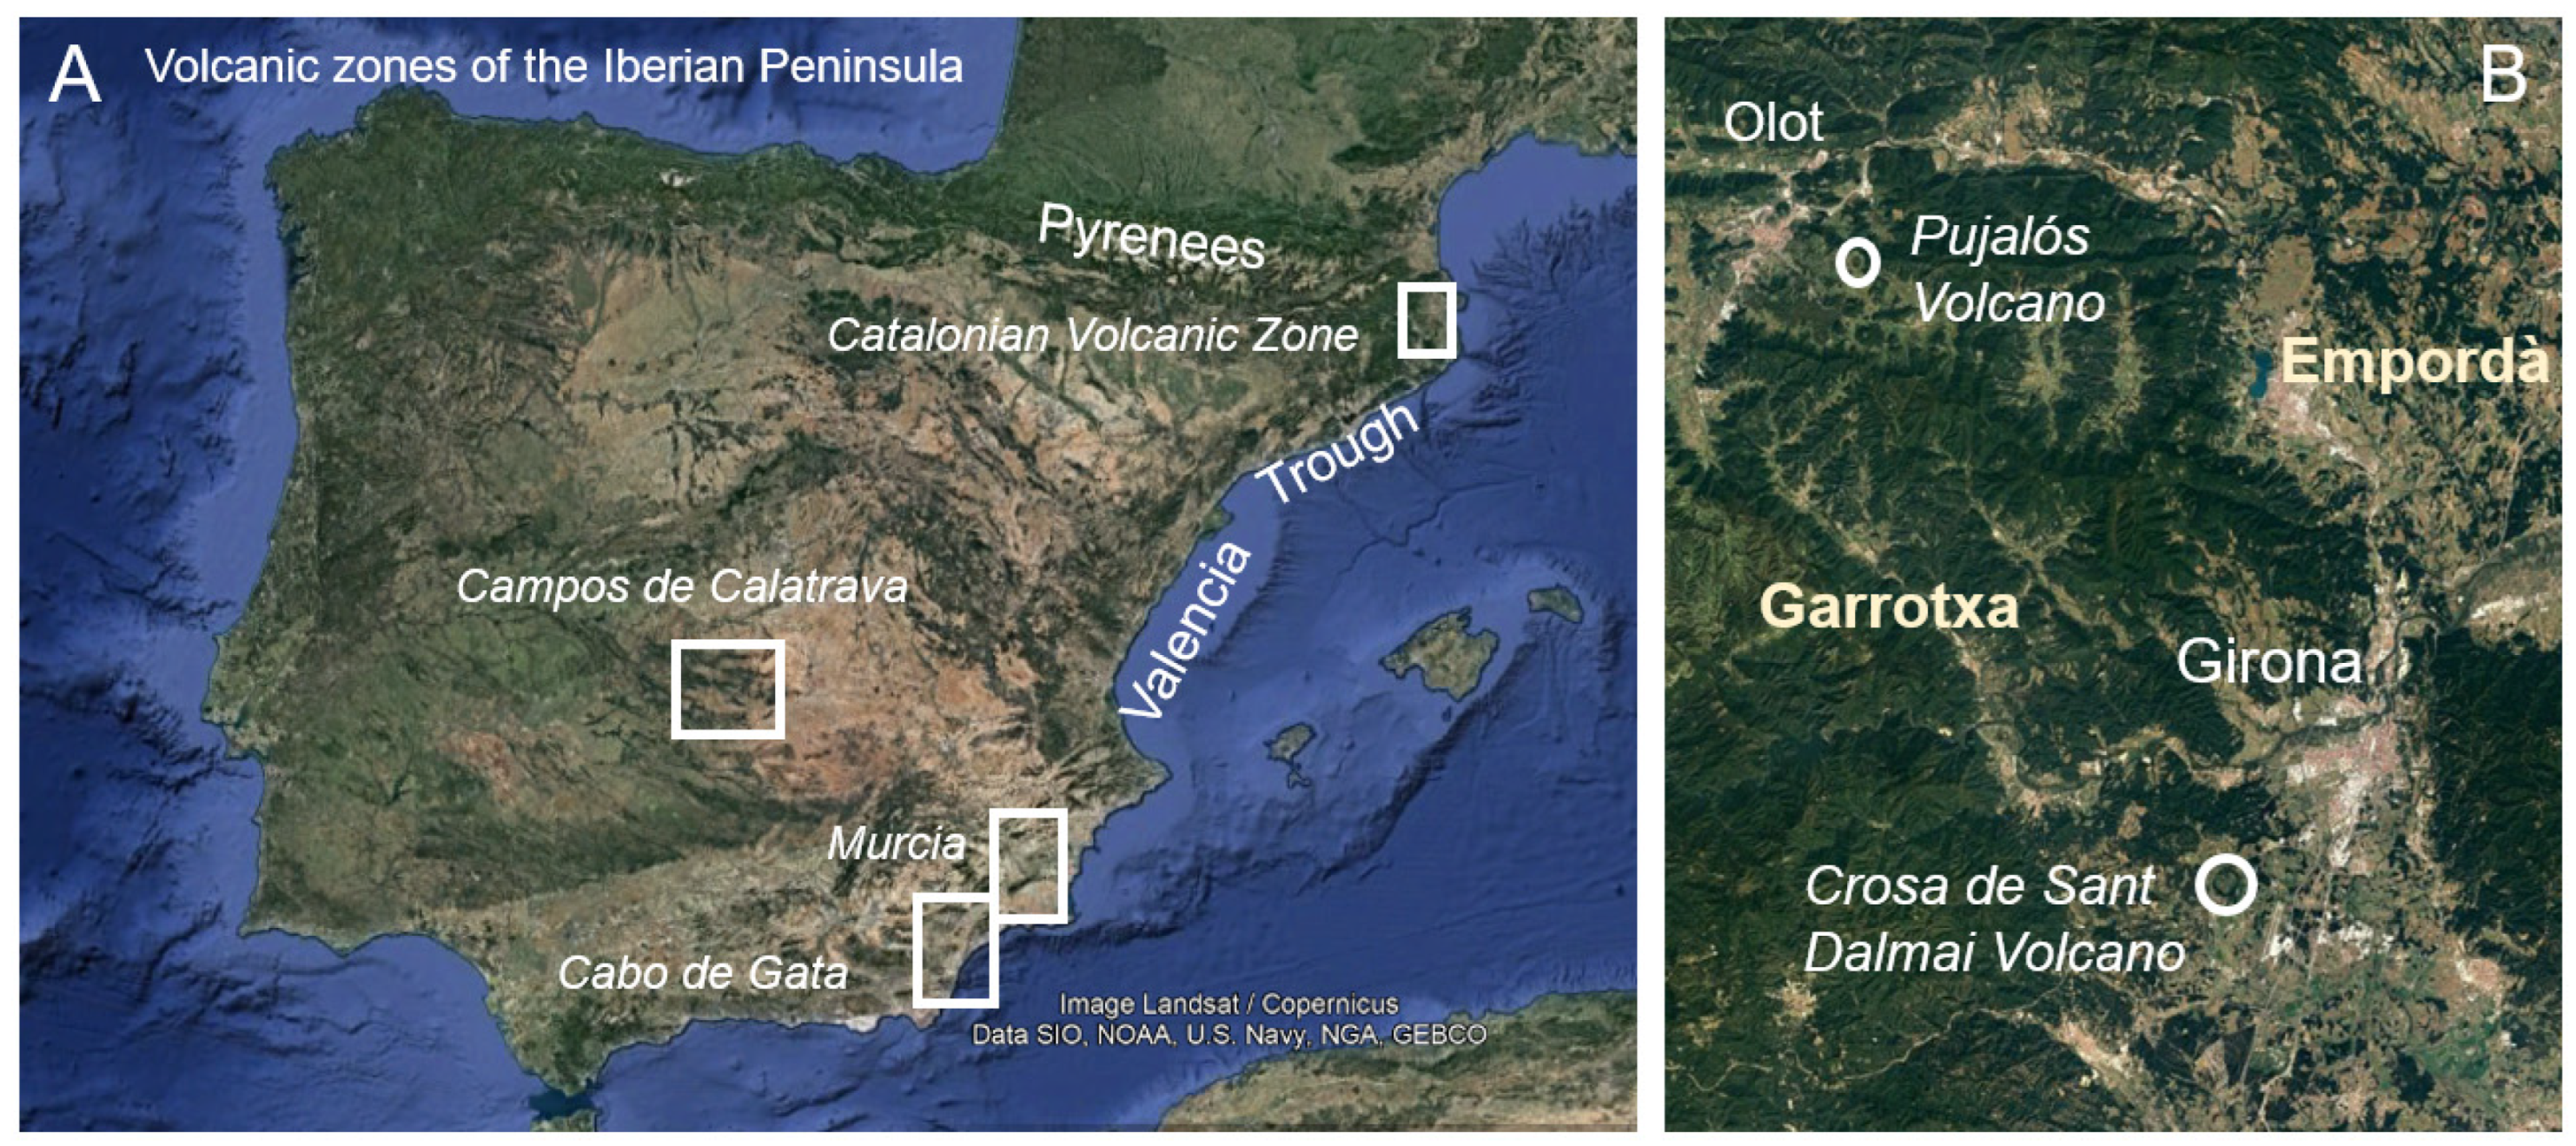
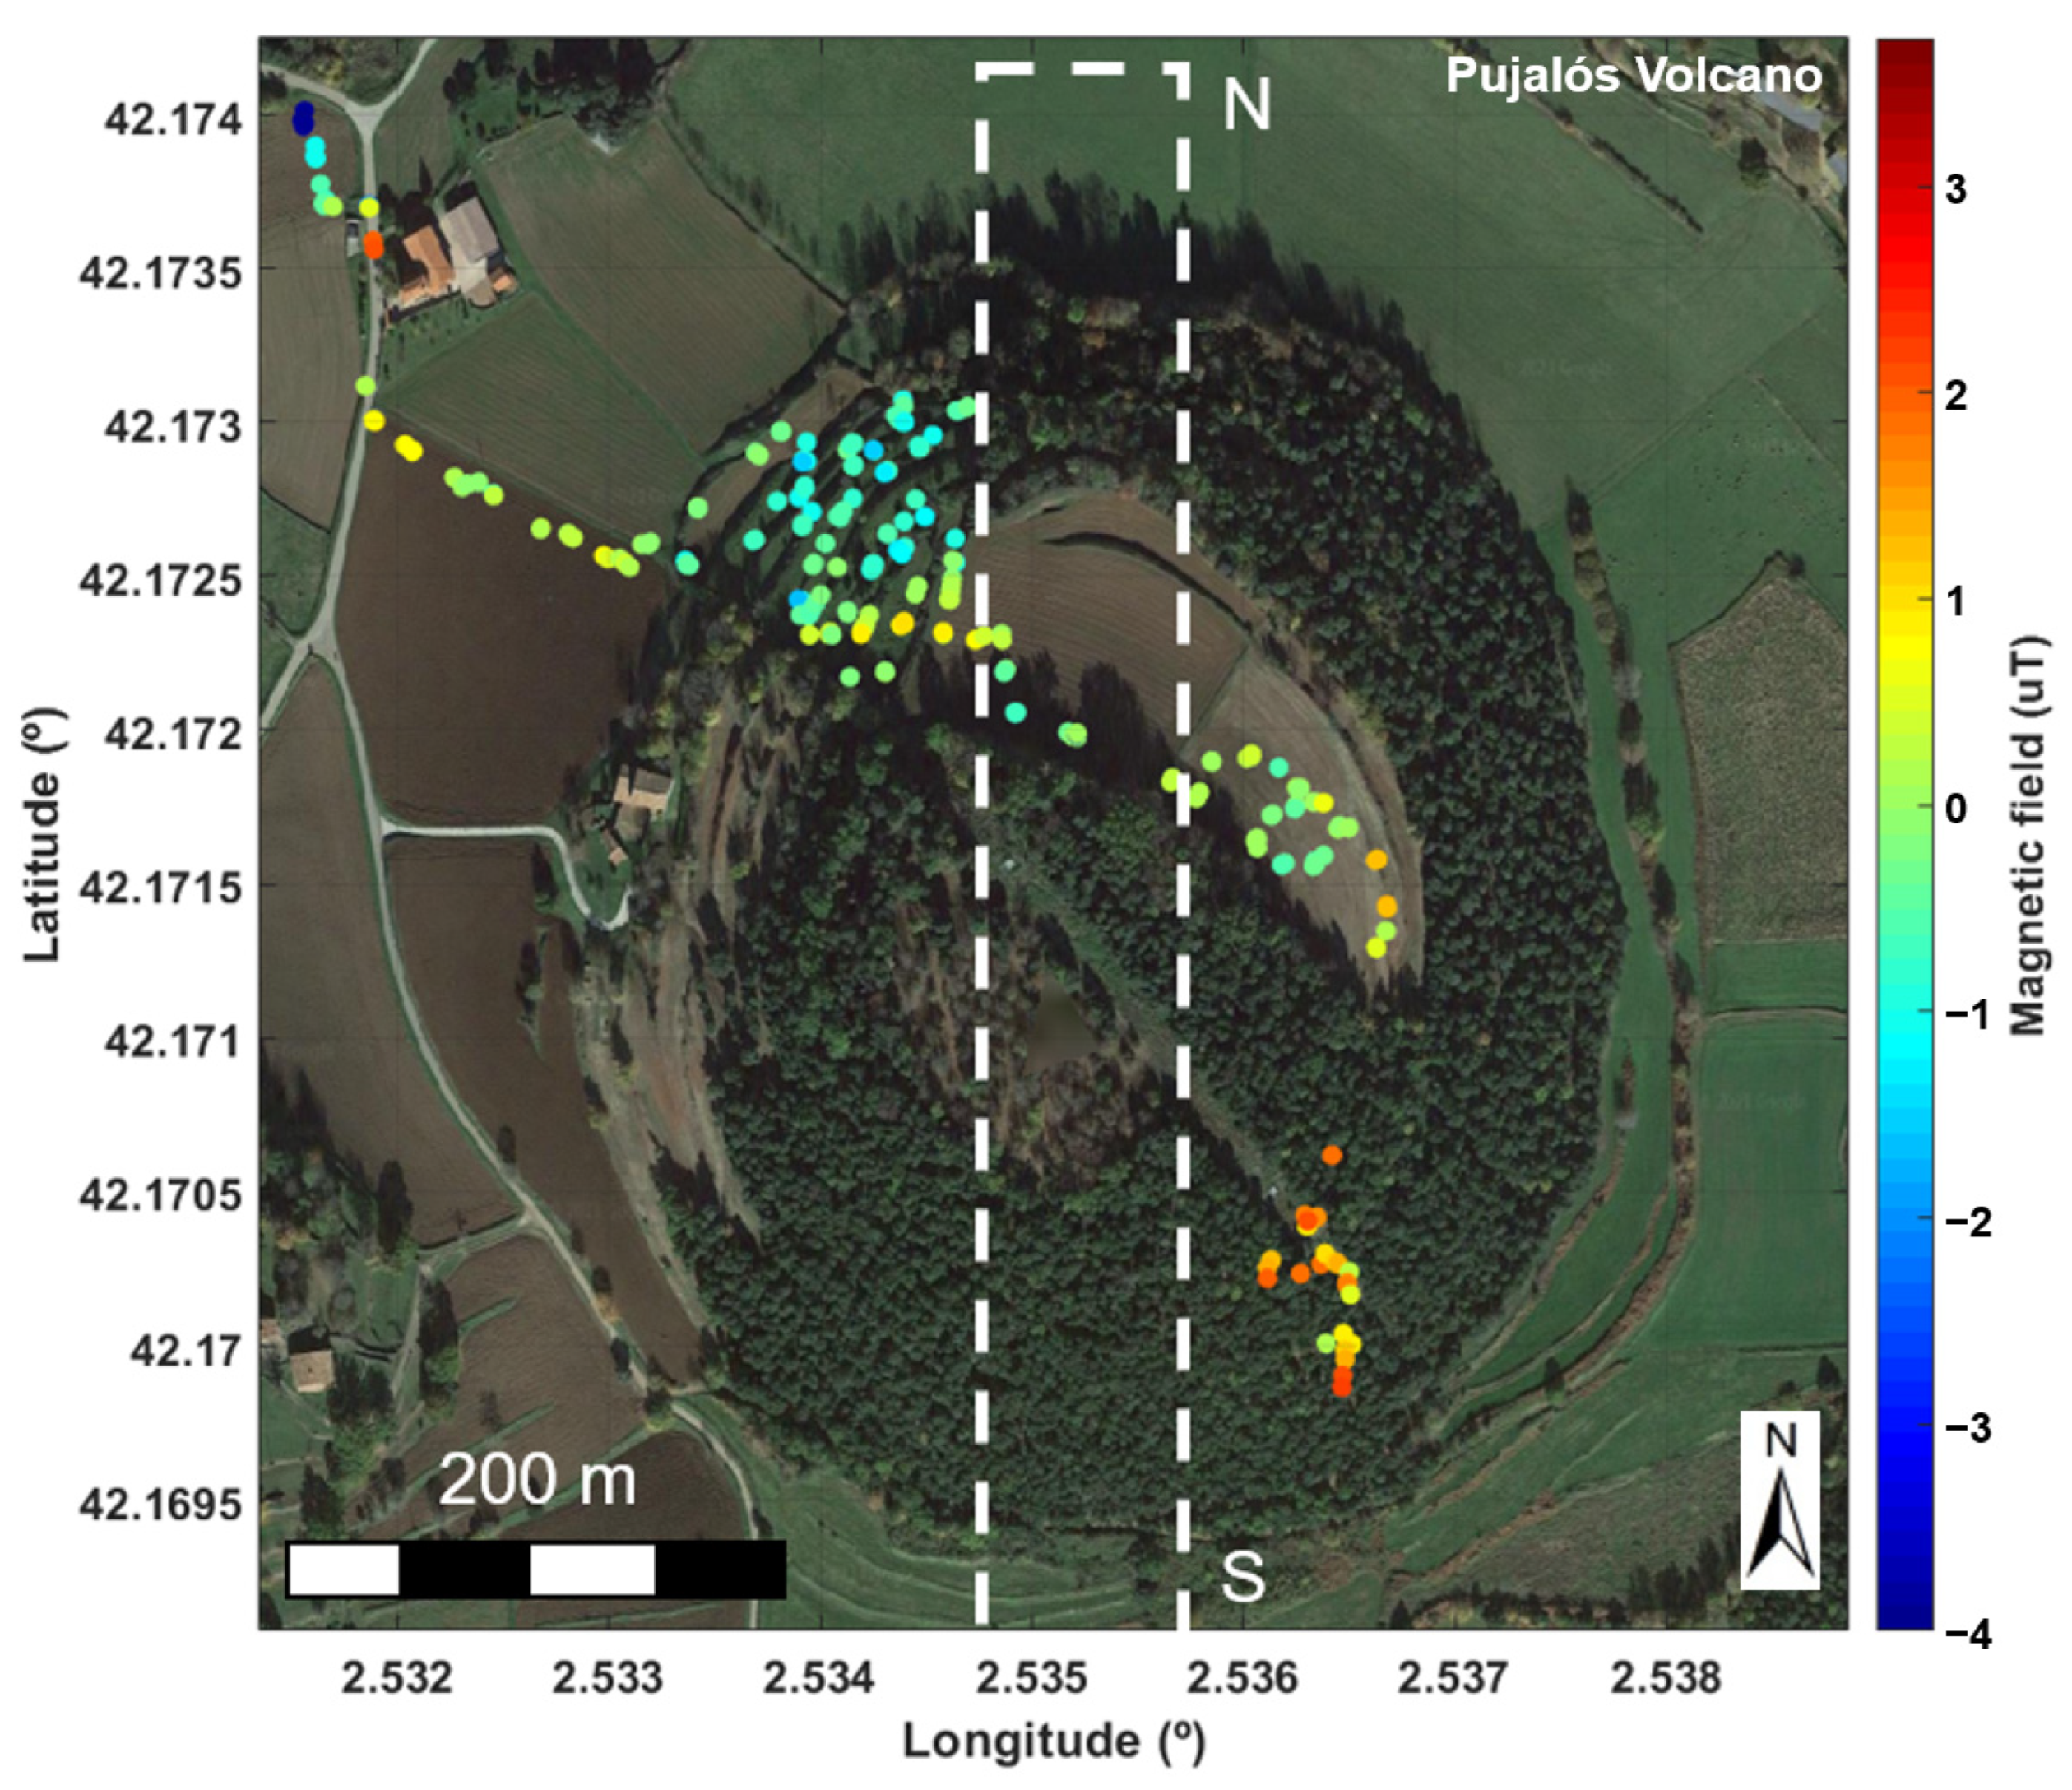
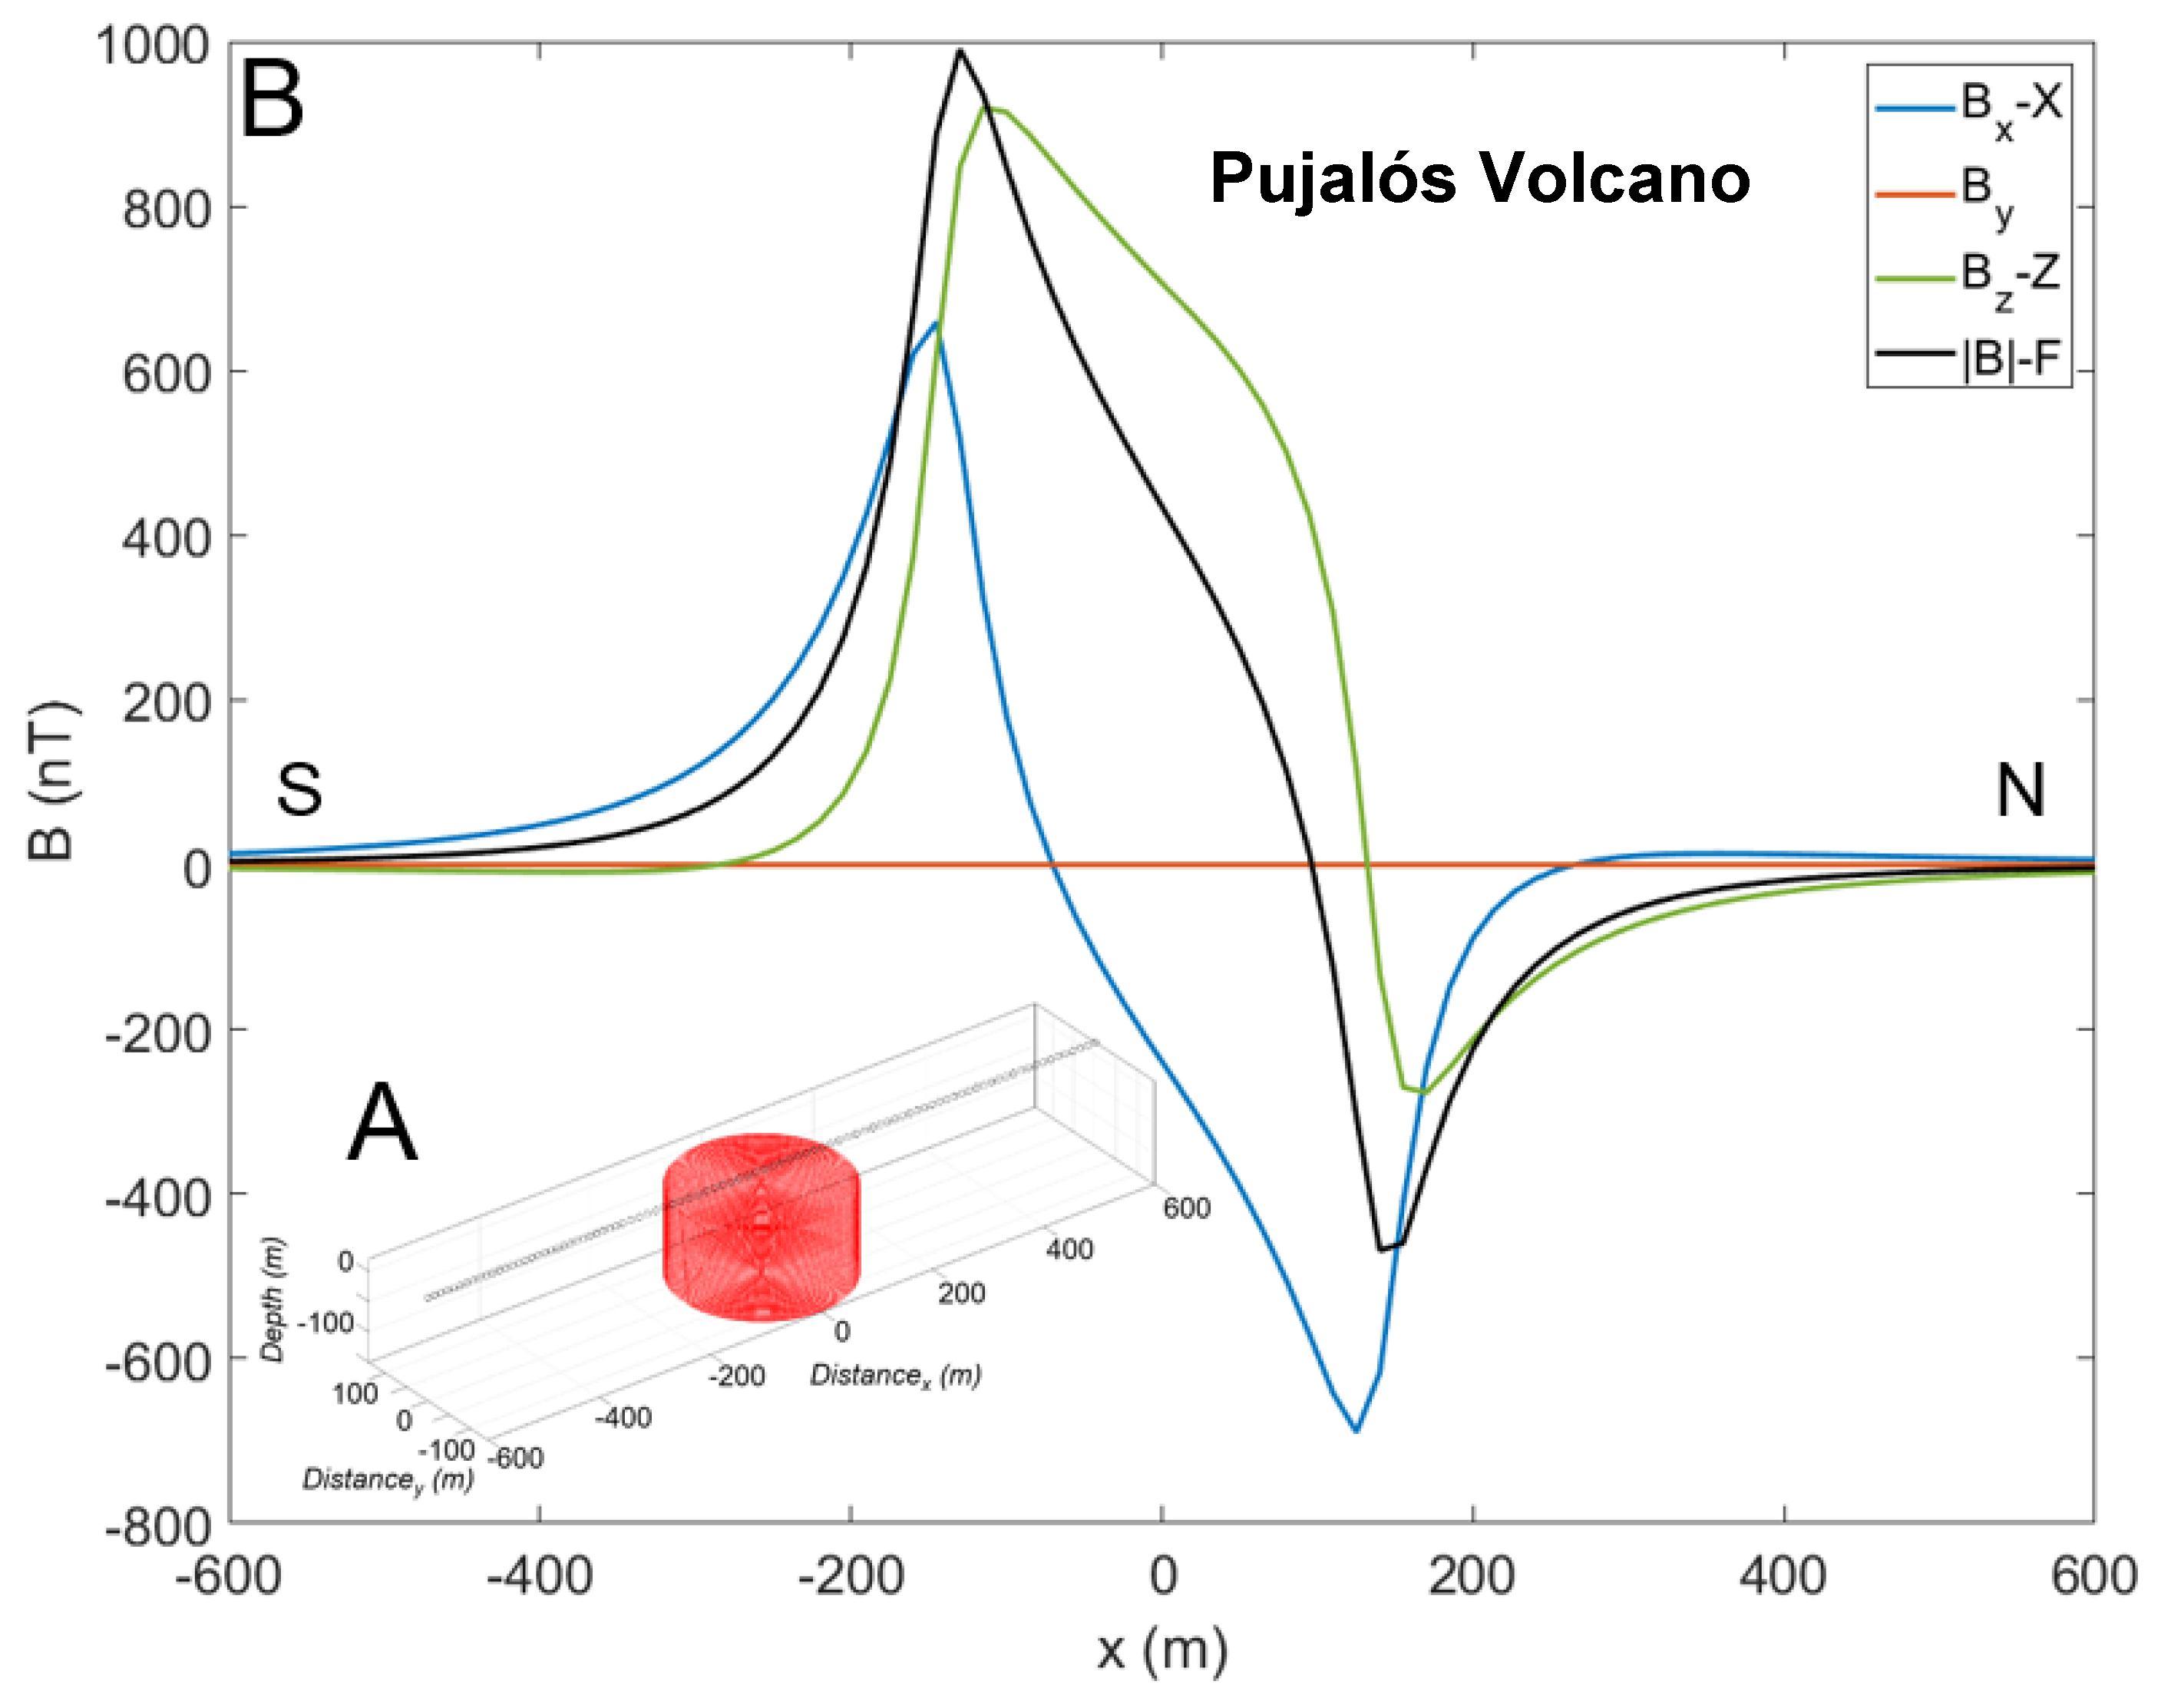
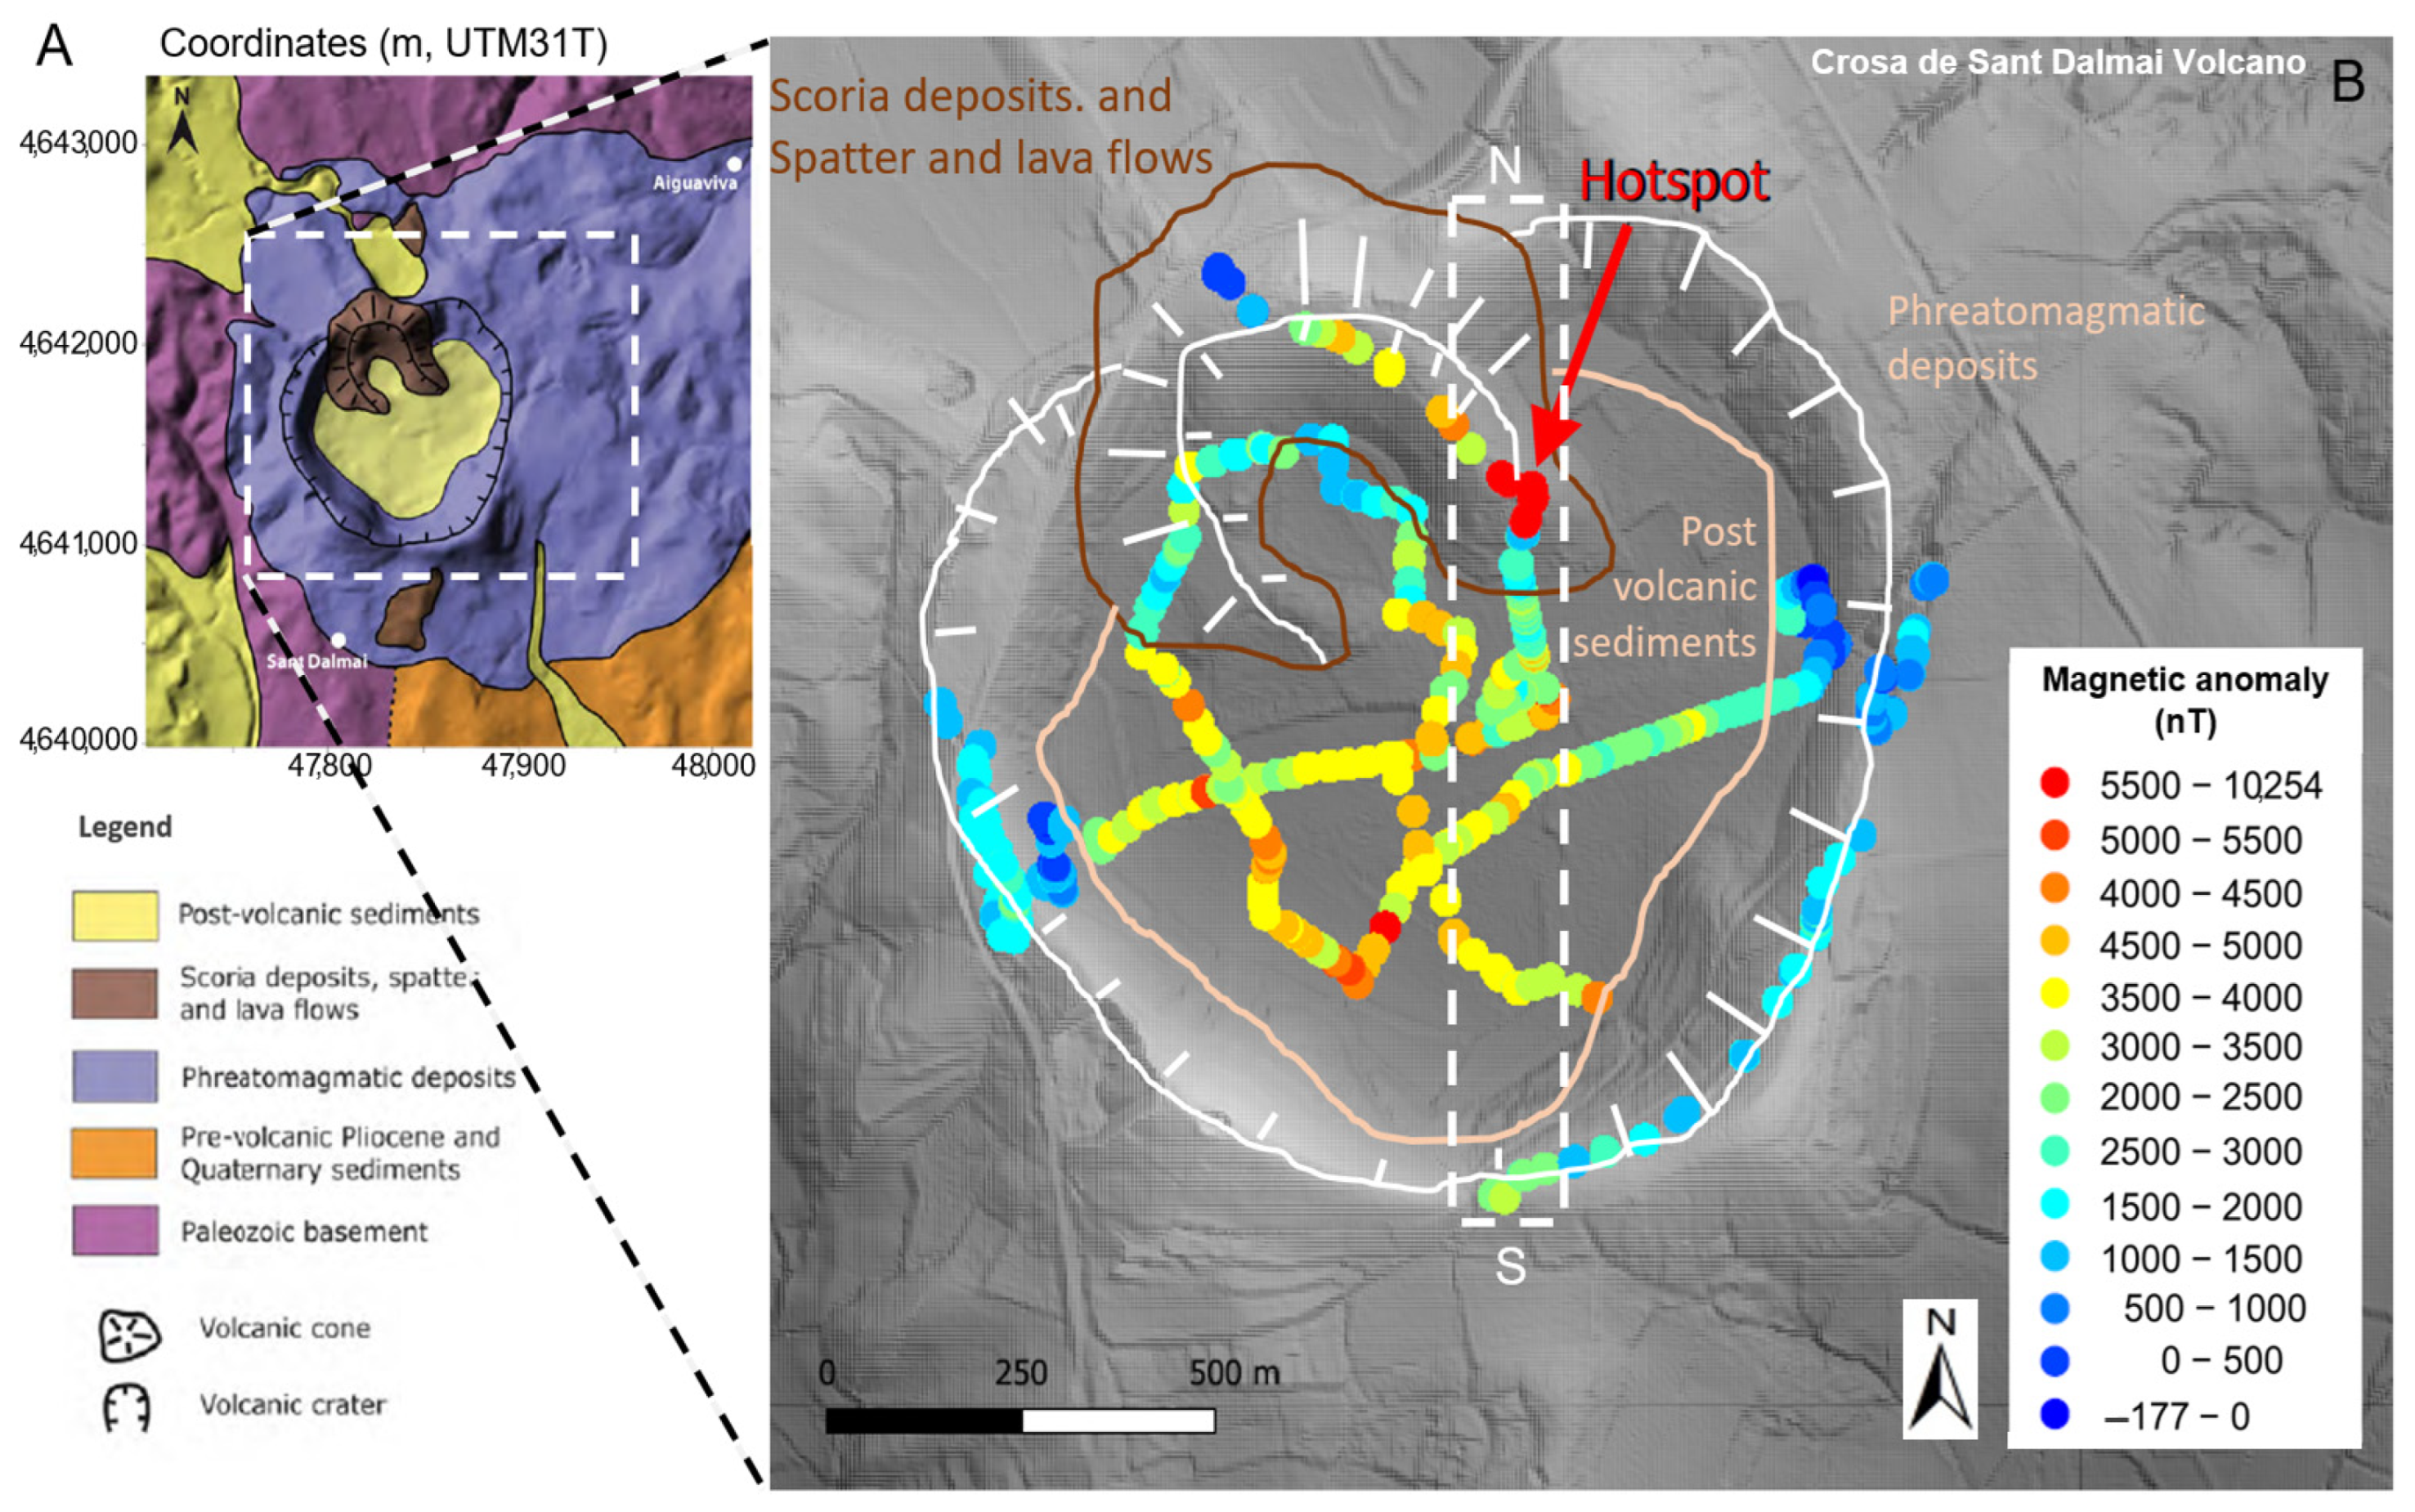
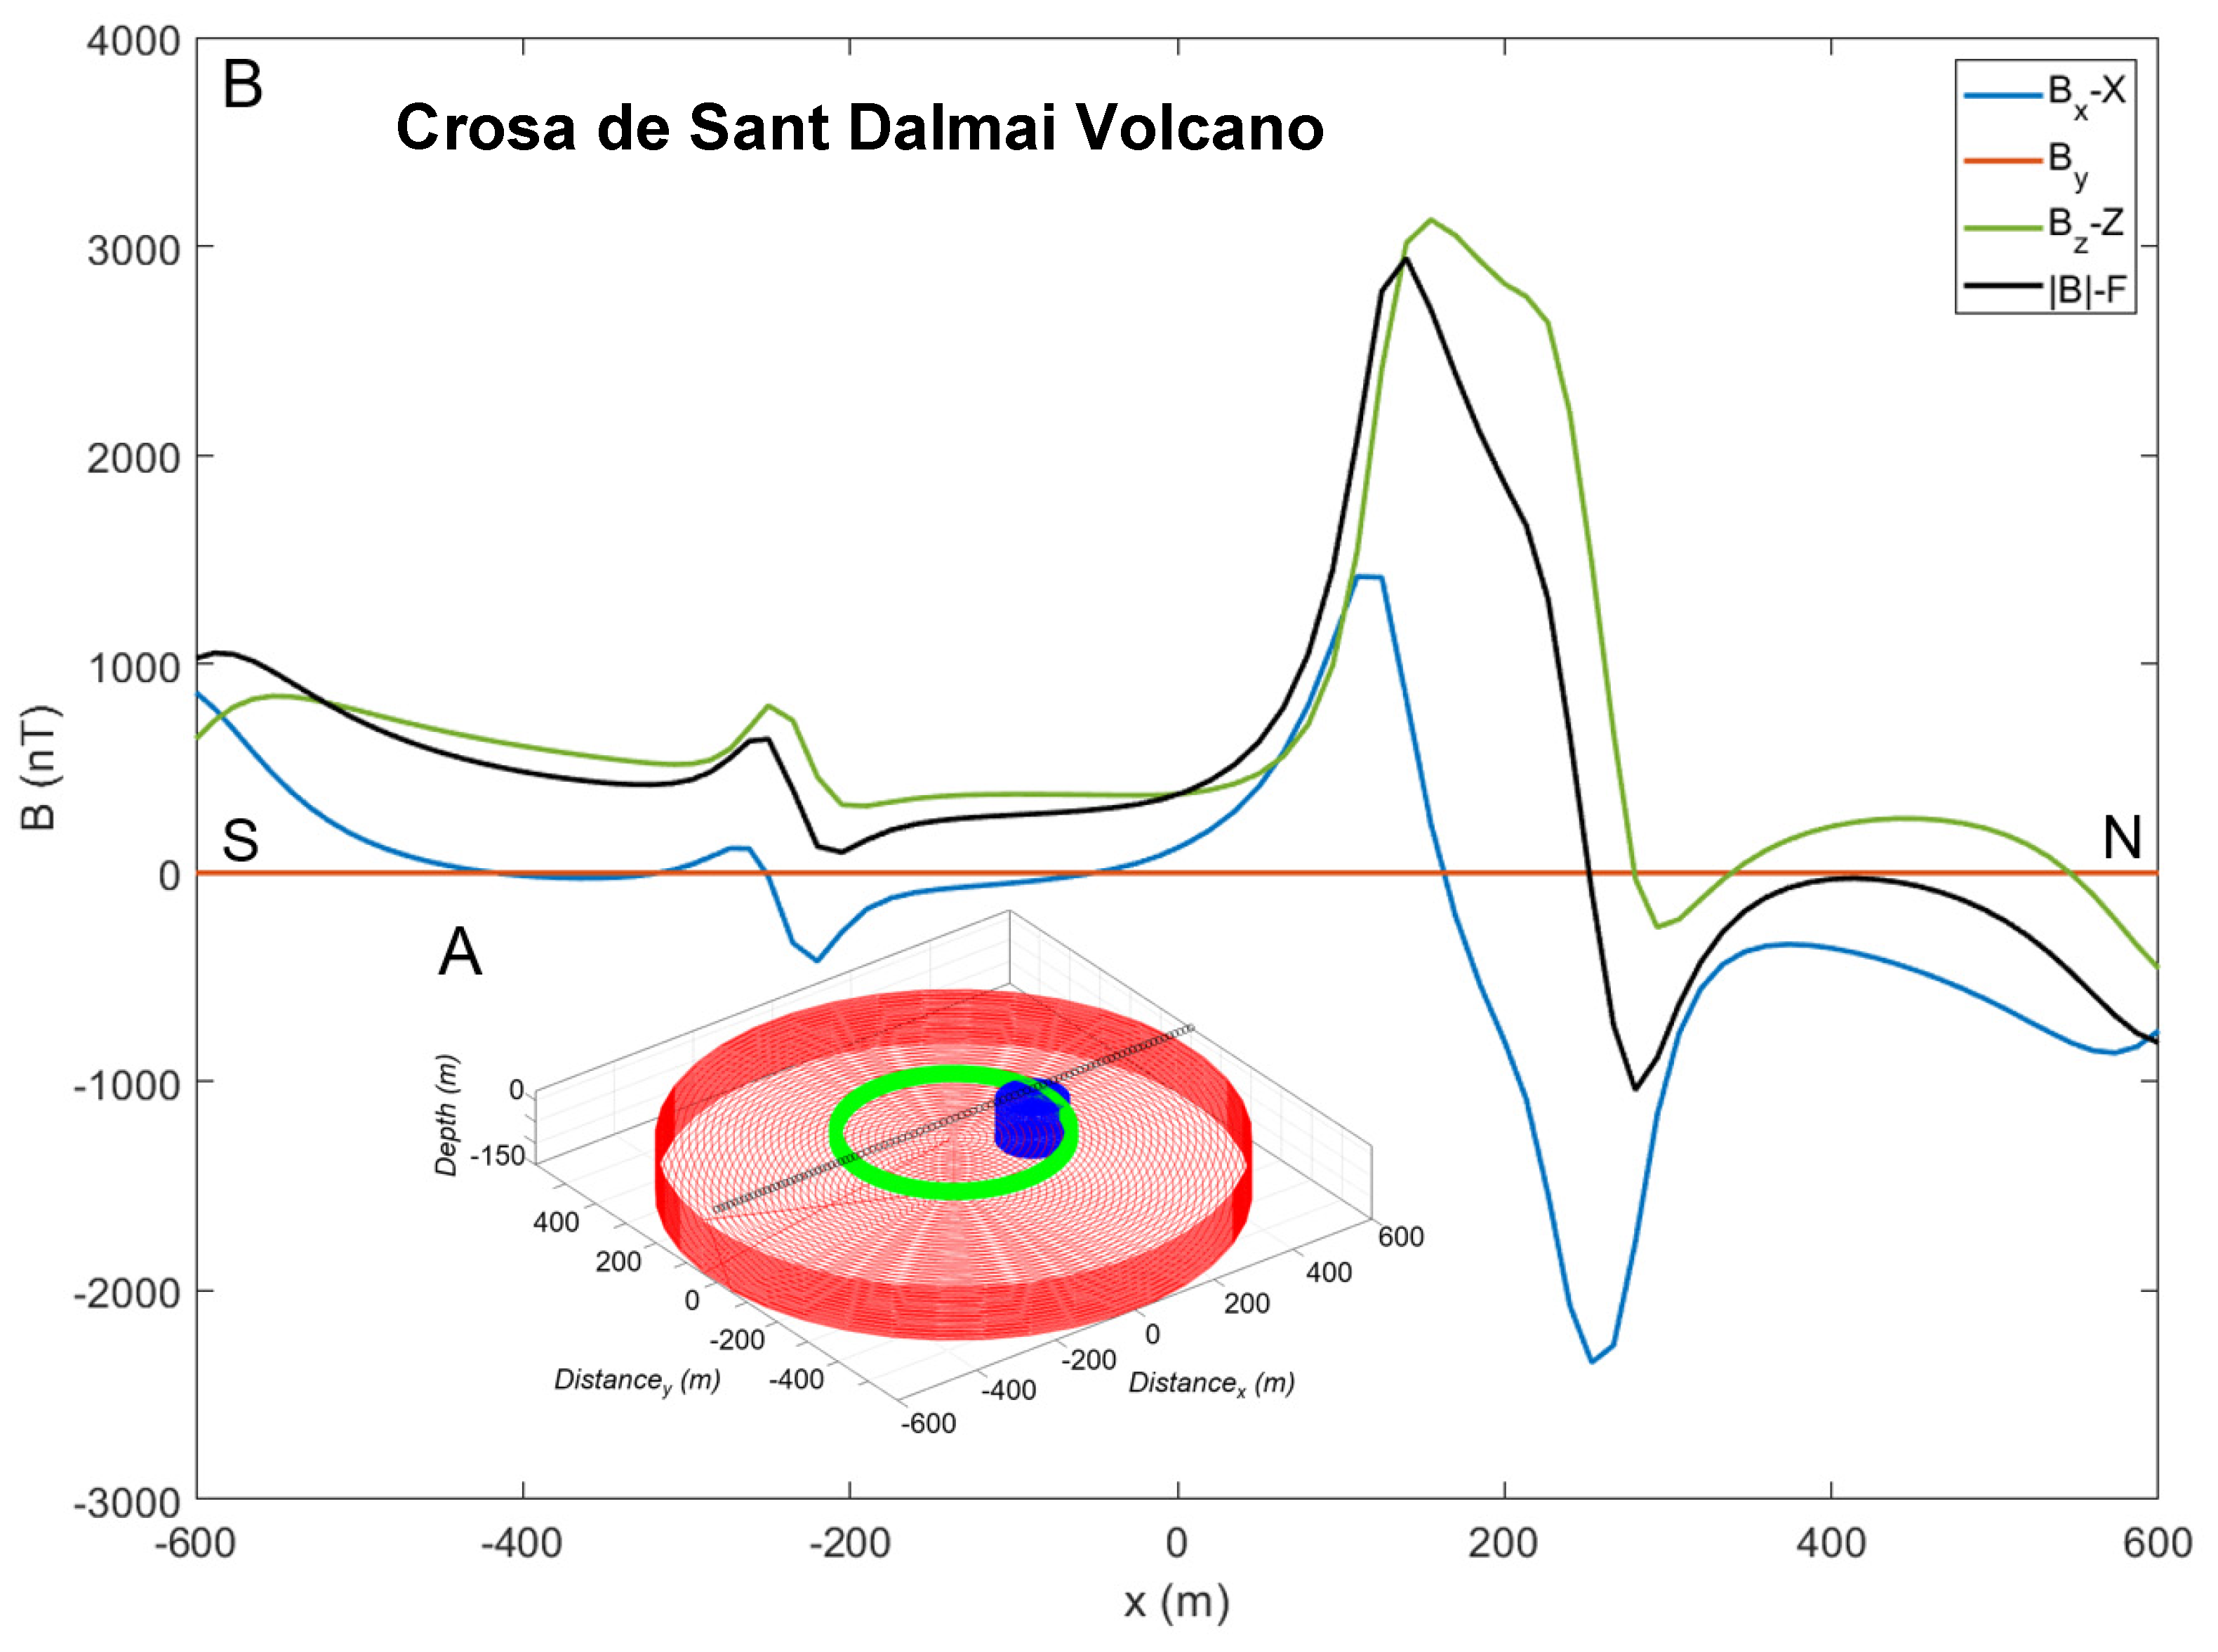
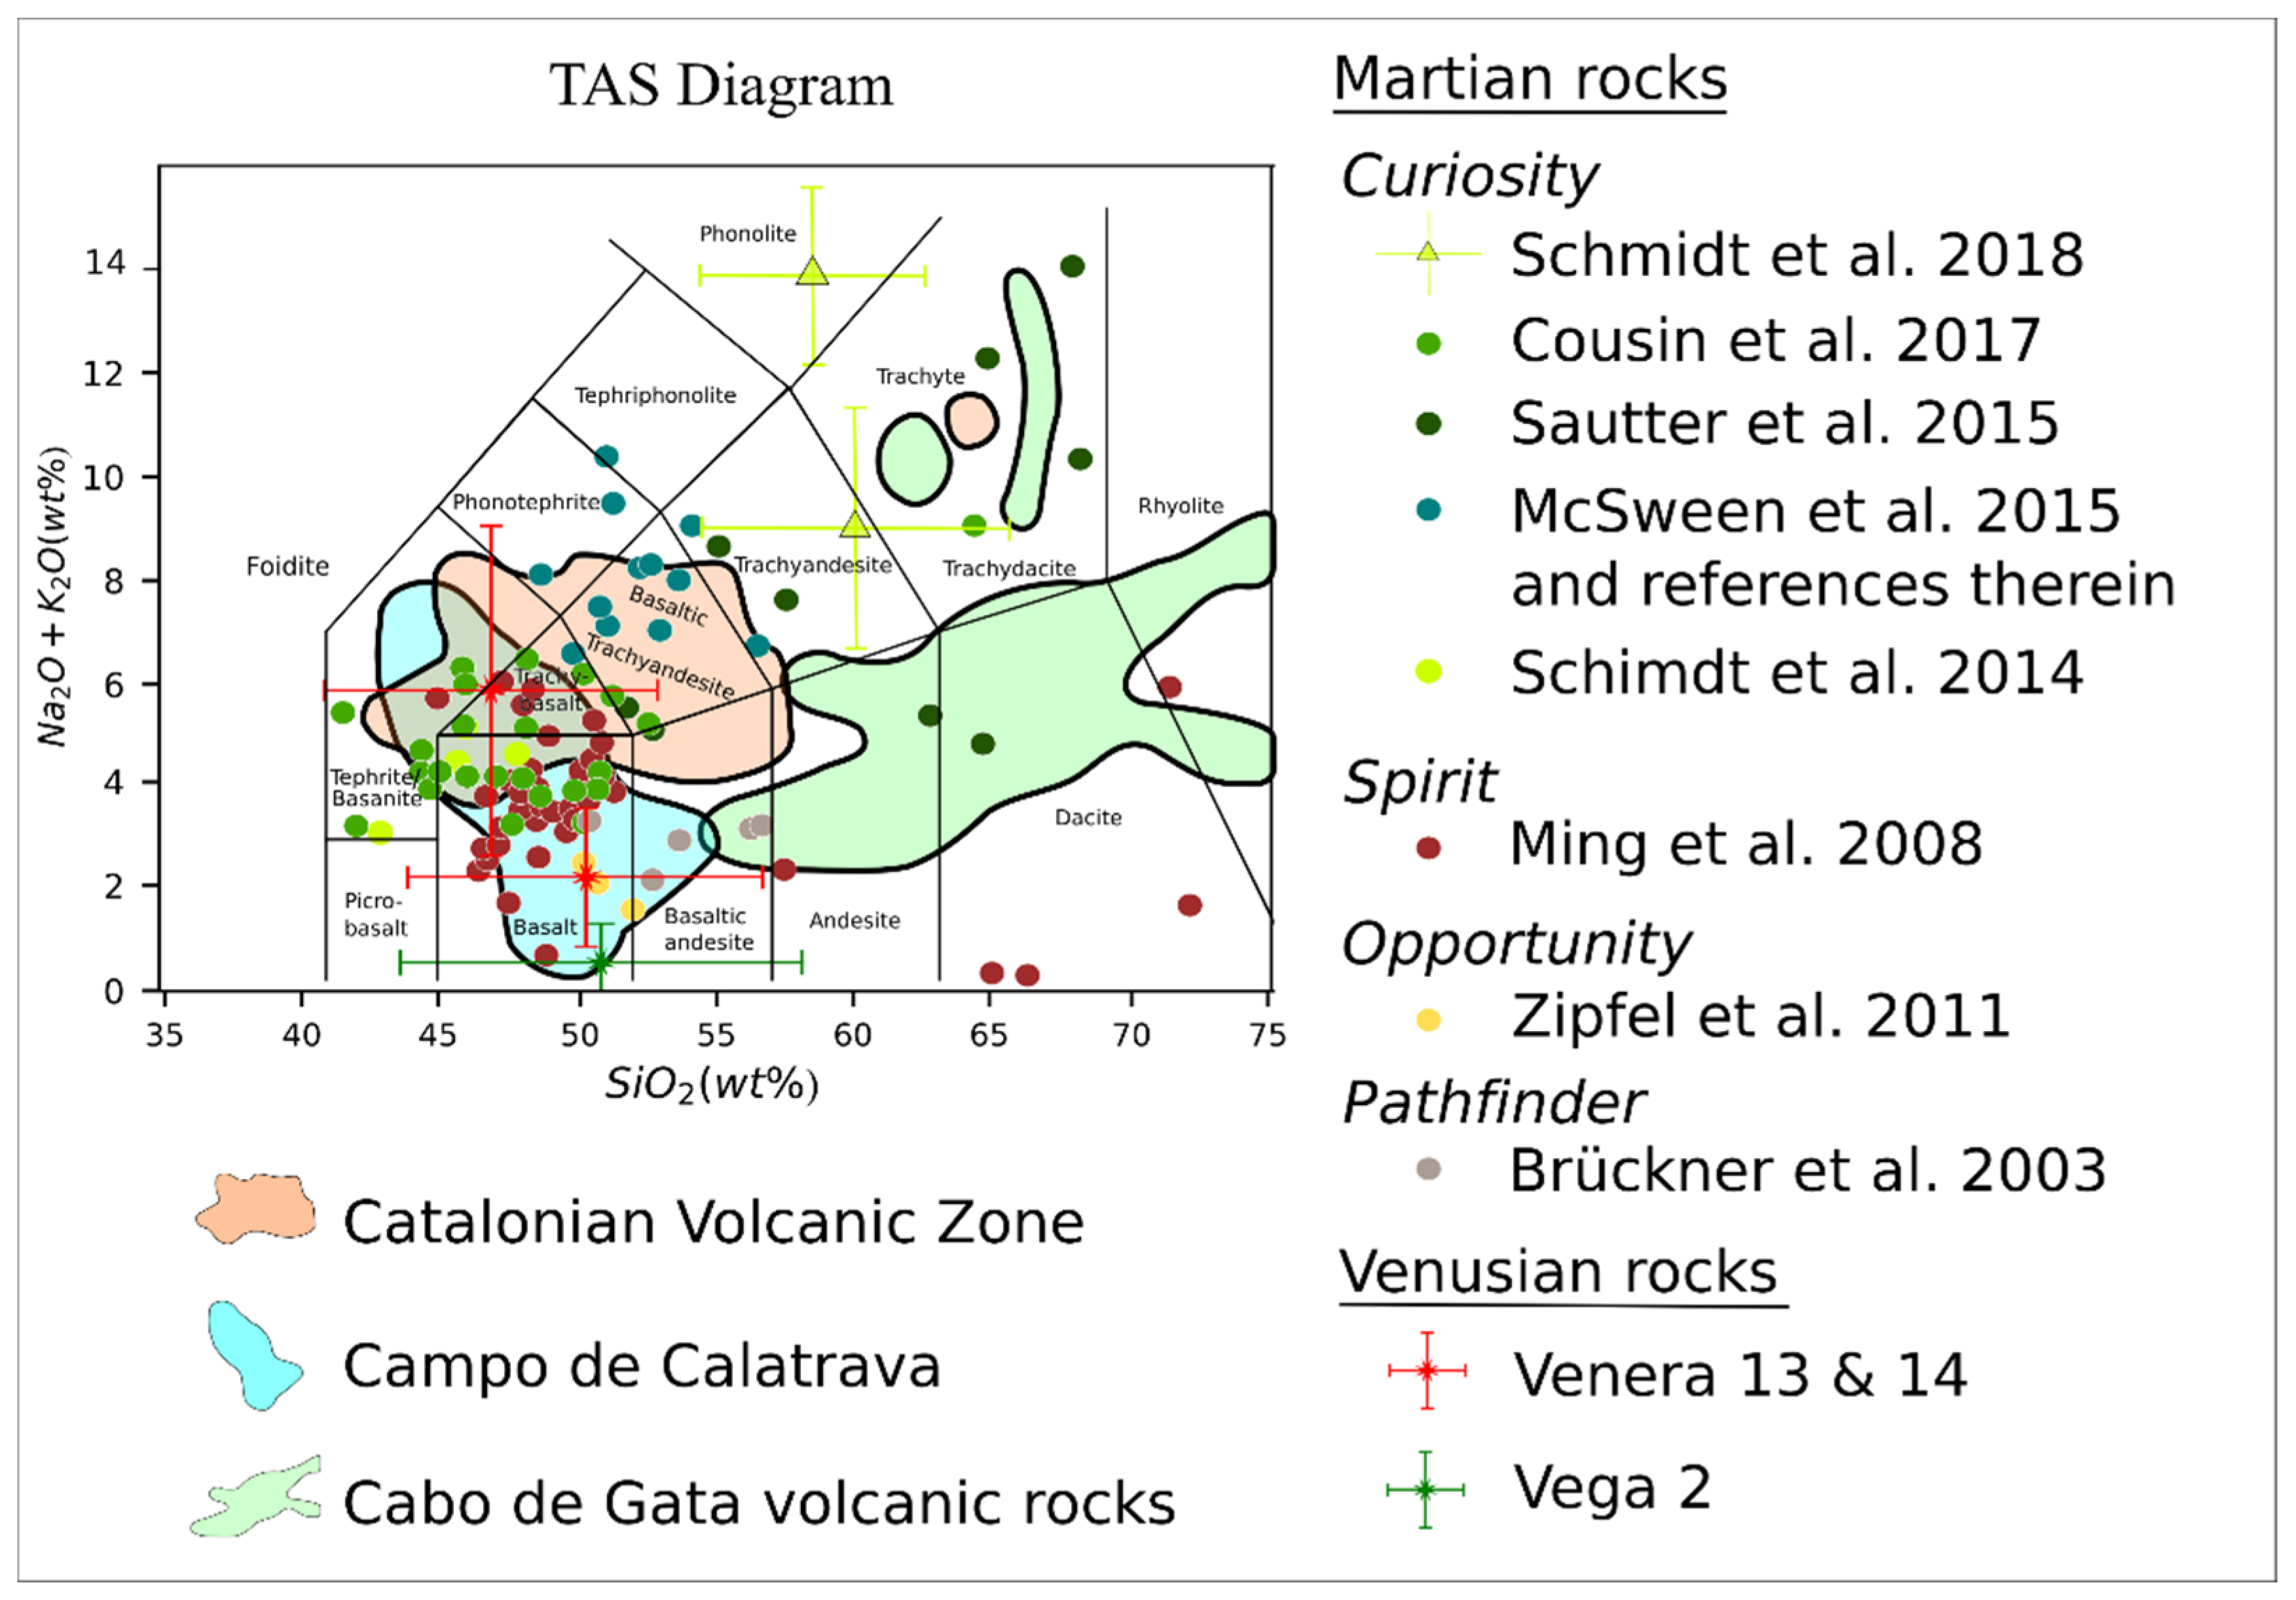
3.1. First Case Study: Catalonian Volcanic Zone

The origin of this volcanic zone is part of the European Cenozoic rift system [67].
The thinning of the crust caused graben structures, and magma could ascend through open fissures [61]. The zone comprises more than 50 well-preserved monogenetic cones, including scoria cones, tuff cones, tephra rings, and maars, and is divided into two volcanic regions: L’Empordà and La Garrotxa [78].
The activity of L’Empordà started over 12 Ma and extended to 6 Ma [78], and was followed by La Garrotxa Volcanism evidenced by basaltic outcrops being the most recent episode between 0.7 Ma to early Holocene [79,80]. It was characterized by pyroclastic deposits generated by strombolian and hydromagmatic processes [79].
In this region, two volcanoes with basanites and basaltic rocks [78] were investigated: the Pujalós and Crosa de Sant Dalmai volcanoes.
The Pujalós volcano is located 4 km from the city of Olot. The volcanic structure represents a monogenetic scoria cone built by a single strombolian phase, for which previous studies have generated electrical resistivity tomograms [81]. The measurement of the magnetic field was performed with the on-ground equipment through a track that extends from the NW to the SE flank, comprising the northern area of the volcanic structure.
The magnetic data, collected with the on-ground equipment, are represented in Figure 7.
From these data, a negative anomaly towards the NW and a positive anomaly in the SE sector can be observed.
The different conductive zones in depth were interpreted as an eruptive conduit and spatter in the NW associated with a high resistivity zone (>231,635 Ohm.m), which was extended towards the center of the structure with a zone of slightly lower resistivity [81].
Based on the magnetic signature, as well as on the previous and abovementioned studies, a simplified model was generated and is depicted in Figure 8A. The model consists of a cylindrical edifice with a radius of 140 m and a length of 150 m at a 75 m depth with respect to the surface. The cylinder has a susceptibility of χ = 10−2 SI and a remanent magnetization of (Mx, My, Mz) = (1, 0, 1.5) Am−1 according to the geomagnetic field in the area. In this case, a synthetic field along a south–north profile has been calculated. The calculation (Figure 8B) seems to be in good agreement with the results, though the correlation cannot be studied due to the lack of experimental data in such a direction.
The other site is the Crosa de Sant Dalmai maar. Due to the state of preservation of the edifice, the volcanic event seems to occur after the main activity in the region. At this site, previous studies [81] involving multiparametric geophysical surveys, as well as the extraction of two drill cores, were carried out to determine the structure of the maar–diatreme and the post-eruptive infill sequence of the crater. The structure has been described as a layer of phreatomagmatic deposits corresponding to a previous eruptive period, which built the volcanic crater, and a subsequent period in which the scoria deposits, spatter, and lava flows formed the volcanic cone. After this, the crater was filled with sediments.
In this work, we performed a magnetic survey with a grid that was denser than the previously available one [81], in which we identify a weak but extensive dipolar anomaly related to the lava flow as well as an intense dipole associated with the hotspot (Figure 9). We use the term “hotspot” to refer to a point where the value of the magnetic anomaly is especially intense.
Therefore, a magnetic model is proposed based on three elements (Figure 10A). Two of them correspond with the phreatomagmatic deposits of the ground floor and walls with a susceptibility of χ = 10−2 SI and a natural remanent magnetization of (Mx, My, Mz) = (2, 0, 3) A/m, and a cylinder of 600 m radius and 125 m length at a depth of 87.5 m and a circular corona of 225 and 275 of internal and external radii and 100 m length on top simulating the walls; a third element corresponds to the remainder of the hotspot, the magmatic material in the vent of the last episode, a cylinder of 75 m radius and 100 m length at a depth of 50 m from the surface with a susceptibility of χ = 10−2 SI, and a natural remanent magnetization of (Mx, My, Mz) = (4, 0, 6) A/m.
The magnetic field was calculated along a diameter transect along the center of the different elements, giving rise to the results shown in Figure 10B at both sides of the crater. The magnetic anomaly represented as |B|-F (F is the modulus of the geomagnetic field in the area) shows a former, fairly weak positive anomaly in the south of the crater, with a ripple corresponding to the crater walls. Towards the north, the element representing the cone yields a more intense positive anomaly that turns negative in the outer part of the crater.
The shape and intensity of the graph is in very good correlation with the measurements, mostly in the northern part, since in the south, the data are less dense.

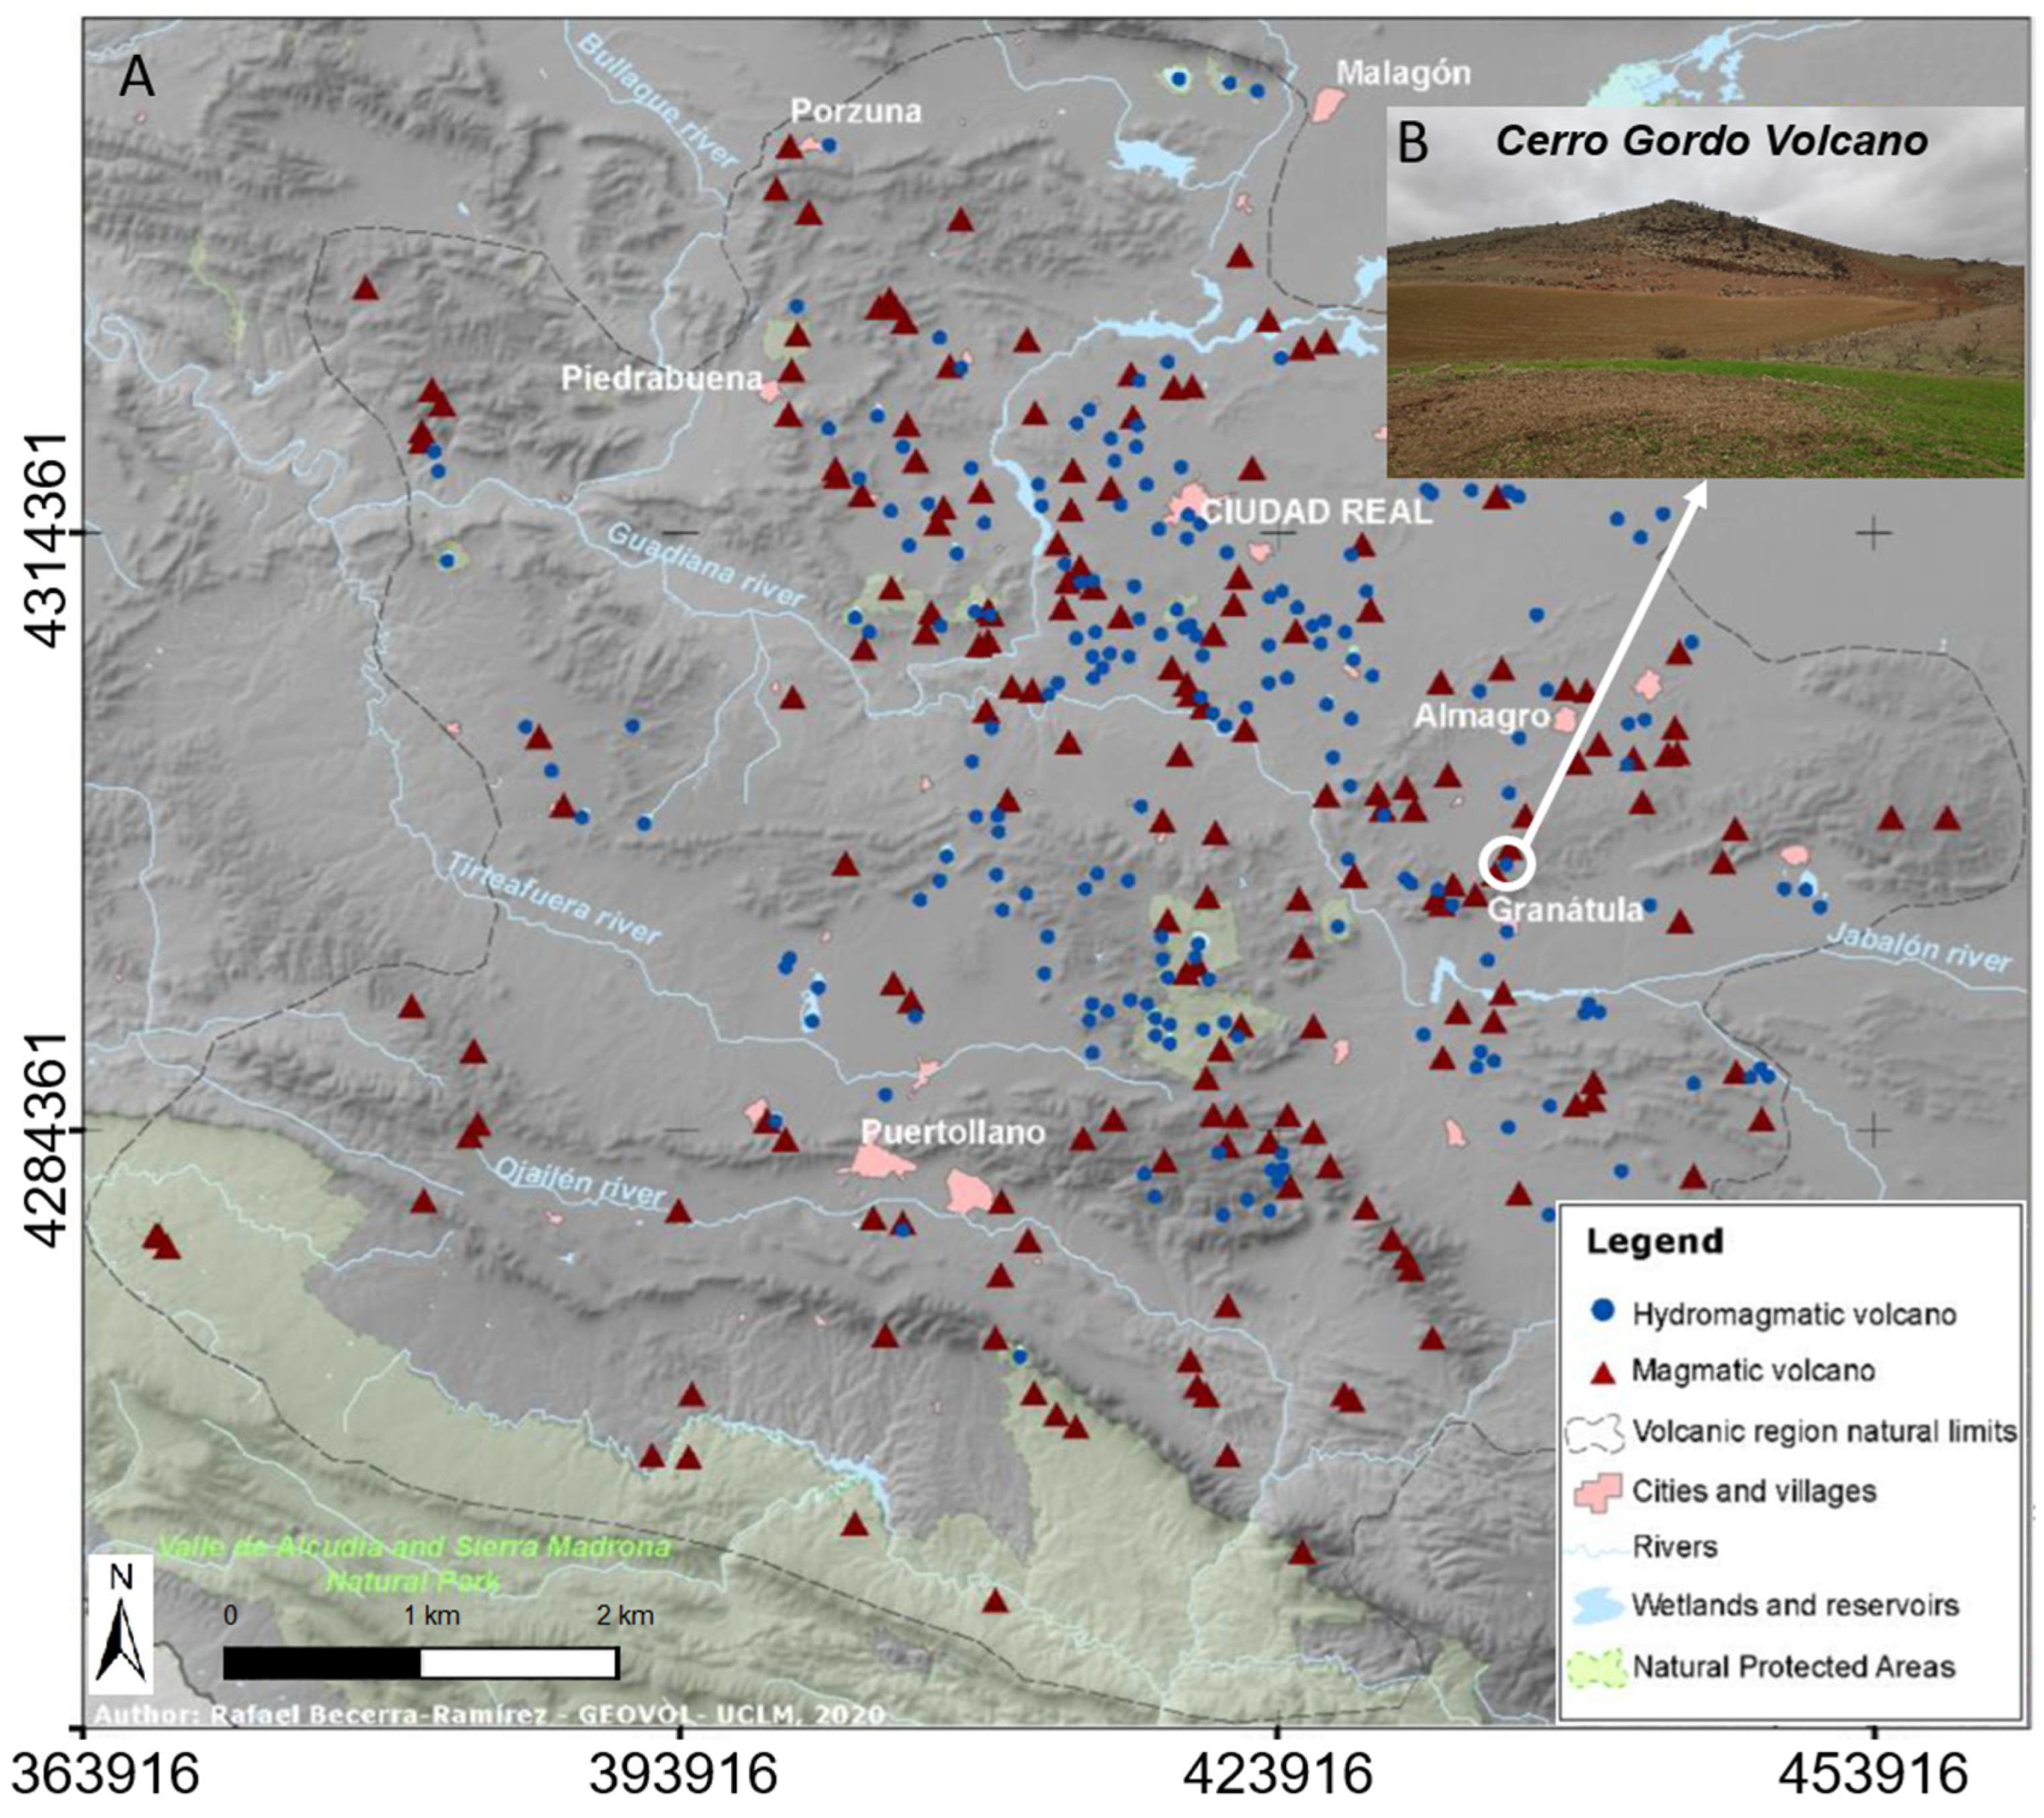
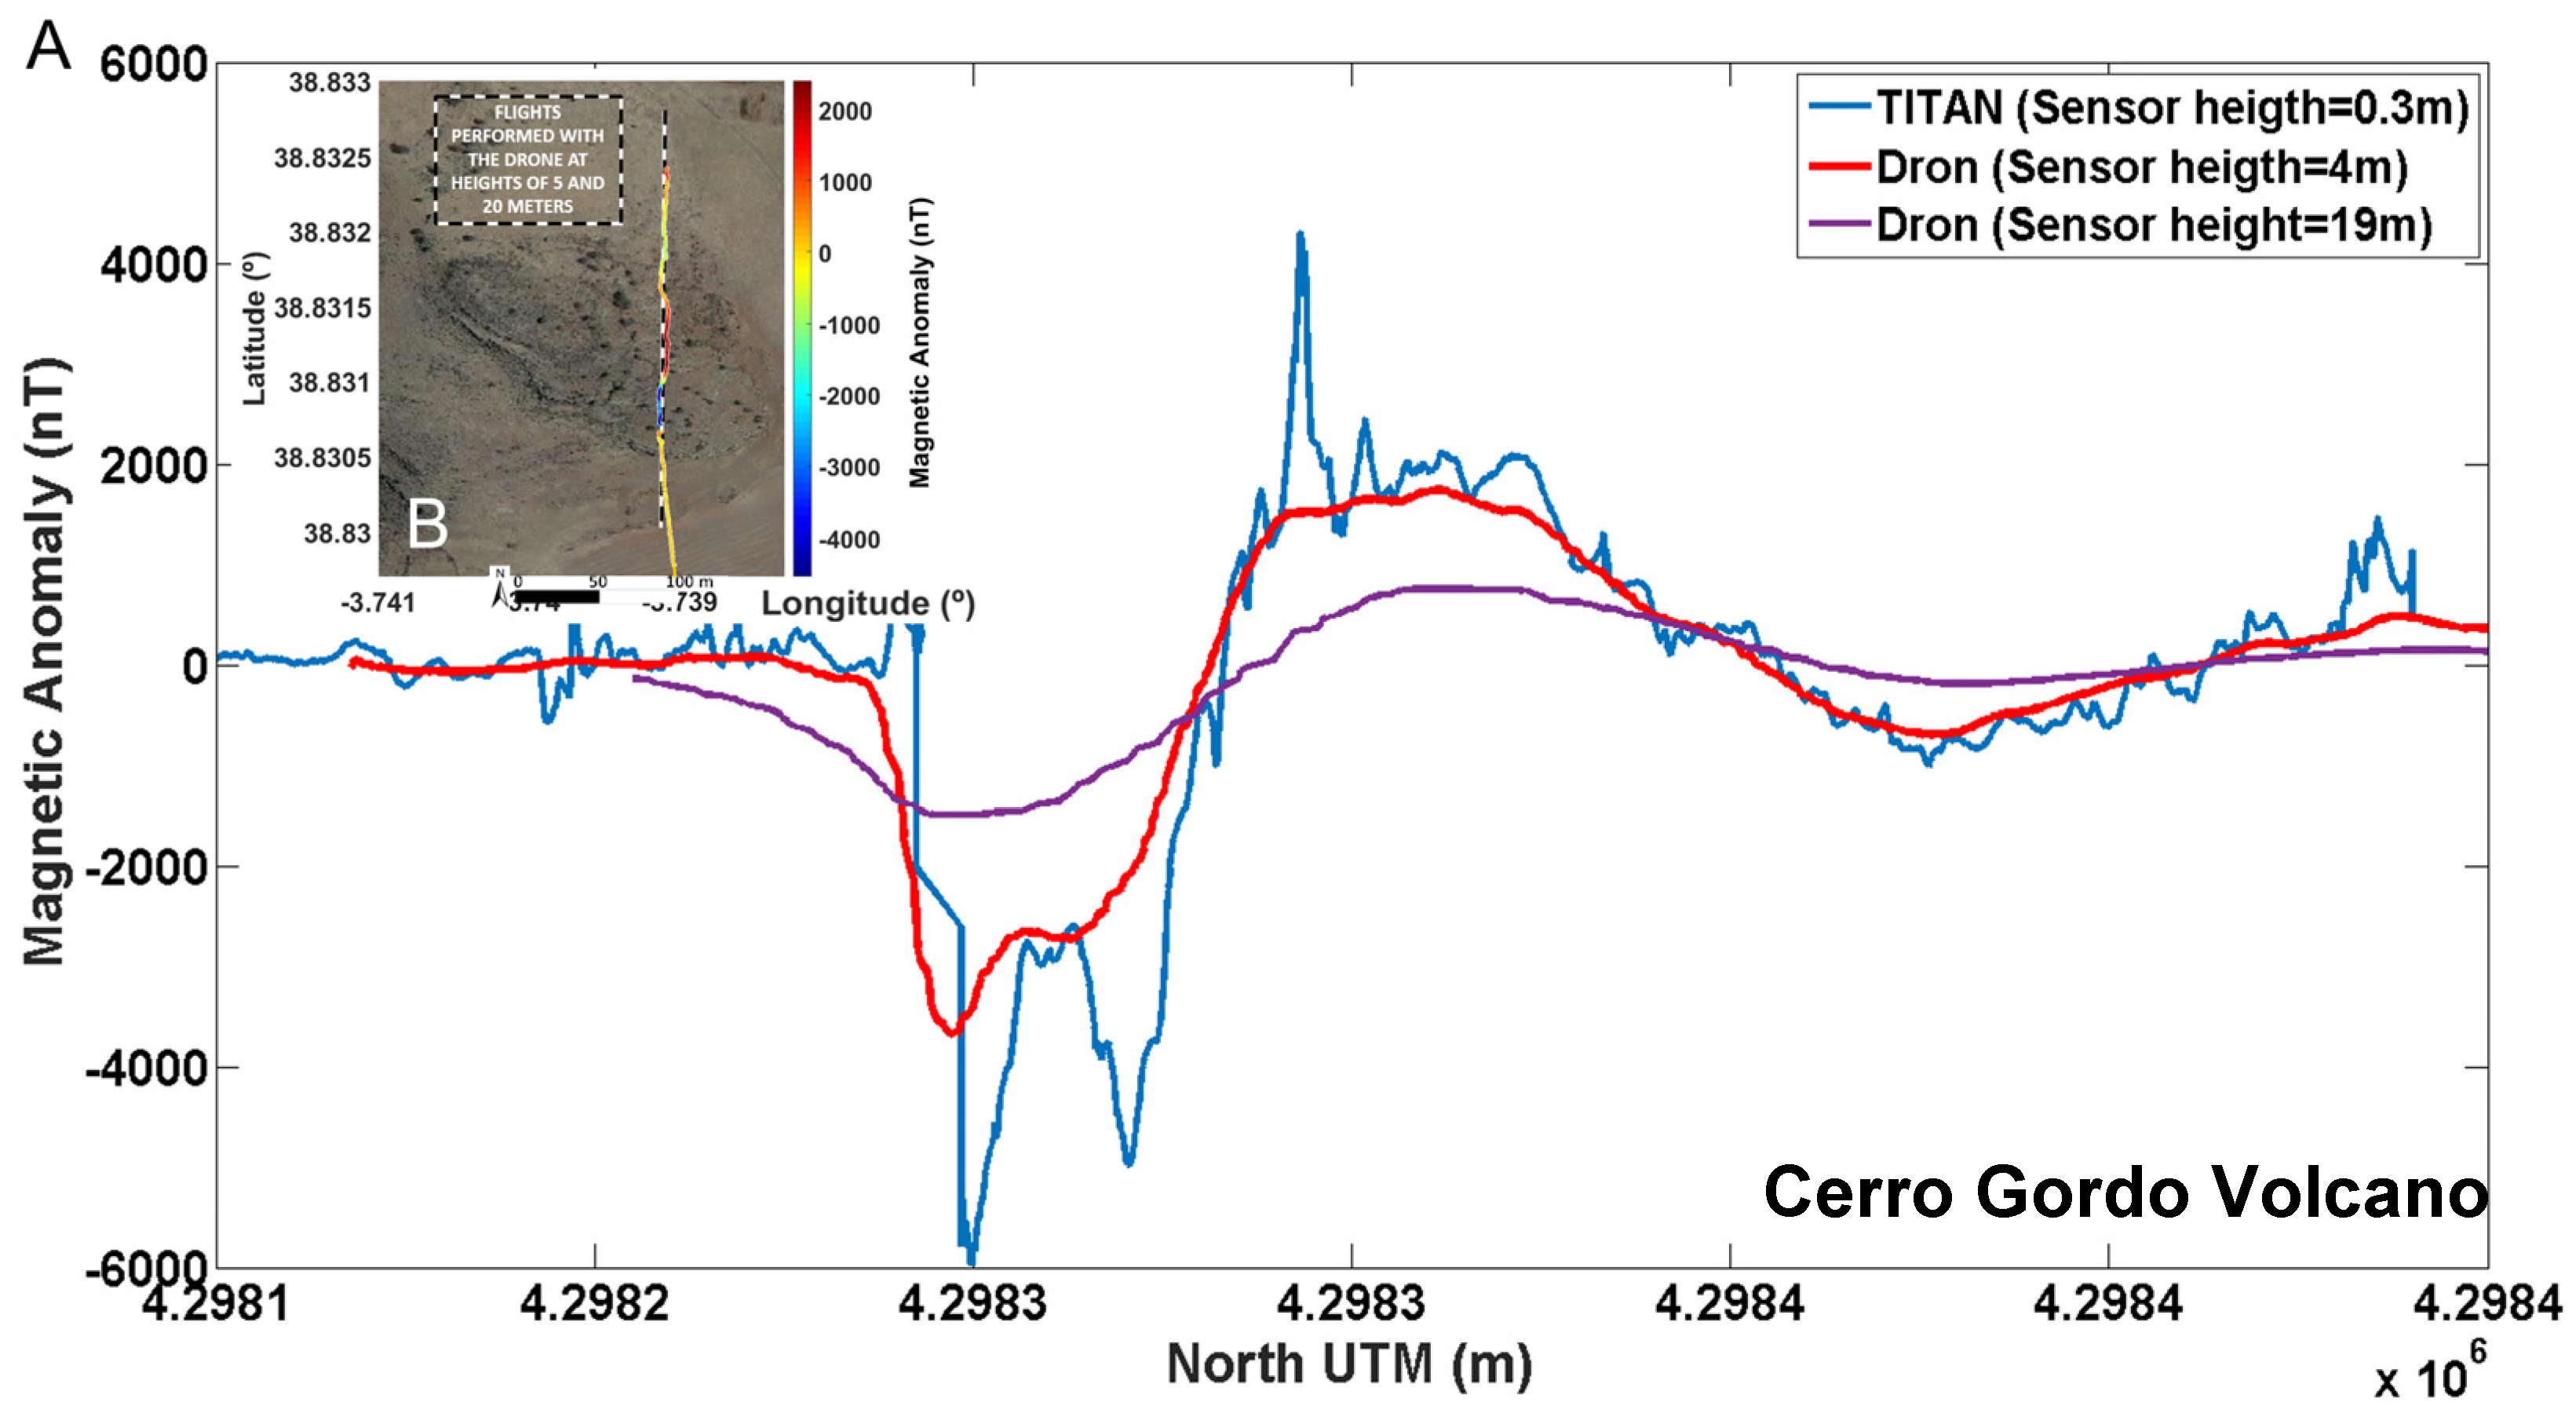
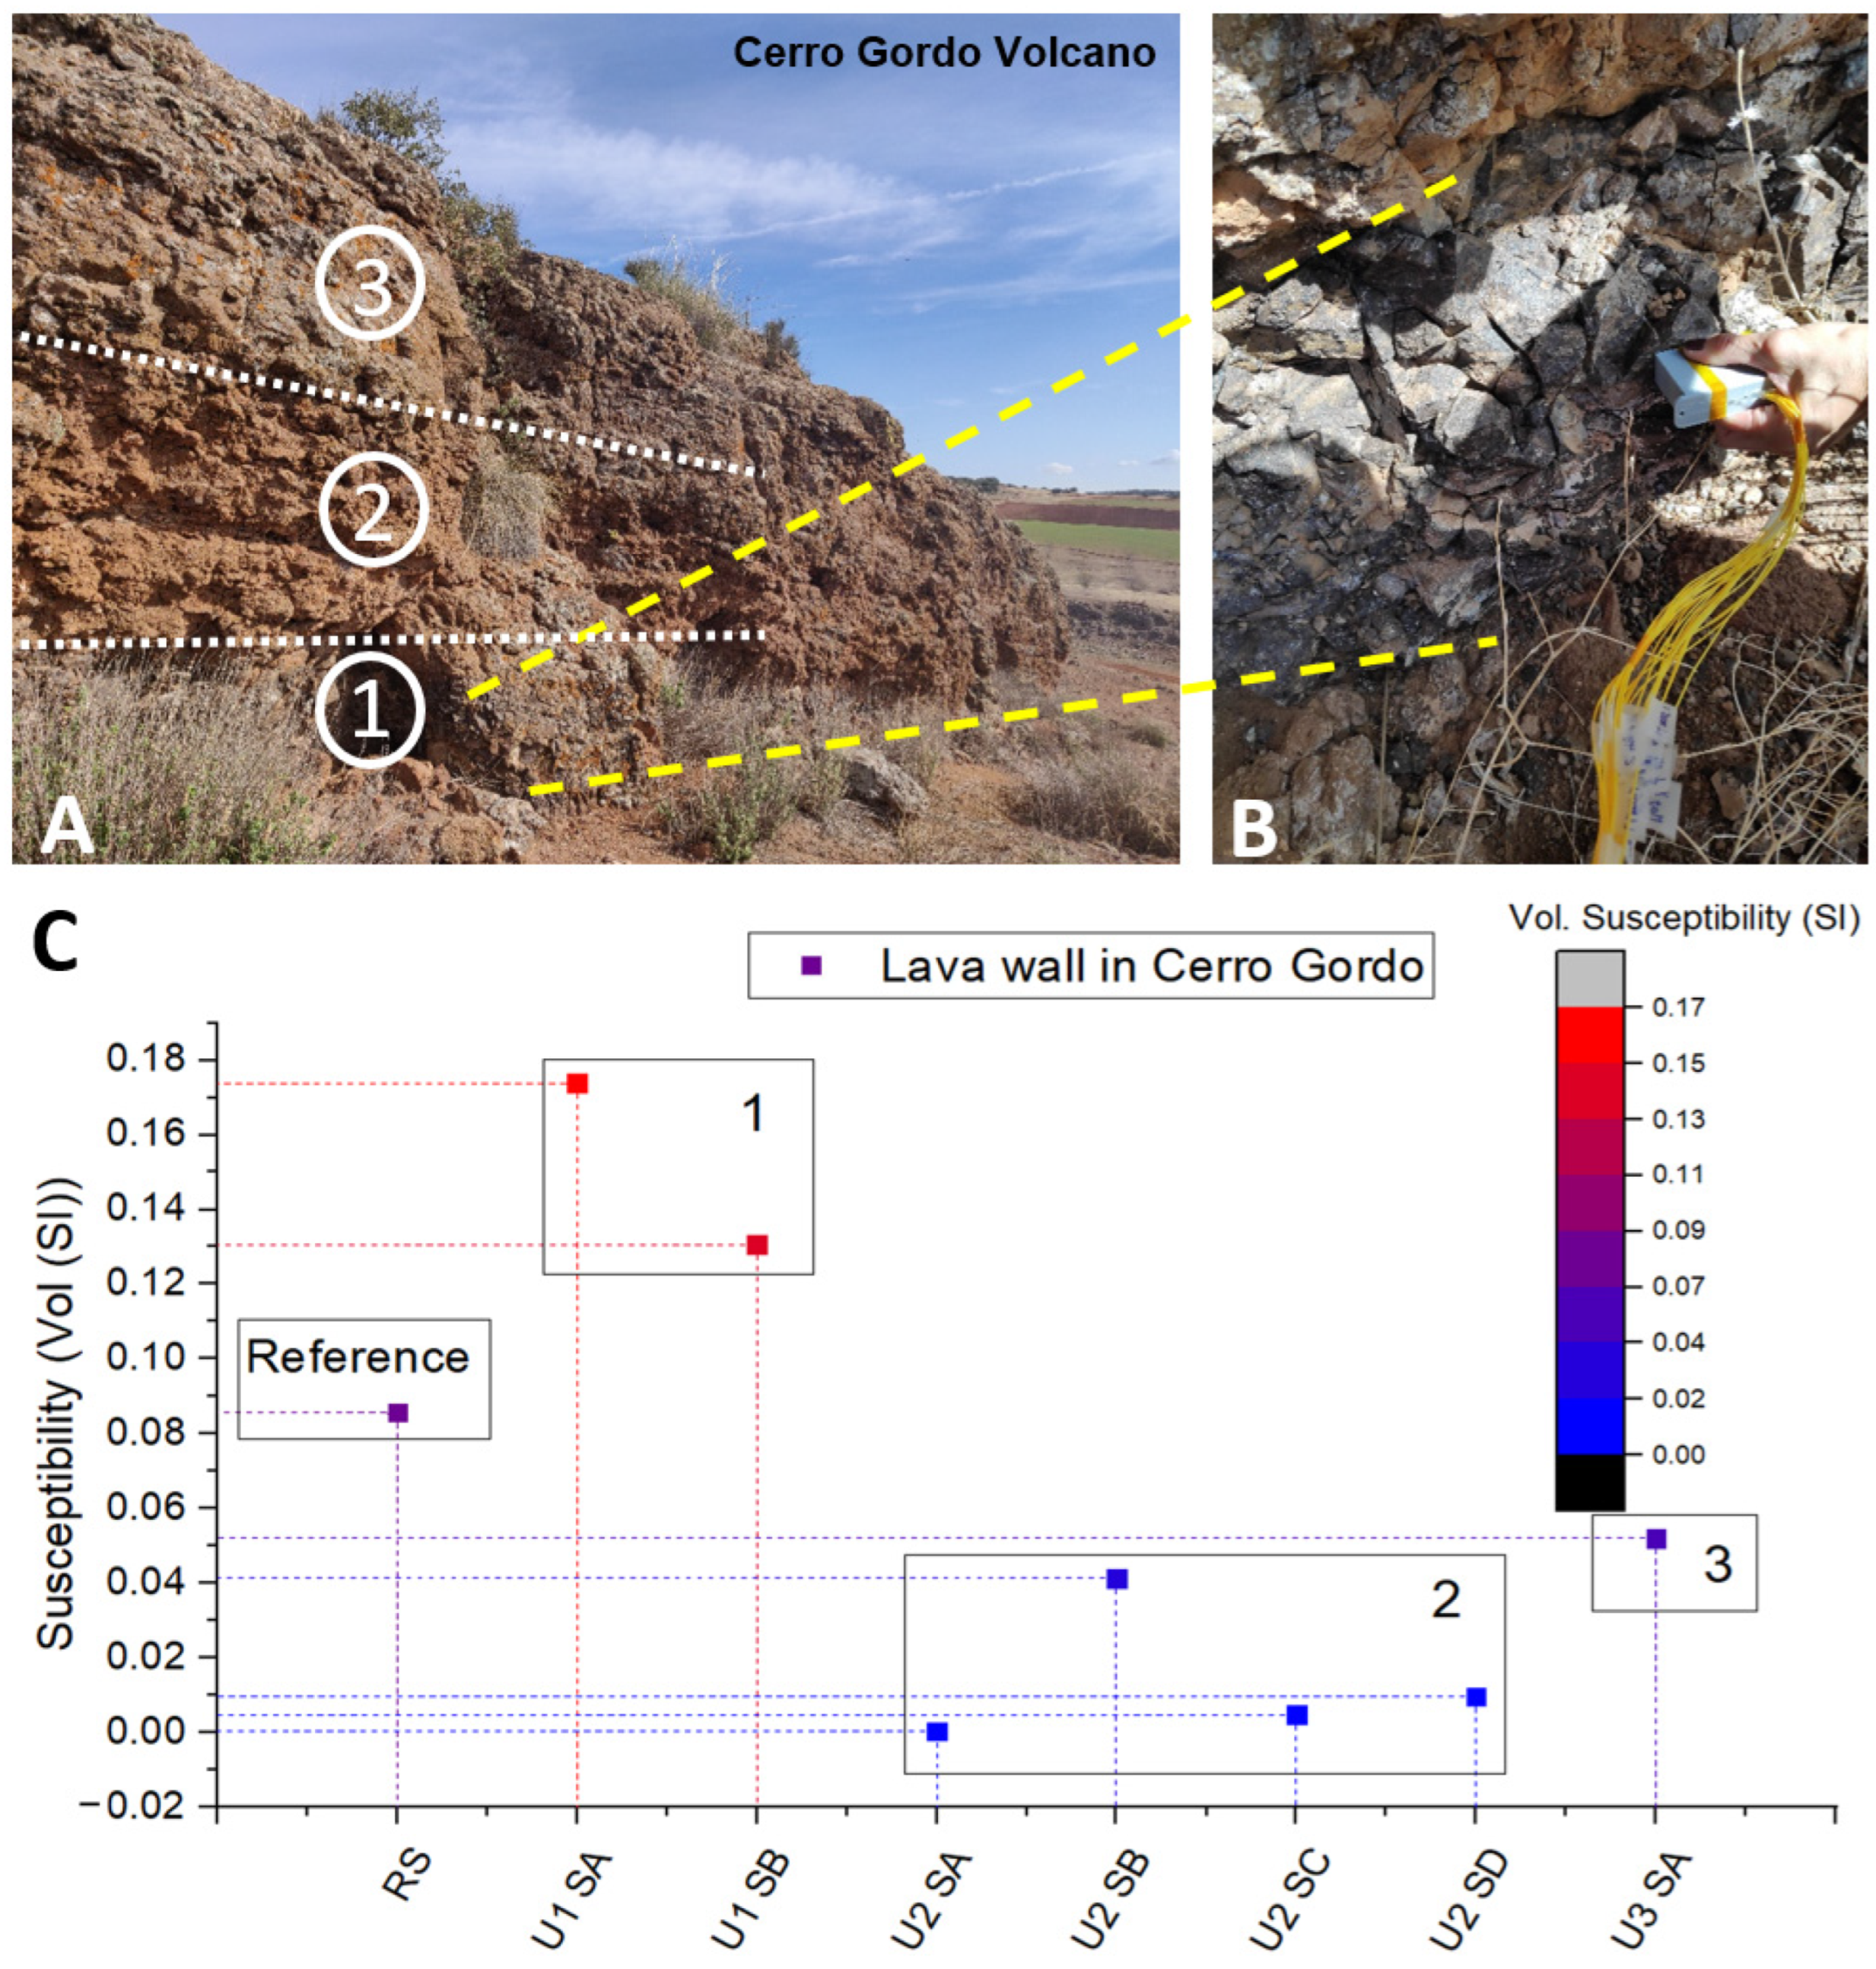
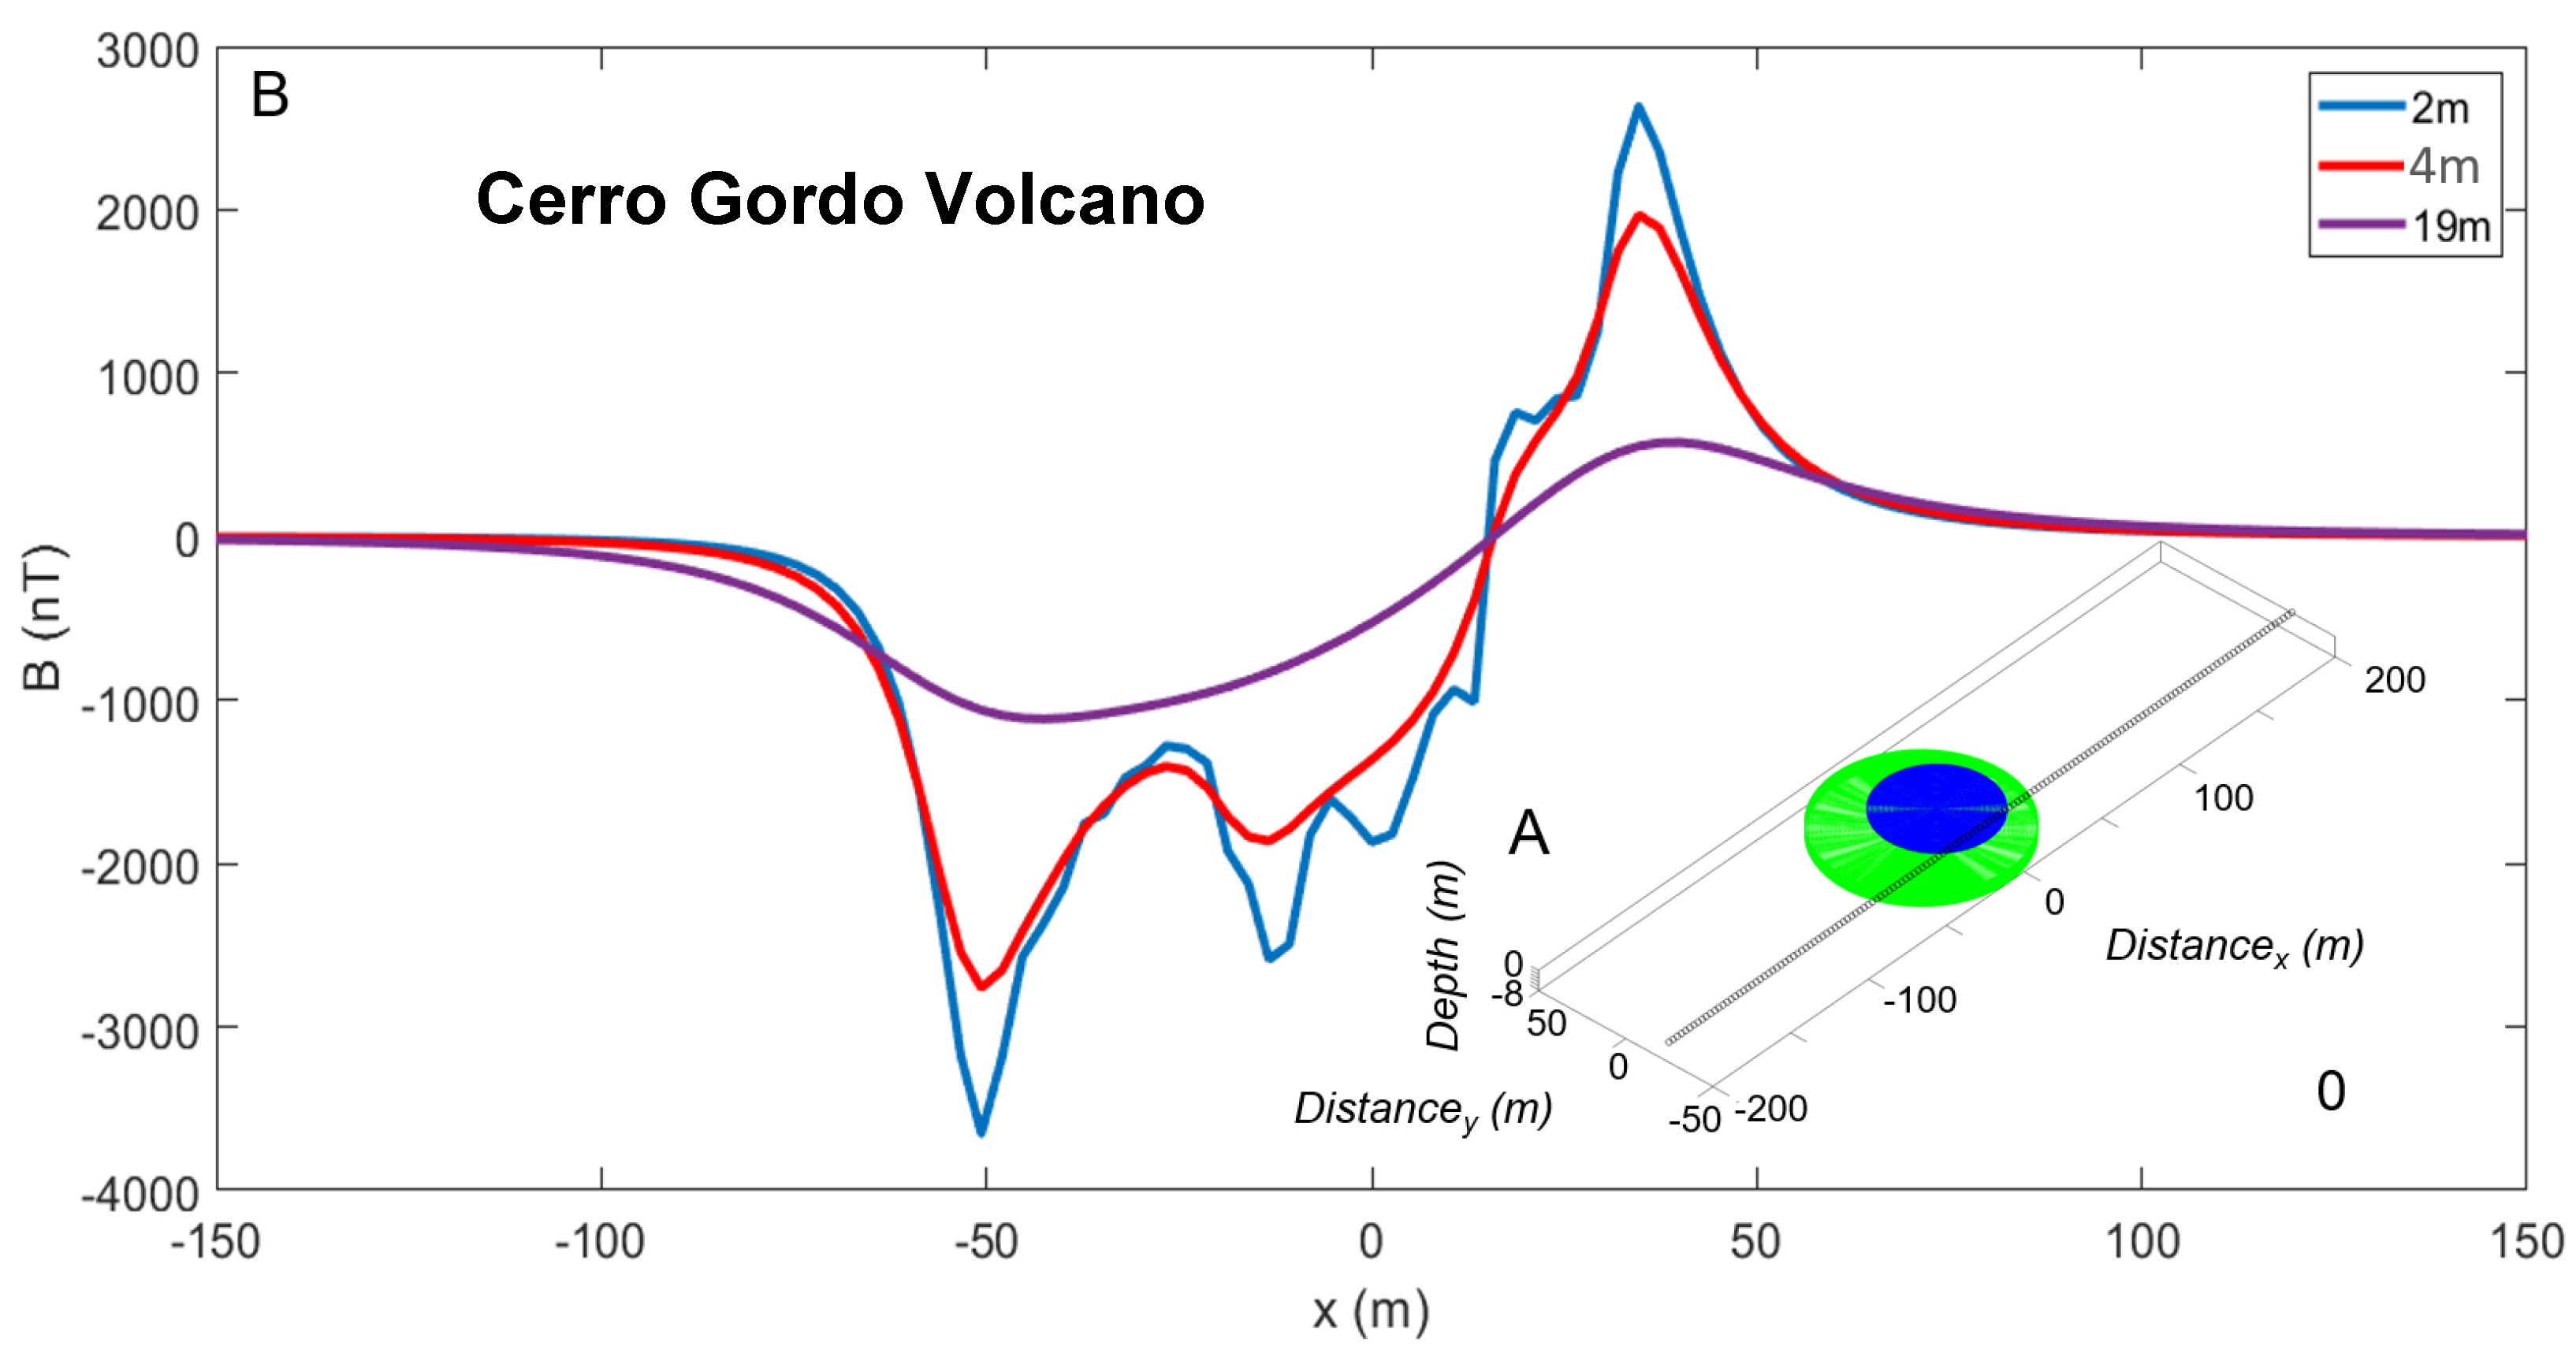
3.2. Second Case Study: Cerro Gordo Volcano in Campo de Calatrava Volcanic Province

The Campo de Calatrava Volcanic Province is a continental area of 5000 km2 with more than 360 volcanoes. The rocks span a range from basanites to basalts with SiO2 contents between 42 and 55%, comprising effusive and explosive phases that combine Strombolian and phreatomagmatic episodes (Figure 11A). The intraplate volcanism started in the Upper Miocene (8.7–6.4 Ma) and extended to the Pliocene–Quaternary (4.7 Ma–5520 yr approximately) [83].
The Cerro Gordo volcano (Figure 11B) is characterized by explosive eruptions and, to a minor extent, effusive eruptions. This volcano has been used for the exhaustive validation of the methodology; therefore, partial results have already been published in [62].
The magnetic signature of the spatter deposit stands out over the global signature of the edifice [62] with an inverted signature with respect to the present geomagnetic field and with an intensity in the order of 1000 nT at 19 m; 3000 nT at 4 m; and up to 6000 nT at ground level (Figure 12A,B).
The eruption that generated the spatter deposit occurred in the late stage of Campo de Calatrava volcanism, i.e., in the Pliocene–Pleistocene transition [62]. During this transition, there was a long period of time with inverted geomagnetic declination.
In this work, we present the application of the methodology to the study of a spatter deposit.
The investigation consisted of a magnetic survey along the transect indicated in Figure 12, using both onboard drones (at 19 and 4 m from the surface) and on-ground, despite the roughness of the terrain. Additionally, in situ susceptibility measurements were conducted with the portable and compact novel NEWTON instrument in an exposed wall of the spatter deposit; laboratory measurements of the natural remanent magnetization (NRM) were performed on the collected samples.
The exposed wall is depicted in Figure 13A. Three different layers can be distinguished: a bottom layer of clastogenic lava, spatter clasts and compacted scoria [83]. The real susceptibility (χ) measurements, performed with the NEWTON instrument (Figure 13B), reflect an important contrast of the three exposed layers: 17·10−2 SI for the clastogenic lava and 5·10−2 SI for the spatter clasts, whereas the scoria shows a much lower susceptibility in the order of χ = 1·10−2 SI. The graph in Figure 13C shows the susceptibility values in the SI in comparison with the reference sample (RS), which is an epoxy matrix with 10% wt. of ferrite powder embedded and spread homogeneously over the volume of the sample.
The NRM of several samples ranges from 5 up to 40 Am−1.
Based on the surveys as well as the susceptibility and remanence data, a model is constructed with cylinders in three layers (Figure 14A) with a net magnetization opposing the geomagnetic field: M = NRM-χH, where H is the geomagnetic field in A m−1 (Figure 14B), which matches fairly well in shape and intensity at all heights with the experimental data.

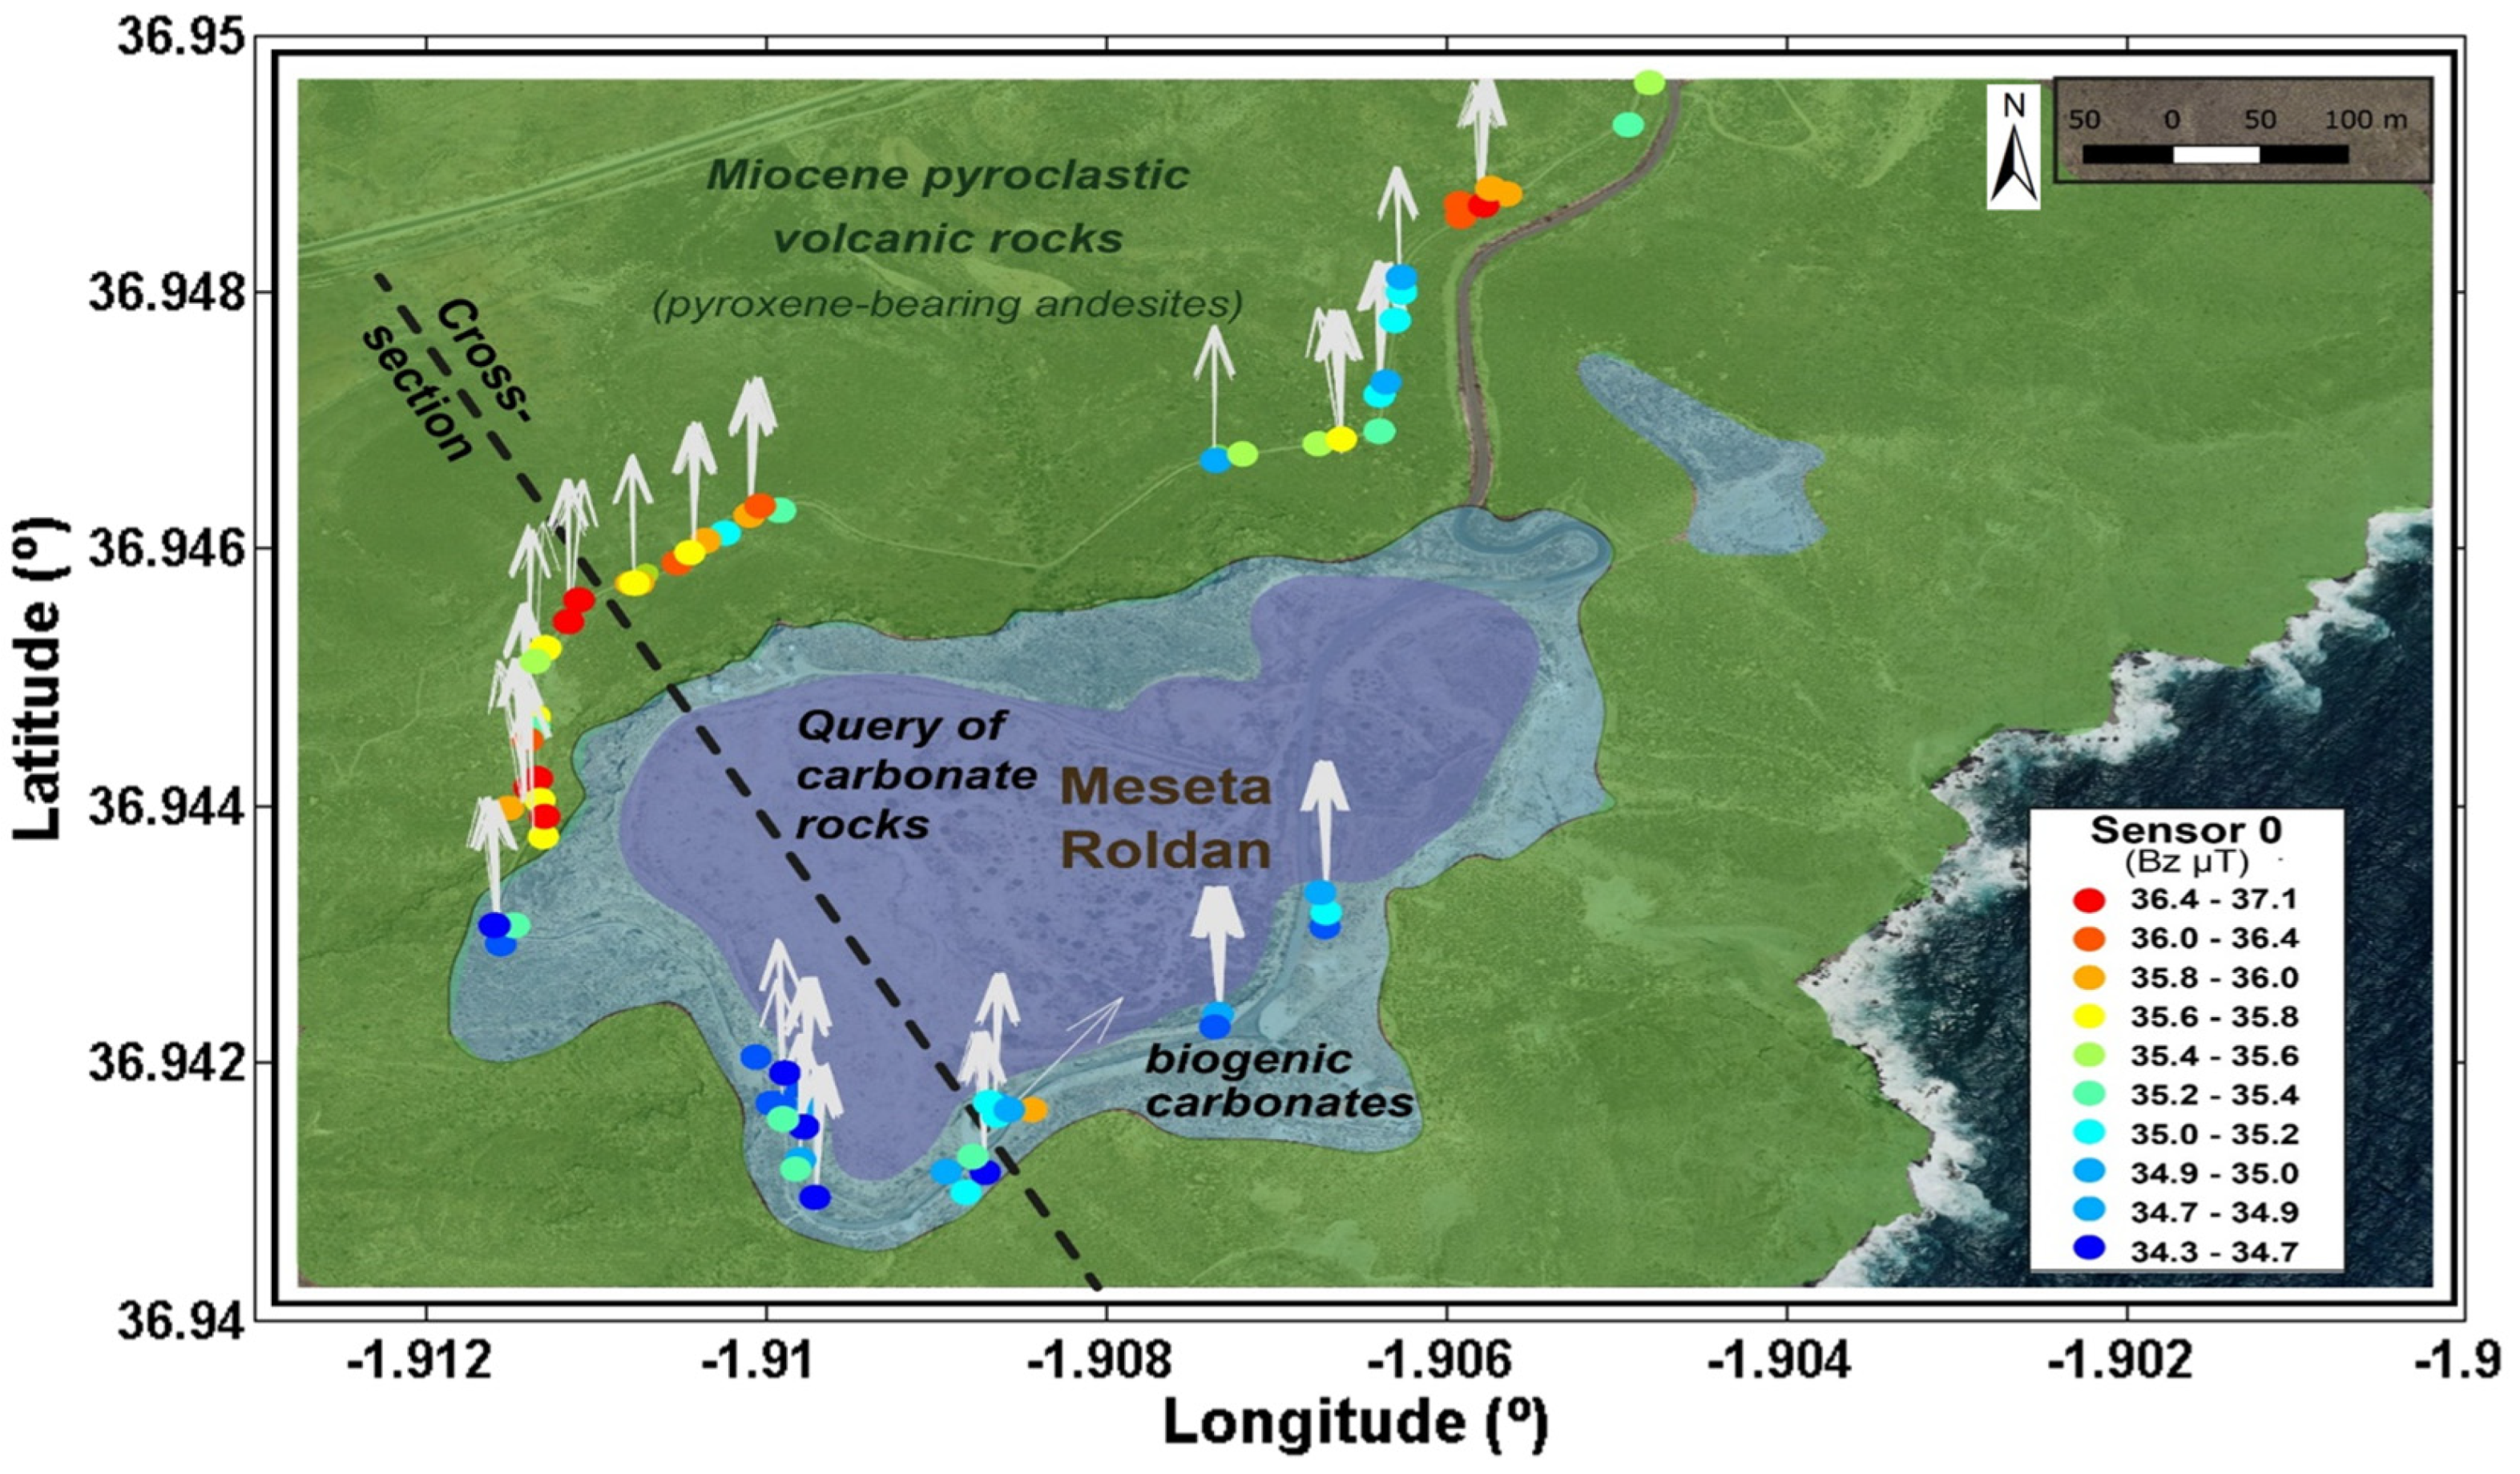
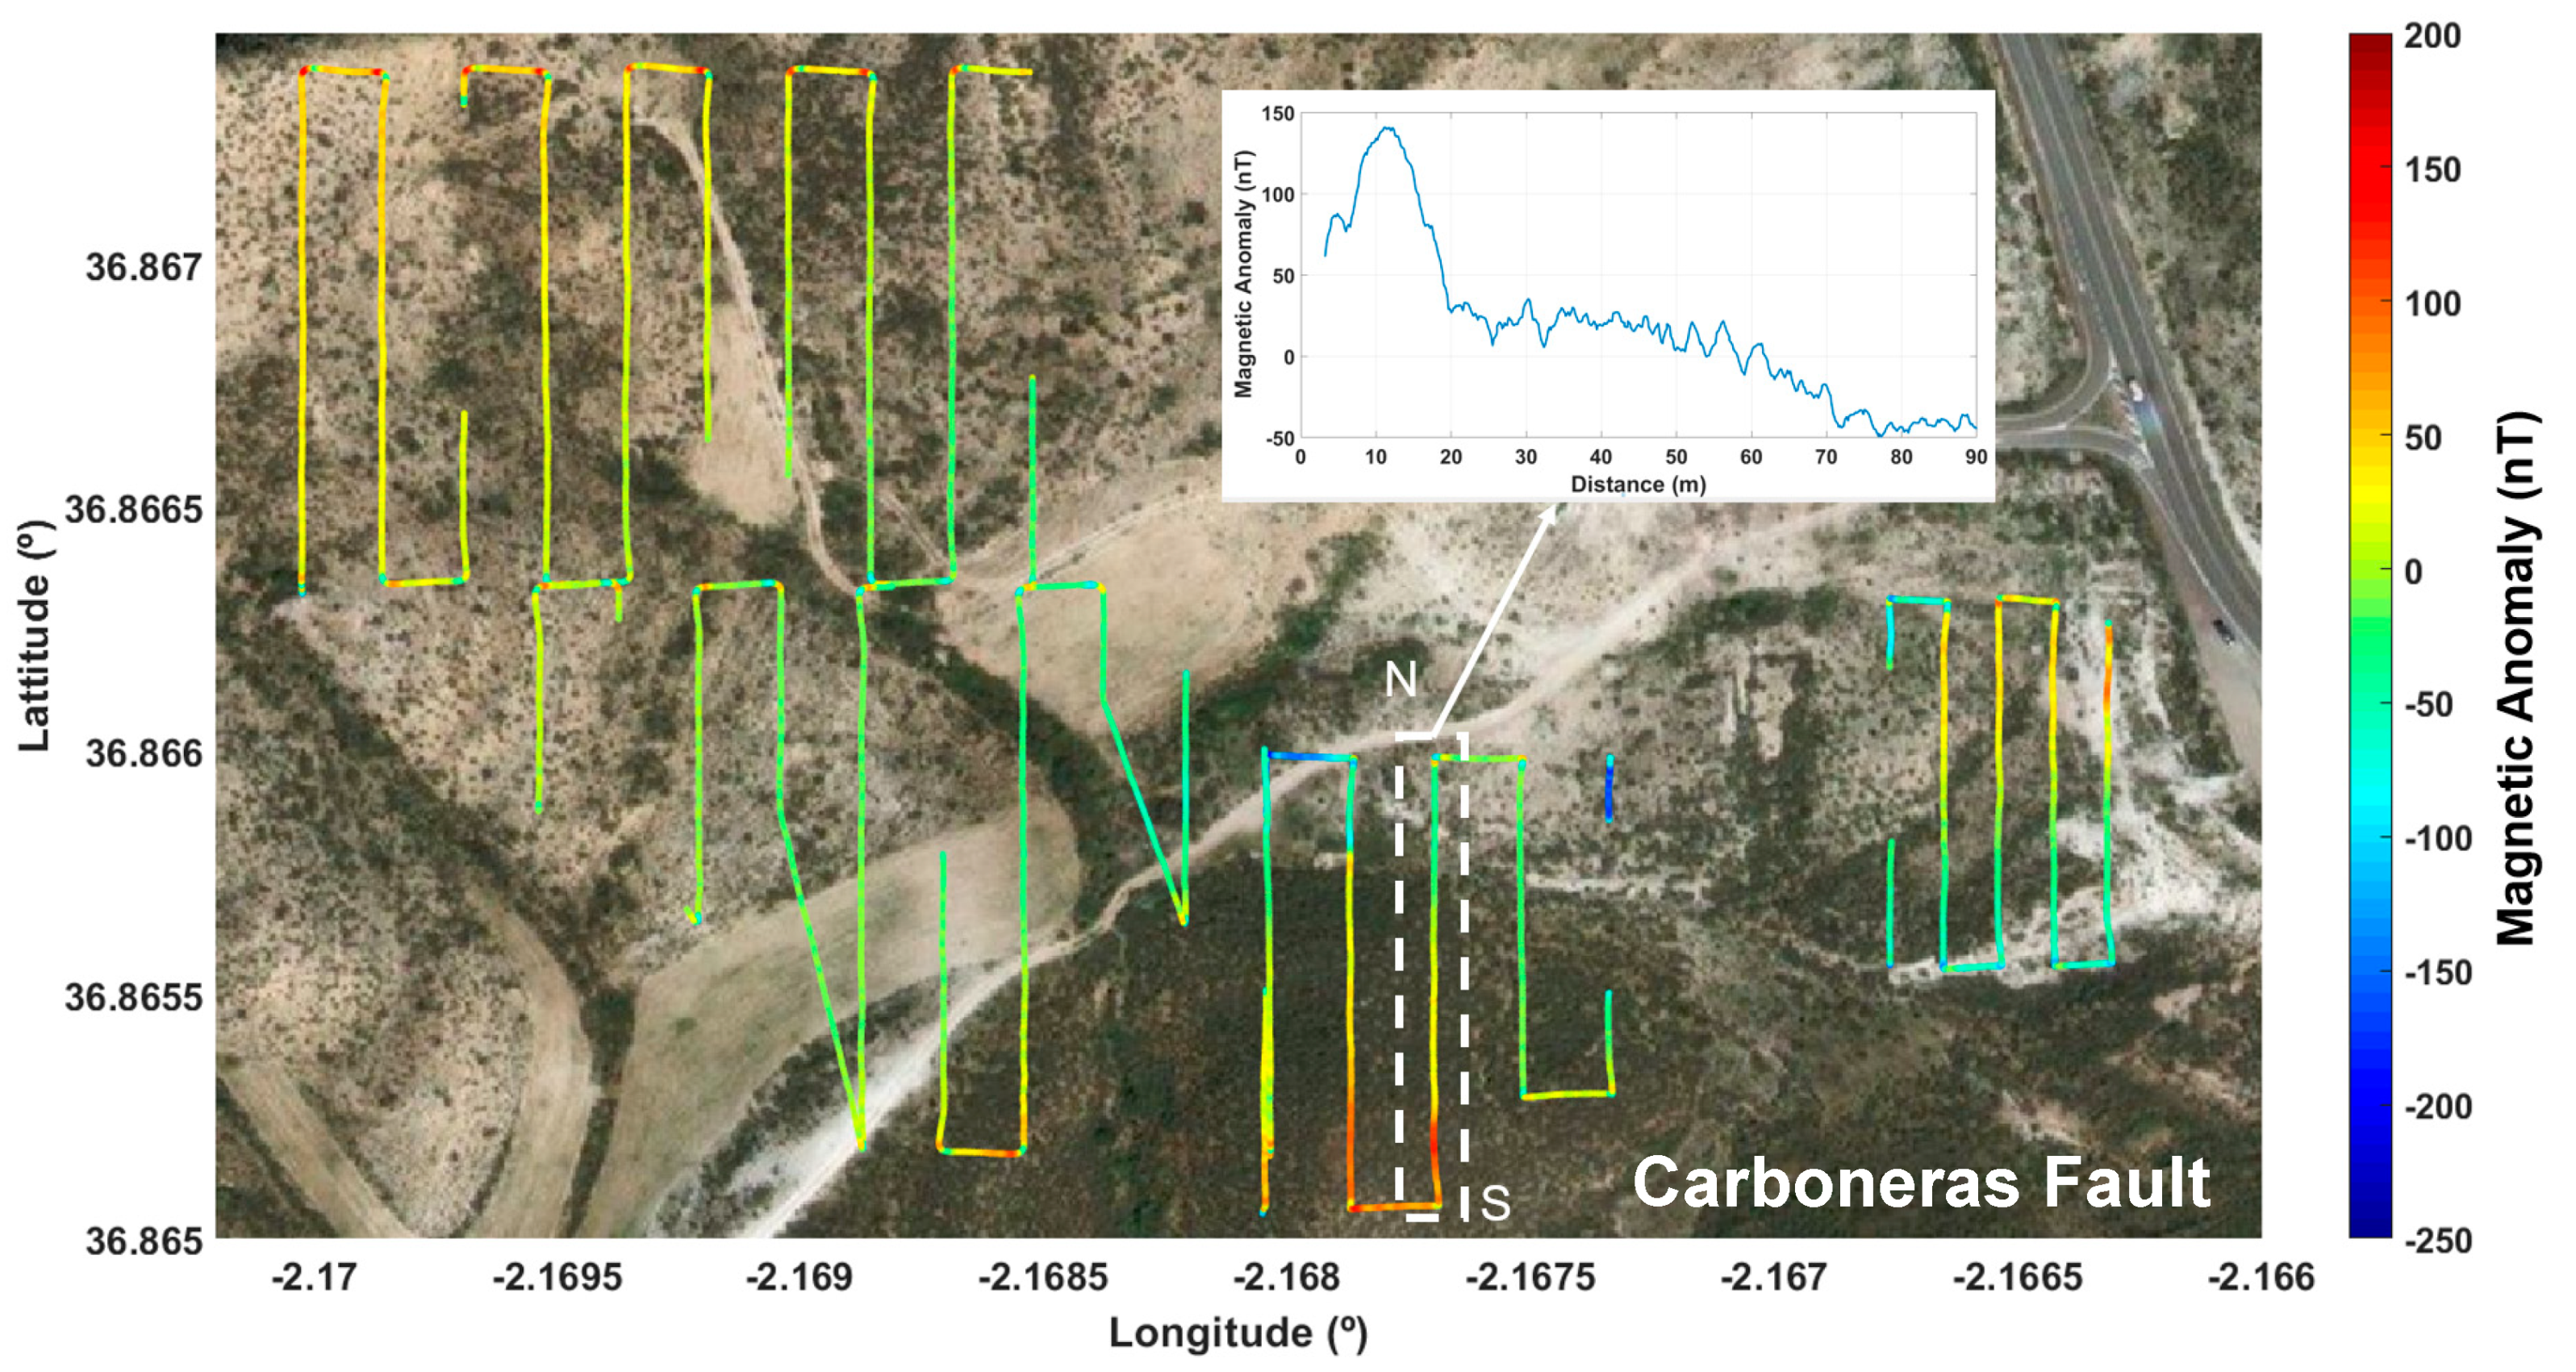
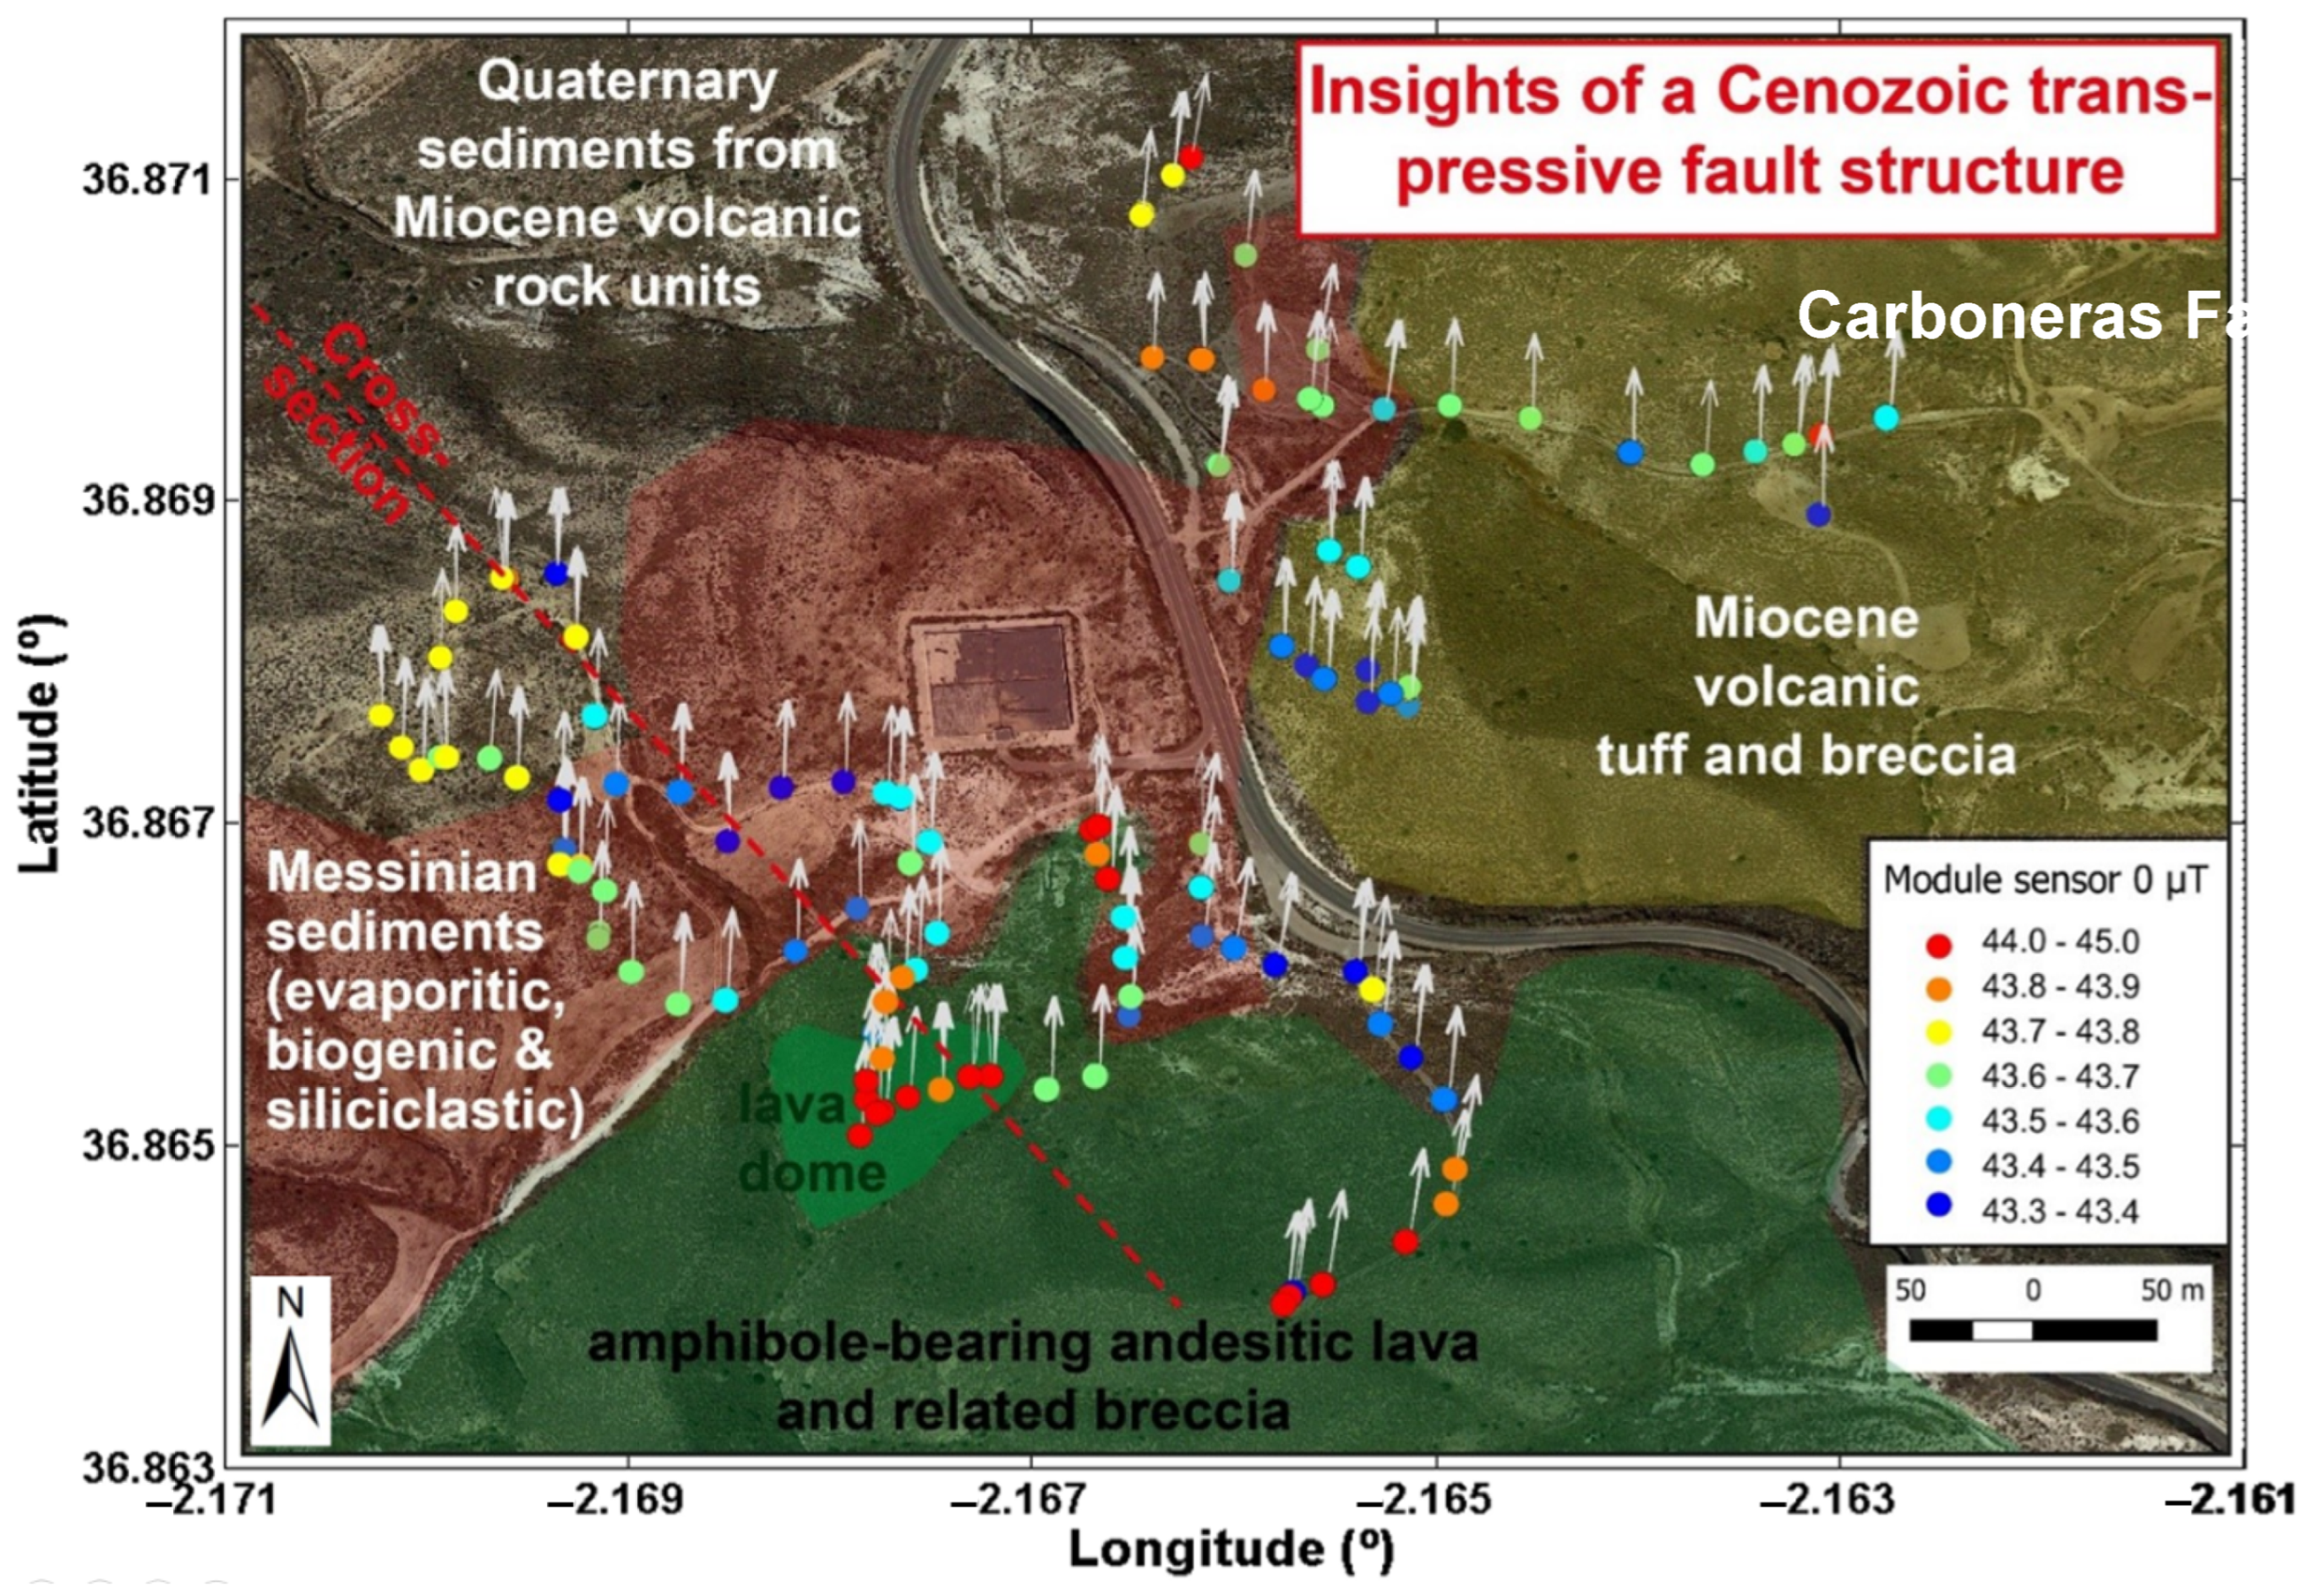
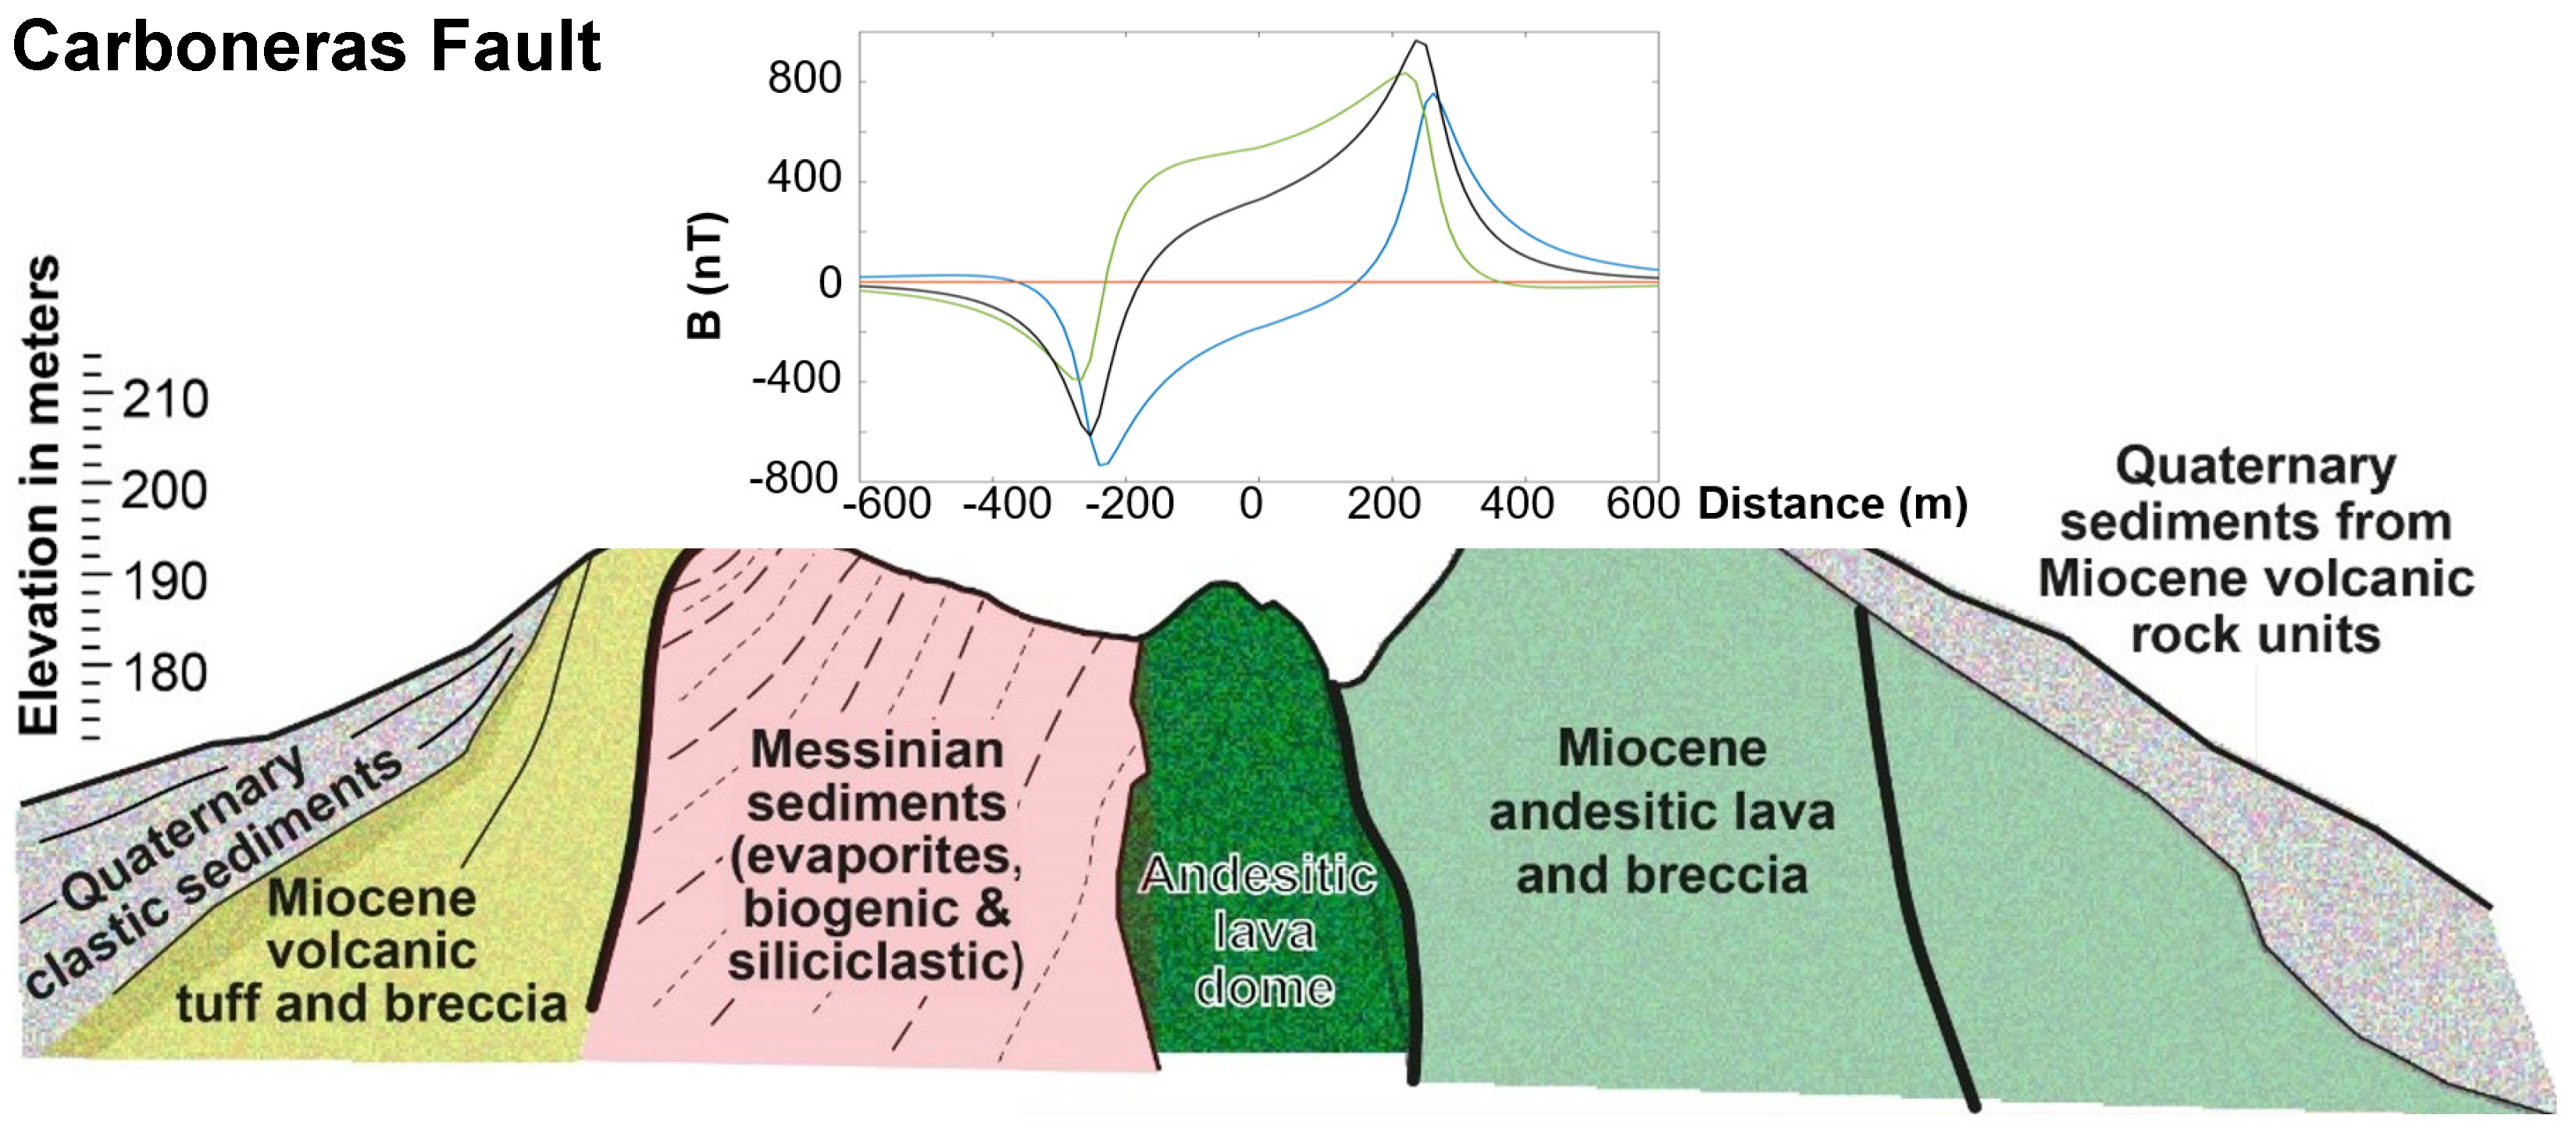
3.3. Third Case Study: Cabo de Gata in Almería–Murcia Volcanic Area

The magmatic activity in Cabo de Gata is related to the dynamics of the margins of the colliding African and European lithospheric plates. The study in the Cabo de Gata region has been included for completeness and for the analogy that these volcanoes can represent for other planetary volcanoes, as in the case of Venusian domes.
The volcanic products have calc-alkaline affinity and the rocks range from basaltic andesites to rhyolites [84], and were erupted by submarine vents and deposited in submarine settings that have now been partially exhumed [75,85]. The two studied sites in the Cabo de Gata zone (Figure 15A) correspond to Mesa Roldán (Figure 15B) and Las Yeseras in La Serrata de Níjar (Figure 15C).
Mesa Roldán is a platform-shaped hill, which comprises an andesitic dome, with its flanks covered by Messinian littoral sediments and Quaternary terrestrial mixed breccias. On the upper plateau, the volcanic rocks are covered by marine sedimentary deposits of the carbonate platform and coral reefs, which reflect the late-Miocene warm period [86].
The structure is accessible for pedestrians and 4WD vehicles. In order to avoid anthropogenic contamination, the survey was performed along a narrow track that starts at the middle of its height and permits the structure to be climbed in a circular path on its skirt.
The magnetic signature is characterized by a northward paleovector with an intensity of the signal from 36,500 nT over the hillsides to a homogeneous intensity around 34,300 nT above the carbonate platform (Figure 16).
Regarding the composition of the magnetic carriers, the structure can be divided into three units with different lithologies and their mixtures: the dome, with an expectedly high magnetic signature due to both the composition (susceptibilities of andesites: ~1700 10−5 SI [87]) and the slow cooling of the andesitic erupted material; the breccia, with a moderate magnetic signature casted by the fragmented andesites cemented with sediments (susceptibility range 100–1000 10−5 SI); and the different sediments (low susceptibility χ << 100 10−5 SI).
Due to the high susceptibility of the andesitic dome compared to the other units, the pattern of the magnetic signature is associated with the distance to the magmatic dome. A simple model with a cylindrical body of 250 m radius and 300 m length centered at the surface, with a susceptibility of χ = 10−2 SI and a natural remanent magnetization of (Mx, My, Mz) = (−5, 0, −7.5) Am−1, simulated the dome with a reversed magnetization with respect to the present geomagnetic field.
The shape of the field anomaly casted by the model correlates very well with the experimental data, with a higher magnetic intensity along the flank of the mountain very close to the dome, and a lower signature on the plateau separated at a distance from the dome through the sediment layer (Figure 17).
The eruption is compatible with having occurred during an inversion of the geomagnetic field.
La Serrata of Níjar is a series of low-height hills (350 m) that extends 12 km in the direction NW–SE. It has a width of 1.2 km and is bounded by two parallel fault traces of the Carboneras Fault [88].
The site of the study belongs to the area named Las Yeseras. In La Serrata, the Carboneras Fault leads to the outcrop of volcanic units as well as the deformed Miocene sedimentary layer, which now appear flanked by Pliocene and Quaternary sediments at both sides of the fault zone (NW and SE). In particular, the site covers four different units: Quaternary sediments originating from volcanic rocks in the NW; towards the SE, there is an area of exposed Messinian sediments, including evaporitic, biogenic, and siliciclastic compounds; and in the central part of the Carboneras Fault, andesites with amphiboles, breccias, and volcanic tuff have been discovered.
At this site, a transect was performed with the drone. At the time of the survey, the technique for constant height flight had not yet been validated; therefore, the profile of the flight is a polygonal curve with the vertices associated with a height of 6 m above the track point with an altitude provided by the digital elevation model of Google Earth, with a maximum error in the barometric height with respect to the elevation of 1.5 m.
The magnetic measurements obtained show a dipolar anomaly towards the south of the NE–SW path in the central part of the image (Figure 18).
The region was also surveyed with the on-ground system (Figure 19). The magnetic measurements show a contrast among the different zones, including a magnetic signature of the area covered with the volcanic tuff and breccia in the range of 43,300–43,700 nT and the region covered with the Quaternary sediments (43,700–43,900 nT). The high magnetic signature is associated with the andesitic zone. In particular, in this region, there is a central part with an anomalous signature between 44,000 and 45,000 nT, which could be associated with a volcanic feature. The on-ground data correlate well with the drone measurements.
According to the literature and the magnetic survey, the site has been interpreted as follows.
In the central part of the transect, plotted in Figure 19, a lava dome outcrops. Towards the SE, the dome is in contact with a layer of the corresponding andesitic lava and breccia.
The area towards the north seems to be associated with the different Messinian sedimentary events, including the evaporites corresponding to the Messinian salinity crisis, which is flanked by the uplifted layer of Miocene tuff and breccia and flanked by the retreated sedimentary layer of the Plio–Quaternary.
Figure 20 shows the synthetic field generated by a simplified model that only includes a cylinder of 250 m radius, with a susceptibility of χ = 10−2 SI and a natural remanent magnetization of (Mx, My, Mz) = (1, 0, 1.5) A/m along the transect perpendicular to the fault (red and dashed line in Figure 20). It shows a good correlation with the measurements along the track indicated in Figure 18. The shape is slightly different from that of the transect of Figure 18 due to the different orientation of the two tracks.

4. Discussion

4.1. Appropriateness of the Proposed Methodology

Since the question of how to derive the magnetic sources from a measured field does not have a univocal solution, different techniques are used to constrain the degrees of freedom of the problem. The most commonly used is numerical inversion. This technique calculates a set of spread dipoles whose signature can be fitted with high accuracy to the experimental data in a surface or in a volume, with the accuracy being highly dependent on the sampling [1]. However, these methods present serious limitations when a restricted number of data are available [89]. Furthermore, scarce information is provided from the sources. In space exploration, the data of the different magnitudes measured by the distinct instruments are often limited, the data of a single magnitude are not homogeneously distributed, and they are often obtained at different altitudes. These circumstances make numerical inversion difficult or impossible for individual features.
The proposed methodology is compatible with the limited datasets obtained with either aerial or on-ground magnetic prospections [90,91], since this involves information from other parameters such as images. It is an alternative method, in which we construct models with simple geometrical bodies. The models mimic the morphology observed with the available images, either satellite, aerial, or on the terrain, based on building blocks for which we consider any extra available information that can help to derive the magnetic properties of the rocks, such as the composition, often related to magnetic susceptibility. In the studied analogs, different evidence has been used to complement the observations. For instance, the models for Pujalós and Crosa de Sant Dalmai are supported by the resistivity tomography published by other authors [80,81], as has been done with some other work on the Moon [92]. In the case of the spatter deposit of the Cerro Gordo volcano, the structure of the edifice in layers is backed by the susceptibility measurements performed in situ as well as some magnetic simple analyses, such as the measurement of the natural remanent magnetization on collected rocks. In the case of Mesa Roldán and La Serrata, the interpretation has been partially based on the existing literature [85]. The synthetic models produced contrast iteratively with the available magnetic data for refinement.
Since this methodology is feasible for use when a restricted dataset is available, it can be applied to the study of planetary features for which such restricted datasets are available, provided that the flight altitude is comparable with the dimensions of the structure under study. The approach intends to adjust to the observations and does not limit the calculation of the intensity and position of the sources. Additionally, the approach is compatible with incremental improvement of the models as soon as more information on the different parameters can be obtained.

4.2. Applicability of Proposed Methodology to Study of Planetary Volcanoes

Unfortunately, it is not currently possible to install volcanic observatories in the considerable number of volcanoes over a rocky planet. Furthermore, in spite of the technological advancements, exhaustive analyses often require instrumentation that cannot be sufficiently miniaturized to be included in the rovers. This might be the main reason why the next decade of space exploration points towards a proliferation of sample return missions [93,94,95]. These missions will be complemented with mobile platforms that help the selection of the samples to be brought back to Earth for high-precision and high-sensitivity characterization. Eventually, some of the mobile platforms could be drones to perform local reconnaissance flights [96,97].
The objective of this work is to establish a methodology that takes advantage of the present technological advances, being affordable in the short term in such a way that it is applicable to the study of planetary surfaces. It intends to be a methodology that extracts as much information as possible with the available, and relatively scarce, data from ground and flight magnetic field measurements, as well as other complementary information such as in situ magnetic susceptibility measurements. Though it relies on a multiphysics approach that naturally pursues incremental progress in the knowledge about the structures under study, the methodology is fundamentally based on magnetic properties. Thus, its application should target bodies that have (or had) a global magnetic field, and therefore will be applicable to different bodies such as Mercury, Mars, the Moon, and possibly Venus, where magmatism should modify the magnetic signature of their crusts.
When eruptions take place in the presence of an ambient magnetic field, since the partial melt temperature of the products is higher than the magnetic transition temperature, the erupted materials containing magnetic carriers record this field during the cooling down process following the eruption. However, some information could also be extracted if the global magnetic field is extinct, but the eruption took place in a magnetized box rock.
For the case of Mars, which had a magnetic field between 4.5 and 3.7 Ga ago [28], many features could be studied with this methodology. For volcanoes of sizes in the order of km, the first step would be to conduct magnetometry using onboard drones.
In contrast to Earth, where most volcanic activity is associated with plate boundaries, volcanism on Mars and Venus, which lack plate tectonics, is principally intraplate [30]. The examples of the volcanic outcrops studied constitute representative cases of volcanism associated with a mantle source and a weakened crust that facilitates the ascent of the magmatic materials. In spite of the fact that they cannot mimic the size and, probably, the composition of Martian volcanoes [98], the eruptive products at these zones cover a wide compositional range, from basalts to rhyolites with alkaline, calc-alkaline, tholeiitic, and shoshonitic geochemical affinities, which is similar to that determined for Mars and Venus (Figure 21). Thus, the whole set of the present study offers great compositional variety for the analysis of the aptitude of the proposed methodology.
This information could significantly benefit from different complementary measurements such as, for instance, from complex susceptibility (real and imaginary) measurements acquired in situ with rovers. This would allow an improved knowledge of the rocks’ composition in magnetic carriers and their structure in domains, despite a potentially weak or non-magnetic signature if the rocks were formed in an environment without a magnetic field. The magnetic field and magnetic susceptibility measurements are both feasible with the available technology [10,64] and are sufficient to reproduce the work presented in this paper in a volcano on Mars. Different and numerous analyses could be performed to complement the information extracted from the morphology observation and its assimilation in the magnetic models through the data of the surveys, which can be feasible in a longer time frame.
Additionally, more profound knowledge on underwater volcanism in Cabo de Gata’s volcanic rocks can contribute to the understanding the steep-sided dome structures of Venus. These circular, positive-relief landforms with pronounced margins are evidence of highly viscous lavas [29]. Further detailed petrological studies, at the andesitic dome of the Mesa de Roldán site, might help to explain the formation processes of these volcanic structures on Venus, which have been related to a high silica content, high crystal content, or high vesicularity [54,100].
In summary, despite the limitations of the proposed methodology, its placement into practice could provide important information on the volcanic processes of other planets prior to having in situ bases with more instrumental capability. It also has to be taken into account that the in-depth study of planetary volcanoes can help develop an understanding of the main differences between these bodies and Earth, and possibly derive important conclusions on the future evolution of our planet.

5. Summary

The objective of this work was to provide a preliminary interpretation of geological structures based on the analysis of their morphology through imaging and their magnetic signature as a feasible methodology in the short to medium term for planetary exploration due to the present technological achievements.
The methodology included a morphological analysis, on-ground and onboard drone magnetic surveys, in situ susceptibility measurements, and the generation of simple models that fit the observed structure as well as feedback of the calculated and measured signature. It was applied to the study of different examples in the most relevant volcanic provinces of the Iberian Peninsula, with the exception of the Valencia zone, because they are principally examples of intraplate volcanism, and therefore are structures analogous to the volcanoes of Mars.
It has been proven that magnetic measurements at different distances can be used to distinguish a spatter deposit on the volcanic edifice of Cerro Gordo in Campo de Calatrava, to identify the volcanic material accumulated in the vents after the eruptions in the Pujalós and Crosa de Sant Dalmai volcanoes in the Catalonian Volcanic Zone. This can also cast contrast between a Miocene volcanic island and its overlying carbonate outcropped platform in Mesa Roldán, as well as between Miocene volcanic rocks and littoral siliciclastic and biogenic oceanic sediments in La Serrata in the Cabo de Gata region.
The results of the models are compatible with the surveys to a first approximation. Furthermore, the susceptibility measurements can be used to classify distinct units by the additional contrast of their magnetic carriers and phases.
More extended magnetic mapping is planned for selected sites with drones, together with in situ measurements of magnetic susceptibilities, to focus on the proportion of the remanent to induced magnetization, to reinforce studies with paleomagnetic information.

Author Contributions

The individual contributions of the authors are: M.D.M.: conceptualization, methodology, field work, and interpretation for the synthetic models. Project administration and funding acquisition. Writing—original draft preparation and writing—review and editing. R.K.: conceptualization, field work, and geological approach. Funding acquisition. M.Á.R.: synthetic models, data processing, methodology, and experimental work concerning magnetic surveys. S.F.R.: methodology and experimental work concerning magnetic surveys and data processing. Project administration. F.R.: geological approach, data processing. J.L.M.: methodology and experimental work concerning susceptibility. A.O.: geological approach. All authors have read and agreed to the published version of the manuscript.

Funding

This work has been funded by the Spanish Programme for Research, Development and Innovation under the grants of references PID2020-119208RB-I00 and ESP2017-88930-R: MINOTAUR and MagAres, respectively, as well as the European Union Project NEWTON, under grant agreement 730041.

Data Availability Statement

Data are stored in INTA server.

Acknowledgments

The authors would like to acknowledge INTA staff for their support and, in particular, Eduardo de Diego and Pablo Morata, for their support with engineering, José Luis García Bueno for his work in the field campaigns piloting the UAVs, María Parrondo for her support in coordination, and Joana S. Oliveira for her review of the text concerning Venus and Mercury in the introduction section; as well as Rafael Becerra-Ramírez and Xavier de Bolós for their review of the texts concerning Campo de Calatrava region and Catalonian Volcanic zone respectively.

Conflicts of Interest

The authors declare no conflict of interest. The funders had no role in the design of the study; in the collection, analyses, or interpretation of data; in the writing of the manuscript; or in the decision to publish the results.

References

  1. Choumert-Nkolo, J.; Lamour, A.; Phélinas, P. The Economics of Volcanoes. Études Et Documents n° 3; Araujo, C., Ed.; Cornec M.: Clermont-Ferrand, France, 2020; pp. 1–36. [Google Scholar]
  2. Filiberto, J.; Trang, D.; Treiman, A.H.; Gilmore, M.S. Present-day volcanism on Venus as evidenced from weathering rates of olivine. Sci. Adv. 2020, 6, eaax7445. [Google Scholar] [CrossRef] [PubMed] [Green Version]
  3. D’Incecco, P.; Filiberto, J.; López, I.; Gorinov, D.A.; Komatsu, G. Idunn Mons: Evidence for Ongoing Volcano-tectonic Activity and Atmospheric Implications on Venus. Planet. Sci. J. 2021, 2, 215. [Google Scholar] [CrossRef]
  4. Shalygin, E.V.; Markiewicz, W.J.; Basilevsky, A.T.; Titov, D.V.; Ignatiev, N.I.; Head, J.W. Active volcanism on Venus in the Ganiki Chasma rift zone. Geophys. Res. Lett. 2015, 42, 4762–4769. [Google Scholar] [CrossRef]
  5. Christensen, P.; McSween, H.; Bandfield, J.; Ruff, S.; Rogers, D.; Hamilton, V.; Gorelick, N.; Wyatt, M.; Jakosky, B.; Kieffer, H.; et al. Evidence for magmatic evolution and diversity on Mars from infrared observations. Nature 2005, 436, 504–509. [Google Scholar] [CrossRef] [PubMed]
  6. Baratoux, D.; Toplis, M.J.; Monnereau, M.; Gasnault, O. Thermal history of Mars inferred from orbital geochemistry of volcanic provinces. Nature 2011, 472, 338–341. [Google Scholar] [CrossRef] [PubMed]
  7. McSween, H.; Taylor, G.; Wyatt, M. Elemental composition of the Martian crust. Science 2009, 324, 736–739. [Google Scholar] [CrossRef] [Green Version]
  8. Rogers, A.D.; Hamilton, V.E. Compositional provinces of Mars from statistical analyses of TES, GRS, OMEGA and CRISM data. J. Geophys. Res. Planets 2014, 120, 62–91. [Google Scholar] [CrossRef]
  9. Zou, Y.; Zhu, Y.; Bai, Y.; Wand, L.; Jia, Y.; Shen, W.; Fan, Y.; Liu, Y.; Wang, C.; Zhang, A.; et al. Scientific objectives and payloads of Tianwen-1, China’s first Mars exploration mission. Adv. Space Res. 2021, 67, 812–823. [Google Scholar] [CrossRef]
  10. NASA. Ingenuity Mars Helicopter, Landing Press Kit. Available online: https://www.jpl.nasa.gov/news/press_kits/mars_2020/download/ingenuity_landing_press_kit.pdf (accessed on 22 December 2021).
  11. Garcia-Fernandez, M.; Alvarez-Lopez, Y.; Las Heras, F. Autonomous Airborne 3D SAR Imaging System for Subsurface Sensing: UWB-GPR on Board a UAV for Landmine and IED Detection Remote. Remote Sens. 2019, 11, 2357. [Google Scholar] [CrossRef] [Green Version]
  12. Park, S.; Choi, Y. Applications of Unmanned Aerial Vehicles in Mining from Exploration to Reclamation: A Review. Minerals 2020, 10, 663. [Google Scholar] [CrossRef]
  13. Wilson, L. Planetary Volcanism. In Encyclopedia of the Solar System, 3rd ed.; Spohn, T., Breuer, D., Johnson, T., Eds.; Elsevier: Amsterdam, The Netherlands, 2014. [Google Scholar]
  14. Kilburn, C.R.J. Encyclopedia of Volcanoes; Academic Press: New York, NY, USA, 2000. [Google Scholar]
  15. McElhinny, M.; McFadden, P. Paleomagnetism: Continents and Oceans; Academic Press: New York, NY, USA, 1999. [Google Scholar]
  16. Anderson, B.J.; Johnson, C.L.; Korth, H.; Purucker, M.E.; Winslow, R.M.; Slavin, J.A.; Solomon, S.C.; McNutt, R.L., Jr.; Raines, J.M.; Zurbuchen, T.H. The global magnetic field of Mercury from MESSENGER orbital observations. Science 2011, 333, 1859–1862. [Google Scholar] [CrossRef] [PubMed] [Green Version]
  17. Hood, L.L. Initial mapping of Mercury’s crustal magnetic field: Relationship to the Caloris impact basin. Geophys. Res. Lett. 2015, 42, 10. [Google Scholar] [CrossRef] [Green Version]
  18. Hood, L.L. Magnetic anomalies concentrated near and within Mercury’s impact basins: Early mapping and interpretation. J. Geophys. Res. Planets 2016, 121, 1016–1025. [Google Scholar] [CrossRef] [Green Version]
  19. Hood, L.L.; Oliveira, J.S.; Galluzzi, V.; Rothery, D.A. Investigating sources of Mercury’s crustal magnetic field: Further mapping of MESSENGER magnetometer data. J. Geophys. Res. Planets 2018, 123, 2647–2666. [Google Scholar] [CrossRef] [Green Version]
  20. Oliveira, J.S.; Hood, L.L.; Langlais, B. Constraining the early history of Mercury and its core dynamo by studying the crustal magnetic field. J. Geophys. Res. Planets 2019, 124, 2382–2396. [Google Scholar] [CrossRef] [Green Version]
  21. Heyner, D.; Auster, H.-U.; Fornaçon, K.-H.; Carr, C.; Richter, I.; Mieth, J.Z.D.; Kolhey, P.; Exner, W.; Motschmann, U.; Baumjohann, W.; et al. The BepiColombo Planetary Magnetometer MPO-MAG: What Can We Learn from the Hermean Magnetic Field? Space Sci. Rev. 2021, 217, 52. [Google Scholar] [CrossRef]
  22. Russell, C.T.; Elphic, R.C.; Slavin, J.A. Limits on the possible intrinsic magnetic field of Venus. J. Geophys. Res. 1980, 85, 8319–8332. [Google Scholar] [CrossRef]
  23. O’Rourke, J.G.; Buz, J.; Fu, R.R.; Lillis, R.J. Detectability of remanent magnetism in the crust of Venus. Geophys. Res. Lett. 2019, 46, 5768–5777. [Google Scholar] [CrossRef]
  24. Acuña, M.H.; Connerney, J.E.P.; Ness, N.F.; Lin, R.P.; Mitchell, D.; Carlson, C.W.; McFadden, J.; Anderson, K.A.; Rême, H.; Mazelle, C.; et al. Global distribution of crustal magnetization discovered by the mars global surveyor MAG/ER experiment. Science 1999, 284, 790–793. [Google Scholar] [CrossRef] [Green Version]
  25. Gilder, S.A.; Pohl, J.; Eitel, M. Magnetic Signatures of Terrestrial Meteorite Impact Craters: A summary. In Magnetic Fields in the Solar System. Planets, Moons and Solar Wind Interactions (Astrophysics and Space Science Library 448); Lühr, H., Wicht, J., Gilder, S.A., Holschneider, M., Eds.; Springer: Cham, Switzerland, 2018; pp. 357–382. [Google Scholar]
  26. Connerney, J.E.P.; Acuña, M.H.; Ness, N.F.; Kletetschka, G.; Mitchell, D.L.; Lin, R.P.; Reme, H. Tectonic implications of Mars crustal magnetism Earth. Proc. Natl. Acad. Sci. USA 2005, 102, 14975. [Google Scholar] [CrossRef] [Green Version]
  27. Lillis, R.J.; Frey, H.V.; Manga, M. Rapid decrease in Martian crustal magnetization in the Noachian era: Implications for the dynamo and climate of early Mars. Geophys. Res. Lett. 2008, 35, L14203. [Google Scholar] [CrossRef] [Green Version]
  28. Mittelholz, A.; Johnson, C.L.; Feinberg, J.M.; Langlais, B.; Phillips, R.J. Timing of the martian dynamo: New constraints for a core field 4.5 and 3.7 G ago. Sci. Adv. 2020, 6, eaba0513. [Google Scholar] [CrossRef] [PubMed]
  29. Platz, T.; Byrne, P.K.; Massironi, M.; Hiesinger, H. Volcanism and tectonism across the inner solar system: An overview. Geol. Soc. Lond. Spec. Publ. 2014, 401, 1–56. [Google Scholar] [CrossRef]
  30. Mège, D.; Cook, A.C.; Garel, E.; Lagabrielle, Y.; Cormier, M.H. Volcanic rifting at Martian grabens. J. Geophys. Res. 2003, 108, 5044. [Google Scholar] [CrossRef] [Green Version]
  31. Cohen, B.E.; Mark, D.F.; Cassata, W.S. Taking the pulse of Mars via dating of a plume-fed volcano. Nat. Commun. 2017, 8, 640. [Google Scholar] [CrossRef] [Green Version]
  32. Gülcher, A.J.P.; Gerya, T.V.; Montési, L.G.J.; Munch, J. Corona structures driven by plume–lithosphere interactions and evidence for ongoing plume activity on Venus. Nat. Geosci. 2020, 13, 547–554. [Google Scholar] [CrossRef]
  33. Smrekar, S.E.; Stofan, E.R.; Mueller, N.; Treiman, A.; Elkins-Tanton, L.; Helbert, J.; Piccioni, G.; Drossart, P. Recent hotspot volcanism on venus from VIRTIS emissivity data. Science 2010, 328, 605–608. [Google Scholar] [CrossRef]
  34. Schmidt, M.E.; Herd, C.D.K.; McCoy, T.J.; McSween, H.Y.; Rogers, A.D.; Treiman, A.H. Igneous Mars: Crust and Mantle Evolution as Seen by Rover Geochemistry, Martian Meteorites, and Remote Sensing. In Proceedings of the 50th Annual Lunar and Planetary Science Conference, The Woodlands, TX, USA, 18–22 March 2019; Volume 2132, p. 2419. [Google Scholar]
  35. Santos, A.R.; Agee, C.B.; McCubbin, F.M.; Shearer, C.K.; Burger, P.V.; Tartèse, R.; Anand, M. Petrology of igneous clasts in Northwest Africa 7034: Implications for the petrologic diversity of the martian crust. Geochim. Cosmochim. Acta 2015, 157, 56–85. [Google Scholar] [CrossRef]
  36. Ming, D.W.; Gellert, R.; Morris, R.V.; Arvidson, R.E.; Brueckner, J.; Clark, B.C. Geochemical properties of rocks and soils in Gusev crater, Mars: Results of the Alpha Particle X-ray Spectrometer from Cumberland Ridge to Home Plate. J. Geophys. Res. Planets 2008, 113, E12S39. [Google Scholar] [CrossRef]
  37. Schmidt, M.E.; Campbell, J.L.; Gellert, R.; Perrett, G.M.; Treiman, A.H.; Blaney, D.L. Geochemical diversity in first rocks examined by the Curiosity Rover in Gale Crater: Evidence for and significance of an alkali and volatile-rich igneous source. J. Geophys. Res. Planets 2014, 119, 64–81. [Google Scholar] [CrossRef]
  38. Schmidt, M.E.; Perrett, G.M.; Bray, S.L.; Bradley, N.J.; Lee, R.E.; Berger, J.A. Dusty Rocks in Gale Crater: Assessing areal coverage and separating dust and rock contributions in APXS analyses. J. Geophys. Res. Planets 2018, 123, 1649–1673. [Google Scholar] [CrossRef]
  39. Sautter, V.; Stolper, E.M. In situ evidence for continental crust on early Mars. Nat. Geosci. 2015, 8, 605–609. [Google Scholar] [CrossRef] [Green Version]
  40. Brückner, J.; Dreibus, G.; Rieder, R.; Wänke, H. Refined data of Alpha Proton X-ray Spectrometer analyses of soils and rocks at the Mars Pathfinder site: Implications for surface chemistry. J. Geophys. Res. Planets 2003, 108, 8094. [Google Scholar] [CrossRef]
  41. McSween, H.Y. Petrology on Mars. Am. Mineral. 2015, 100, 2380–2395. [Google Scholar] [CrossRef]
  42. Zipfel, J.; Schroder, C.; Jolliff, B.L.; Gellert, R.; Herkenhoff, K.E.; Rieder, R.; Anderson, R.; Bell, J.F., III; Brückner, J.; Crisp, J.A.; et al. Bounce Rock—A shergottite-like basalt encounteredin Meridiani Planum; Mars. Meteorit. Planet. Sci. 2011, 46, 1–20. [Google Scholar]
  43. Sautter, V.; Payre, V. Alkali magmatism on Mars: An unexpected diversity. CR Geosci. 2021, 353, 61–90. [Google Scholar] [CrossRef]
  44. Greeley, R.; Spudis, P.D. Volcanism on mars. Rev. Geophys. 1981, 19, 13–41. [Google Scholar] [CrossRef]
  45. Hauber, E.; Brož, P.; Rossi, A.P.; Michael, G. A field of small pitted cones on the floor of coprate chasma Mars: Volcanism inside Valles Marineris? In Proceedings of the 46th Lunar and Planetary Science Conference, The Woodlands, TX, USA, 16–20 March 2015; pp. 16–20. [Google Scholar]
  46. Greeley, R.; Foing, B.H.; McSween, H.Y.; Neukum, G.; Pinet, P.; van Kan, M.; Werner, S.C.; Williams, D.A.; Zegers, T.E. Fluid lava flows in Gusev crater; Mars. J. Geophys. Res. Planets 2005, 110, E05008. [Google Scholar] [CrossRef] [Green Version]
  47. Farrand, W.H.; Rice, J.W., Jr.; Chuang, F.C.; Rogers, A.D. Spectral and geological analyses of domes in western Arcadia Planitia; Mars: Evidence for intrusive alkali-rich volcanism and ice-associated surface features. Icarus 2021, 357, 114111. [Google Scholar] [CrossRef]
  48. Michalski, J.; Bleacher, J. Supervolcanoes within an ancient volcanic province in Arabia Terra; Mars. Nature 2013, 502, 47–52. [Google Scholar] [CrossRef]
  49. Whelley, P.; Matiella Novak, A.; Richardson, J.; Bleacher, J.; Mach, K.; Smith, R.N. Stratigraphic evidence for early martian explosive volcanism in Arabia Terra. Geophys. Res. Lett. 2021, 48, e2021GL094109. [Google Scholar] [CrossRef]
  50. Squyres, S.W.; Aharonson, O.; Clark, B.C.; Cohen, B.A.; Crumpler, L.; De Souza, P.A.; Farrand, W.H.; Grant, J.; Grotzinger, J.P.; Haldemann, A.F.C.; et al. Pyroclastic activity at home plate in Gusev Crater; Mars. Science 2007, 316, 738–742. [Google Scholar] [CrossRef] [PubMed] [Green Version]
  51. Treiman, A.H. Geochemistry of Venus’ Surface: Current Limitations as Future Opportunities. In Exploring Venus as a Terrestrial Planet, 1st ed.; Esposito, L.W., Stofan, E.R., Cravens, T.E., Eds.; American Geophysical Union: Washington, DC, USA, 2007; pp. 7–22. [Google Scholar]
  52. Elkins-Tanton, L.T.; Smrekar, S.E.; Hess, P.C.; Parmentier, E.M. Volcanism and volatile recycling on a one-plate planet: Applications to Venus. J. Geophys. Res. Planets 2007, 112, E04S06. [Google Scholar] [CrossRef] [Green Version]
  53. Magee, K.P.; Head, J.W. Large flow fields on Venus: Implications for plumes, rift associations, and resurfacing. In Mantle Plumes: Their Identification Through Time; Geological Society of America Special Papers: Washington DC USA, 2001; Volume 352, pp. 81–101. [Google Scholar]
  54. Stofan, E.; Anderson, S.; Crown, D.A.; Plaut, J.J. Emplacement and composition of steep-sided domes on Venus. J. Geophys. Res. Planets 2000, 105, 26757–26771. [Google Scholar] [CrossRef]
  55. Crumpler, L.S.; Aubele, J. Volcanism on Venus. In Encyclopedia of Volcanoes; Sigurdson, H., Houghton, B., Rymer, H., Stix, J., McNutt, S., Eds.; Academic Press: New York, NY, USA, 2000; pp. 727–770. [Google Scholar]
  56. Lustrino, M.; Wilson, M. The Circum-Mediterranean Anorogenic Cenozoic Igneous Province. Earth Sci. Rev. 2007, 81, 1–65. [Google Scholar] [CrossRef]
  57. Duggen, S.; Hoernle, K.; Klügel, A.; Geldmacher, J.; Thirlwall, M.; Hauff, F.; Lowry, D.; Oates, N. Geochemical zonation of the Miocene Alborán Basin volcanism (westernmost Mediterranean): Geodynamic implications. Contrib. Mineral Petr. 2008, 156, 577–593. [Google Scholar] [CrossRef]
  58. Porreca, M.; Giordano, G.; Riggs, N.; Mattei, M. Geochronology; Geochemistry and Geodynamics of the Cabo de Gata volcanic zone; Southeastern Spain. Ital. J. Geosci. 2014, 133, 341–361. [Google Scholar]
  59. Le Bas, J.M.; Le Maitre, R.V.; Streckeisen, A.; Zanettin, B. A chemical classification of volcanic rocks based on the total alkali-silica diagram. J. Petrol. 1986, 27, 745–750. [Google Scholar] [CrossRef]
  60. Quesada, C.; Oliveira, J.T. (Eds.) Martí and Bólos. In The Geology of Iberia: A Geodynamic Approach; Springer: Cham, Switzerland, 2019. [Google Scholar]
  61. Granja Bruña, J.L.; Vegas, R.; Sentre-Domingo, M.A.; Muñoz-Martín, A.; Sainz-Maza, S. Gravity modeling of the lithosphere in the Calatrava Volcanic Province (Spain): Geodynamic implications. J. Iber. Geol. 2015, 41, 233–252. [Google Scholar] [CrossRef] [Green Version]
  62. Fernandez Romero, S.; Morata Barrado, P.; Rivero Rodriguez, M.A.; Vazquez Yañez, G.A.; De Diego Custodio, E.; Díaz Michelena, M. Vector Magnetometry Using Remotely Piloted Aircraft Systems: An Example of Application for Planetary Exploration. Remote Sens. 2021, 13, 390. [Google Scholar] [CrossRef]
  63. Zheng, Y.; Li, S.; Xing, K.; Zhang, X. Unmanned Aerial Vehicles for Magnetic Surveys: A Review on Platform Selection and Interference Suppression. Drones 2021, 5, 93. [Google Scholar] [CrossRef]
  64. Díaz Michelena, M.; Mesa Uña, J.L.; Pérez Jimenez, M.; Maicas Ramos, M.C.; Cobos Arribas, P.; Aroca Hernánedez-Ros, C. A novel induction-based device for the measurement of the complex magnetic susceptibility. Sens. Actuators A 2017, 263, 471–479. [Google Scholar] [CrossRef]
  65. Reitz, J.R.; Milford, F.J.; Christy, R.W. Electromagnetic Waves. In Foundations of Electromagnetic Theory, 3rd ed.; Wesley series in Physics; Addison-Wesley: Boston, MA, USA, 1979. [Google Scholar]
  66. Díaz Michelena, M.; Kilian, R.; Baeza, O.; Rios, F.; Rivero, M.A.; Mesa, J.L.; González, V.; Arlensiú Ordoñez, A.; Langlais, B.; Rocca, M.C.L.; et al. The formation of a giant collapse caprock sinkhole on the Barda Negra plateau basalts (Argentina): Magnetic, mineralogical and morphostructural evidences. Geomorphology 2020, 367, 107297. [Google Scholar] [CrossRef]
  67. López-Ruiz, J.; Cebriá, J.M.; Doblas, M. Cenozoic volcanism I: The Iberian peninsula. In The Geology of Spain; Gibbons, W., Moreno, T., Eds.; Geological Society: London, UK, 2002. [Google Scholar]
  68. Ancochea, E. Evolución Espacial Y Temporal Del Vulcanismo Reciente De España Central. Ph.D. Thesis, Universidad Complutense de Madrid, Madrid, Spain, 1982. [Google Scholar]
  69. Ancochea, E.; Huertas, M.J. La región volcánica de Levante. In Geología de España; Vera, J.A., Ed.; SGE-IGME: Madrid, Spain, 2004; pp. 675–676. [Google Scholar]
  70. Ancochea, E.; Muñoz, M.; Sagredo, J. Las manifestaciones volcánicas de Cofrentes y Picasent (provincia de Valencia). In Proceedings of the I Congreso Español de Geología, Segovia, Spain, 9–19 April 1984. [Google Scholar]
  71. Aparicio, A.; Araña, V.; García, R.; Grachev, A. The origin of the Columbretes Islands’ basanitic and phonolitic magmas (Western Mediterranean). Mineral. Mag. 1994, 58, 21–22. [Google Scholar] [CrossRef]
  72. Cebriá, J.M.; López Ruiz, J. Alkali basalts and leucitites in an extensional intracontinental plate setting: The Late Cenozoic Calatrava Volcanic Province (Central Spain). Lithos 1995, 35, 27–46. [Google Scholar] [CrossRef]
  73. López Ruiz, J.; Rodríguez Badiola, E. La región volcánica Mio-Pleistocena del NE de España. Estud. Geol.-Madr. 1985, 41, 105–126. [Google Scholar] [CrossRef] [Green Version]
  74. Neumann, E.R.; Martí, J.; Mitjavila, J.; Wulff-Pedersen, E. Origin and implications of mafic xenoliths associated with Cenozoic extension-related volcanism in the València Trough, NE Spain. Miner. Petrol. 1999, 65, 113–139. [Google Scholar] [CrossRef]
  75. Soriano, C.; Cas, R.A.F.; Riggs, N.R.; Giordano, G. Submarine Volcanism of the Cabo de Gata Magmatic Arc in the Betic-Rif Orogen, SE Spain. In Updates in Volcanology—From Volcano Modelling to Volcano Geology; Nemeth, K., Ed.; IntechOpen: London, UK, 2016. [Google Scholar]
  76. Martí, J.; Mitjavila, J.; Roca, E.; Aparicio, A. Cenozoic magmatism of the Valencia trough (western Mediterranean): Relationship between structural evolution and volcanism. Tectonophysics 1992, 203, 145–165. [Google Scholar] [CrossRef]
  77. Dèzes, P.; Schmid, S.M.; Ziegler, P.A. Evolution of the European Cenozoic Rift System: Interaction of the Alpine and Pyrenean orogens with their foreland lithosphere. Tectonophysics 2004, 389, 1–33. [Google Scholar] [CrossRef]
  78. Martí, J.; Pujadas, A.; Ferrés, D.; Planagumà, L. El vulcanismo. In Guía de Campo de la Zona Volcánica de la Garrotxa, 1st ed.; Parque Natural de la Zona volcánica de la Garrotxa: Catalunya, Spain, 2001. [Google Scholar]
  79. Bolós, X.; Planagumà, L.; Martí, J. Volcanic stratigraphy of the Quaternary La Garrotxa Volcanic Field (north-east Iberian Peninsula). J. Quaternary Sci. 2014, 29, 547–560. [Google Scholar] [CrossRef]
  80. Bolós, X.; Martí, J.; Becerril, L.; Planagumà, L.; Grosse, P.; Barde-Cabusson, S. Volcano-structural analysis of La Garrotxa Volcanic Field (NE Iberia): Implications for the plumbing system. Tectonophysics 2015, 642, 58–70. [Google Scholar] [CrossRef] [Green Version]
  81. Barde-Cabusson, S.; Bolós, X.; Pedrazzi, D.; Lovera, R.; Himi, M.; Serra, G.; Martí Molist, J.; Casas, A. Illuminating the Internal Structure of Two Monogenetic Volcanoes by ERT (La Garrotxa Volcanic Field, Spain). In Proceedings of the Conference Proceedings, Near Surface Geoscience 2013—19th EAGE European Meeting of Environmental and Engineering Geophysics, Bochum, Germany, 9–11 September 2013. [Google Scholar]
  82. Bolós, X.; Barde-Cabusson, S.; Pedrazzi, D.; Martí, J. Investigation of the inner structure of La Crosa de Sant Dalmai mar (Catalo- nian Volcanic Zone, Spain). J. Volcanol. Geotherm. Res. 2012, 37–48, 247–248. [Google Scholar]
  83. Becerra-Ramírez, R.; Gosálvez, R.U.; Escobar, E.; González, E.; Serrano-Patón, M.; Guevara, D. Characterization and Geotourist Resources of the Campo de Calatrava Volcanic Region (Ciudad Real, Castilla-La Mancha, Spain) to Develop a UNESCO Global Geopark Project. Geosciences 2020, 10, 441. [Google Scholar] [CrossRef]
  84. Fernández-Soler, J.M. El vulcanismo calco-alcalino en el Parque Natural de Cabo de Gata—Nijar (Almeria). Estudio volcanológico y petrológico. Ph.D. Thesis, Universidad de Granada, Granada, Spain, 1 December 1996. Soc. Almeriense Historia Natural. [Google Scholar]
  85. Braga, J.; Martín, J.; Quesada, C. Patterns and average rates of late Neogene–Recent uplift of the Betic Cordillera, SE Spain. Geomorphology 2003, 50, 3–26. [Google Scholar] [CrossRef]
  86. Sola, F.; Puga-Bernabéu, Á.; Aguirre, J.; Braga, J.C. Heterozoan carbonate deposition on a steep basement escarpment (Late Miocene, Almería, south-east Spain). Sedimentology 2017, 64, 1107–1131. [Google Scholar] [CrossRef]
  87. Li, Z.; Fu, G. Application of Magnetic Susceptibility Parameters in Research of Igneous Rock in Chepaizi. J. Phys. Conf. Ser. 2019, 1176, 042068. [Google Scholar] [CrossRef]
  88. Moreno, X.; Masana, E.; Pallàs, R.; Gràcia, E.; Rodés, Á.; Bordonau, J. Quaternary tectonic activity of the Carboneras Fault in the La Serrata range (SE Iberia): Geomorphological and chronological constraints. Tectonophysics 2015, 663, 78–94. [Google Scholar] [CrossRef]
  89. Toepfer, S.; Narita, Y.; Heyner, D.; Kolhey, P.; Motschmann, U. Mathematical foundations of Capon’s method for planetary magnetic field analysis. Geosci. Instrum. Methods Data Syst. 2020, 9, 471–481. [Google Scholar] [CrossRef]
  90. Parshin, A.V.; Morozov, V.A.; Blinov, A.V.; Kosterev, A.N.; Budyak, A.E. Low-altitude geophysical magnetic prospecting based on multirotor UAV as a promising replacement for traditional ground survey. Geo-Spat. Inf. Sci. 2018, 21, 67–74. [Google Scholar] [CrossRef] [Green Version]
  91. Gailler, L.; Labazuy, P.; Régis, E.; Bontemps, M.; Souriot, T.; Bacques, G.; Carton, B. Validation of a New UAV Magnetic Prospection Tool for Volcano Monitoring and Geohazard Assessment. Remote Sens. 2021, 13, 894. [Google Scholar] [CrossRef]
  92. Wakita, S.; Johnson, B.C.; Garrick-Bethell, I.; Kelley, M.R.; Maxwell, M.E.; Davison, T.M. Impactor material records the ancient lunar magnetic field in antipodal anomalies. Nat. Commun. 2021, 12, 6543. [Google Scholar] [CrossRef] [PubMed]
  93. Treiman, A.; Wadhwa, M.; Shearer, C.K., Jr.; MacPherson, G.J.; Papike, J.J.; Wasserburg, G.J.; Floss, C.; Rutherford, M.J.; Flynn, G.J.; Papanastassiou, D.; et al. Groundbreaking Sample Return from Mars: The Next Giant Leap in Understanding the Red Planet. A White Paper for the NRC Planetary Science Decadal Survey. 2009. Available online: https://www.lpi.usra.edu/decadal/captem/AllanTreimanMars.pdf (accessed on 27 March 2022).
  94. Martins, Z.; Chan, Q.H.S.; Bonal, L.; King, A.; Yabuta, H. Organic Matter in the Solar System—Implications for Future on-Site and Sample Return Missions. Space Sci. Rev. 2020, 216, 54. [Google Scholar] [CrossRef]
  95. Kuramoto, K.; Kawakatsu, Y.; Fujimoto, M. Martian moons exploration MMX: Sample return mission to Phobos elucidating formation processes of habitable planets. Earth Planets Space 2022, 74, 1–31. [Google Scholar] [CrossRef]
  96. Lorenz, R.D.; Turtle, E.P.; Barnes, J.W.; Trainer, M.G.; Adams, D.S.; Hibbard, K.E.; Sheldon, C.Z.; Zacny, K.; Peplowski, P.N.; Lawrence, D.J.; et al. Dragonfly: A Rotorcraft Lander Concept for Scientific Exploration at Titan. Johns Hopking APL Tech. Dig. 2018, 34, 3. [Google Scholar]
  97. Barnes, J.W.; Turtle, E.P.; Trainer, M.G.; Lorentz, R.D.; MacKenzie, S.M.; Brinkerhoff, W.B.; Cable, M.L.; Ernst, C.M.; Freissinet, C.; Hand, K.P. Science Goals and Objectives for the Dragonfly Titan Rotorcraft Relocatable Lander. Planetary Sci. J. 2021, 2, 130. [Google Scholar] [CrossRef]
  98. Zimbelman, J.R.; Crown, D.A.; Mouginis-Mark, P.J.; Gregg, T.K.P. The Volcanoes of Mars, 1st ed.; Elsevier: Amsterdam, The Netherlands, 2020. [Google Scholar]
  99. Cousin, A.; Sautter, V.; Payré, V.; Forni, O.; Mangold, N.; Gasnault, O.; Le Deit, L.; Johnson, J.; Maurice, S.; Salvatore, M.; et al. Classification of Igneous Rocks Analyzed by ChemCam at Gale Crater, Mars. Icarus 2017, 288, 265–283. [Google Scholar] [CrossRef]
  100. Pavri, B.; Head, J.W.; Klose, K.B.; Wilson, L. Steep-sided domes on Venus: Characteristics; geologic setting; and eruption conditions from Magellan data. J. Geophys. Res. 1992, 97, 13445–13478. [Google Scholar] [CrossRef]
Figure 1. Location of the Iberian volcanism modified from Granja-Bruña et al. 2015 [61]. Study areas are shown in blue, green, and orange. Volcanic areas not included in this study are displayed in pink.
Remotesensing 14 02039 g001
Figure 2. (A) Onboard drone and on-ground magnetometry. (B) Details of the ground magnetometry equipment.
Remotesensing 14 02039 g002
Figure 3. (A) Ground station. (B) Drone with the boom to deploy the magnetometer in flight configuration.
Remotesensing 14 02039 g003
Figure 4. (A) Hexacopter-type drone provided with a laser altimeter in the landing configuration with the boom horizontal. (B) Mobile ground station for tracks longer than 500 m.
Remotesensing 14 02039 g004
Figure 5. NEWTON instrument: S-box with the sensing head and E-box with control electronics. Auxiliary devices such as a PC, battery, and a transport case.
Remotesensing 14 02039 g005
Figure 6. (A) Volcanic zones of the Iberian Peninsula, excluding the islands Columbretes and Alborán. (B) Detail of the Catalonian Volcanic Zone indicating the three regions: L’Émpordà and La Garrotxa, as well as the location of the Pujalós and La Crosa de Sant Dalmai volcanoes. These images are from Google Earth Pro.
Remotesensing 14 02039 g006
Figure 7. Magnetic anomaly of the Pujalós volcano measured with the on-ground equipment. The rectangle in the dashed lines shows the transect for the modeling.
Remotesensing 14 02039 g007
Figure 8. (A) Scheme of the simulated structure, a cylindrical body of 140 m radius at a depth of 150 m with respect to the surface, with a susceptibility of χ = 10−2 SI and a remanent magnetization of (Mx, My, Mz) = (1, 0, 1.5) Am−1 using the geomagnetic reference system. (B) Results of the simulation.
Remotesensing 14 02039 g008
Figure 9. (A) Geological map of the crater of the Crosa de Sant Dalmai volcano by Bolós et al., 2012 [82]. (B) Representation of the measurements performed with the on-ground equipment survey, showing the magnetic anomaly superimposed with the structure with the main different elements: phreatomagmatic deposits, scoria deposits, spatter, and lava flow, as well as the post-volcanic sediments. The rectangle in the dashed lines shows the transect for the modeling.
Remotesensing 14 02039 g009
Figure 10. (A) Scheme of the simulated structure: the elements in red and green simulate the old crater and its deposits with a susceptibility of χ = 10−2 SI and a natural remanent magnetization of (Mx, My, Mz) = (2, 0, 3) Am−1; 2, and the blue cylinder depicts the material in the vent of the last eruptive episode with a susceptibility of χ = 10−2 SI and a natural remanent magnetization of (Mx, My, Mz) = (4, 0, 6) Am−1. (B) Graph of the magnetic field components and intensity calculated as |B|-F, sourced by the model.
Remotesensing 14 02039 g010
Figure 11. (A) Map of the volcanoes of Campo de Calatrava from Rafael Becerra-Ramírez el al. 2020 [83] indicating the position of the Cerro Gordo volcano. (B) Photograph of the Cerro Gordo volcano.
Remotesensing 14 02039 g011
Figure 12. (A) Representation of the measurements performed with the ground equipment (TITAN) and with the drone at different heights. (B) Track followed by the ground equipment and magnetic anomaly in a color diagram.
Remotesensing 14 02039 g012
Figure 13. (A) Photograph of the spatter deposit wall. (B) NEWTON instrument measuring the susceptibility of the rocks of the layer. (C) Magnetic susceptibility of the different layers depicted in A as well as a reference sample: an epoxy parallelepiped with 10% weight of ferrite in the SI.
Remotesensing 14 02039 g013
Figure 14. (A) Scheme of the simulated structure with three layers. (B) Numerical magnetic field generated by the model.
Remotesensing 14 02039 g014
Figure 15. (A) Cabo de Gata area showing the Carboneras Fault and the two sites of study: (B) Mesa Roldán and (C) La Serrata.
Remotesensing 14 02039 g015
Figure 16. Magnetic field intensity and direction of Mesa Roldán in Cabo de Gata registered by the on-ground equipment.
Remotesensing 14 02039 g016
Figure 17. Interpretation of Mesa Roldán as a dome of 500 m diameter and 300 m height centered at the surface. Synthetic magnetic field: components and total field.
Remotesensing 14 02039 g017
Figure 18. Experimental values of the magnetic field anomaly of the Carboneras Fault registered by the on-drone equipment. Graph concerning the track corresponding to the overflight of the hypothesized lava dome.
Remotesensing 14 02039 g018
Figure 19. Experimental values of the magnetic field anomaly of the Carboneras Fault: intensity and direction registered by the on-ground equipment. Graph concerning the track corresponding to the overflight of the hypothesized lava dome.
Remotesensing 14 02039 g019
Figure 20. Interpretation of the area of study (the Carboneras Fault) as a northern area associated with the different Messinian sedimentary events, including the evaporites corresponding to the Messinian salinity crisis, which is flanked by the uplifted layer of Miocene tuff and breccia and flanked by the retreated sedimentary layer of the Plio–Quaternary. The synthetic field is calculated by the simplified model of a cylindrical dome of 250 m radius, with a susceptibility of χ = 10−2 SI and a natural remanent magnetization of (Mx, My, Mz) = (1, 0, 1.5) A/m.
Remotesensing 14 02039 g020
Figure 21. TAS diagram [58] showing the compositional ranges of Catalonian Volcanic Zone, Campo de Calatrava [60] and Cabo de Gata [61], together with in situ analysis of rocks on Mars [36,37,38,39,40,41,42,99] and Venus [51].
Remotesensing 14 02039 g021
Publisher’s Note: MDPI stays neutral with regard to jurisdictional claims in published maps and institutional affiliations.

