Article

Remotely Monitoring Vegetation Productivity in Two Contrasting Subtropical Forest Ecosystems Using Solar-Induced Chlorophyll Fluorescence

1
Key Laboratory of Poyang Lake Wetland and Watershed Research, Ministry of Education, School of Geography and Environment, Jiangxi Normal University, Nanchang 330022, China
2
Chongqing Jinfo Mountain Karst Ecosystem National Observation and Research Station, School of Geographical Sciences, Southwest University, Chongqing 400715, China
3
Hydrology and Water Resources Monitoring Center for Ganjiang River Upstream, Ganzhou 341000, China
4
College of Geography and Planning, Gannan Normal University, Ganzhou 341000, China
5
School of Geography and Planning, Sun Yat-Sen University, Guangzhou 510275, China
6
Key Laboratory of Watershed Geographic Sciences, Nanjing Institute of Geography and Limnology, Chinese Academy of Sciences, Nanjing 210008, China
*
Author to whom correspondence should be addressed.
Remote Sens. 2022, 14(6), 1328; https://doi.org/10.3390/rs14061328
Submission received: 8 February 2022 / Revised: 6 March 2022 / Accepted: 8 March 2022 / Published: 9 March 2022

Abstract

:
Subtropical forests can sequester a larger amount of atmospheric carbon dioxide (CO2) relative to other terrestrial ecosystems through photosynthetic activity and act as an important role in mitigating global climate warming. Compared with the model-based gross primary production (GPP) products, satellite-derived solar-induced fluorescence (SIF) opens a new window for quantification. Here, we used the remotely sensed SIF retrievals, two satellite-driven GPP products including MODIS (GPPMOD) and BESS (GPPBESS), and tower-based GPP measurements at two contrasting subtropical forests to provide a systematic analysis. Our results revealed that GPP and the associated environmental factors exhibited distinct seasonal patterns. However, the peak GPP values had large differences, with stronger GPP in the evergreen needleleaf forest site (8.76 ± 0.71 g C m−2 d−1) than that in the evergreen broadleaf forest site (5.71 ± 0.31 g C m−2 d−1). The satellite-derived SIF retrievals showed great potential in quantifying the variability in GPP, especially for the evergreen needleleaf forest with r reaching up to 0.909 (p < 0.01). GPPMOD and GPPBESS showed distinctly different performances for the two subtropical forests, whereas the GPP estimates by exclusive use of satellite-based SIF data promised well to the tower-based GPP observations. Multi-year evaluation again confirmed the good performance of the SIF-based GPP estimates. These findings will provide an alternative framework for quantifying the magnitude of forest GPP and advance our understanding of the carbon sequestration capacity of subtropical forest ecosystems.

1. Introduction

Earth’s climate has changed dramatically in the past century and will keep changing during the next few centuries. The IPPC AR6 report revealed that the global annual near-surface temperature has been rising steadily from the latter part of the 19th century and places the year 2020 as one of the three warmest years on record [1]. Such changes have exerted substantial effects on terrestrial ecosystem processes and functions [2,3], whereas human-induced activities, especially greenhouse gases emitted from fossil fuel combustion, contributed a lot to this warming [4,5]. Fortunately, as an important part of terrestrial ecosystems, forests make up 30% of the Earth’s land surface, which plays a crucial role in regulating atmospheric CO2 concentrations under the influence of both photosynthesis and respiration [6,7,8]. Essentially, the carbon sequestration potential of terrestrial forests is jointly affected by climate change and human-induced perturbation through land-use changes including deforestation and afforestation [9,10,11]. It is therefore imperative to accurately evaluate the dynamics of terrestrial forest carbon cycles in order to predict the feedback on Earth’s climate system.
With the development of the eddy covariance-based flux measurements (EC) in recent decades, the ongoing land–atmosphere carbon and water exchanges can be directly observed [12]. Currently, over 900 EC-based flux towers on the Earth are operated in the long run and jointly form the global network FLUXNET [13]. These sites are located in various ecosystems such as tropical and subtropical forests, temperate conifer and broadleaf (evergreen and deciduous) forests, croplands, wetlands, grasslands, and tundra. Forest flux sites occupy over a half of theFLUXNET2015 dataset. These EC-based carbon flux measurements (NEE) can be further separated into gross primary production (GPP) and ecosystem respiration (Re) through the daytime-based [14] approach and the nighttime-based [15] partitioning method. Nevertheless, these tower-based fluxes were generally observed at site-level with small areas (<1 km2), and long-term financial support is necessary to construct and maintain these instruments [16,17]. In order to quantify the spatial and temporal patterns of terrestrial GPP across large areas, these spatially sparse flux measurements need to be upscaled to spatially continuous estimates.
Various methods, including the satellite-based vegetation indices or leaf area index and process-based and light-use efficiency GPP models, were developed and compared to evaluate the spatio-temporal dynamics of vegetation productivity [18,19]. Despite that, large uncertainties still exist in these GPP estimates, owing to the model structure and different input data sets such as the fractional photosynthetically active radiation (FPAR) product, the potential error contributions from land cover classification and maximum light use efficiency (εmax) [20,21]. In recent years, satellite-based sun-induced vegetation chlorophyll fluorescence (SIF) observations, like the space-borne SIF retrievals of GOSAT [22], GOME-2 [23], and OCO-2 [24], have been recognized as a new proxy for vegetation GPP over various terrestrial ecosystems. Because of its inherent connection with photosynthesis, as well as the simple and robust relationship between SIF signals and GPP observations [25,26,27], these SIF products are crucial to examining the dynamics of ecosystems and responses to climatic change. Even so, the tremendous applicable values were severely constrained by such spatially sparse SIF signals from site to regional or global levels. A high-resolution, spatially contiguous global SIF product from space-borne SIF retrievals can fulfill the need for repeatedly and precisely quantifying vegetation productivity over different time and space scales [28,29], which can bridge the gaps between site-level EC-based flux towers and satellite-driven SIF data sets.
Subtropical forest ecosystems in southern China play a critical role in mitigating climate change from regional to even global scales due to the strong carbon fixation capability [30,31], and the main forest types are comprised of evergreen needleleaf forest and evergreen broadleaf forest depending on the contrasting tree species. Harris et al. [32] found that the tropical and subtropical forests sequestered more atmospheric CO2 emissions relative to the temperate and boreal forests (−8.6 vs. −4.4 and −2.5 Gt CO2 year−1, respectively). However, considerable uncertainties still exist in these satellite-derived GPP products. The study used two subtropical forest flux sites, jointly with the satellite-derived GPP estimates based on ecosystem process-based and light-use efficiency models as well as a new globally reconstructed SIF datasets, (1) to analyze the seasonal dynamics in site-level GPP observations, and the associated environmental controls across the two subtropical forest flux sites including evergreen needleleaf forest and evergreen broadleaf forest; (2) to develop an alternative method to predict the GPP dynamics by solely using the satellite-derived SIF retrievals via leave-one-out validation; and (3) to evaluate the model performance against satellite-based GPP products. All analyses will be helpful to enhance our understanding of the carbon cycles in the subtropical conifer and broadleaved forests.

2. Materials and Methods

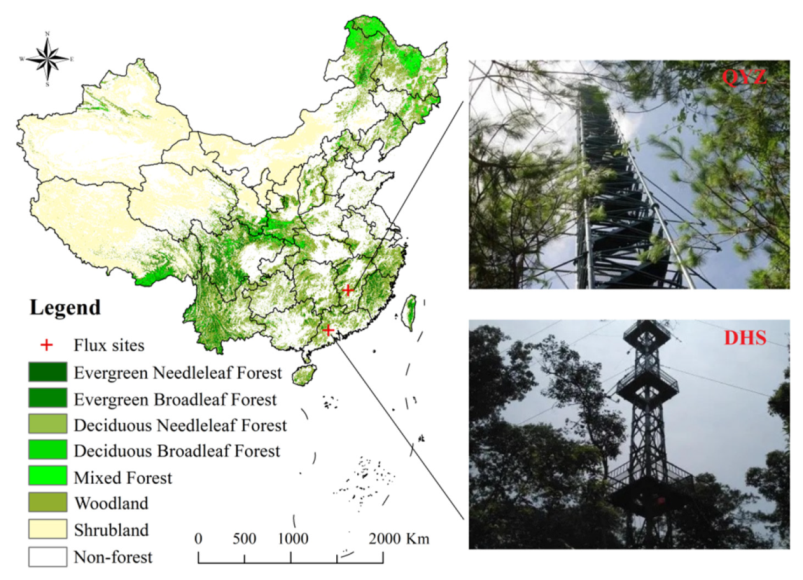
2.1. Description of the Flux Sites

As illustrated in Figure 1, the study used two forest sites with long-term continuous flux measurements to represent the typical evergreen needleleaf forest and evergreen broadleaf forest in the subtropical humid region of Southeast China, which also belonged to Chinese Terrestrial Ecosystem Flux Research Network (ChinaFLUX). Both sites started to continuously measure the long-term CO2 and H2O fluxes from autumn 2002 via the EC-based method.
The Qianyanzhou (QYZ) Ecological Research station (115°03′29.2″ E, 26°44′29.1″ N) is located in Jiangxi Province on the typical red-soil hilly area in the mid-subtropical monsoon climate region with planted coniferous forests. The terrain of the underlying surface is gentle, with the slope gradient ranging from 2.8° to 13.5°. Multi-year mean temperature, precipitation, and relative humility at this site are 17.8 °C, 1471.2 mm, and 84%, respectively [33,34]. The soil type is comprised of red soil, fluvo-aquic soil, paddy soil, and meadow soil, and the parent materials generally include rotten rock, mudstone, glutinite, and river alluvium. Coniferous forests planted inabout 1985 are the dominant vegetation type. The major tree species consist of masson pine, splash pine, and cedarwood, with some Schima superba andorange. The canopy is nearly close with evergreen vegetation occupying approximately 76% of total land area.
The Dinghushan (DHS) flux site (112°32′3.8″ E, 23°10′24″ N) is situated in the evergreen broadleaf forest, in the kernel area of the Dinghushan Biosphere Reserve, Guangdong Province, within the southern subtropical region. This site has abundant resources of radiation, heat, and rainfall. Multi-year mean temperature, precipitation, and relative humidity are 20.9 °C, 1956 mm, and 82%, respectively [35,36]. The terrain is basically flat, especially in the prevailing northeast wind direction. The soil type is mostly lateritic, and a humus layer is covered. Monsoon evergreen broadleaf forest is the typical vegetation, with the dominant species of Castanopis chinensis, Schim asuperba, Cryptocarya chnensis. The stand is about 400 years old, with complicated forest structure including six layers, namely, three sub-layers of arbor, sapling shrub layer, herbaceous seedling layer, and interlayer plant layer. The mean canopy height is about 17 m, and the leaf area index (LAI) spans from 3.8 to 4.2 m−2 m−2 [37].

2.2. Data Processing of the EC-Based Fluxes

As an indispensable part of the global-scale long-term network of micrometeorological flux observations, ChinaFLUX addressed to reveal the variability in land–atmosphere carbon and water fluxes, as well as the underlying mechanisms controlling it [38,39]. In this study, the EC-based flux measurements between 2003 and 2010 at the two subtropical forest flux sites (QYZ and DHS) were used for analysis. At these flux sites, the eddy covariance system together with an automatic meteorological station (AWS) were mounted and continuously observe the site-scale net carbon exchanges (NEE) and the related meteorological data. These synchronously observed climate data consisted of near-surface air temperature (Ta), solar radiation (Rg), soil temperature and water content (Ts and SWC), relative humidity, vapor pressure deficit (VPD) and the amount of precipitation (P). The open-path EC system contains two sensors including a fast response infrared CO2/H2O gas analyser (Li-7500, LI-COR Biosciences, NE, USA) and a 3-D sonic anemometer (CSAT3, Campbell Scientific, UT, USA). The raw data are sampled at the frequency of 10 Hz by the data logger (CR5000, Campbell Scientific, UT, USA). Then, the procedures including spike detection and despiking, two-dimensional coordinate rotation, time delay removal of H2O and CO2, virtual temperature correction, density effects (WPL correction) and frequency response corrections were completed to produce a half-hour flux dataset [40,41]. More details about the processing procedures can be seen in Tang et al. [42].
Furthermore, owing to the power failure, instrument malfunctions, and severe weather conditions, a few flux observations were lost. These gaps were interpolated with a standardized algorithm developed by ChinaFlux [40,41]. Meanwhile, these site-level NEE measurements were separated into GPP and Re using a short-term temperature dependent method [15,43]. The R-based software (REddyProc, MPI, Jena, Germany) developed by the Max Planck Institute (MPI) for Biogeochemistry was applied to complete the gap-filling and flux partitioning procedures [44]. Finally, the half-hourly GPP data were processed into the daily time scale and averaged over each 8-day period to match the composites of satellite-based SIF and GPP products.

2.3. SIF Data Set

The space-borne SIF observation offers the possibility to accurately quantify terrestrial ecosystem productivity. Recent research by Sun et al. [26] and Li et al. 2018 [45] proved that the satellite-derived SIF retrievals from the NASA’s Orbiting Carbon Observatory-2 (OCO-2) have become an alternative proxy for vegetation GPP across multiple spatial and temporal scales. Nevertheless, the tremendous applicable values were severely constrained by the spatially-sparse nature of OCO-2 data, particularly for regional and global scales. Thus, this study used a newly released global contiguous SIF product with the spatial resolution of 0.05 degree and temporal resolution of 8 days (GOSIF V2, http://globalecology.unh.edu, accessed on 20 October 2021). These SIF retrievals were derived from OCO-2, MERRA-2, and MODIS data sets and agreed well with the site-level GPP observations from more than 90 flux sites spanning various vegetation types. The GOSIF product exhibits amounts of advantages such as better spatial resolution, longer observation periods, and spatially continuous coverage in comparison to the coarse-resolution SIF product directly from discrete SIF signals. More descriptions of the features on the GOSIF data can be found in Li & Xiao [28]. Here, we used the GOSIF time series between 2003 and 2010 to extract the SIF retrievals at the two subtropical forest flux sites and explore its potential to capture the variability in site-level GPP.

2.4. MODIS GPP Data

The study used the satellite-driven MOD17A2 GPP data (V6) based on the concept of a light use efficiency model for comparison, which has been widely used to repeatedly monitor global vegetation conditions, as well as the associated carbon sequestration potentials [46], and as inputs to terrestrial land surface models to infer the energy and ecohydrological processes [17]. The satellite remote-sensing-based vegetation-related dynamic input data of the model used the MOD15A2H data set, including the composite of photosynthetically active radiation (FPAR) and leaf area index (LAI) for 8-day periods. The missing data owing to cloudiness in this product are gap-filled according to the MODIS quality assessment (QA) data layers. Meanwhile, the model used the meteorological data from 6-h National Center for Environmental Prediction/Department of Energy (NCEP/DOE) reanalysis II products to drive the algorithm. The relevant Biome Property Look-up Tables (BPLUT) were also updated across the plant functional types. Currently, these GPP products have several time scales including 8-day, monthly, and annually, and this study used the 8-day mean values, which can be accessed through the website https://lpdaac.usgs.gov/products/mod17a2hv006/ (accessed on 20 October 2021).

2.5. BESS GPP Product

The Breathing Earth System Simulator (BESS) algorithm used seven MODIS-driven atmosphere and land data, four different satellite products, four reanalysis data, and three ancillary input data sets to produce global-scale GPP products. As an ecological process-based model, the modules including atmosphere and canopy radiative transfer algorithm, canopy photosynthesis algorithm, transpiration algorithm, and energy balance algorithm were coupled together [47]. The coupled carbon–water module composed of Farquhar’s algorithm for biochemical photosynthetic pathways such as C3 and C4 plants, a two-leaf canopy radiative transfer algorithm, and the quadratic Penman–Monteith model is integrated to quantify terrestrial GPP for sunlit and shade canopy by iterative steps. Jiang & Ryu [48] improved the model algorithm and evaluated BESS GPP against FLUXNET 2015 dataset with MPI-BGC product across multiple spatio-temporal scales. The performance has also been evaluated by previous research [21,49]. Now, the global BESS GPP dataset between 2000 and 2015 with 1 km spatial resolution for 8-day periods can be accessed at the Ecological Sensing Artificial Intelligence (AI) Laboratory at the Soul National University (the website: http://environment.snu.ac.kr/, accessed on 22 October 2021).

2.6. Statistical Analysis

In total, 16 site-years of flux measurements at the two contrasting subtropical forest sites were used to explore the main environmental factors determining the dynamics in GPP of the evergreen needleleaf forest and evergreen broadleaf forest. The Pearson correlation coefficients (r) jointly with relevant p-value between these in situ GPP measurements, and the vegetation and climate-related factors including SIF, Rg, Ta, VPD, and P were calculated. When the r value is close to 1, a strong positive linear relationship is indicated when it passes the significance test (p < 0.01).
Then, this study aimed to develop an alternative method to retrieve GPP by exclusive use of satellite-based SIF data and evaluated its performance against satellite-based MODIS and BESS GPP products. Here, we used the leave-one-out cross-validation approach to test the reliability and robustness of the developed model. For each forest type, there were a total of 8 years of GPP measurements. One year of the GPP observations were withheld successively as a testing dataset, and then the data from the remaining seven years were used as training samples for model development. Then, we compared the model-estimated GPP including the SIF-based GPP (GPPSIF), MODIS GPP (GPPMOD), and BESS GPP (GPPBESS) with the tower-measured GPP, respectively.
Two widely used indicators including the coefficient of determination (R2) and the root mean square error (RMSE) were used to assess the model’s performance. The equations of R2 and RMSE are as follows:
R 2 = 1 ( y y ) 2 y 2
R M S E = ( y y ) 2 n  
where y and y represented the observed and predicted values of GPP; n is the total number of observations (eight-day periods). Generally, the optimal GPP estimates had the largest R2 and least RMSE. In this study, all statistical analyses are implemented by SPSS 19.0 (IBM, Chicago, IL, USA). When the tower-measured and model-estimated GPP regression was close to the 1:1 line, it indicated a high precision of the model estimation. However, the scatter plots between site-level GPP and modeled GPP can only reflect the overall consistency. Thus, in order to examine the performance of the modeled GPP over time, this study also compared the seasonal consistency between tower-based GPP observations (GPPEC) at the two subtropical forest flux sites and three different satellite-based GPP products.

3. Results

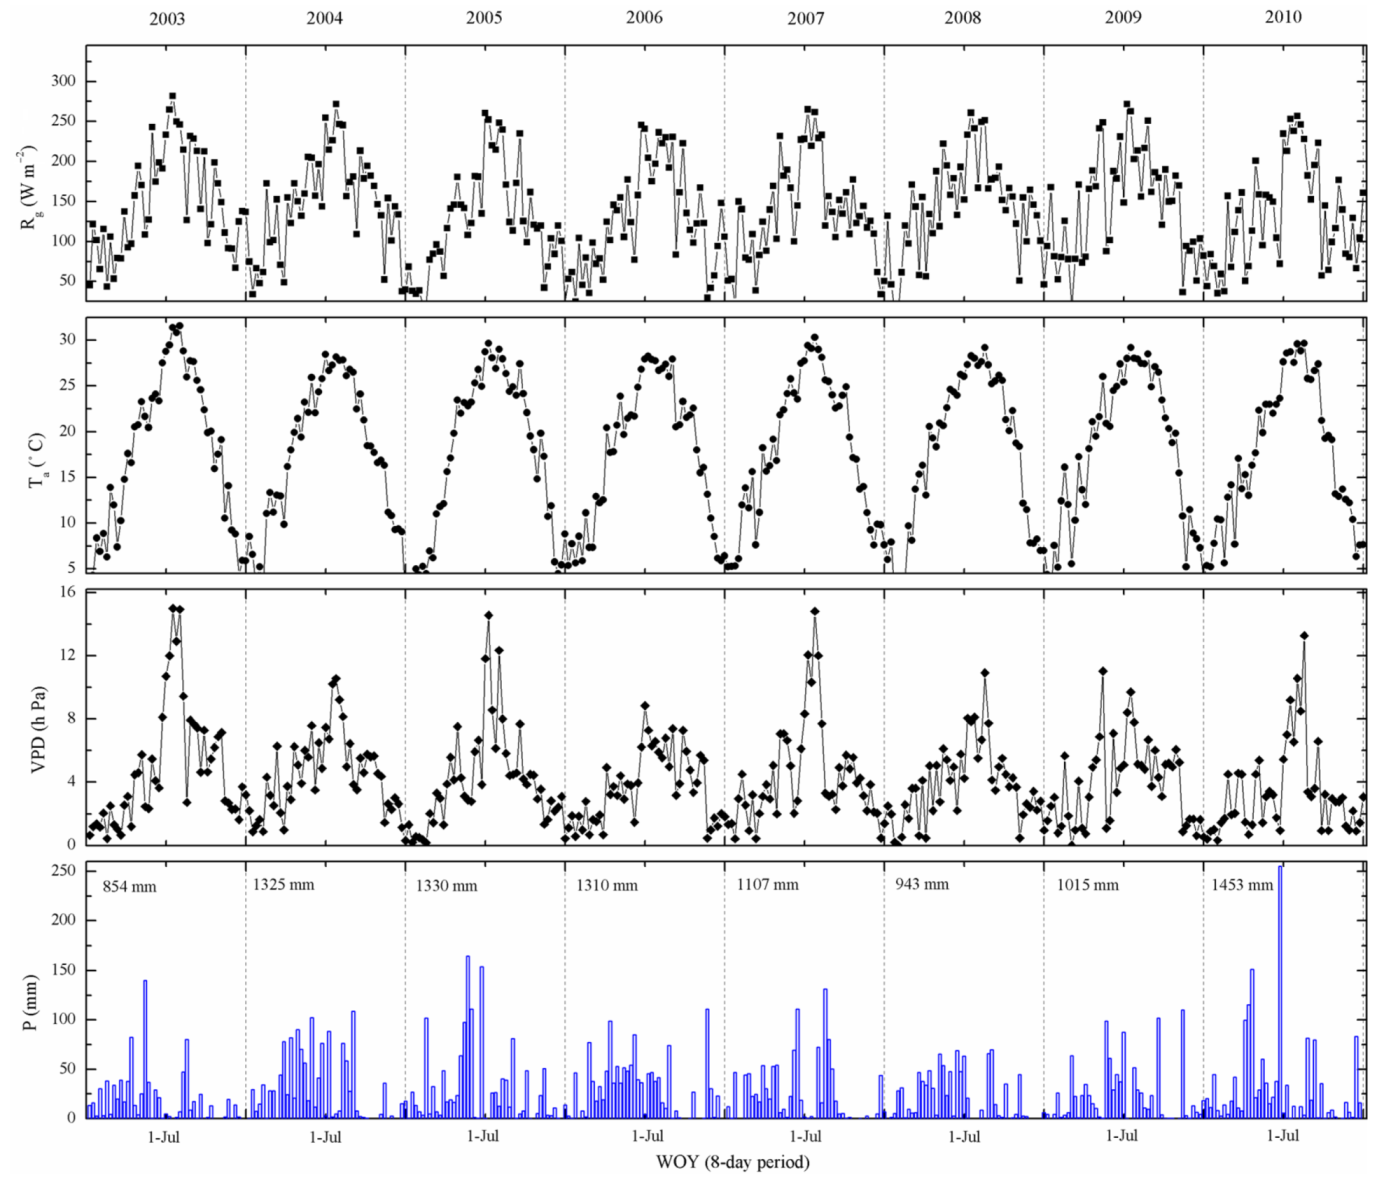
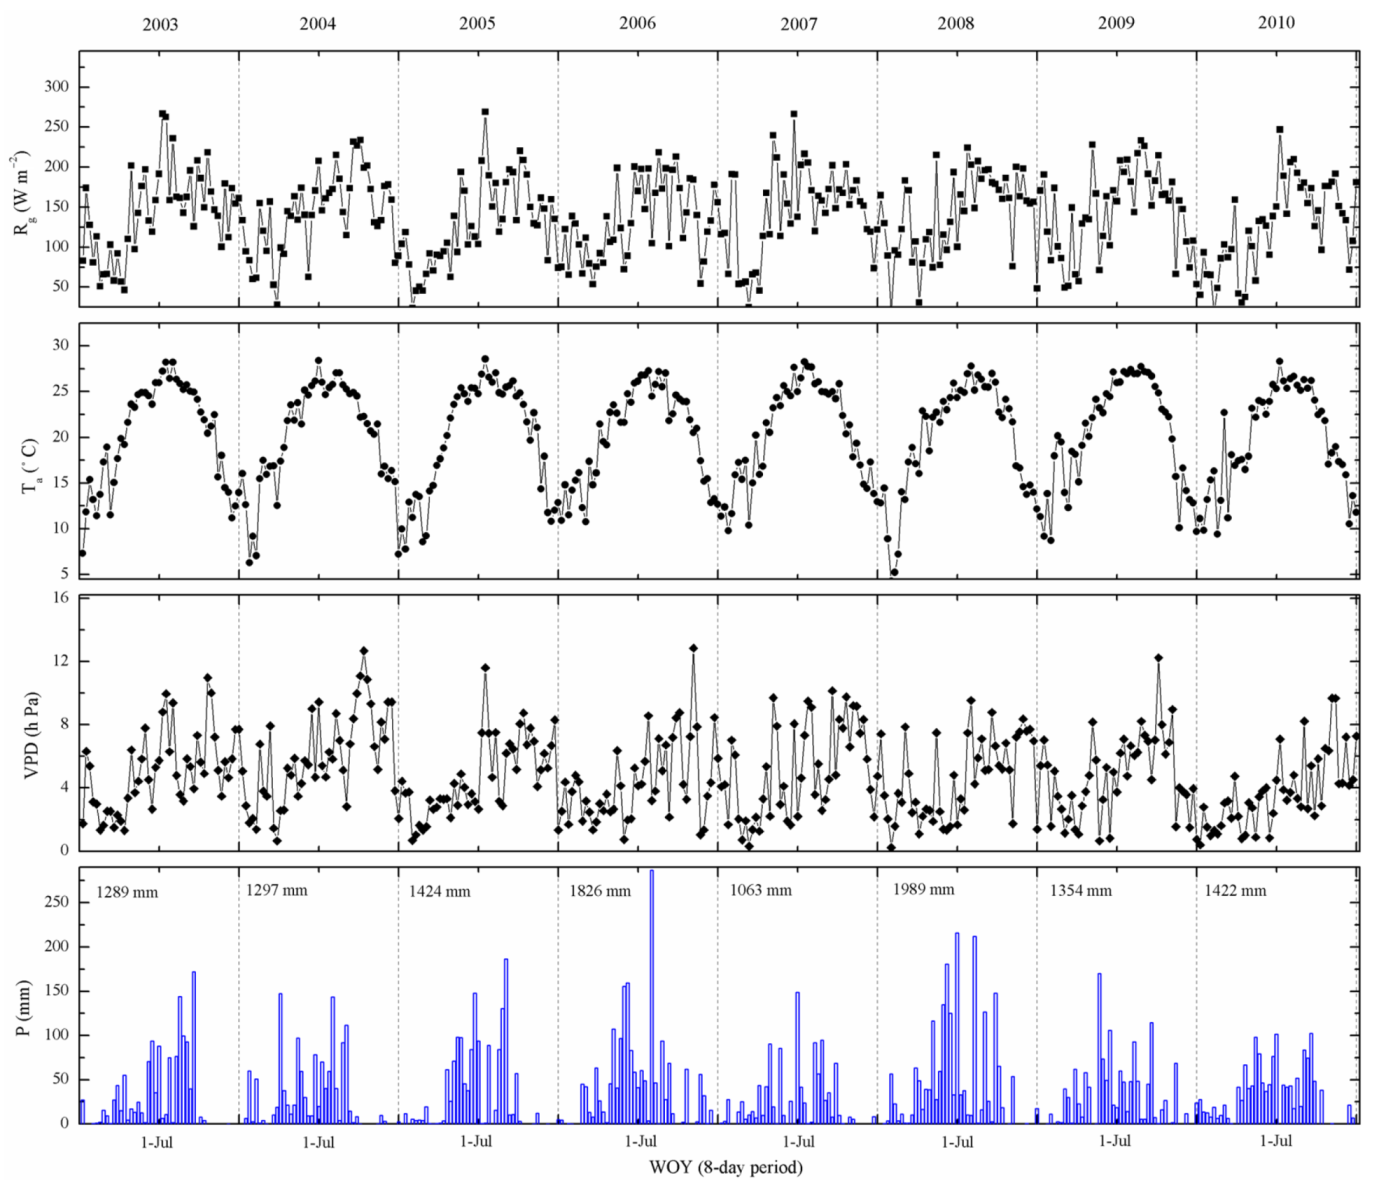
3.1. Dynamics in GPP as Well as Environmental Factors

Seasonal variations in site-level GPP and climate-related factors including Rg, Ta, VPD, and P across the two contrasting subtropical conifer and broadleaved forest ecosystems are illustrated in Figure 2, Figure 3 and Figure 4. For each forest type, a total of 8 years of flux observations was used for analysis. It implied that the GPP of both the QYZ and DHS sites showed apparent single-peak patterns. As the temperature rose in springtime (Figure 3), GPP enhanced increasingly with the plant growth status, peaked in summertime, and decreased again in autumn. However, the peak timing appeared earlier in the evergreen needleleaf forest at the end of June or early July, by comparison with the evergreen broadleaf forest during about middle to late July. In addition, the peak values of GPP had large differences, with larger photosynthetic carbon fixation potential at the QYZ site (8.76 ± 0.71 g C m−2 d−1) than that at the DHS site (5.71 ± 0.31 g C m−2 d−1). The distribution of rainfall is mainly concentrated in summer with large fluctuations throughout the measurement period (Figure 3). As a proxy for plant water stress, the VPD of the QYZ site also showed distinct seasonal dynamics, whereas the VPD of the DHS site fluctuated severely around the year.
Table 1 compared the correlations between these site-level GPP observations and the environmental factors including Rg, Ta, VPD, and P at the two subtropical forest flux sites, respectively. It revealed that, except P, almost all variables strongly affected the dynamics in forest GPP. In the evergreen needleleaf forest, GPP was proven to exert a stronger influence by Ta (r = 0.908), followed by Rg and VPD of 0.855 and 0.793, respectively. Contrastingly, Rg was the dominant environmental factor of GPP in the evergreen broadleaf forest (r = 0.79). Then, both VPD and Ta also strongly and positively affected the variability in GPP with similar correlations of 0.677 and 0.655, respectively.

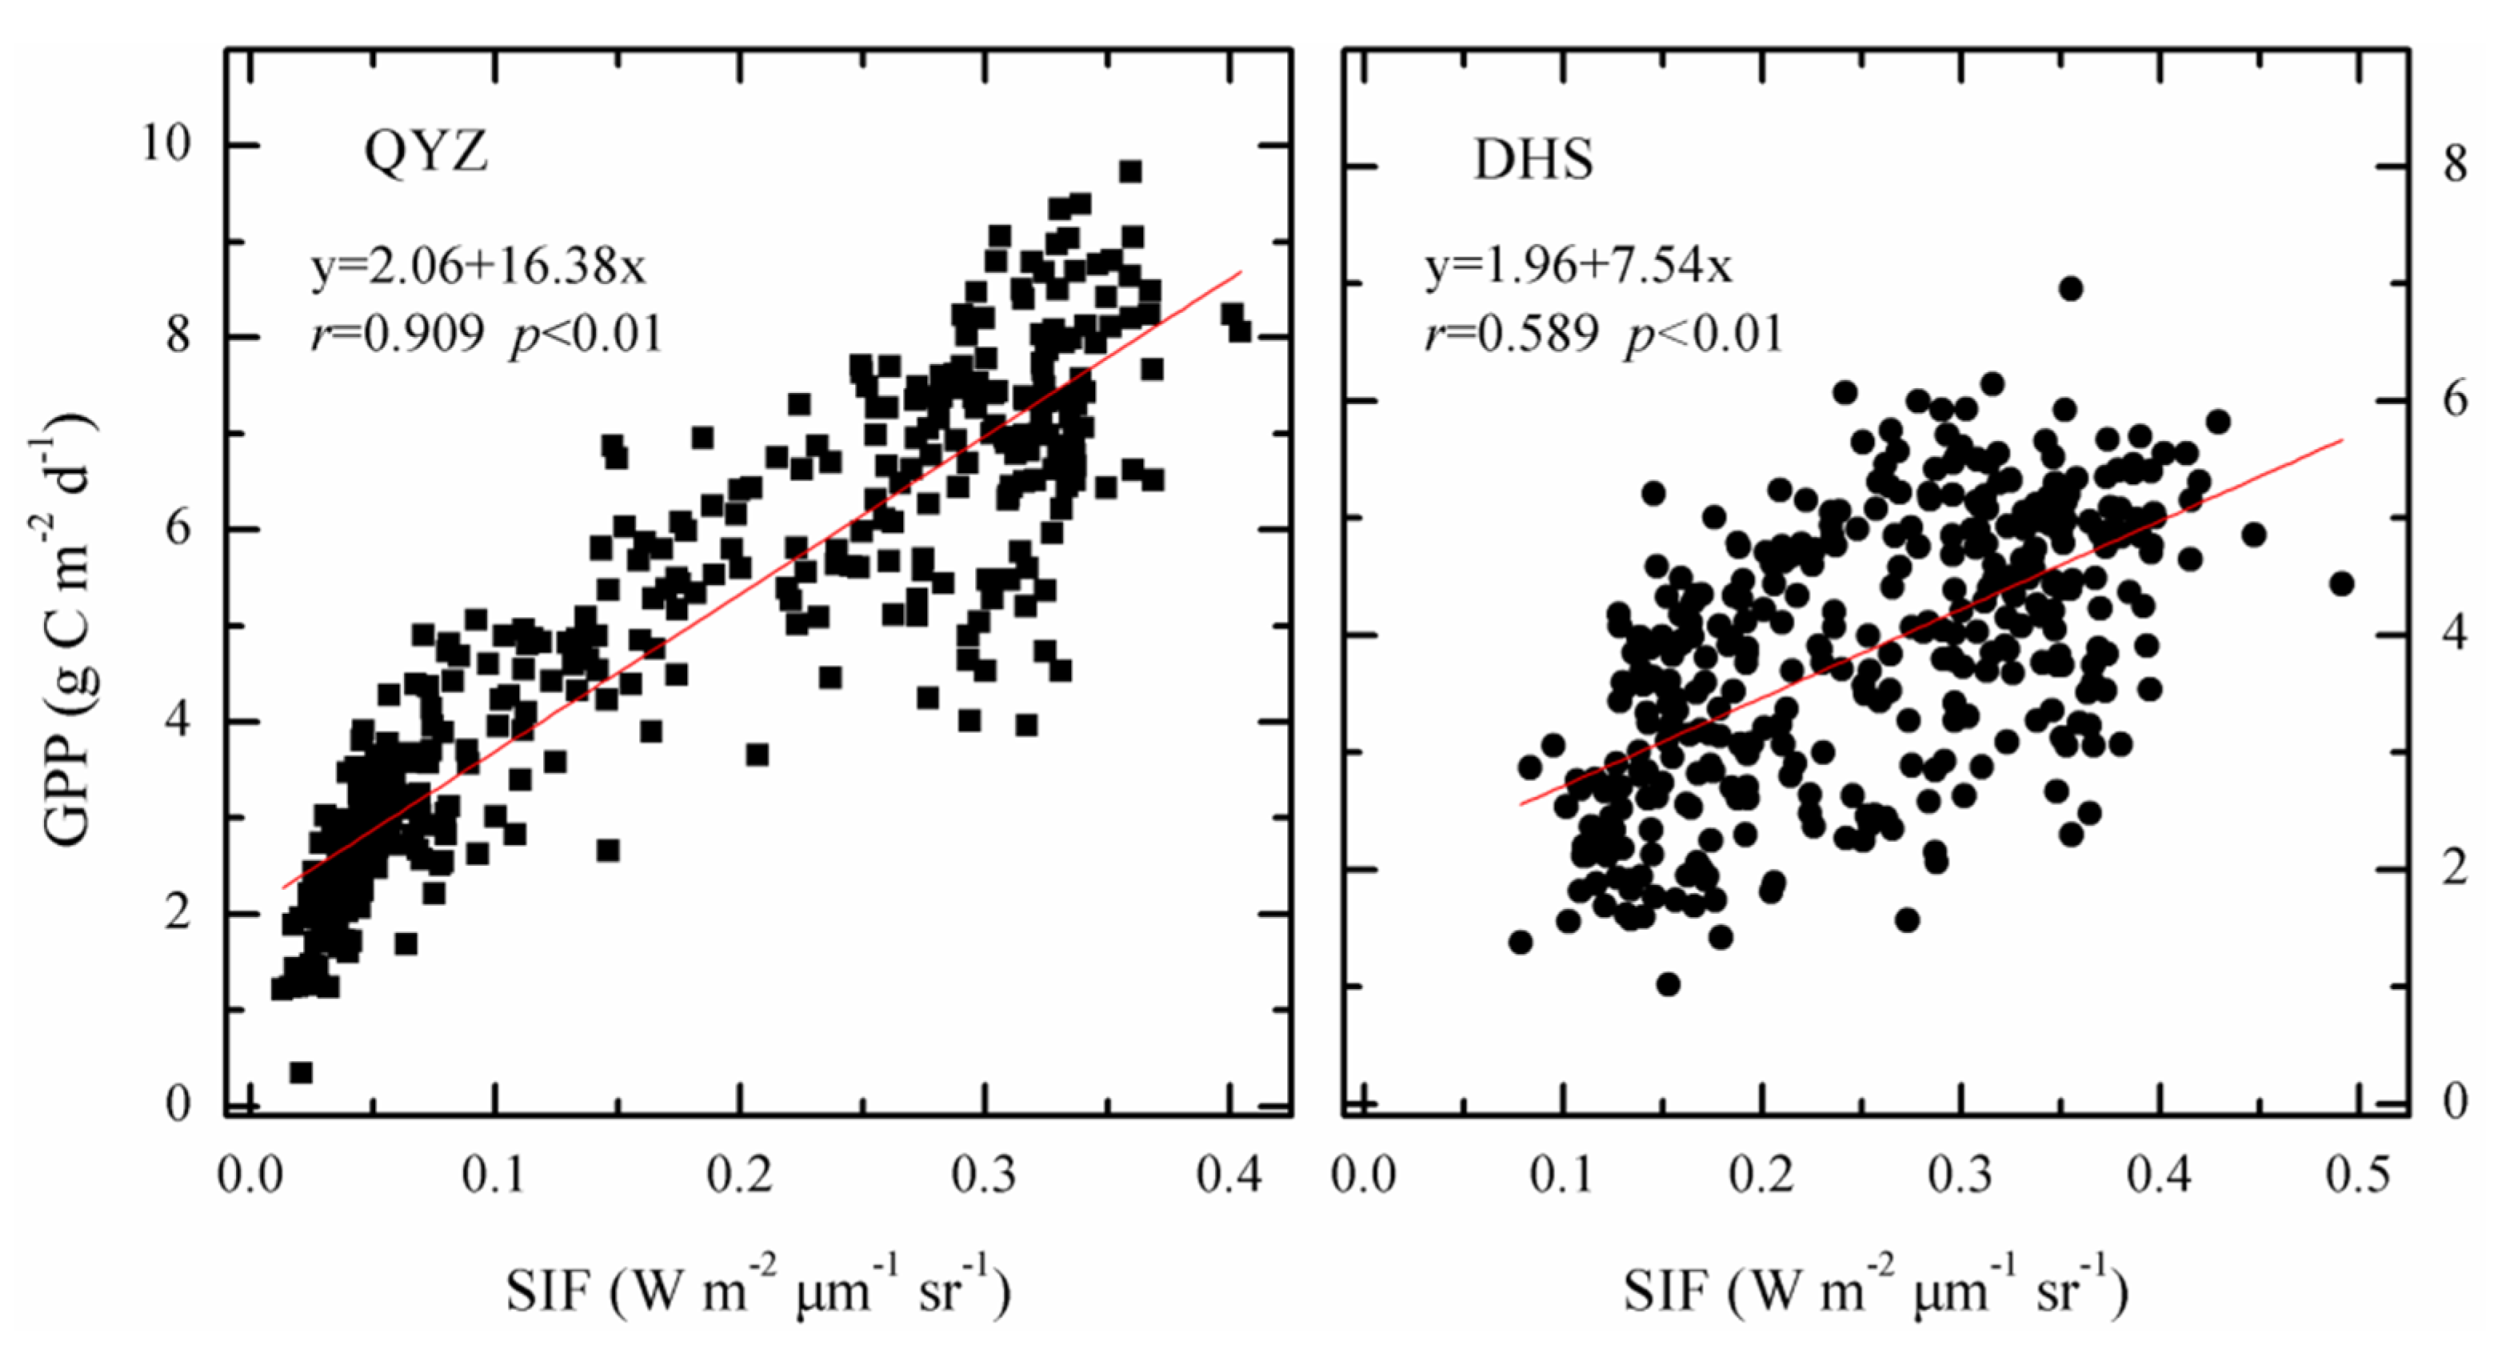
3.2. Model Development by Exclusive Use of SIF Data

The study also examined the relationships between these 8-day tower-based GPPs and the associated SIF products at the two subtropical forest sites. As shown in Figure 5, the GPP at both the QYZ and DHS sites exhibited strong correlations to these satellite-derived SIF retrievals, revealing the great potential to monitor the dynamics of GPP by the remote-sensing-based SIF technique. The correlation between GPP and SIF reached up to 0.909 (p < 0.01) in the evergreen needleleaf forest. Although the r value was slightly lower (r = 0.589) in the evergreen broadleaf forest, it also exhibited a strong linear relationship with SIF.
On this basis, the work proposed the models for quantifying the seasonal dynamics of GPP at the two subtropical forest ecosystems by exclusive use of satellite-based SIF data. Then, this study evaluated the model-estimated GPP performance using the in situ measured GPP through leave-one-out cross-validation method (Table 2). At the evergreen needleleaf forest, the regressions of site-level GPP observations and GPP estimates in the cross-validation implied R2 changed between 0.75 and 0.94, and the associated RMSE values varied from 0.71 to 1.11 g C m−2 d−1 for the GPP estimates by withholding years. Meanwhile, R2 changed between 0.28 and 0.61, and the associated RMSE values varied from 0.80 to 1.03 g C m−2 d−1 for the GPP estimates by withholding years at the evergreen broadleaf forest. For all site-years measurements, the regression of in situ measured GPP and the estimated GPP in the cross-validation implied that R2 = 0.82 and RMSE = 0.93 g C m−2 d−1 at the QYZ site (Figure 6a), and R2 = 0.35 and RMSE = 0.95 g C m−2 d−1 at the DHS site (Figure 6b). As illustrated in Figure 6, the scatterplots between GPP observations and GPP estimates were close to the 1:1 regression line, demonstrated by the great performance of such SIF-based method.

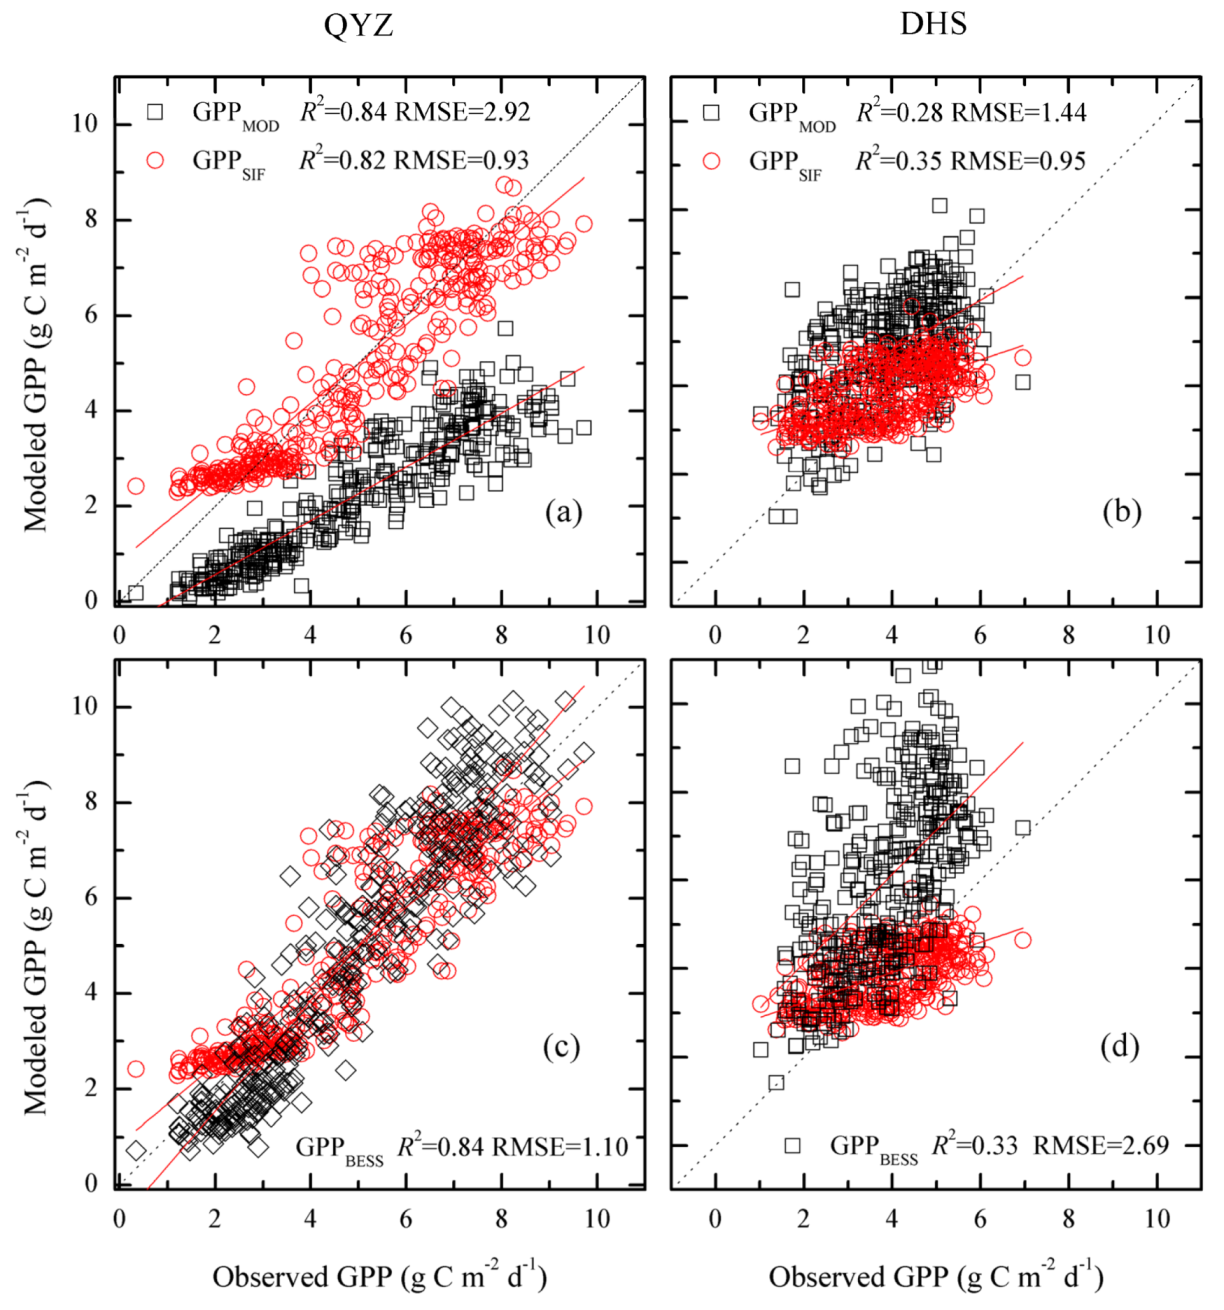
3.3. Model Performance against Satellite-Based GPP Products

Furthermore, this study evaluated the model performance (GPPSIF) against satellite-based GPP products including MODIS GPP (GPPMOD) and BESS GPP (GPPBESS) across the two subtropical forests (Figure 6, Figure 7 and Figure 8). Overall, among these GPP estimates, GPPSIF exhibited the optimal performance in promising the variability in site-level GPP observations. However, GPPMOD and GPPBESS showed distinctly different performances for the evergreen needleleaf forest and evergreen broadleaf forest, respectively. As illustrated in Figure 6 and Figure 7 at the QYZ site, GPPMOD consistently underestimated the tower-measured GPP with large discrepancies (Figure 6a; RMSE = 2.92 g C m−2 d−1), whereas GPPBESS agreed well the variability in the measured GPP with RMSE of 1.10 g C m−2 d−1 (Figure 6c). As illustrated in Figure 6 and Figure 8 at the DHS site, GPPBESS severely overestimated the tower-measured GPP in the evergreen broadleaf forest with RMSE of 2.69 g C m−2 d−1 (Figure 6d), whereas GPPMOD provided slightly better estimates (Figure 6b; RMSE = 1.44 g C m−2 d−1). Nevertheless, this study also found that GPPSIF seemed unable to capture the dramatic decline in the coniferous site in summer.

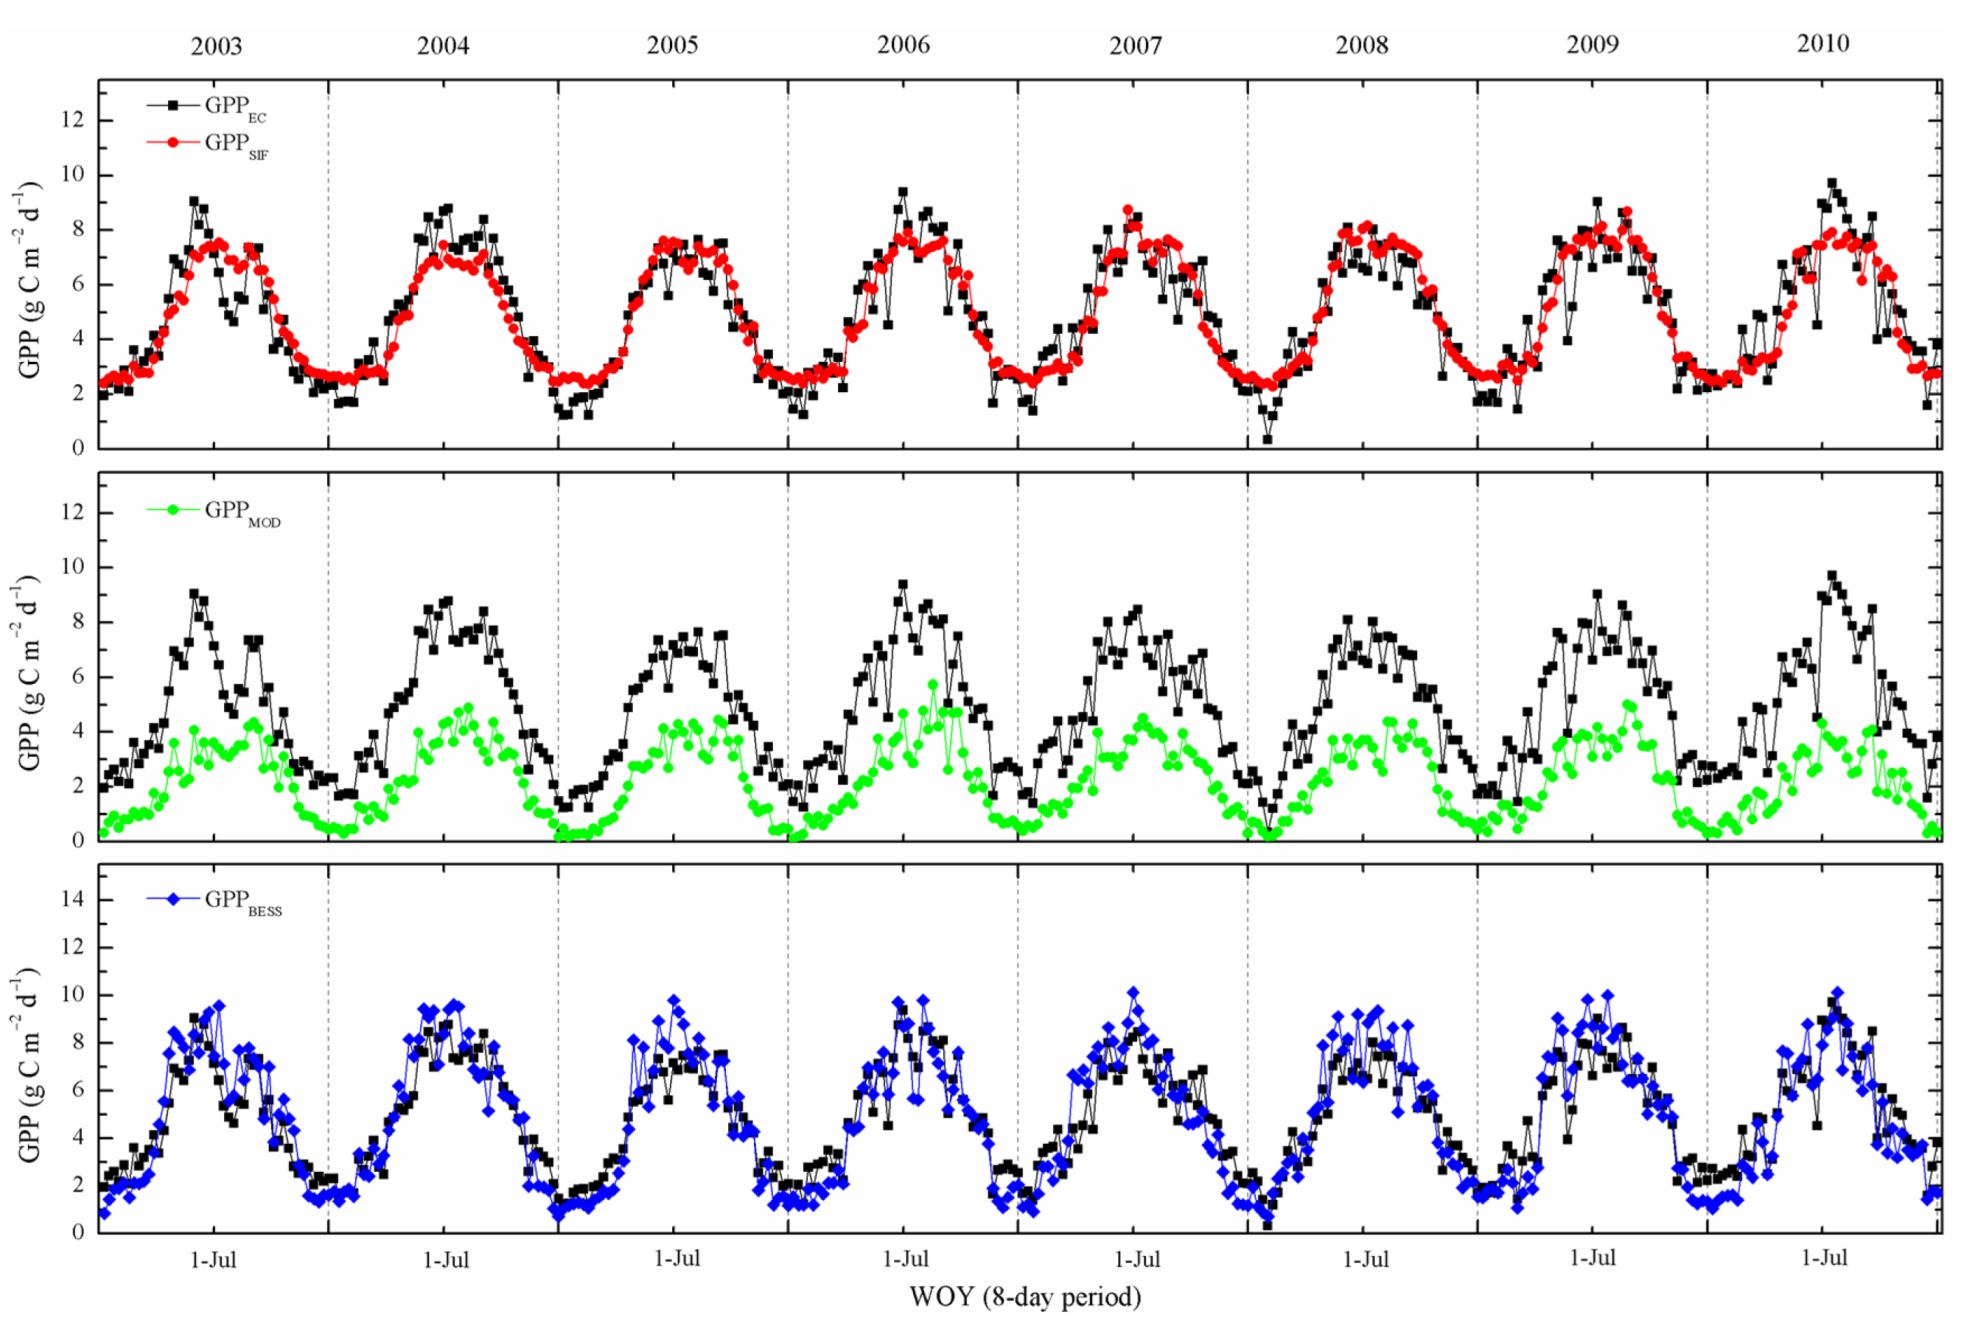
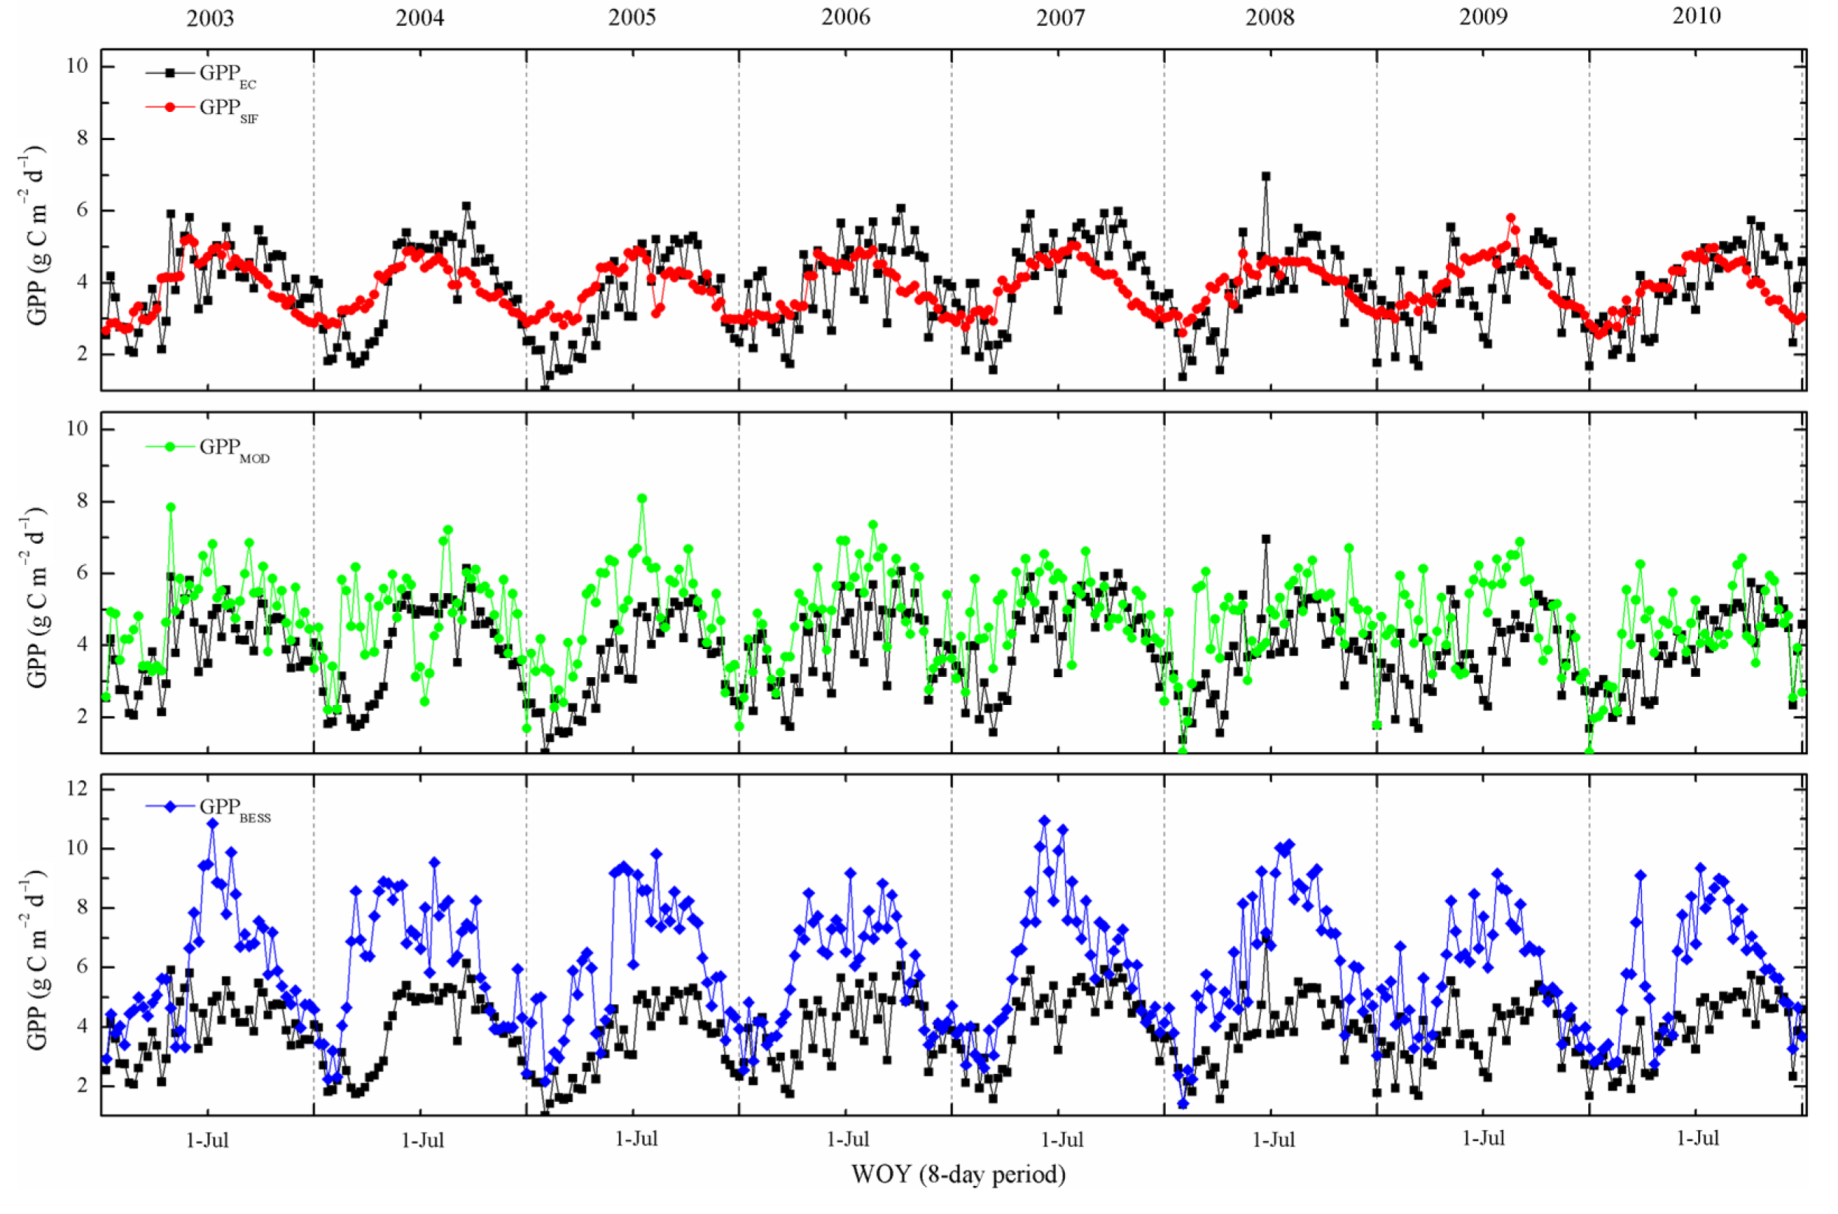
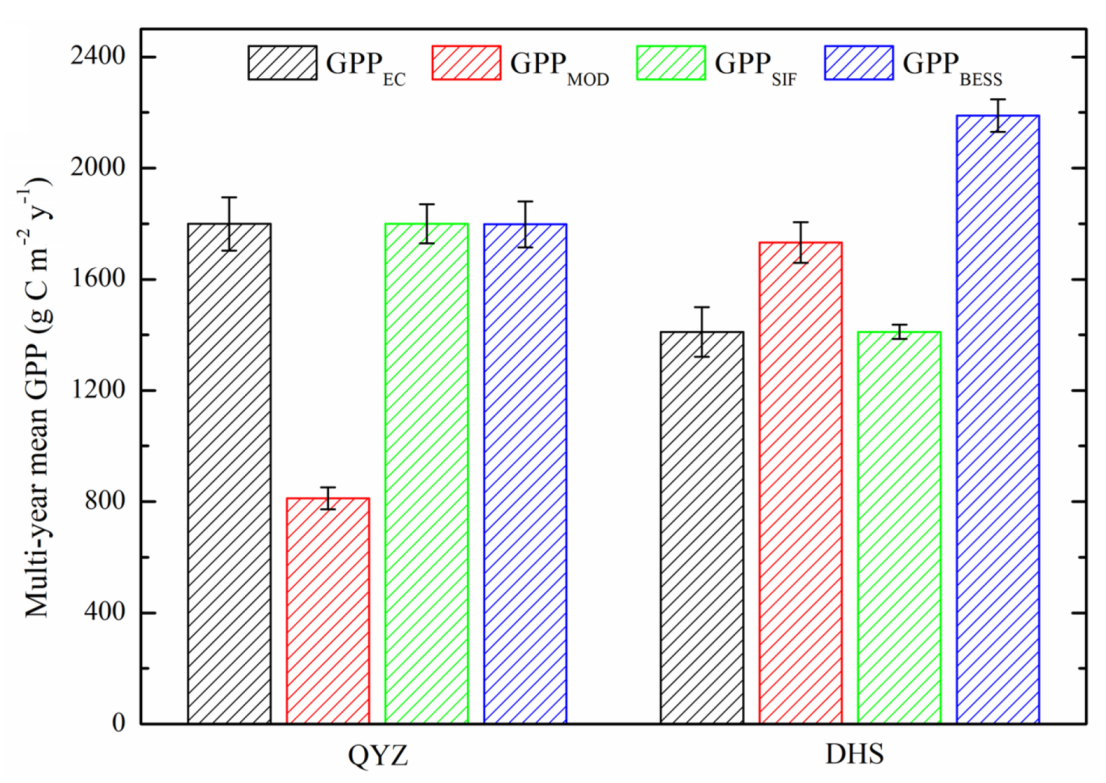
3.4. Yearly Evaluation of GPP

As illustrated in Figure 9, the study work examined the multi-year mean tower-based GPP observations (GPPEC) and three different satellite-based GPP products including the GPPSIF, GPPMOD and GPPBESS at the two subtropical forest flux sites. At the evergreen needleleaf forest site, multi-year mean tower-measured GPP was 1799 ± 95 g C m−2 y−1, which was over twice of the estimate by GPPMOD (812 ± 39 g C m−2 y−1), and close to the estimates by GPPSIF (1800 ± 70 g C m−2 y−1) and GPPBESS (1795 ± 83 g C m−2 y−1). At the evergreen broadleaf forest site, multi-year mean tower-measured GPP was 1411 ± 89 g C m−2 y−1, which was quite close to the estimate by GPPSIF (1415 ± 26 g C m−2 y−1), whereas GPPMOD and GPPBESS exhibited a larger overestimation by about 22.8% and 55.0%, respectively. All analysis again confirmed the good performance by the SIF-based GPP estimates.

4. Discussion

Climate-induced issues must be mitigated by diverse stakeholders such as the policymakers, investors, companies, scientists, and the public [32]. In response to the changing climate, currently, more and more governments are implementing their aims to combat global climate warming [50]. In the fall of 2020, the Chinese government also made a specific target to reach its carbon peak by 2030 and then realizing carbon neutrality by 2060. Carbon neutrality means that one region or country gradually achieves net-zero CO2 emissions by adopting diverse management measures. Terrestrial vegetation GPP represents the largest carbon flux amongst global carbon cycles and supplies important ecosystem services for human society [51,52]. Both the Paris Agreement and the IPCC reports admitted that the targets of climate change mitigation could not be realized without the important role of terrestrial forests, whereas the rate of contribution by forests in reducing atmospheric greenhouse gas concentrations remains a challenge [53,54].
The traditional vegetation monitoring from the satellite-based Earth observation (EO) technique is usually constrained by the vegetation structure and the sensitivity to aboveground biomass density, especially for the complicated forest ecosystems [55,56,57], leading to the spatial pattern and long-term changes of forest GPP being poorly understood. Vegetation GPP can be quantified using satellite remote sensing and ecological models, but Tang et al. [42] revealed that the widely used MODIS product was unable to capture the long-term dynamics of global karst ecosystem GPP. In this study, the contrasting performance of the MODIS GPP and BESS GPP products were revealed when monitoring GPP of the evergreen needleleaf forest and evergreen broadleaf forest (Figure 6). MODIS GPP exhibited better performance in the broadleaved forest (Figure 6b), whereas a large underestimation was found for the coniferous forest (Figure 6a). Wang et al. [20] systematically evaluated the latest MODIS GPP products across multiple biomes using global eddy covariance flux data and revealed that the εmax of MOD17A2H have the largest underestimation reaching up to 31% for the evergreen needleleaf forest. In contrast, BESS GPP showed better performance in the coniferous forest (Figure 6c), which was consistent with the results by Lin et al. [58], with the R2 and RMRE being 0.76 and 1.66 g C m−2 d−1, respectively, for the evergreen needleleaf forest, and R2 and RMRE being 0.35 and 2.45 g C m−2 d−1, respectively, for the evergreen broadleaf forest.
Fortunately, scientists found that when vegetation chlorophyll is exposed to solar radiation, SIF will be emitted as a by-product of vegetation photosynthesis activity, which is different from the reflectance-based biophysical parameters. The satellite-based sun-induced fluorescence technique has been developed in recent years and recognized as a rapidly advancing front on the terrestrial vegetation science [26,59]. SIF showed more advantages in monitoring terrestrial GPP by comparison with other remotely sensed indicators such as vegetation indices. Because SIF is related to both the amount of absorbed photosynthetic active radiation (APAR) as well as the efficiency of APAR used to carry out photosynthesis [60], satellite SIF retrievals thus have great potential to monitor photosynthetic activity, which has also been confirmed by our study (Figure 5 and Figure 6). Nevertheless, the spatial scale mismatch between the actual flux tower footprint and the pixel of GOSIF product used in the comparisons is an issue. The coarse spatiotemporal sampling and low signal-to-noise ratio of the raw SIF data hamper their application over small or fragmented ecosystems. Fortunately, with the development of satellite SIF observations, TROPOMI within the TROPOSIF project funded by the European Space Agency can provide daily global measurements at a much denser spatial and temporal sampling than earlier satellite instruments. Recently, a new global SIF dataset between May 2018 and April 2021 was produced [61], which could reduce the uncertainty of scale mismatch to a certain extent. Although this study developed the accurate SIF-based models to capture the variability in tower-based GPP, more forest flux sites across different climate zones and stand age structures are necessary to enhance the empirical model’s robustness. In addition, a recent study [59] revealed that extreme weather events such as heatwave broke down the linearity between SIF and GPP of evergreen broadleaved trees. As illustrated in Figure 7, this work also found that the SIF lacked sensitivity to the influence of summer drought in 2003 on forest GPP in the QYZ site. However, the process-based BESS GPP captured the dramatic decline.
Multi-year mean GPP observations in the subtropical conifer and broadleaved forests in the study reached up to 1799 ± 95 g C m−2 y−1 and 1411 ± 89 g C m−2 y−1, respectively, which were apparently larger than that of the boreal black spruce (812 g C m−2 y−1) and Scots pine forest (about 1000 g C m−2 y−1) [62,63]. Recent work has also implied that the implementation of a series of afforestation and reforestation programmes could significantly increase vegetation cover condition and enhance the vegetation carbon sequestration capacity [42,64]. Alternatively, deforestation could severely reduce the forest coverage, as well as the carbon fixation [65]. However, the explicit effect of various human-induced activities on regional or global carbon budget remained unclear. Our study provided a new framework to quantify the magnitude and dynamic of forest carbon fixation.

5. Conclusions

In sum, the present study exhibited the strong linear GPP–SIF relationships across the two subtropical forest ecosystems and great potential to track the variability in tower-based GPP by solely using the satellite-derived SIF product. Compared with two widely-used MODIS and BESS GPP products, the SIF-based GPP estimates showed better performance at the seasonal and annual time scales. The results can help improve our understanding of the carbon cycles in the subtropical forests and pave a novel way toward monitoring GPP accurately for evaluating climate change mitigation performance.

Author Contributions

G.L.: formal analysis, investigation, data curation, writing; Y.W. (Yisong Wang) and X.T. (Xingqing Tong): methodology and resources. Y.C.: conceptualization and methodology. Y.W. (Yuandong Wang) and J.X.: reviewing and editing. X.T. (Xuguang Tang): reviewing and funding. All authors have read and agreed to the published version of the manuscript.

Funding

This study was jointly supported by the National Natural Science Foundation of China (41961004 and 42161019) and Key Laboratory of Watershed Geographic Sciences, Nanjing Institute of Geography and Limnology, Chinese Academy of Sciences (WSGS2020007).

Institutional Review Board Statement

Not applicable.

Informed Consent Statement

Not applicable.

Data Availability Statement

All data that support the findings of this study are publicly available from the corresponding author upon request.

Acknowledgments

All scientists and technicians maintaining the ChinaFLUX site management, data collection, and long-term observations are greatly appreciated. We are also grateful to the developers of MODIS products provided by NASA’s Earth Observation System Data; GOSIF data produced by Earth System Research Center, University of New Hampshire; and BESS data developed by Seoul National University.

Conflicts of Interest

The authors declare no conflict of interest.

References

  1. Eyring, V.; Gillett, N.P.; Achutarao, K.; Barimalala, R.; Barreiro Parrillo, M.; Bellouin, N.; Cassou, C.; Durack, P.; Kosaka, Y.; McGregor, S.; et al. Human Influence on the Climate System: Contribution of Working Group i to the Sixth Assessment Report of the Intergovernmental Panel on Climate Change; IPCC Sixth Assessment Report; Cambridge University Press: Cambridge, UK, 2021. [Google Scholar]
  2. Anderegg, W.R.; Kane, J.M.; Anderegg, L.D. Consequences of widespread tree mortality triggered by drought and temperature stress. Nat. Clim. Change 2013, 3, 30–36. [Google Scholar] [CrossRef]
  3. Wang, M.; Ding, Z.; Wu, C.; Song, L.; Ma, M.; Yu, P.; Lu, B.; Tang, X. Divergent responses of ecosystem water-use efficiency to extreme seasonal droughts in Southwest China. Sci. Total Environ. 2021, 760, 143427. [Google Scholar] [CrossRef] [PubMed]
  4. Matthews, H.D.; Graham, T.L.; Keverian, S.; Lamontagne, C.; Seto, D.; Smith, T.J. National contributions to observed global warming. Environ. Res. Lett. 2014, 9, 014010. [Google Scholar] [CrossRef] [Green Version]
  5. Shakoor, A.; Ashraf, F.; Shakoor, S.; Mustafa, A.; Rehman, A.; Altaf, M.M. Biogeochemical transformation of greenhouse gas emissions from terrestrial to atmospheric environment and potential feedback to climate forcing. Environ. Sci. Pollut. Res. 2020, 27, 38513–38536. [Google Scholar] [CrossRef] [PubMed]
  6. Liu, D.; Chen, Y.; Cai, W.; Dong, W.; Xiao, J.; Chen, J.; Zhang, H.; Xia, J.; Yuan, W. The contribution of China’s Grain to Green Program to carbon sequestration. Landsc. Ecol. 2014, 29, 1675–1688. [Google Scholar] [CrossRef]
  7. Prăvălie, R. Major perturbations in the Earth’s forest ecosystems. Possible implications for global warming. Earth-Sci. Rev. 2018, 185, 544–571. [Google Scholar] [CrossRef]
  8. Omali, T.U.; Okeke, F.I. Global significance of terrestrial carbon stocks. GIS Bus. 2020, 15, 33–42. [Google Scholar]
  9. Aguilos, M.; Takagi, K.; Liang, N.; Ueyama, M.; Fukuzawa, K.; Nomura, M.; Kishida, O.; Fukazawa, T.; Takahashi, H.; Kotsuka, C.; et al. Dynamics of ecosystem carbon balance recovering from a clear-cutting in a cool-temperate forest. Agric. For. Meteorol. 2014, 197, 26–39. [Google Scholar] [CrossRef] [Green Version]
  10. Schlesinger, W.H.; Dietze, M.C.; Jackson, R.B.; Phillips, R.P.; Rhoades, C.C.; Rustad, L.E.; Vose, J.M. Forest biogeochemistry in response to drought. Glob. Change Biol. 2016, 22, 2318–2328. [Google Scholar] [CrossRef]
  11. Tong, X.; Brandt, M.; Yue, Y.; Ciais, P.; Rudbeck Jepsen, M.; Penuelas, J.; Wigneron, J.P.; Xiao, X.; Song, X.P.; Horion, S.; et al. Forest management in southern China generates short term extensive carbon sequestration. Nat. Commun. 2020, 11, 129. [Google Scholar] [CrossRef]
  12. Baldocchi, D.; Falge, E.; Gu, L.; Olson, R.; Hollinger, D.; Running, S.; Anthoni, P.; Bernhofer, C.; Davis, K.; Evans, R.; et al. FLUXNET: A new tool to study the temporal and spatial variability of ecosystem-scale carbon dioxide, water vapor, and energy flux densities. Bull. Am. Meteorol. Soc. 2001, 82, 2415–2434. [Google Scholar] [CrossRef]
  13. Falge, E.; Aubinet, M.; Bakwin, P.S.; Baldocchi, D.; Berbigier, P.; Bernhofer, C.; Black, T.A.; Ceulemans, R.; Davis, K.J.; Dolman, A.J.; et al. FLUXNET Research Network Site Characteristics, Investigators, and Bibliography, 2016; ORNL DAAC: Oak Ridge, TN, USA, 2017. [Google Scholar]
  14. Lasslop, G.; Reichstein, M.; Papale, D.; Richardson, A.D.; Arneth, A.; Barr, A.; Stoy, P.; Wohlfahrt, G. Separation of net ecosystem exchange into assimilation and respiration using a light response curve approach: Critical issues and global evaluation. Glob. Change Biol. 2010, 16, 187–208. [Google Scholar] [CrossRef] [Green Version]
  15. Desai, A.R.; Richardson, A.D.; Moffat, A.M.; Kattge, J.; Hollinger, D.Y.; Barr, A.; Falge, E.; Noormets, A.; Papale, D.; Reichstein, M.; et al. Cross-site evaluation of eddy covariance GPP and RE decomposition techniques. Agric. For. Meteorol. 2008, 148, 821–838. [Google Scholar] [CrossRef]
  16. Turner, D.P.; Ritts, W.D.; Cohen, W.B.; Maeirsperger, T.K.; Gower, S.T.; Kirschbaum, A.A.; Running, S.W.; Zhao, M.; Wofsy, S.C.; Dunn, A.L.; et al. Site-level evaluation of satellite-based global terrestrial gross primary production and net primary production monitoring. Glob. Change Biol. 2005, 11, 666–684. [Google Scholar] [CrossRef]
  17. Tang, X.; Li, H.; Desai, A.R.; Nagy, Z.; Luo, J.; Kolb, T.E.; Olioso, A.; Xu, X.; Yao, L.; Kutsch, W.; et al. How is water-use efficiency of terrestrial ecosystems distributed and changing on Earth? Sci. Rep. 2014, 4, 1–11. [Google Scholar] [CrossRef] [PubMed]
  18. Piao, S.; Yin, G.; Tan, J.; Cheng, L.; Huang, M.; Li, Y.; Liu, R.; Mao, J.; Myneni, R.B.; Peng, S.; et al. Detection and attribution of vegetation greening trend in China over the last 30 years. Glob. Change Biol. 2015, 21, 1601–1609. [Google Scholar] [CrossRef]
  19. Wu, X.; Xiao, X.; Zhang, Y.; He, W.; Wolf, S.; Chen, J.; He, M.; Gough, C.M.; Qin, Y.; Zhou, Y.; et al. Spatiotemporal consistency of four gross primary production products and solar-induced chlorophyll fluorescence in response to climate extremes across CONUS in 2012. J. Geophys. Res. Biogeosci. 2018, 123, 3140–3161. [Google Scholar] [CrossRef]
  20. Wang, L.; Zhu, H.; Lin, A.; Zou, L.; Qin, W.; Du, Q. Evaluation of the latest MODIS GPP products across multiple biomes using global eddy covariance flux data. Remote Sens. 2017, 9, 418. [Google Scholar] [CrossRef] [Green Version]
  21. Chen, Y.; Gu, H.; Wang, M.; Gu, Q.; Ding, Z.; Ma, M.; Liu, R.; Tang, X. Contrasting performance of the remotely-derived GPP products over different climate zones across China. Remote Sens. 2019, 11, 1855. [Google Scholar] [CrossRef] [Green Version]
  22. Joiner, J.; Yoshida, Y.; Vasilkov, A.P.; Middleton, E.M. First observations of global and seasonal terrestrial chlorophyll fluorescence from space. Biogeosciences 2011, 8, 637–651. [Google Scholar] [CrossRef] [Green Version]
  23. Joiner, J.; Guanter, L.; Lindstrot, R.; Voigt, M.; Vasilkov, A.P.; Middleton, E.M.; Frankenberg, C. Global monitoring of terrestrial chlorophyll fluorescence from moderate-spectral-resolution near-infrared satellite measurements: Methodology, simulations, and application to GOME-2. Atmos. Meas. Tech. 2013, 6, 2803–2823. [Google Scholar] [CrossRef] [Green Version]
  24. Frankenberg, C.; O’Dell, C.; Berry, J.; Guanter, L.; Joiner, J.; Köhler, P.; Taylor, T.E. Prospects for chlorophyll fluorescence remote sensing from the Orbiting Carbon Observatory-2. Remote Sens. Environ. 2014, 147, 1–12. [Google Scholar] [CrossRef] [Green Version]
  25. Walther, S.; Voigt, M.; Thum, T.; Gonsamo, A.; Zhang, Y.; Köhler, P.; Jung, M.; Varlagin, A.; Guanter, L. Satellite chlorophyll fluorescence measurements reveal large-scale decoupling of photosynthesis and greenness dynamics in boreal evergreen forests. Glob. Change Biol. 2016, 22, 2979–2996. [Google Scholar] [CrossRef] [PubMed] [Green Version]
  26. Sun, Y.; Frankenberg, C.; Wood, J.D.; Schimel, D.S.; Jung, M.; Guanter, L.; Drewry, D.T.; Verma, M.; Porcar-Castell, A.; Griffis, T.J.; et al. OCO-2 advances photosynthesis observation from space via solar-induced chlorophyll fluorescence. Science 2017, 358, eaam5747. [Google Scholar] [CrossRef] [Green Version]
  27. Hao, D.; Asrar, G.R.; Zeng, Y.; Yang, X.; Li, X.; Xiao, J.; Guan, K.; Wen, J.; Xiao, Q.; Berry, J.A.; et al. Potential of hotspot solar-induced chlorophyll fluorescence for better tracking terrestrial photosynthesis. Glob. Change Biol. 2021, 27, 2144–2158. [Google Scholar] [CrossRef]
  28. Li, X.; Xiao, J. A global, 0.05-degree product of solar-induced chlorophyll fluorescence derived from OCO-2, MODIS, and reanalysis data. Remote Sens. 2019, 11, 517. [Google Scholar] [CrossRef] [Green Version]
  29. Zhang, Y.; Joiner, J.; Alemohammad, S.H.; Zhou, S.; Gentine, P. A global spatially contiguous solar-induced fluorescence (CSIF) dataset using neural networks. Biogeosciences 2018, 15, 5779–5800. [Google Scholar] [CrossRef] [Green Version]
  30. Yu, G.; Chen, Z.; Piao, S.; Peng, C.; Ciais, P.; Wang, Q.; Lia, X.; Zhu, X. High carbon dioxide uptake by subtropical forest ecosystems in the East Asian monsoon region. Proc. Natl. Acad. Sci. USA 2014, 111, 4910–4915. [Google Scholar] [CrossRef] [Green Version]
  31. Amir, M.; Chen, J.; Chen, B.; Wang, S.; Zhu, K.; Li, Y.; Meng, Z.; Ma, L.; Wang, X.; Liu, Y.; et al. Reflectance and chlorophyll fluorescence-based retrieval of photosynthetic parameters improves the estimation of subtropical forest productivity. Ecol. Indic. 2021, 131, 108133. [Google Scholar] [CrossRef]
  32. Harris, N.L.; Gibbs, D.A.; Baccini, A.; Birdsey, R.A.; De Bruin, S.; Farina, M.; Fatoyinbo, L.; Hansen, M.C.; Herold, M.; Houghton, R.A.; et al. Global maps of twenty-first century forest carbon fluxes. Nat. Clim. Change 2021, 11, 234–240. [Google Scholar] [CrossRef]
  33. Li, J.; Liu, Y.; Yang, X.; Li, J. Studies on water-vapor flux characteristic and the relationship with environmental factors over a planted coniferous forest in Qianyanzhou Station. Acta Ecol. Sin. 2006, 26, 2449–2456. [Google Scholar] [CrossRef]
  34. Han, J.; Guo, C.; Ye, S.; Zhang, L.; Li, S.; Wang, H.; Yu, G. Effects of diffuse photosynthetically active radiation on gross primary productivity in a subtropical coniferous plantation vary in different timescales. Ecol. Indic. 2020, 115, 106403. [Google Scholar] [CrossRef]
  35. Otieno, D.; Li, Y.; Ou, Y.; Cheng, J.; Liu, S.; Tang, X.; Zhang, Q.; Jung, E.Y.; Zhang, D.; Tenhunen, J. Stand characteristics and water use at two elevations in a sub-tropical evergreen forest in southern China. Agric. For. Meteorol. 2014, 194, 155–166. [Google Scholar] [CrossRef]
  36. Njoroge, B.; Li, Y.; Wei, S.; Meng, Z.; Liu, S.; Zhang, Q.; et, al. An Interannual comparative study on ecosystem carbon exchange characteristics in the Dinghushan biosphere reserve, a dominant subtropical evergreen forest ecosystem. Front. Plant Sci. 2021, 12, 715340. [Google Scholar] [CrossRef]
  37. Li, Y.L.; Zhou, G.Y.; Zhang, D.Q.; Wenigmann, K.O.; Otieno, D.; Tenhunen, J.; Zhang, Q.M.; Yan, J.H. Quantification of ecosystem carbon exchange characteristics in a dominant subtropical evergreen forest ecosystem. Asia-Pac. J. Atmos. Sci. 2012, 48, 1–10. [Google Scholar] [CrossRef]
  38. Yu, G.; Fu, Y.; Sun, X.; Wen, X.; Zhang, L. Recent progress and future directions of China FLUX. Sci. China Ser. D Earth Sci. 2006, 49, 1–23. [Google Scholar] [CrossRef]
  39. Fu, B.; Li, S.; Yu, X.; Yang, P.; Yu, G.; Feng, R.; Zhuang, X. Chinese ecosystem research network: Progress and perspectives. Ecol. Complex. 2010, 7, 225–233. [Google Scholar] [CrossRef]
  40. Yu, G.R.; Zhu, X.J.; Fu, Y.L.; He, H.L.; Wang, Q.F.; Wen, X.F.; Li, X.R.; Zhang, L.M.; Zhang, L.; Su, W.; et al. Spatial patterns and climate drivers of carbon fluxes in terrestrial ecosystems of China. Glob. Change Biol. 2013, 19, 798–810. [Google Scholar] [CrossRef]
  41. Tang, X.; Zhou, Y.; Li, H.; Yao, L.; Ding, Z.; Ma, M.; Yu, P. Remotely monitoring ecosystem respiration from various grasslands along a large-scale east–west transect across northern China. Carbon Balance Manag. 2020, 15, 1–14. [Google Scholar] [CrossRef]
  42. Tang, X.; Xiao, J.; Ma, M.; Yang, H.; Li, X.; Ding, Z.; Yu, P.; Zhang, Y.; Wu, C.; Huang, J.; et al. Satellite evidence for China’s leading role in restoring vegetation productivity over global karst ecosystems. For. Ecol. Manag. 2022, 507, 120000. [Google Scholar] [CrossRef]
  43. Reichstein, M.; Falge, E.; Baldocchi, D.; Papale, D.; Aubinet, M.; Bernhofer, C.; Buchmann, N.; Gilmanov, T.; Granier, A.; Grünwald, T.; et al. On the separation of net ecosystem exchange into assimilation and ecosystem respiration: Review and improved algorithm. Glob. Change Biol. 2005, 11, 1424–1439. [Google Scholar] [CrossRef]
  44. Wutzler, T.; Lucas-Moffat, A.; Migliavacca, M.; Knauer, J.; Sickel, K.; Šigut, L.; Menzer, O.; Reichstein, M. Basic and extensible post-processing of eddy covariance flux data with REddyProc. Biogeosciences 2018, 15, 5015–5030. [Google Scholar] [CrossRef] [Green Version]
  45. Li, X.; Xiao, J.; He, B.; Altaf Arain, M.; Beringer, J.; Desai, A.R.; Emmel, C.; Hollinger, D.Y.; Krasnova, A.; Mammarella, I.; et al. Solar-induced chlorophyll fluorescence is strongly correlated with terrestrial photosynthesis for a wide variety of biomes: First global analysis based on OCO-2 and flux tower observations. Glob. Change Biol. 2018, 24, 3990–4008. [Google Scholar] [CrossRef] [PubMed]
  46. Zhao, M.; Heinsch, F.A.; Nemani, R.R.; Running, S.W. Improvements of the MODIS terrestrial gross and net primary production global data set. Remote Sens. Environ. 2005, 95, 164–176. [Google Scholar] [CrossRef]
  47. Ryu, Y.; Baldocchi, D.D.; Kobayashi, H.; Van Ingen, C.; Li, J.; Black, T.A.; Beringer, J.; Van Gorsel, E.; Knohl, A.; Law, B.E.; et al. Integration of MODIS land and atmosphere products with a coupled-process model to estimate gross primary productivity and evapotranspiration from 1 km to global scales. Glob. Biogeochem. Cycles 2011, 25, GB4017. [Google Scholar] [CrossRef] [Green Version]
  48. Jiang, C.; Ryu, Y. Multi-scale evaluation of global gross primary productivity and evapotranspiration products derived from Breathing Earth System Simulator (BESS). Remote Sens. Environ. 2016, 186, 528–547. [Google Scholar] [CrossRef]
  49. Yang, S.; Zhang, J.; Zhang, S.; Wang, J.; Bai, Y.; Yao, F.; Guo, H. The potential of remote sensing-based models on global water-use efficiency estimation: An evaluation and intercomparison of an ecosystem model (BESS) and algorithm (MODIS) using site level and upscaled eddy covariance data. Agric. For. Meteorol. 2020, 287, 107959. [Google Scholar] [CrossRef]
  50. Bertoldi, P.; Kona, A.; Rivas, S.; Dallemand, J.F. Towards a global comprehensive and transparent framework for cities and local governments enabling an effective contribution to the Paris climate agreement. Curr. Opin. Environ. Sustain. 2018, 30, 67–74. [Google Scholar] [CrossRef]
  51. Beer, C.; Reichstein, M.; Tomelleri, E.; Ciais, P.; Jung, M.; Carvalhais, N.; Rödenbeck, C.; Arain, M.A.; Baldocchi, D.; Bonan, G.B.; et al. Terrestrial gross carbon dioxide uptake: Global distribution and covariation with climate. Science 2010, 329, 834–838. [Google Scholar] [CrossRef] [Green Version]
  52. Holmberg, M.; Aalto, T.; Akujärvi, A.; Arslan, A.N.; Bergström, I.; Böttcher, K.; Lahtinen, I.; Mäkelä, A.; Markkanen, T.; Minunno, F.; et al. Ecosystem services related to carbon cycling–modeling present and future impacts in boreal forests. Front. Plant Sci. 2019, 10, 343. [Google Scholar] [CrossRef]
  53. Höhne, N.; Kuramochi, T.; Warnecke, C.; Röser, F.; Fekete, H.; Hagemann, M.; Day, T.; Tewari, R.; Kurdziel, M.; Sterl, S.; et al. The Paris Agreement: Resolving the inconsistency between global goals and national contributions. Clim. Policy 2017, 17, 16–32. [Google Scholar] [CrossRef]
  54. Intergovernmental Panel on Climate Change. Climate Change and Land: An IPCC Special Report on Climate Change, Desertification, Land Degradation, Sustainable Land Management, Food Security, and Greenhouse Gas Fluxes in Terrestrial Ecosystems; Intergovernmental Panel on Climate Change: Geneva, Switzerland, 2019. [Google Scholar]
  55. Tian, F.; Brandt, M.; Liu, Y.Y.; Verger, A.; Tagesson, T.; Diouf, A.A.; Rasmussen, K.; Mbow, C.; Wang, Y.; Fensholt, R. Remote sensing of vegetation dynamics in drylands: Evaluating vegetation optical depth (VOD) using AVHRR NDVI and in situ green biomass data over West African Sahel. Remote Sens. Environ. 2016, 177, 265–276. [Google Scholar] [CrossRef] [Green Version]
  56. Fan, L.; Wigneron, J.P.; Ciais, P.; Chave, J.; Brandt, M.; Fensholt, R.; Saatchi, S.S.; Bastos, A.; Al-Yaari, A.; Hufkens, K.; et al. Satellite-observed pantropical carbon dynamics. Nat. Plants 2019, 5, 944–951. [Google Scholar] [CrossRef] [PubMed]
  57. Tang, X.; Li, H.; Huang, N.; Li, X.; Xu, X.; Ding, Z.; Xie, J. A comprehensive assessment of MODIS-derived GPP for forest ecosystems using the site-level FLUXNET database. Environ. Earth Sci. 2015, 74, 5907–5918. [Google Scholar] [CrossRef]
  58. Lin, S.; Li, J.; Liu, Q.; Gioli, B.; Paul-Limoges, E.; Buchmann, N.; Gharun, M.; Hörtnagl, L.; Foltýnová, L.; Dušek, J.; et al. Improved global estimations of gross primary productivity of natural vegetation types by incorporating plant functional type. Int. J. Appl. Earth Obs. Geoinf. 2021, 100, 102328. [Google Scholar] [CrossRef]
  59. Martini, D.; Sakowska, K.; Wohlfahrt, G.; Pacheco-Labrador, J.; van der Tol, C.; Porcar-Castell, A.; Magney, T.; Carrara, A.; Colombo, R.; El-Madanay, T.; et al. Heatwave breaks down the linearity between sun-induced fluorescence and gross primary production. New Phytol. 2022, 233, 2415–2428. [Google Scholar] [CrossRef]
  60. Zhang, Y.; Guanter, L.; Berry, J.A.; Joiner, J.; van der Tol, C.; Huete, A.; Gitelson, A.; Voigt, M.; Köhler, P. Estimation of vegetation photosynthetic capacity from space-based measurements of chlorophyll fluorescence for terrestrial biosphere models. Glob. Change Biol. 2014, 20, 3727–3742. [Google Scholar] [CrossRef] [Green Version]
  61. Guanter, L.; Bacour, C.; Schneider, A.; Aben, I.; van Kempen, T.A.; Maignan, F.; Retscher, C.; Köhler, P.; Frankenberg, C.; Joiner, J.; et al. The TROPOSIF global sun-induced fluorescence dataset from the Sentinel-5P TROPOMI mission. Earth Syst. Sci. Data 2021, 13, 5423–5440. [Google Scholar] [CrossRef]
  62. Turner, D.P.; Ritts, W.D.; Cohen, W.B.; Gower, S.T.; Zhao, M.; Running, S.W.; Wofsy, S.C.; Urbanski, S.; Dunn, A.L.; Munger, J.W. Scaling gross primary production (GPP) over boreal and deciduous forest landscapes in support of MODIS GPP product validation. Remote Sens. Environ. 2003, 88, 256–270. [Google Scholar] [CrossRef] [Green Version]
  63. Mäkelä, A.; Kolari, P.; Karimäki, J.; Nikinmaa, E.; Perämäki, M.; Hari, P. Modelling five years of weather-driven variation of GPP in a boreal forest. Agric. For. Meteorol. 2006, 139, 382–398. [Google Scholar] [CrossRef]
  64. Tong, X.; Brandt, M.; Yue, Y.; Horion, S.; Wang, K.; De Keersmaecker, W.; Tian, F.; Schurgers, G.; Xiao, X.; Luo, Y.; et al. Increased vegetation growth and carbon stock in China karst via ecological engineering. Nat. Sustain. 2018, 1, 44–50. [Google Scholar] [CrossRef]
  65. Schielein, J.; Börner, J. Recent transformations of land-use and land-cover dynamics across different deforestation frontiers in the Brazilian Amazon. Land Use Policy 2018, 76, 81–94. [Google Scholar] [CrossRef]
Figure 1. Geographical location of the two subtropical forest flux sites (QYZ and DHS) used in the present study. The base map is derived from AVHRR 1 km land-cover map.
Remotesensing 14 01328 g001
Figure 2. Site-level GPP observations at the two subtropical forest flux sites (QYZ and DHS) for 8-day periods from 2003 to 2010, respectively. For x-axis, the data refer to week of year (WOY) ranging from 1 to 46.
Remotesensing 14 01328 g002
Figure 3. Seasonal trajectories of solar radiation (Rg), air temperature (Ta), vapour pressure deficit (VPD), and precipitation (P) during 2003–2010 at the QYZ flux site (evergreen needleleaf forest) for 8-day periods. For x-axis, the data refer to week of year (WOY) ranging from 1 to 46.
Remotesensing 14 01328 g003
Figure 4. Seasonal trajectories of solar radiation (Rg), air temperature (Ta), vapour pressure deficit (VPD) and precipitation (P) during 2003–2010 at the DHS flux site (evergreen broadleaf forest) for 8-day periods. For x-axis, the data refer to week of year (WOY) ranging from 1 to 46.
Remotesensing 14 01328 g004
Figure 5. Relationships between 8-day mean tower-based GPP and the associated SIF product at the two subtropical forest (QYZ, evergreen needleleaf forest; DHS, Evergreen broadleaf forest) flux sites. The red line is linear regression.
Remotesensing 14 01328 g005
Figure 6. Leave-one-out cross-validation of the model-estimated GPP relying on time-series SIF data (GPPSIF) and the associated MODIS GPP (GPPMOD) and BESS GPP (GPPBESS) products across the two subtropical forest (QYZ, evergreen needleleaf forest; DHS, Evergreen broadleaf forest) flux sites. The dotted line is a 1:1 line.
Remotesensing 14 01328 g006
Figure 7. Seasonal consistency between tower-based GPP observations (GPPEC) at the QYZ flux site (evergreen needleleaf forest) and three different satellite-based GPP products including the SIF-based GPP (GPPSIF), MODIS GPP (GPPMOD), and BESS GPP (GPPBESS), respectively.
Remotesensing 14 01328 g007
Figure 8. Seasonal consistency between tower-based GPP observations (GPPEC) at the DHS flux site (evergreen broadleaf forest) and three different satellite-based GPP products including the SIF-based GPP (GPPSIF), MODIS GPP (GPPMOD), and BESS GPP (GPPBESS), respectively.
Remotesensing 14 01328 g008
Figure 9. Comparisons of multi-year mean tower-based GPP observations (GPPEC) and three different satellite-based GPP products including the SIF-based GPP (GPPSIF), MODIS GPP (GPPMOD) and BESS GPP (GPPBESS) at the two subtropical forest flux sites (QYZ and DHS) during 2003 and 2010. The error bars represent ±1 standard error.
Remotesensing 14 01328 g009
Table 1. Correlations between site-level GPP observations and the environmental factors including solar radiation (Rg), air temperature (Ta), vapour pressure deficit (VPD), and precipitation (P) at the two subtropical forest flux sites, respectively.
SiteRg
(W m−2)
Ta
(°C)
VPD
(h Pa)
P
(mm)
GPP
(g C m−2 d−1)
QYZ (Evergreen needleleaf forest)0.855 **0.908 **0.793 **0.051
DHS (Evergreen broadleaf forest)0.790 **0.665 **0.677 **−0.069
Note: ** means that the correlation is significant at the 0.01 level (p < 0.01).
Table 2. Accuracy assessment of the model-estimated GPP relying on time-series SIF data at the two subtropical forest flux sites through leave-one-out cross-validation method.
SiteValidation YearR2RMSE
(g C m−2 d−1)
GPP
(g C m−2 d−1)
QYZ
(Evergreen needleleaf forest)
20030.780.98
20040.940.90
20050.900.71
20060.860.88
20070.820.89
20080.870.85
20090.830.94
20100.751.11
DHS
(Evergreen broadleaf forest)
20030.400.80
20040.610.89
20050.421.03
20060.300.98
20070.390.99
20080.450.91
20090.311.01
20100.280.92
Publisher’s Note: MDPI stays neutral with regard to jurisdictional claims in published maps and institutional affiliations.

