
SII-Net: Spatial Information Integration Network for Small Target Detection in SAR Images


1
College of Information and Communication Engineering, Harbin Engineering University, Harbin 150001, China
2
Key Laboratory of Advanced Marine Communication and Information Technology, Ministry of Industry and Information Technology, Harbin Engineering University, Harbin 150001, China
3
Beijing Remote Sensing Information Institute, Beijing 100094, China
*
Author to whom correspondence should be addressed.
Remote Sens. 2022, 14(3), 442; https://doi.org/10.3390/rs14030442
Submission received: 17 December 2021
/
Revised: 10 January 2022
/
Accepted: 15 January 2022
/
Published: 18 January 2022
(This article belongs to the Special Issue Object-Level Remote Sensing Image Information Extraction and Applications)
Abstract
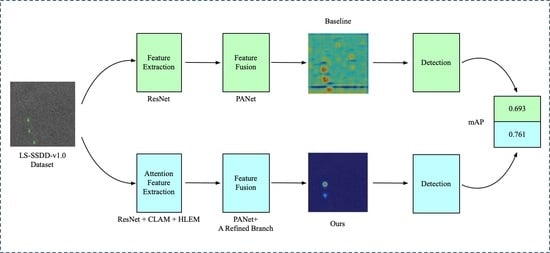
:Ship detection based on synthetic aperture radar (SAR) images has made a breakthrough in recent years. However, small ships, which may be regarded as speckle noise, pose enormous challenges to the accurate detection of SAR images. In order to enhance the detection performance of small ships in SAR images, a novel detection method named a spatial information integration network (SII-Net) is proposed in this paper. First, a channel-location attention mechanism (CLAM) module which extracts position information along with two spatial directions is proposed to enhance the detection ability of the backbone network. Second, a high-level features enhancement module (HLEM) is customized to reduce the loss of small target location information in high-level features via using multiple pooling layers. Third, in the feature fusion stage, a refined branch is presented to distinguish the location information between the target and the surrounding region by highlighting the feature representation of the target. The public datasets LS-SSDD-v1.0, SSDD and SAR-Ship-Dataset are used to conduct ship detection tests. Extensive experiments show that the SII-Net outperforms state-of-the-art small target detectors and achieves the highest detection accuracy, especially when the target size is less than 30 pixels by 30 pixels.
1. Introduction
Synthetic aperture radar (SAR), with the characteristics of all-day and all-weather work, has broad application prospects in both the military and civilian fields. Among the SAR applications, ship detection plays an important role in maritime management and monitoring. However, compared with optical images, the process of SAR images is more difficult due to their lower resolution. Therefore, the accurate location of SAR ships with relatively small pixels remains a significant challenge.
In the early detection of SAR images, Leng et al. [1] proposed the constant false alarm rate (CFAR) algorithm, which could adaptively determine the detection threshold. In addition, Liu et al. [2] proposed a method to separate the sea and land to opt for the detection area automatically. Nevertheless, these traditional methods have cumbersome calculation processes and poor migration capabilities. In recent years, a series of SAR ship detection methods based on deep learning (DL) [3,4,5,6] have achieved good performance. DL-based methods of object detection are mainly divided into two patterns, i.e., one-stage detector and two-stage detector. To ensure the real-time effect of recognition, some one-stage [7,8,9,10,11,12] methods are chosen to detect SAR ships. However, studies [13] have shown that one-stage methods are more likely to produce more localization errors in small target detection.
For the two-stage methods [14,15,16], although they can obtain high detection accuracy in the offshore area, they are prone to plenty of missing detections and false alarms in the inshore area. Therefore, some scholars choose the attention mechanism as the starting point for research, aiming to reinforce the feature extraction ability of the backbone network. For example, the squeeze-and-excitation (SE) [17] mechanism utilized by Lin et al. [18] was adopted to improve the feature extraction capability of the network. However, the SE module only considered the correlation between channels and ignored the importance of location information. The ARPN [19] network combined a convolutional block attention module (CBAM) [20] proposed by Zhao et al. to suppress the adverse effects of the surrounding environment. However, CBAM modules could only capture local correlations and could not build long-range dependence of the feature. In addition, Fu et al. [21] proposed the feature balancing and refinement network (FBR-Net), which used an attention-guided balanced pyramid to effectively improve the detection performance of small ships in complex scenes. However, the FBR-Net was designed to semantically balance multiple features at different levels, without considering location information. The inconsistency across different levels makes the networks pay more attention to the objects with sufficient obvious semantic features, it also causes the detection problem of small targets. Aiming to solve this problem, many scholars use multiscale feature extraction methods [22,23,24] to address this imbalance issue. For instance, the Lite Faster R-CNN proposed by Li et al. [25] was adopted to extract feature information by a parallel multi-scale convolution operation. A lightweight SAR ship detector proposed by Zhang et al. [26] was applied to share the features of different detection scales through up-sampling and down-sampling methods. A multi-domain fusion network proposed by Li et al. [27] was used to attain excellent results in multi-scale target detection under complex backgrounds. A dense connection module presented by Deng et al. [28] was adopted to obtain the feature information of each layer in the network and to predict multiscale ship proposals from several intermediate layers. These improved methods based on feature imbalance effectively improve the detection accuracy of small ship targets in SAR images. However, on the one hand, these methods did not notice the location information loss of high-level small targets. Therefore, the small object has little information for location refinement when it is mapped to the final feature map. On the other hand, these methods did not focus on reducing the similarity between the target and the surrounding background. However, some local areas of the ship targets in the SAR image have a similar scattering mechanism to the surrounding areas, and lots of false alarms may be generated in the inshore area. Some scholars [29,30] choose multi-modal detection methods to improve the detection accuracy of ships in SAR images. Although the multi-modal methods can improve the stability of the prediction results, the design of these methods is too complicated, and there is not much improvement in small target detection. This still causes a huge obstacle to the precise positioning of the small ship target.
To tackle the above-mentioned phenomenon, a small ship detection method based on a spatial information integration network (SII-Net) is proposed in this paper. At present, the improvement of small target detection based on SAR images is mostly from two directions, the use of attention mechanism in the backbone network or enhancement in the feature fusion stage. The SII-Net is also designed from these two perspectives while noting the high-level feature loss during feature extraction. SII-Net includes three key components: the channel-location attention mechanism (CLAM), high-level features enhancement module (HLEM), and a refined branch. Taking into account the fusion of location and channel information, the CLAM module is designed to extract feature information from two spatial directions. At the same time, we put forward the HLEM module to remedy the location information loss of small targets at a high level. Additionally, we design a feature refinement path to enhance the difference between the target and the background, aiming to better reduce the interference of background noise. The detection results illustrate the superiority of SII-Net in comparison with other state-of-the-art CNN-based methods on the small target dataset LS-SSDD-v1.0 [31] and other large public datasets (i.e., SSDD [32], SAR-Ship-Dataset [33]). The main contributions of this paper are as follows:
- (1)
- We propose a channel-location attention mechanism (CLAM) that embeds positional information into channel information along with two spatial directions. By modeling inter-channel similarity and spatial correlation, the CLAM yields impressive performance in enhancing the feature extraction ability of the backbone.
- (2)
- To address the location information loss of small targets at the high level, a well-designed module called the high-level features enhancement module (HLEM) is customized to upgrade the performance of the high feature layer of the backbone network by multiscale pooling operation.
- (3)
- Considering the fact that inshore ship targets are susceptible to interference from surrounding objects, a new refined branch of feature is proposed to optimize the features after fusing each feature layer. The refined branch can make the network enhance the difference between target and background to effectively distinguish the target from the background.
2. Methods
2.1. The Motivation of the Proposed Method
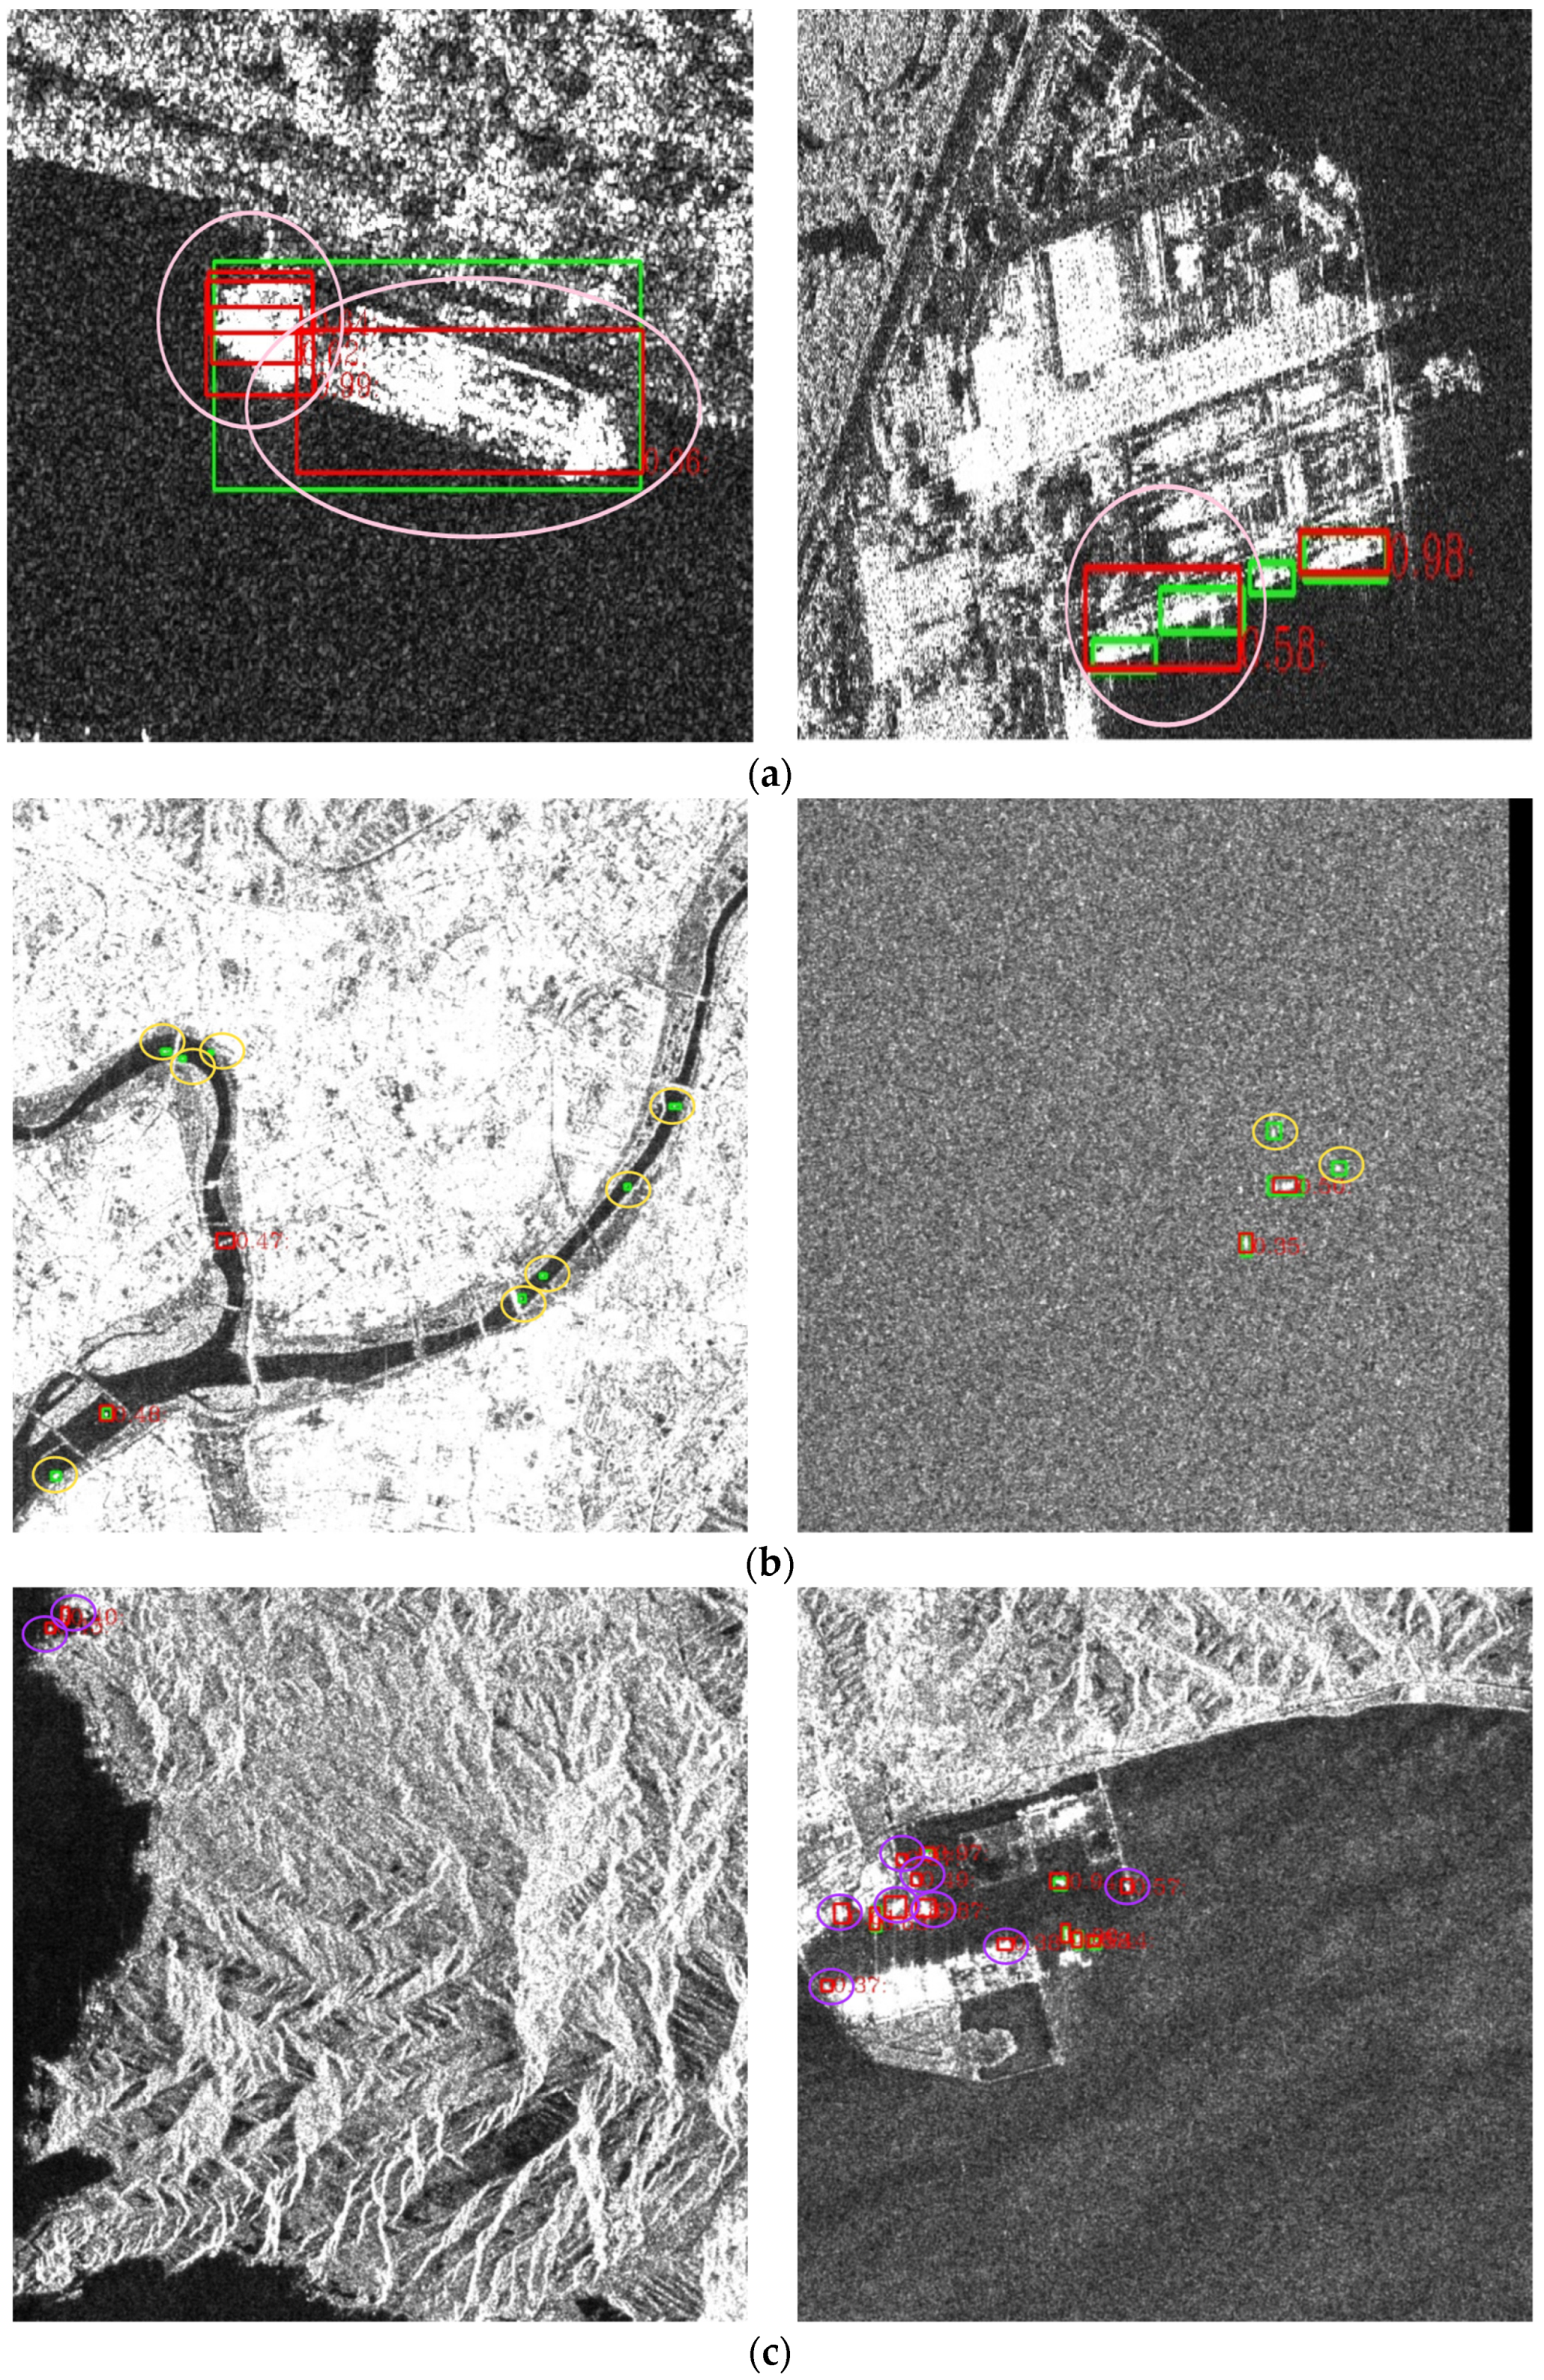
Nowadays, ship detection in SAR images is prone to several problems due to noise interference. As shown in Figure 1, ground truths are marked by green boxes, and detection results are marked by red boxes. Figure 1a shows the problem of inaccurate localization, the pink circles represent the ships with the inaccurate bounding box. Figure 1b shows the problem of the missing ships which are represented by the yellow circles. Figure 1c shows the problem of false detections which are represented by the purple circles. To solve these problems, the current algorithms are usually improved in the backbone network or feature fusion stage.
To highlight significant information, attention mechanism modules are usually inserted into the backbone network [34,35,36]. For example, the once-popular channel-based attention module, SE, was applied to integrate the channel information by the global pooling [37] method. However, the SE module only paid attention to the channel information, ignoring the importance of the location information in detection. After that, the improved CBAM module calculated the channel attention while calculating the spatial attention, but the CBAM module used large-scale convolution kernels to extract spatial information locally. The CBAM module did not provide a good improvement on the long-distance dependence which is required for small ship detection.
In addition, although high-level features contain a great deal of semantic information, the location information of small targets is easily lost at a high level due to the continuous down-sampling operation.
In addition, a series of [7,38,39,40] improving networks based on FPN [41] were put forward to strengthen the detection ability of ship targets, but these improvements usually used fine-grained feature pyramids to consider multiscale features. These improved methods based on multiscale features can enhance the detection performance for offshore ships, but for targets whose characteristics are not particularly obvious in complex backgrounds, the effect of improvement is not particularly prominent.
Inspired by these algorithms, we propose the SII-Net which contains three innovative modules, i.e., CALM, HLEM, and a refined branch. The SII-Net is mainly designed to improve the detection ability of small targets. The detailed implementation of the entire method is introduced in the next section.
2.2. Overview of the Processing Scheme
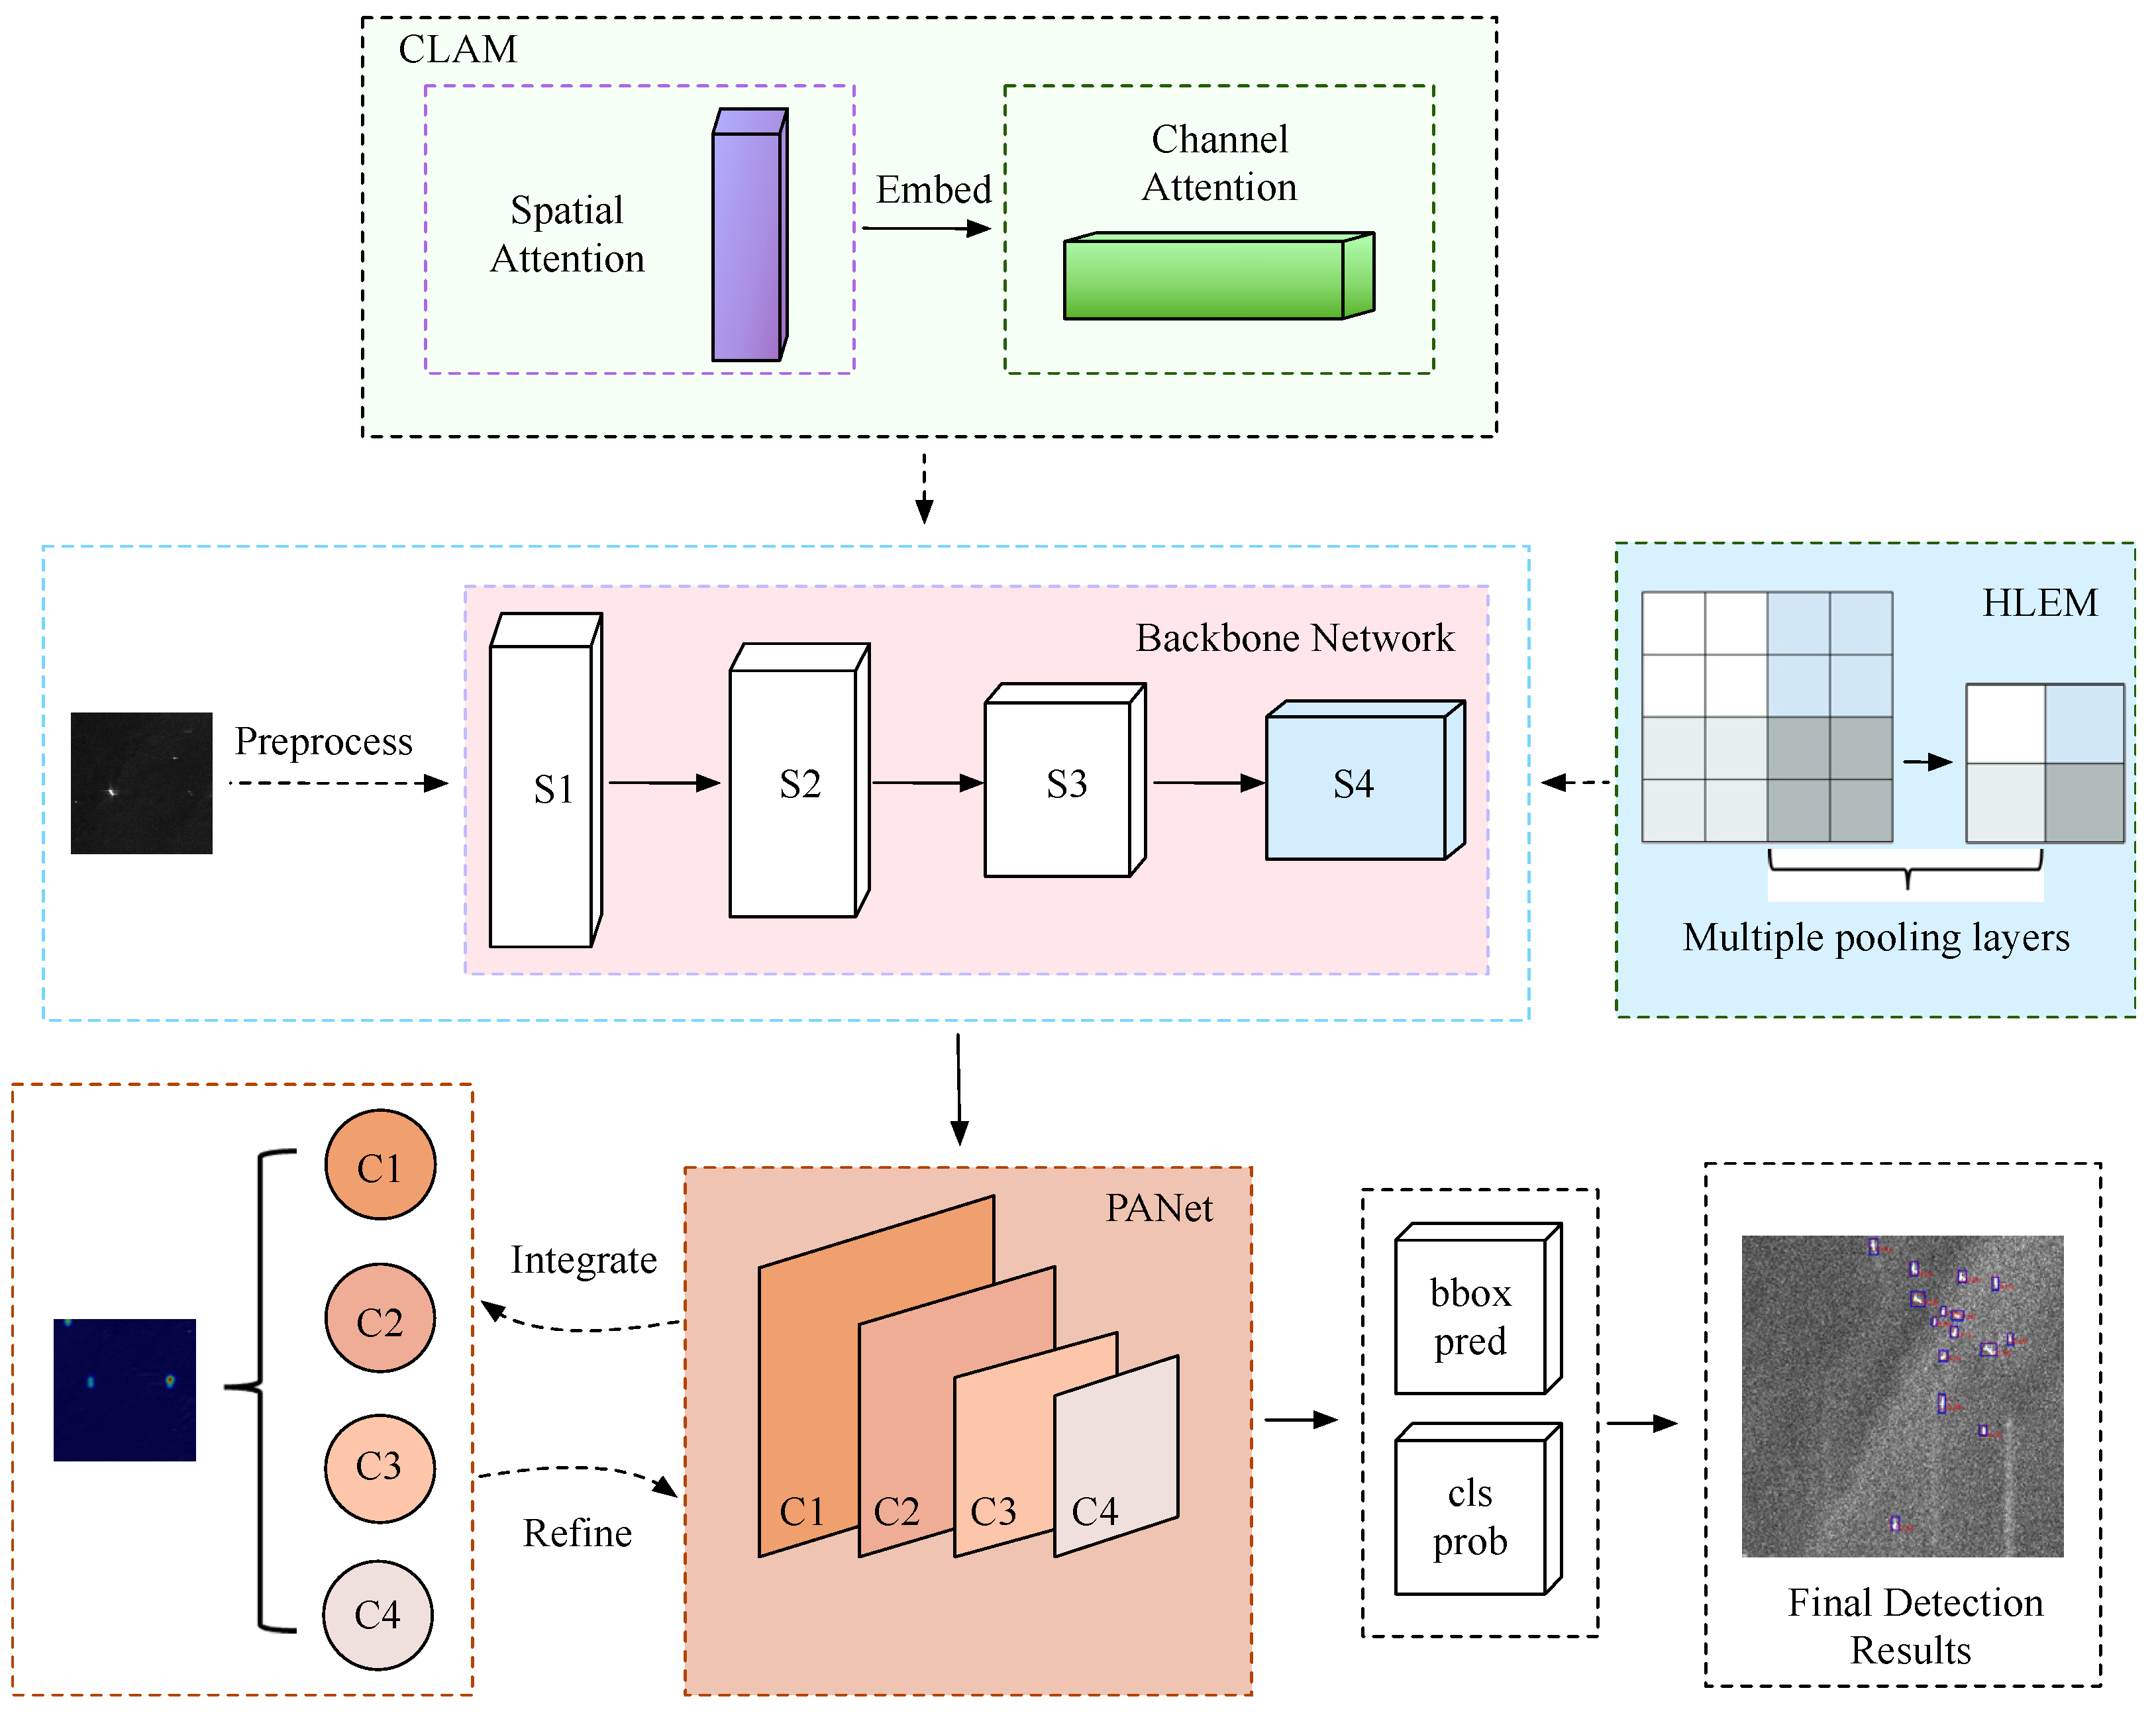
As shown in Figure 2, the SII-Net consists of four parts, i.e., the preprocessing part, the backbone network, the feature fusion module, and the detection head. Our innovative work is reflected in three parts, the CLAM module, the HLEM module and a refined branch. To effectively use the location information of the target, we design a new attention mechanism, CLAM, which can encode spatial information in horizontal and vertical directions. After the extraction of spatial features, a carefully designed HLEM module is proposed to mitigate the loss of high-level location information and improve the ability to detect small targets by parallel multiscale pooling layers. To avoid the interference of inshore targets by the scattering mechanism of surrounding objects, we propose a refined path branch to highlight the target characteristics and enhance the difference between the target and the background. The SII-Net has a good reference significance for other scholars who research small target detection. Next, the flowchart of the SII-Net will be introduced in detail. At first, the input SAR images are preprocessed by adding false samples and using the Scale Match [42] method. By using preprocessing methods, the effect of the pre-train network and the quality of feature extraction can be improved. After preprocessing, the SAR images are input to the backbone network, and the CLAM module is applied to enhance feature extraction capability for the backbone network by collecting location information from two spatial directions. After this, the HLEM module is used to enhance high-level features of the backbone network. The features are then input into PANet [43] for processing, and the refined path is adopted to optimize the output of the PANet to distinguish the target from the background. Later, the information collected by the above operations is sent to the classification sub-network and the anchor regression sub-network for discrimination and localization tasks respectively. Finally, the results of SII-Net are output through non-maximum suppression (NMS) [44] operation.
2.3. Pre-Processing Method
2.3.1. Scale Match
The pre-training model of the current algorithm is usually obtained from the ImageNet dataset [45] or COCO dataset [46], ignoring the scale difference between the pre-training dataset and the training dataset. This situation leads to the effect of the pre-training model being extremely weak. Noting this shortcoming, we choose to use the scale match method. Before training, the scale match method is performed on the pre-training dataset and the training dataset by changing the image size of the pre-training dataset. The scale match method is used to make the scales of all targets in the pre-training dataset align with the scale distributions of all targets in the training dataset.
2.3.2. Add False Samples
Several pure background pictures may lead to false alarms during the detection in the LS-SSDD-v1.0 dataset. To allow pure background pictures to participate in the training, we adopt the strategy of adding a false sample with 1 pixel in each SAR image to enhance the robustness of the network model.
2.4. Channel-Location Attention Mechanism (CLAM)
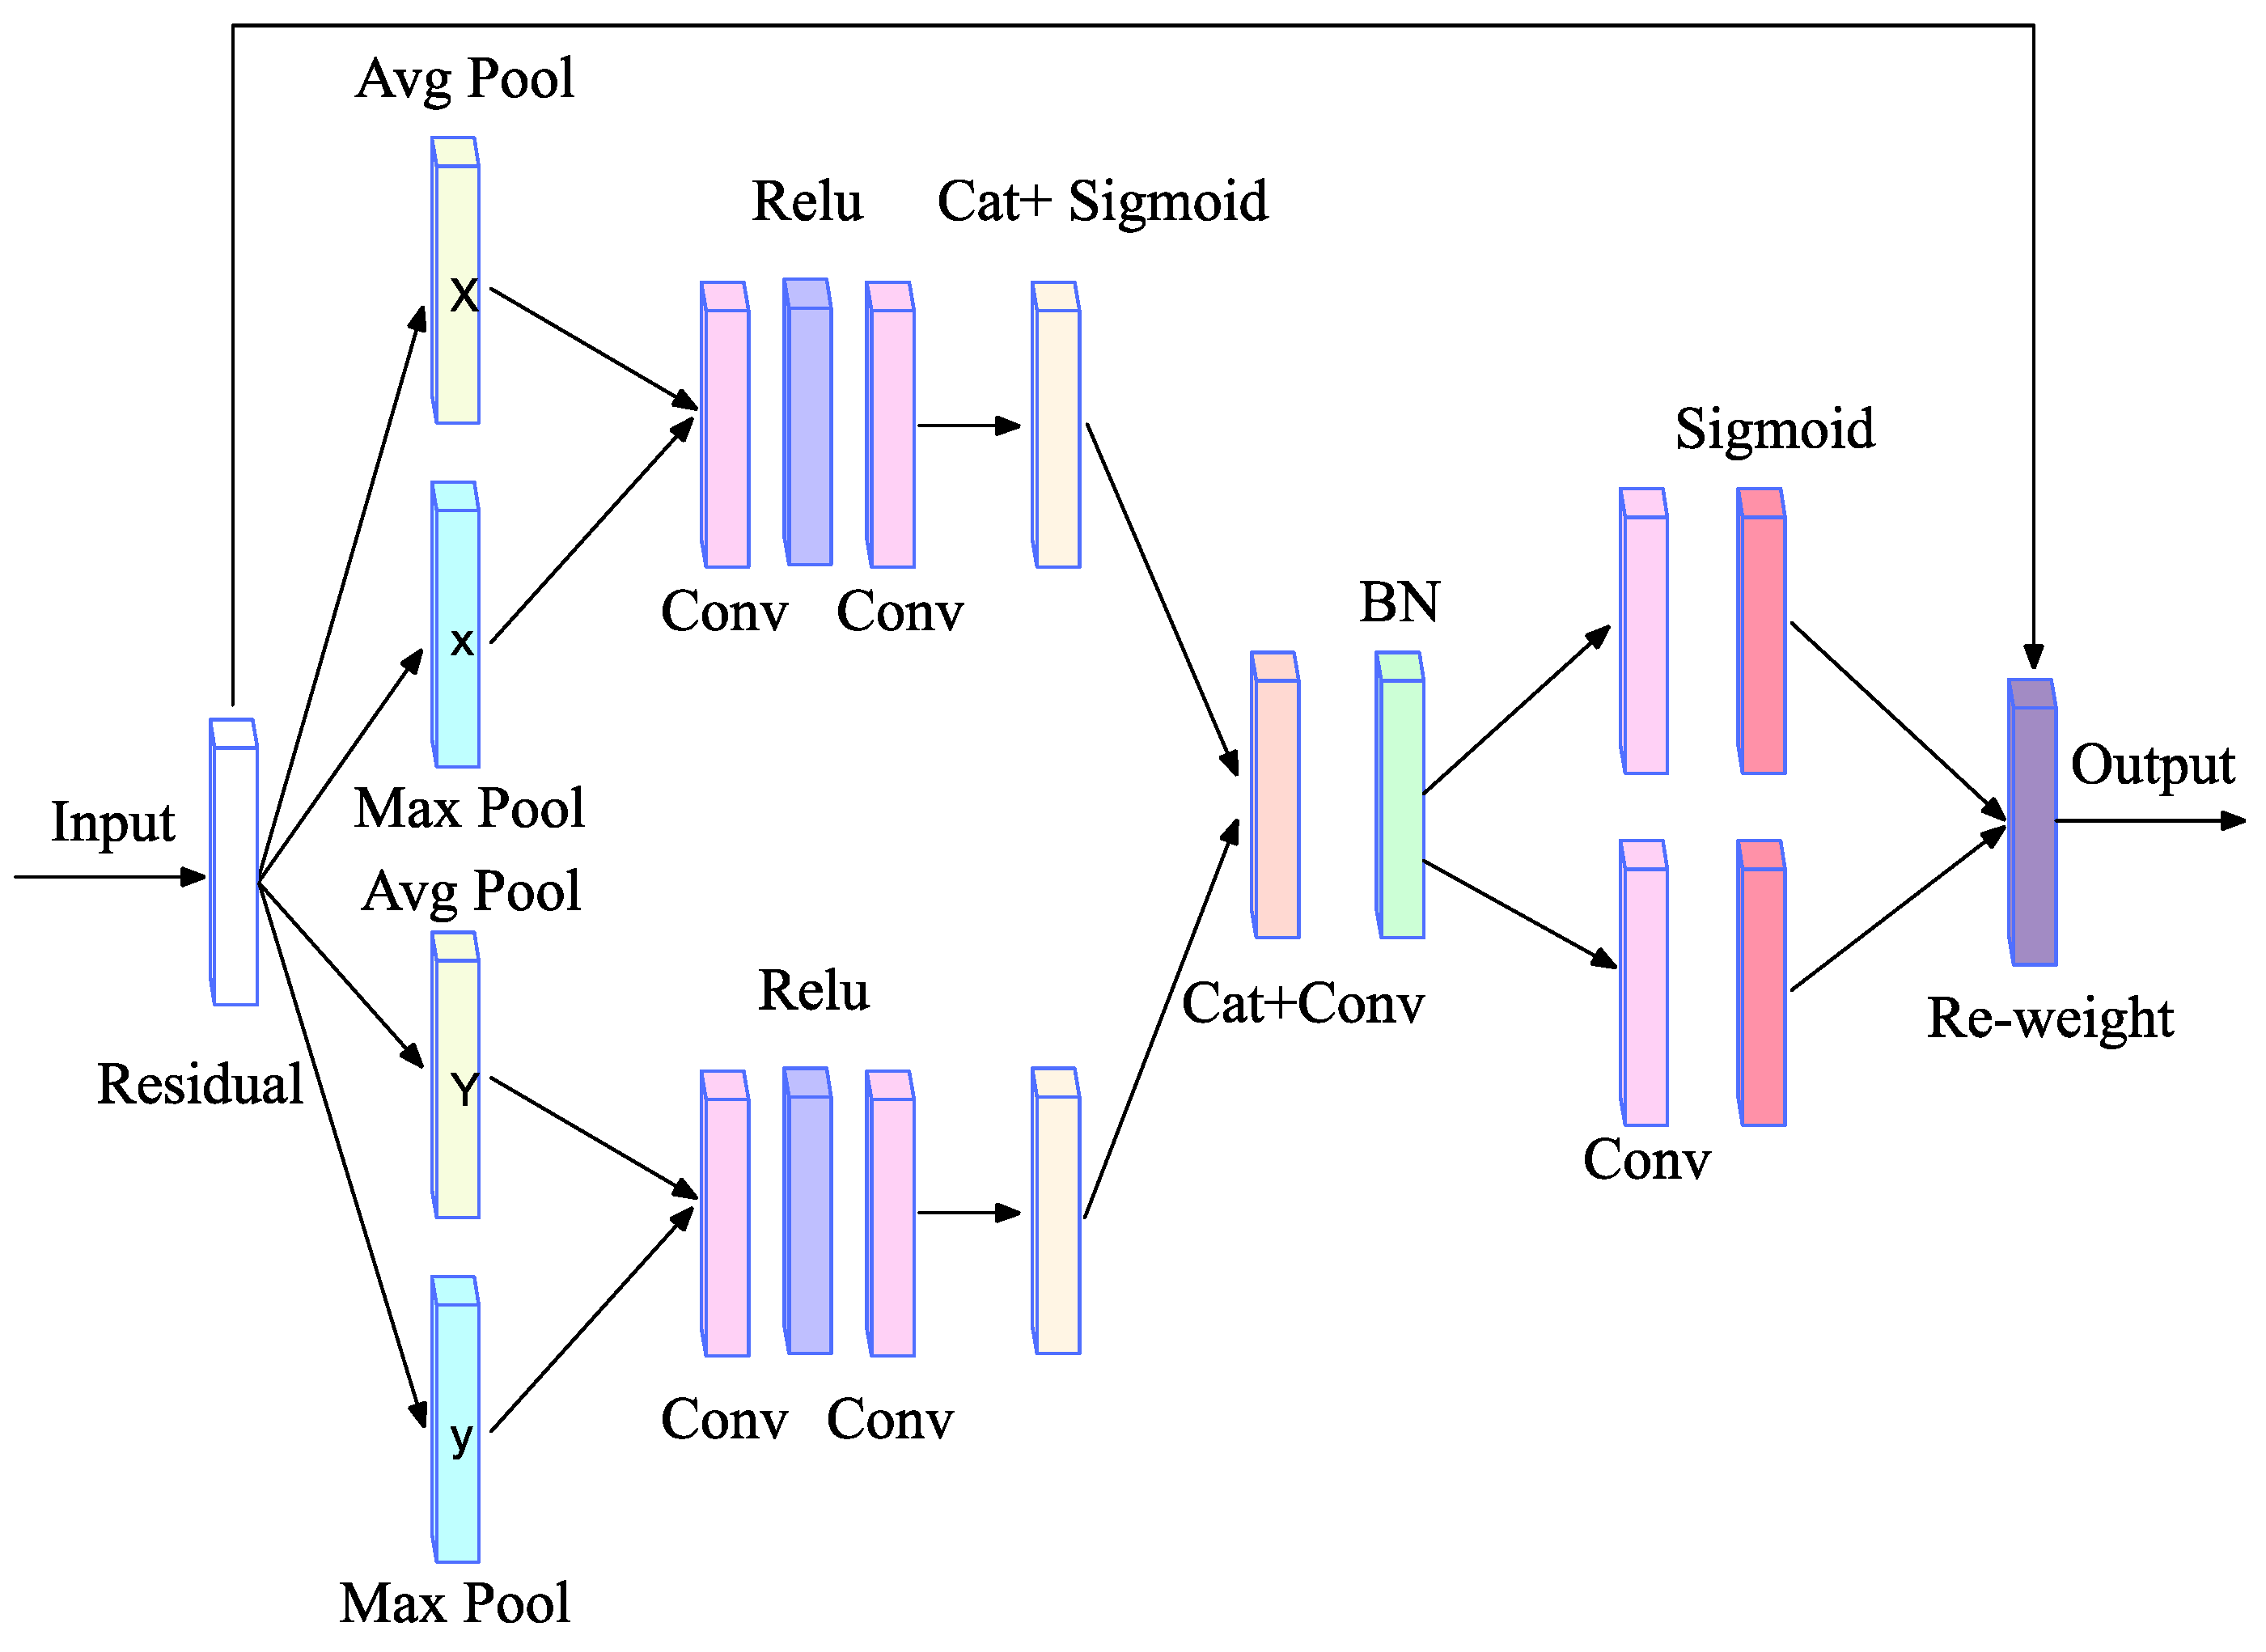
We use ResNet-50 as the backbone, as it mainly includes four residual modules. By using the residual modules, the flow of information is increased. In addition, the gradient vanishing problem and the degradation problem caused by networks that are too deep can be effectively avoided. The attention mechanism module CLAM is designed to improve the target location capability of the backbone network. The overall structure of CLAM is shown in Figure 3. It can be seen from the figure that the CLAM module extracts features from the X direction and the Y direction, respectively, and then summarizes features. Specifically, in the first stage, the two spatial extents of pooled kernels (H, 1) and (1, W) are used to integrate each channel information of the feature along the horizontal direction and the vertical direction respectively, and the feature is then decomposed into two parallel one-dimensional codes. Extracting features along two spatial directions can effectively extract location information and enhance the expressional ability of location features. Since there is a large amount of background information on the SAR ship images, an average pooling operation is used to retain the background information. In addition, the adaptive maximum pooling operation is also performed to highlight the main information of the target and enhance the texture information of the feature. The two pooling methods can realize the full use of the feature information. After the average pooling and maximum pooling is operated in each direction, the feature maps turn into ,, and . Here C, H, and W, respectively, denotes the number of input feature channels, the height of the input plane in pixels, and the width of the input plane in pixels, denotes the result of the average pooling operation of features along the vertical direction, denotes the result of the maximum pooling operation of the features along the vertical direction, represents the result of averaging pooling of features along the horizontal direction, and represents the result of the maximum pooling operation of the features along the horizontal direction. The output features of two directions can be expressed as:
where A1, A2, A3, and A4 represent the weight of the current step, b1, b2, b3, and b4 represent the bias of the current step and represent the output feature maps in the horizontal and vertical directions respectively, and F denotes the input feature map. Based on this method, accurate position information can be used to effectively capture spatial structures.
After the pooling operations, a convolution layer combination module is used to encode local spatial information. In the second stage, to make better use of representations with global receptive fields and accurate location information generated in the first stage, the processed feature maps of the two directions are cascaded to perform the global integration of features. Later, a convolution layer with kernel size 1 × 1 is used to transform and generate intermediate feature maps. The horizontal tensor and the vertical tensor are then segmented along the spatial dimension, respectively. The convolution operation is then used again, so that the number of output channels in the two directions is resumed the same as the input F. Finally, the two coefficients are multiplied with the previous input F. Now, the channel information processing and spatial information embedding are completed. Moreover, the CLAM module has a strong robustness and generalization ability, and it is easy to plug CLAM into any location of the network for feature enhancement. The final output of the CLAM module can be expressed as:
where and denote the final calculation results in the x-direction and y-direction respectively.
2.5. High-Level Features Enhancement Module (HLEM)
Inspired by the SPP-Net [47], we designed the HLEM module to improve the ability to detect small targets by compensating for the loss of location information at a high-level feature map of the backbone. The SPP-Net is used to realize the extraction of multi-scale features. Based on the scale features of small targets, smaller pooling kernels are adopted by the HLEM module to capture the location information of small targets more accurately.
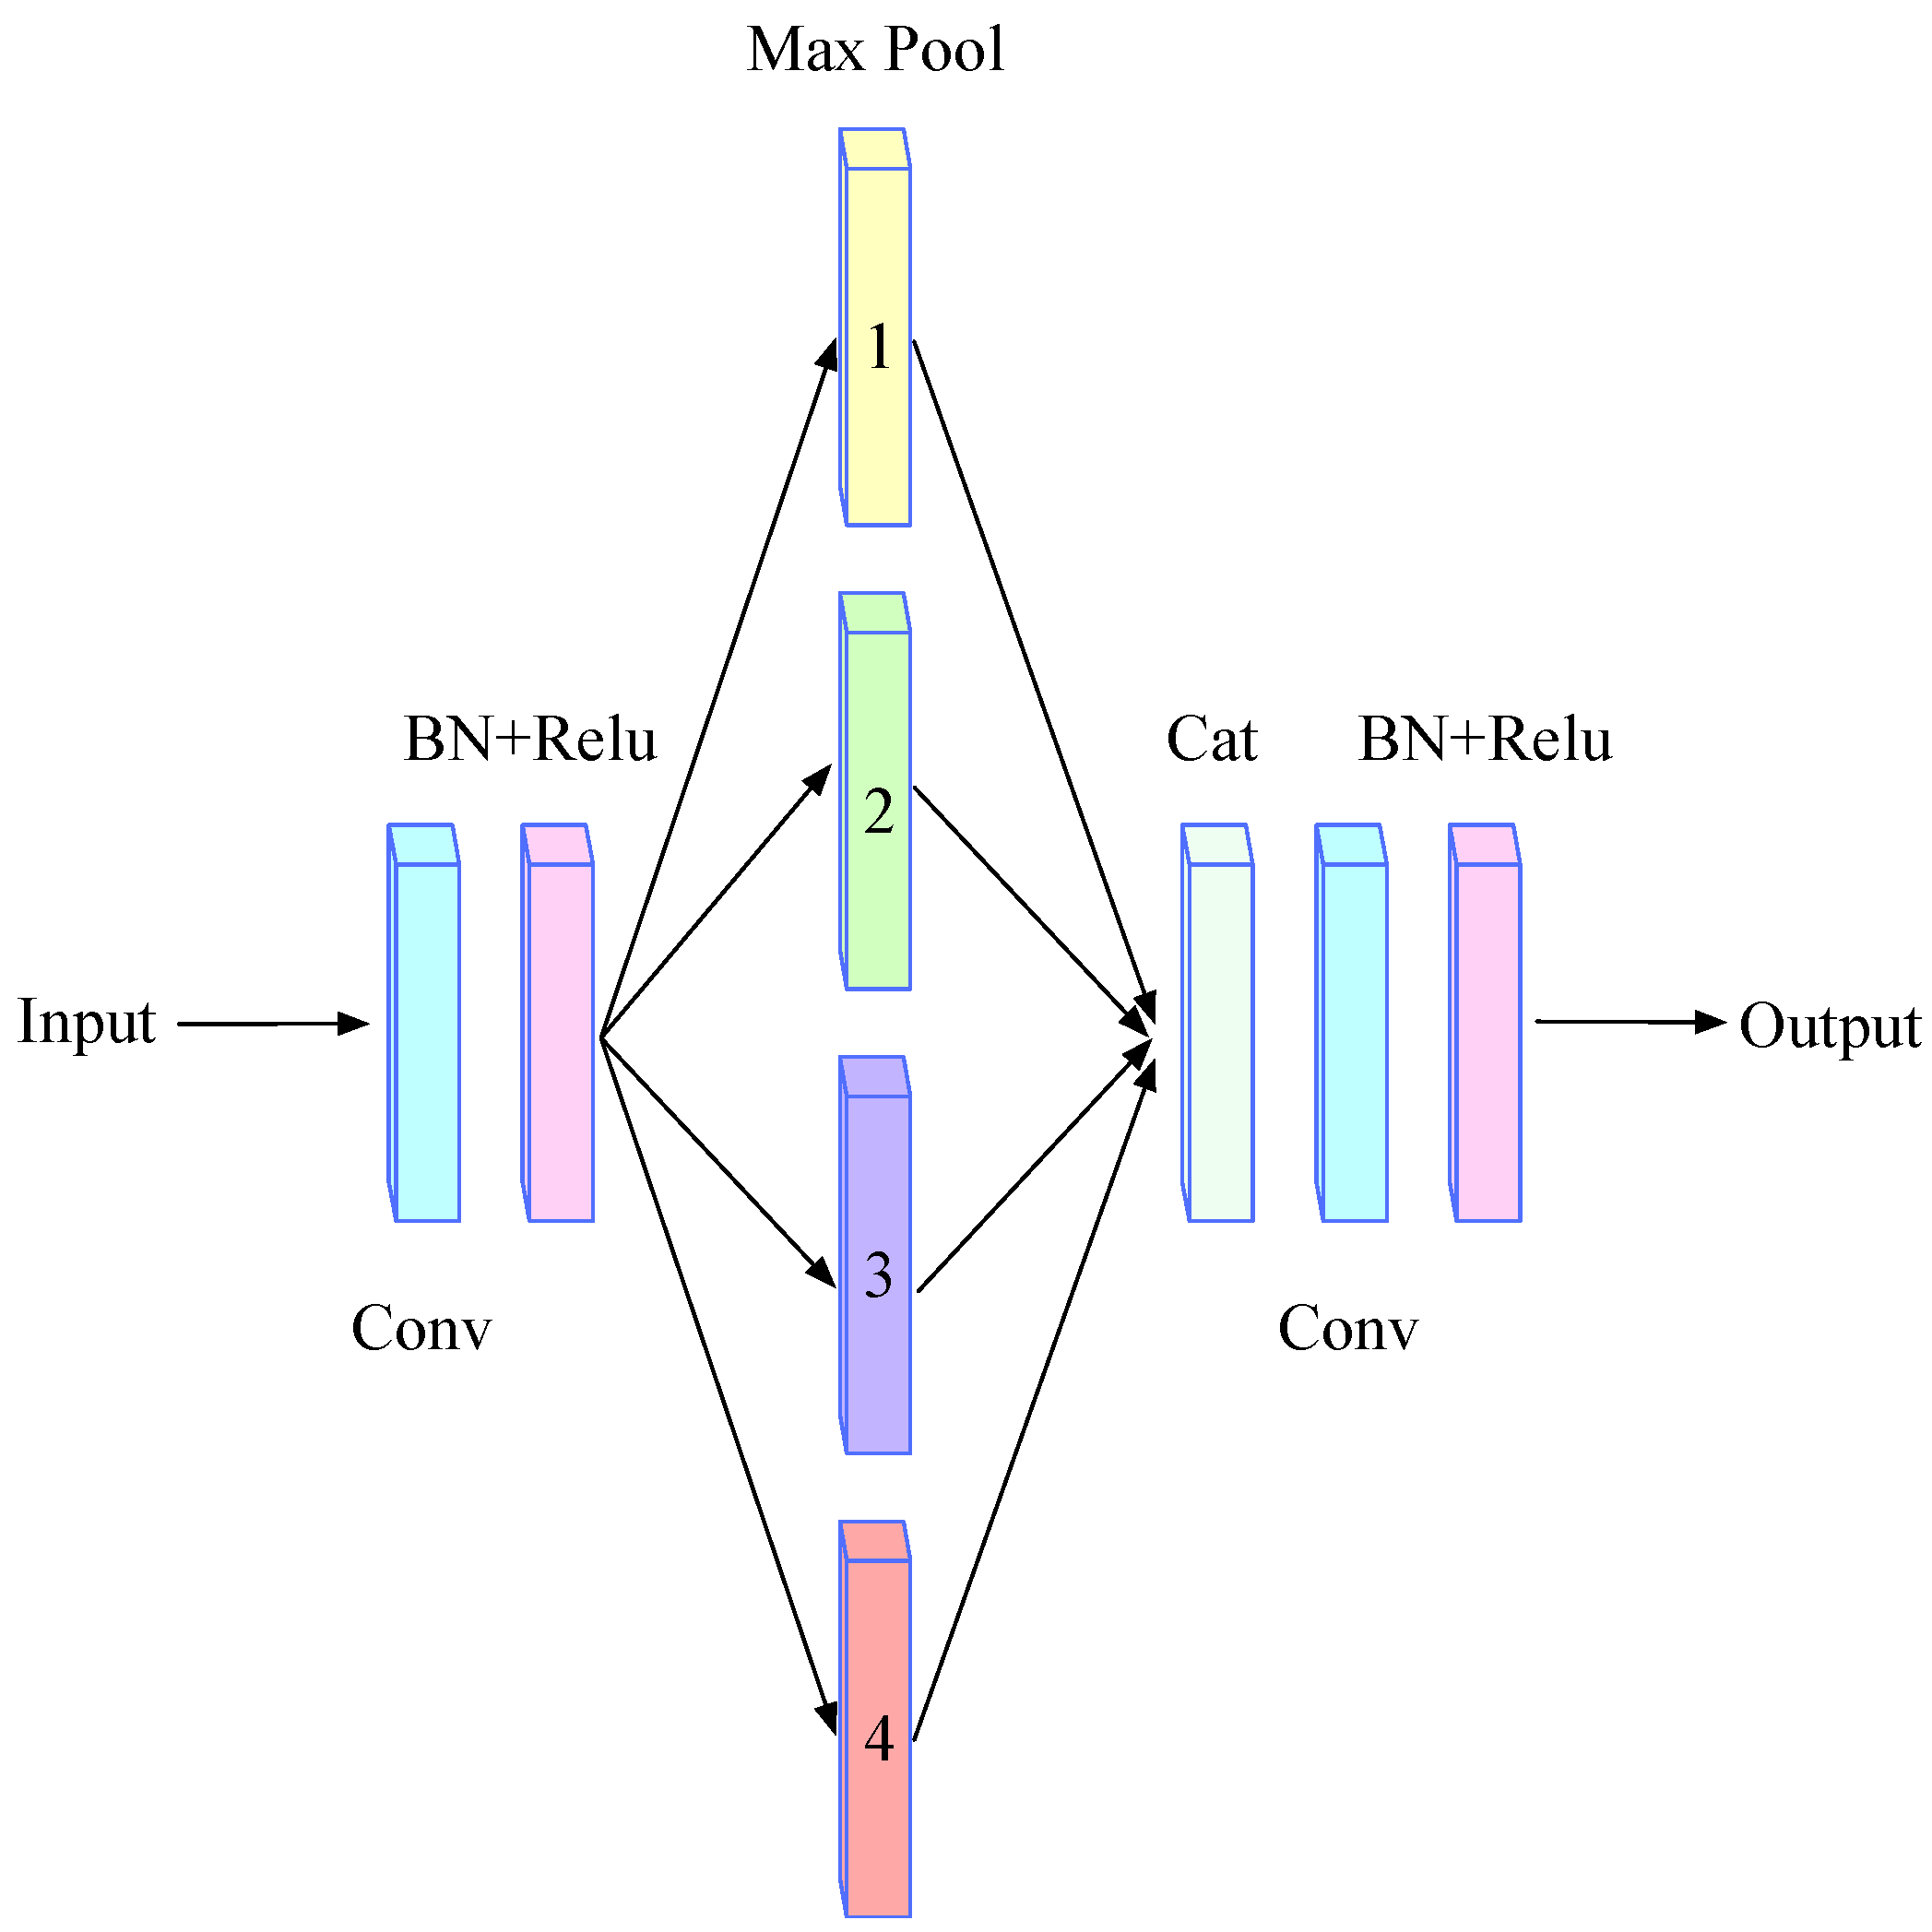
In the HLEM module, the method of lateral splicing features in SII-Net is not selected, instead, the features processed by multiple pooling layers are spliced with the original features along with the channel level, making up for the missing position features more fully. Its specific operation process is shown in Figure 4. Firstly, a convolution layer with kernel size 3 × 3 is used for down-sampling. Secondly, the processed feature maps are sent to pooling layers of different scales for pooling operations, the multiscale pooling layers can not only help our network extract location information but also extract different fine-grained features. To avoid destroying global features, the HLEM module then directly splices the parallel multi-level pooling layer and uses a 3 × 3 convolution to integrate the channel dimension. Lastly, the HLEM module is fused with the highest-level output feature of the backbone network. The characteristics output of HLEM can be represented as:
where denotes the result of the maximum pooling operation, i denotes kernel size of the pooling, and ‘+’ represents the activation function.
2.6. A Refined Branch
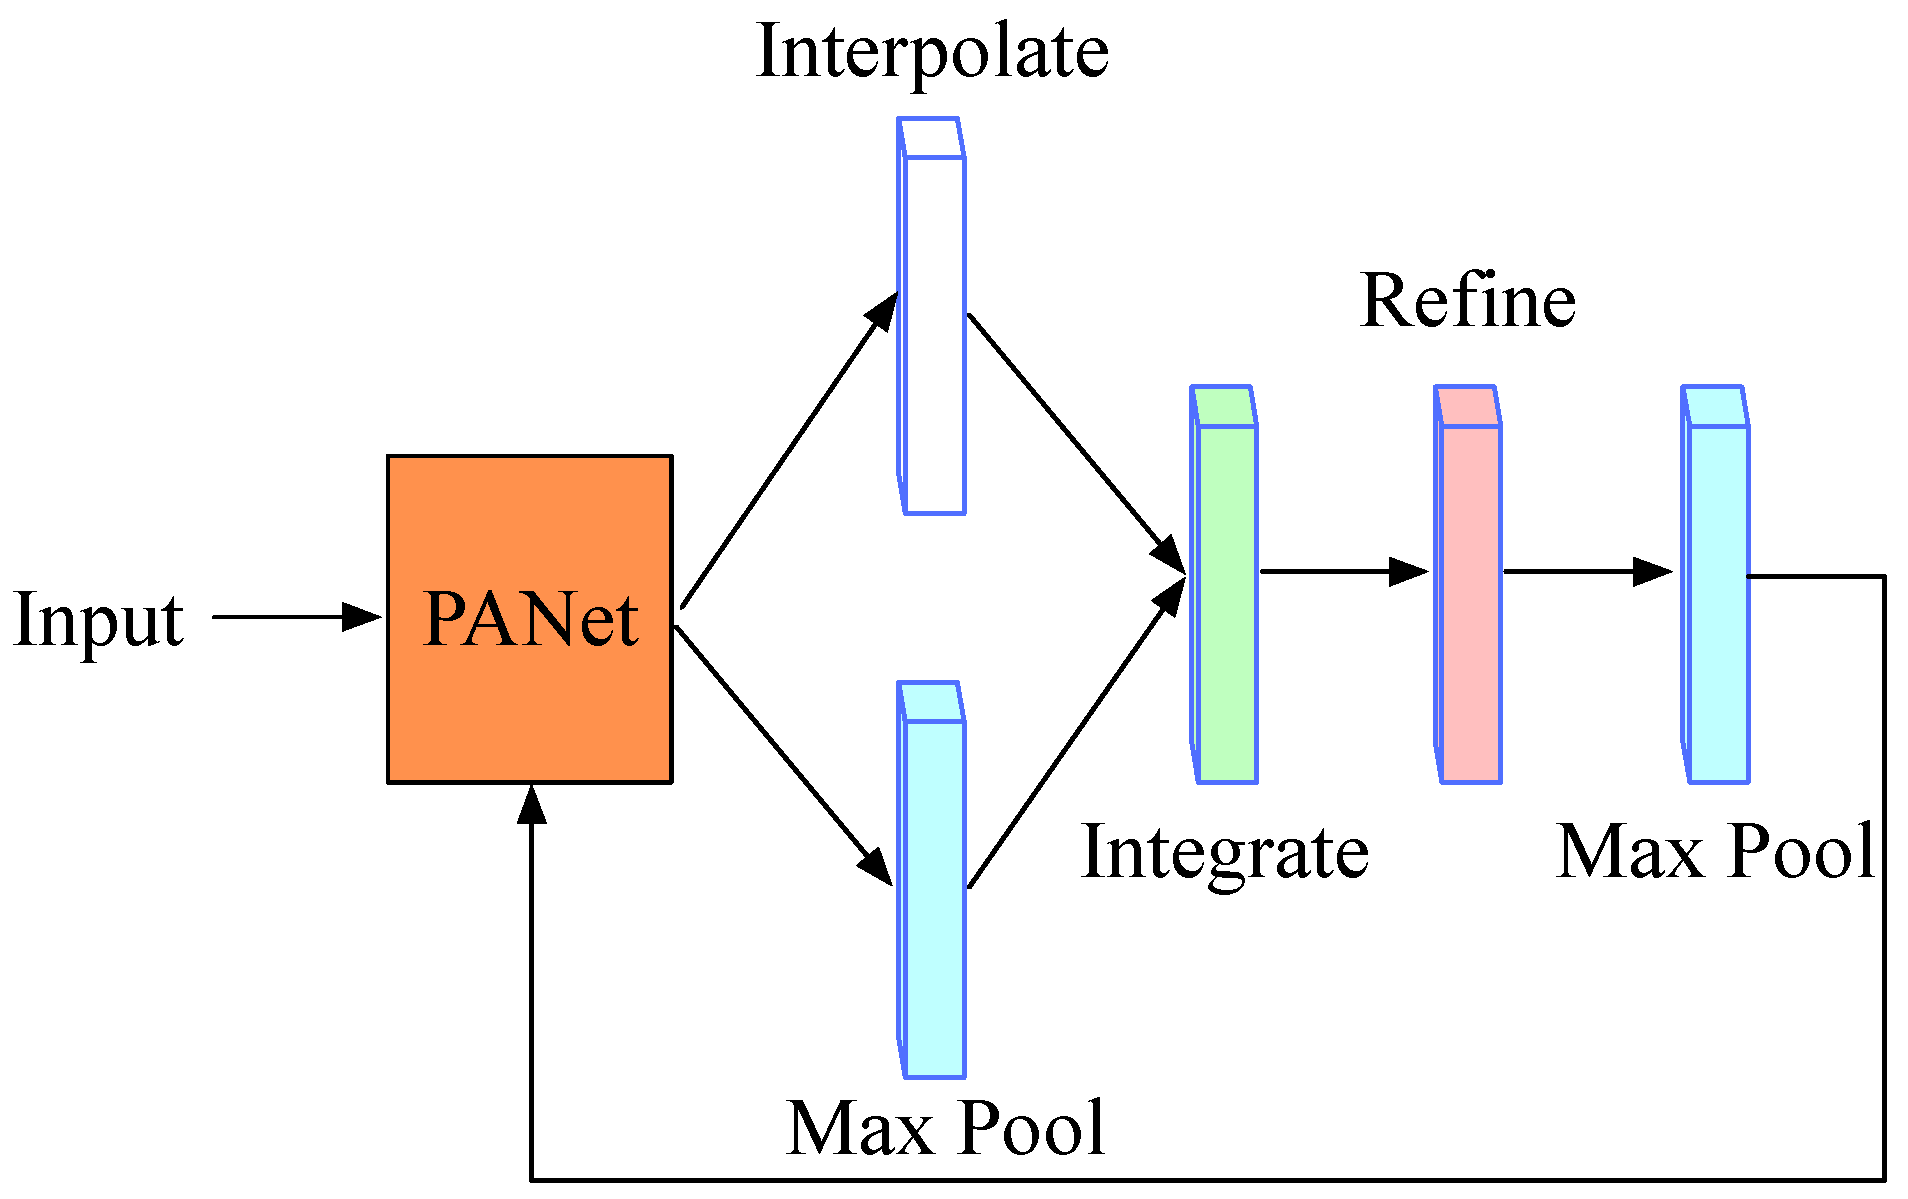
At present, the network mainly relies on the feature pyramid to improve the recognition ability of small targets. SAR ships show different characteristics at different levels of the pyramid. The PANet is improved based on the FPN, which adds a bottom-up pyramid after the FPN to deliver effective positioning information for the underlying features. However, for the SAR images, if PANet is used alone in the detection process, the small targets are still easily submerged by surrounding noise. To further refine the characteristics output of the PANet and effectively enhance the ability of the network to distinguish targets from the background, we design a new refined branch. The specific operation of the refine branch is shown in Figure 5. Its main process of feature refinement is as follows. The PANet network has five layers of output, i.e., , , , and . At first, any feature layer of the output is selected (the middle layer is recommended), and the maximum pooling operation is used for up-sampling of the low-level features ( and ) which are under the selected layer, and the interpolation method is used for processing the high-level features ( and ) which are above the selected layer. In this way, the scale of each feature layer can be converted to the same scale as our selected feature layer. Next, the processed features are accumulated to achieve feature fusion, and the fused feature has rich location information and detailed information. The fused feature can be represented as:
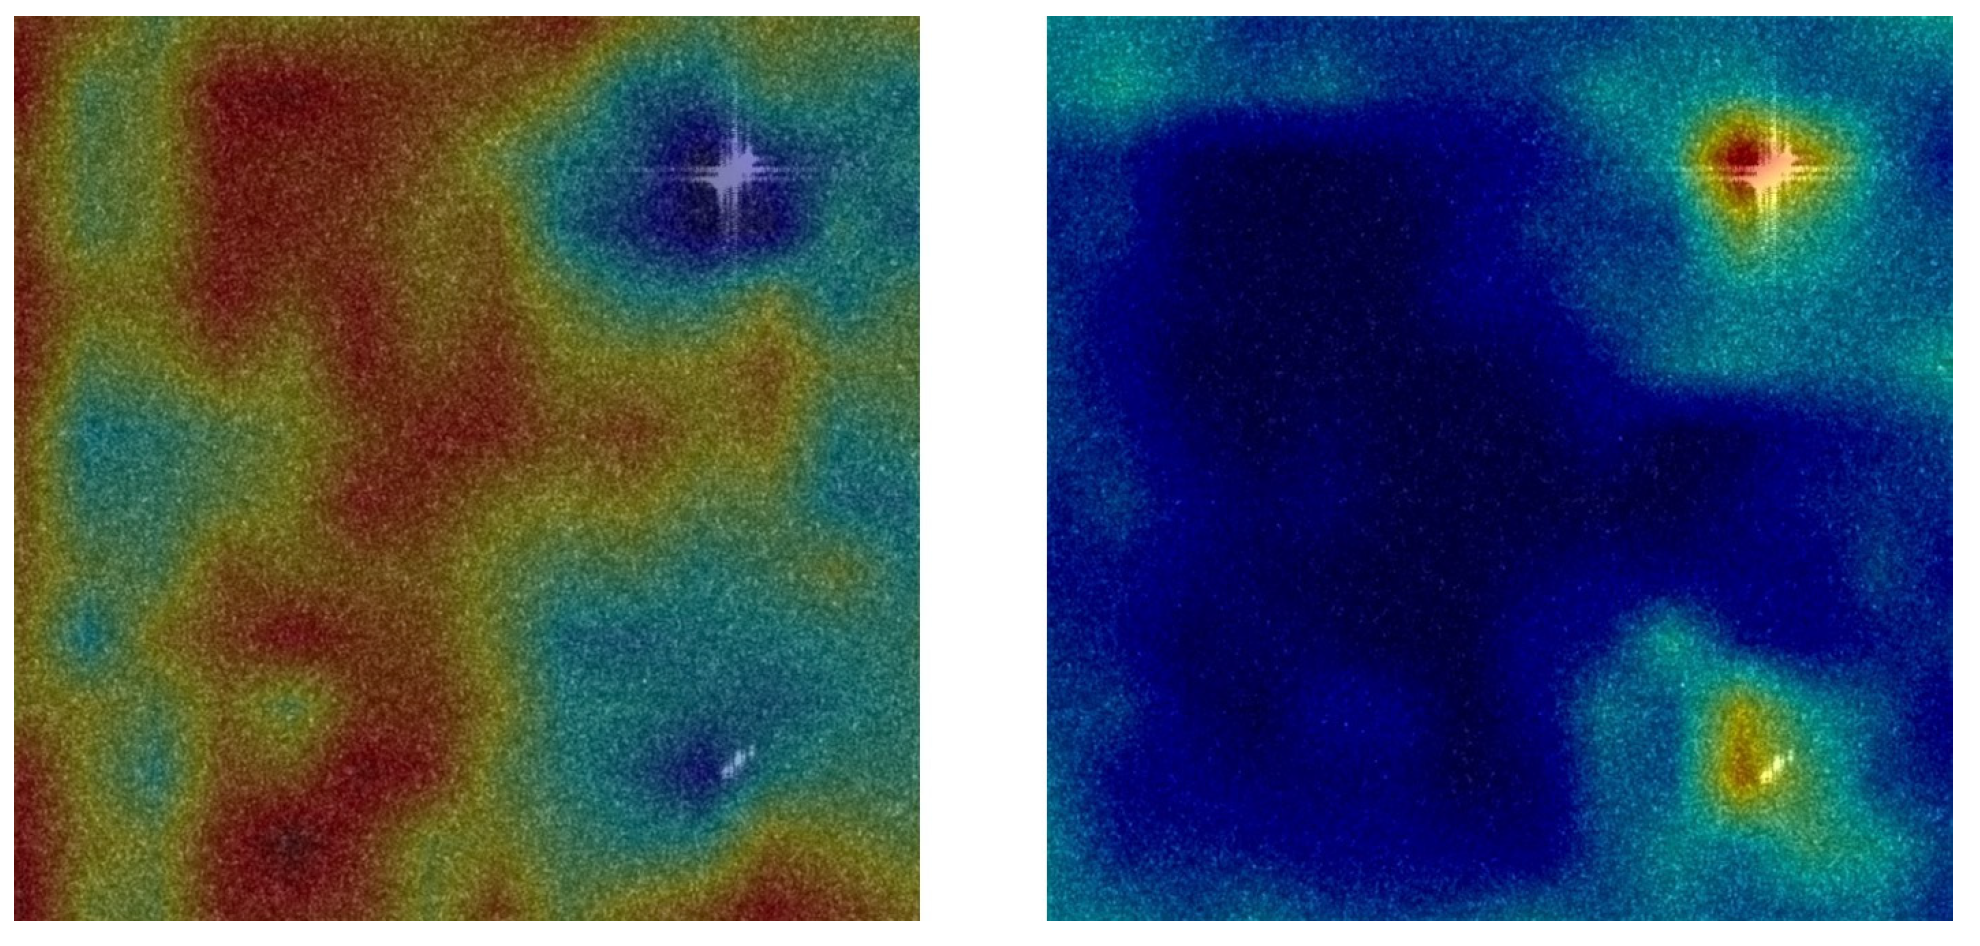
where denotes the input feature, i represents the number of the current feature layer, r represents the number of the feature layer that we appoint, denotes the interpolation operation in the near mode, and represents the maximum pooling operation. C denotes the total number of feature layers. The non-local [48] method, which can realize the weighting of all position features when calculating the feature response of a certain position, is then used to further refine the fused feature. After this, the adaptive maximum pooling operation is employed to enhance the texture information of the targets. In the end, features processed by pooling are merged with the PANet to highlight target features and reduce ambient background noise infection. After the refinement of the features, as shown in Figure 6, the network will make the features of the target more visible, focusing on the target area and greatly reducing the focus on the background. The final output is expressed as:
where denotes the output feature of the PANet, and N represents the non-local operations.
3. Experiments
3.1. Introduction of the Datasets
- (1)
- LS-SSDD-v1.0: LS-SSDD-v1.0 is a large-scale background SAR ship detection dataset. There are 15 large-scale images with 24,000 × 16,000 pixels in LS-SSDD-v1.0 from Sentinel-1 (the first 10 images are selected as a training set, and the remaining are selected as a test set). The 15 large-scale images are cut into 9000 sub-images with 800 × 800 pixels by the publisher of the dataset. At the same time, it contains a wealth of pure background images. SAR ships in LS-SSDD-v1.0 are provided with various resolutions around 5 m, and VV and VH polarizations. According to the setting of the original reports in [31], the training set has 6000 images, and the test set has 3000 images. We set the ratio of the training set and test set to 6:3. This is mainly used for small ship detection.
- (2)
- SSDD: SSDD is the first public SAR ship detection dataset proposed by Li et al. in 2017. It consists of 1160 images of approximately 500 × 500 pixels, acquired by RadarSat-2, TerraSAR-X, and Sentinel-1. The dataset contains 2540 ships, with resolutions ranging from 1 m to 15 m, and HH, HV, VV, and VH polarizations. We set the ratio of the training set and test set to 8:2, the last number of the picture name is 1 or 9 is set as the test set, and the rest is set as the training set.
- (3)
- SAR-Ship-Dataset: The SAR-Ship-Dataset is a SAR ship detection dataset published by Wang et al. in 2019. There are 43,819 images with 256 × 256 pixels from Sentinel-1 and Gaofen-3. It contains 59,535 ships with a resolution of 3 m, 5 m, and 8 m, etc., and HH, HV, VV, and VH polarizations. In the same way as the original reports in [33], we randomly set the ratio of the training set, validation set, and the test set to 7:2:1.
The proportion of targets in different scales is shown in Figure 7. It can be seen that the targets with a pixel value of less than 30 pixels by 30 pixels account for a large proportion of the overall targets in LS-SSDD-v1.0. However, in SSDD and SAR-Ship-Dataset, small-size targets do not occupy the main part.
3.2. Evaluation Criterions
We adopted evaluation indices, including precision (p), recall (r), and mean average precision (), to evaluate the detection performance of different detection methods, i.e.,
where represents the number of true positives, represents the number of false positives, and denotes the number of positive negatives. Because the considers both precision and recall, it is used to measure the final detection accuracy:
The denotes the precision-recall curve.
3.3. Implement Details
For the experimental platform, we used lntel®Xeon(R) Gold 5118, 2.3 GHz twelve-core processor, 17.6 GiB memory, NVIDIA GeForce GTX 1080ti 12 g graphics card. The software environment that we used was the ubuntu 16.04 64-bit operating system. The programming language used was python 3.7. The GPU computing platform is PyTorch 1.2.0. CUDA 10.1 and cuDNN 7.6. SII-Net uses the stochastic gradient descent (SGD) optimizer with an initial learning rate of 1 × 10⁻², optimizer momentum of 0.9, and weight decay of 1 × 10⁻⁴. Moreover, the learning rate is reduced by 10 times per epoch from 8-epoch to 11-epoch to ensure an adequate loss reduction. Images in LS-SSDD-v1.0, SSDD, SAR-Ship-Dataset are resized as the 1000 × 1000, 700 × 700, and 400 × 400 image sizes for training. SII-Net and the other SAR ship detectors are implemented under the MMDetection [49] toolbox to ensure fairness of the result. When performing our detection method in the test stage, we set the score threshold as 0.5.
3.4. Results on Small Target Dataset LS-SSDD-v1.0
Since the SII-Net network is aimed at improving the detection effect of small-size targets, we first conducted experiments on the small target dataset LS-SSDD-v1.0 to prove the effectiveness of our algorithm. Table 1 shows the quantitative comparison with the other 14 competitive SAR ship detectors on LS-SSDD-v1.0. Whether it is for algorithms with the attention mechanism modules or the algorithm that uses LS-SSDD-v1.0 publicly, SII-Net achieves the best 76.1% mAP on the entire scene. The second-best detector is SA Faster R-CNN+PBHT, which is the best performing method among the public results at this stage, but SA Faster R-CNN+PBHT is still lower than SII-Net by ~1.0% mAP.
To further verify the superiority of our algorithm on small target detection, we used the detector Double-Head R-CNN (achieved the best performance among all approaches opened source codes) and the SII-Net network to evaluate the object in the LS-SSDD-v1.0 dataset at four scales. It defines the targets with a scale between (0,900) as small targets and targets with a scale between (0,100) as extremely small targets. The evaluation results are shown in Table 2 and Table 3. Compared with the Double-Head R-CNN, SII-Net has improved the detection effect of targets the scale of which is in the range of (0,100), (100,400), and (400,900) by 9.6% mAP, 11.9% mAP, and 2.4% mAP, respectively. It can be concluded that the improvement effect of SII-Net on small target detection is more prominent, highlighting the best detection performance of our detector on small target detection. This shows that SII-Net is efficient in integrating spatial feature information and improving the detection result of small targets.
In addition, we also used the SII-Net algorithm to test the objects in inshore scenes and offshore scenes on the LS-SSDD-v1.0 dataset. As shown in Table 4 and Table 5, SII-Net all achieves the best detection performance. The inshore detection environment is much more complex than the offshore, and the improvement in inshore target detection confirms that the SII-Net owns strong robustness in complex scenarios and can successfully suppress the surrounding noise of the target.
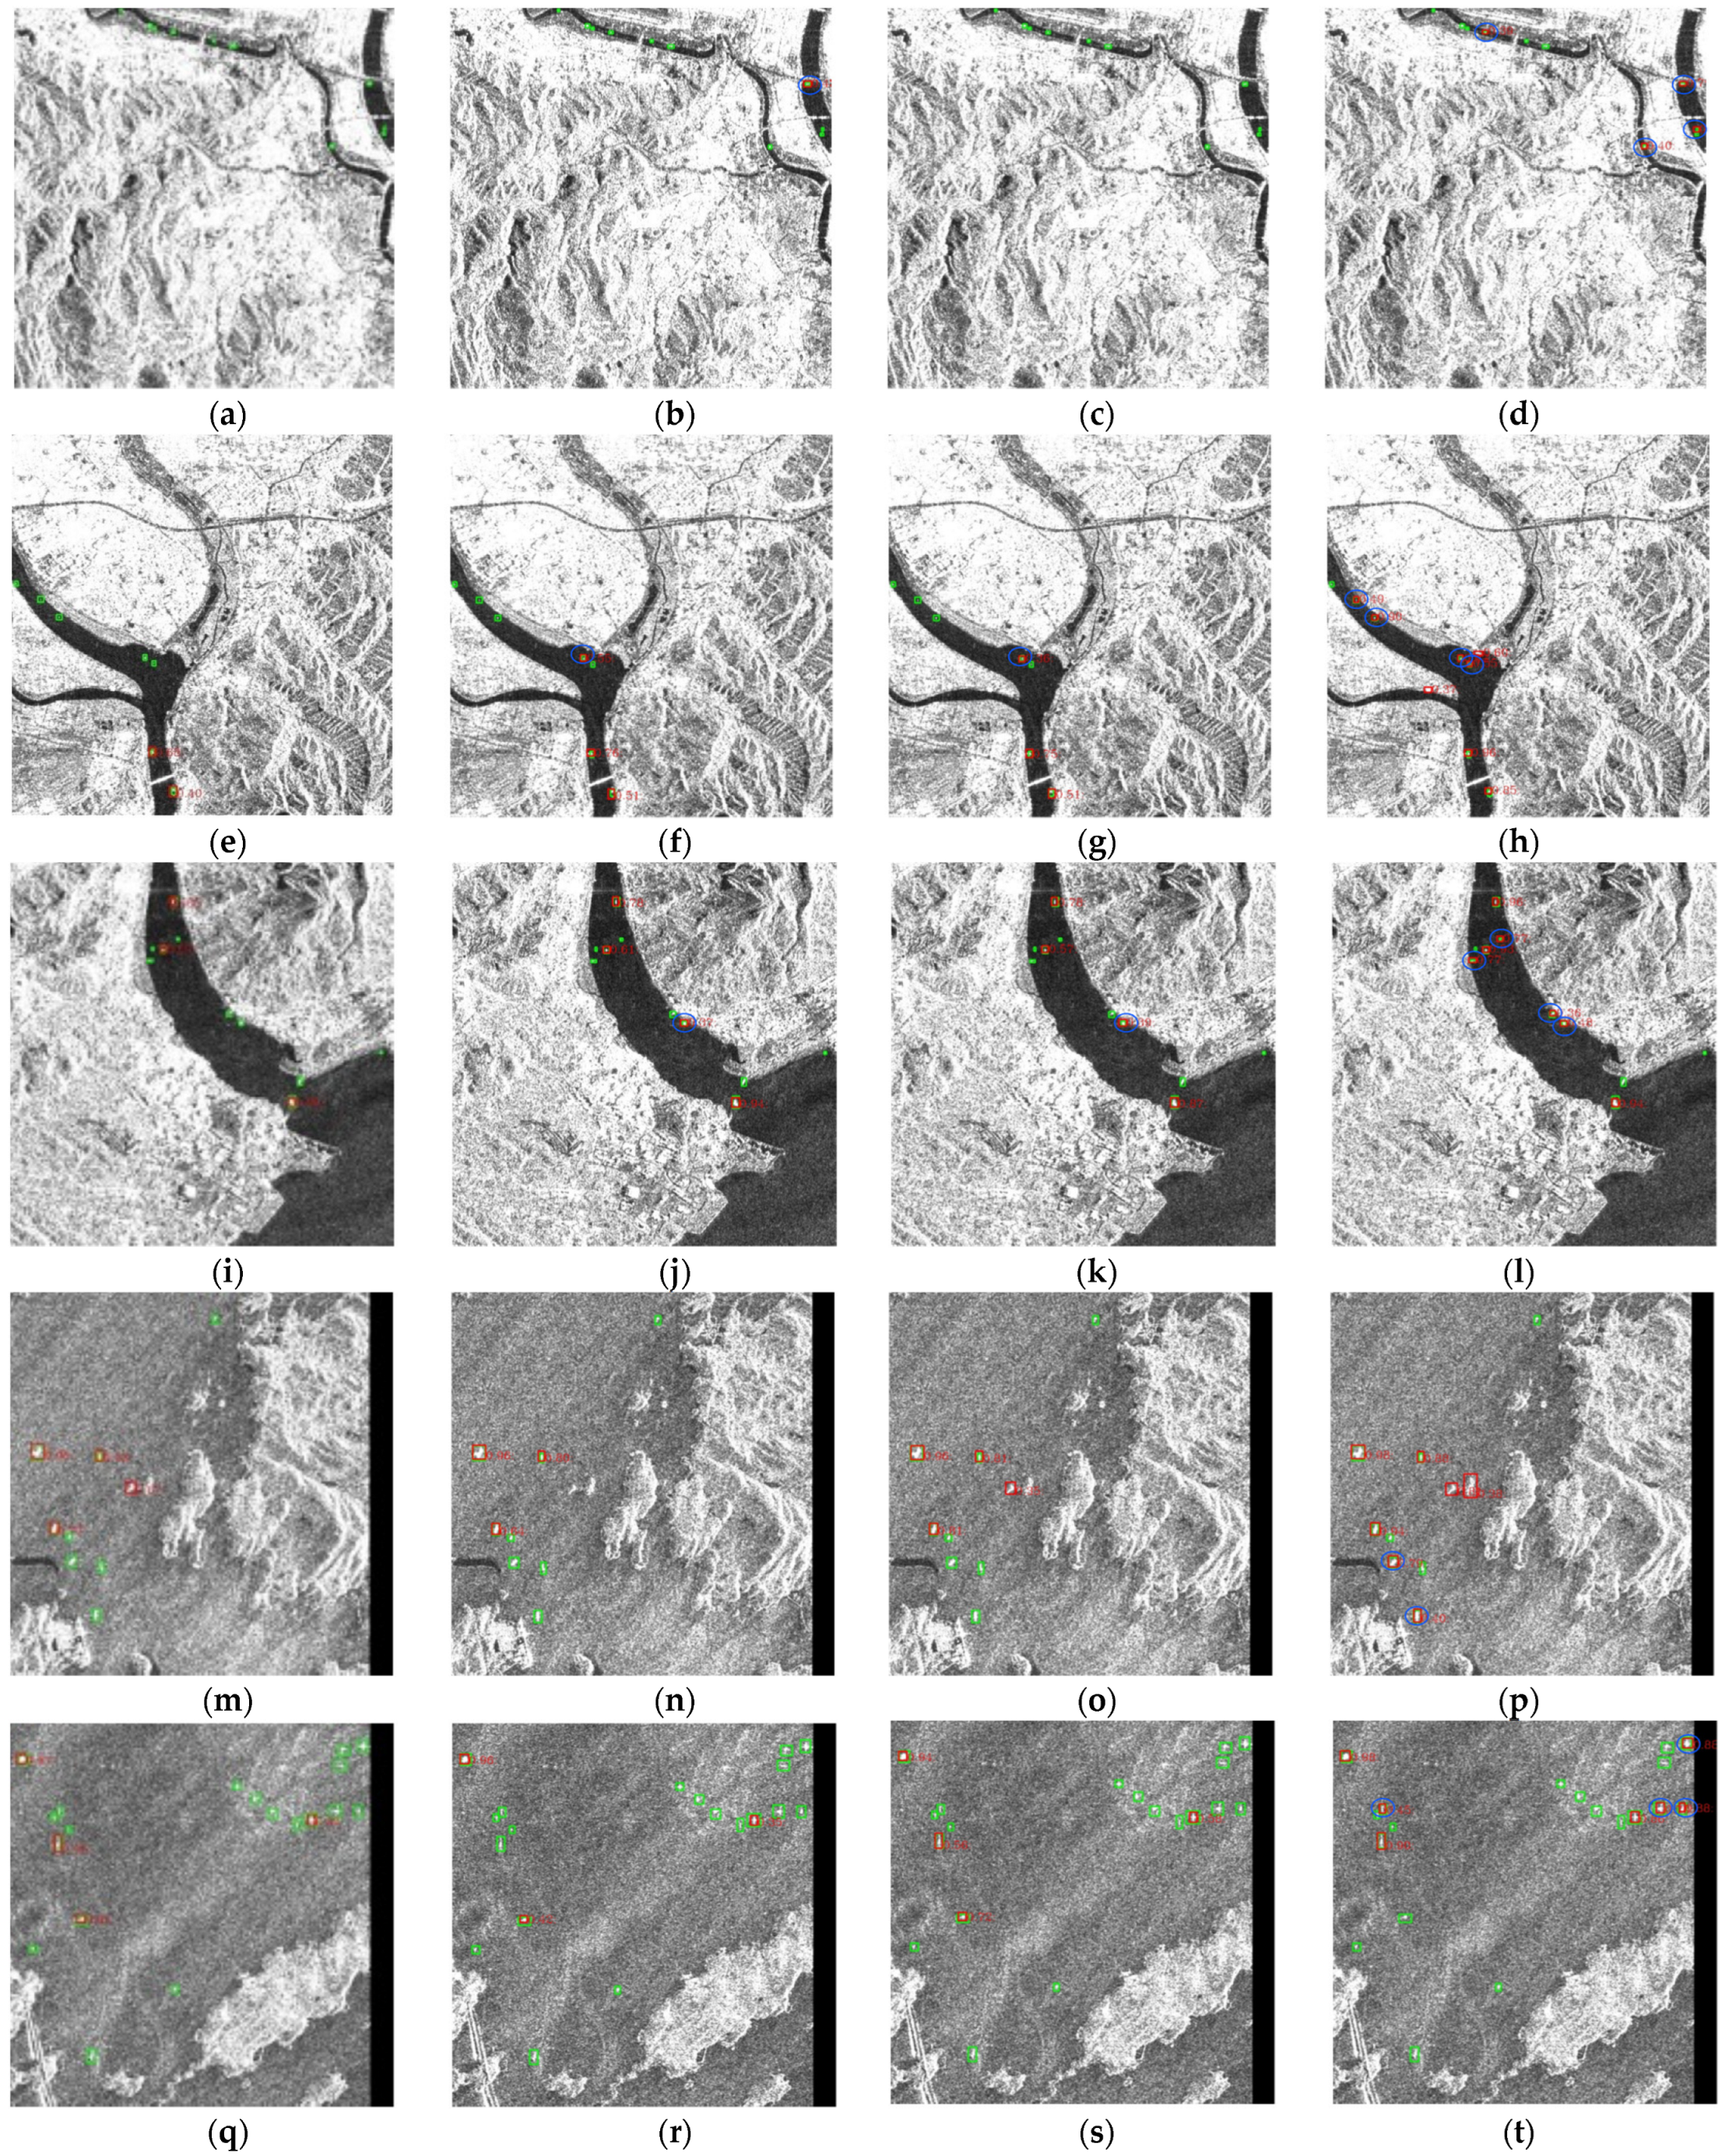
Figure 8 shows the qualitative results on LS-SSDD-v1.0. In Figure 8, SII-Net is compared with Faster R-CNN, DCN, and Double-Head R-CNN in inshore scenes. Ground truths are marked by green boxes and detection results are marked by red boxes. Compared with other methods, the new correct detection results of SII-Net are marked by a blue circle. Figure 8a,e,I,m,q represent the results of Faster R-CNN. Figure 8b,f,j,n,r represent the results of DCN. Figure 8c,g,k,o,s represent the results of Double-Head R-CNN. Figure 8d,h,l,p,t represent the results of SII-Net. There are many noise interferences in the figures, and it is very difficult to accurately locate small targets. However, it can be seen that while the SII-Net achieves the best detection results, no false alarms are generated significantly. This is mainly because the refine path branch we designed can effectively highlight the target features and reduce the similarity between the target and the background.
3.5. Results on Other Datasets
To verify the generalization of SII-Net on other mainstream SAR image ship datasets, we also performed SII-Net on the other two datasets. On SSDD, as shown in Table 6, our algorithm has achieved the best 95.5% mAP (on the entire scenes), and the second-best one is 95.2% mAP from Quad-FPN. On SAR-Ship-Dataset, as shown in Table 7, our algorithm achieved the third-best 93.2% mAP (on the entire scenes), and the best detector is 94.3% mAP from Quad-FPN. For these two datasets, the superiority of the SII-Net is not particularly outstanding. This is because the proportion of small targets in these two datasets is not large (as shown in Figure 7). However, SII-Net is mainly aimed at small targets. Especially for SAR-Ship-Dataset, due to it being relatively simple, the detection results of each method at this stage are close. For the most studied dataset SSDD in the field of SAR image detection, SII-Net achieves the best detection results, which shows that SII-Net has excellent robustness and generalization ability.
4. Ablation Experiment
In this section, we take LS-SSDD-v1.0 as an example, where ‘O’ means that the module is not added, and ‘P’ means that the module is added. We first discuss the overall effectiveness of the algorithm. It can be seen from Table 8 that in the process of module accumulation, the detection accuracy of the algorithm gradually changes from 71.9% to 76.1%. This shows the validity of our overall structural design.
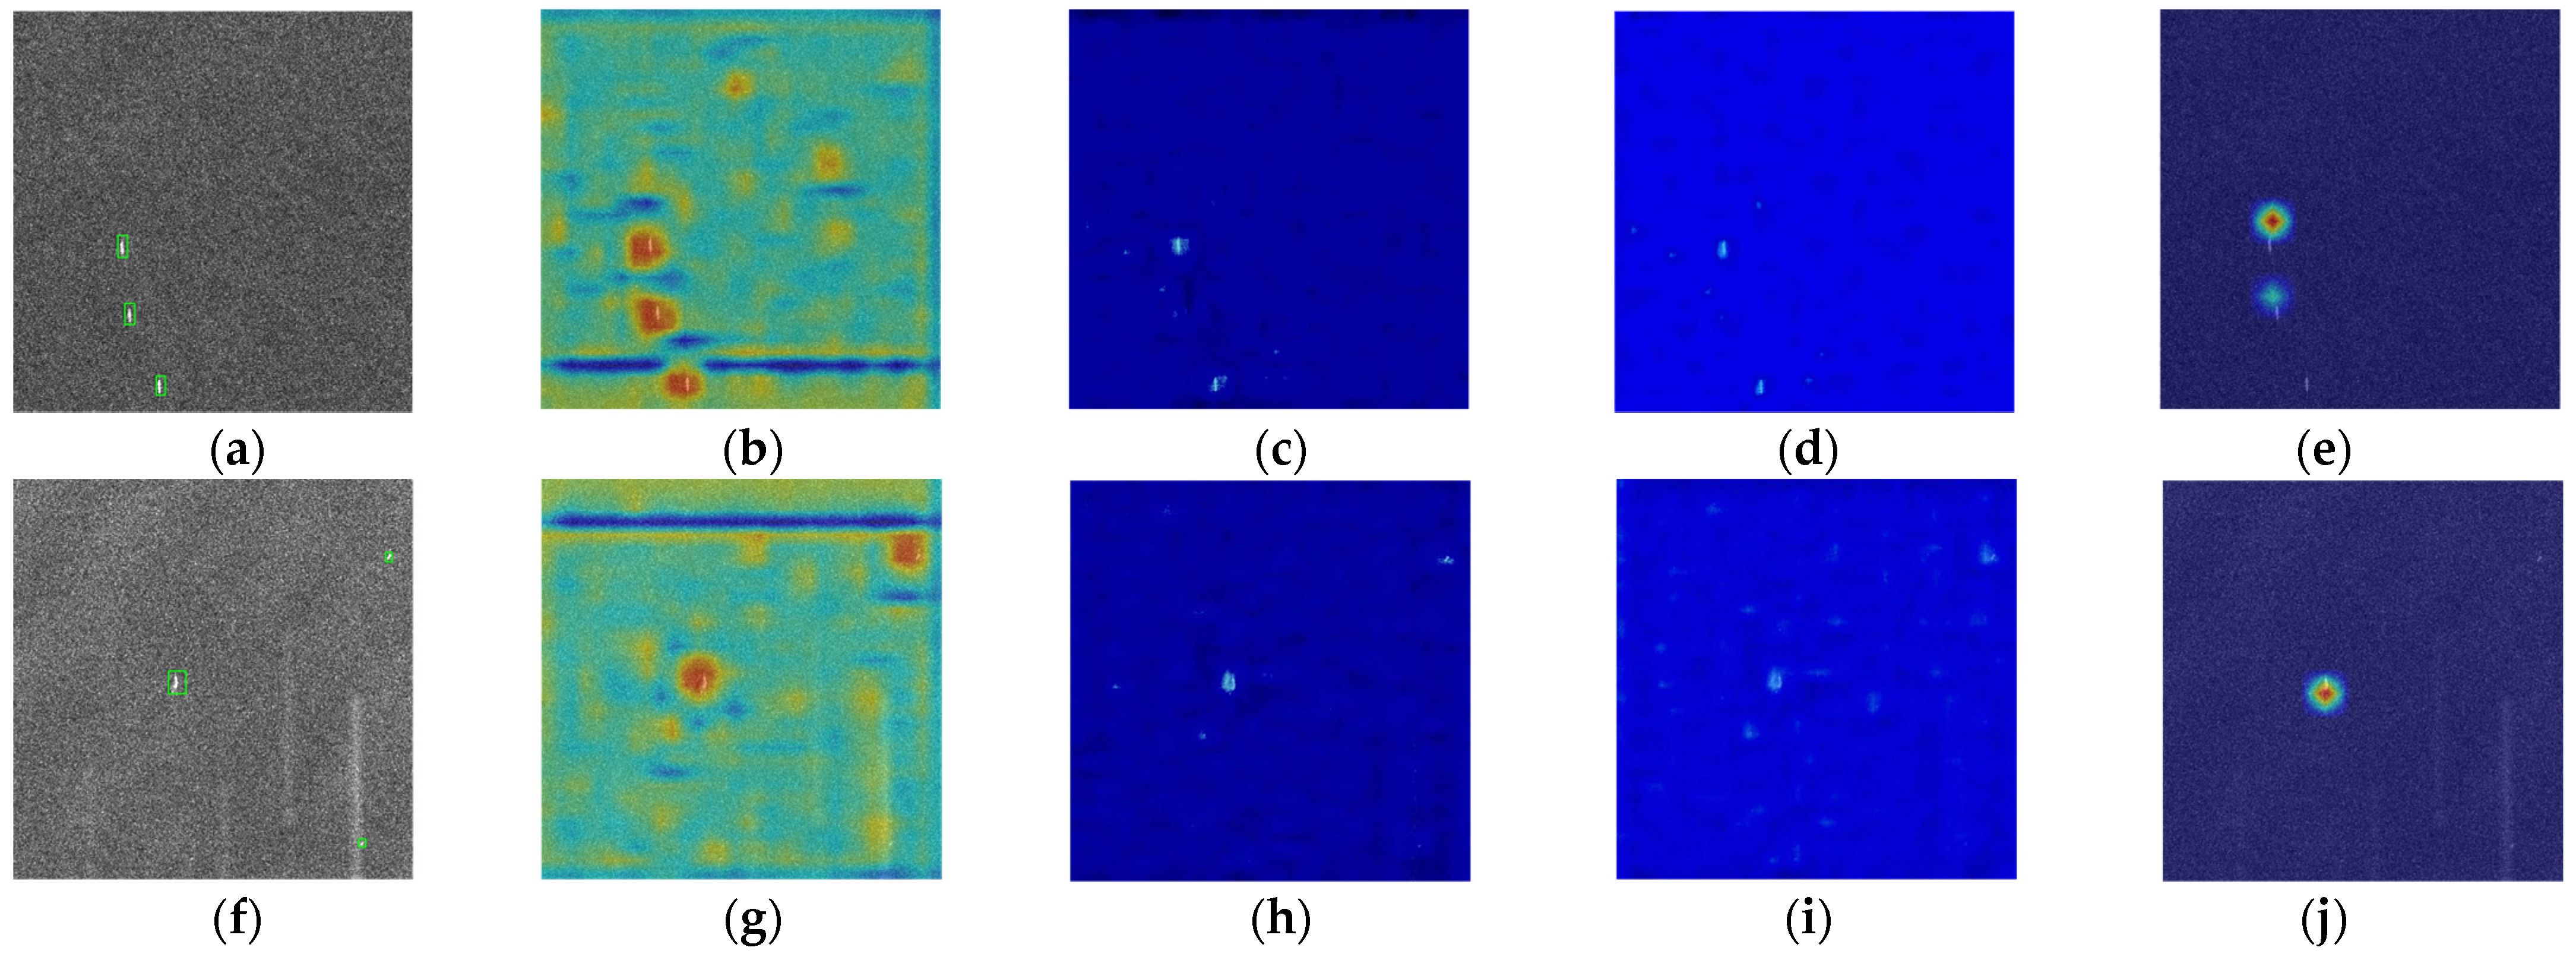
To visually assess the effectiveness of the three innovation modules, we visualize their intermediate heatmaps. Figure 9a,f represent the original image. Figure 9b,g represent the heatmaps of the basic algorithm. Figure 9c,h represent the heatmaps of the CLAM module. Figure 9d,i represent the heatmaps of the HLEM module. Figure 9e,j represent the heatmaps of the refined branch. As shown in Figure 9, the brighter color in heatmaps represents the target area predicted by the network. It can be seen that, compared with the base algorithm, the three innovation modules can not only reduce the noise background in the image but also accurately locate the target.
4.1. Effectiveness of CLAM
Table 9 and Table 10 show the results of the CLAM module ablation experiment, when the other two modules are added and not added together, the CLAM module has improved the overall test results. This proves that the CLAM module effectively enhances the extraction of location information and improves the detection ability of the backbone network.
4.2. Effectiveness of HLEM
Table 11 and Table 12 shows the results of the ablation experiment of the HLEM module, when the other two modules are added and not added together, the HLEM module has improved the overall effect of the algorithm to a certain extent. This shows that the HLEM module can explicitly compensate for the loss of high-level location information in the detection process and improve the detection ability of the high feature layer for small targets.
4.3. Effectiveness of R-Branch
Table 13 and Table 14 shows the results of the ablation experiment of the R-branch, when the other two modules are added and not added together, the R-branch has improved the ability to detect small targets in the network. The results show that the anti-noise performance of the R-branch and its effectiveness in enhancing the difference between target and background.
5. Conclusions
Aiming at the problems of inaccurate target location and the interference of complex backgrounds in synthetic aperture radar (SAR) image detection, a novel target detector SII-Net based on spatial information integration is proposed in this paper. Specifically, the channel-location attention mechanism (CLAM) module is proposed to help the backbone network achieve more accurate positioning of the target. Furthermore, the high-level features enhancement module (HLEM) is customized to compensate for the loss of location features of high-level small targets. The ablation experiments present that the addition of the CLAM module and the HLEM module achieve 2.4% mAP and 3.3% mAP improvements compared with the baseline model, respectively. Moreover, a new feature refinement branch is presented to distinguish the feature information of the target and the background by enhancing the difference between them, so that the false alarms and missed detections can be effectively reduced. The heatmaps show that the target and the background are greatly distinguished by the feature refinement branch. Quantitative experiments demonstrate that the SII-Net surpasses all SOTA algorithms by a large margin when performing small target detection, as it breaks through the problem with a low detection accuracy of the small target. Qualitative comparisons show that the SII-Net achieves more visually pleasant detection results.
Author Contributions
Conceptualization, C.Z. and N.S.; methodology, N.S. and J.H.; software, J.H.; validation, Y.Y. and C.Z.; formal analysis, C.Z.; data curation, Y.Y. and X.X.; writing—original draft preparation, J.H. and N.S.; writing—review and editing, N.S., X.X. and J.H.; funding acquisition, C.Z., Y.Y. and N.S. All authors have read and agreed to the published version of the manuscript.
Funding
This work was supported by the National Natural Science Foundation of China (No. 61801142, No. 62071136, No. 61971153, No. 62002083) Heilongjiang Postdoctoral Foundation LBH-Q20085, LBH-Z20051 and the Fundamental Research Funds for the Central Universities Grant 3072021CF0814, 3072021CF0807 and 3072021CF0808.
Institutional Review Board Statement
Not applicable.
Informed Consent Statement
Not applicable.
Data Availability Statement
No new data were created or analyzed in this study. Data sharing is not applicable to this article.
Conflicts of Interest
The authors declare no conflict of interest.
References
- Leng, X.; Ji, K.; Yang, K.; Zou, H. A Bilateral CFAR Algorithm for Ship Detection in SAR Images. IEEE Geosci. Remote Sens. Lett. 2015, 12, 1536–1540. [Google Scholar] [CrossRef]
- Liu, Y.; Zhang, M.; Xu, P.; Guo, Z. SAR Ship Detection Using Sea-Land Segmentation-Based Convolutional Neural Network. In Proceedings of the 2017 International Workshop on Remote Sensing with Intelligent Processing (RSIP), Shanghai, China, 19–21 May 2017; pp. 1–4. [Google Scholar]
- Kang, M.; Ji, K.; Leng, X.; Lin, Z. Contextual Region-Based Convolutional Neural Network with Multilayer Fusion for SAR Ship Detection. Remote Sens. 2017, 9, 860. [Google Scholar] [CrossRef] [Green Version]
- Yu, L.; Wu, H.; Zhong, Z.-C.; Zheng, L.; Deng, Q.; Hu, H. TWC-Net: A SAR Ship Detection Using Two-Way Convolution and Multiscale Feature Mapping. Remote Sens. 2021, 13, 2558. [Google Scholar] [CrossRef]
- Zhang, T.; Zhang, X. High-Speed Ship Detection in SAR Images Based on a Grid Convolutional Neural Network. Remote Sens. 2019, 11, 1206. [Google Scholar] [CrossRef] [Green Version]
- Chen, S.; Zhang, J.; Zhan, R. R2FA-Det: Delving into High-Quality Rotatable Boxes for Ship Detection in SAR Images. Remote Sens. 2020, 12, 2031. [Google Scholar] [CrossRef]
- Wei, S.; Su, H.; Ming, J.; Wang, C.; Yan, M.; Kumar, D.P.; Shi, J.; Zhang, X. Precise and Robust Ship Detection for High-Resolution SAR Imagery Based on HR-SDNet. Remote Sens. 2020, 12, 167. [Google Scholar] [CrossRef] [Green Version]
- Wang, Y.; Wang, C.; Zhang, H.; Dong, Y.; Wei, S. Automatic Ship Detection Based on RetinaNet Using Multi-Resolution Gaofen-3 Imagery. Remote Sens. 2019, 11, 531. [Google Scholar] [CrossRef] [Green Version]
- Sun, Z.; Leng, X.; Lei, Y.; Xiong, B.; Ji, K.; Kuang, G. BiFA-YOLO: A Novel YOLO-Based Method for Arbitrary-Oriented Ship Detection in High-Resolution SAR Images. Remote Sens. 2021, 13, 4209. [Google Scholar] [CrossRef]
- Yang, X.; Zhang, X.; Wang, N.; Gao, X. A Robust One-Stage Detector for Multiscale Ship Detection with Complex Background in Massive SAR Images. IEEE Trans. Geosci. Remote Sens. 2021. [Google Scholar] [CrossRef]
- Wang, J.; Lin, Y.; Guo, J.; Zhuang, L. SSS-YOLO: Towards More Accurate Detection for Small Ships in SAR Image. Remote Sens. Lett. 2020, 12, 93–102. [Google Scholar] [CrossRef]
- Chaudhary, Y.; Mehta, M.; Goel, N.; Bhardwaj, P.; Gupta, D.; Khanna, A. YOLOv3 Remote Sensing SAR Ship Image Detection. In Data Analytics and Management; Khanna, A., Gupta, D., Pólkowski, Z., Bhattacharyya, S., Castillo, O., Eds.; Springer: Singapore, 2021; pp. 519–531. [Google Scholar]
- Tang, G.; Zhuge, Y.; Claramunt, C.; Men, S. N-YOLO: A SAR Ship Detection Using Noise-Classifying and Complete-Target Extraction. Remote Sens. 2021, 13, 871. [Google Scholar] [CrossRef]
- Ke, X.; Zhang, X.; Zhang, T.; Shi, J.; Wei, S. SAR Ship Detection Based on an Improved Faster R-CNN Using Deformable Convolution. In Proceedings of the 2021 IEEE International Geoscience and Remote Sensing Symposium IGARSS, Brussels, Belgium, 11–16 July 2021; pp. 3565–3568. [Google Scholar]
- Ai, J.; Tian, R.; Luo, Q.; Jin, J.; Tang, B. Multi-Scale Rotation-Invariant Haar-Like Feature Integrated CNN-Based Ship Detection Algorithm of Multiple-Target Environment in SAR Imagery. IEEE Trans. Geosci. Remote Sens. 2019, 57, 10070–10087. [Google Scholar] [CrossRef]
- Wang, J.; Zheng, T.; Lei, P.; Bai, X. A Hierarchical Convolution Neural Network (CNN)-Based Ship Target Detection Method in Spaceborne SAR Imagery. Remote Sens. 2019, 11, 620. [Google Scholar] [CrossRef] [Green Version]
- Hu, J.; Shen, L.; Sun, G. Squeeze-and-Excitation Networks. In Proceedings of the 2018 IEEE/CVF Conference on Computer Vision and Pattern Recognition, Salt Lake City, UT, USA, 18–23 June 2018; pp. 7132–7141. [Google Scholar]
- Lin, Z.; Ji, K.; Leng, X.; Kuang, G. Squeeze and Excitation Rank Faster R-CNN for Ship Detection in SAR Images. IEEE Geosci. Remote Sens. Lett. 2019, 16, 751–755. [Google Scholar] [CrossRef]
- Zhao, Y.; Zhao, L.; Xiong, B.; Kuang, G. Attention Receptive Pyramid Network for Ship Detection in SAR Images. IEEE J. Sel. Top. Appl. Earth Obs. Remote Sens. 2020, 13, 2738–2756. [Google Scholar] [CrossRef]
- Woo, S.; Park, J.; Lee, J.-Y.; Kweon, I.S. CBAM: Convolutional Block Attention Module. arXiv 2018, arXiv:1807.06521. [Google Scholar]
- Fu, J.; Sun, X.; Wang, Z.; Fu, K. An Anchor-Free Method Based on Feature Balancing and Refinement Network for Multiscale Ship Detection in SAR Images. IEEE Trans. Geosci. Remote Sens. 2021, 59, 1331–1344. [Google Scholar] [CrossRef]
- Chen, C.; He, C.; Hu, C.; Pei, H.; Jiao, L. A Deep Neural Network Based on an Attention Mechanism for SAR Ship Detection in Multiscale and Complex Scenarios. IEEE Access 2019, 7, 104848–104863. [Google Scholar] [CrossRef]
- Qi, X.; Lang, P.; Fu, X.; Qin, R.; Dong, J.; Liu, C. A Regional Attention-Based Detector for SAR Ship Detection. Remote Sens. Lett. 2021, 13, 55–64. [Google Scholar] [CrossRef]
- Gao, F.; He, Y.; Wang, J.; Hussain, A.; Zhou, H. Anchor-Free Convolutional Network with Dense Attention Feature Aggregation for Ship Detection in SAR Images. Remote Sens. 2020, 12, 2619. [Google Scholar] [CrossRef]
- Li, Y.; Zhang, S.; Wang, W. A Lightweight Faster R-CNN for Ship Detection in SAR Images. IEEE Geosci. Remote Sens. Lett. 2020, 19, 1–5. [Google Scholar] [CrossRef]
- Zhang, T.-W.; Zhang, X. ShipDeNet-20: An Only 20 Convolution Layers and <1-MB Lightweight SAR Ship Detector. IEEE Geosci. Remote Sens. Lett. 2021, 18, 1234–1238. [Google Scholar] [CrossRef]
- Li, D.; Liang, Q.; Liu, H.; Liu, Q.; Liao, G. A Novel Multidimensional Domain Deep Learning Network for SAR Ship Detection. IEEE Trans. Geosci. Remote Sens. 2021, 60, 1–13. [Google Scholar] [CrossRef]
- Deng, Z.; Sun, H.; Zhou, S.; Zhao, J. Learning Deep Ship Detector in SAR Images From Scratch. IEEE Trans. Geosci. Remote Sens. 2019, 57, 4021–4039. [Google Scholar] [CrossRef]
- Jeong, S.; Kim, Y.; Kim, S.; Sohn, K. Enriching SAR Ship Detection via Multistage Domain Alignment. IEEE Geosci. Remote Sens. Lett. 2022, 19, 1–5. [Google Scholar] [CrossRef]
- Bao, W.; Huang, M.; Zhang, Y.; Xu, Y.; Liu, X.; Xiang, X. Boosting Ship Detection in SAR Images With Complementary Pretraining Techniques. IEEE J. Sel. Top. Appl. Earth Obs. Remote Sens. 2021, 14, 8941–8954. [Google Scholar] [CrossRef]
- Zhang, T.; Zhang, X.; Ke, X.; Zhan, X.; Shi, J.; Wei, S.; Pan, D.; Li, J.; Su, H.; Zhou, Y.; et al. LS-SSDD-v1.0: A Deep Learning Dataset Dedicated to Small Ship Detection from Large-Scale Sentinel-1 SAR Images. Remote Sens. 2020, 12, 2997. [Google Scholar] [CrossRef]
- Li, J.; Qu, C.; Shao, J. Ship Detection in SAR Images Based on an Improved Faster R-CNN. In Proceedings of the 2017 SAR in Big Data Era: Models, Methods and Applications (BIGSARDATA), Beijing, China, 13–14 November 2017; pp. 1–6. [Google Scholar]
- Wang, Y.; Wang, C.; Zhang, H.; Dong, Y.; Wei, S. A SAR Dataset of Ship Detection for Deep Learning under Complex Backgrounds. Remote Sens. 2019, 11, 765. [Google Scholar] [CrossRef] [Green Version]
- Wang, Q.; Wu, B.; Zhu, P.; Li, P.; Zuo, W.; Hu, Q. ECA-Net: Efficient Channel Attention for Deep Convolutional Neural Networks. In Proceedings of the 2020 IEEE/CVF Conference on Computer Vision and Pattern Recognition (CVPR), Seattle, WA, USA, 14–19 June 2020; pp. 11531–11539. [Google Scholar]
- Qin, Z.; Zhang, P.; Wu, F.; Li, X. FcaNet: Frequency Channel Attention Networks. arXiv 2020, arXiv:abs/2012.11879. [Google Scholar]
- Fu, J.; Liu, J.; Tian, H.; Fang, Z.; Lu, H. Dual Attention Network for Scene Segmentation. In Proceedings of the 2019 IEEE/CVF Conference on Computer Vision and Pattern Recognition (CVPR), Long Beach, CA, USA, 15–20 June 2019; pp. 3141–3149. [Google Scholar]
- Lin, M.; Chen, Q.; Yan, S. Network In Network. arXiv 2014, arXiv:1312.4400. [Google Scholar]
- Cui, Z.; Li, Q.; Cao, Z.; Liu, N. Dense Attention Pyramid Networks for Multi-Scale Ship Detection in SAR Images. IEEE Trans. Geosci. Remote Sens. 2019, 57, 8983–8997. [Google Scholar] [CrossRef]
- Zhang, T.; Zhang, X.; Ke, X. Quad-FPN: A Novel Quad Feature Pyramid Network for SAR Ship Detection. Remote Sens. 2021, 13, 2771. [Google Scholar] [CrossRef]
- Guo, C.; Fan, B.; Zhang, Q.; Xiang, S.; Pan, C. AugFPN: Improving Multi-Scale Feature Learning for Object Detection. In Proceedings of the 2020 IEEE/CVF Conference on Computer Vision and Pattern Recognition (CVPR), Seattle, WA, USA, 14–19 June 2020; pp. 12592–12601. [Google Scholar]
- Lin, T.-Y.; Dollár, P.; Girshick, R.B.; He, K.; Hariharan, B.; Belongie, S.J. Feature Pyramid Networks for Object Detection. In Proceedings of the 2017 IEEE Conference on Computer Vision and Pattern Recognition (CVPR), Honolulu, HI, USA, 21–26 July 2017; pp. 936–944. [Google Scholar]
- Yu, X.; Gong, Y.; Jiang, N.; Ye, Q.; Han, Z. Scale Match for Tiny Person Detection. In Proceedings of the 2020 IEEE Winter Conference on Applications of Computer Vision (WACV), Snowmass Village, CO, USA, 1–5 March 2020; pp. 1246–1254. [Google Scholar]
- Liu, S.; Qi, L.; Qin, H.; Shi, J.; Jia, J. Path Aggregation Network for Instance Segmentation. In Proceedings of the 2018 IEEE/CVF Conference on Computer Vision and Pattern Recognition, Salt Lake City, UT, USA, 18–23 June 2018; pp. 8759–8768. [Google Scholar]
- Hosang, J.; Benenson, R.; Schiele, B. Learning non-maximum suppression. arXiv 2017, arXiv:1705.02950. [Google Scholar]
- He, K.; Girshick, R.B.; Dollár, P. Rethinking ImageNet Pre-Training. In Proceedings of the 2019 IEEE/CVF International Conference on Computer Vision (ICCV), Seoul, Korea, 27–28 October 2019; pp. 4917–4926. [Google Scholar]
- Lin, T.-Y.; Maire, M.; Belongie, S.; Hays, J.; Perona, P.; Ramanan, D.; Dollár, P.; Zitnick, C. Microsoft COCO: Common objects in context. arXiv 2014, arXiv:1405.0312. [Google Scholar]
- He, K.; Zhang, X.; Ren, S.; Sun, J. Spatial Pyramid Pooling in Deep Convolutional Networks for Visual Recognition. IEEE Trans. Pattern Anal. Mach. Intell. 2015, 37, 1904–1916. [Google Scholar] [CrossRef] [Green Version]
- Wang, X.; Girshick, R.B.; Gupta, A.; He, K. Non-Local Neural Networks. In Proceedings of the 2018 IEEE/CVF Conference on Computer Vision and Pattern Recognition, Salt Lake City, UT, USA, 18–23 June 2018; pp. 7794–7803. [Google Scholar]
- Chen, K.; Wang, J.; Pang, J.; Cao, Y.; Xiong, Y.; Li, X.; Sun, S.; Feng, W.; Liu, Z.; Xu, J.; et al. MMDetection: Open MMLab Detection Toolbox and Benchmark. arXiv 2019, arXiv:abs/1906.07155. [Google Scholar]
- Ren, S.; He, K.; Girshick, R.B.; Sun, J. Faster R-CNN: Towards Real-Time Object Detection with Region Proposal Networks. IEEE Trans. Pattern Anal. Mach. Intell. 2015, 39, 1137–1149. [Google Scholar] [CrossRef] [PubMed] [Green Version]
- Cai, Z.; Vasconcelos, N. Cascade R-CNN: Delving Into High Quality Object Detection. In Proceedings of the 2018 IEEE/CVF Conference on Computer Vision and Pattern Recognition, Salt Lake City, UT, USA, 18–23 June 2018; pp. 6154–6162. [Google Scholar]
- Wu, Y.; Chen, Y.; Yuan, L.; Liu, Z.; Wang, L.; Li, H.; Fu, Y.R. Rethinking Classification and Localization for Object Detection. In Proceedings of the 2020 IEEE/CVF Conference on Computer Vision and Pattern Recognition (CVPR), Seattle, WA, USA, 14–19 June 2020; pp. 10183–10192. [Google Scholar]
- Lu, X.; Li, B.; Yue, Y.; Li, Q.; Yan, J. Grid R-CNN. In Proceedings of the 2019 IEEE/CVF Conference on Computer Vision and Pattern Recognition (CVPR), Long Beach, CA, USA, 15–20 June 2019; pp. 7355–7364. [Google Scholar]
- Dai, J.; Qi, H.; Xiong, Y.; Li, Y.; Zhang, G.; Hu, H.; Wei, Y. Deformable Convolutional Networks. In Proceedings of the 2017 IEEE International Conference on Computer Vision (ICCV), Venice, Italy, 22–29 October 2017; pp. 764–773. [Google Scholar]
- Wang, J.; Chen, K.; Yang, S.; Loy, C.C.; Lin, D. Region Proposal by Guided Anchoring. In Proceedings of the 2019 IEEE/CVF Conference on Computer Vision and Pattern Recognition (CVPR), Long Beach, CA, USA, 15–20 June 2019; pp. 2960–2969. [Google Scholar]
- Zhang, X.; Wan, F.; Liu, C.; Ji, R.; Ye, Q. FreeAnchor: Learning to Match Anchors for Visual Object Detection. arXiv 2019, arXiv:1909.02466. [Google Scholar]
- Tian, Z.; Shen, C.; Chen, H.; He, T. FCOS: Fully Convolutional One-Stage Object Detection. In Proceedings of the 2019 IEEE/CVF Conference on Computer Vision and Pattern Recognition (CVPR), Long Beach, CA, USA, 15–20 June 2019; pp. 9626–9635. [Google Scholar]
- Zhang, S.; Chi, C.; Yao, Y.; Lei, Z.; Li, S.Z. Bridging the Gap Between Anchor-Based and Anchor-Free Detection via Adaptive Training Sample Selection. In Proceedings of the 2020 IEEE/CVF Conference on Computer Vision and Pattern Recognition (CVPR), Seattle, WA, USA, 14–19 June 2020; pp. 9756–9765. [Google Scholar]
- Kong, T.; Sun, F.; Liu, H.; Jiang, Y.; Shi, J. FoveaBox: Beyond Anchor-Based Object Detector. arXiv 2019, arXiv:abs/1904.03797. [Google Scholar]
- Zhang, X.; Huo, C.; Xu, N.; Jiang, H.; Cao, Y.; Ni, L.; Pan, C. Multitask Learning for Ship Detection From Synthetic Aperture Radar Images. IEEE J. Sel. Top. Appl. Earth Obs. Remote Sens. 2021, 14, 8048–8062. [Google Scholar] [CrossRef]
Figure 1.
Some detection results of the general detector. (a) The problem of inaccurate localization; (b) the problem of the missing ships; (c) the problem of false detections.
Figure 1.
Some detection results of the general detector. (a) The problem of inaccurate localization; (b) the problem of the missing ships; (c) the problem of false detections.

Figure 2.
Overall framework of SII-Net.

Figure 3.
Architecture of CLAM.

Figure 4.
Architecture of HLEM.

Figure 5.
Architecture of the refined branch.

Figure 6.
Comparison of thermal diagrams before and after refinement.

Figure 7.
Scale distribution of targets.

Figure 8.
SAR ship detection results on LS-SSDD-v1.0. (a,e,i,m,q) represent the results of Faster R-CNN; (b,f,j,n,r) represent the results of DCN; (c,g,k,o,s) represent the results of Double-Head R-CNN; (d,h,l,p,t) represent the results of SII-Net.
Figure 8.
SAR ship detection results on LS-SSDD-v1.0. (a,e,i,m,q) represent the results of Faster R-CNN; (b,f,j,n,r) represent the results of DCN; (c,g,k,o,s) represent the results of Double-Head R-CNN; (d,h,l,p,t) represent the results of SII-Net.

Figure 9.
Some visualization results. (a,f) represent the original image; (b,g) represent the heatmaps of the basic algorithm; (c,h) represent the heatmaps of the CLAM module; (d,i) represent the heatmaps of the HLEM module. (e,j) represent the heatmaps of the refined branch.
Figure 9.
Some visualization results. (a,f) represent the original image; (b,g) represent the heatmaps of the basic algorithm; (c,h) represent the heatmaps of the CLAM module; (d,i) represent the heatmaps of the HLEM module. (e,j) represent the heatmaps of the refined branch.


Table 1.
Evaluation indices comparison with the other methods on LS-SSDD-v1.0 of the entire scenes.
| No. | Method | r | p | mAP |
|---|---|---|---|---|
| 1 | Faster R-CNN [50] | 0.720 | 0.766 | 0.694 |
| 2 | PANET [43] | 0.719 | 0.746 | 0.693 |
| 3 | Cascade R-CNN [51] | 0.711 | 0.794 | 0.689 |
| 4 | Double-Head R-CNN [52] | 0.719 | 0.743 | 0.695 |
| 5 | Grid R-CNN [53] | 0.711 | 0.664 | 0.683 |
| 6 | DCN [54] | 0.717 | 0.762 | 0.691 |
| 7 | Guided Anchoring [55] | 0.638 | 0.801 | 0.598 |
| 8 | Free-Anchor [56] | 0.721 | 0.232 | 0.628 |
| 9 | FCOS [57] | 0.667 | 0.505 | 0.632 |
| 10 | ATSS [58] | 0.715 | 0.742 | 0.681 |
| 11 | FoveaBox [59] | 0.599 | 0.775 | 0.522 |
| 12 | SA Faster R-CNN+PBHT [49] | 0.778 | 0.748 | 0.751 |
| 13 | SE Faster R-CNN+PBHT [49] | 0.772 | 0.747 | 0.743 |
| 14 | MTL-Det [60] | - | - | 0.717 |
| 15 | SII-Net | 0.793 | 0.682 | 0.761 |
Table 2.
Evaluation results of targets in different scales in LS-SSDD-v1.0 using Double-Head R-CNN.
| Size | r | p | mAP |
|---|---|---|---|
| (0,100) | 0.005 | 1 | 0.005 |
| (100,400) | 0.630 | 0.576 | 0.568 |
| (400,900) | 0.911 | 0.886 | 0.894 |
| (900,1600) | 0.980 | 0.944 | 0.976 |
Table 3.
Evaluation results of targets in different scales in LS-SSDD-v1.0 using SII-Net.
| Size | r | p | mAP |
|---|---|---|---|
| (0,100) | 0.120 | 0.764 | 0.101 |
| (100,400) | 0.766 | 0.513 | 0.687 |
| (400,900) | 0.933 | 0.875 | 0.918 |
| (900,1600) | 0.987 | 0.931 | 0.976 |
Table 4.
Evaluation indices comparison with the other methods on LS-SSDD-v1.0 of the inshore scenes.
Table 4.
Evaluation indices comparison with the other methods on LS-SSDD-v1.0 of the inshore scenes.
| No. | Method | r | p | mAP |
|---|---|---|---|---|
| 1 | Faster R-CNN [50] | 0.401 | 0.601 | 0.353 |
| 2 | PANET [43] | 0.393 | 0.566 | 0.342 |
| 3 | Cascade R-CNN [51] | 0.376 | 0.645 | 0.337 |
| 4 | Double-Head R-CNN [52] | 0.385 | 0.556 | 0.337 |
| 5 | Grid R-CNN [53] | 0.414 | 0.425 | 0.367 |
| 6 | DCN [54] | 0.393 | 0.601 | 0.346 |
| 7 | Guided Anchoring [55] | 0.353 | 0.649 | 0.308 |
| 8 | Free-Anchor [56] | 0.456 | 0.700 | 0.273 |
| 9 | FCOS [57] | 0.291 | 0.534 | 0.245 |
| 10 | ATSS [58] | 0.376 | 0.543 | 0.327 |
| 11 | FoveaBox [59] | 0.272 | 0.527 | 0.230 |
| 12 | SA Faster R-CNN+PBHT [49] | 0.526 | 0.579 | 0.466 |
| 13 | SE Faster R-CNN+PBHT [49] | 0.517 | 0.579 | 0.455 |
| 14 | MTL-Det [60] | - | - | 0.387 |
| 15 | SII-Net | 0.554 | 0.461 | 0.469 |
Table 5.
Evaluation indices comparison with the other methods on LS-SSDD-v1.0 of the offshore scenes.
Table 5.
Evaluation indices comparison with the other methods on LS-SSDD-v1.0 of the offshore scenes.
| No. | Method | r | p | mAP |
|---|---|---|---|---|
| 1 | Faster R-CNN [50] | 0.908 | 0.824 | 0.887 |
| 2 | PANET [43] | 0.911 | 0.812 | 0.890 |
| 3 | Cascade R-CNN [51] | 0.909 | 0.840 | 0.890 |
| 4 | Double-Head R-CNN [52] | 0.916 | 0.811 | 0.897 |
| 5 | Grid R-CNN [53] | 0.886 | 0.785 | 0.800 |
| 6 | DCN [54] | 0.909 | 0.818 | 0.886 |
| 7 | Guided Anchoring [55] | 0.807 | 0.852 | 0.768 |
| 8 | Free-Anchor [56] | 0.877 | 0.665 | 0.778 |
| 9 | FCOS [57] | 0.895 | 0.792 | 0.823 |
| 10 | ATSS [58] | 0.887 | 0.803 | 0.865 |
| 11 | FoveaBox [59] | 0.793 | 0.858 | 0.704 |
| 12 | SA Faster R-CNN+PBHT [49] | 0.927 | 0.829 | 0.908 |
| 13 | SE Faster R-CNN+PBHT [49] | 0.922 | 0.827 | 0.902 |
| 14 | MTL-Det [60] | - | - | 0.887 |
| 15 | SII-Net | 0.934 | 0.819 | 0.916 |
Table 6.
Evaluation indices comparison with the other detectors on SSDD.
| No. | Method | r | p | mAP |
|---|---|---|---|---|
| 1 | Faster R-CNN [50] | 0.904 | 0.870 | 0.897 |
| 2 | PANET [43] | 0.919 | 0.868 | 0.911 |
| 3 | Cascade R-CNN [51] | 0.908 | 0.941 | 0.905 |
| 4 | Double-Head R-CNN [52] | 0.919 | 0.869 | 0.911 |
| 5 | Grid R-CNN [53] | 0.897 | 0.877 | 0.889 |
| 6 | DCN [54] | 0.930 | 0.862 | 0.922 |
| 7 | Guided Anchoring [55] | 0.904 | 0.946 | 0.900 |
| 8 | Free-Anchor [56] | 0.926 | 0.723 | 0.910 |
| 9 | HR-SDNet [7] | 0.909 | 0.964 | 0.908 |
| 10 | DAPN [38] | 0.913 | 0.855 | 0.905 |
| 11 | SER Faster R-CNN [18] | 0.922 | 0.861 | 0.915 |
| 12 | ARPN [19] | 0.906 | 0.854 | 0.898 |
| 13 | Quad-FPN [39] | 0.957 | 0.895 | 0.952 |
| 14 | SII-Net | 0.968 | 0.861 | 0.955 |
Table 7.
Evaluation indices comparison with the other detectors on SAR-Ship-Dataset.
| No. | Method | r | p | mAP |
|---|---|---|---|---|
| 1 | Faster R-CNN [50] | 0.932 | 0.868 | 0.917 |
| 2 | PANET [43] | 0.934 | 0.868 | 0.920 |
| 3 | Cascade R-CNN [51] | 0.934 | 0.905 | 0.922 |
| 4 | Double-Head R-CNN [52] | 0.941 | 0.884 | 0.929 |
| 5 | Grid R-CNN [53] | 0.930 | 0.851 | 0.914 |
| 6 | DCN [54] | 0.932 | 0.862 | 0.918 |
| 7 | Guided Anchoring [55] | 0.938 | 0.925 | 0.927 |
| 8 | Free-Anchor [56] | 0.949 | 0.839 | 0.937 |
| 9 | HR-SDNet [7] | 0.932 | 0.921 | 0.922 |
| 10 | DAPN [38] | 0.933 | 0.872 | 0.919 |
| 11 | SER Faster R-CNN [18] | 0.935 | 0.867 | 0.921 |
| 12 | ARPN [19] | 0.920 | 0.881 | 0.913 |
| 13 | Quad-FPN [39] | 0.961 | 0.775 | 0.943 |
| 14 | SII-Net | 0.955 | 0.765 | 0.932 |
Table 8.
Overall effectiveness of the modules.
| CLAM | HLEM | R-Branch | r | p | mAP |
|---|---|---|---|---|---|
| O | O | O | 0.760 | 0.651 | 0.719 |
| P | O | O | 0.767 | 0.724 | 0.740 |
| P | P | O | 0.772 | 0.744 | 0.748 |
| P | P | P | 0.793 | 0.682 | 0.761 |
Table 9.
Effectiveness of CLAM when the other two modules are added.
| CLAM | HLEM | R-Branch | r | p | mAP |
|---|---|---|---|---|---|
| O | P | P | 0.764 | 0.756 | 0.737 |
| P | P | P | 0.793 | 0.682 | 0.761 |
Table 10.
Effectiveness of CLAM when the other two modules are not added.
| CLAM | HLEM | R-Branch | r | p | mAP |
|---|---|---|---|---|---|
| O | O | O | 0.760 | 0.651 | 0.719 |
| P | O | O | 0.767 | 0.724 | 0.740 |
Table 11.
Effectiveness of HLEM when the other two modules are added.
| CLAM | HLEM | R-Branch | r | p | mAP |
|---|---|---|---|---|---|
| P | O | P | 0.763 | 0.664 | 0.728 |
| P | P | P | 0.793 | 0.682 | 0.761 |
Table 12.
Effectiveness of HLEM when the other two modules are not added.
| CLAM | HLEM | R-Branch | r | p | mAP |
|---|---|---|---|---|---|
| O | O | O | 0.760 | 0.651 | 0.719 |
| O | P | O | 0.776 | 0.741 | 0.751 |
Table 13.
Effectiveness of R-branch when the other two modules are added.
| CLAM | HLEM | R-Branch | r | p | mAP |
|---|---|---|---|---|---|
| P | P | O | 0.772 | 0.744 | 0.748 |
| P | P | P | 0.793 | 0.682 | 0.761 |
Table 14.
Effectiveness of R-branch when the other two modules are not added.
| CLAM | HLEM | R-Branch | r | p | mAP |
|---|---|---|---|---|---|
| O | O | O | 0.760 | 0.651 | 0.719 |
| O | O | P | 0.765 | 0.716 | 0.734 |
Publisher’s Note: MDPI stays neutral with regard to jurisdictional claims in published maps and institutional affiliations. |
© 2022 by the authors. Licensee MDPI, Basel, Switzerland. This article is an open access article distributed under the terms and conditions of the Creative Commons Attribution (CC BY) license (https://creativecommons.org/licenses/by/4.0/).
Share and Cite
MDPI and ACS Style
Su, N.; He, J.; Yan, Y.; Zhao, C.; Xing, X. SII-Net: Spatial Information Integration Network for Small Target Detection in SAR Images. Remote Sens. 2022, 14, 442. https://doi.org/10.3390/rs14030442
AMA Style
Su N, He J, Yan Y, Zhao C, Xing X. SII-Net: Spatial Information Integration Network for Small Target Detection in SAR Images. Remote Sensing. 2022; 14(3):442. https://doi.org/10.3390/rs14030442
Chicago/Turabian StyleSu, Nan, Jiayue He, Yiming Yan, Chunhui Zhao, and Xiangwei Xing. 2022. "SII-Net: Spatial Information Integration Network for Small Target Detection in SAR Images" Remote Sensing 14, no. 3: 442. https://doi.org/10.3390/rs14030442
Note that from the first issue of 2016, this journal uses article numbers instead of page numbers. See further details here.