Article

Geometrical and Microphysical Properties of Clouds Formed in the Presence of Dust above the Eastern Mediterranean

1
Institute for Astronomy, Astrophysics, Space Applications and Remote Sensing, National Observatory of Athens (IAASARS-NOA), 15236 Penteli, Greece
2
Laboratory of Atmospheric Physics, Aristotle University of Thessaloniki (AUTH), 54124 Thessaloniki, Greece
3
Institute of Atmospheric Physics, German Aerospace Center (DLR), 82234 Oberpfaffenhofen, Germany
4
Institute of Methodologies for Environmental Analysis, National Research Council of Italy (CNR-IMAA), 85050 Potenza, Italy
5
National Research & Development Institute Optoelectronics INOE 2000, 077125 Măgurele, Romania
6
Leibniz Institute for Tropospheric Research (TROPOS), 04318 Leipzig, Germany
7
Finnish Meteorological Institute (FMI), 00101 Helsinki, Finland
*
Author to whom correspondence should be addressed.
Remote Sens. 2021, 13(24), 5001; https://doi.org/10.3390/rs13245001
Submission received: 17 October 2021 / Revised: 6 December 2021 / Accepted: 7 December 2021 / Published: 9 December 2021
(This article belongs to the Special Issue Radar Remote Sensing of Cloud and Precipitation)

Abstract

:
In this work, collocated lidar–radar observations are used to retrieve the vertical profiles of cloud properties above the Eastern Mediterranean. Measurements were performed in the framework of the PRE-TECT experiment during April 2017 at the Greek atmospheric observatory of Finokalia, Crete. Cloud geometrical and microphysical properties at different altitudes were derived using the Cloudnet target classification algorithm. We found that the variable atmospheric conditions that prevailed above the region during April 2017 resulted in complex cloud structures. Mid-level clouds were observed in 38% of the cases, high or convective clouds in 58% of the cases, and low-level clouds in 2% of the cases. From the observations of cloudy profiles, pure ice phase occurred in 94% of the cases, mixed-phase clouds were observed in 27% of the cases, and liquid clouds were observed in 8.7% of the cases, while Drizzle or rain occurred in 12% of the cases. The significant presence of Mixed-Phase Clouds was observed in all the clouds formed at the top of a dust layer, with three times higher abundance than the mean conditions (26% abundance at −15 °C). The low-level clouds were formed in the presence of sea salt and continental particles with ice abundance below 30%. The derived statistics on clouds’ high-resolution vertical distributions and thermodynamic phase can be combined with Cloudnet cloud products and lidar-retrieved aerosol properties to study aerosol-cloud interactions in this understudied region and evaluate microphysics parameterizations in numerical weather prediction and global climate models.

Graphical Abstract

1. Introduction

Clouds play a vital role in our weather and climate, producing precipitation and impacting the Earth’s radiation budget. The processes governing their formation, evolution, geometrical and microphysical properties, as well as their radiative effects, are far from being well understood. As stated in the recent report of the Intergovernmental Panel on Climate Change, the confidence of current climate models in representing processes involving clouds and aerosols remains low [1]. The complex interactions between aerosols and clouds (ACI), under the dynamic changes of global climate, along with the effect of clouds on Earth’s radiation budget, are uncertain climate factors still poorly handled by climate and forecast models [2].
The main knowledge gaps and limitations in current state-of-the-art global climate models (GCMs) are attributed to their inability to correctly describe the ice content in clouds on a global scale [3]. The uncertainty is higher for quantifying ice and water content in mixed-phase clouds (MPC), which are clouds consisting of water vapor, ice particles, and supercooled liquid droplets [4,5,6]. These limitations significantly affect the cloud albedo estimate in GCMs, altering the equilibrium climate sensitivity by up to 2 °C [7,8,9].
Our limited knowledge of MPC is mainly due to their complexity, as they are affected by processes with different spatial and temporal scales and various feedback mechanisms. For example, the formation and evolution of MPC are influenced (amongst others) by the availability of aerosol particles that can act as cloud condensation nuclei (CCN) and ice nuclei (IN) for primary ice nucleation [10,11,12,13,14]. In addition, other parameters should also be considered, such as the prevailing meteorological conditions, level of supersaturation with respect to ice, small-scale turbulent motions, deposition growth removing water vapor from the cloud, the fall-out of ice particles under gravity, and the nucleation of ice crystals (primary and secondary ice nucleation) [1,15,16,17]. These processes strongly influence the macro and microphysical properties of MPC, such as the partitioning of liquid and ice phase, the number and size distribution of droplets and ice crystals, and the ice-crystal growth. These alterations in MPC properties affect their reflectivity, lifetime and precipitation, and define their role in extreme weather phenomena and climate change.
The Eastern Mediterranean is at the crossroads of air mass outflows from European and Asian pollution centers and receiving significant amounts of desert dust from Africa and the Middle East. Moreover, the region is characterized by considerable variability in cloud systems, ranging from frontal and convective to cyclones [18,19,20]. It is a climate “hot spot”, exhibiting more frequent and more intense weather phenomena associated with severe winds, floods, and dust events during the transition seasons [21,22,23,24,25].
Despite the significance of clouds over the Mediterranean basin, for both climate science and regional impacts, there are only a few observational studies available for the region. Most of these studies focus mainly on the influence of specific aerosol types (e.g., marine, continental, and smoke) on CCN processes, using surface in-situ measurements acquired at the Finokalia station [26,27,28,29,30]. The only known observational studies for aerosols acting as IN in the Mediterranean are that of Schrod et al. [31] and Marinou et al. [32], both confined to a limited geographical area (Cyprus). At the same time, there have been no studies on the macroscopic or microphysical characteristics of clouds, mainly due to the lack of cloud measurements, which narrows our ability to improve the theories and model parameterizations for the region [6,33]. Accurate observations of cloud and aerosol microphysics with high vertical resolution in different parts of the region could help fill these gaps.
In this study we use collocated lidar–radar observations to retrieve high-resolution vertical profiles of cloud properties above the Eastern Mediterranean. We study the cloud’s geometrical properties and derive statistics of the cloud phases above the region. Specific focus is given to clouds formed in the presence of dust particles. The dataset used was collected during the PRE-TECT experimental campaign that took place in Crete, Greece. During PRE-TECT, the first ever Cloudnet campaign was held in Greece.
The manuscript is organized as follows: Section 2 presents the instruments and the methodology applied to process the cloud observations. Section 3 offers the geometrical and microphysical characteristics of the clouds formed above Finokalia during PRE-TECT, along with the associated meteorological conditions that led to their formation. A statistical analysis of the cloud properties during the PRE-TECT campaign is also provided in Section 3. The main findings are summarized in Section 4.

2. Data and Methodology

The data used in our study were acquired during the PRE-TECT experimental campaign [34]. The campaign was organized by the National Observatory of Athens (NOA) in the framework of the Aerosol, Clouds, and Trace Gases Research Infrastructure (ACTRIS) project and the ERC project “Does dust TriboElectrification affect our ClimaTe?” (D-TECT) and took place on 1–30 April 2017, at the Greek atmospheric observatory of Finokalia (35.338°N, 25.670°E), in Crete (finokalia.chemistry.uoc.gr) (Figure 1a). During the experiment we collected continuous observations of aerosols, clouds and winds, with high vertical and temporal resolution. We used collocated measurements from the PollyXT lidar system of NOA [35], the MIRA36 cloud Doppler radar system [36] of the Italian National Research Council’s Institute of Methodologies for Environmental Analysis (CNR-IMAA), the RPG microwave radiometer of the National Research & Development Institute Optoelectronics (INOE), and the Halo Doppler wind lidar [37] of the Finnish Meteorological Institute (FMI). These instruments constituted the first ever Cloudnet campaign station in Greece (Figure 1b).
To determine the cloud macro and microphysical properties, we use the synergy between lidar, cloud radar and microwave radiometer data, along with satellite observations and model simulations. The ground-based remote sensing measurements are processed with the Cloudnet target classification algorithm [38,39]. The algorithm combines the vertical profiles of the lidar attenuated backscatter coefficient at 1064 nm, cloud radar variables including radar reflectivity, Doppler velocity, and linear depolarisation ratio, liquid water path from the microwave radiometer, and thermodynamic variables (temperature, pressure, humidity, and horizontal wind) from the operational forecast model of the European Center for Medium-Range Weather Forecasts (ECMWF), in order to provide information on the type and phase of the “targets” detected by the radar and lidar (i.e., ice, cloud droplets, ice and supercooled droplets, drizzle or rain, drizzle/rain and cloud droplets, melting ice, melting ice and cloud droplet, aerosols, insects, aerosol and insects). Complementary information of the detection status of the lidar and radar is also provided (e.g., detection only from the lidar, from lidar and radar, and only from the radar). The input observations are regirdded to a common resolution of 20 s and 28.78 m, determined by the vertical resolution of the Mira36 radar.
An example of the acquired observations and their usage for classifying the atmospheric constituents above Finokalia with the Cloudnet classification scheme is shown in Figure 2 for 4 April 2017. The figure highlights the advantage of the combination of the radar and lidar instruments to identify cloud boundaries and phase. The two instruments have complementary properties; radar can penetrate even optically thick clouds and is more sensitive to large particles (such as raindrops and snowflakes) than the tiny cloud droplets typically formed in fog and optically thin clouds, whereas lidar is much more sensitive to the small cloud droplets and optically thin clouds while being rapidly attenuated in optically thick clouds. In the example shown in Figure 2, the cloud radar was able to detect the entire cloud structure above the station, with the vertical in-cloud extent exceeding 4 km, while the lidar was able to penetrate only the first 1.5 km inside the cloud. In contrast, the lidar detected thin layers with high attenuated backscatter coefficient values at altitudes between 5 and 7 km, from 04:00 to 12:00 UTC, which are not visible to the radar, indicating they must contain small cloud particles. The complementary observations of the lidar volume depolarization ratio show that the majority of the particles in these layers are spherical, in contrast to the surrounding targets where nonspherical particles prevail. Thus, the combination of the lidar and radar observations indicate the coexistence of ice particles and water droplets in these layers. The model temperature fields indicate subzero conditions and, hence, the presence of supercooled droplets. The Cloudnet target classification has correctly classified these mixed-phase layers as “ice and supercooled droplets” (I + SC), providing their time evolution above Finokalia station. Moreover, the information on the radar and lidar detection status is quite valuable for identifying the cloud regions where it is possible to detect the presence of I + SC targets since these are only the regions with good lidar and radar echoes (although this is only possible up to depths of less than 1.5 km in this case).
In order to derive cumulative statistics for the cloud properties during the period of the PRE-TECT campaign, we first computed N target , which provides the Cloudnet target occurrences per 1 °C temperature bins for the total abundance of the different cloud, rain, and aerosol features using the Equation (1), illustrated in Figure 3a. We also computed F target , which provides the percentage of the different cloud/rain features from the total cloud/rain targets with Equation (3), illustrated in Figure 3b.
N target ( Δ T ) = t N target ( t , Δ T )
where t is the time, and ΔT is the temperature range. Here, 1 °C temperature ranges are used between −65 °C to 20 °C.
N cloud / rain ( Δ T ) = ( t , cloud / rain ) N target ( t , Δ T , cloud / rain )
where cloud/rain are the cloud and/or rain Cloudnet target categories, i.e., cloud droplets (CD), drizzle or rain (DoR), Drizzle/rain and cloud droplets (DR + CD), ICE, I + SC, melting ice (mI), melting ice and cloud droplet (mI + CD).
F target ( Δ T ) = N target ( Δ T ) N cloud / rain ( Δ T )
Table 1 shows the acronyms used for the various cloud types. Figure 3 shows an example of the N target and F target statistics for the observations on 4 April 2017.
Supercooled water (SCW) clouds are present in subzero temperatures, with their particles identified in the category “cloud droplets only” (CD). Most detected SCW targets have an ICE phase immediately below or next to them. We interpret this as an occurrence of a mixed-phase cloud since the ice layer is in contact and interacting with the liquid layer. At the top of supercooled liquid layers, where any ice crystals are too small or too few to be detected by the radar, the Cloudnet classification derives CD targets only. A cloud top containing SCW with ice precipitating below is characteristic of boundary layer mixed-phase clouds [6]. Additionally, in practice, Cloudnet clouds flagged as I + SC are systematically found along with ICE clouds. In order to describe the observed cloud variations with a specific focus on MPC, the fraction of MPC ( F MPC ) is computed considering the I + SC and SCW targets (Equation (4)). The all-ice cloud category (ICE) accounts for occurrences of the ice phase when there is no presence of SCW. These cases are helpful in investigating the ice-only processes and for comparing them with the processes in the supercooled liquid clouds. By definition, ICE and SCW fractions are complimentary in subzero temperatures (Equation (5)). The limitation of lidar signal total attenuation for clouds thicker than approximately 1 km should be considered for calculating F MPC , which can be underrepresented in these cases:
F MPC ( Δ T ) = F I + SC ( Δ T ) + F SCW ( Δ T )
where F SCW ( Δ T ) = { F CD ( Δ T )   for   Δ T < 0   ° C   ,   0   for   Δ T > 0   ° C } .
F cloud ( Δ T ) = F MPC ( Δ T ) +   F ICE ( Δ T ) ,   Δ T < 0   ° C
We derive the cumulative cloud phase statistics per cloud profile. A cloud profile is considered a MPC when at least two I + SC or SCW targets are observed, and an all-ice phase when all the cloud targets are ICE only.
Furthermore, we utilize the PollyXT backscatter coefficient and volume depolarization ratio ( δ v ) retrievals to collect information on the abundance of aerosol and the presence of non-spherical particles (i.e., dust) over the area. An example is presented in Figure 2f, where the enhanced (larger than 0.1–0.15) δ v values at 532 nm show the presence of a dust layer at altitudes up to 2.5 km, and its distinct separation with the layer that is advected above the island after 9:00 UTC at altitudes up to 2 km containing spherical particles. Using the PollyXT multiwavelength optical products (e.g., the backscatter coefficient at 1064 nm, the particle depolarization ratio at 532 nm ( δ p ), the backscatter Ångström exponent at 532 and 1064 nm, and the Lidar ratio at 355 and 532 nm), we acquire additional information on the aerosol types in the scene [40,41,42,43]. When clouds overlay the aerosol layers, the lidar retrievals cannot be derived with conventional methods [44,45]. In this case, the Pollynet target classification scheme [46] is applied (quick looks available in polly.tropos.de, accessed on 6 December 2021).
Complimentary to observations, we utilize the Advanced Research Weather Research and Forecasting model version 4.2.1 (WRF-ARWv4.2.1), coupled with the Georgia Institute of Technology-Goddard Global Ozone Chemistry Aerosol Radiation and Transport (GOCART) aerosol model and the Air Force Weather Agency (AFWA) dust emission scheme [47], to derive information on the meteorological conditions and the abundance of dust and marine aerosol during the PRE-TECT campaign. The model parameterizes both the dust emission and transport processes, and the sea salt production and transport. The simulation was performed from 22 March to 30 April, with the first ten days acting as a spin-up period for developing dust and sea salt background. The simulations were performed in 84-h reinitialization cycles in a two-way nested domain configuration, with daily updating of the sea surface temperature. The 6-hourly, 0.25° × 0.25° resolution reanalysis product of the Global Forecast System Final Analysis (GFS-FNL) is used for the model initial and boundary conditions. The WRF parent domain extends from 2.86°N to 48.44°N and from −35.54°E to 63.54°E, containing 320 × 171 points in a 30 km × 30 km horizontal grid. The nested domain extends from 19.21°N to 47.46°N and from −17.89°E to 42.46°E, containing 583 × 334 points in a 10 km × 10 km horizontal grid. Both domains contain 33 sigma-pressure vertical levels. With this configuration, we derived both the modelled dust and sea salt predictions above Finokalia station, with vertical resolution gradually decreasing between 56 m and 407 m in altitudes up to 2 km, and between and 450 m to 1.1 km in altitudes up to 12 km.

3. Results

This section presents the geometrical and microphysical characteristics of the clouds formed above Finokalia during the PRE-TECT campaign, along with the associated meteorological conditions in the broader Eastern Mediterranean region that led to their formation. Four cases are analysed with clouds formed in (i) the warm front of a depression system, (ii) a cold front region, (iii) the presence of an intense dust event, and (iv) a marine and continental boundary layer. Finally, the cloud statistics for the whole period of the PRE-TECT campaign are provided, along with an overview of the aerosol abundance in their presence.

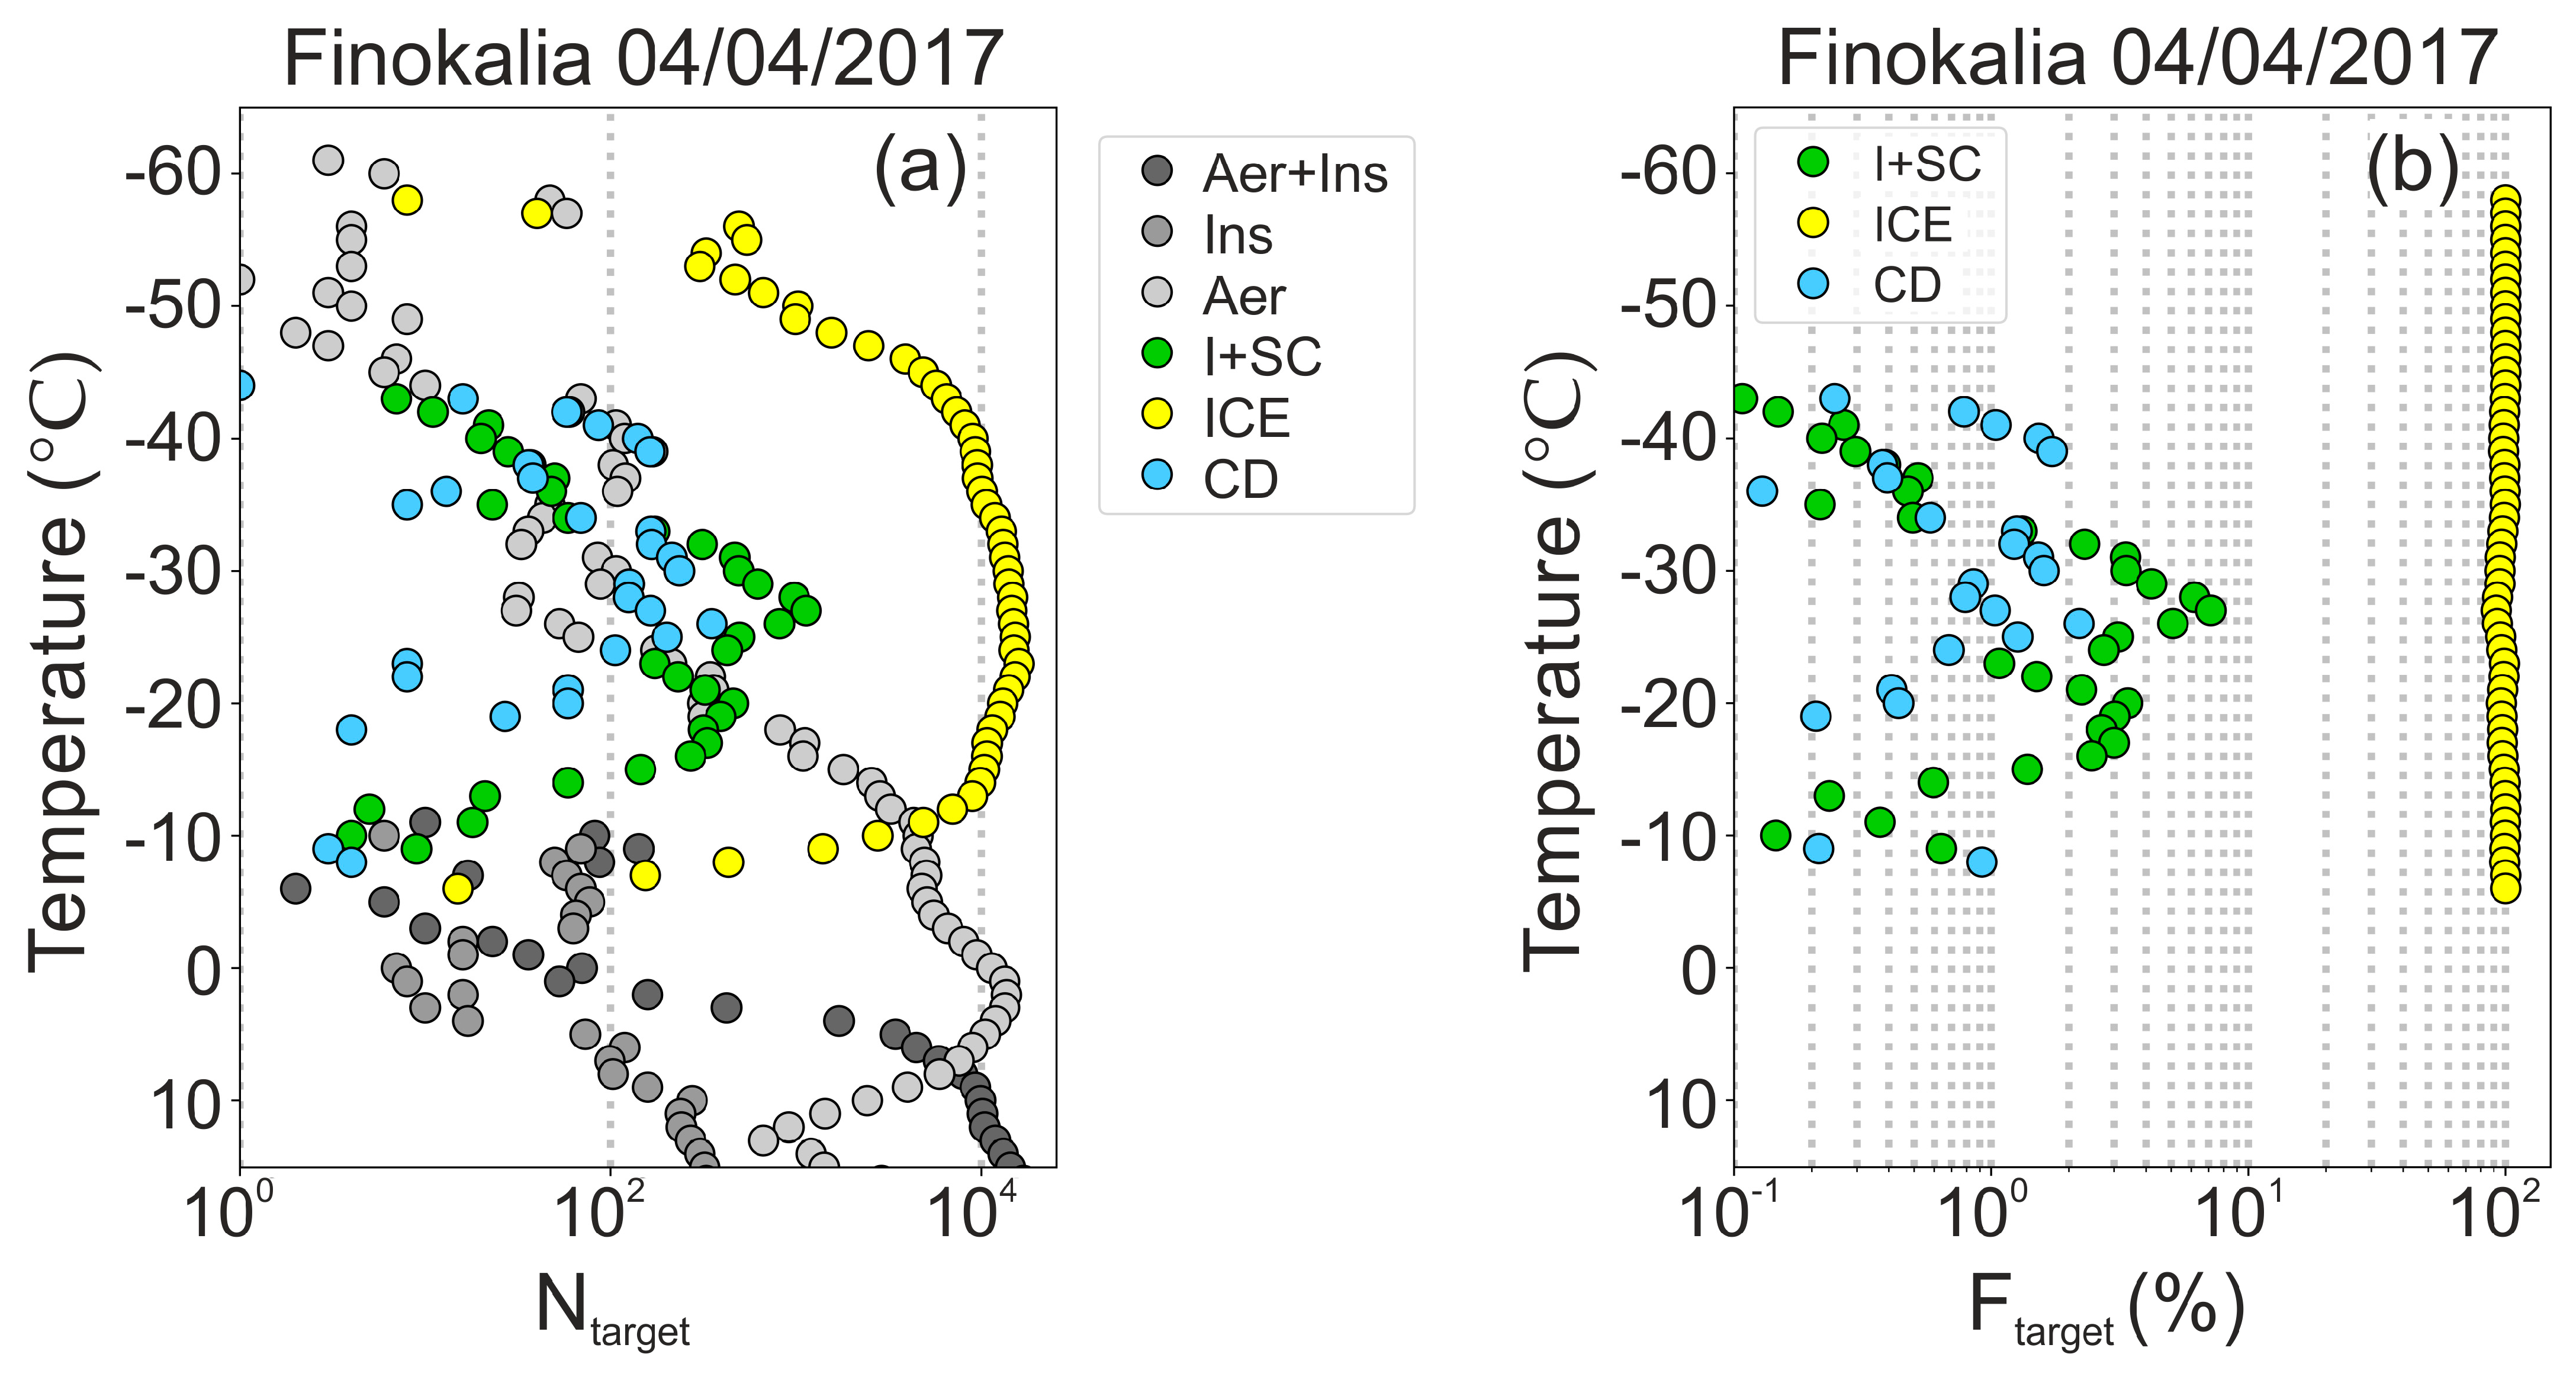
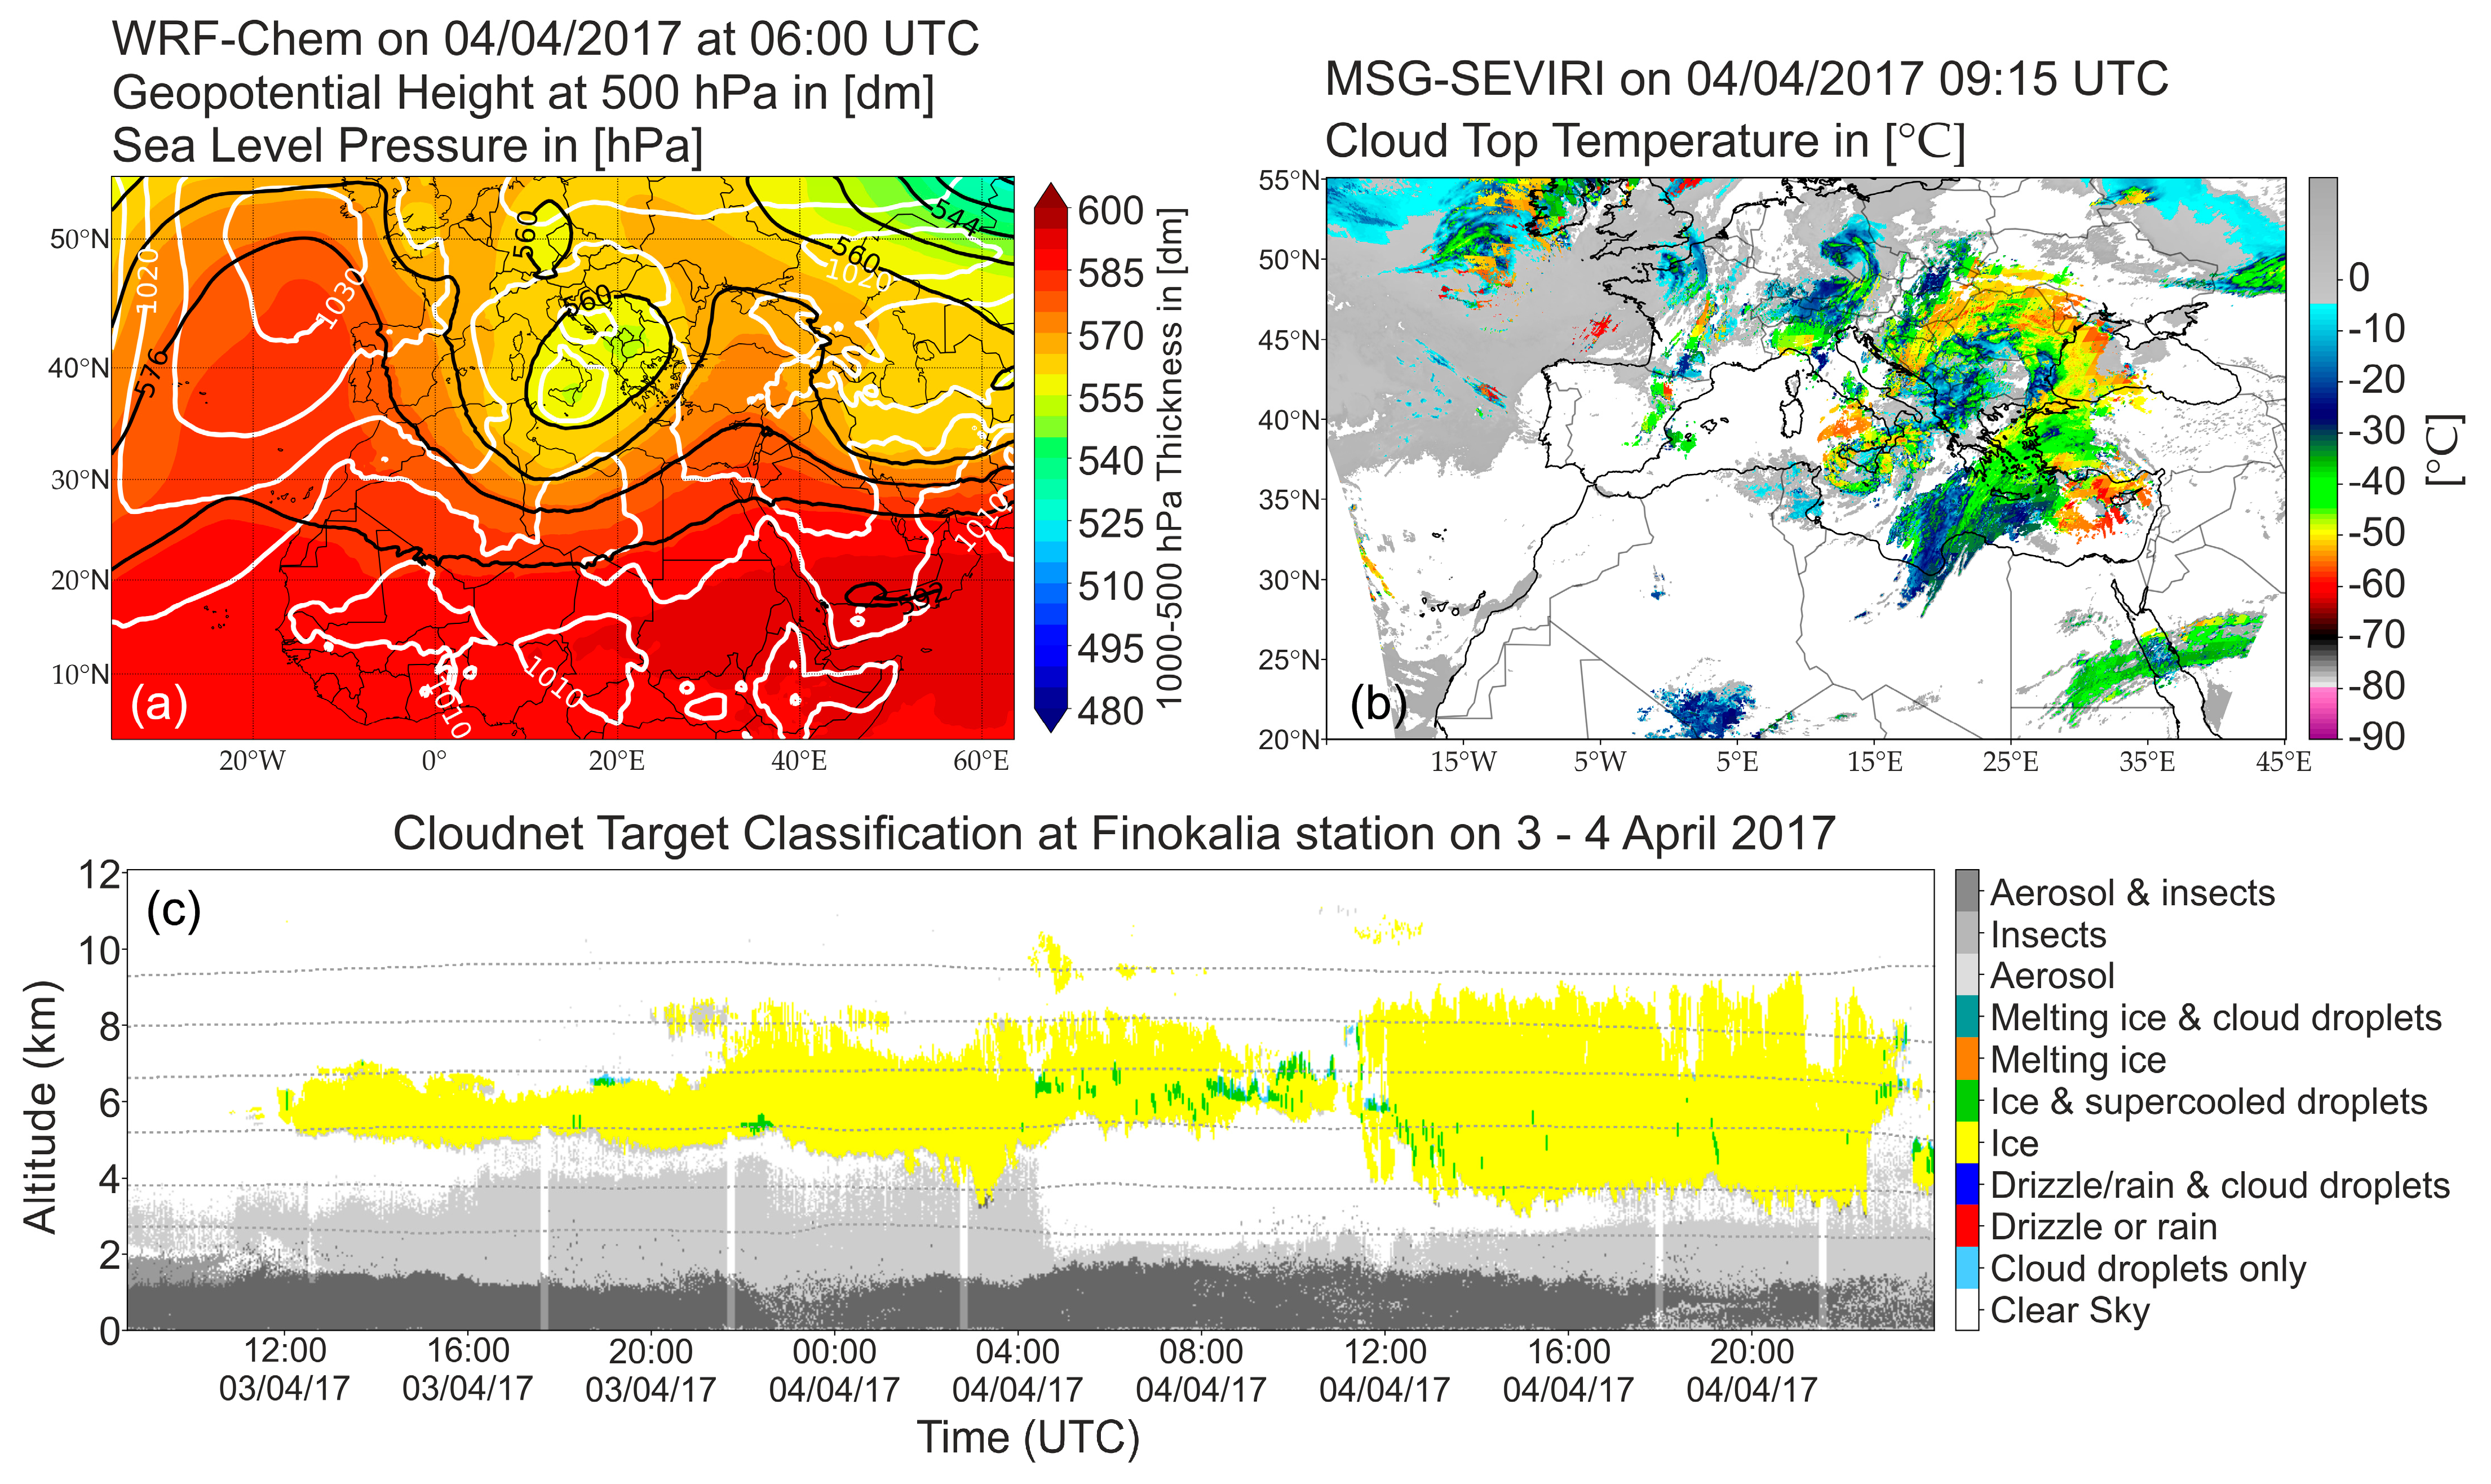
3.1. Case Study 1: 3–4 April 2017

On 3–4 April 2017, a surface low-pressure system was present above Sicily, with strong support from the upper levels of the atmosphere. Its center was almost aligned between the surface and 500 hPa, indicating its strong vertical structure. The cyclone moved slowly to the east, and in the positive vorticity advection area, mesoscale clouds formed with a frontal cloud band above Greece. Figure 4 shows the synoptic conditions on this day (Figure 4a) and the cloud top temperatures and abundance above the region (Figure 4b). Mostly high and mid-level clouds formed above the Eastern Mediterranean.
The Cloudnet products above Finokalia station and the MSG-Seviri cloud top temperature (Figure 4b,c) indicate the continuous presence of ice clouds on 3 and 4 April between 4 and 9 km altitude at temperatures from −10 °C to −50 °C. The majority of the observed clouds are ICE (99.5% of the clouds), with MPC presence mainly on 4 April, from 04:00 to 12:00 UTC. The cumulative cloud phase abundance for these days shows that 17% of the cloud profiles were MPC, and 82% were all-ice phase. During the period of the highest MPC abundance, the clouds from all categories were found at 5 to 8 km, and the majority of MPC were observed in the temperature range −15 °C to −35 °C, with the highest occurrence at −20 °C and −27 °C (Figure 3). Indicatively, the observations of MPC on 4 April represent 3.8% (at −20 °C) and 8.1% (at −27 °C) of the total cloud observations.

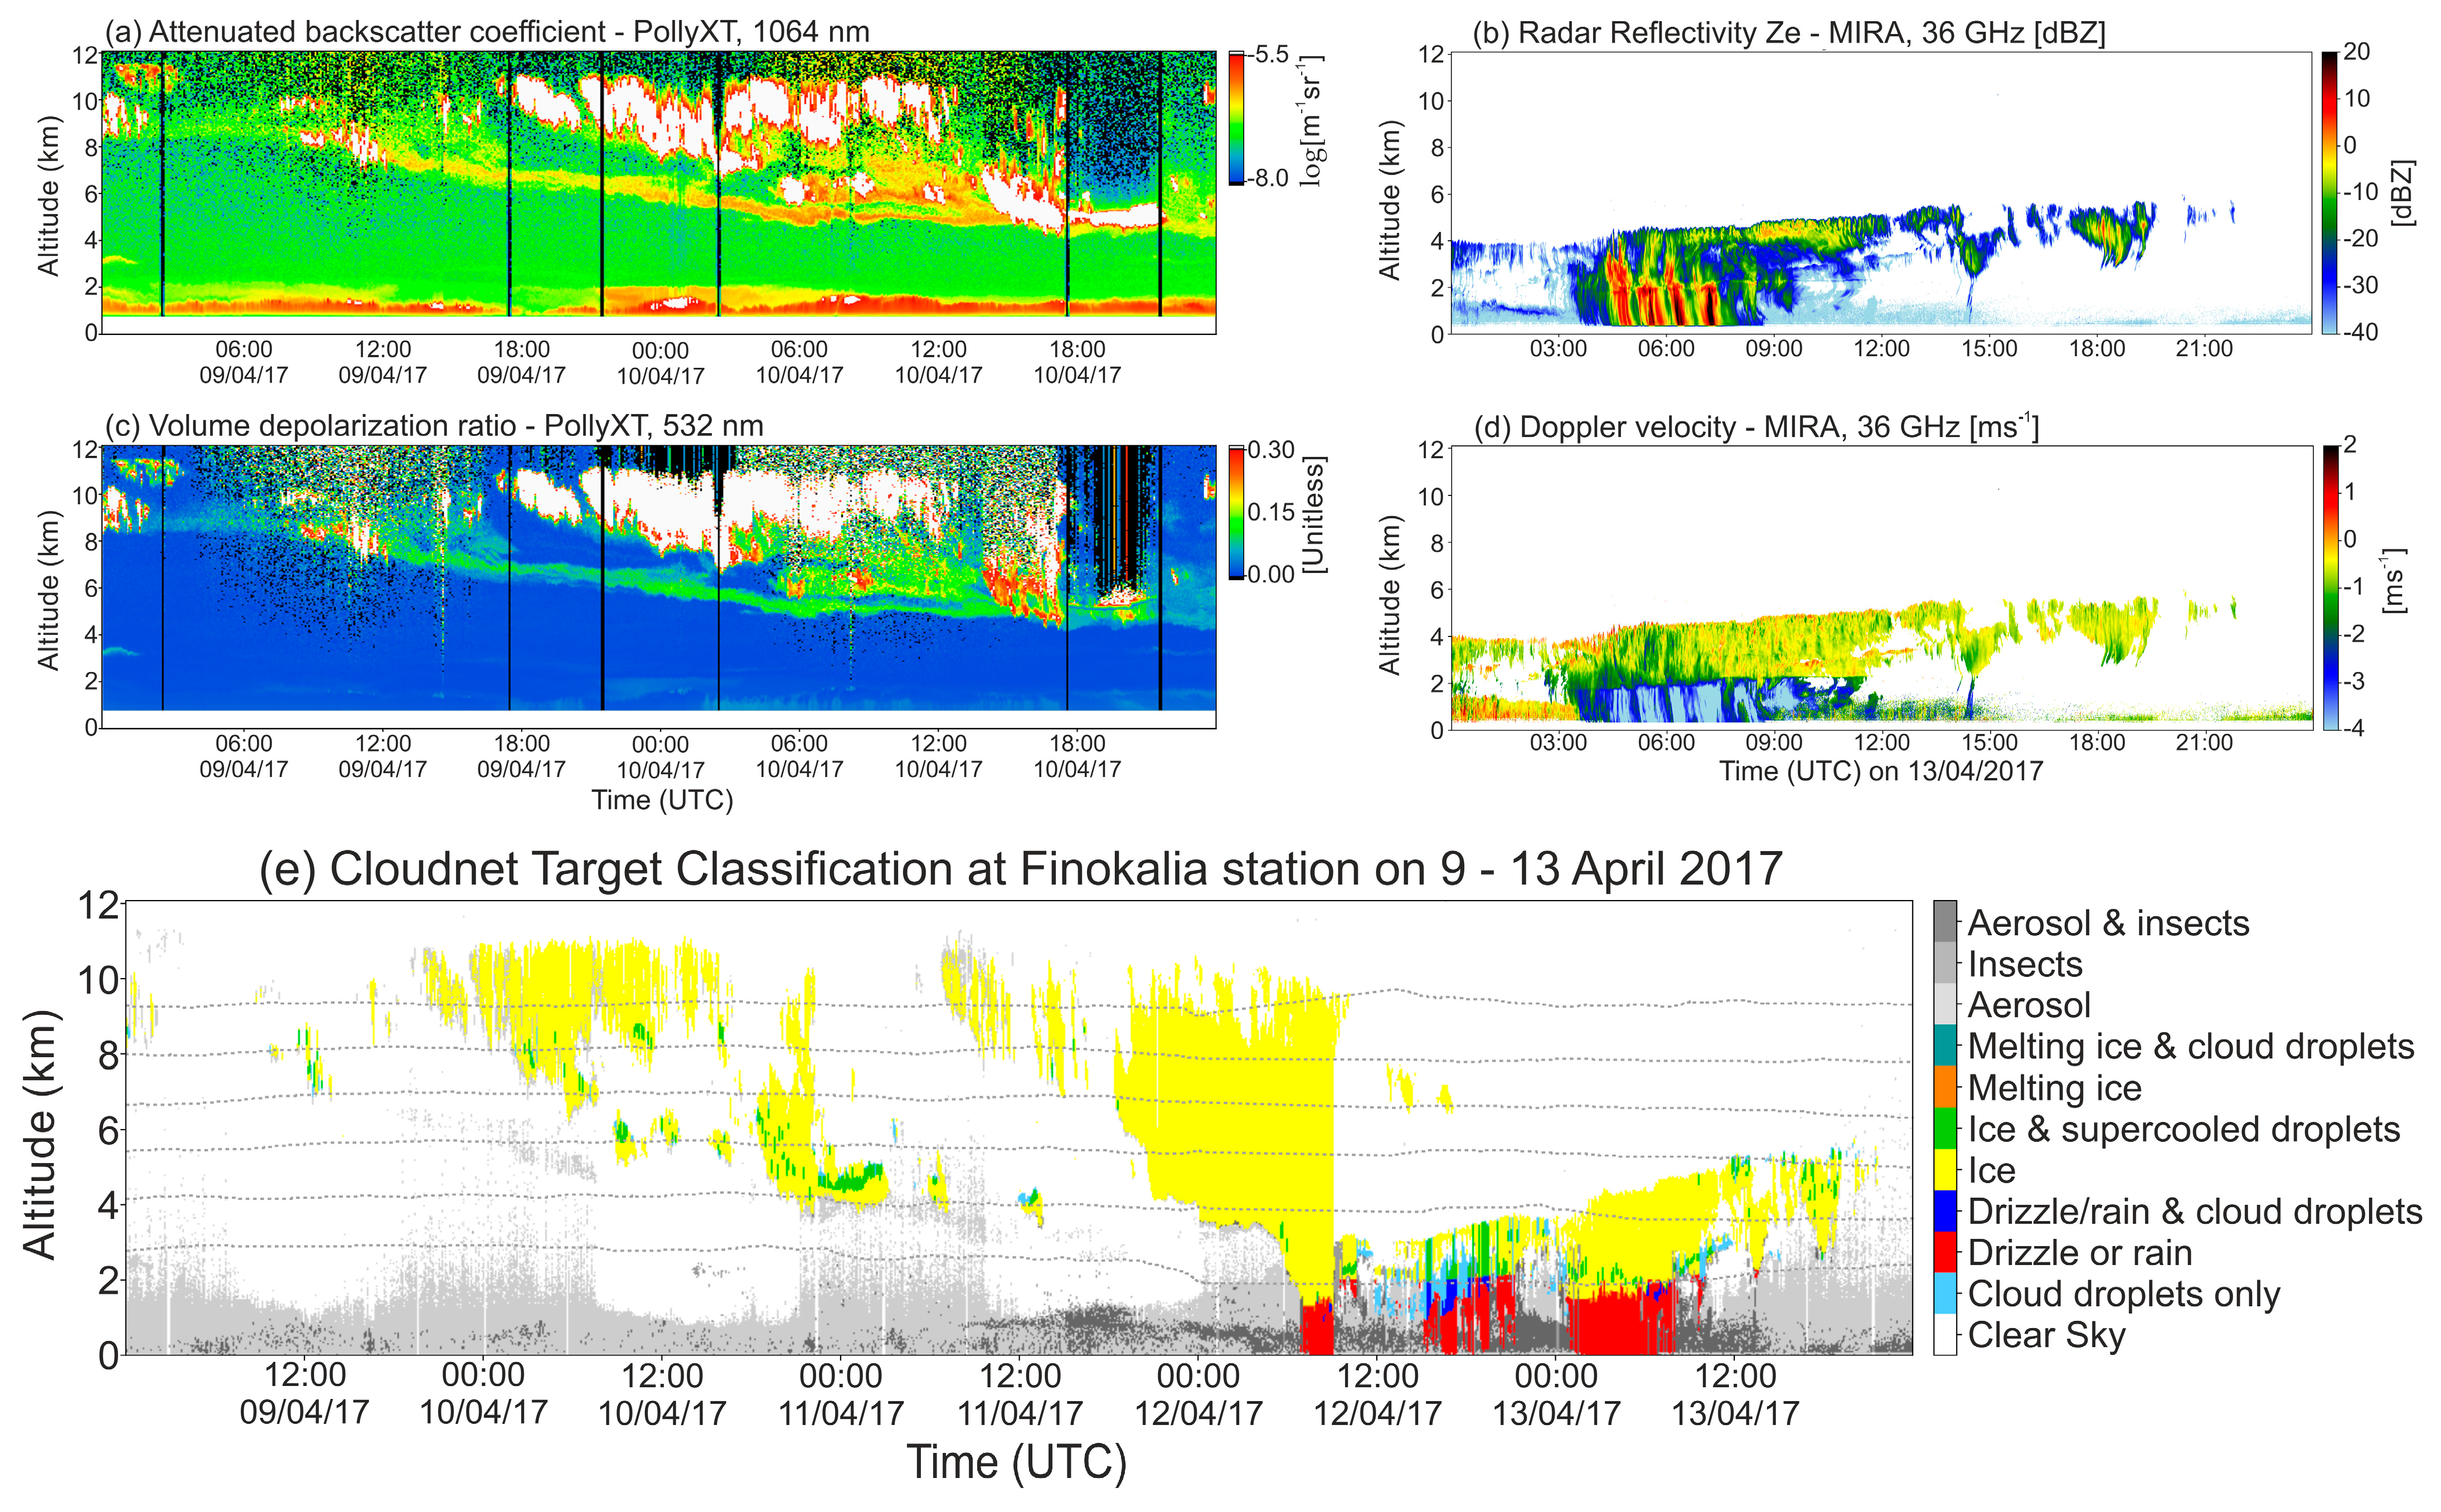
3.2. Case Study 2: 9–10 April 2017

On 9 and 10 April 2017, cold air masses were advected from Northeast Europe towards the Eastern Mediterranean, as indicated by the presence of an upper-level trough above the Black Sea in Figure 5a. The atmospheric conditions in the Mediterranean were characterized by the advection of warm African air masses near the surface and colder air masses in the upper troposphere (as indicated by the upper-level trough above Libya). The combination of the two systems resulted in the development of a cold frontal zone (indicated by the isopleths of 500–1000 hPa thickness). Along with the frontal zone, cold air masses replaced warmer air masses by forcing them to lift, resulting in extended cloud formation between Italy and Cyprus (Figure 5b). In the follow-up circulation during the following days, the advection of northern cold air masses continued, and the two systems merged in a prevailing 500 hPa trough above the Eastern Mediterranean (not shown). The Finokalia site, positioned in the positive vorticity sector of the trough, was affected by the formation of the convective clouds. The system was well-fed by the moist air masses of the region and resulted in precipitation.
The African air masses contained low aerosol concentrations with dusty aerosols also captured from the lidar measurements on 9 and 10 April 2017. Figure 6a,c shows the presence of a thin and elevated dust layer of approximately 1 km depth, with its base located above 8 km in altitude on the beginning of 9 April 2017, and gradually descending to 4 km in altitude by the end of 10 April 2017. The dusty layer had δ p = 27 ± 3% at 532 nm [48], indicating that dust dominated in the layer. The clouds were formed within the thin dust layer and were observed above the station on 9 April from 00:00 to 03:00 UTC and 07:30 to 12:30 UTC, and on 10 April from 05:00 to 22:30 UTC. Figure 6b,d shows the intensity of the rain event on 13 April, with radar reflectivity exceeding 20 dBz, and strong downward Doppler velocity reaching −2 m s−1 in the ice and exceeding −4 m s−1 in the rain (4:00–11:00 UTC). Figure 6e shows the effect on the cloud formation over the site of the cold front passage from 9 to 13 April 2017. On 9 April, high thin clouds were detected, which gradually deepened in vertical extent during the following days as the front passed over the site, reaching cloud top heights of up to 11 km. On 12 April, the development of deep convective clouds was observed, which led to precipitation events. Multiple rain periods were captured from 12 April at 22:00 UTC until 13 April at 11:00 UTC, with MPC layers formed at 2–4 km and constituting 10% of the clouds at T ~ 4 °C on 13 April. Additionally, significant SC abundance was found at T > −9 °C (up to 10% at 4 °C on 13 April) due to a thin cloud layer between 08:00 to 13:00 UTC. Later that day, MPC layers were observed between −15 to −25 °C, with their abundance exceeding 20% at T < −20 °C (Figure 7b–d).
A significant presence of MPC was observed in the clouds formed in the presence of the dust layer. Specifically, the Cloudnet classification showed the presence of a relatively small (in time and vertical extent) cloud formation at temperatures between −30 °C to −50 °C, containing a significant presence of MPC at ~12:00 UTC on 9 April. The corresponding MPC fraction reached 38% at −14 °C (Figure 7b). Later on, from 18:00 UTC on 9 April to 04:00 UTC on 10 April, mainly ice-phase clouds were present at altitudes between 7 and 11 km at temperatures from −30 °C to −60 °C. The MPC fraction of these clouds reached 10% at −38 °C (not shown). On 10 April, the majority of MPC observed at temperatures from −13 °C to −26 °C were related to the cloud formed in the dust layer between 12:00 UTC to 24:00 UTC. Here, the MPC fraction was 38% (at −14 °C) and 18% (at −24 °C) of the total cloud observations (Figure 7c). The MPC fractions related with the thin dust layers had significantly higher contributions to the overall MPC fractions at relevant temperatures, which were 16% at −5 °C and 3% at −13 °C, −24 °C, and −38 °C, for the period 9 to 13 April (Figure 7a).

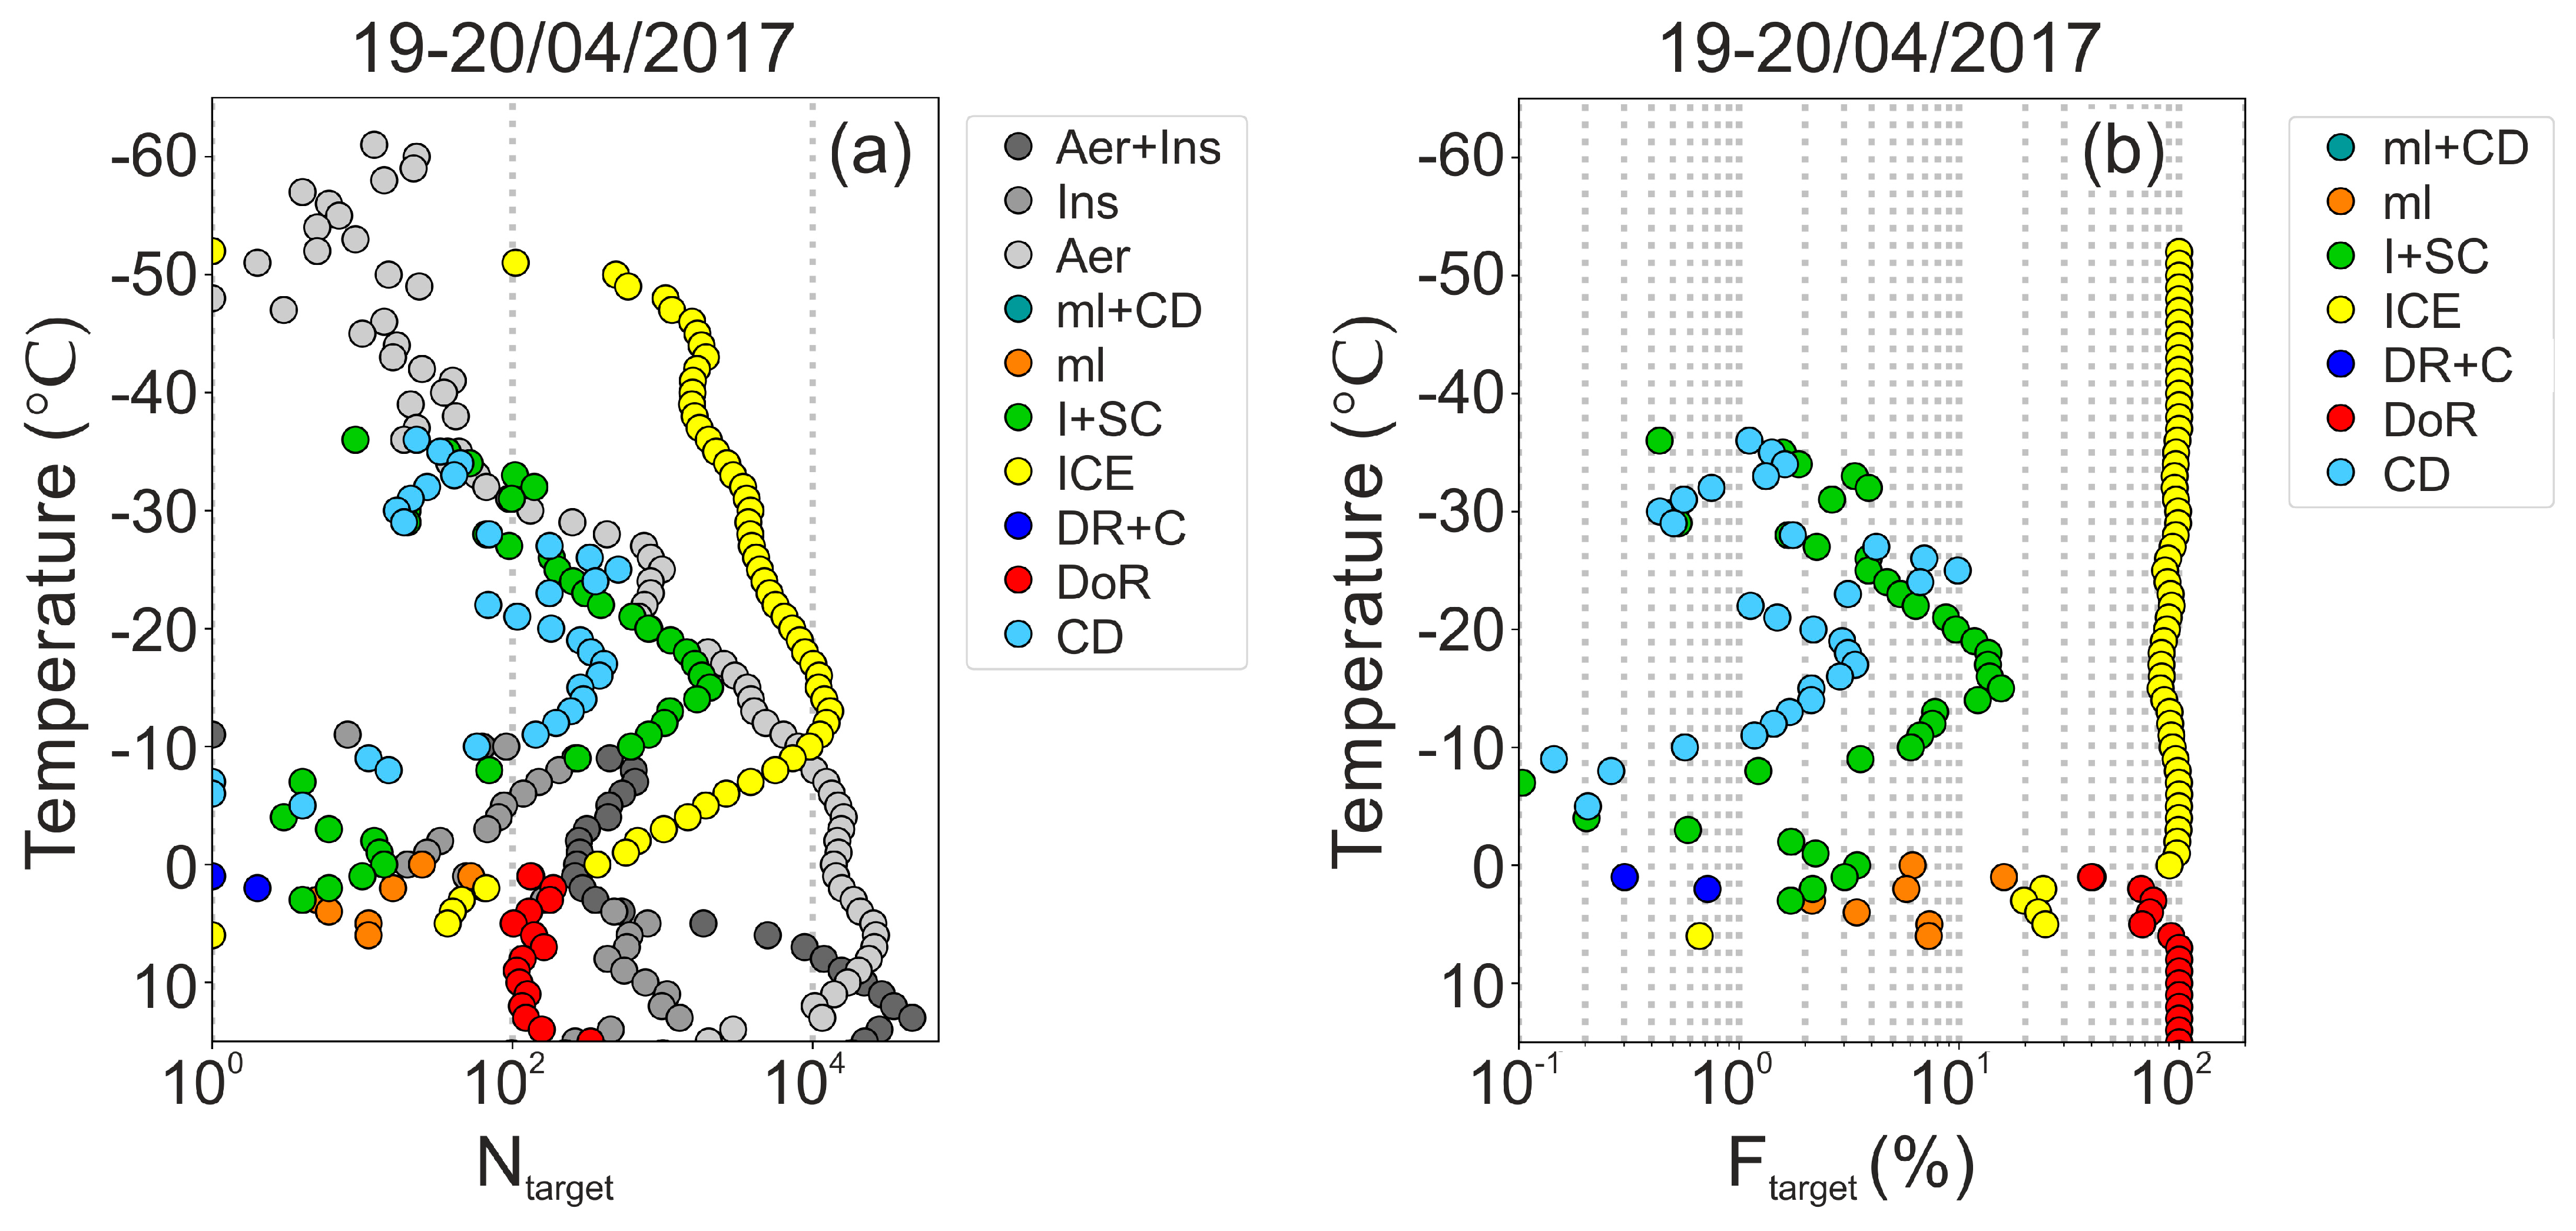
3.3. Case Study 3: 19–20 April 2017

On 19 and 20 April 2017, a deep low-pressure system over Central Europe affected the circulation above many countries, including Greece, with tropospheric temperatures lower than average (Figure 8). The circulation led to the advection of a Saharan air mass from Africa towards Finokalia. The instantaneous MSG-Seviri plots and PRE-TECT observations in Figure 8b,c show that clouds were formed on top of the Saharan dust layers with the support of the weakened frontal activity. Figure 8c,d shows the time evolution of the dust advection above Finokalia and the clouds that formed at the top of the dust layer. At the beginning of the event, the clouds were formed at altitudes between 3 and 5 km and temperatures from 0 °C to −20 °C. Later on, the cloud formation continued, extending up to higher altitudes, above 5 km, and temperatures lower than −20 °C. Short rainfall events were observed in Finokalia.
Two dust layers were observed above the station. The first one was observed at 12:00–23:00 UTC, at altitudes up to 4 km, with 2 km depth, δ p = 22 ± 3% and extinction coefficient of 50 ± 10 Mm1 at 532 nm. This dust layer seems to be connected with the clouds formed on 19 April, from 12:00 to 18:00 UTC. The second dust layer was observed after 18:00 UTC, at higher altitudes up to 7 km, with δ p = 27 ± 3% and extinction coefficient reaching 80 ± 10 Mm1 at 532 nm on 20 April. This layer is connected with the clouds formed on the day after.
A significant presence of mixed-phase layers was observed in all clouds on 19 and 20 April (Figure 9a). Additionally, the majority of MPC temperatures were higher than in previous cases (Figure 9b), showing values of −8 to −17 °C, and down to −26 °C. MPC represented 21% of the total cloud observations (at −16 °C).

3.4. Case Study 4: Clouds Formed in Marine and Continental Aerosols

Finokalia is a coastal location in South Aegean and is affected by meteorological conditions that support aerosol advection. The strong north winds that frequent this location contribute to the appearance of marine aerosols that are transported from the Aegean Sea and continental aerosols that are transported from the more northerly urban centers, such as Athens, Peloponnese, and Turkey [49,50,51]. Voudouri et al. [52] investigated the aerosol characterization of the observed layers over Finokalia during the PRE-TECT campaign, ignoring the cloudy cases. Their analysis shows that during cloud-free conditions, layers with clean continental particles (defined as medium size, medium spherical, and medium absorbing), along with layers with marine particles (defined as large, aspherical, nonabsorbing), were the most abundant aerosol types in the region, with the percentage of occurrence greater than 50%. Polluted continental particles were present in 10% of the cases, and cloud-free Saharan dust layers, either pure or mixed with other particles (smoke, polluted continental, marine), were present in 3% of the cases.
Figure 10 shows two case studies characterized by the presence of marine and continental aerosols on 18 and 23 April 2017. Low depolarization ratio values were observed below 2 km (Figure 10b,e), in combination with cloud formation at the top of the boundary layer at ~2 km (Figure 10a,d). Both cases are characterized mainly by zonal atmospheric flow in the upper levels (not shown), along with colder air masses dominating above Central and Northern Europe. On 18 April, boundary layer clouds were formed at 1.5–2 km during noon and afternoon, at the top of the aerosols below 2 km (with δ p < 10%, lidar ratio between 25 to 50 Sr and extinction coefficient of 25 ± 10 Mm1 at 532 nm). On 23 April, low-level clouds were formed from 02:00 UTC, at the top of the aerosols below 2 km (with δ p < 10%, lidar ratio > 50 Sr and extinction coefficient of 40 ± 20 Mm1 at 532 nm), with rain episodes before sunrise. The lidar observations indicate a higher abundance of marine particles on 18 April and a higher abundance of continental particles on 23 April. The former is supported by the WRF modelled sea salt concentrations (Figure 11), indicating concentrations greater than 15 μgr m−3 in altitudes up to 2 km on 18 April.
The clouds formed on 18 April are all at temperatures > 0 °C; hence no ice was present, and the drizzle observed evaporated before reaching the ground (Figure 10a,c). On 23 April, the ambient temperature was lower, and part of the clouds were in subzero temperatures, with ICE and I + SC present. A significant fraction of rain targets were detected, and rain reached the ground. The Cloudnet target classification statistics for these days are shown in Figure 10c,f. Most of the clouds formed were of liquid phase (CD and DR + C) (100% on 18 and 70% on 23 April). The wind lidar radial velocity observations, providing the vertical wind velocity, showed updrafts and downdrafts up to cloud base, indicating the contribution of the abundant marine and continental aerosols to the CCN and IN processes.

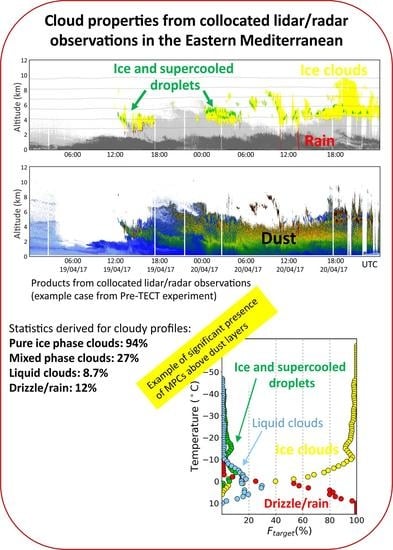
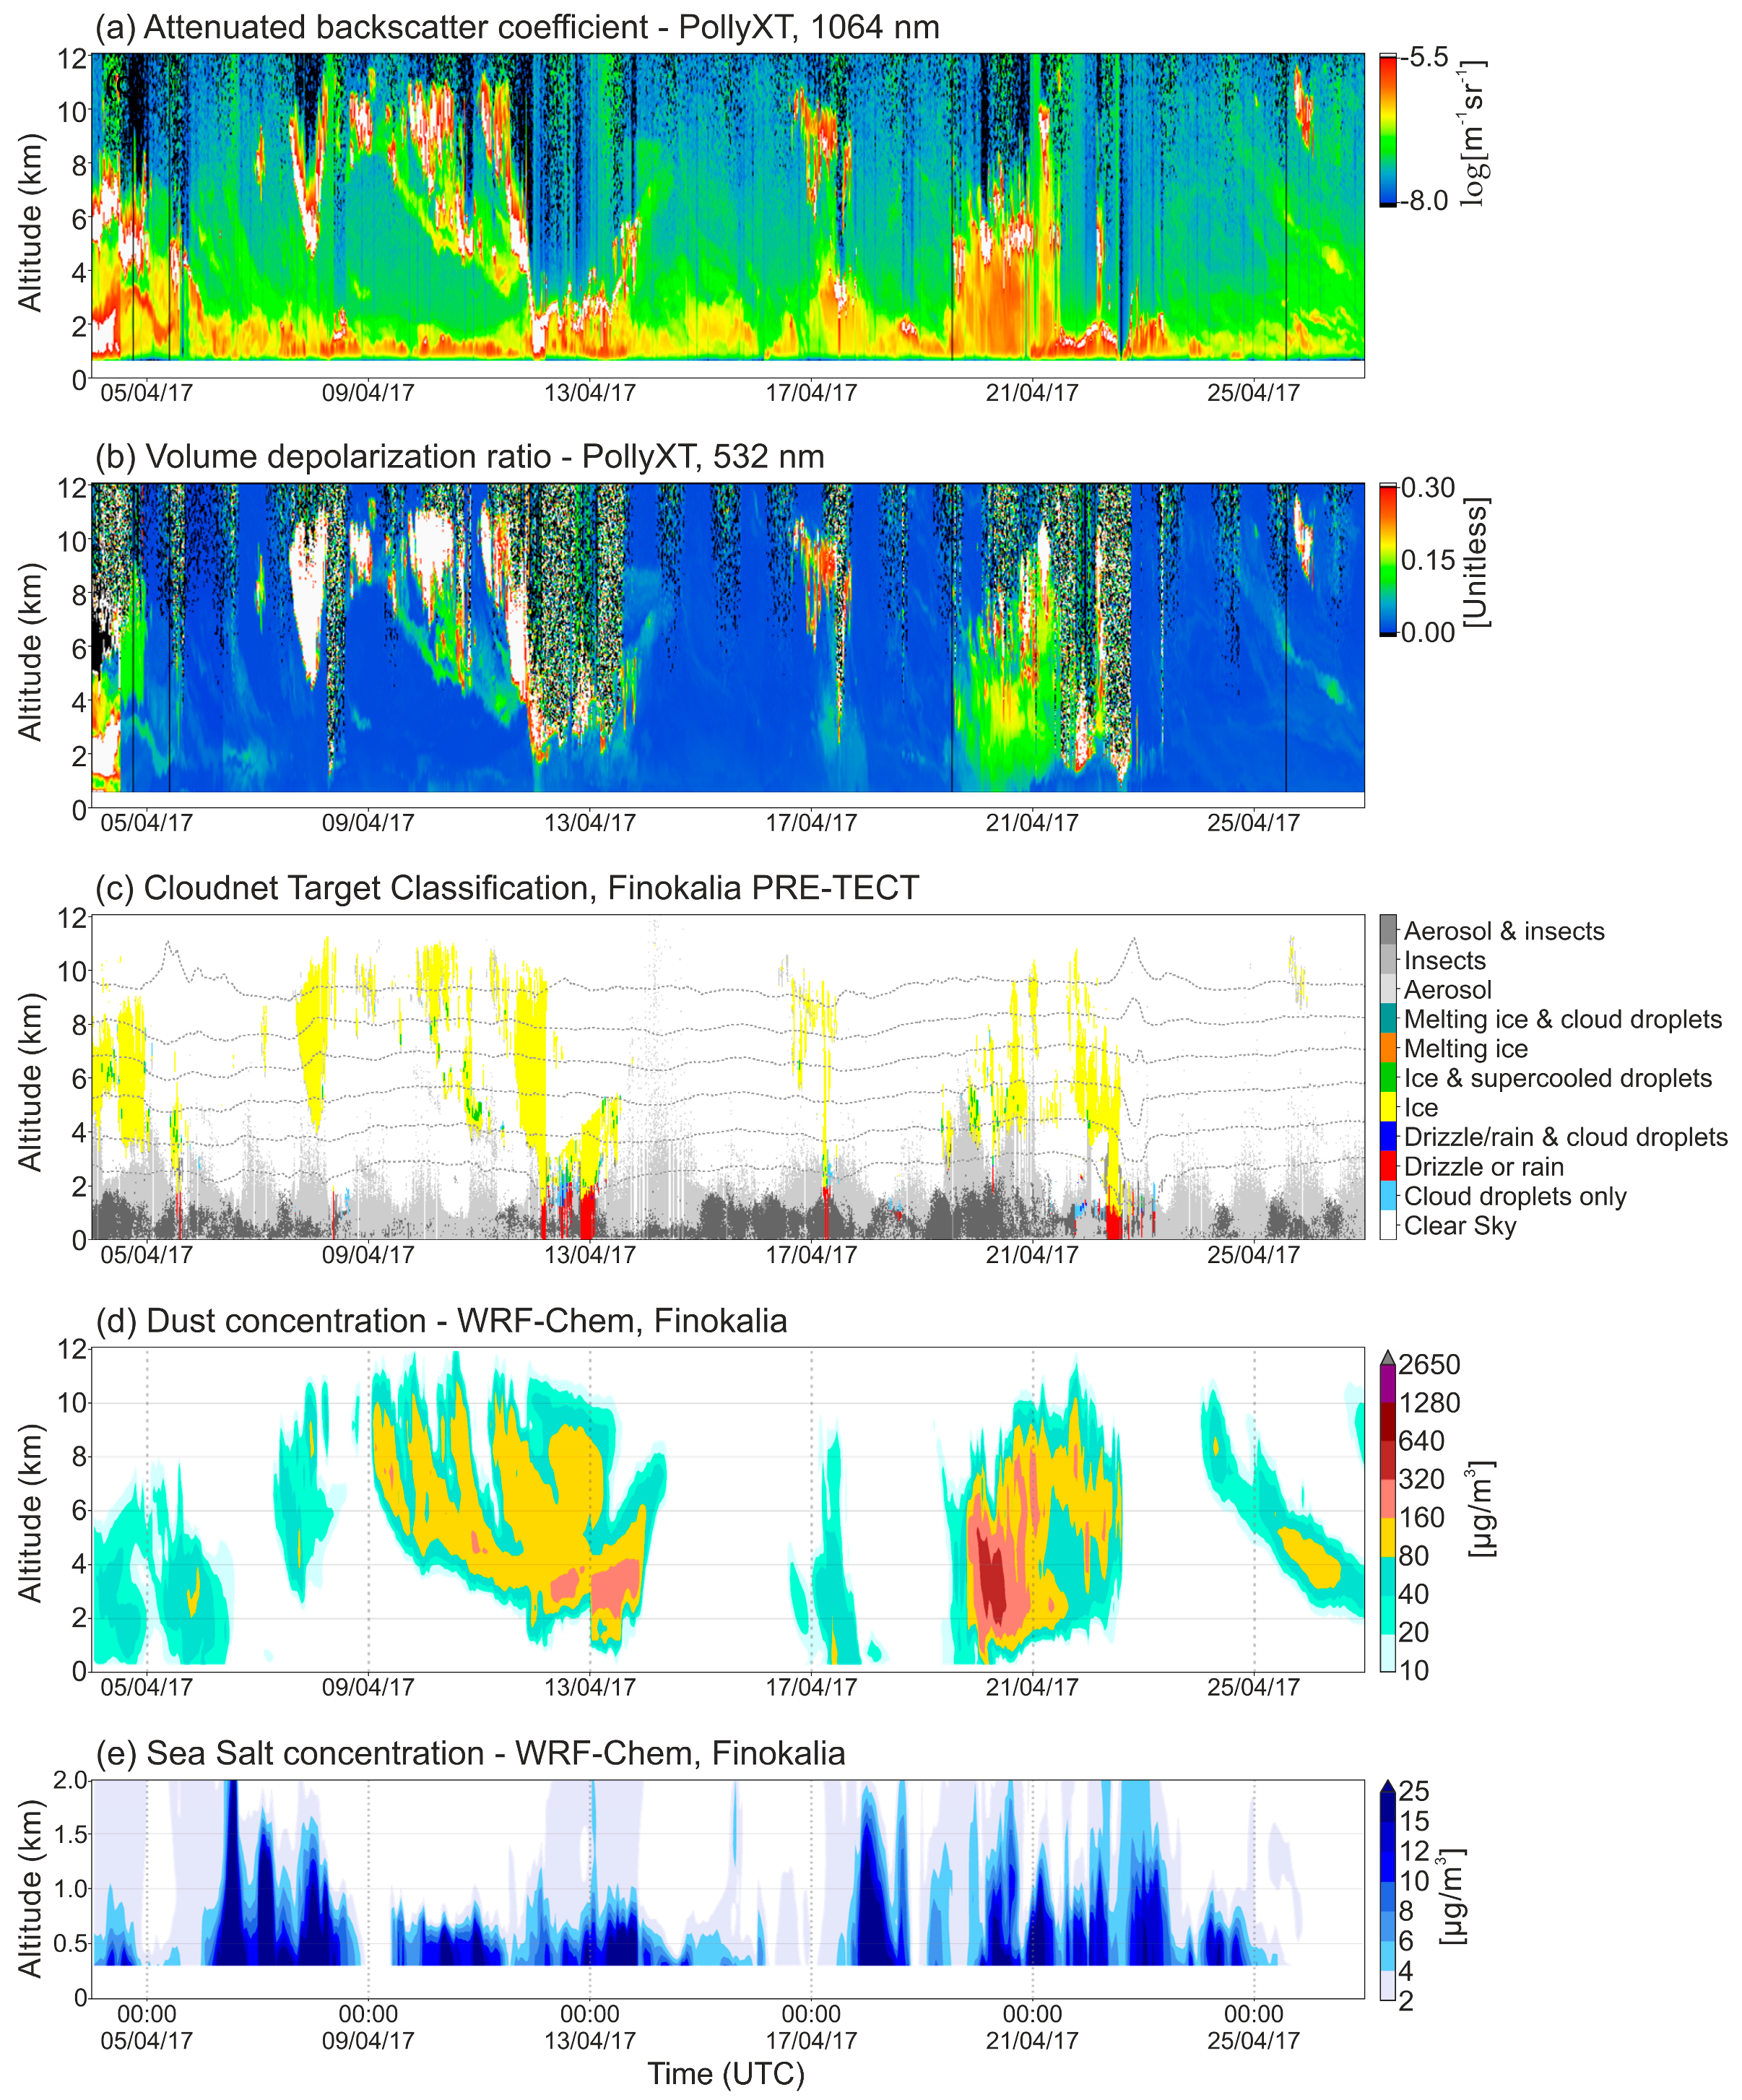
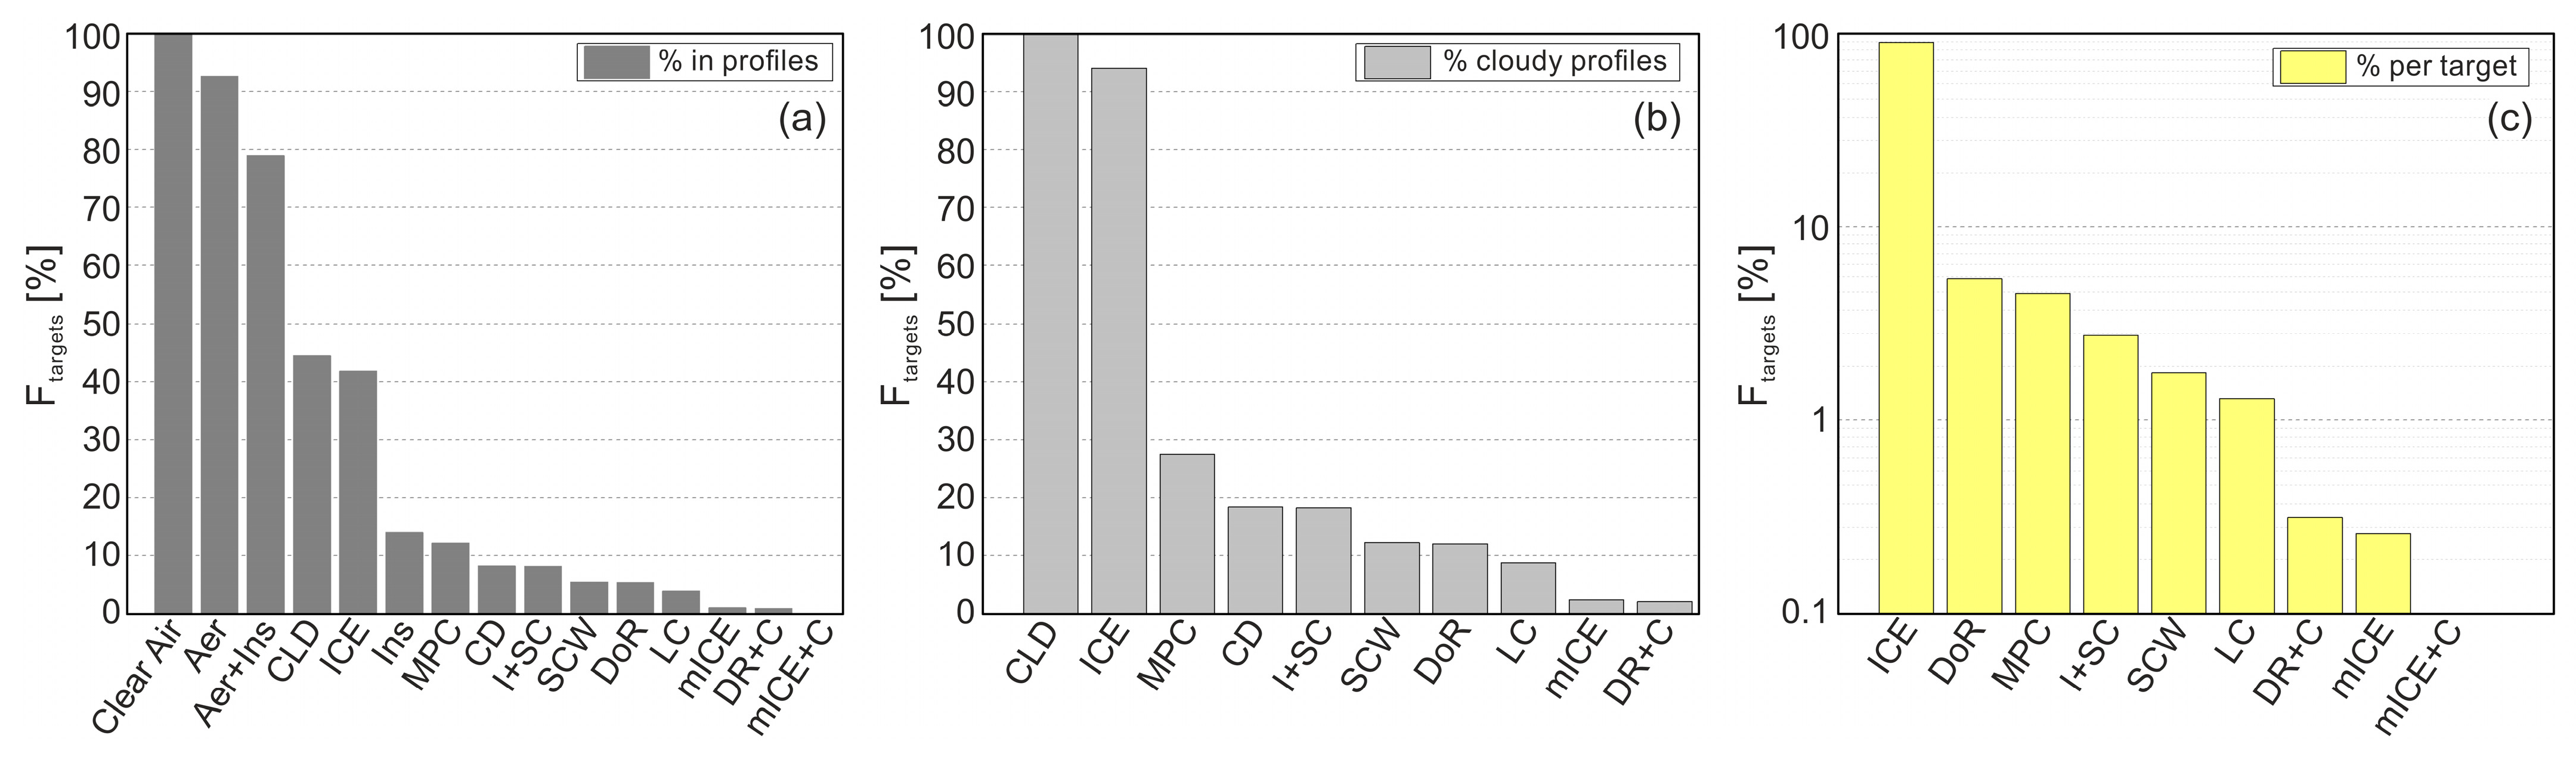
3.5. Overall Statistics during PRE-TECT

Figure 11 provides an overview of the aerosol and cloud conditions during the PRE-TECT campaign, as captured from the lidar and radar observations (Figure 11a–c), along with an overview of the modelled dust and sea salt concentrations advected above the site during the campaign period (Figure 11d,e). Figure 11a shows the lidar attenuated backscatter coefficient (calibrated range corrected signal) at 1064 nm, and Figure 11b shows the δ v values at 532 nm. The Cloudnet target classification is presented in Figure 11c.
Enhanced δ v values indicate the presence of non-spherical particles throughout April, and especially during the days of Saharan dust transport over Finokalia. During the campaign, four dust events were observed above the station (on 4–6, 8–12, 17, and 19–22 April). During these dust events, clouds were formed at the top of the dust layers, and rain episodes occurred. For the events on 4–6 and 19–22 April, the dust particles were advected up to 5.5 and 6 km, respectively. During the event on 8–11 April, under the influence of a persistent cold front, the dust layers were observed at 8 km, gradually increasing in depth from 1 to 3 km as they propagated to lower altitudes with time, reaching 4 km altitude before the rain event. The model correctly reproduces the evolution of the vertical structure of the dust field above the site and provides additional information on the dust presence inside the clouds (Figure 11d). By comparing the observations of the spatiotemporal abundance of the mid-level and high clouds between 3–6 and > 6 km, respectively, with the modelled dust field, it is evident that all the clouds during the PRE-TECT campaign may have been affected by the presence of dust particles. The modeled sea salt concentrations in Figure 11e indicate the periods and altitudes where favourable wind conditions may have contributed to a high marine aerosol load. The simulated sea salt concentrations are high (up to 25 μg/m3), mostly below 2 km height (Figure 11e). Combining multiwavelength lidar products with back trajectories simulations shows that, during PRE-TECT, aerosol layers in the vicinity of clouds at altitudes above 2 km were mainly dust and dust mixtures with pollution and sea salt.
Overall, within the one month of the PRE-TECT campaign, there were 25 days of collocated lidar and radar measurements above Finokalia. Cloudy cases were observed on 17 days, including 9 days with additional rainfall. In this dataset, complex and varied cloud structures were observed under complex and varied meteorological conditions. MPC were frequently observed (on 13 days) with and without detecting aerosols at their boundaries. Figure 12 (and in more detail Appendix A) presents the cloud geometrical characteristics. The majority of the clouds observed were mid-level clouds, in 38% of the cases with cloud tops between 2 and 7 km. In 58% of the cases, the cloud tops were higher, reaching up to 11 km, with a small occurrence of clouds at up to 12 km (1.6%). Low-level clouds were observed in 2% of the cases. The majority of cloud bases were between 3 and 6 km, in 49% of the cases, with 23% of the clouds having bases below 3 km and 28% above 6 km. Cloud depth varied significantly, from less than 1 km up to 9 km, with the majority of the clouds being less than 2 km in depth (47% of the cases) and 27% of the clouds with depths between 3 and 6 km.
Figure 13 presents the cloud statistics from the Cloudnet target classification. We estimated the statistics per profile (Figure 13a,b) and per hydrometeor target (Figure 13c). Aerosols were always present above the station in 92% of the profiles.
Clouds were present in 44% of the profiles, liquid clouds in 3.9%, ice clouds in 41.8%, MPC in 12.2%, and DoR in 5.4%. When clouds were present, they were observed with ICE phase in 94% of the cases, with MPC in 27%, I + SC 18%, and SCW 12%, and in liquid phase in 8.7% of the case, while DoR occurred in 12% of the cloudy cases. The statistics on the hydrometeor phase per target (Figure 13c) show the absolute domination of the ICE and DoR phases, with percentages of occurrences of 90% and 5.3%, respectively. MPC and LC targets follow with low percentages (4.5% and 1.3%).
We also analyze the statistics of the Cloudnet target classification results for three temperature clusters at [−10, −1] °C, [−20, −10] °C, and [−30, −20] °C. Here, we see again that clouds observed at altitudes with temperatures below 0 °C are dominated by the ICE phase, coexisting with I + SC and even SC at certain temperature clusters. Pure ice had the highest occurrences at [−20, −30] °C, representing 99% of the cloud observations. At [−10, −1] °C, 6% of the targets were DoR. In what follows, we provide the statistics of the Cloudnet target classification results for all targets and only-cloud targets, for each modelled temperature level, with a vertical resolution of 1 °C (Figure 14). We see the ICE dominance in temperatures below 0 °C and rain dominance above 0 °C. MPC were observed at [−45, 0] °C. Their highest occurrences are found at [−10, −1] °C, representing 29% and 16% of the cloud observations at −6 °C and −3 °C, respectively, from which 14% and 6.6%, respectively, are classified as I + SC. A second abundance maximum is observed in the range [−20, −10] °C, where MPC represents the 8.4% of the cloud observations at −15 °C, from which 7% are classified as I + SC. Their abundance in the temperature range [−30, −20] °C varies between 2 and 4.5% and in [−40, −30] °C between 1.3 and 2.5%.

4. Discussion

Within the one month of the PRE-TECT campaign, complex and varied cloud structures were observed, with and without the detection of aerosols in their boundaries. Finokalia was strongly affected by the transport of dust layers from the Saharan desert, which affected the observed mid-level clouds formed at the top of the dust layers. These clouds had a dominant ice phase with their cloud tops exceeding five-kilometer altitude. In our study, a significant presence of MPC was observed in all clouds with Saharan dust particles in their vicinity. Indicatively, although the overall MPC abundance at −15 °C was 8.4%, during the dust events on 9–10, 13 and 19–20 April, it was approximately three times higher in the same temperatures (26%) with an abundance of 38% (at −14 °C), 20% (at −20 °C), and 21% (at −16 °C) for the three events. For clouds in the presence of dust observed at higher altitudes (lower temperatures), MPC abundance was also significantly higher than the mean conditions (<4.5%), reaching 10% (at −38°C) and 18% (at −24 °C) on 9 April and 14% at (at −25 °C) on 19–20 April. At lower altitudes, MPC occurrence is still significant, reaching 25% (at −3 °C) in the dust event on 5 April, 10% (at 4 °C) on 13 April and exceeding 20% at temperatures between −6 °C and −3 °C in the dust event on 17 April. All dust events observed in April were followed by rain above the site.
To our knowledge, our study is one of few that present the geometrical and microphysical properties of clouds formed in the presence of dust in the Eastern Mediterranean region. Radenz et al. [53] focused on the ice formation in stratiform MPC at three different observational sites (Leipzig, Limassol, Punta Arenas). This study showed that, in stratiform MPC, the fraction of clouds that contain ice at temperatures below −15 °C is more than 85% of the observations. These retrievals, even if not entirely comparable, are in line with ours, where a pure ice phase was observed in 87% of the cloudy cases at temperatures below −15 °C. While at Finokalia, Leipzig, and Limassol, all clouds below −16 °C contained ice, while at Punta Arenas, a fraction of 5–7% of shallow stratiform clouds at these temperatures were classified as liquid only. In the same study, it was found that the fraction of ice-forming clouds between −25 and −15 °C was 100% in Leipzig, 95% in Limassol, and 60% in Punta Arenas. In our study, the fraction of ice clouds at these temperatures was 94.5% in our overall dataset and 30% of the clouds formed during the continental/marine conditions on 18 and 23 April. Moreover, another point discussed by Radenz et al. [53] is that the fraction of ice forming clouds between −25 and −15 °C remains 10% lower in the clean marine environment of Punta Arenas, compared with the moderate or highly polluted environments (i.e., Leipzig, Limassol). These differences can be attributed to the difference in the amount of ice-nucleating particles at the sites mentioned above. Our retrievals are within the range of these observations, as the clean marine environment of Finokalia can also be strongly affected by the transportation of dust from the Saharan desert, which is known to be an efficient IN at low temperatures [32], and as discussed already, lower ice fractions were observed during the dust-free cases.
Satellite retrievals derived with the synergy of the A-Train satellite observations suggest systematically lower ice amounts in the southern mid-latitudes [54] and a strong sensitivity to dust load [55]. Additionally, the study of Listowski et al. [56] showed the seasonal dependence of the cloud fraction percentages for MPC and supercooled liquid water clouds, based on the combined radar–lidar DARDAR-MASK v2 products over an Antarctic region. This seasonality is claimed to be dependent on the temperature seasonal cycle and the sea ice fraction seasonal evolution, which drive the amount of water vapour released into the atmosphere. Huang et al. [57] provide another climatological study of the thermodynamic phase of the clouds over the Southern Ocean, showing that the relative frequencies of the cloud top thermodynamic phase classes of ice is seasonally dependent and can reach up to 60%. Based on these findings, our study could be further extended to a larger dataset to account for the seasonal variation of the statistics for the cloud phase over the East Mediterranean region.
The frequency of occurrence of ice, liquid, and MPC observed in the PRE-TECT clouds offers a valuable observational dataset for the validation of GCM-predicted SLF [2], and thus can be used to evaluate the model’s capability to represent the phase partitioning of cloud water correctly. Using additional Cloudnet products, similar datasets could be derived to evaluate the cloud microphysical parameterisations in numerical weather prediction (NWP) models, resulting in the improvement of precipitation forecasts [58].

5. Conclusions

Combined lidar and cloud radar observations performed in the framework of the PRE-TECT experimental campaign have been processed with the Cloudnet target classification algorithm to study the cloud geometrical and microphysical properties above the Eastern Mediterranean. A statistical analysis of the cloud geometrical properties and thermodynamic phase at different height levels has been provided for the first time in this understudied region. Overall, within the one month of the PRE-TECT campaign, there were 25 days of collocated lidar and radar measurements above Finokalia. Cloudy cases were observed in 17 days, including 9 days with additional rainfall.
We found that the variable atmospheric conditions that prevailed above the region during April 2017 resulted in complex cloud structures. Mid-level clouds were observed in 38% of the cases, high or convective clouds in 58% of the cases, and low-level clouds in 2% of the cases. Overall, during the monthly campaign, clouds were present in 44% of the profiles, with liquid clouds in 3.9%, ice clouds in 41.8%, MPC in 12.2%, and DoR in 5.4%. The ICE phase was observed in 94% of the cases during cloudy conditions and was linked with particles exhibiting high lidar depolarization. While the majority of the mid-level clouds were formed in the presence of dust particles and were ice-dominated, the low-level clouds were formed in the presence of sea salt and continental particles with ice abundance below 30%. In our study, a significant presence of MPC was observed in all clouds formed at the top of a dust layer, with an abundance three times higher than the mean conditions (26% abundance at −15 °C).
The results of this study can be used synergistically with other Cloudnet-derived cloud products and lidar-derived aerosol properties in order to study the effect of aerosols on the clouds formed above the region, and the PRE-TECT dataset can be used for the evaluation of the cloud microphysical parameterizations in NWP and GCM models. In the future, our study could be further extended to a larger dataset to account for the seasonal variation of the cloud statistics over the East Mediterranean region (e.g., for the PANhellenic GEophysical observatory of Antikythera (PANGEA) station [59]).

Author Contributions

Conceptualization, E.M., K.A.V., C.M. and M.R.; methodology, E.M.; software, E.M. and E.D.; formal analysis, E.M.; investigation, E.M. and K.A.V.; resources, E.M., K.A.V., M.R., D.E., E.D., E.O. and V.A.; data curation, E.M., M.R., D.E., H.B. and E.O.; writing—original draft preparation, E.M., K.A.V., E.D. and I.T.; writing—review and editing, E.M., K.A.V., E.D., I.T., A.T., M.R., D.E. and E.O.; visualization, E.M., K.A.V., E.D. and H.B.; supervision, C.M.; project administration, K.A.V., E.M. and C.M.; funding acquisition, E.M., K.A.V. and C.M. All authors have read and agreed to the published version of the manuscript.

Funding

This research was funded by Greece and the European Union (European Social Fund-ESF) through the Operational Program «Human Resources Development, Education and Lifelong Learning 2014–2020» in the context of the project “MANAM” (MIS 5047913).

Data Availability Statement

The Cloudnet data used are publicly available on the Cloudnet data center [39]. The PollyXT data used are publicly available as quick looks in the PollyNET website (polly.tropos.de, accessed on 6 December 2021) and available upon request from E.M. and V.A. The MSG SEVIRI data used for the cloud-top temperature plots is the product: “CLAAS-2.1: CM SAF CLoud property dAtAset using SEVIRI—Edition 2.1” [60] and were obtained from EUMETSAT’s Satellite Application Facility on Climate Monitoring (CM SAF).

Acknowledgments

The authors would like to acknowledge EARLINET [61], Cloudnet [39], and ACTRIS [62] for the data collection, calibration, processing and dissemination. We thank the PRE-TECT team for providing access to the PRE-TECT datasets [34]. We thank Doina Nicolae for her support during PRE-TECT for the implementation of the Cloudnet station in Finokalia.

Conflicts of Interest

The authors declare no conflict of interest.

Abbreviations

The following abbreviations are used in this manuscript:
ACIAerosol Clouds Interactions
ACTRISAerosol, Clouds and Trace Gases Research Infrastructure project
AFWAAir Force Weather Agency
CCNCloud Condensation Nuclei
CNR-IMAItalian National Research Council’s Institute of Methodologies for environmental Analysis
D-TECTthe ERC project “Does dust TriboElectrification affect our ClimaTe?”
ECMWFEuropean Center for Medium-Range Weather Forecasts
FMIFinnish Meteorological Institute
GCMsGlobal Climate Models
GFS-FNLGlobal Forecast System Final Analysis
GOCARTGeorgia Institute of Technology-Goddard Global Ozone Chemistry Aerosol Radiation and Transport Aerosol Radiation and Transport aerosol model
INIce Nuclei
INOENational Research & Development Institute Optoelectronics
MPCMixed Phase Clouds
MSG-SeviriSpinning Enhanced Visible and InfraRed Imager
NOANational Observatory of Athens
NWP Numerical Weather Prediction
PANGEA PANhellenic GEophysical observatory of Antikythera station
SCWSupercooled water
δvVolume depolarization ratio
δpParticulate depolarization ratio

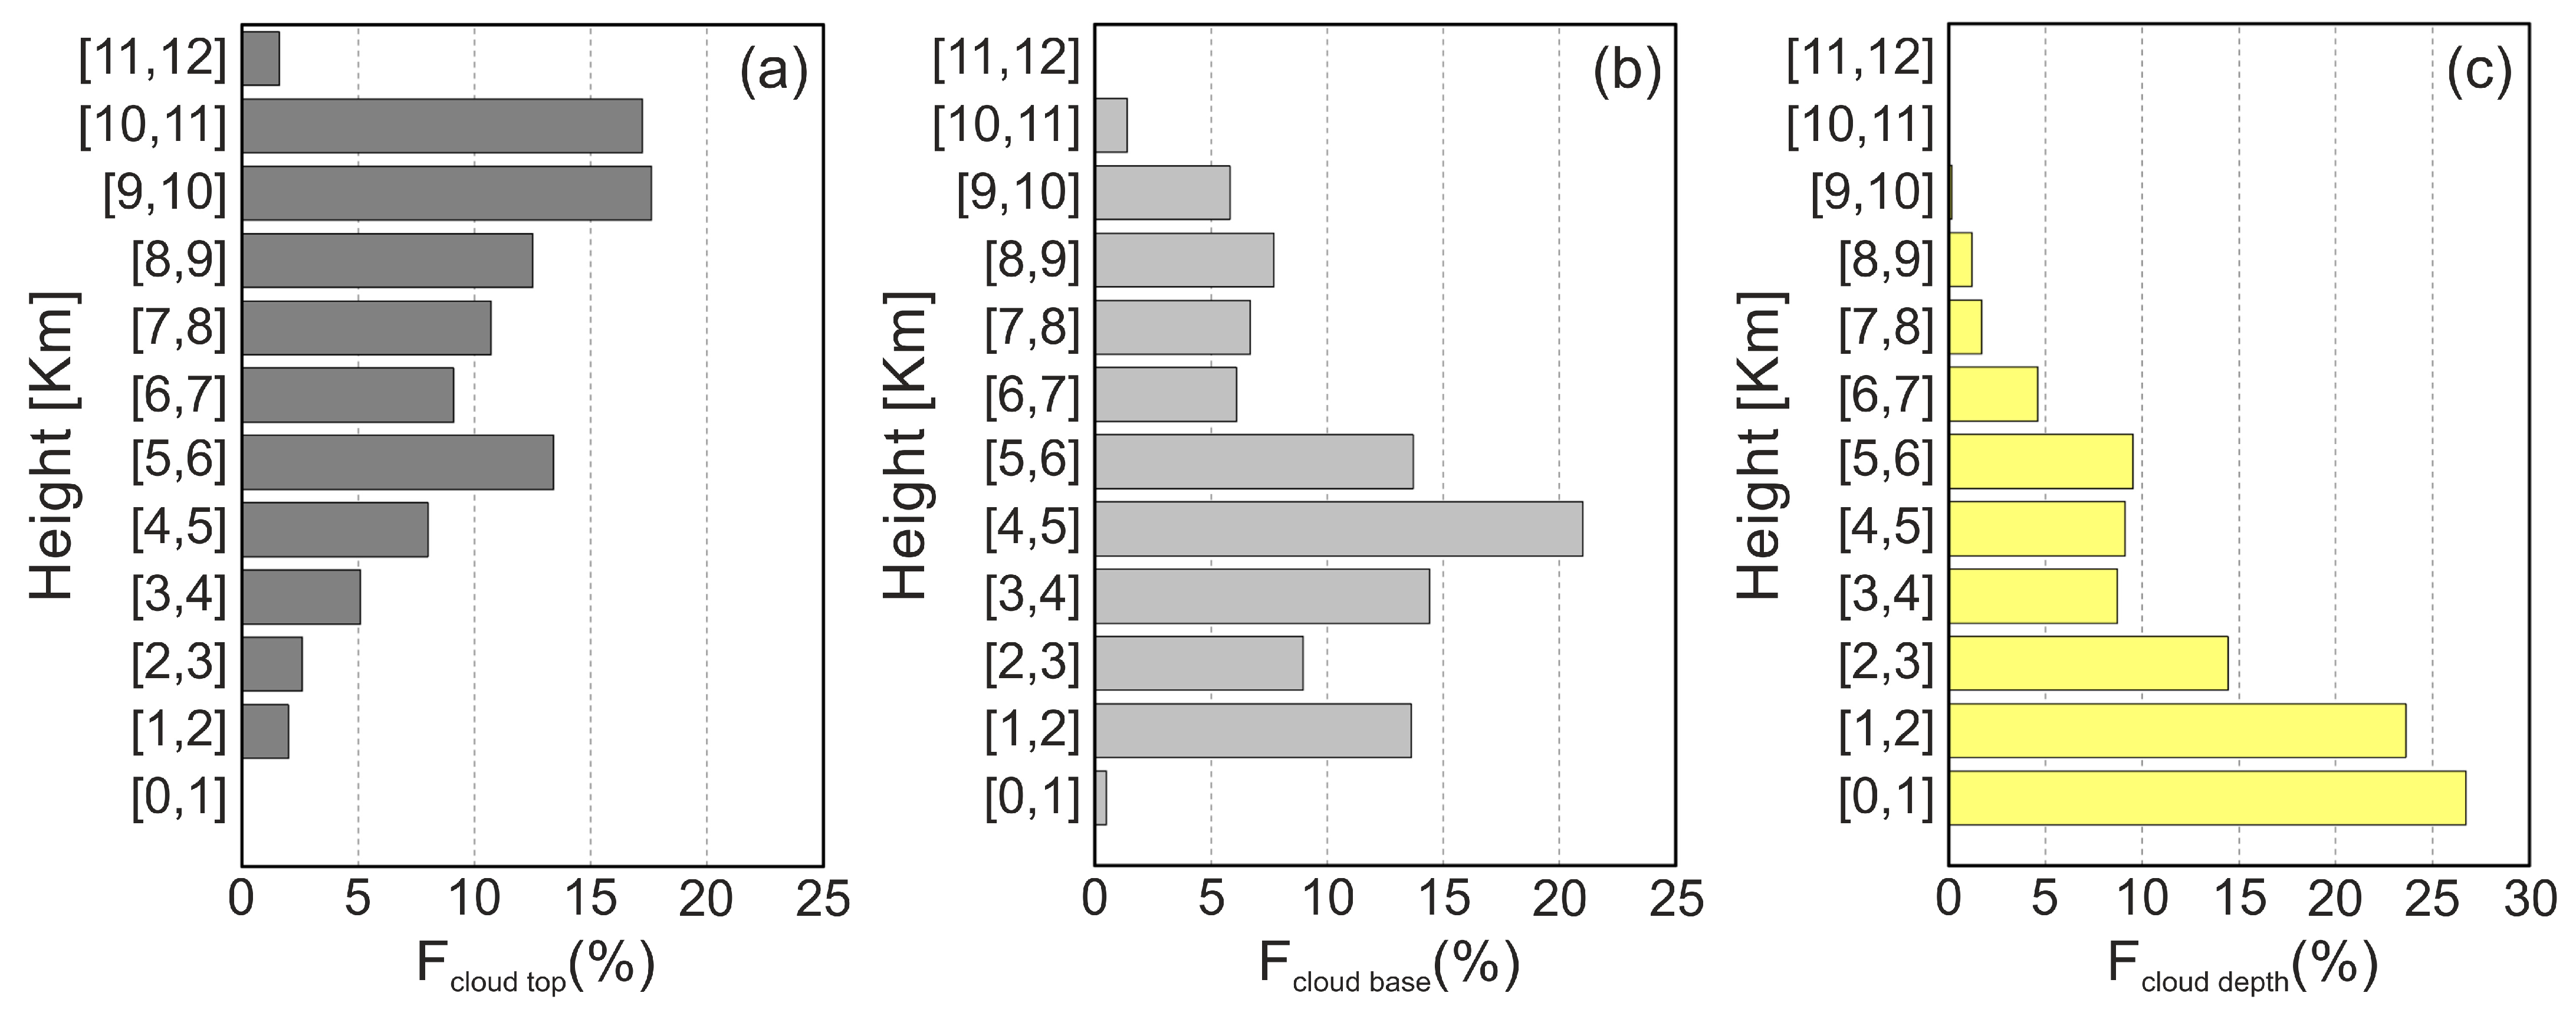
Appendix A. Cloud Base, Top and Depth Occurrence Statistics above Finokalia Site during PRE-TECT

KmCloud BaseCloud TopCloud Depth
[0, 1]0.5026.7
[1, 2]13.62.023.6
[2, 3]8.962.614.4
[3, 4]14.45.18.7
[4, 5]21.08.09.1
[5, 6]13.713.49.5
[6, 7]6.19.14.6
[7, 8]6.710.71.7
[8, 9]7.712.51.2
[9, 10]5.817.60.14
[10, 11]1.417.20.01
[11, 12]0.031.60.03

References

  1. IPCC. Climate Change 2014: Synthesis Report. Contribution of Working Groups I, II and III to the Fifth Assessment Report of the Intergovernmental Panel on Climate Change; Pachauri, R.K., Meyer, L.A., Eds.; IPCC: Geneva, Switzerland, 2014; p. 151. [Google Scholar]
  2. Seinfeld, J.H.; Bretherton, C.; Carslaw, K.S.; Coe, H.; DeMott, P.J.; Dunlea, E.J.; Feingold, G.; Ghan, S.; Guenther, A.B.; Kahn, R.; et al. Improving our fundamental understanding of the role of aerosol-cloud interactions in the climate system. Proc. Natl. Acad. Sci. USA 2016, 113, 5781–5790. [Google Scholar] [CrossRef] [Green Version]
  3. Komurcu, M.; Storelvmo, T.; Tan, I.; Lohmann, U.; Yun, Y.; Penner, J.E.; Wang, Y.; Liu, X.; Takemura, T. Intercomparison of the cloud water phase among global climate models. J. Geophys. Res. Atmos. 2014, 119, 3372–3400. [Google Scholar] [CrossRef] [Green Version]
  4. Cesana, G.; Waliser, D.E.; Jiang, X.; Li, J.L.F. Multimodel evaluation of cloud phase transition using satellite and reanalysis data. J. Geophys. Res. Atmos. 2015, 120, 7871–7892. [Google Scholar] [CrossRef]
  5. McIlhattan, E.A.; L’Ecuyer, T.S.; Miller, N.B. Observational Evidence Linking Arctic Supercooled Liquid Cloud Biases in CESM to Snowfall Processes. J. Clim. 2017, 30, 4477–4495. [Google Scholar] [CrossRef]
  6. Korolev, A.; McFarquhar, G.; Field, P.R.; Franklin, C.; Lawson, P.; Wang, Z.; Williams, E.; Abel, S.J.; Axisa, D.; Borrmann, S.; et al. Mixed-Phase Clouds: Progress and Challenges. Meteor. Mon. 2017, 58, 5.1–5.50. [Google Scholar] [CrossRef]
  7. Forbes, R.M.; Ahlgrimm, M. On the Representation of High-Latitude Boundary Layer Mixed-Phase Cloud in the ECMWF Global Model. Mon. Weather. Rev. 2014, 142, 3425–3445. [Google Scholar] [CrossRef]
  8. Kay, J.; Bourdages, L.; Miller, N.B.; Morrison, A.; Yettella, V.; Chepfer, H.; Eaton, B. Evaluating and improving cloud phase in the Community Atmosphere Model version5 using spaceborne lidar observations. J. Geophys. Res. Atmos. 2016, 121, 4162–4176. [Google Scholar] [CrossRef] [Green Version]
  9. Tan, I.; Storelvmo, T.; Zelinka, M.D. Observational constraints on mixed-phase clouds imply higher climate sensitivity. Science 2016, 352, 224–227. [Google Scholar] [CrossRef] [PubMed] [Green Version]
  10. Lohmann, U.; Feichter, J. Global indirect aerosol effects: A review. Atmos. Chem. Phys. 2005, 5, 715–737. [Google Scholar] [CrossRef] [Green Version]
  11. DeMott, P.J.; Prenni, A.J.; Liu, X.; Kreidenweis, S.M.; Petters, M.D.; Twohy, C.H.; Richardson, M.S.; Eidhammer, T.; Rogers, D.C. Predicting global atmospheric ice nuclei distributions and their impacts on climate. Proc. Natl. Acad. Sci. USA 2010, 107, 11217–11222. [Google Scholar] [CrossRef] [PubMed] [Green Version]
  12. Tao, W.-K.; Chen, J.-P.; Li, Z.; Wang, C.; Zhang, C. Impact of aerosols on convective clouds and precipitation. Rev. Geophys. 2012, 50, 2001. [Google Scholar] [CrossRef] [Green Version]
  13. Altaratz, O.; Koren, I.; Remer, L.A.; Hirsch, E. Review: Cloud invigoration by aerosols—Coupling between microphysics and dynamics. Atmos. Res. 2014, 140–141, 38–60. [Google Scholar] [CrossRef]
  14. Rosenfeld, D.; Andreae, M.O.; Asmi, A.; Chin, M.; de Leeuw, G.; Donovan, D.P.; Kahn, R.; Kinne, S.; Kivekäs, N.; Kulmala, M.; et al. Global observations of aerosol-cloud-precipitation-climate interactions. Rev. Geophys. 2014, 52, 750–808. [Google Scholar] [CrossRef] [Green Version]
  15. Köhler, H. The nucleus in and the growth of hygroscopic droplets. Trans. Faraday Soc. 1936, 32, 1152–1161. [Google Scholar] [CrossRef]
  16. Barahona, D.; Nenes, A. Parameterizing the competition between homogeneous and heterogeneous freezing in ice cloud formation—Polydisperse ice nuclei. Atmos. Chem. Phys. 2009, 9, 5933–5948. [Google Scholar] [CrossRef] [Green Version]
  17. Sullivan, S.; Hoose, C.; Nenes, A. Investigating the contribution of secondary ice production to in-cloud ice crystal numbers. J. Geophys. Res. Atmos. Atmos. 2017, 122, 9391–9412. [Google Scholar] [CrossRef]
  18. Jacobeit, J. Variations of trough positions and precipitation patterns in the mediterranean area. J. Climatol. 1987, 7, 453–476. [Google Scholar] [CrossRef]
  19. Lionello, P.; Galati, M.B. Links of the significant wave height distribution in the Mediterranean sea with the Northern Hemisphere teleconnection patterns. Adv. Geosci. 2008, 17, 13–18. [Google Scholar] [CrossRef] [Green Version]
  20. Miglietta, M.M.; Moscatello, A.; Conte, D.; Mannarini, G.; Lacorata, G.; Rotunno, R. Numerical analysis of a Mediterranean ‘hurricane’ over south-eastern Italy: Sensitivity experiments to sea surface temperature. Atmos. Res. 2011, 101, 412–426. [Google Scholar] [CrossRef]
  21. Hoerling, M.; Eischeid, J.; Perlwitz, J.; Quan, X.; Zhang, T.; Pegion, P. On the increased frequency of Mediterranean drought. J. Clim. 2012, 25, 2146–2161. [Google Scholar] [CrossRef] [Green Version]
  22. Barros, V.; Field, C.; Dokken, D.; Mastrandrea, M.; Mach, K.; Bilir, T.; Chatterjee, M.; Ebi, K.; Estrada, Y.; Genova, R.; et al. Part B: Regional Aspects. Contribution of Working Group II to the Fifth Assessment Report of the Intergovernmental Panel on Climate Change. In IPCC, 2014: Impacts, Adaptation, and Vulnerability; Cambridge University Press: Cambridge, UK, 2004. [Google Scholar]
  23. Solomos, S.; Ansmann, A.; Mamouri, R.-E.; Binietoglou, I.; Patlakas, P.; Marinou, E.; Amiridis, V. Remote sensing and modelling analysis of the extreme dust storm hitting the Middle East and eastern Mediterranean in September 2015. Atmos. Chem. Phys. 2017, 17, 4063–4079. [Google Scholar] [CrossRef] [Green Version]
  24. Lionello, P.; Scarascia, L. The relation between climate change in the Mediterranean region and global warming. Reg. Environ. Chang. 2018, 18, 1481–1493. [Google Scholar] [CrossRef]
  25. Zittis, G.; Hadjinicolaou, P.; Klangidou, M.; Proestos, Y.; Lelieveld, J. A multi-model, multi-scenario, and multi-domain analysis of regional climate projections for the Mediterranean. Reg. Environ. Chang. 2019, 19, 2621–2635. [Google Scholar] [CrossRef] [Green Version]
  26. Bougiatioti, A.; Fountoukis, C.; Kalivitis, N.; Pandis, S.N.; Nenes, A.; Mihalopoulos, N. Cloud condensation nuclei measurements in the marine boundary layer of the Eastern Mediterranean: CCN closure and droplet growth kinetics. Atmos. Chem. Phys. 2009, 9, 7053–7066. [Google Scholar] [CrossRef] [Green Version]
  27. Bougiatioti, A.; Nenes, A.; Fountoukis, C.; Kalivitis, N.; Pandis, S.N.; Mihalopoulos, N. Size-resolved CCN distributions and activation kinetics of aged continental and marine aerosol. Atmos. Chem. Phys. 2011, 11, 8791–8808. [Google Scholar] [CrossRef] [Green Version]
  28. Bougiatioti, A.; Bezantakos, S.; Stavroulas, I.; Kalivitis, N.; Kokkalis, P.; Biskos, G.; Mihalopoulos, N.; Papayannis, A.; Nenes, A. Biomass-burning impact on CCN number, hygroscopicity and cloud formation during summertime in the eastern Mediterranean. Atmos. Chem. Phys. 2016, 16, 7389–7409. [Google Scholar] [CrossRef] [Green Version]
  29. Kalivitis, N.; Kerminen, V.-M.; Kouvarakis, G.; Stavroulas, I.; Bougiatioti, A.; Nenes, A.; Manninen, H.E.; Petäjä, T.; Kulmala, M.; Mihalopoulos, N. Atmospheric new particle formation as a source of CCN in the eastern Mediterranean marine boundary layer. Atmos. Chem. Phys. 2015, 15, 9203–9215. [Google Scholar] [CrossRef] [Green Version]
  30. Kalkavouras, P.; Bossioli, E.; Bezantakos, S.; Bougiatioti, A.; Kalivitis, N.; Stavroulas, I.; Kouvarakis, G.; Protonotariou, A.P.; Dandou, A.; Biskos, G.; et al. New particle formation in the southern Aegean Sea during the Etesians: Importance for CCN production and cloud droplet number. Atmos. Chem. Phys. 2017, 17, 175–192. [Google Scholar] [CrossRef] [Green Version]
  31. Schrod, J.; Weber, D.; Drücke, J.; Keleshis, C.; Pikridas, M.; Ebert, M.; Cvetković, B.; Nickovic, S.; Marinou, E.; Baars, H.; et al. Ice nucleating particles over the Eastern Mediterranean measured by unmanned aircraft systems. Atmos. Chem. Phys. 2017, 17, 4817–4835. [Google Scholar] [CrossRef] [Green Version]
  32. Marinou, E.; Tesche, M.; Nenes, A.; Ansmann, A.; Schrod, J.; Mamali, D.; Tsekeri, A.; Pikridas, M.; Baars, H.; Engelmann, R.; et al. Retrieval of ice-nucleating particle concentrations from lidar observations and comparison with UAV in situ measurements. Atmos. Chem. Phys. 2019, 19, 11315–11342. [Google Scholar] [CrossRef] [Green Version]
  33. Matus, A.V.; L’Ecuyer, T.S. The role of cloud phase in Earth’s radiation budget. J. Geophys. Res. Atmos. 2017, 122, 2559–2578. [Google Scholar] [CrossRef]
  34. The PRE-TECT Experimental Campaign. Available online: http://PRE-TECT.space.noa.gr/ (accessed on 6 December 2021).
  35. Engelmann, R.; Kanitz, T.; Baars, H.; Heese, B.; Althausen, D.; Skupin, A.; Wandinger, U.; Komppula, M.; Stachlewska, I.S.; Amiridis, V.; et al. The automated multiwavelength Raman polarization and water-vapor lidar PollyXT: The neXT generation. Atmos. Meas. Tech. 2016, 9, 1767–1784. [Google Scholar] [CrossRef] [Green Version]
  36. Madonna, F.; Amodeo, A.; Boselli, A.; Cornacchia, C.; Cuomo, V.; D’Amico, G.; Giunta, A.; Mona, L.; Pappalardo, G. CIAO: The CNR-IMAA advanced observatory for atmospheric research. Atmos. Meas. Tech. 2011, 4, 1191–1208. [Google Scholar] [CrossRef] [Green Version]
  37. Manninen, A.J.; O’Connor, E.J.; Vakkari, V.; Petäjä, T. A generalised background correction algorithm for a Halo Doppler lidar and its application to data from Finland. Atmos. Meas. Tech. 2016, 9, 817–827. [Google Scholar] [CrossRef] [Green Version]
  38. Illingworth, A.J.; Hogan, R.J.; O’Connor, E.J.; Bouniol, D.; Brooks, M.E.; Delanoé, J.; Donovan, D.P.; Eastment, J.D.; Gaussiat, N.; Goddard, J.W.F.; et al. Cloudnet: Continuous evaluation of cloud profiles in seven operational models using ground-based observations. Bull. Am. Meteorol. Soc. 2007, 88, 883–898. [Google Scholar] [CrossRef] [Green Version]
  39. Cloudnet Data Center. Available online: https://cloudnet.fmi.fi/ (accessed on 6 December 2021).
  40. Groß, S.; Esselborn, M.; Weinzierl, B.; Wirth, M.; Fix, A.; Petzold, A. Aerosol classification by airborne high spectral resolution lidar observations. Atmos. Chem. Phys. 2013, 13, 2487–2505. [Google Scholar] [CrossRef] [Green Version]
  41. Wandinger, U.; Baars, H.; Engelmann, R.; Hünerbein, A.; Horn, S.; Kanitz, T.; Donovan, D.; van Zadelhoff, G.; Daou, D.; Fischer, J.; et al. HETEAC: The Aerosol Classification Model for EarthCARE. EPJ Web Conf. 2016, 119, 01004. [Google Scholar] [CrossRef] [Green Version]
  42. Nicolae, D.; Vasilescu, J.; Talianu, C.; Binietoglou, I.; Nicolae, V.; Andrei, S.; Antonescu, B. A neural network aerosol-typing algorithm based on lidar data. Atmos. Chem. Phys. 2018, 18, 14511–14537. [Google Scholar] [CrossRef] [Green Version]
  43. Papagiannopoulos, N.; Mona, L.; Amodeo, A.; D’Amico, G.; Gumà Claramunt, P.; Pappalardo, G.; Alados-Arboledas, L.; Guerrero-Rascado, J.L.; Amiridis, V.; Kokkalis, P.; et al. An automatic observation-based aerosol typing method for EARLINET. Atmos. Chem. Phys. 2018, 18, 15879–15901. [Google Scholar] [CrossRef] [Green Version]
  44. Klett, J.D. Stable analytical inversion solution for processing lidar returns. Appl. Opt. 1981, 20, 211–220. [Google Scholar] [CrossRef] [PubMed] [Green Version]
  45. Ansmann, A.; Wandinger, U.; Riebesell, M.; Weitkamp, C.; Michaelis, W. Independent measurement of extinction and backscatter profiles in cirrus clouds by using a combined Raman elastic-backscatter lidar. Appl. Opt. 1992, 31, 7113–7131. [Google Scholar] [CrossRef]
  46. Baars, H.; Seifert, P.; Engelmann, R.; Wandinger, U. Target categorization of aerosol and clouds by continuous multiwavelength-polarization lidar measurements. Atmos. Meas. Tech. 2017, 10, 3175–3201. [Google Scholar] [CrossRef] [Green Version]
  47. LeGrand, S.L.; Polashenski, C.; Letcher, T.W.; Creighton, G.A.; Peckham, S.E.; Cetola, J.D. The AFWA dust emission scheme for the GOCART aerosol model in WRF-Chem v3.8.1. Geosci. Model Dev. 2019, 12, 131–166. [Google Scholar] [CrossRef] [Green Version]
  48. PollyNET Products above Finokalia on 2017-04-09. Available online: https://polly.tropos.de/datavis/location/13/21/?dates=[2017-04-09T00:00:00,2017-04-10T00:00:00] (accessed on 6 December 2021).
  49. Kouvarakis, G.; Doukelis, Y.; Mihalopoulos, N.; Rapsomanikis, S.; Sciare, J.; Blumthaler, M. Chemical, physical, and optical characterization of aerosols during PAUR II experiment. J. Geophys. Res. 2002, 107, 8141. [Google Scholar] [CrossRef]
  50. Pikridas, M.; Bougiatioti, A.; Hildebrandt, L.; Engelhart, G.J.; Kostenidou, E.; Mohr, C.; Prévôt, A.S.H.; Kouvarakis, G.; Zarmpas, P.; Burkhart, J.F.; et al. The Finokalia Aerosol Measurement Experiment—2008 (FAME-08): An overview. Atmos. Chem. Phys. 2010, 10, 6793–6806. [Google Scholar] [CrossRef] [Green Version]
  51. Schoenenberger, F.; Henne, S.; Hill, M.; Vollmer, M.K.; Kouvarakis, G.; Mihalopoulos, N.; O’Doherty, S.; Maione, M.; Emmenegger, L.; Peter, T.; et al. Abundance and sources of atmospheric halocarbons in the Eastern Mediterranean. Atmos. Chem. Phys. 2018, 18, 4069–4092. [Google Scholar] [CrossRef] [Green Version]
  52. Voudouri, K.A.; Marinou, E.; Gialitaki, A.; Tsichla, M.; Kampouri, A.; Amiridis, V.; Baars, H.; Yin, Z.; Meleti, C. Aerosol Typing and Characterization during Pre-TECT Campaign over Finokalia, Crete. In Proceedings of the 15th International Conference on Meteorology, Climatology and Atmospheric Physics (COMECAP), Ioannina, Greece, 26–29 September 2021. [Google Scholar]
  53. Radenz, M.; Bühl, J.; Seifert, P.; Baars, H.; Engelmann, R.; Barja González, B.; Mamouri, R.-E.; Zamorano, F.; Ansmann, A. Hemispheric contrasts in ice formation in stratiform mixed-phase clouds: Disentangling the role of aerosol and dynamics with ground-based remote sensing. Atmos. Chem. Phys. 2021, 21, 17969–17994. [Google Scholar] [CrossRef]
  54. Zhang, D.; Wang, Z.; Kollias, P.; Vogelmann, A.M.; Yang, K.; Luo, T. Ice particle production in mid-level stratiform mixed-phase clouds observed with collocated A-Train measurements. Atmos. Chem. Phys. 2018, 18, 4317–4327. [Google Scholar] [CrossRef] [Green Version]
  55. Villanueva, D.; Heinold, B.; Seifert, P.; Deneke, H.; Radenz, M.; Tegen, I. The day-to-day co-variability between mineral dust and cloud glaciation: A proxy for heterogeneous freezing. Atmos. Chem. Phys. 2020, 20, 2177–2199. [Google Scholar] [CrossRef] [Green Version]
  56. Listowski, C.; Delanoë, J.; Kirchgaessner, A.; Lachlan-Cope, T.; King, J. Antarctic clouds, supercooled liquid water and mixed phase, investigated with DARDAR: Geographical and seasonal variations. Atmos. Chem. Phys. 2019, 19, 6771–6808. [Google Scholar] [CrossRef] [Green Version]
  57. Huang, Y.; Siems, S.T.; Manton, M.J.; Protat, A.; Delanoë, J. A study on the low-altitude clouds over the Southern Ocean using the DARDAR-MASK. J. Geophys. Res. 2012, 117, D18204. [Google Scholar] [CrossRef]
  58. Ikuta, Y.; Satoh, M.; Sawada, M.; Kusabiraki, H.; Kubota, T. Improvement of the Cloud Microphysics Scheme of the Mesoscale Model at the Japan Meteorological Agency using Space-borne Radar and Microwave Imager of the Global Precipitation Measurement as Reference. Mon. Weather. Rev. 2021, 149, 3803–3819. [Google Scholar] [CrossRef]
  59. Kampouri, A.; Amiridis, V.; Solomos, S.; Gialitaki, A.; Marinou, E.; Spyrou, C.; Georgoulias, A.K.; Akritidis, D.; Papagiannopoulos, N.; Mona, L.; et al. Investigation of Volcanic Emissions in the Mediterranean: “The Etna–Antikythera Connection”. Atmosphere 2021, 12, 40. [Google Scholar] [CrossRef]
  60. Finkensieper, S.; Meirink, J.F.; van Zadelhoff, G.J.; Hanschmann, T.; Benas, N.; Stengel, M.; Fuchs, P.; Hollmann, R.; Kaiser, J.; Werscheck, M. CLAAS-2.1: CM SAF CLoud property dAtAset using SEVIRI—Edition 2.1, Satellite Application Facility on Climate Monitoring. Satellite Appl. Facil. Clim. Monit. 2016. [Google Scholar] [CrossRef]
  61. A European Aerosol Research Lidar Network to Establish an Aerosol Climatology: EARLINET. Available online: www.earlinet.org (accessed on 6 December 2021).
  62. The Aerosol, Clouds and Trace Gases Research Infrastructure. Available online: https://www.actris.eu (accessed on 6 December 2021).
Figure 1. Location of Finokalia background station (35.338°N, 25.670°E) in Greece (a), and PRE-TECT campaign Cloudnet station (b).
Remotesensing 13 05001 g001
Figure 2. Observations of radar reflectivity (a), radar Doppler velocity (b), and lidar attenuated backscatter coefficient (c) measured on 4 April 2017 above Finokalia, Crete. Cloudnet target classification (d), radar/lidar detection status (e), and lidar volume depolarization ratio (f) for the same day. The dotted lines in the Cloudnet target classification plot are the modelled temperature levels of 0, −10, −20, −30, −40, and −50 °C.
Remotesensing 13 05001 g002
Figure 3. (a) Cloudnet target classification statistics ( N target ) and (b) percentage statistics of the cloud phase ( F target ), per 1 °C bin as observed above Finokalia on 4 April 2017.
Remotesensing 13 05001 g003
Figure 4. (a) WRF 1000–500 hPa thickness along with geopotential height at 500 hPa (black lines) and sea level pressure (white lines) at 06 UTC on 4 April 2017, (b) MSG-Seviri cloud top temperature at 15 UTC on 4 April 2017, and (c) Cloudnet target classification on 3 and 4 April 2017. The dotted lines in the Cloudnet target classification plot are the temperature levels of 0, −10, −20, −30, −40, and −50 °C.
Remotesensing 13 05001 g004
Figure 5. (a) WRF 1000–500 hPa Thickness and Geopotential Height at 500 hPa (black lines) and Sea Level Pressure (white lines) on 10 April 2017 12:00 UTC, and (b) MSG-Seviri cloud top temperature on 9 April 2017 19:00 UTC. The blue arrow band indicates the position of the cold front.
Remotesensing 13 05001 g005
Figure 6. (a,c) lidar attenuated backscatter coefficient and volume depolarization ratio, on 9 to 10 April 2017, (b,d) radar reflectivity and Doppler velocity on 13 April 2017, (e) Cloudnet target classification on 9 to 13 April 2017. The dotted lines in the Cloudnet target classification plot are the temperature levels of 0, −10, −20, −30, −40, and −50 °C.
Remotesensing 13 05001 g006
Figure 7. Cloud phase fraction statistics during (a) 9 to 13 April, (b) 9 April, (c) 10 April, and (d) 13 April 2017.
Remotesensing 13 05001 g007
Figure 8. (a) WRF 1000–500 hPa Thickness and Geopotential Height at 500 hPa (black lines) and Sea Level Pressure (white lines) on 19 April 2017, at 06:00 UTC, (b) MSG-Seviri cloud top temperature on 19 April 2017, at 14:30 UTC, (c) Cloudnet target classification, and (d) lidar volume depolarization ratio, at Finakalia station on 19 to 20 April 2017. The dotted lines in the Cloudnet target classification plot are the modelled temperature levels of 0, −10, −20, −30, −40, and −50 °C.
Remotesensing 13 05001 g008
Figure 9. (a) Cloudnet target classification statistics and (b) statistics of the hydrometeor phase per 1 °C, as observed during 19 and 20 April 2017.
Remotesensing 13 05001 g009
Figure 10. (a,d) Cloudnet target classification, (b,e) lidar volume depolarization ratio, and (c,f) pie chart of the Cloudnet target classification statistics on 18 and 23 April 2017 over Finokalia.
Remotesensing 13 05001 g010
Figure 11. (a) Lidar attenuated backscatter coefficient at 1064 nm, (b) volume depolarization ratio at 532 nm, (c) Cloudnet target classification, (d) modelled WRF-Chem dust concentrations, and (e) WRF-Chem sea salt concentrations over Finokalia during the PRE-TECT campaign.
Remotesensing 13 05001 g011
Figure 12. Cloud bottom (a), top (b) and depth (c) occurrence statistics.
Remotesensing 13 05001 g012
Figure 13. Cloudnet classification statistics (a) per profile, (b) per cloudy profile, (c) per hydrometeor target during the PRE-ECT campaign above Finokalia.
Remotesensing 13 05001 g013
Figure 14. (a) Cloudnet target classification statistics and (b) statistics on the hydrometeor phase, per 1 °C, as observed during the PRE-TECT campaign above Finokalia.
Remotesensing 13 05001 g014
Table 1. Acronyms used in the text to designate the various cloud types.
CDCloud Droplets Only
DoRDrizzle or Rain
DR + CDrizzle and Cloud droplets
ICEIce
I + SCIce + Supercooled droplets
mImelting Ice
mI + CDmelting Ice + Cloud Droplets
AerAerosol
InsInsects
Aer + InsAerosol and Insects
SCWSupercooled water
LCLiquid Cloud
CLDCloud
Publisher’s Note: MDPI stays neutral with regard to jurisdictional claims in published maps and institutional affiliations.

