
Evaluation of Seven Near-Real-Time Satellite-Based Precipitation Products for Wet Seasons in the Nierji Basin, China

School of Hydraulic Engineering, Dalian University of Technology, Dalian 116024, China
*
Author to whom correspondence should be addressed.
Remote Sens. 2021, 13(22), 4552; https://doi.org/10.3390/rs13224552
Submission received: 25 August 2021
/
Revised: 9 November 2021
/
Accepted: 10 November 2021
/
Published: 12 November 2021
Abstract
:This study evaluated and intercompared seven near-real-time (NRT) versions of satellite-based precipitation products (SPPs) with latencies of less than one day, including GSMaP-NRT, GSMaP-Gauge-NRT, GSMaP-NOW, IMERG-Early, IMERG-Late, TMPA 3B42RT, and PERSIANN-CCS for wet seasons from 2008 to 2019 in a typical middle–high latitude temperate monsoon climate basin, namely, the Nierji Basin in China, in four aspects: flood sub-seasons, rainfall intensities, precipitation events, and hydrological utility. Our evaluation shows that the cell-scale and area-scale intercomparison ranks of NRT SPPs are similar in these four aspects. The performances of SPPs at the areal scale, at the event scale, and with light magnitude are better than those at the cell scale, at the daily scale, and with heavy magnitude, respectively. Most SPPs are similar in terms of their Pearson Correlation Coefficient (CC). The main difference between SPPs is in terms of their root-mean-square error (RMSE). The worse performances of TMPA 3B42RT are mainly caused by the poor performances during main flood seasons. The worst performances of PERSIANN-CCS are primarily reflected by the lowest CC and the underestimation of precipitation. Though GSMaP-NOW has the highest RMSE and overestimates precipitation, it can reflect the precipitation variation, as indicated by the relatively high CC. The differences among SPPs are more significant in pre-flood seasons and less significant in post-flood seasons. These results can provide valuable guidelines for the selection, correction, and application of NRT SPPs and contribute to improved insight into NRT-SPP retrieval algorithms.

1. Introduction
Precipitation is an essential component of the hydrological circle [1,2]. The hydrological forecasting driven by precipitation plays a crucial role in water resources management [3] and flood warning and precautions [4], particularly in wet seasons when precipitation occurs frequently. Traditionally, ground-based rainfall observations, such as gauges [5,6] and radars [7,8], have been widely used in hydrological forecasting due to their fine temporal resolution and accurate estimates at regional scales. However, practical limitations arise from the inadequate spatial coverage and resolution, especially in remote regions, such as mountains and forests, which increase the challenges associated with installing and maintaining in situ measurement networks. In the current rapid proliferation of meteorologic and hydrologic measuring techniques [9], indirect satellite-based precipitation products (SPPs) have made it possible to obtain global maps of precipitation at satisfactory spatial (finer than 0.25°) and temporal (shorter than daily) scales. SPPs at a global scale are important not only because they are the supplements of ground-based rainfall observations, but also because they can be used to improve the numerical weather prediction model’s initial conditions to accurately predict severe weather events such as tropical cyclones and hurricanes [10]. Examples of SPPs include the Precipitation Estimation from Remotely Sensed Information Using Artificial Neural Networks (PERSIANN) [11], the Climate Prediction Center MORPHing technique (CMORPH) [12], the Tropical Rainfall Measuring Mission (TRMM) Multi-satellite Precipitation Analysis (TMPA) [13], the Integrated Multi-satellite Retrievals for the Global Precipitation Measurement (IMERG) [14], and the Global Satellite Mapping of Precipitation (GSMaP) [15].
SPPs are derived from spaceborne sensors, which are mainly divided into microwave (MW) and infrared (IR) sensors according to the principle and measurement technique [16]. For MW sensors on low Earth orbit satellites, the retrieval principle that precipitation is related to MW emission from raindrops at low-frequency channels and MW scattering from ice at high-frequency channels [17] is used. IR sensors on board geostationary satellite platforms use the relationship between the precipitation and cloud top brightness temperature observed from space to estimate precipitation [18]. As a result, MW sensors have a more direct physical principle but a longer repeat cycle, whereas IR sensors have the opposite effects. Therefore, to exploit their complementary advantages, sensors on multi-satellites are combined to derive SPPs using various algorithms. The mainstream satellites include TRMM [13] and its successor, namely, Global Precipitation Measurement (GPM) Core Observatory satellite launched on 28 February 2014 [19]. The core satellite of GPM carries a dual-frequency phased array precipitation radar and a conical-scanning multichannel MW imager [20,21], which are used to generate combined precipitation profiles and calibrate the retrievals from other satellite platforms.
SPPs are released in multiple versions, divided into near-real-time (satellite-only) and post-processing (gauge-corrected) versions. Although near-real-time (NRT) SPPs typically perform worse compared with post-processing SPPs [22], they have the advantage of having less latency, which is vital for hydrological forecasting. Some recent studies demonstrated NRT SPPs against gauge-based precipitation observations to reveal the error structure and error characteristics [23].
NRT SPPs are evaluated at various regions, such as China [24,25,26], Europe [27,28], South America [29], Pakistan [30], the United Arab Emirates [31], Peruvian Andes [32], and Peninsular Malaysia [33]; various basins, such as the Yellow River Source Basin in China [34], Kinu Basin in Japan [35], Lower Colorado River Basin in Texas [36], Ottawa Basin in Canada [37], and Chindwin Basin in Myanmar [38]; analyzed insight of NRT SPP performance at various aspects, such as climatology [39], seasons [40], extreme events [29,41], and utilization purposes (e.g., flood simulation [32,42], crop forecasting [43,44], drought monitoring [45], and landslides [46]).
It can be found from these studies that the performances of these NRT SPPs vary from region to region, and from aspect to aspect. However, NRT SPPs are only a part of the products in most evaluation studies; in other words, a handful of studies have focused on inter-comparison among NRT SPPs [26,32,41,47], and none of them for an extended evaluation period.
Nierji Basin is controlled by the Nierji Reservoir, which is responsible for the water resources management and flood control of northeast China’s industrial and agricultural base [48]. This necessitates a higher requirement for hydrological forecasting, and further, near-real-time precipitation observations. However, precipitation gauges are limited in this basin due to its undulating topography and lush forests, meaning that there is an urgent need for NRT SPPs with latencies of less than one day. Therefore, the performances of NRT SPPs in Nierji Basin need to be further evaluated, inter-compared, and analyzed. Since Nierji Basin is a typical, semi-humid basin in the middle–high latitude temperate monsoon climate region, precipitation is the primary source of water resources in the basin and mainly occurs in wet seasons. Furthermore, the wet season can be divided into three sub-seasons [49,50] according to the uneven temporal distribution of precipitation caused by annual movements of the edge of the Western Pacific Subtropical High (WPSH). Therefore, we focus on the performances of NRT SPPs in the Nierji Basin during wet (sub-)seasons in this study.
NRT SPPs, including GSMaP-NRT, GSMaP-Gauge-NRT, GSMaP-NOW, IMERG-Early, IMERG-Late, TMPA 3B42RT, and PERSIANN-CCS, were statistically evaluated and analyzed from 2008 to 2019 in four aspects in this study: flood sub-seasons, rainfall intensities, precipitation event total accumulation, and hydrological utility. We expect that the findings in this study could enhance the understanding of the performance of NRT SPPs, provide valuable guidelines for hydrological forecasting driven by NRT SPPs, and contribute to insights into NRT SPP improvement.
2. Materials and Methods
2.1. Study Area
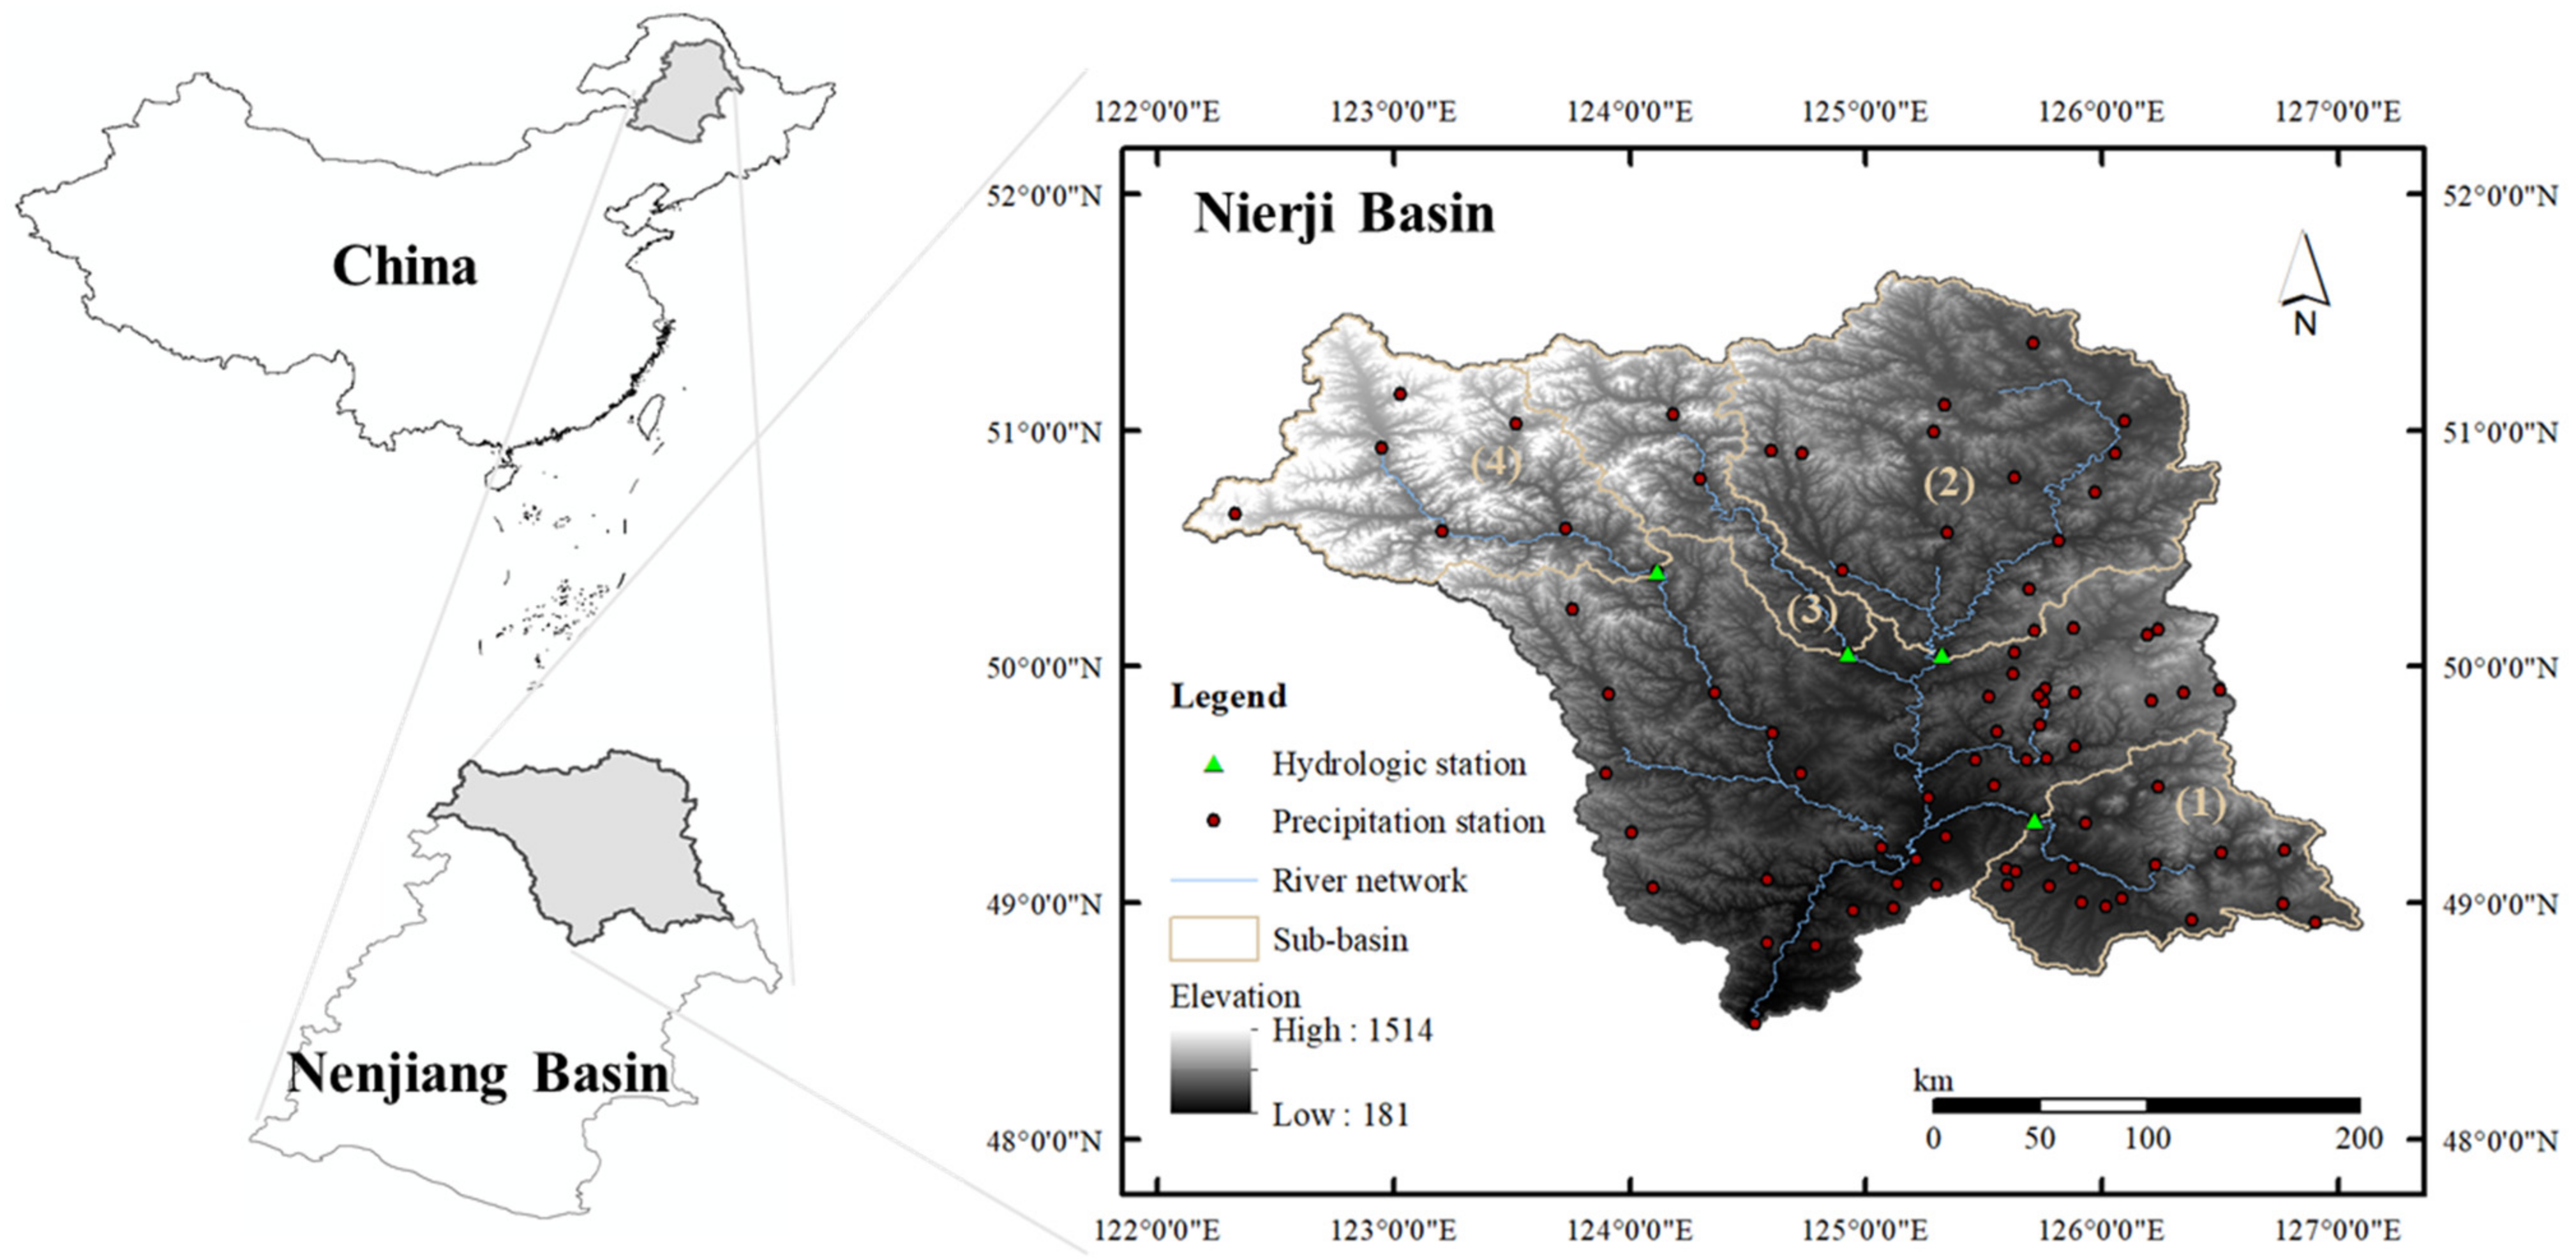
The Nierji Basin (Figure 1), located in northeast China, is defined as the area controlled by the Nierji Reservoir, located at the last gorge where the Nenjiang River enters the Songnen Plain from the mountain and hilly regions [51]. The Nierji Basin covers the source region of the Nenjiang River, where the precipitation is higher than its downstream. Therefore, the Nierji Reservoir is of great importance in flood control and water resources management, and hydrological forecasting is necessary. However, since the lush forest of the Greater Khingan Range is in the Nierji Basin, it is difficult to install and maintain precipitation stations. As a result, precipitation stations are sparse in most areas of the Nierji Basin and occasionally malfunction, so there is an urgent need for SPPs.
The Nierji Basin has a complex terrain, with elevations ranging from 181 to 1514 m. The longitude extends from 122.10°E to 127.33°E and the latitude from 48.42°N to 51.68°N, with a total drainage area of 66,382 km2 (22.35% of the Nenjiang Basin) and an average annual runoff of 104.7 × 10⁹ m3 (45.7% of the Nenjiang Basin). Benefiting from its location in the middle–high latitudes on the eastern coast of Eurasia, this area has a typical temperate monsoon climate with long cold winters, dry and windy springs, hot and rainy summers, and short autumns, with an annual average temperature of approximately −0.5 °C. The basin-averaged mean annual precipitation is approximately 475 mm and is seriously inhomogeneous in a year, where more than 90% of annual precipitation occurs from May to September, and less than 10% occurs from October to April. Therefore, the Nierji Basin has an apparent wet season, defined as from 1 May to 30 September.
In the Nierji Basin, precipitation is the primary source of water resources and is mainly formed by the vortex and cyclones. A precipitation event formed by a weather system can last for about three days. Continuous weather systems can form precipitation that lasts for dozens of days, causing floods that last more than a month. As the leading cause of precipitation, vortexes and cyclones frequently occur at the edge of WPSH, whose movements in the wet season are between 20°N and 35°N and are characterized by moving northward slowly and then southward quickly. As a result, during the wet season, the pre-flood season is from 1 May to 20 June, when precipitation is always partly areal extent and partly caused by the slow northward movement of the WPSH ridge; the main flood season from is 21 June to 5 September, when precipitation is always great areal extent and mainly caused by cyclones, since the ridge of WPSH is at its northernmost area; the post-flood season is from 6 to 30 September, when precipitation is also partly areal extent and mainly caused by cold front and cyclones formed by the quick southward movement of the WPSH ridge. The features of the Nierji Basin make it a distinct region to investigate the SPPs’ performance in the mid–high latitude temperate monsoon climate region for wet seasons.
2.2. Datasets
2.2.1. Satellite-Based Precipitation Products
Seven NRT SPPs were evaluated daily in this study, i.e., GSMaP-V6-NRT (GSMaP-N), GSMaP-V6-Gauge-NRT (GSMaP-GN), IMERG-V6-Early (IMERG-E), IMERG-V6-Late (IMERG-L), PERSIANN-CCS, GSMaP-NOW, and TMPA 3B42RT V7 (TMPA); see summary in Table 1. The exclusion of near-real-time versions of GSMaP-V7, namely, GSMaP-V7-NRT and GSMaP-V7-Gauge-NRT, is due to their having the same latencies and a similar performance to GSMaP-V6, and their start time (2017) being later than GSMaP-V6. The near-real-time version of CMORPH, namely, CMORPH-RAW, was excluded because only data after 2019 can be downloaded, so the sequence is too short to evaluate. The SPPs used in this study were downloaded at a daily scale, except for GSMaP-NOW. The daily precipitation estimates of GSMaP-NOW were obtained by accumulating the original hourly precipitation estimates.
SPPs were retrieved from microwave (MW) sensors and/or infrared (IR) sensors. MW sensors are more accurate but infrequent, providing accurate precipitation estimation with a low temporal and spatial resolution. In contrast, IR sensors are more frequent but indirect, providing the motions of weather systems, and precipitation estimates are derived by the motions. Among the seven NRT SPPs in Table 1, PERSIANN-CCS is the only pure IR-based product [52], while GSMaP-NOW is the only pure WM-based product [53]. The two products with the shortest latencies can be released within 1 h, primarily due to their relatively simple inputs and retrieve algorithms. With the increasing product latencies, both MW and IR sensors are used to retrieve SPPs, taking both accuracy and resolution into consideration, such as GSMaP, IMERG, and TMPA.
GSMaP-V6 and IMERG-V6 are generally referred to as new-generation products, namely, the products of the GPM era [54]. This is because GSMaP-V6 and IMERG-V6 are retrieved from the GPM mission that was officially launched by the National Aeronautics and Space Administration (NASA) and the Japan Aerospace Exploration Agency (JAXA) to ensure the continuity of the TRMM mission that was launched in 1997 [19]. TMPA is referred to as a TRMM-era product and was no longer released after 1 January 2020. IMERG and TMPA were compared in terms of their different temporal and regional aspects but never in terms of their sub-flood-season aspect.
GSMaP products, developed by JAXA, are produced in several steps. First, the instantaneous precipitation rate is retrieved based on the MW sensors from different satellite platforms [55]. Then, the gaps between MW-based estimates are propagated using the cloud motion vectors computed from geo-IR images [56]. To date, near-real-time versions, including GSMaP-N and GSMaP-GN, have been produced, where GSMaP-GN is calibrated using gauge-based data.
IMERG system is run several times by NASA, that is, “Early” (IMERG-E), “Late” (IMERG-L), and the “Final” (IMERG-F). IMERG-V6 algorithm utilizes total precipitable water vapor from reanalysis data to drive the Climate Prediction Center (CPC) MORPHing technique (CMORPH) scheme so that the preliminarily PWM-based precipitation estimation is extrapolated in time and space by interpolation. The IMERG-V6 algorithm provides IMERG-E, using only forward morphing with a 4 h latency, and IMERG-L, using both forward and backward morphing with a 12 h latency [14,57,58].
2.2.2. Gauge-Based Precipitation and Discharge
Four hydrologic stations and 83 precipitation stations were used in this study in the Nierji Basin. Gauge-based weather radars were excluded due to their limited coverage (there is only one radar in the basin). The hydrologic stations and precipitation stations were installed and maintained by the Ministry of Water Resources (MWR). The precipitation stations are tipping-bucket recorders with a minimum detectability of 0.1 mm; none of them are included in the Global Precipitation Climatology Centre (GPCC) and only one of them is included in the China Meteorological Administration (CMA). The spatial distribution of precipitation stations is uneven in the study area, where the stations in the north and east of the basin are sparser, as shown in Figure 1. The gauge-based precipitation and discharge data were collected daily from 2008 to 2019. Missing values and extreme values were excluded for quality control.
2.3. Methodology
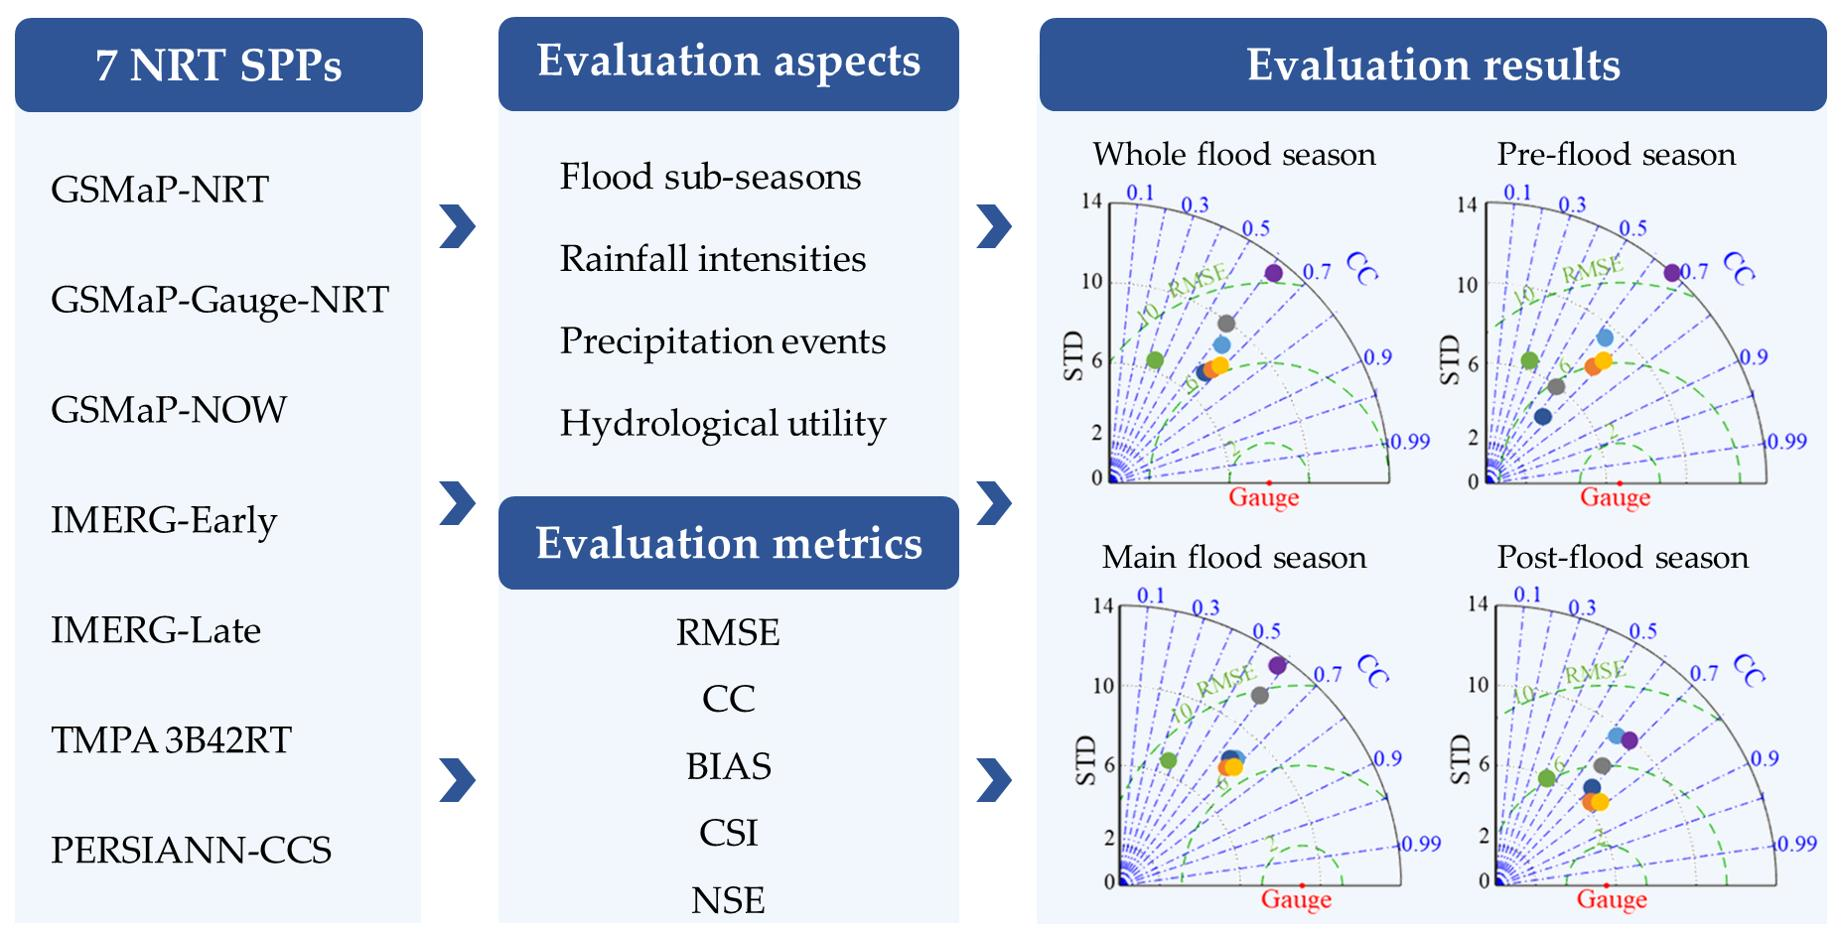
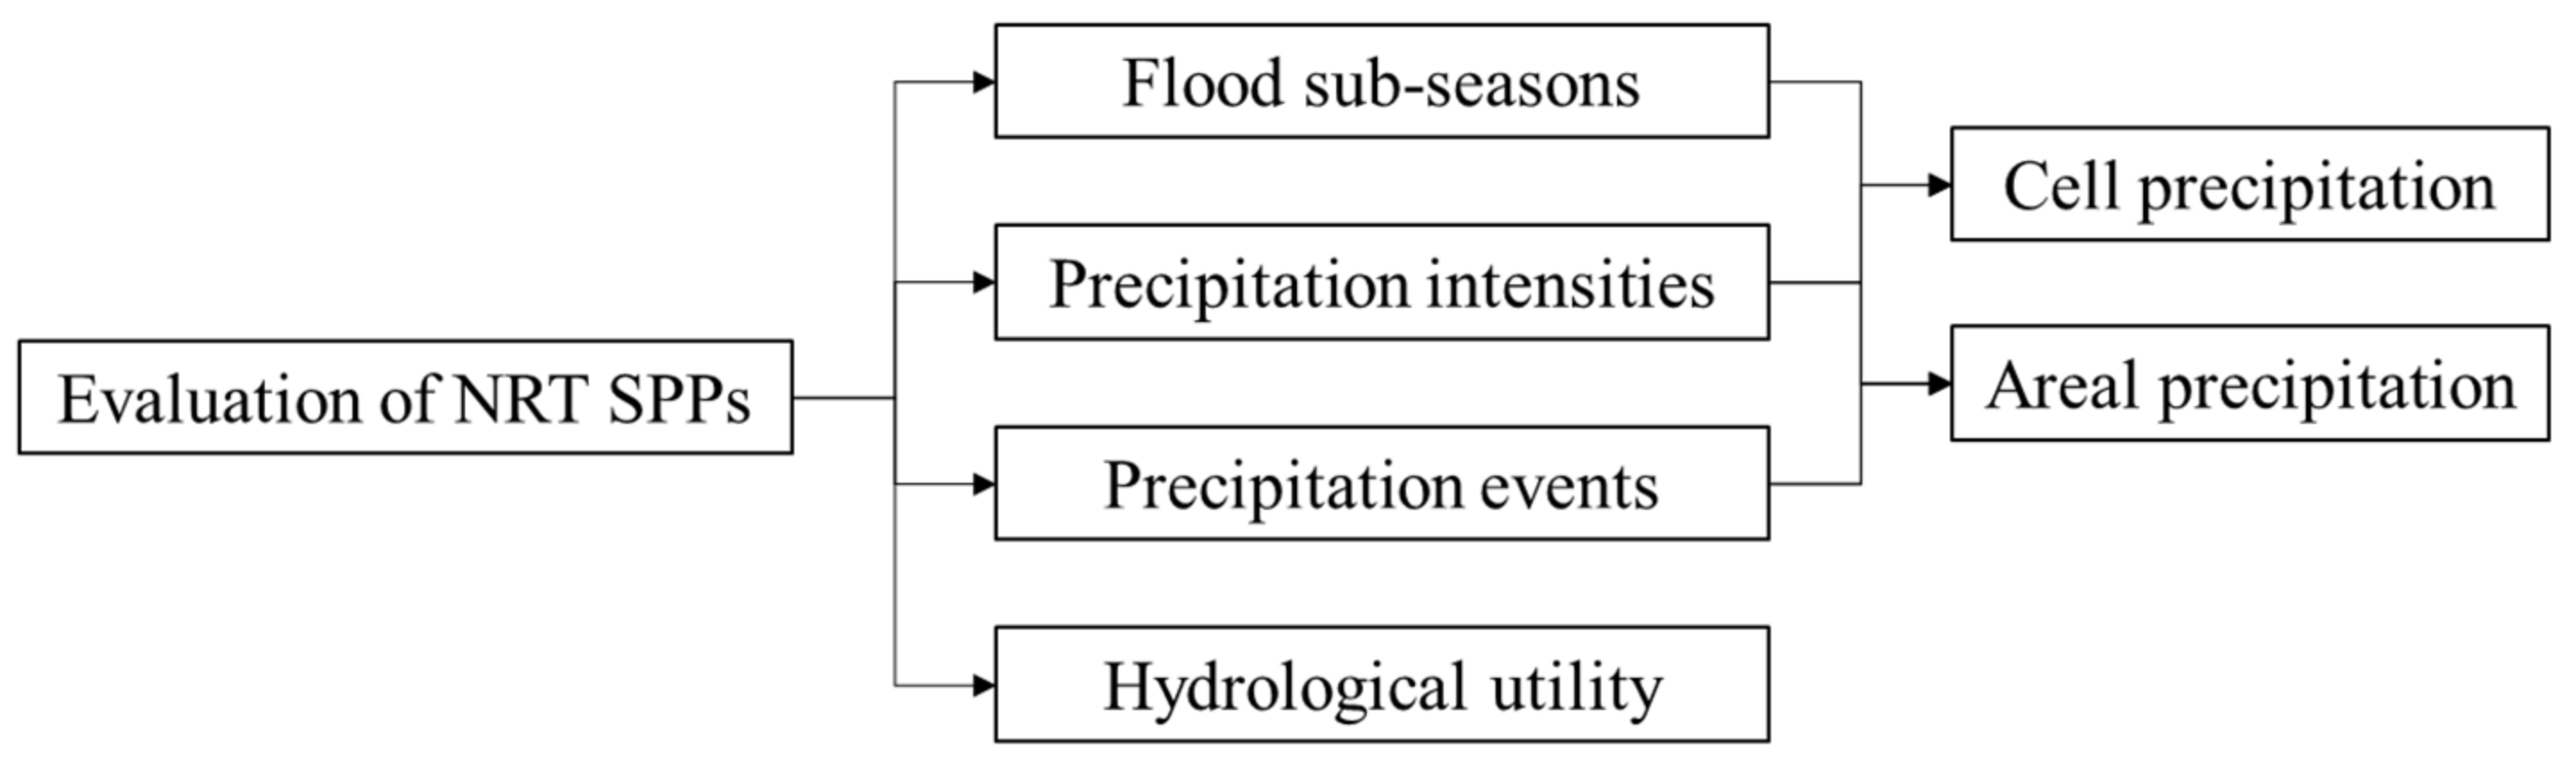
The NRT SPPs were evaluated and analyzed in four aspects in this study: different flood sub-seasons, precipitation intensities, precipitation event total accumulation, and hydrological utility, as shown in Figure 2.
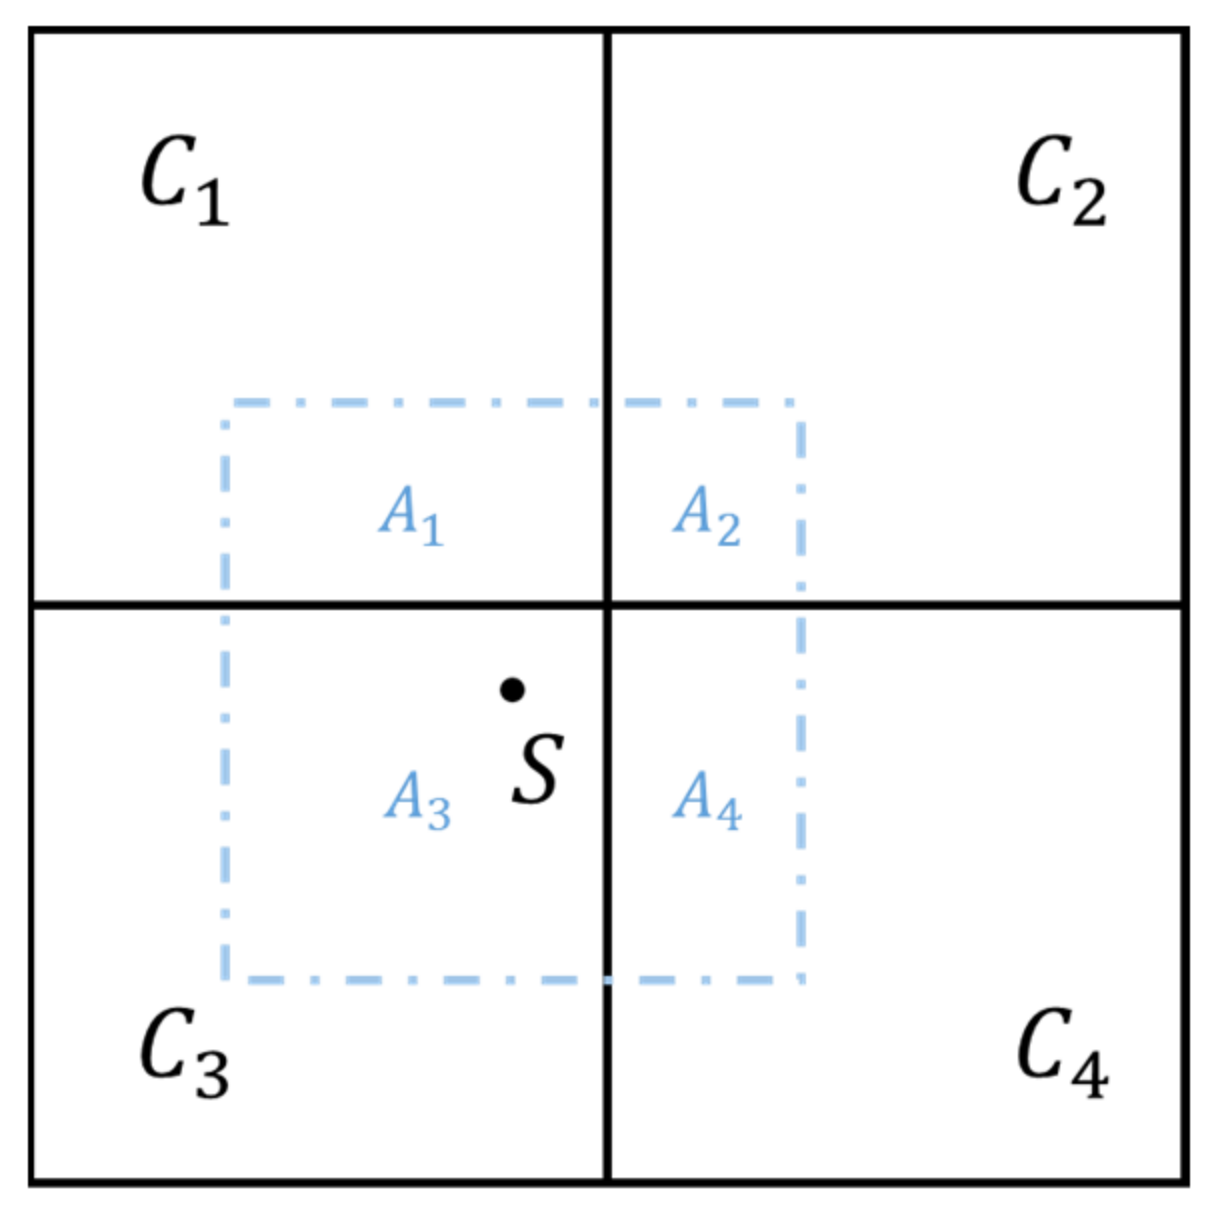
As shown in Figure 2, the first three aspects were evaluated and analyzed at the cell scale and areal scale. Cell evaluation means evaluating the precipitation in the grid cells at the station locations compared to the gauge-based precipitation observation of the corresponding stations. The reason for this is that rainfall measured by ground-based stations is representative of a certain spatial area, for example, 575 km2 for interior plains and 250 km2 for mountains, as recommended by World Meteorological Organization [59], and the cell area of the selected SPPs is about 16~625 km2. The precipitation in the grid cell at the station location was obtained by an areal weighting method [60]. As shown in Figure 3, a window cell was created, centered around the station (S), and the window size is defined as 0.1° × 0.1° when evaluating each SPP. are the four adjacent SPP cells to S, and are the areas of intersection between and the window cell. The weighting method based on adjacent areas was performed by weighted averaging the precipitation estimates of , where the weights are determined by the corresponding .
Areal evaluation means evaluating the areal mean precipitation of SPPs over a basin compared to the areal mean gauge-based precipitation over the corresponding basin. The target data, namely, the areal mean precipitation of SPPs over a basin, were obtained in two steps: (i) clip the SPP to match the basin shape; (ii) average the clipped SPP. The reference data, namely, areal mean gauge-based precipitation, were obtained in three steps: (i) spatially interpolate the gauge-based precipitation; (ii) clip the interpolated data to match the basin shape; (iii) average the clipped data. The sub-basin named Kehou was employed to evaluate areal precipitation due to the highest density of precipitation stations in the Nierji Basin, to minimize the uncertainty of the reference data.
Additionally, the precipitation (P) magnitude was classified into three levels, namely, light (0.1 mm/day ≤ P < 10 mm/day), moderate (10 mm/day ≤ P < 25 mm/day), and heavy (P ≥ 25 mm/day) precipitation, according to the national standard of China (GB/T 28592-2012) [61]. A single day or adjacent days, when precipitation exceeds 0.1 mm/day, were regarded as a precipitation event, and precipitation estimates of an event were obtained by accumulating total precipitation during the event. According to the statistics, precipitation-event durations were mostly from 1 to 3 days for a single station and 2 to 5 days for a basin. The hydrological utility evaluation of SPPs included two simulation schemes: the hydrological model driven by SPP uses the parameters that were calibrated by inputting (Ⅰ) the gauge-based precipitation; (Ⅱ) the corresponding SPP. The Xin’anjiang model [62], a lumped and conceptual model, was employed in this study due to its broad application in humid and semi-humid basins in China.
As shown in Table 2, the root-mean-square error (RMSE), Pearson Correlation Coefficient (CC), and relative bias (BIAS) were employed to describe error characteristics of SPPs. A critical success index (CSI) was employed to demonstrate the SPPs’ ability to detect the occurrence of precipitation with different thresholds, namely, 0.1, 10, and 25 mm/day. A Nash–Sutcliffe efficiency coefficient (NSE) was employed to evaluate the hydrologic utility of SPPs.
3. Results and Discussion
3.1. SPPs in Different Flood Sub-Seasons
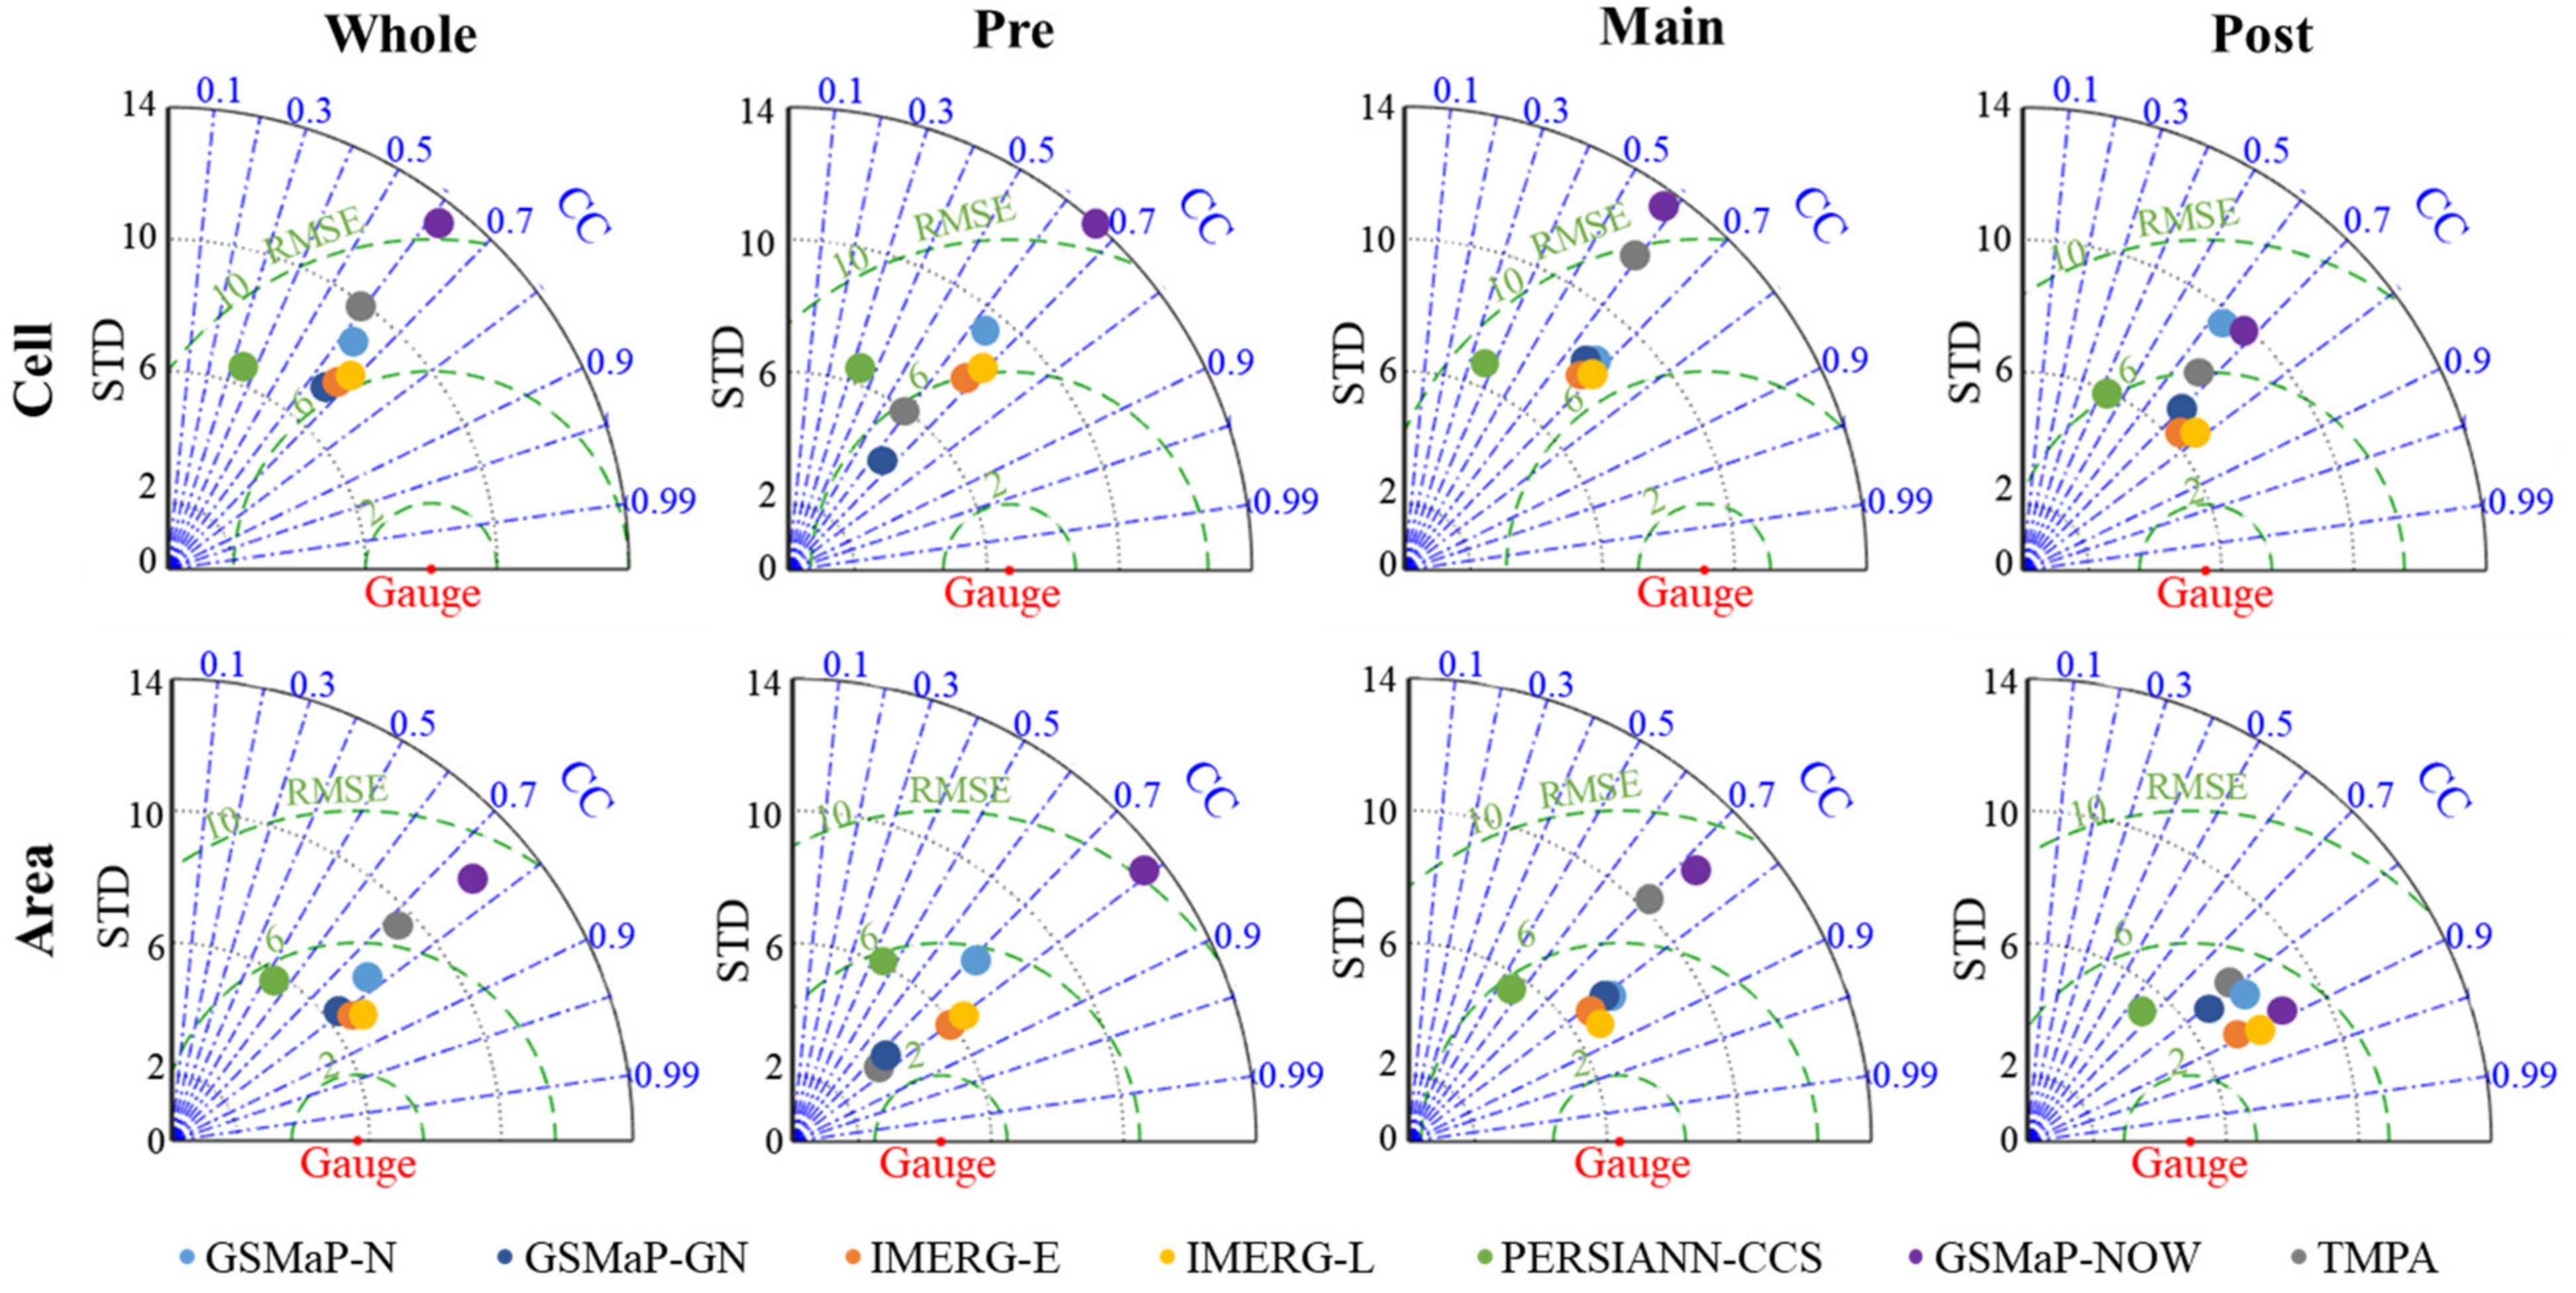
Figure 4 shows the Taylor diagrams (CC and RMSE) of the seven NRT SPPs at the cell scale and areal scale over the Nierji Basin for different flood sub-seasons, from 2008 to 2019. In the Taylor diagram, the points closer to the “Gauge” point on the X-axis show better accuracy. According to Figure 4, the distribution of points in the Taylor diagrams has three characteristics. Firstly, the point distribution of the main flood season is similar to that of the whole flood season, which is reasonable considering that 55% of wet-season precipitation occurs during the main flood season. The points in the Taylor diagrams of the pre- and post-flood seasons are more scattered and more centralized, respectively, than the points of the main flood season, meaning that the differences among SPPs are more significant in pre-flood seasons but slighter in post-flood seasons, whether at the cell scale or the areal scale. Secondly, regardless of flood sub-season, points at the areal scale have a similar distribution with those at the area scale and are closer to the “Gauge” than those at the cell scale. The potential reason for this is that the precipitation spatial biases are partly neutralized after the areal averaging. Thirdly, the points are mainly distributed along the radius of the Taylor diagram, except for PERSIANN-CCS with a minor CC, meaning that SPPs are similar in CC and the main difference in SPPs is the RMSE.
SPPs have different characteristics in different flood sub-seasons. The two NRT versions of GSMaP with the same latencies, namely, GSMaP-N and GSMaP-GN, are similar during the main flood seasons, but GSMaP-N is much worse than GSMaP-GN during pre-flood and post-flood seasons (except for the areal scale in post-flood seasons, where all six NRT SPPs that used MW are similar). The two versions of IMERG (points in yellow and orange in Figure 4) are significantly similar during each flood sub-season. IMERG-L takes both forward and backward morphing into account, despite the expense of lost timeliness; however, it does not become much more accurate than IMERG-E. In addition to this, the performances of TMPA in pre-flood and post-flood seasons are better than those in the main flood seasons. PERSIANN-CCS and GSMaP-NOW are, respectively, the worst in terms of CC and RMSE during each flood sub-season, which is potentially caused by the fewest information used in the precipitation retrieval process.
As for the performance intercomparison, the ranks of SPPs vary between the flood sub-seasons. Over the whole flood season, GSMaP-GN, IMERG-E, and IMERG-L are the best, followed by GSMaP-N, PERSIANN-CCS, and TMPA, and GSMaP-NOW is the worst. In the pre-flood season, the accuracy of GSMAP-GN and TMPA is significantly better than that in the whole flood season so that the two SPPs become the best, and the order of other SPPs is similar to the whole flood season in the pre-flood season. In the main flood season, GSMaP-N, GSMaP-GN, IMERG-E, and IMERG-L are the best and are significantly similar. In the post-flood season, each SPP performs better. GSMAP-NOW shows the most significant improvement, while the other two NRT versions of GSMAP show the most negligible improvement.
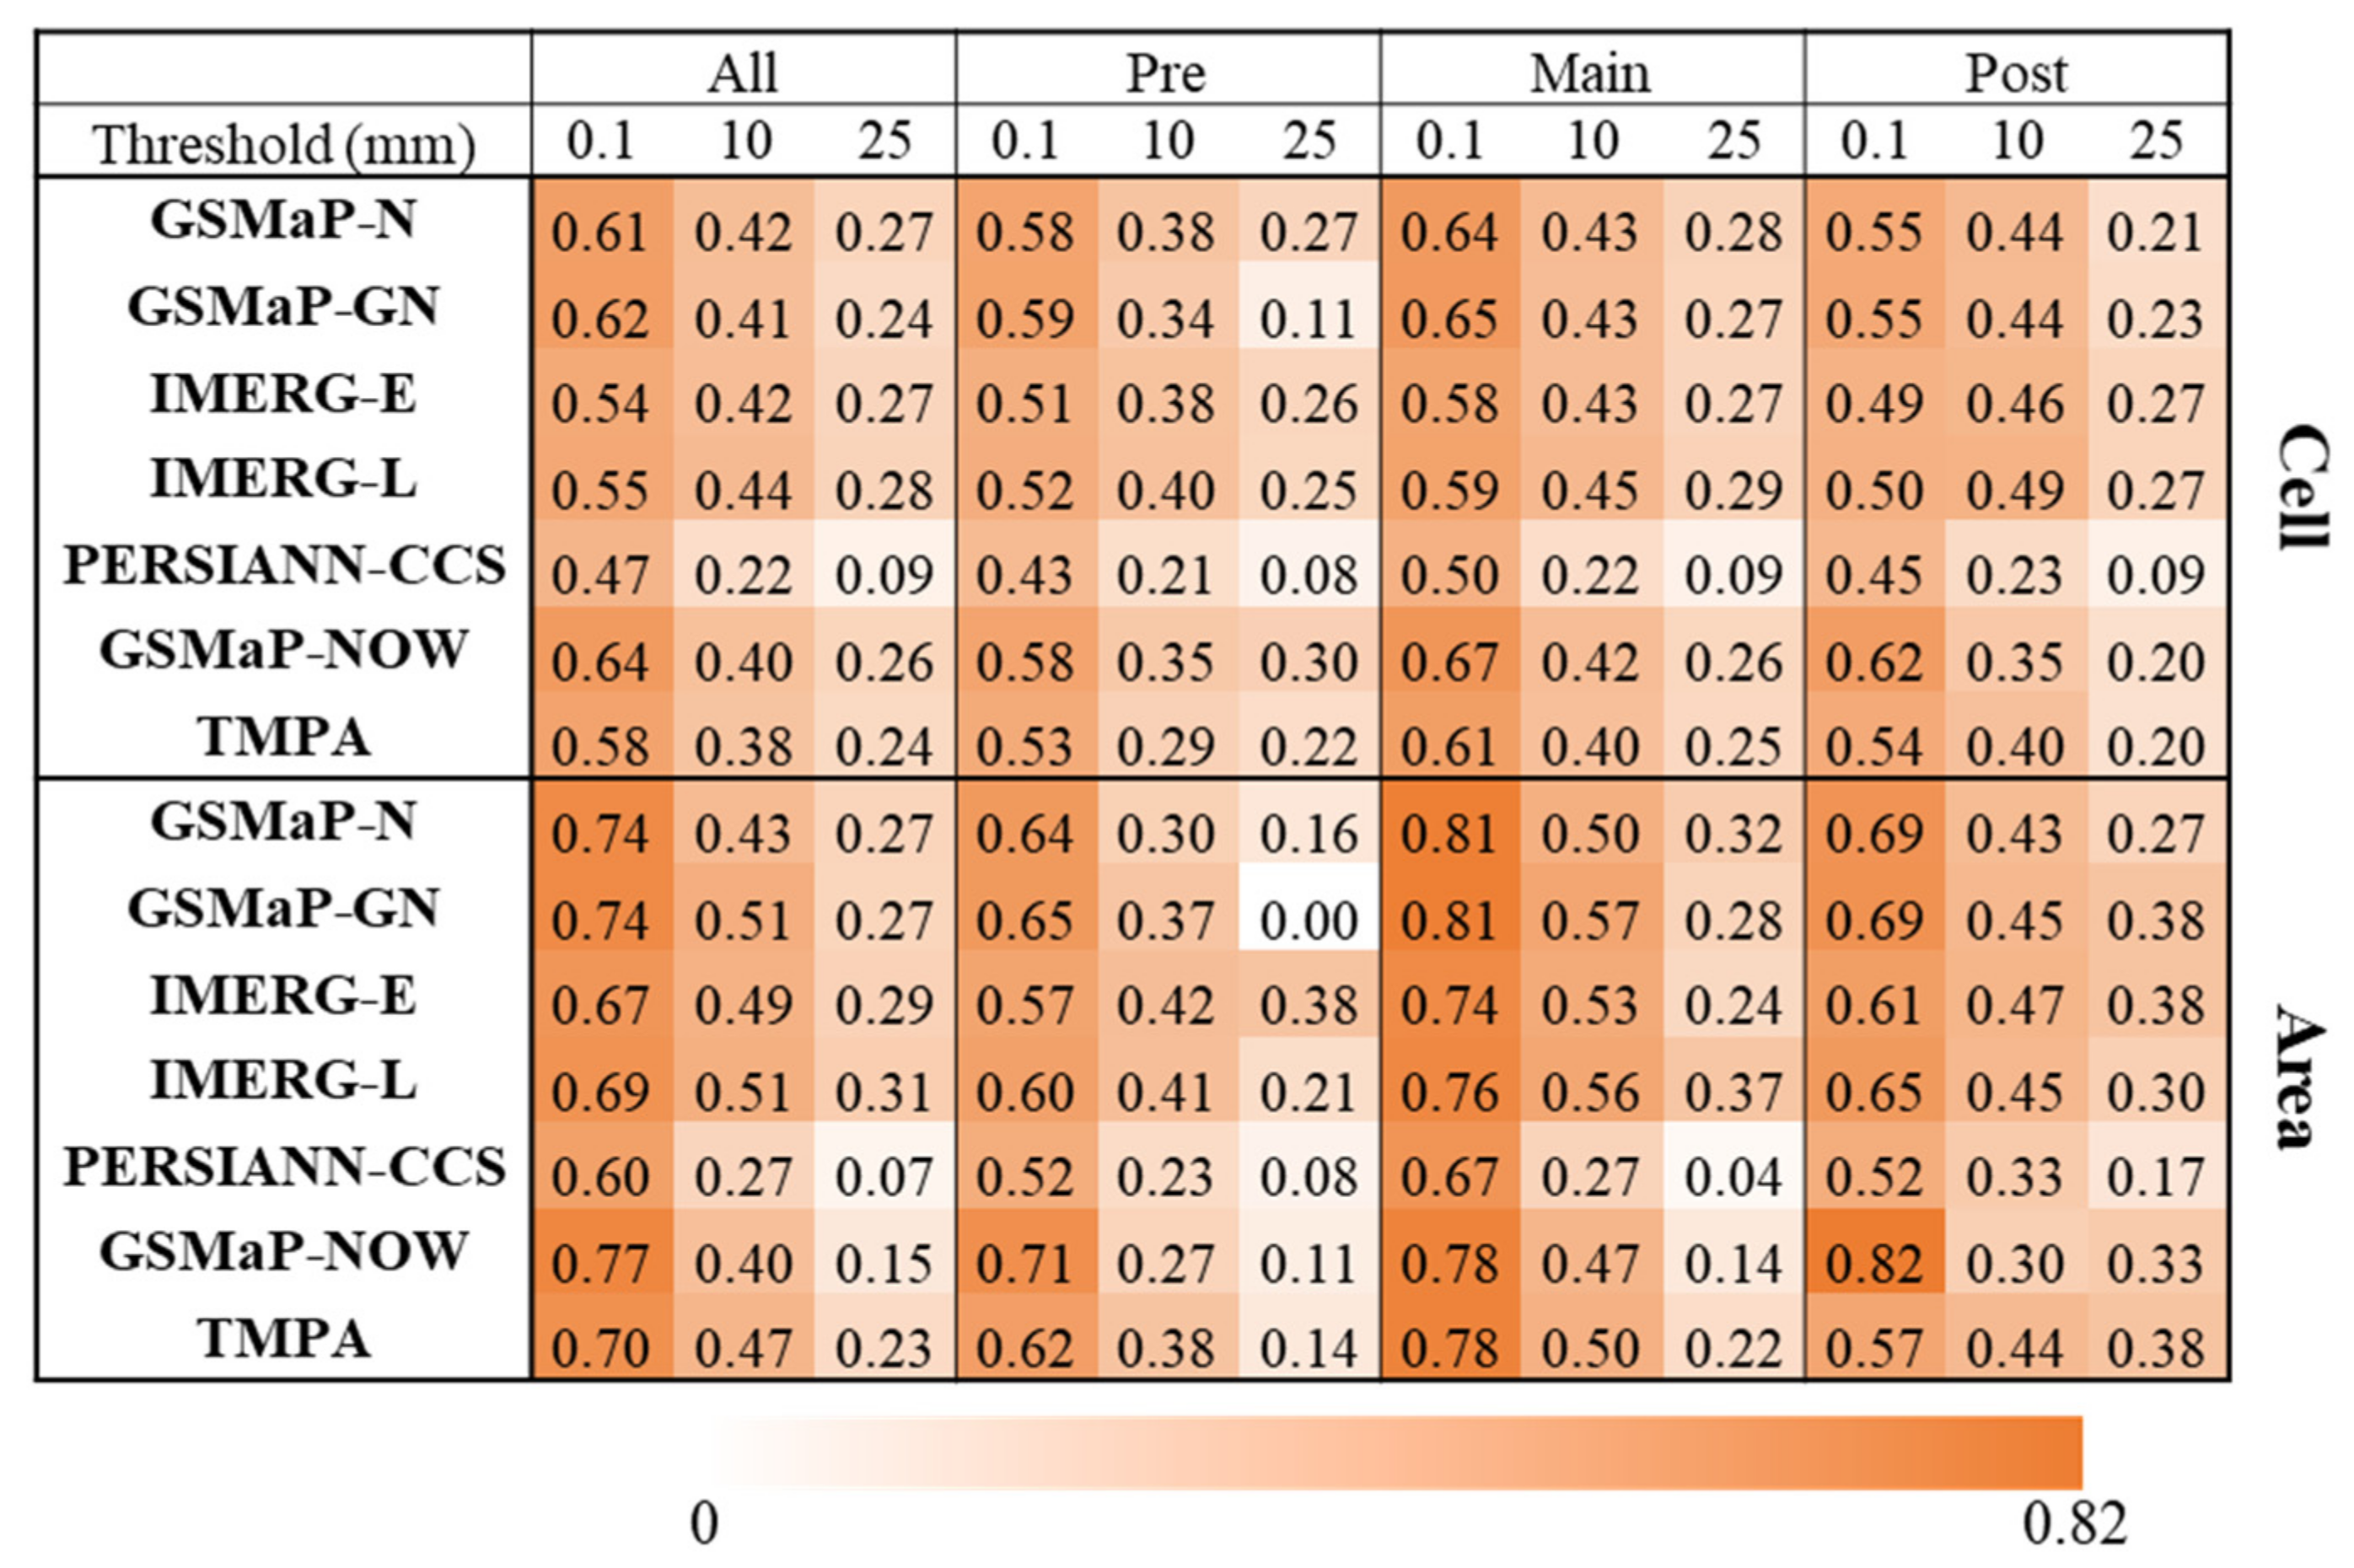
Comparison and analysis were carried out among different sub-seasons, scales, thresholds, and products according to Figure 5. Figure 5 shows CSI at the cell scale and areal scale for different flood sub-seasons and thresholds using a heat map, where a darker color means the better value. Firstly, the CSI at the areal scale is larger than that at the cell scale. When the threshold is equal to 0.1, the CSI at areal and cell scales varies from 0.52 to 0.82 and from 0.43 to 0.67, respectively, which means SPPs at the areal scale are better at detecting precipitation occurrence than that at cell scales. Secondly, the lower the detection threshold, the stronger the detection ability of SPPs. The detection ability with a threshold of 0.1 is the best in this study, and the detection ability of each SPP in the main flood season is the best of the different flood sub-seasons. Thirdly, the heat distribution of the flood sub-season blocks is similar at the cell scale. Under any detection threshold, the difference between the maximum and minimum CSI of flood sub-seasons is no greater than 0.1, indicating that the influence of flood sub-seasons on the detection ability of SPPs is slight. Fourthly, the detection ability of PERSIANN-CCS is the worst, and the GSMaP-GN’s ability to detect heavy rainfall in pre-flood seasons is unsatisfactory with the CSI of 0.11 and 0 at the cell scale and the areal scale, respectively. The main reason for this is that GSMaP-GN significantly underestimates heavy rainfall in pre-flood seasons, so there is little rainfall monitored by NRT SPPs exceeding the threshold of 25 mm/day. The detection ability of GSMaP-N and GSMaP-GN is the best in the main flood seasons at the areal scale. GSMaP-NOW performs well in terms of detection ability, with a threshold of 0.1, especially in the post-flood season when the CSI is equal to 0.82.
3.2. SPPs with Different Intensities
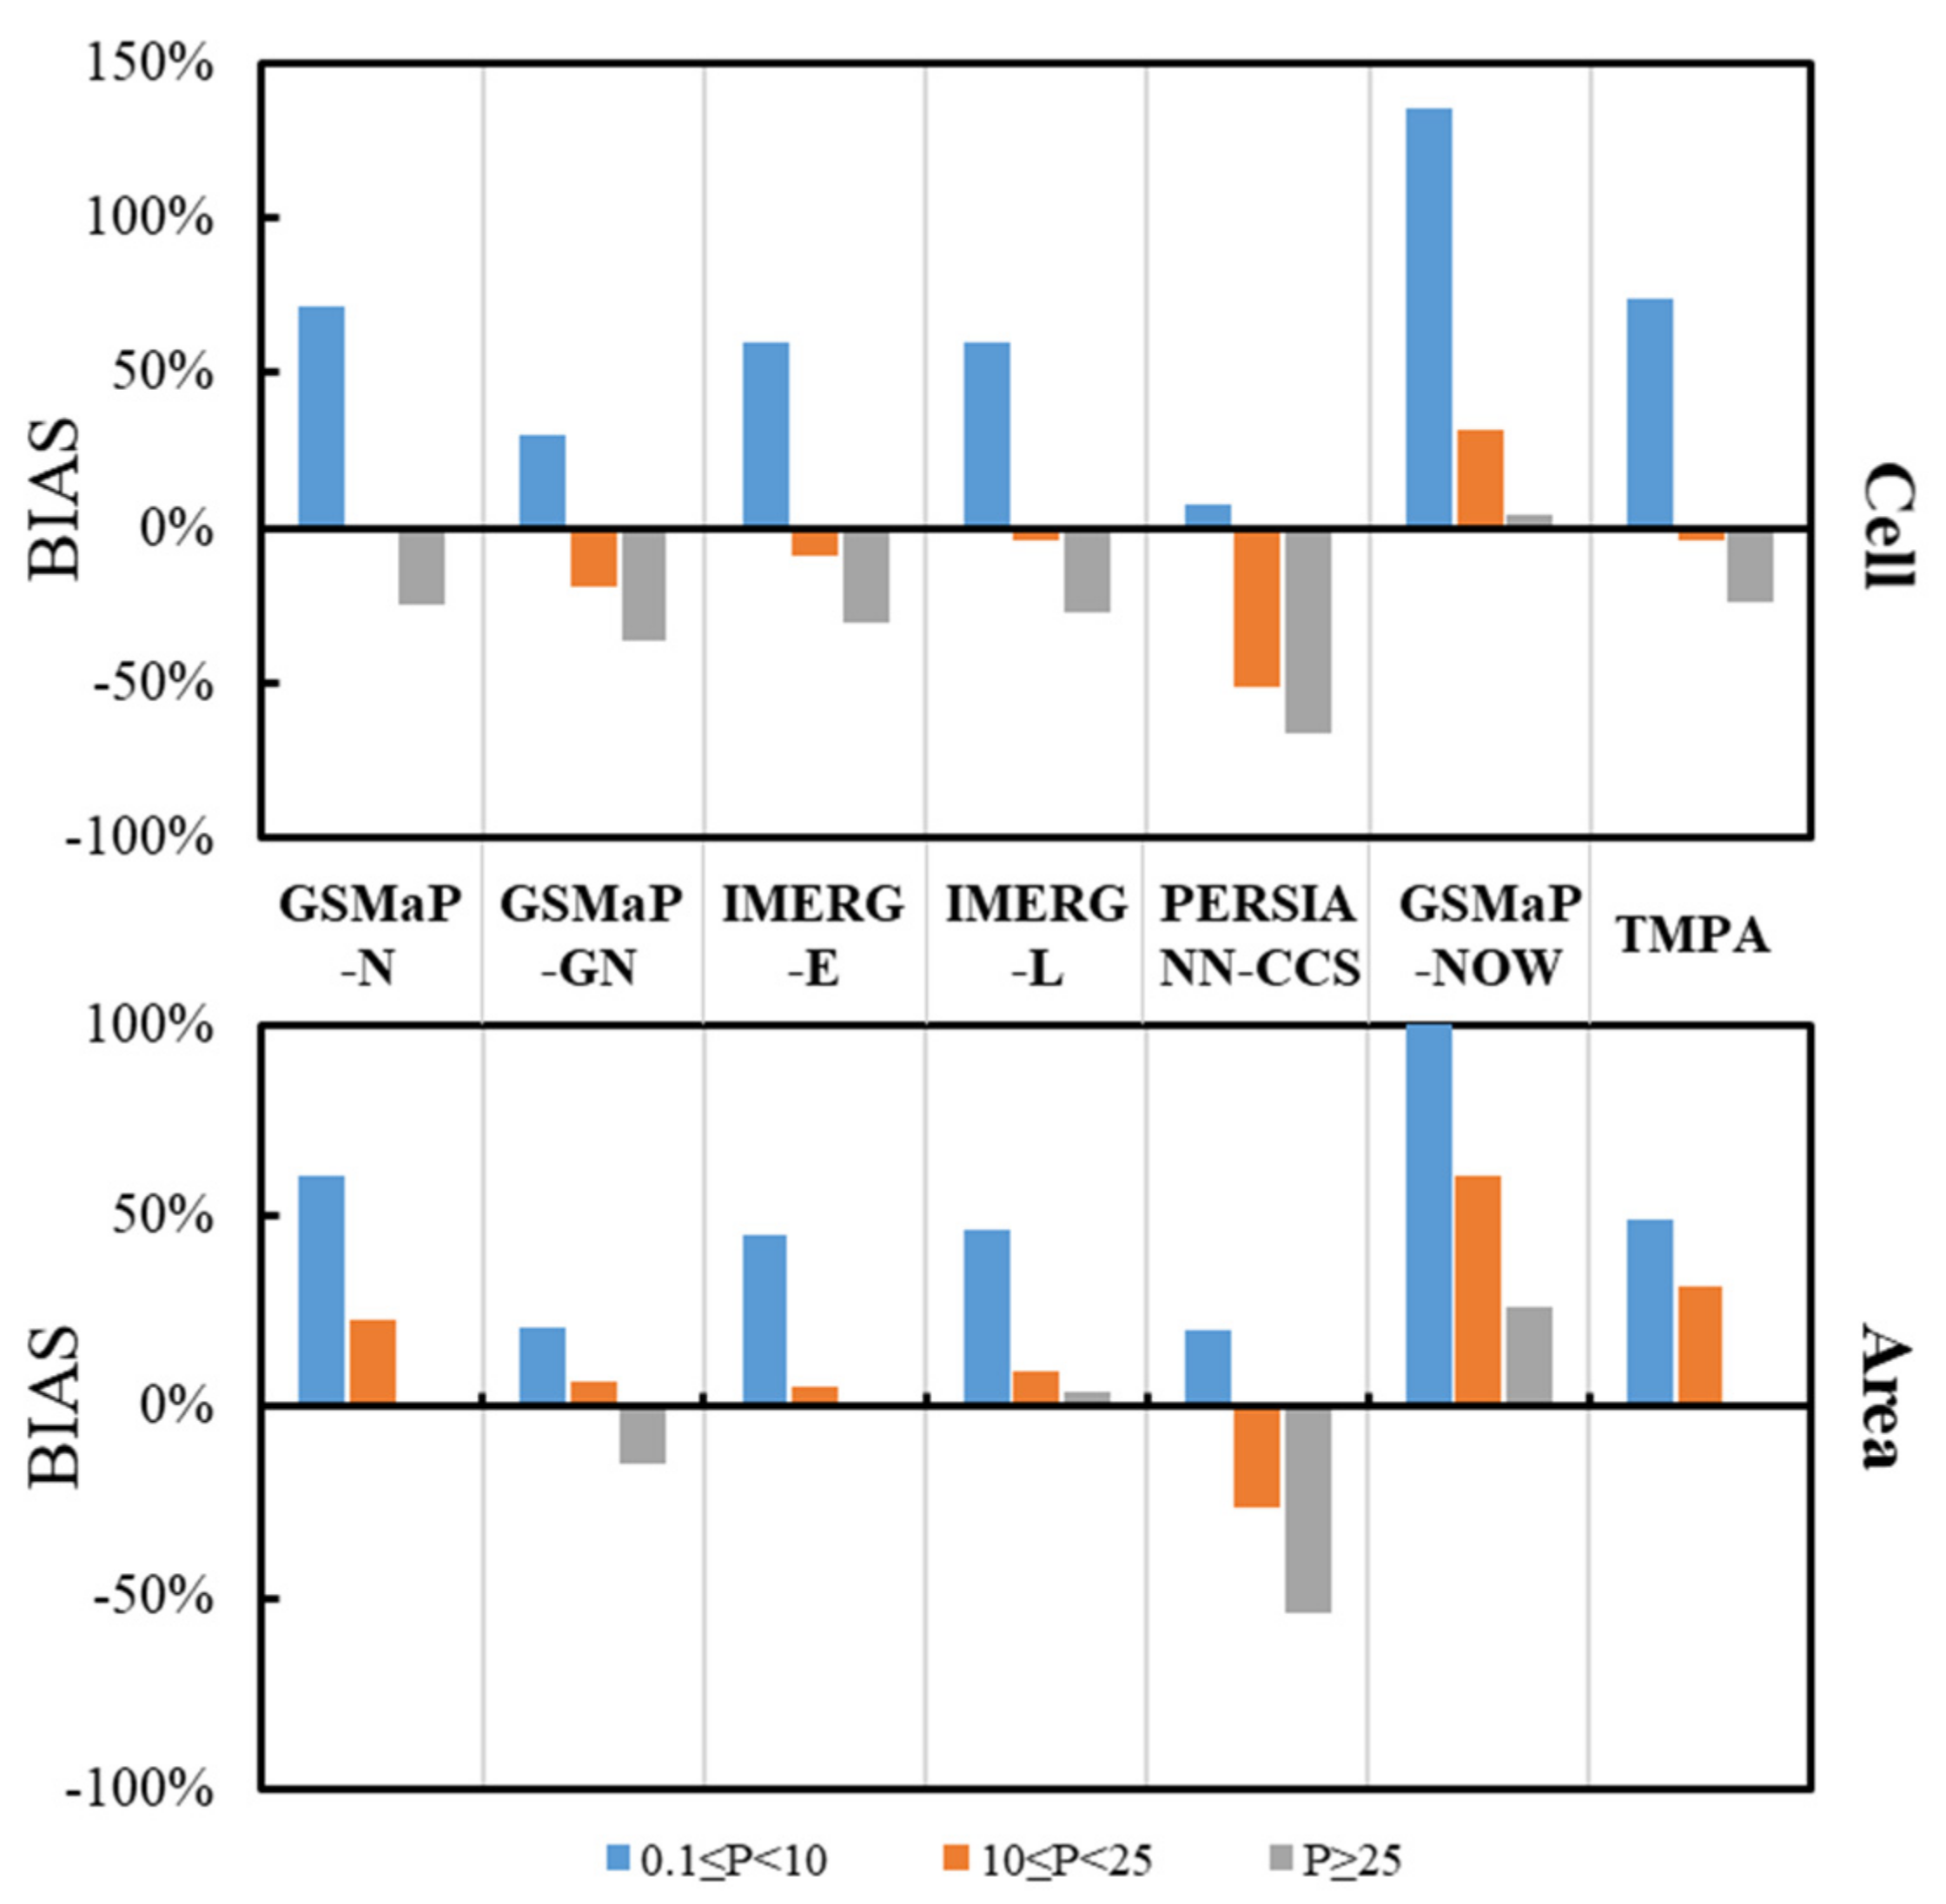
Figure 6 shows the BIAS of SPPs with different precipitation intensities. The positive and negative BIAS indicates the overestimation and underestimation of the evaluated SPP, respectively. It is worth noting that when the BIAS is close to 0, it cannot fully conclude that the SPP is accurate, but only indicates that the precipitation estimates are not obviously heavier or lighter. According to Figure 6, SPPs tend to overestimate light precipitation. The product that overestimates light precipitation most significantly is GSMaP-NOW, with a BIAS of 135.7% and 100.67% at the cell scale and areal scale, respectively, followed by GSMaP-N, TMPA, IMERG-E, and IMERG-L, with a BIAS of 60–75% at the cell scale and 45–60% at the areal scale. GSMaP-GN and PERSIANN-CCS overestimate light precipitation the least. For heavy precipitation, apart from GSMaP-NOW, SPPs underestimate heavy precipitation at the cell scale. The underestimate of PERSIANN-CCS is the most significant, with a BIAS of −66%, while the BIAS of the rest of the SPPs varies from −24% to −37%. At the areal scale, the SPP estimates of heavy precipitation are not significantly heavier or lighter than gauge-based observations, with a BIAS of less than ±15%, except for the underestimates of PERSIANN-CSS and the overestimates of GSMaP-NOW. Overall, SPPs deviate more at the cell scale than at the areal scale.
As shown in Figure 6, among the seven NRT SPPs, GSMaP-GN deviates the least, with a BIAS between −37% and 30% at the cell scale and between −15% and 21% at the areal scale, followed by IMERG-E and IMERG-L, GSMaP-N and TMPA. PERSIANN-CSS and GSMaP-NOW deviate significantly; the former tends to underestimate precipitation and the latter tends to overestimate precipitation.
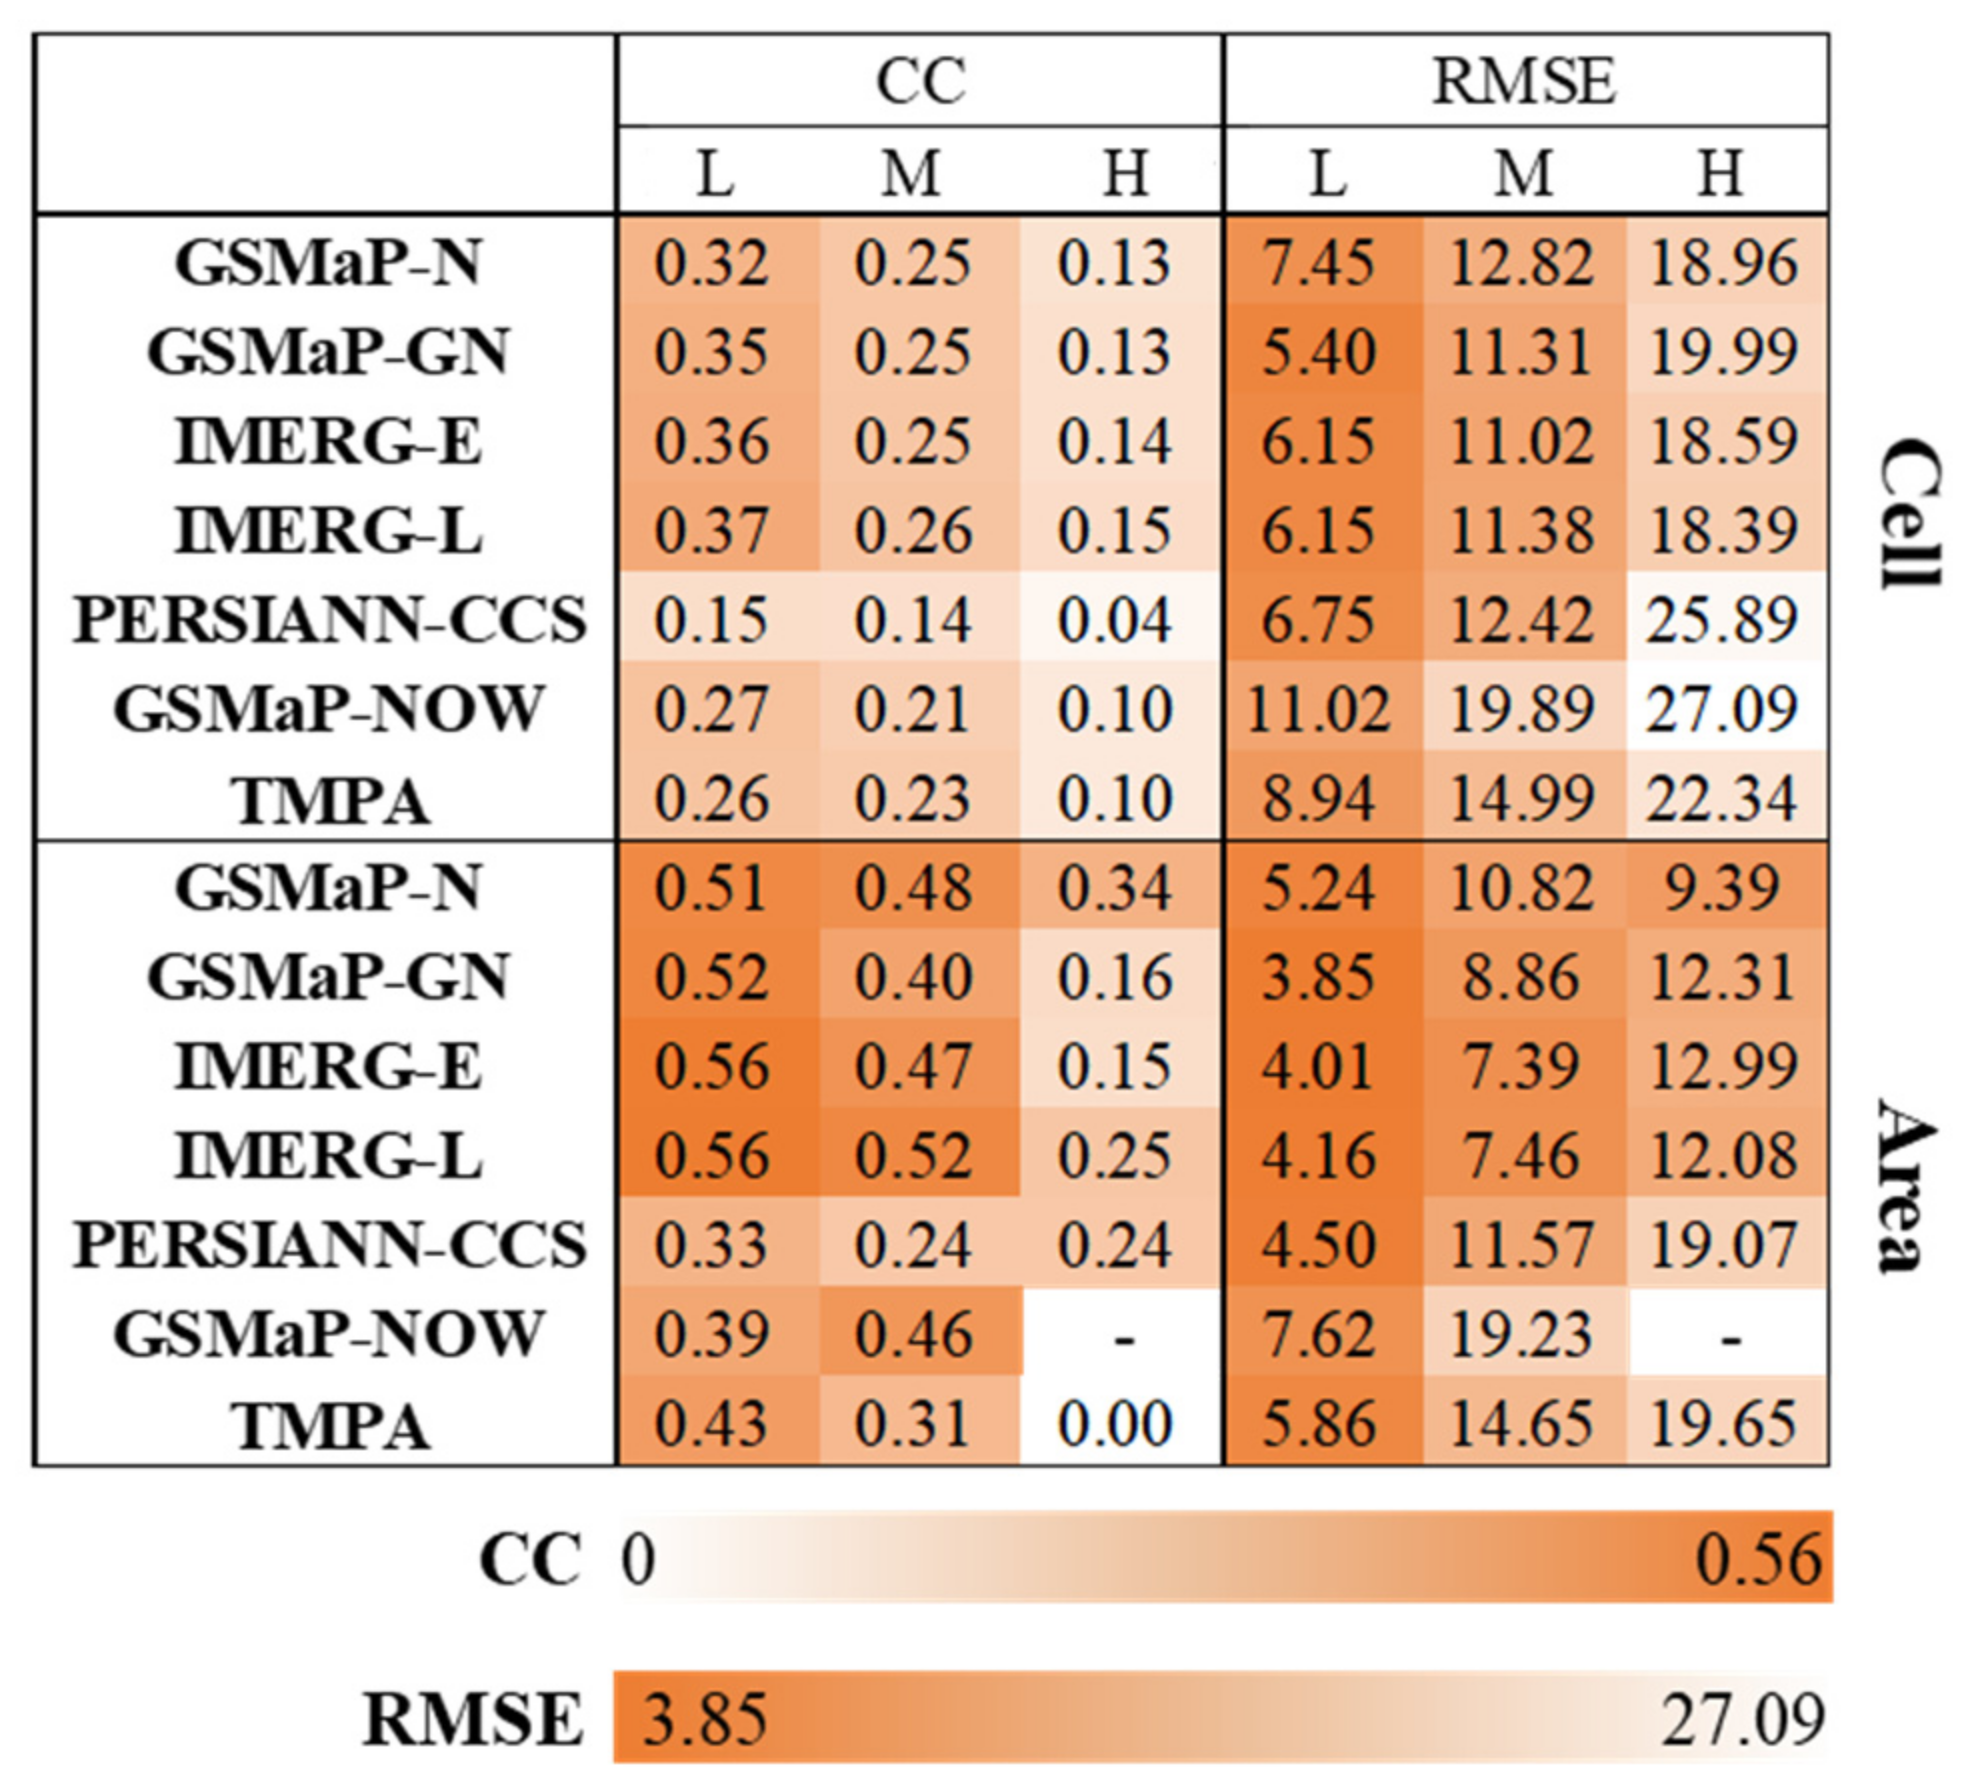
Figure 7 shows CC and RMSE at the cell scale and areal scale for different precipitation intensities using a heat map, where the darker color indicates the better value. As shown in Figure 7, the lighter the precipitation is, the better the CCs of SPPs are. GSMaP-N, GSMaP-GN, IMERG-E, and IMERG-L are similar and the best at estimating light and moderate precipitation. Each SPP cannot estimate heavy precipitation well, but the heavy precipitation estimation at the areal scale is better than that at the cell scale. GSMaP-N performs the best, with a CC of 0.34 and an RMSE of 9.39. The exclusion of GSMaP-NOW when evaluating heavy precipitation at the areal scale is due to the limited number of samples (only seven values from 2017 to 2019).
3.3. Total Accumulation of SPPs in Precipitation Events
Figure 8 shows CC and BIAS at the cell scale and areal scale for precipitation events and daily rainfall when rainfall exceeds 0.1 mm/day; the exclusion of RMSE is due to the significant difference between the accumulation of rainfall events and daily rainfall. Overall, accumulation estimations of rainfall events perform better than those of daily rainfall, and SPPs tend to overestimate the precipitation volume either at the cell scale or areal scale and either at the event scale or the daily scale, except for PERSIANN-CCS and GSMaP-GN. Additionally, the CC at the event scale is high with a maximum of 0.93 (IMERG-E and IMERG-L) and a minimum of 0.79 (PERSIANN-CCS, although whose daily CC is 0.50 and 0.31 at the areal scale and cell scale, respectively). IMERG-L performs best at the event-cell scale with CC of 0.7 and BIAS of 0%, while GSMaP-GN performs best at the event-areal scale with CC of 0.91 and BIAS of 5%. It is worth noting that GSMaP-NOW significantly overestimates areal precipitation with BIAS of 65% and 68% for area-event scale and area-daily scale, respectively, but can reflect the precipitation variation, as indicated by the relatively high CC (0.89 and 0.7 for area-event scale and area-daily scale, respectively). Therefore, the system error of areal precipitation overestimation should be corrected before GSMaP-NOW is employed at area scale.
3.4. Hydrological Utility of SPPs
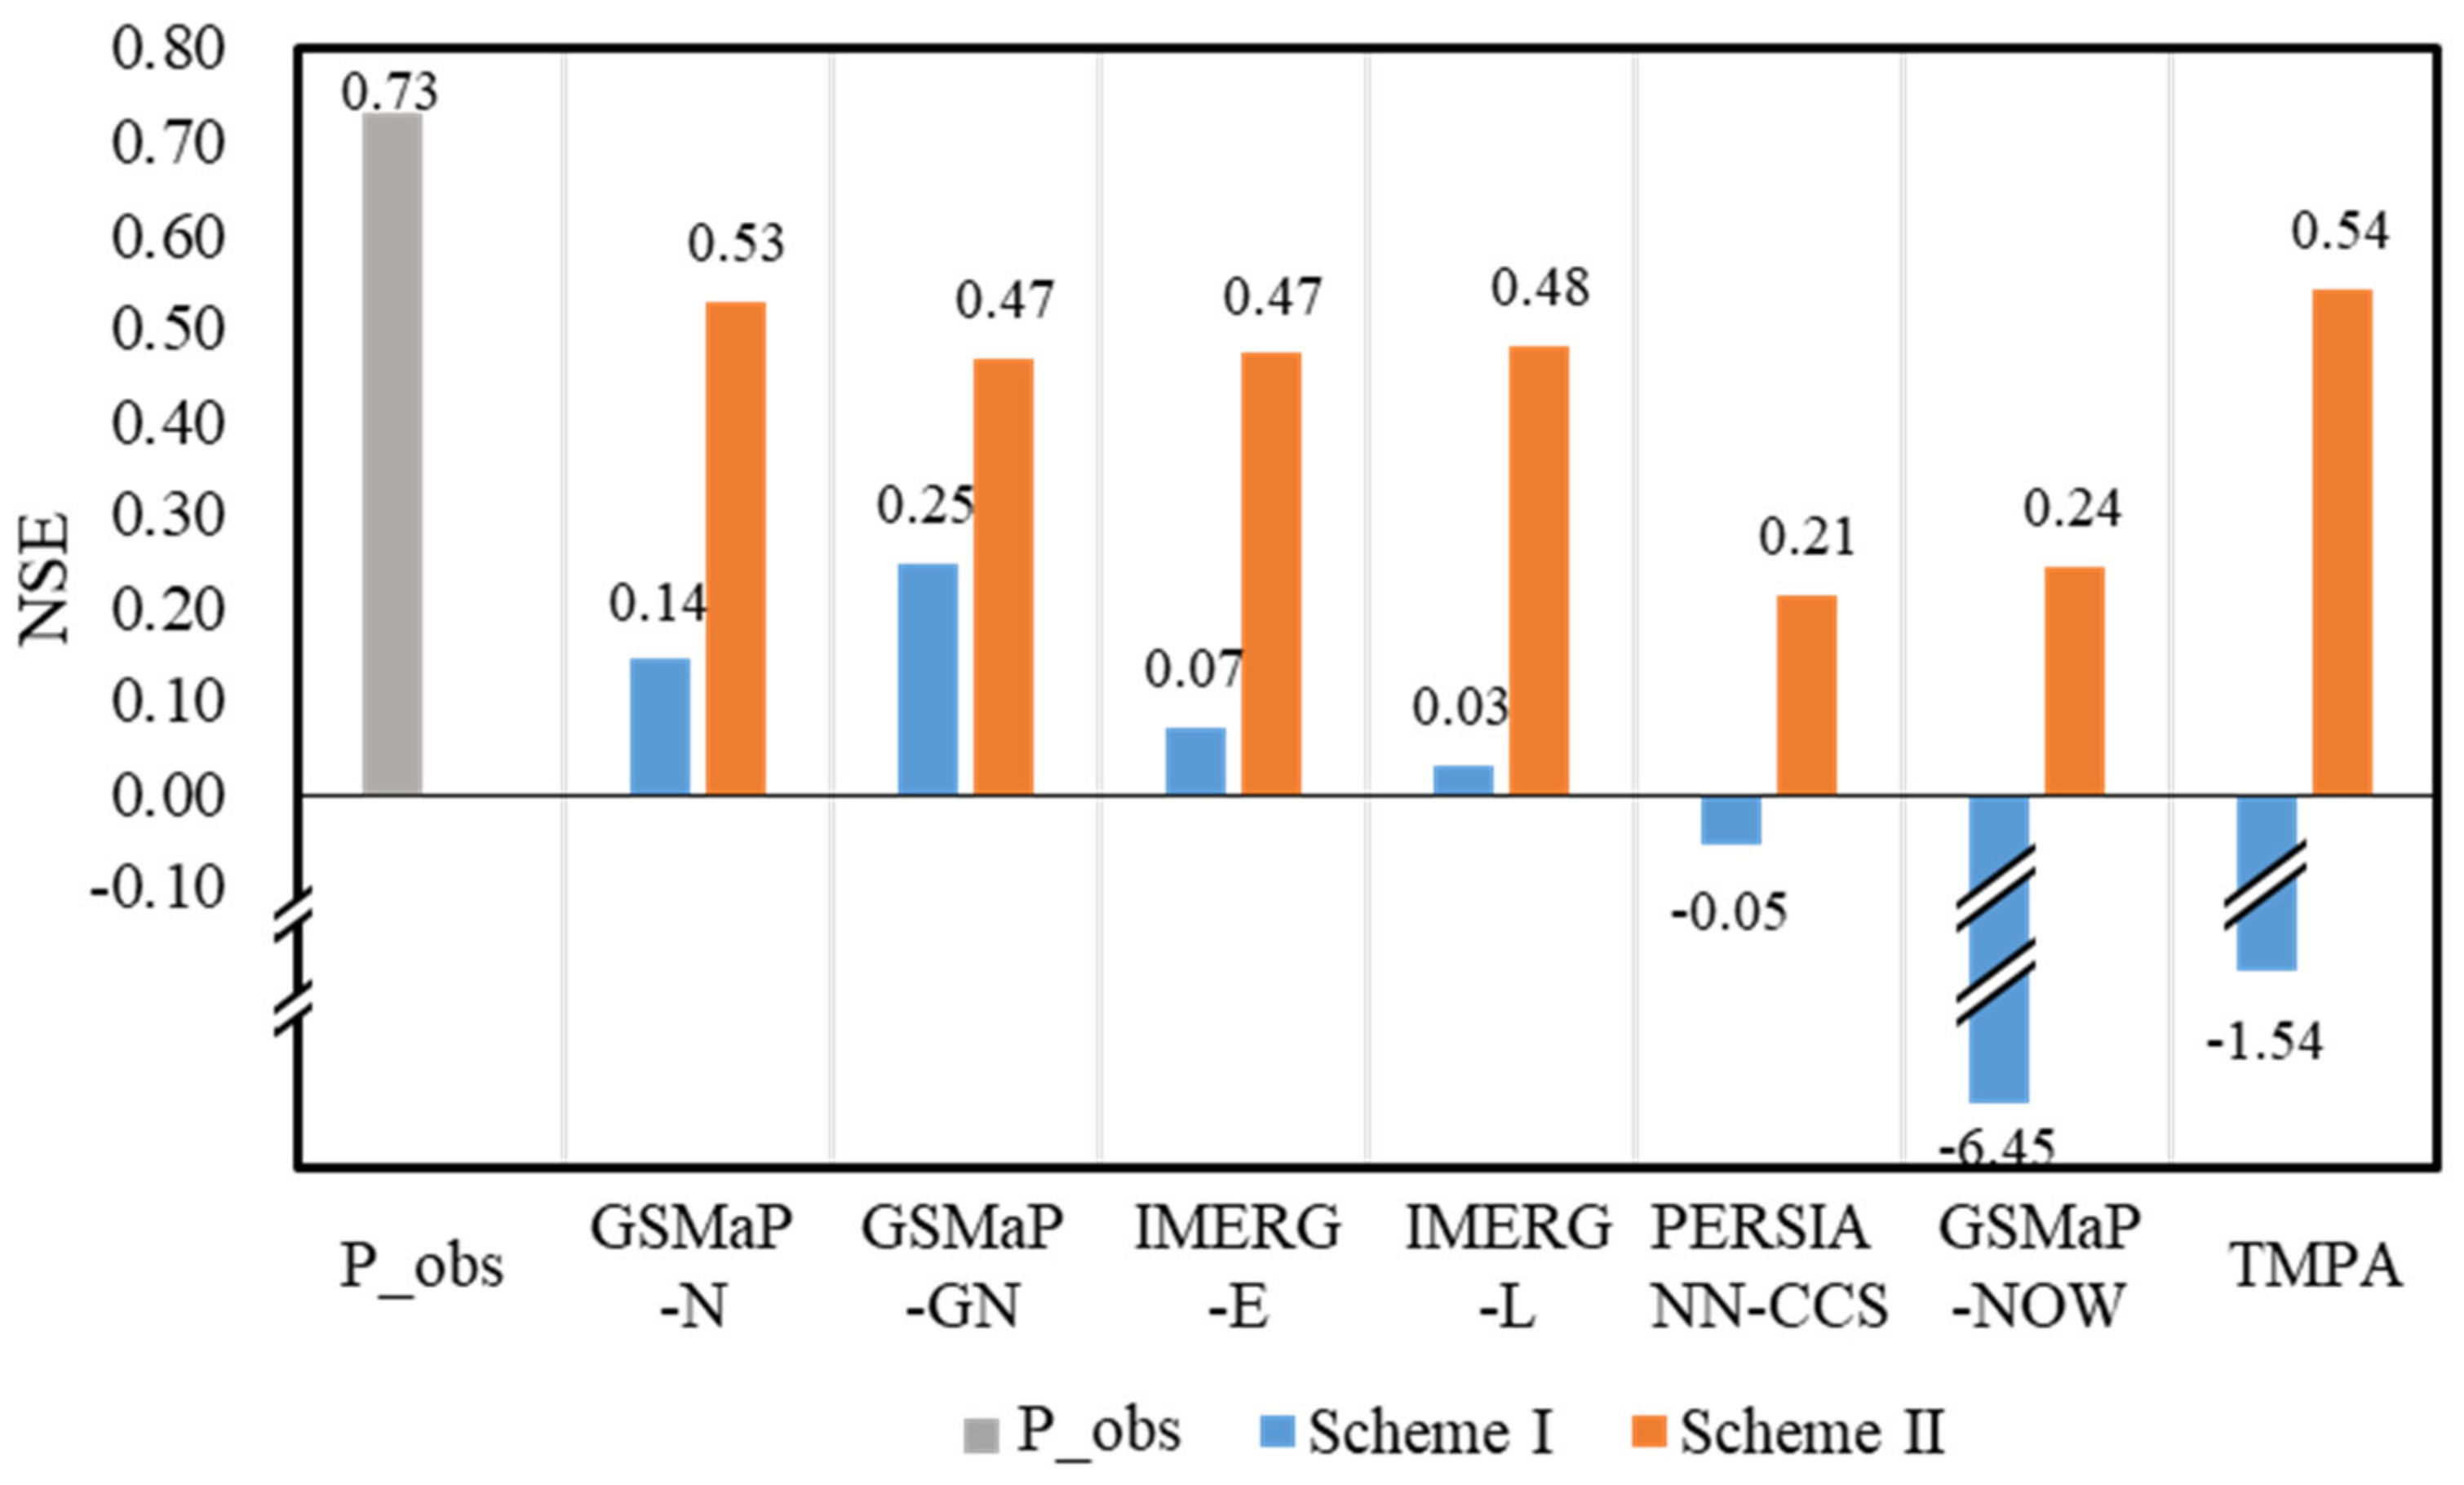
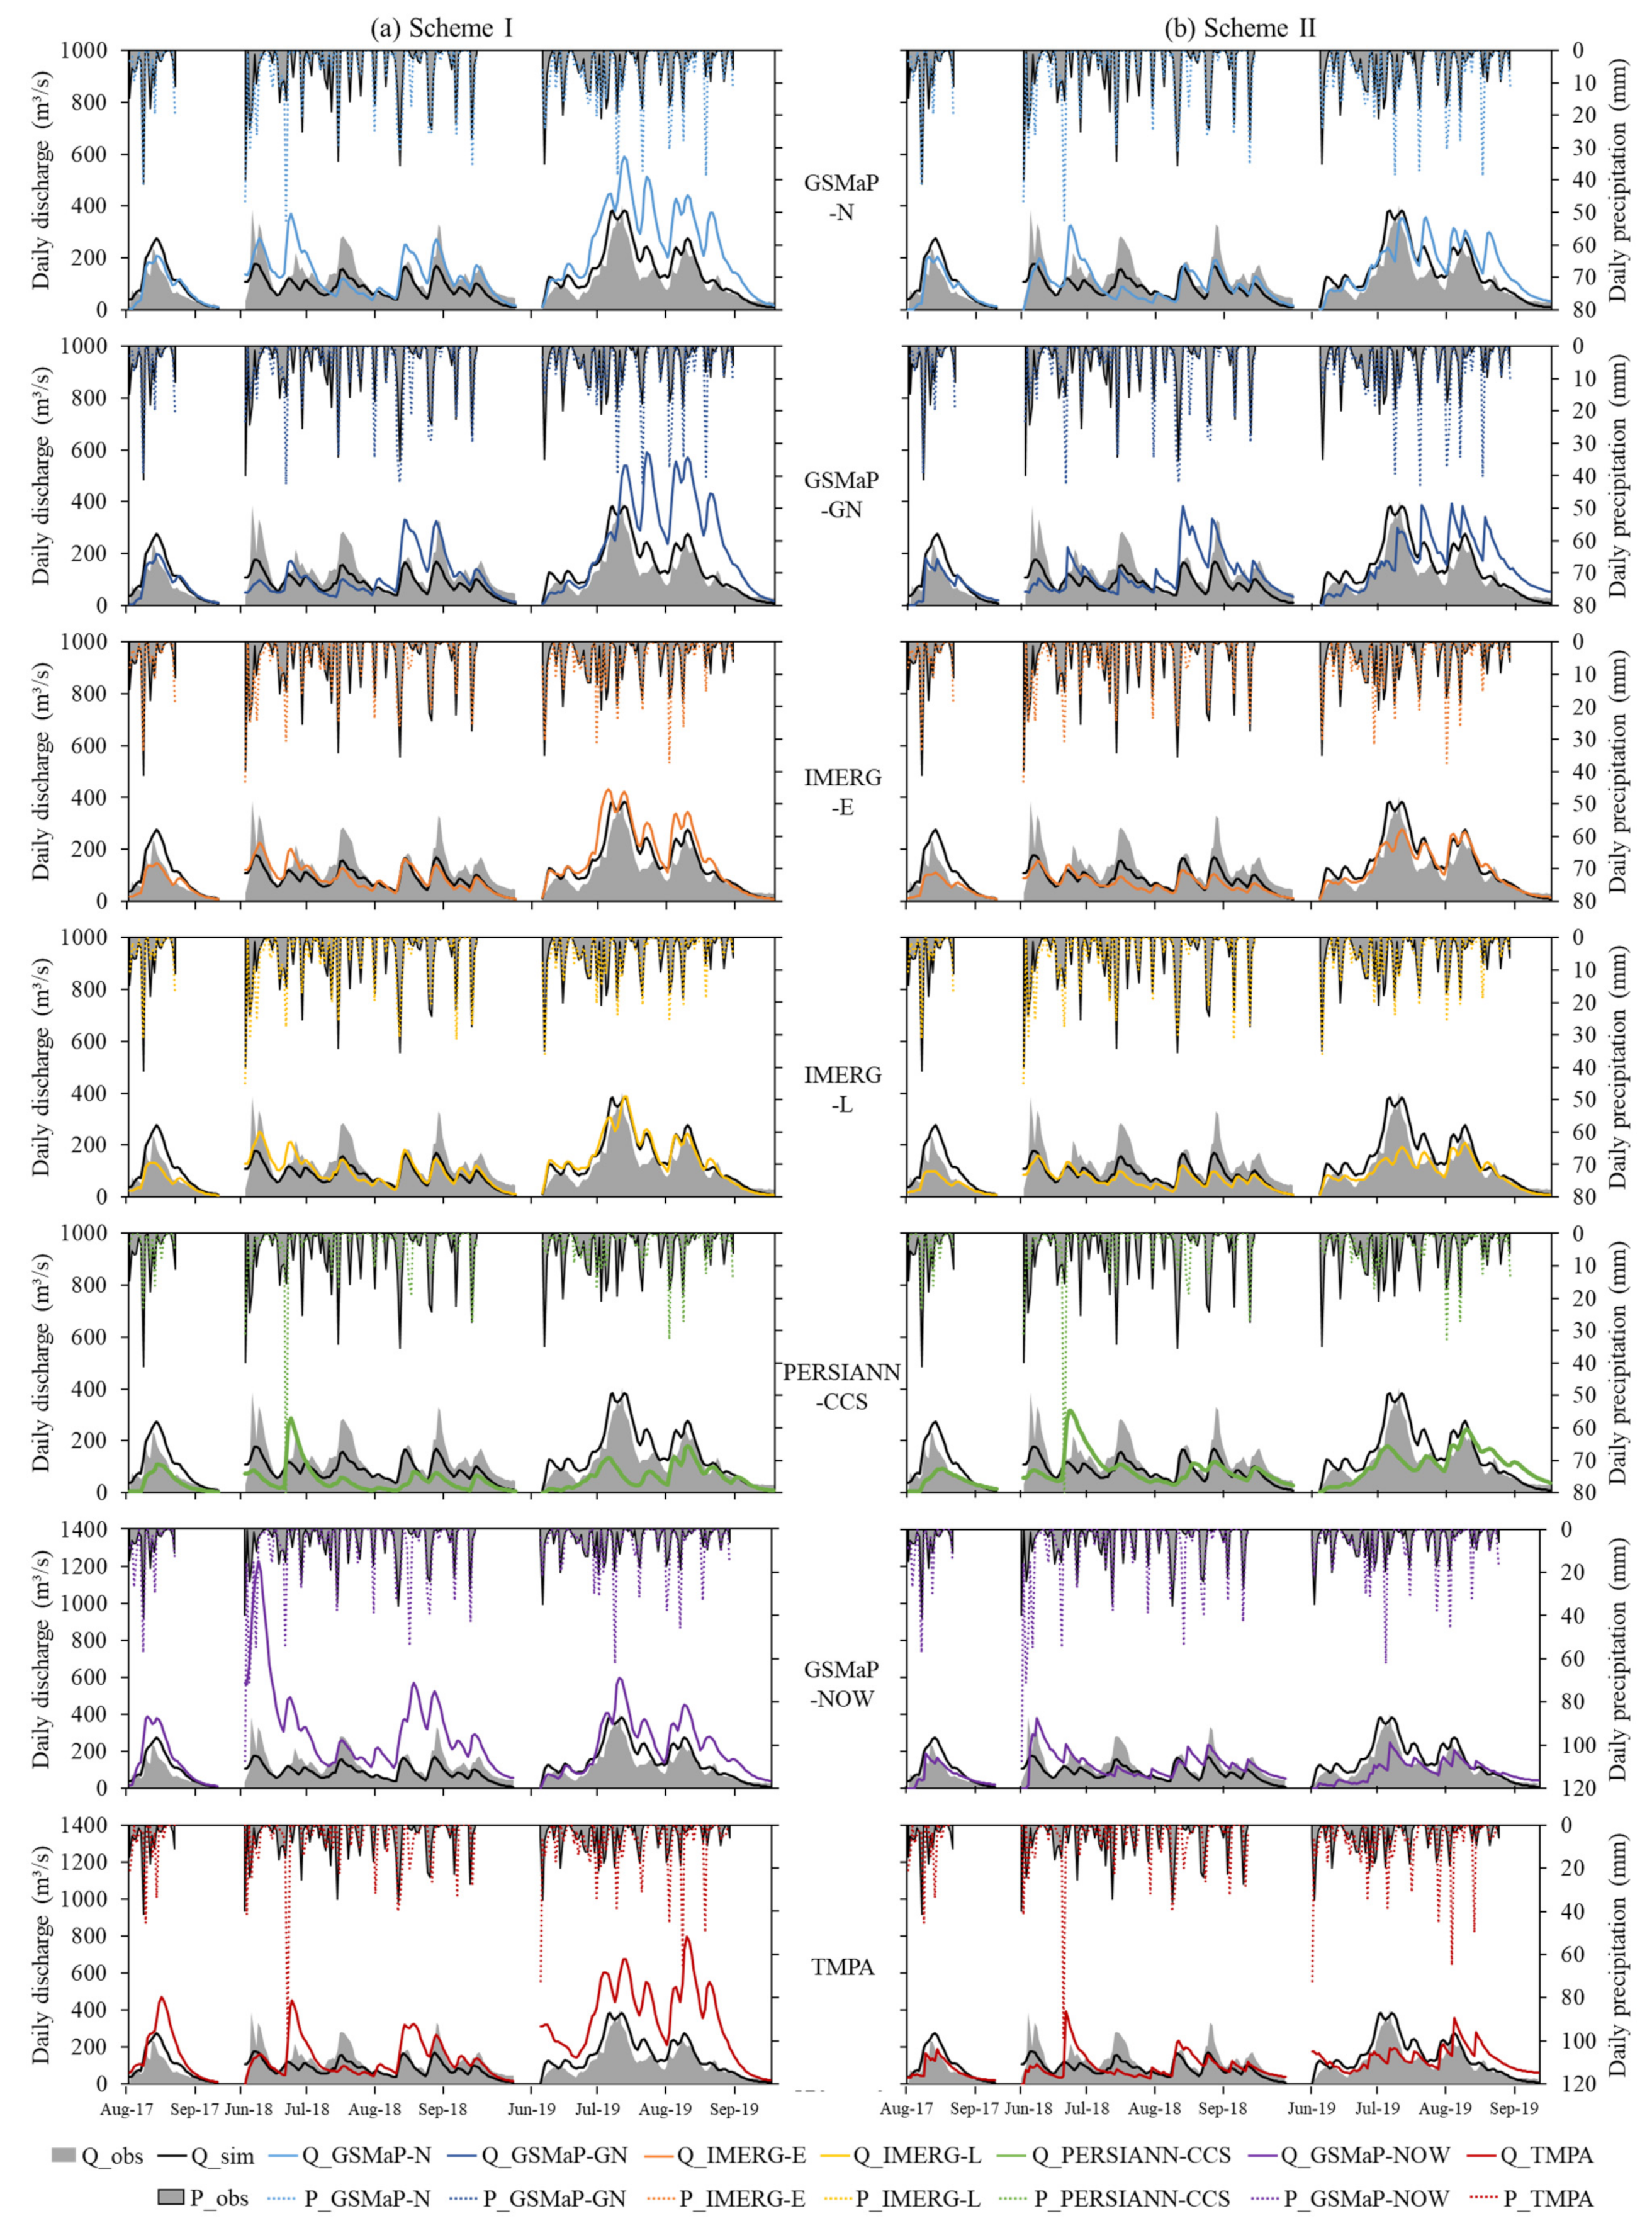
An NSE of simulated discharge against the observed discharge at Kehou station during the wet seasons from 2008 to 2019 is shown in Figure 9. The observed and simulated daily discharge at Kehou station during wet seasons from 2017 to 2019 is shown in Figure 10. As shown in Figure 9, simulated discharge by inputting gauge-based precipitation with an NSE of 0.73 performed better than that simulated by inputting SPPs for both Scheme Ⅰ and Scheme Ⅱ. In Scheme Ⅰ, the GSMaP-GN-based NSE was the best but was only 0.25. Furthermore, the NSE based on PERSIANN-CCS, GSMaP-NOW, and TMPA in Scheme Ⅰ was negative, indicating the poor performance of the simulated discharge. The NSE based on GSMaP-NOW reached −6.45; this NSE was caused by the significant overestimations of precipitation, which can be seen in Figure 10a. After recalibrating the hydrologic model with SPPs, as in Scheme Ⅱ, NSE significantly improved. Among the SPPs, TMPA showed the most significant improvement after recalibration, with an NSE ranging from −1.54 to 0.54, and became the best in Scheme Ⅱ. Additionally, GSMaP-N, GSMaP-GN, IMERG-E, and IMERG-L also performed well in Scheme Ⅱ. Although the five SPPs with better hydrological utility had similar NSEs, ranging from 0.47 to 0.54, the simulated discharge based on the above products was different, as shown in Figure 10b. Taking GSMaP-GN and IMERG-L in 2019 as an example, GSMaP-GN-based discharge fit the observed discharge well in June and July but poorly in August and September, while IMERG-L-based discharge showed the opposite effect.
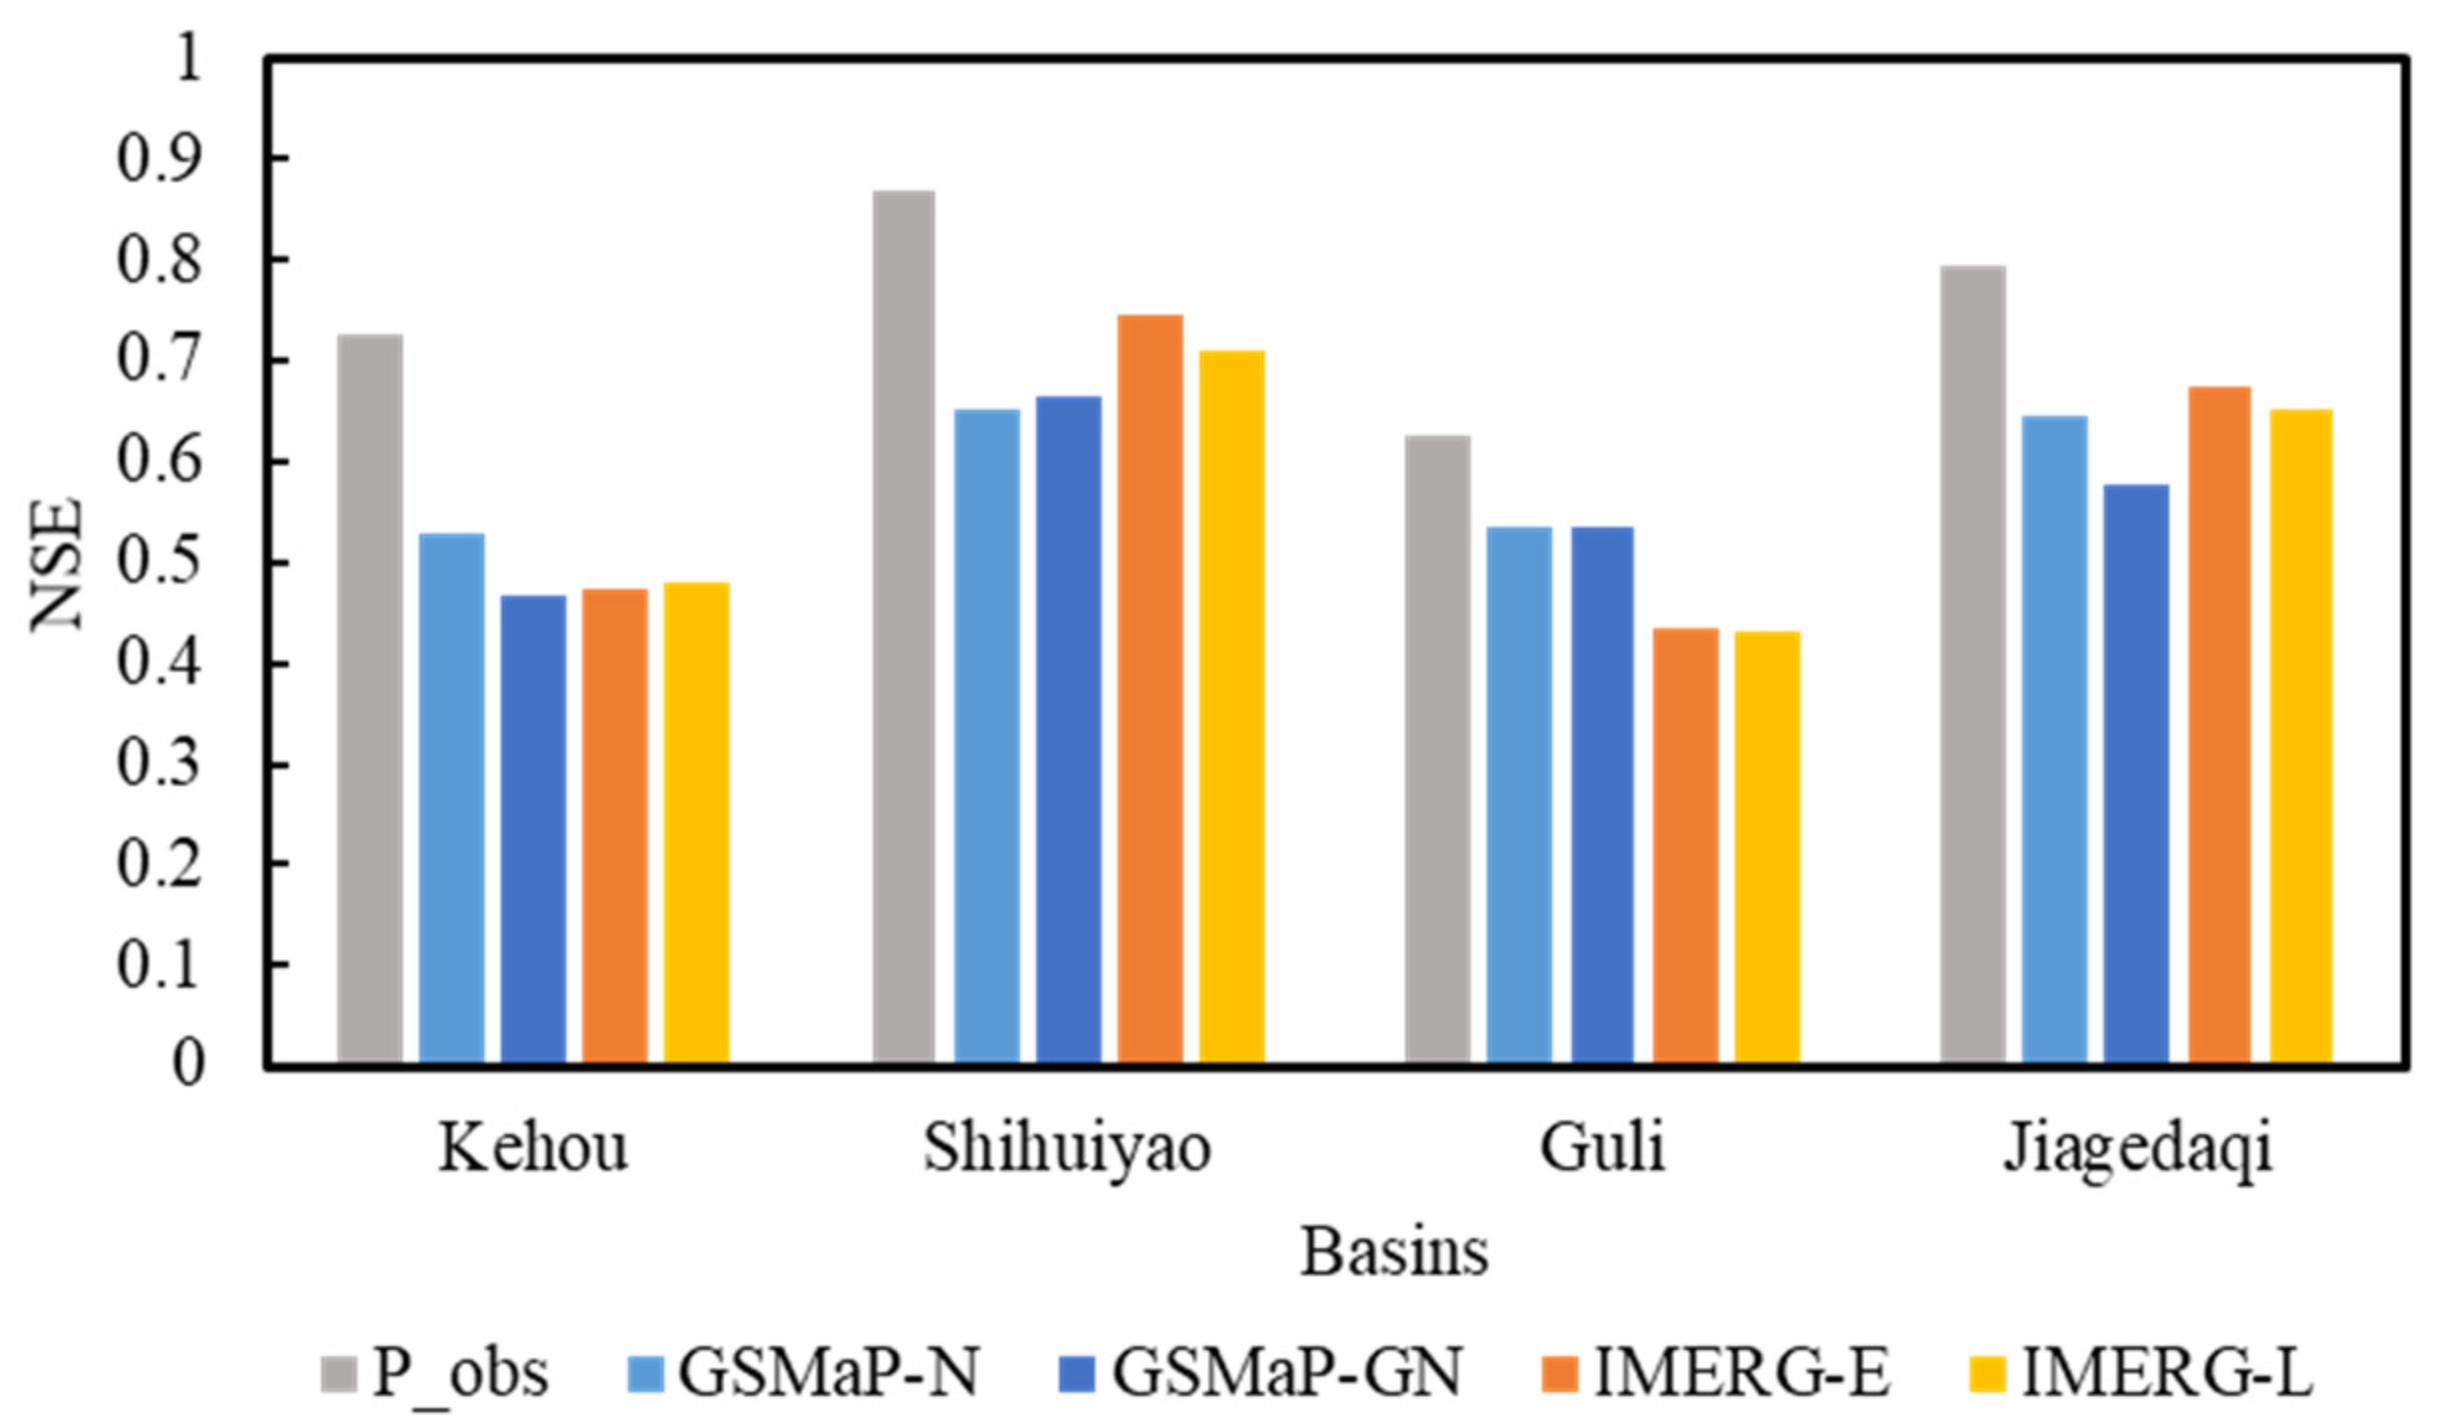
Based on the above evaluation and comparison, GSMaP-N, GSMaP-GN, IMERG-E, and IMERG-L were selected to recalibrate the hydrologic model for the basins controlled by Shihuiyao, Guli, and Jiagedaqi stations. TMPA was excluded due to its limited coverage of 50°S–50°N, which cannot cover the other three basins. Figure 11 shows the NSE of simulated discharge compared to the observed discharge at Kehou, Shihuiyao, Guli, and Jiagedaqi stations during the wet seasons from 2008 to 2019. It can be seen from Figure 11 that the four products performed similarly in the same basin with an NSE of no more than 0.1. The difference in the NSE based on P_obs among various basins was similar to that based on the SPPs, so the difference was mainly caused by the different abilities of the hydrological model to describe hydrologic responses in different basins.
4. Conclusions
This study evaluated seven NRT SPPs with latencies of less than one day, including GSMaP-N, GSMaP-GN, GSMaP-NOW, IMERG-E, IMERG-L, TMPA 3B42RT, and PERSIANN-CCS, for wet seasons from 2008 to 2019 in Nierji Basin, a typical middle–high latitude temperate monsoon climate basin. Gauge-based precipitation and discharge were used as references. The main conclusions based on the findings are as follows:
(1) In the four aspects, the cell-scale and area-scale intercomparison ranks of NRT SPPs are similar; the best SPPs are GSMaP-N, GSMaP-GN, IMERG-E, and IMERG-L, followed by TMPA 3B42RT, and the poorest are GSMaP-NOW and PERSIANN-CCS. Additionally, the performances of SPPs at the areal scale, at the event scale, and with light magnitude are better than those at the cell scale, at the daily scale, and with heavy magnitude, respectively.
(2) The performances of GSMaP-N, GSMaP-GN, IMERG-E, and IMERG-L are similar, especially in the main flood seasons. IMERG-L performs best at the event-cell scale, with a CC of 0.7 and BIAS of 0%, while GSMaP-GN performs best at the event-areal scale, with a CC of 0.91 and BIAS of 5%. The worse performances of TMPA 3B42RT are mainly caused by the poor performances during the main flood seasons. The worse performances of PERSIANN-CCS are mainly reflected by having the lowest CC and the underestimation of precipitation. Although GSMaP-NOW has the highest RMSE and overestimates precipitation, it can reflect the precipitation variation indicated by the relatively high CC.
(3) SPPs are similar in their CC and mainly differ in terms of their RMSE, with the exception of PERSIANN-CCS. SPPs have different characteristics and intercomparison ranks in different flood sub-seasons. The differences between SPPs are more significant in pre-flood seasons but slighter in post-flood seasons; however, the influence of flood sub-seasons on the detection ability of SPPs is slight.
(4) SPPs overestimate light rainfall. GSMaP-NOW overestimates light rainfall most significantly, with a BIAS of 135.7% and 100.67% at the cell scale and areal scale, respectively. SPPs cannot estimate heavy precipitation well. GSMaP-N performs the best, with a CC of 0.34 and RMSE of 9.39 at the areal scale.
(5) In Scheme Ⅰ, the NSE of simulated discharge based on GSMaP-GN was the best, but only 0.25, and NSE based on GSMaP-NOW was the worst (−6.45). After recalibrating the hydrologic model by SPPs, TMPA showed the most significant improvement, with an NSE ranging from −1.54 to 0.54. Additionally, GSMaP-N, GSMaP-GN, IMERG-E, IMERG-L, and TMPA perform well and similarly in terms of recalibration, but the simulated discharge based on the above products differs.
Based on the evaluation and intercomparison of SPP performances, it is suggested that the selected SPPs have different characteristics and should be used after appropriate adjustment to fill the gaps between rain gauges.
Author Contributions
Conceptualization, Y.D.; data curation, C.Z.; formal analysis, Y.D. and L.Y.; funding acquisition, L.Y. and C.Z.; investigation, Y.D.; methodology, Y.D.; resources, L.Y. and H.Z.; supervision, H.Z.; validation, J.Z.; visualization, Y.D. and J.Z.; writing—original draft, Y.D.; writing—review and editing, L.Y. All authors have read and agreed to the published version of the manuscript.
Funding
This research was funded by the National Natural Science Foundation of China, grant number 51925902, the Fundamental Research Funds for the Central Universities, grant number DUT20RC(3)019), the Fund of Innovation Research Team from the Department of Science and Technology in Liaoning Province, grant number XLYC1908023, and the Fund of Innovation Research Team in Dalian University of Technology, grant number DUT19TD31.
Acknowledgments
We acknowledge the contribution of the Ministry of Water Resources of China for providing rain gauge data. We also thank the developers of GSMaP-NRT, GSMaP-Gauge-NRT, GSMaP-NOW, IMERG-Early, IMERG-Late, TMPA 3B42RT, and PERSIANN-CCS.
Conflicts of Interest
The authors declare no conflict of interest.
References
- Sharma, A.; Wasko, C.; Lettenmaier, D.P. If Precipitation Extremes Are Increasing, Why Aren’t Floods? Water Resour. Res. 2018, 54, 8545–8551. [Google Scholar] [CrossRef]
- Ye, L.; Hanson, L.S.; Ding, P.; Wang, D.; Vogel, R.M. The probability distribution of daily precipitation at the point and catchment scales in the United States. Hydrol. Earth Syst. Sci. 2018, 22, 6519–6531. [Google Scholar] [CrossRef] [Green Version]
- Zhang, C.; Chen, X.; Li, Y.; Ding, W.; Fu, G. Water-energy-food nexus: Concepts, questions and methodologies. J. Clean. Prod. 2018, 195, 625–639. [Google Scholar] [CrossRef]
- Yuan, F.; Wang, B.; Shi, C.; Cui, W.; Zhao, C.; Liu, Y.; Ren, L.; Zhang, L.; Zhu, Y.; Chen, T.; et al. Evaluation of hydrological utility of IMERG Final run V05 and TMPA 3B42V7 satellite precipitation products in the Yellow River source region, China. J. Hydrol. 2018, 567, 696–711. [Google Scholar] [CrossRef]
- Arheimer, B.; Lindström, G.; Olsson, J. A systematic review of sensitivities in the Swedish flood-forecasting system. Atmos. Res. 2011, 100, 275–284. [Google Scholar] [CrossRef]
- Liang, Z.; Huang, Y.; Singh, V.P.; Hu, Y.; Li, B.; Wang, J. Multi-source error correction for flood forecasting based on dynamic system response curve method. J. Hydrol. 2021, 594, 125908. [Google Scholar] [CrossRef]
- Tuanjie, H.; Kong, F.; Xunlai, C.; Hengchi, L.; Zhaoxia, H. Evaluation of Radar and Automatic Weather Station Data Assimilation for a Heavy Rainfall Event in Southern China. Adv. Atmos. Sci. 2015, 32, 967–978. [Google Scholar] [CrossRef]
- Zhong, L.; Yang, R.; Wen, Y.; Chen, L.; Gou, Y.; Li, R.; Zhou, Q. Cross-evaluation of re fl ectivity from the space-borne precipitation radar and multi-type ground-based weather radar network in China. Atmos. Res. 2017, 196, 200–210. [Google Scholar] [CrossRef]
- Li, Y.; Grimaldi, S.; Walker, J.; Pauwels, V. Application of Remote Sensing Data to Constrain Operational Rainfall-Driven Flood Forecasting: A Review. Remote Sens. 2016, 8, 456. [Google Scholar] [CrossRef] [Green Version]
- Ebert, E.E.; Janowiak, J.E.; Kidd, C. Comparison of near-real-time precipitation estimates from satellite observations and numerical models. Bull. Am. Meteorol. Soc. 2007, 47–64. [Google Scholar] [CrossRef] [Green Version]
- Sorooshian, S.; Hsu, K.L.; Gao, X.; Gupta, H.V.; Imam, B.; Braithwaite, D. Evaluation of PERSIANN system satellite-based estimates of tropical rainfall. Bull. Am. Meteorol. Soc. 2000, 81, 2035–2046. [Google Scholar] [CrossRef] [Green Version]
- Joyce, R.J.; Janowiak, J.E.; Arkin, P.A.; Xie, P. CMORPH: A method that produces global precipitation estimates from passive microwave and infrared data at high spatial and temporal resolution. J. Hydrometeorol. 2004, 5, 487–503. [Google Scholar] [CrossRef]
- Huffman, G.J.; Bolvin, D.T.; Nelkin, E.J.; Wolff, D.B.; Adler, R.F.; Gu, G.; Hong, Y.; Bowman, K.P.; Stocker, E.F. The TRMM Multisatellite Precipitation Analysis (TMPA): Quasi-Global, Multiyear, Combined-Sensor Precipitation Estimates at Fine Scales. J. Hydrometeorol. 2007, 8, 38–55. [Google Scholar] [CrossRef]
- Huffman, G.J.; Gsfc, N.; Bolvin, D.T.; Braithwaite, D.; Hsu, K.; Joyce, R.; Kidd, C.; Nelkin, E.J.; Sorooshian, S.; Tan, J.; et al. Algorithm Theoretical Basis Document (ATBD) NASA Global Precipitation Measurement (GPM) Integrated Multi-satellitE Retrievals for GPM (IMERG). 2018. Available online: https://gpm.nasa.gov/resources/documents/gpm-integrated-multi-satellite-retrievals-gpm-imerg-algorithm-theoretical-basis- (accessed on 7 February 2018).
- Kubota, T.; Shige, S.; Hashizume, H.; Aonashi, K.; Takahashi, N.; Seto, S.; Hirose, M.; Takayabu, Y.N.; Ushio, T.; Nakagawa, K.; et al. Global Precipitation Map Using Satellite-Borne Microwave Radiometers by the GSMaP Project: Production and Validation. IEEE Trans. Geosci. Remote Sens. 2007, 45, 2259–2275. [Google Scholar] [CrossRef]
- Gebregiorgis, A.S.; Kirstetter, P.E.; Hong, Y.E.; Gourley, J.J.; Huffman, G.J.; Petersen, W.A.; Xue, X.; Schwaller, M.R. To What Extent is the Day 1 GPM IMERG Satellite Precipitation Estimate Improved as Compared to TRMM TMPA-RT? J. Geophys. Res. Atmos. 2018, 123, 1694–1707. [Google Scholar] [CrossRef]
- Kummerow, C.; Barnes, W.; Kozu, T.; Shiue, J.; Simpson, J. The Tropical Rainfall Measuring Mission (TRMM) Sensor Package. J. Atmos. Ocean. Technol. 1998, 15, 809–817. [Google Scholar] [CrossRef]
- Sun, Q.; Miao, C.; Duan, Q.; Ashouri, H.; Sorooshian, S.; Hsu, K.-L. A Review of Global Precipitation Data Sets: Data Sources, Estimation, and Intercomparisons. Rev. Geophys. 2017, 79–107. [Google Scholar] [CrossRef] [Green Version]
- Hou, A.Y.; Kakar, R.K.; Neeck, S.; Azarbarzin, A.A.; Kummerow, C.d.; Kojima, M.; Oki, R.; Nakamura, K.; Iguchi, T. The Global Precipitation Measurement Mission. Bull. Am. Meteorol. Soc. 2014, 95, 701–722. [Google Scholar] [CrossRef]
- Kubota, T.; Yoshida, N.; Urita, S.; Iguchi, T. Evaluation of Precipitation Estimates by at-Launch Codes of GPM/DPR Algorithms Using Synthetic Data from TRMM/PR Observations. IEEE J. Sel. Top. Appl. Earth Obs. Remote Sens. 2014, 7, 3931–3944. [Google Scholar] [CrossRef] [Green Version]
- Le, M.; Chandrasekar, V.; Biswas, S. Evaluation and Validation of GPM Dual-Frequency Classification Module after Launch. Am. Meteorol. Soc. 2016, 33, 2699–2716. [Google Scholar] [CrossRef]
- Tang, G.; Clark, M.P.; Michael, S.; Ma, Z.; Hong, Y.; Tian, Y.; Huffman, G.J.; Adler, R.F.; Tang, L.; Sapiano, M.; et al. Have satellite precipitation products improved over last two decades ? A comprehensive comparison of GPM IMERG with nine satellite and reanalysis datasets. Remote Sens. Environ. 2020, 240, 111697. [Google Scholar] [CrossRef]
- Maggioni, V.; Massari, C. On the performance of satellite precipitation products in riverine flood modeling: A review. J. Hydrol. 2018, 558, 214–224. [Google Scholar] [CrossRef]
- Lu, D.; Yong, B. A preliminary assessment of the gauge-adjusted near-real-time GSMaP precipitation estimate over Mainland China. Remote Sens. 2020, 12, 141. [Google Scholar] [CrossRef] [Green Version]
- Zhao, H.; Yang, B.; Yang, S.; Huang, Y.; Dong, G.; Bai, J.; Wang, Z. Systematical estimation of GPM-based global satellite mapping of precipitation products over China. Atmos. Res. 2018, 201, 206–217. [Google Scholar] [CrossRef]
- Chen, H.; Yong, B.; Shen, Y.; Liu, J.; Hong, Y.; Zhang, J. Comparison analysis of six purely satellite-derived global precipitation estimates. J. Hydrol. 2020, 581, 124376. [Google Scholar] [CrossRef]
- Stampoulis, D.; Anagnostou, E.N. Evaluation of Global Satellite Rainfall Products over Continental Europe. J. Hydrometeorol. 2011, 13, 588–603. [Google Scholar] [CrossRef]
- Navarro, A.; García-Ortega, E.; Merino, A.; Sánchez, J.L.; Kummerow, C.; Tapiador, F.J. Assessment of IMERG precipitation estimates over Europe. Remote Sens. 2019, 11, 2470. [Google Scholar] [CrossRef] [Green Version]
- Palharini, R.S.A.; Vila, D.A.; Rodrigues, D.T.; Quispe, D.P.; Palharini, R.C.; de Siqueira, R.A.; de Sousa Afonso, J.M. Assessment of the Extreme Precipitation by Satellite Estimates over South America. Remote Sens. 2020, 12, 2085. [Google Scholar] [CrossRef]
- Arshad, M.; Ma, X.; Yin, J.; Ullah, W.; Ali, G.; Ullah, S.; Liu, M.; Shahzaman, M.; Ullah, I. Evaluation of GPM-IMERG and TRMM-3B42 precipitation products over Pakistan. Atmos. Res. 2021, 249, 105341. [Google Scholar] [CrossRef]
- Mahmoud, M.T.; Hamouda, M.A.; Mohamed, M.M. Spatiotemporal evaluation of the GPM satellite precipitation products over the United Arab Emirates. Atmos. Res. 2019, 219, 200–212. [Google Scholar] [CrossRef]
- Llauca, H.; Lavado-Casimiro, W.; León, K.; Jimenez, J.; Traverso, K.; Rau, P. Assessing Near Real-Time Satellite Precipitation Products for Flood Simulations at Sub-Daily Scales in a Sparsely Gauged Watershed in Peruvian Andes. Remote Sens. 2021, 13, 826. [Google Scholar] [CrossRef]
- Noor, M.; Ismail, T.; Shahid, S.; Asaduzzaman, M.; Dewan, A. Evaluating intensity-duration-frequency (IDF) curves of satellite-based precipitation datasets in Peninsular Malaysia. Atmos. Res. 2021, 248, 105203. [Google Scholar] [CrossRef]
- Shi, J.; Yuan, F.; Shi, C.; Zhao, C.; Zhang, L.; Ren, L.; Zhu, Y.; Jiang, S.; Liu, Y. Statistical Evaluation of the Latest GPM-Era IMERG and GSMaP Satellite Precipitation Products in the Yellow River Source Region. Water 2020, 12, 1006. [Google Scholar] [CrossRef] [Green Version]
- Mastrantonas, N.; Bhattacharya, B.; Shibuo, Y.; Rasmy, M.; Espinoza-DÁVALOS, G.; Solomatine, D. Evaluating the Benefits of Merging Near-Real-Time Satellite Precipitation Products: A Case Study in the Kinu Basin Region, Japan. J. Hydrometeorol. 2019, 1213–1233. [Google Scholar] [CrossRef]
- Omranian, E.; Sharif, H.O. Evaluation of the Global Precipitation Measurement (GPM) Satellite Rainfall Products over the Lower Colorado River Basin, Texas. J. Am. Water Resour. Assoc. 2018, 54, 882–898. [Google Scholar] [CrossRef]
- Belabid, N.; Zhao, F.; Brocca, L.; Huang, Y.; Tan, Y. Near-real-time flood forecasting based on satellite precipitation products. Remote Sens. 2019, 11, 252. [Google Scholar] [CrossRef] [Green Version]
- Yuan, F.; Zhang, L.; Soe, K.; Ren, L.; Zhao, C.; Zhu, Y.; Jiang, S.; Liu, Y. Applications of TRMM- and GPM-Era Multiple-Satellite Precipitation Products for Flood Simulations at Sub-Daily Scales in a Sparsely Gauged Watershed in Myanmar. Remote Sens. 2019, 11, 140. [Google Scholar] [CrossRef] [Green Version]
- Li, Z.; Tang, G.; Hong, Z.; Chen, M.; Gao, S.; Kirstetter, P.; Gourley, J.J.; Wen, Y.; Yami, T.; Nabih, S.; et al. Two-decades of GPM IMERG early and final run products intercomparison: Similarity and difference in climatology, rates, and extremes. J. Hydrol. 2021, 594, 125975. [Google Scholar] [CrossRef]
- Wang, H.; Wang, L.; He, J.; Ge, F.; Chen, Q.; Tang, S.; Yao, S. Can the GPM IMERG Hourly Products Replicate the Variation in Precipitation During the Wet Season Over the Sichuan Basin, China? Earth Sp. Sci. 2020, 7, e2020EA001090. [Google Scholar] [CrossRef] [Green Version]
- Chen, S.; Hu, J.; Zhang, A.; Min, C.; Huang, C.; Liang, Z. Performance of near real-time Global Satellite Mapping of Precipitation estimates during heavy precipitation events over northern China. Theor. Appl. Climatol. 2019, 135, 877–891. [Google Scholar] [CrossRef]
- Priyambodoho, B.A.; Kure, S.; Yagi, R.; Januriyadi, N.F. Flood inundation simulations based on GSMaP satellite rainfall data in Jakarta, Indonesia. Prog. Earth Planet. Sci. 2021, 8, 34. [Google Scholar] [CrossRef]
- Falanga Bolognesi, S.; Pasolli, E.; Belfiore, O.; De Michele, C.; D’Urso, G. Harmonized Landsat 8 and Sentinel-2 Time Series Data to Detect Irrigated Areas: An Application in Southern Italy. Remote Sens. 2020, 12, 1275. [Google Scholar] [CrossRef] [Green Version]
- de Carvalho, M.Â.C.C.; Uliana, E.M.; da Silva, D.D.; Aires, U.R.V.; Martins, C.A.d.S.; de Sousa Junior, M.F.; da Cruz, I.F.; Mendes, M.A.d.S.A. Drought Monitoring Based on Remote Sensing in a Grain-Producing Region in the Cerrado–Amazon Transition, Brazil. Water 2020, 12, 3366. [Google Scholar] [CrossRef]
- Suliman, A.H.A.; Awchi, T.A.; Al-Mola, M.; Shahid, S. Evaluation of remotely sensed precipitation sources for drought assessment in Semi-Arid Iraq. Atmos. Res. 2020, 242, 105007. [Google Scholar] [CrossRef]
- Getirana, A.; Kirschbaum, D.; Mandarino, F.; Ottoni, M.; Khan, S.; Arsenault, K. Potential of GPM IMERG Precipitation Estimates to Monitor Natural Disaster Triggers in Urban Areas: The Case of Rio de Janeiro, Brazil. Remote Sens. 2020, 12, 4095. [Google Scholar] [CrossRef]
- Huang, W.; Liu, P.; Hsu, J.; Li, X.; Deng, L. Assessment of Near-Real-Time Satellite Precipitation Products from GSMaP in Monitoring Rainfall Variations over Taiwan. Remote Sens. 2021, 13, 202. [Google Scholar] [CrossRef]
- Ding, W.; Zhang, C.; Cai, X.; Li, Y.; Zhou, H. Multiobjective hedging rules for flood water conservation. Water Resour. Res. 2017, 53, 1963–1981. [Google Scholar] [CrossRef]
- Jiang, H.; Wang, Z.; Ye, A.; Liu, K.; Wang, X.; Wang, L. Hydrological characteristic-based methodology for dividing flood seasons: An empirical analysis from China. Environ. Earth Sci. 2019, 78, 1–9. [Google Scholar] [CrossRef]
- Liu, P.; Guo, S.; Xiong, L.; Chen, L. Flood season segmentation based on the probability change-point analysis technique. Hydrol. Sci. J. 2010, 55, 540–554. [Google Scholar] [CrossRef]
- Wei, G.; Tych, W.; Beven, K.; He, B.; Ning, F.; Zhou, H. Nierji reservoir flood forecasting based on a Data-Based Mechanistic methodology. J. Hydrol. 2018, 567, 227–237. [Google Scholar] [CrossRef] [Green Version]
- Hong, Y.; Hsu, K.-L.; Sorooshian, S.; Gao, X. Precipitation Estimation from Remotely Sensed Imagery Using an Artificial Neural Network Cloud Classification System. J. Appl. Meteorol. 2004, 43, 1834–1853. [Google Scholar] [CrossRef] [Green Version]
- Kubota, T.; Aonashi, K.; Ushio, T.; Shige, S.; Takayabu, Y.N.; Kachi, M.; Arai, Y.; Tashima, T.; Masaki, T.; Kawamoto, N.; et al. Global Satellite Mapping of Precipitation (GSMaP) Products in the GPM Era. Satell. Precip. Meas. 2020, 1, 355–373. [Google Scholar]
- Huffman, G.J.; Bolvin, D.T.; Braithwaite, D.; Hsu, K.; Joyce, R.J.; Kidd, C. Satellite Precipitation Measurement; Levizzani, V., Kidd, C., Kirschbaum, D.B., Kummerow, C.D., Nakamura, K., Turk, F.J., Eds.; Springer Nature Switzerland AG: Cham, Switzerland, 2020; Volume 67. [Google Scholar]
- Zhu, Z.; Yong, B.; Ke, L.; Wang, G.; Ren, L.; Chen, X. Tracing the Error Sources of Global Satellite Mapping of Precipitation for GPM (GPM-GSMaP) Over the Tibetan Plateau, China. IEEE J. Sel. Top. Appl. Earth Obs. Remote Sens. 2018, 11, 2181–2191. [Google Scholar] [CrossRef]
- Duan, Z.; Liu, J.; Tuo, Y.; Chiogna, G.; Disse, M. Evaluation of eight high spatial resolution gridded precipitation products in Adige Basin (Italy) at multiple temporal and spatial scales. Sci. Total Environ. 2016, 573, 1536–1553. [Google Scholar] [CrossRef] [PubMed] [Green Version]
- Huffman, G.J.; Bolvin, D.T.; Nelkin, E.J. Integrated Multi-satellitE Retrievals for GPM (IMERG) Technical Documentation. NASA/GSFC Code 2015, 612, 2019. [Google Scholar]
- Huffman, G.J.; Bolvin, D.T.; Nelkin, E.J.; Stocker, E.F.; Tan, J. V05 IMERG Final Run Release Notes; NASA Goddard Earth Sciences Data and Information Services Center: Greenbelt, MD, USA, 2018; pp. 1–8. [Google Scholar]
- Rodda, J.C. Guide to Hydrological Practices. Hydrol. Sci. J. 2011, 56, 196–197. [Google Scholar] [CrossRef]
- Li, M.; Shao, Q. An improved statistical approach to merge satellite rainfall estimates and raingauge data. J. Hydrol. 2010, 385, 51–64. [Google Scholar] [CrossRef]
- Wu, L.; Xu, Y.; Wang, S. Comparison of TMPA-3B42RT Legacy Product and the Equivalent IMERG Products over Mainland China. Remote Sens. 2018, 10, 1778. [Google Scholar] [CrossRef] [Green Version]
- Zhao, R. The Xinanjiang model applied in China. J. Hydrol. 1992, 135, 371–381. [Google Scholar] [CrossRef]
Figure 1.
The map of the Nierji Basin and its sub-basins in the upstream named (1) Kehou, (2) Shihuiyao, (3) Guli, and (4) Jiagedaqi. Each sub-basin is controlled by the station with the corresponding name.
Figure 1.
The map of the Nierji Basin and its sub-basins in the upstream named (1) Kehou, (2) Shihuiyao, (3) Guli, and (4) Jiagedaqi. Each sub-basin is controlled by the station with the corresponding name.

Figure 2.
Flow chart of the technical framework for evaluating NRT SPPs.

Figure 3.
The areal weighting method to obtain the precipitation in the grid cell at the station location, where S indicates the station, indicate the four adjacent SPPs cells to S, and indicate the areas of intersection between and the window cell (within the blue dotted dashed line).
Figure 3.
The areal weighting method to obtain the precipitation in the grid cell at the station location, where S indicates the station, indicate the four adjacent SPPs cells to S, and indicate the areas of intersection between and the window cell (within the blue dotted dashed line).

Figure 4.
Taylor diagrams at cell scale and areal scale for different flood sub-seasons.

Figure 5.
Heat map of CSI at the cell scale and areal scale for different flood sub-seasons and thresholds.
Figure 5.
Heat map of CSI at the cell scale and areal scale for different flood sub-seasons and thresholds.

Figure 6.
Bar graph of BIAS at cell scale and areal scale for different precipitation intensities.

Figure 7.
Heat map of CC and RMSE at the cell scale and the areal scale for different precipitation intensities, where L, M, and H indicate light precipitation, moderate precipitation, and heavy precipitation, respectively.
Figure 7.
Heat map of CC and RMSE at the cell scale and the areal scale for different precipitation intensities, where L, M, and H indicate light precipitation, moderate precipitation, and heavy precipitation, respectively.

Figure 8.
Heat map of CC and BIAS at the cell scale and areal scale for rainfall events and daily rainfall when rainfall exceeds 0.1 mm/day.
Figure 8.
Heat map of CC and BIAS at the cell scale and areal scale for rainfall events and daily rainfall when rainfall exceeds 0.1 mm/day.

Figure 9.
NSE of simulated daily discharge at Kehou station during wet seasons from 2008 to 2019 for Scheme Ⅰ, Scheme Ⅱ, and using gauge-based precipitation.
Figure 9.
NSE of simulated daily discharge at Kehou station during wet seasons from 2008 to 2019 for Scheme Ⅰ, Scheme Ⅱ, and using gauge-based precipitation.

Figure 10.
Two comparison schemes of the observed and simulated daily discharge at Kehou station during the wet seasons from 2017 to 2019.
Figure 10.
Two comparison schemes of the observed and simulated daily discharge at Kehou station during the wet seasons from 2017 to 2019.

Figure 11.
NSE of simulated daily discharge at Kehou, Shihuiyao, Guli, and Jiagedaqi stations during wet seasons from 2008 to 2019, calibrated by inputting gauge-based precipitation, GSMaP-N, GSMaP-GN, IMERG-E, and IMERG-L.
Figure 11.
NSE of simulated daily discharge at Kehou, Shihuiyao, Guli, and Jiagedaqi stations during wet seasons from 2008 to 2019, calibrated by inputting gauge-based precipitation, GSMaP-N, GSMaP-GN, IMERG-E, and IMERG-L.


Table 1.
Overview of the SPPs evaluated in this paper.
| Datasets | Spatial Resolution | Coverage | Evaluation Period | Latency | Developer |
|---|---|---|---|---|---|
| Gauge-observed | Point | Nierji Basin | 2008–2019 | - | MWR |
| GSMaP-NRT | 0.1° | 60°S to 60°N | 2008–2019 | 4 h | JAXA |
| GSMaP-Gauge-NRT | 0.1° | 60°S to 60°N | 2008–2019 | 4 h | JAXA |
| IMERG-Early | 0.1° | 90°S to 90°N | 2008–2019 | 4 h | NASA |
| IMERG-Late | 0.1° | 90°S to 90°N | 2008–2019 | 12 h | NASA |
| PERSIANN-CCS | 0.04° | 60°S to 60°N | 2008–2019 | <1 h | UCI |
| GSMaP-NOW | 0.1° | 60°S to 60°N | 2017–2019 | <1 h | JAXA |
| TMPA 3B42RT V7 | 0.25° | 50°S to 50°N | 2008–2019 | 8 h | NASA |
Table 2.
List of diagnostic metrics for evaluating SPPs.
| Diagnostic Metrics | Equation | Perfect Value | Unit |
|---|---|---|---|
| Root-mean-square error (RMSE) | 0 | mm | |
| Pearson Correlation Coefficient (CC) | 1 | - | |
| Relative bias (BIAS) | 0 | % | |
| Critical success index (CSI) | 1 | - | |
| Nash–Sutcliffe efficiency coefficient (NSE) | 1 | - |
Notation: represents satellite-based precipitation products, represents gauge-based precipitation, H represents the number of hit events for which both and detect precipitation above the threshold, M represents the number of missed events for which detects precipitation above the threshold but does not, F represents the number of false alarms, which is inverse to M, represents the simulated discharge by any precipitation input, and represents the observed discharge.
Publisher’s Note: MDPI stays neutral with regard to jurisdictional claims in published maps and institutional affiliations. |
© 2021 by the authors. Licensee MDPI, Basel, Switzerland. This article is an open access article distributed under the terms and conditions of the Creative Commons Attribution (CC BY) license (https://creativecommons.org/licenses/by/4.0/).
Share and Cite
MDPI and ACS Style
Dou, Y.; Ye, L.; Zhang, J.; Zhang, C.; Zhou, H. Evaluation of Seven Near-Real-Time Satellite-Based Precipitation Products for Wet Seasons in the Nierji Basin, China. Remote Sens. 2021, 13, 4552. https://doi.org/10.3390/rs13224552
AMA Style
Dou Y, Ye L, Zhang J, Zhang C, Zhou H. Evaluation of Seven Near-Real-Time Satellite-Based Precipitation Products for Wet Seasons in the Nierji Basin, China. Remote Sensing. 2021; 13(22):4552. https://doi.org/10.3390/rs13224552
Chicago/Turabian StyleDou, Yanhong, Lei Ye, Jiayan Zhang, Chi Zhang, and Huicheng Zhou. 2021. "Evaluation of Seven Near-Real-Time Satellite-Based Precipitation Products for Wet Seasons in the Nierji Basin, China" Remote Sensing 13, no. 22: 4552. https://doi.org/10.3390/rs13224552
Note that from the first issue of 2016, this journal uses article numbers instead of page numbers. See further details here.