1. Introduction
The roughness and moisture of bare agriculture soil are key parameters that influence backscattering signatures measured by the Sentinel-1 at a frequency of 5.4 GHz at a fixed viewing angle. Soil moisture retrieved using the well-known Oh, Dubois, and integral equation (IEM) backscattering models, as a rule, lead to a significant mismatch compared to soil moisture values, measured at the sub-satellite test sites [
1,
2]. For bare soil, the main reason for this is the multi-scale spatial variety of the heights of soil surface roughness, which changes dynamically with time. According to [
3], the standard deviation, the correlation length, and the autocorrelation function of the heights of soil surface roughness depend not only on roughness but also on the size of the data collection profile (0.5–25 m). This fact leads to the practical inexpediency of the ground-based measurements of soil surface roughness statistical characteristics as input parameters of existing scattering models and the development on their basis of global multi-scale radar remote sensing soil moisture algorithms. However, to take into account the specific local characteristics of soil surface roughness in articles [
4,
5], correlation length was proposed to calibrate depending on the root mean square (RMS) heights of soil surface roughness and viewing angles. Such calibrated models are widely used for training artificial neural networks (NNs) [
6,
7,
8]. The trained NN on physical-based scattering models [
6,
7,
8] is more adaptive compared to simply training the NN with Sentinel-1 backscattering and ancillary soil moisture values [
9,
10,
11,
12].
In this paper, the relationship between the cross-polarized ratio, reflectivity, and the soil surface roughness, established in [
13], was proposed to use as a basis for the soil moisture retrieval algorithm from Sentinel-1 radar data. Compared to IEM, Advanced IEM, and Dubois models, the Oh model [
13] shows the best fitting between its predictions and representative experimental radar dataset over bare soils [
1]. In contrast to existing physical-based approaches [
6,
7], in this paper, the well-known linear relationship between root-mean-square (RMS) heights of soil surface roughness and scattering anisotropy [
14,
15,
16,
17] was used to predict soil reflectivity based on NN and Oh models [
13]. As a result, only satellite data and in situ soil moisture values on the key test site were needed to calibrate the NN, but the ground measurements of soil surface roughness could be excluded. It should be noted that the linear relationship between RMS heights of soil surface roughness and scattering anisotropy was observed over a wide frequency range [
17] from 1.5 to 18 GHz, which include C-band radar of Sentinel-1.
2. Test Site, Remote Sensing, and In Situ Data
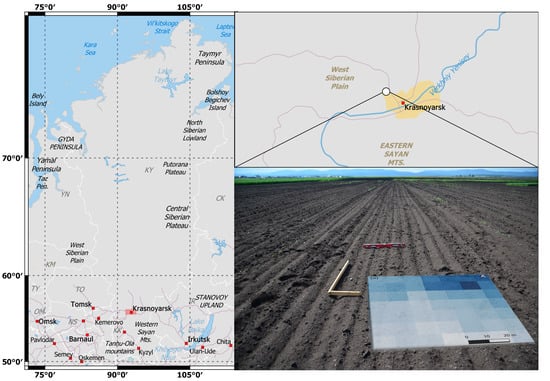
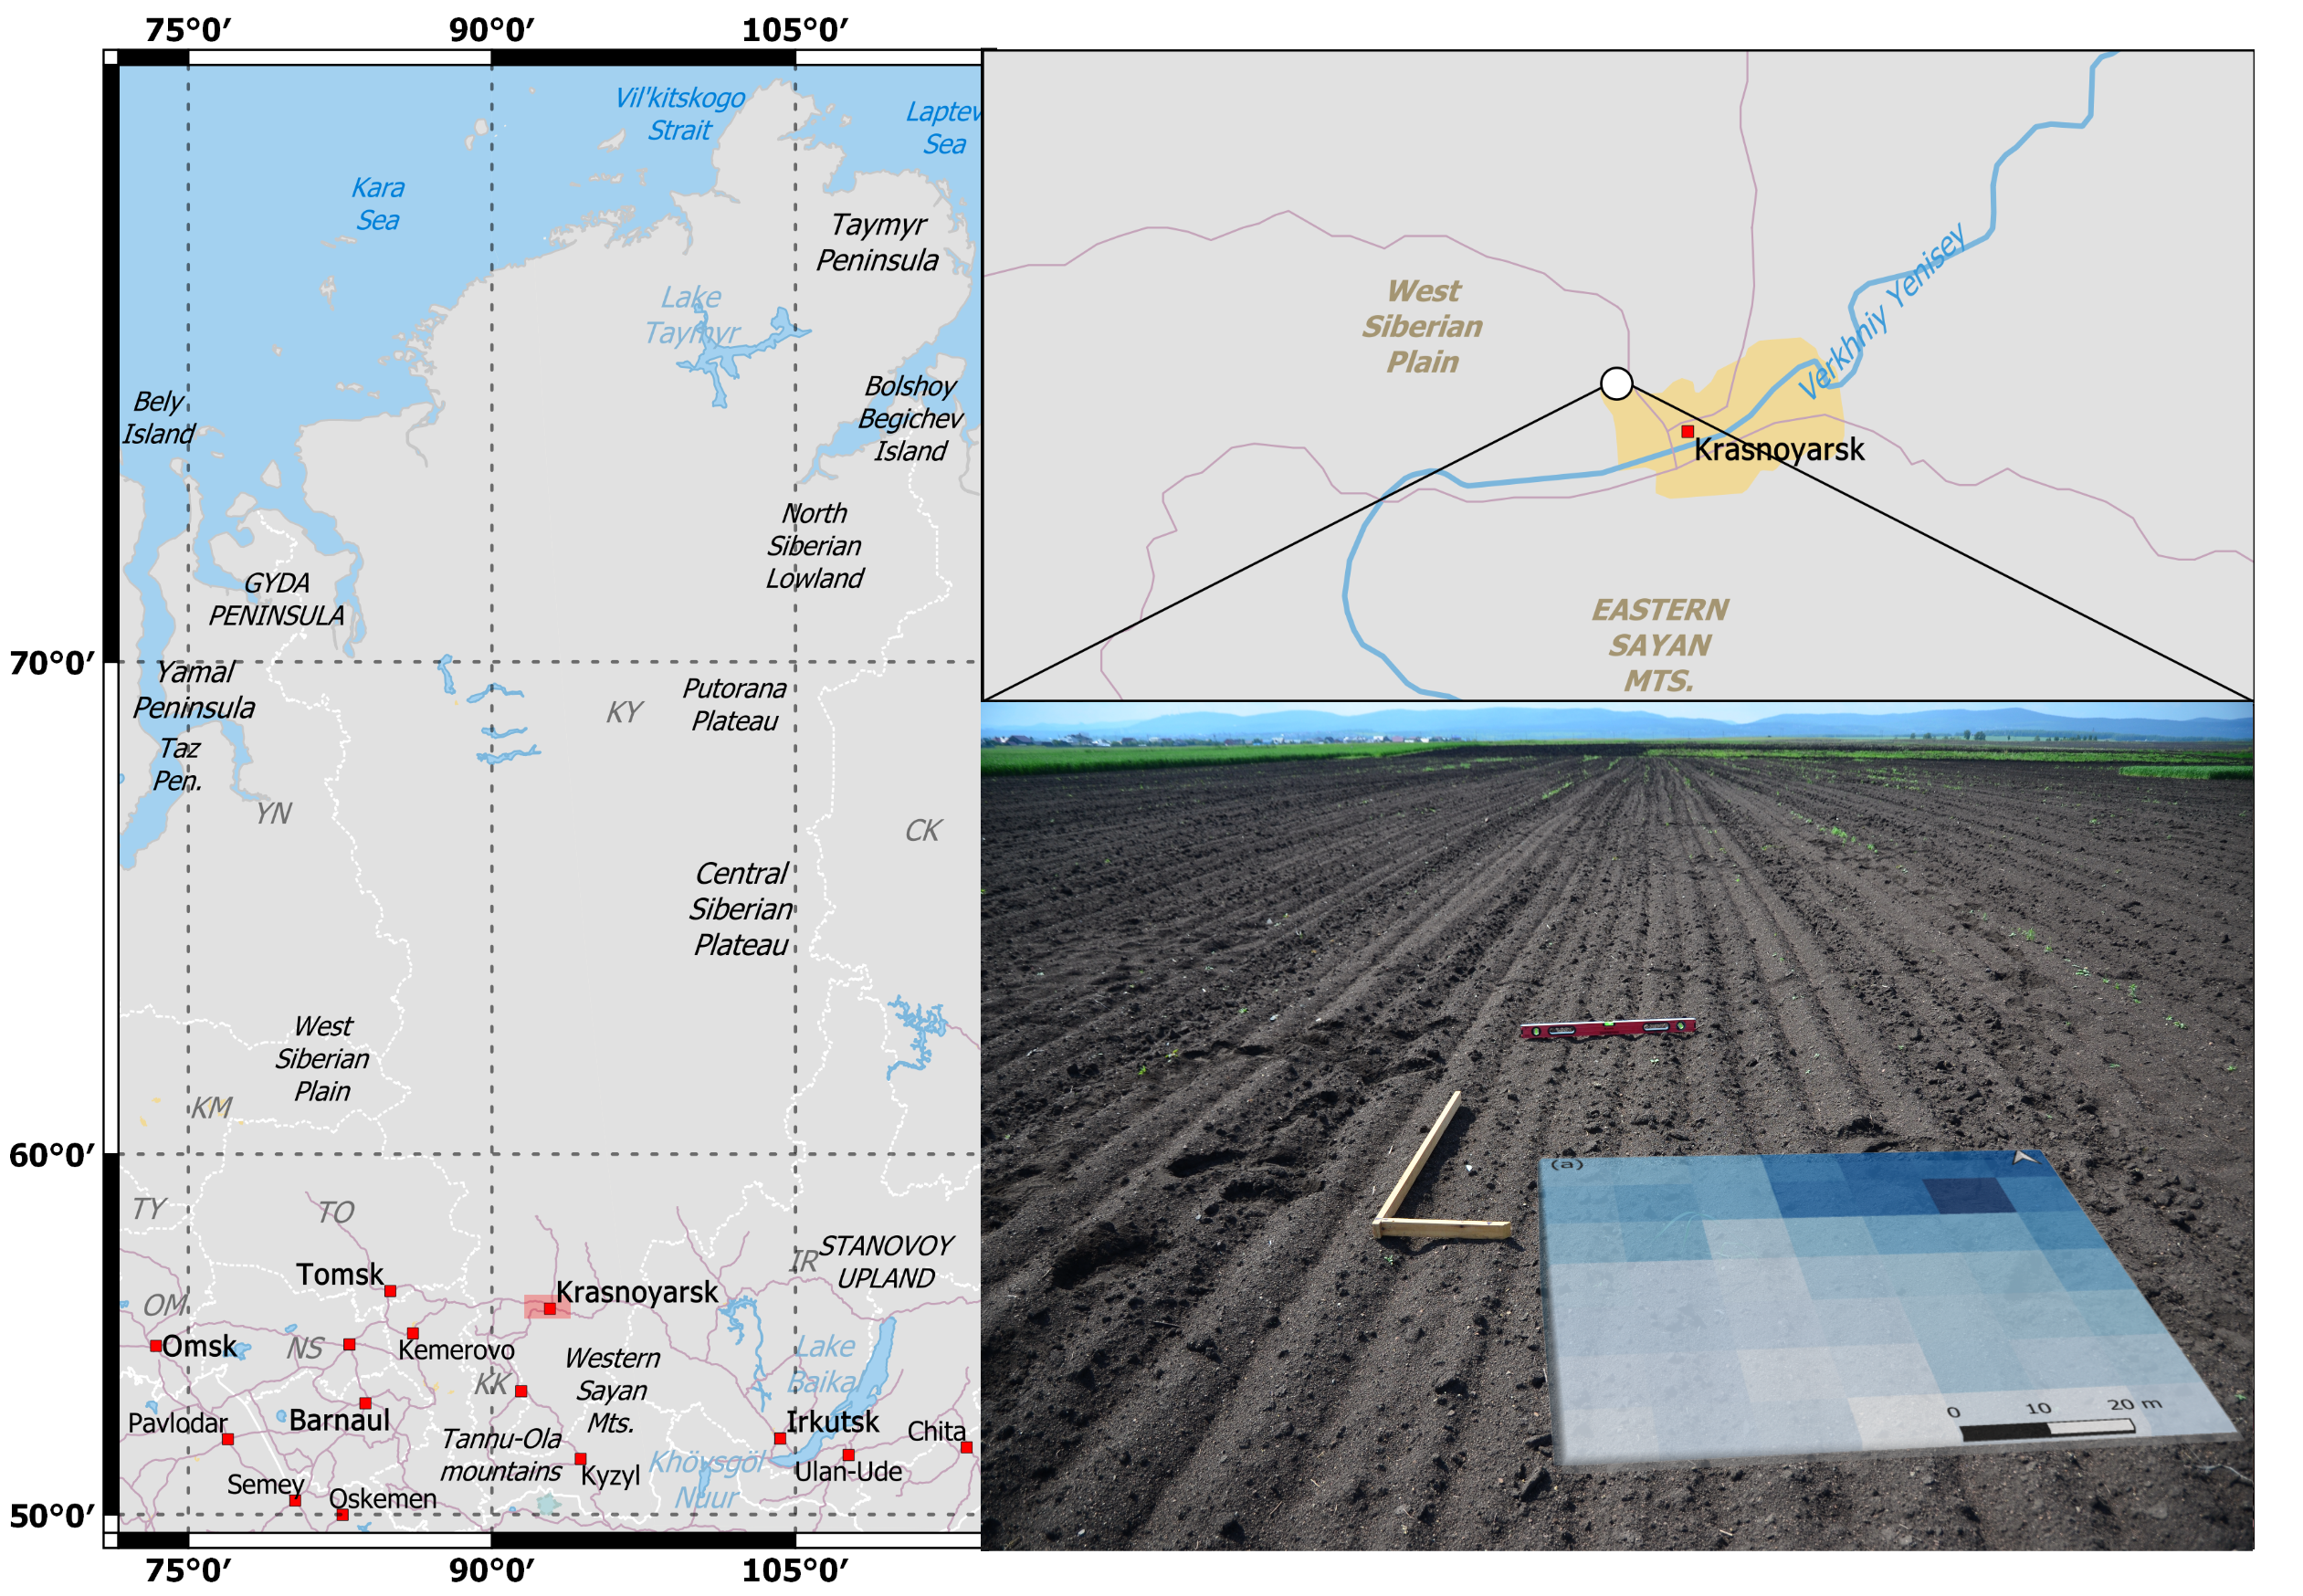
The fallow agricultural field of 100 × 100 m, located near the Minino village, Krasnoyarsk region, the Russian Federation was chosen as a test site (
Figure 1).
The center of the agriculture field locates in coordinate (56.0865°N, 92.6772°E). In days of Sentinel-1B passage (from 21 May to 25 August of 2020 every twelve days) soil moisture was measured in the 0.00–0.05-m top layer at 23–27 small local plots (~8–10 × 8–10 m) evenly scattered within the agricultural field and separated from each other by a distance of ~10–12 m. Soil moisture was measured in 40–80 separate points evenly distributed in each small local plots. After that, they were averaged. As a result, for each day of Sentinel-1B observations, sets of geospatial soil moisture data were obtained for 23–27 small local plots within the agricultural field. The center of each small local plot was assigned a GPS coordinate. Volumetric soil moisture was measured by EC-5 sensor (Decagon, Pullman, WA, USA). The sensor was vertically immersed into the soil to the length of the entire rods (0.05 m). The sensor was equipped with a NEO-M8N GPS receiver providing positioning in the horizontal plane with an error of ~2 m. The sensor was calibrated in laboratory conditions using soil samples collected on the test field. After calibration, RMS error (RMSE) of volumetric soil moisture measurements by EC-5 did not exceed 2% (with determination coefficient
R2 = 0.99) in the soil moisture range from 6 to 50%. (High moisture values were obtained with additional moisturized of soil samples). The soil cover of the agriculture field is represented by the Haplic Chernozems soils [
18]. Average dry bulk density and clay content in the topsoil thickness of about 0.05 m were 0.93–1.16·10
3 kg m
−3 and about 26% (by weight), respectively.
The Sentinel-1B radar data were available in interferometric wide (IW) swath mode (10-m special resolution) on vertical–vertical (VV) and vertical–horizontal (VH) polarizations. Single look complex (SLC) and ground range-detected (GRD) images were processed by the European Space Agency (ESA) Sentinel Application Platform (SNAP). Standard processing of the Sentinel-1 radar data consisted of: precision orbits applied, calibration, and speckle noise filtering (Gamma map filter with a window size of 3 × 3 pixels), range-Doppler terrain correction (SRTM 1Sec HGT). As a result, for the agriculture field, spatial maps of backscattering coefficients
,
, alpha angle, scattering anisotropy
A, and entropy
H [
14] were obtained. The incidence angle of wave was about 37°. Due to the mismatch between the coordinates of Sentinel-1B pixels and small local plots, the backscattering coefficients corresponding to the center of each small local plots were calculated using the spatial linear interpolation of Sentinel-1B image. As a result, from 21 May to 25 August 2020, the total amount of joint observations data of backscattering coefficients and soil moisture was 159.
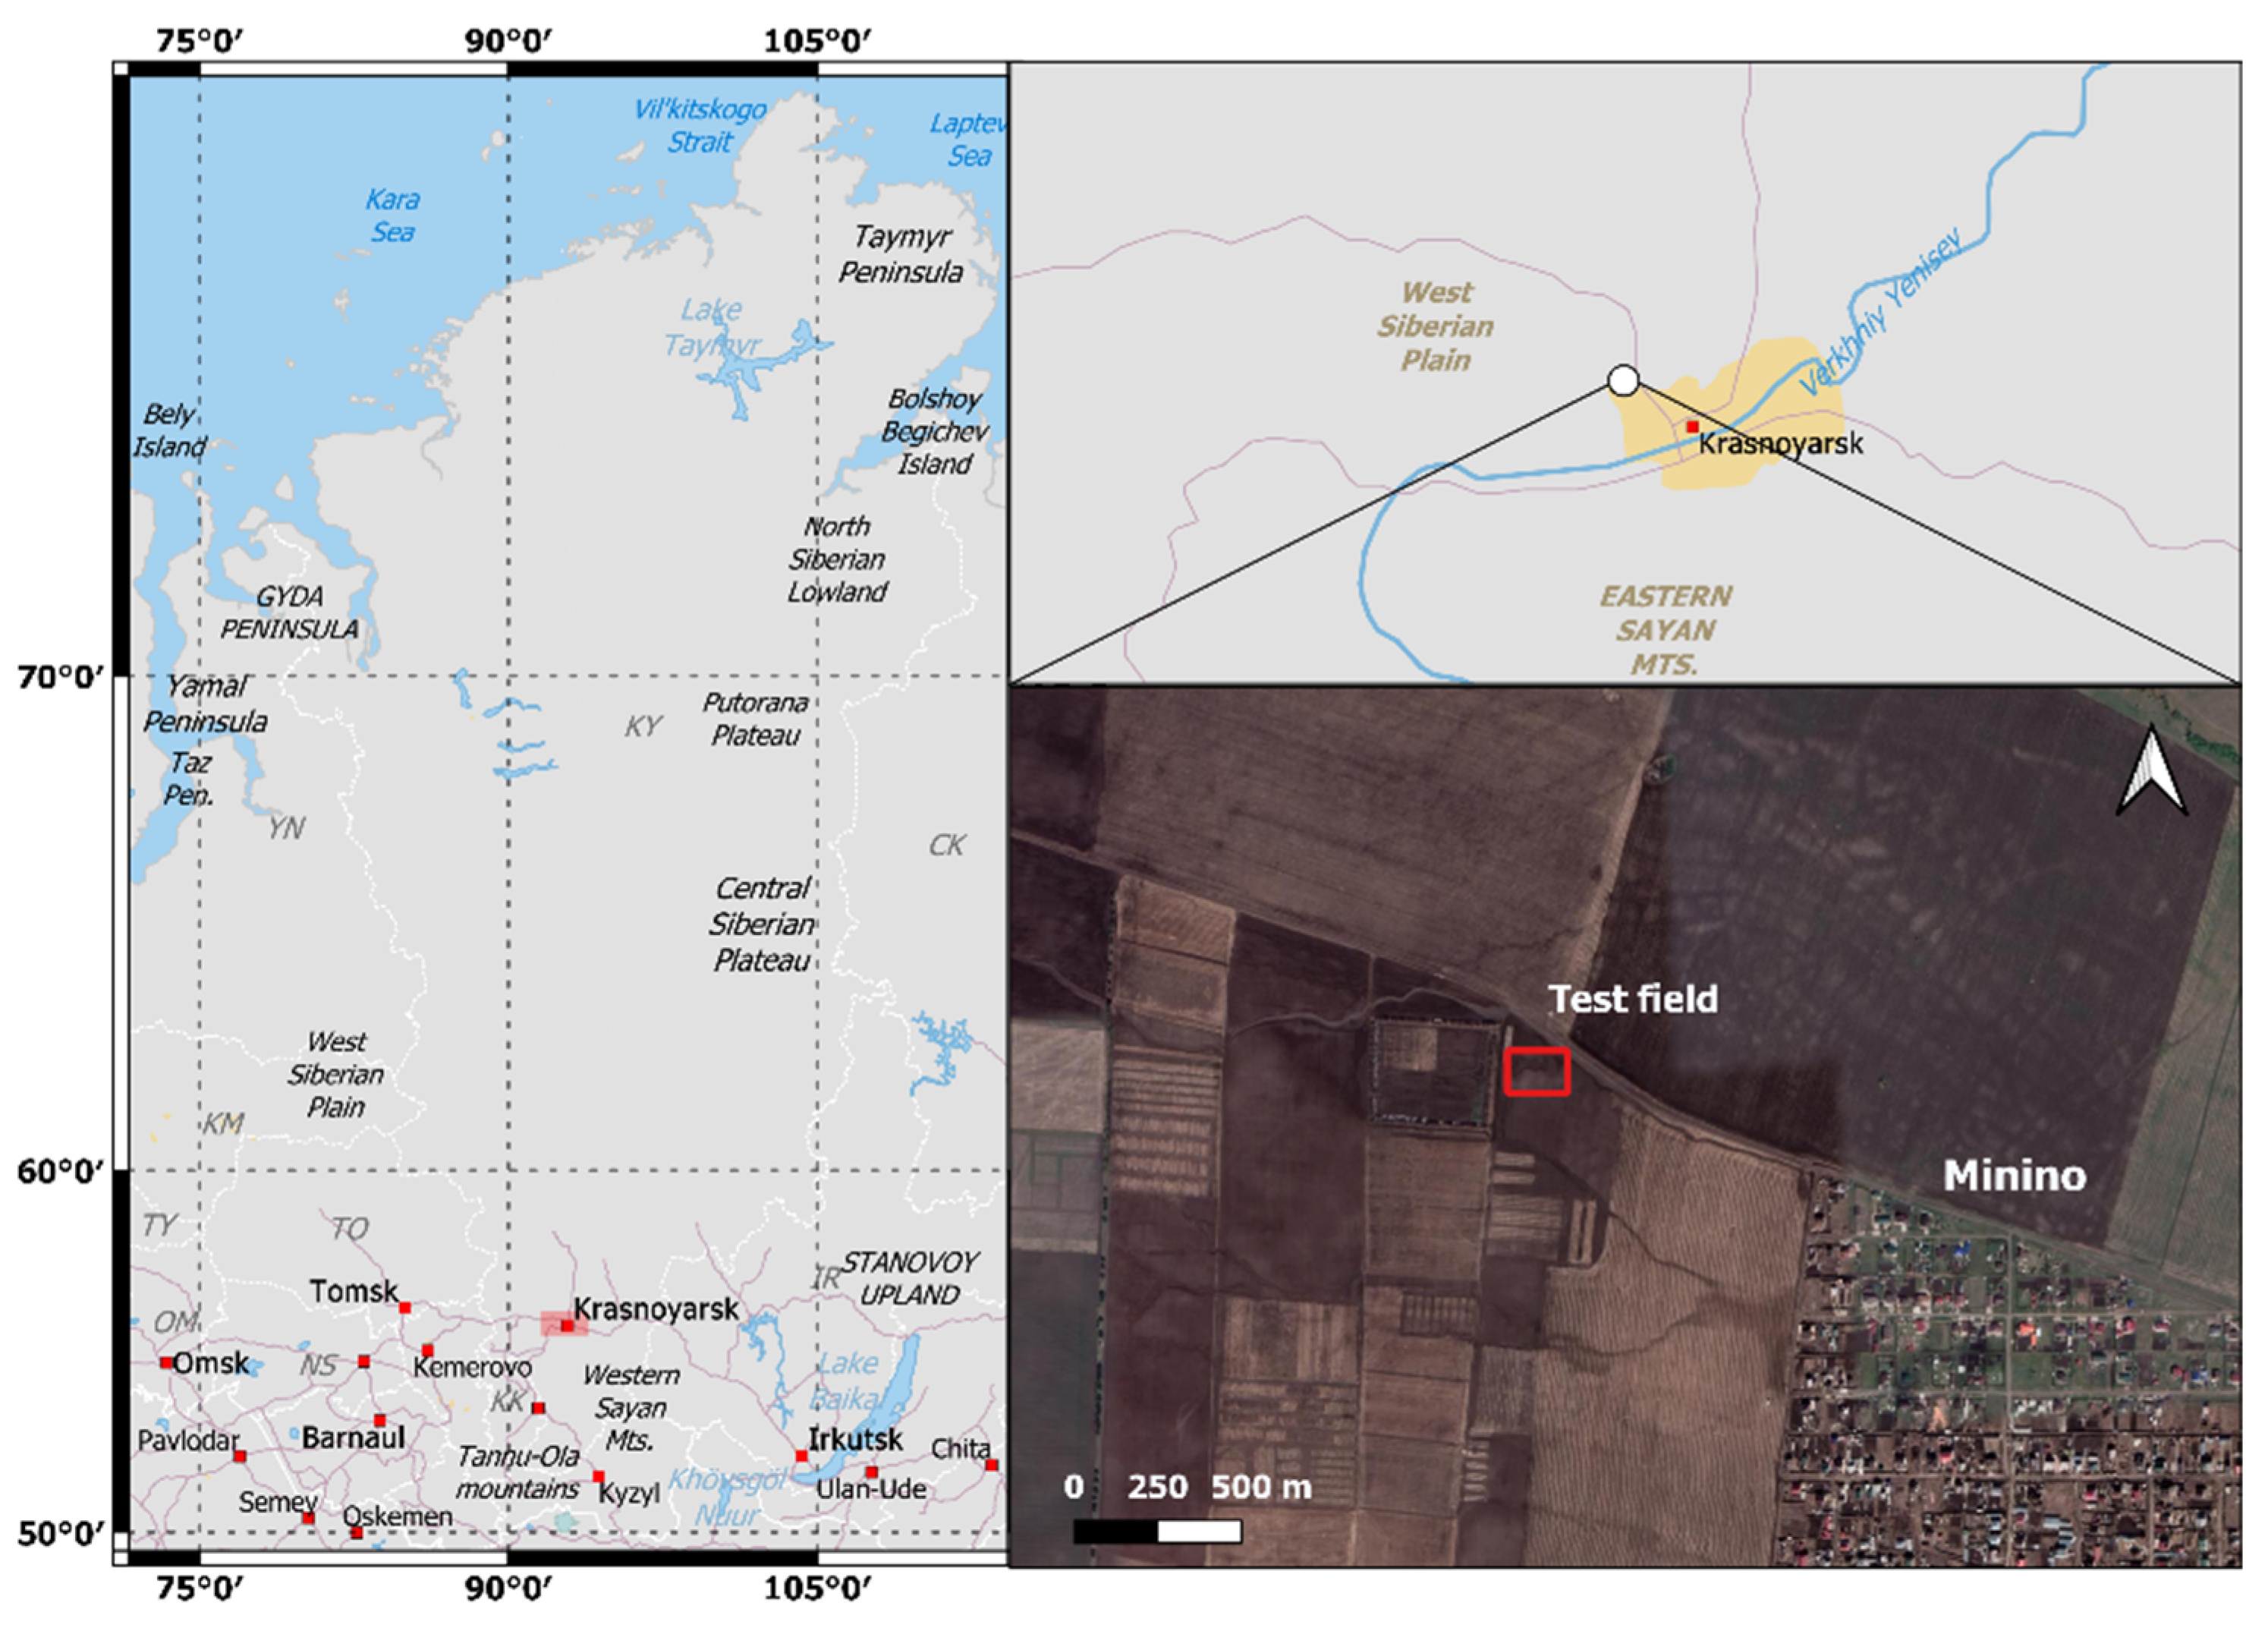
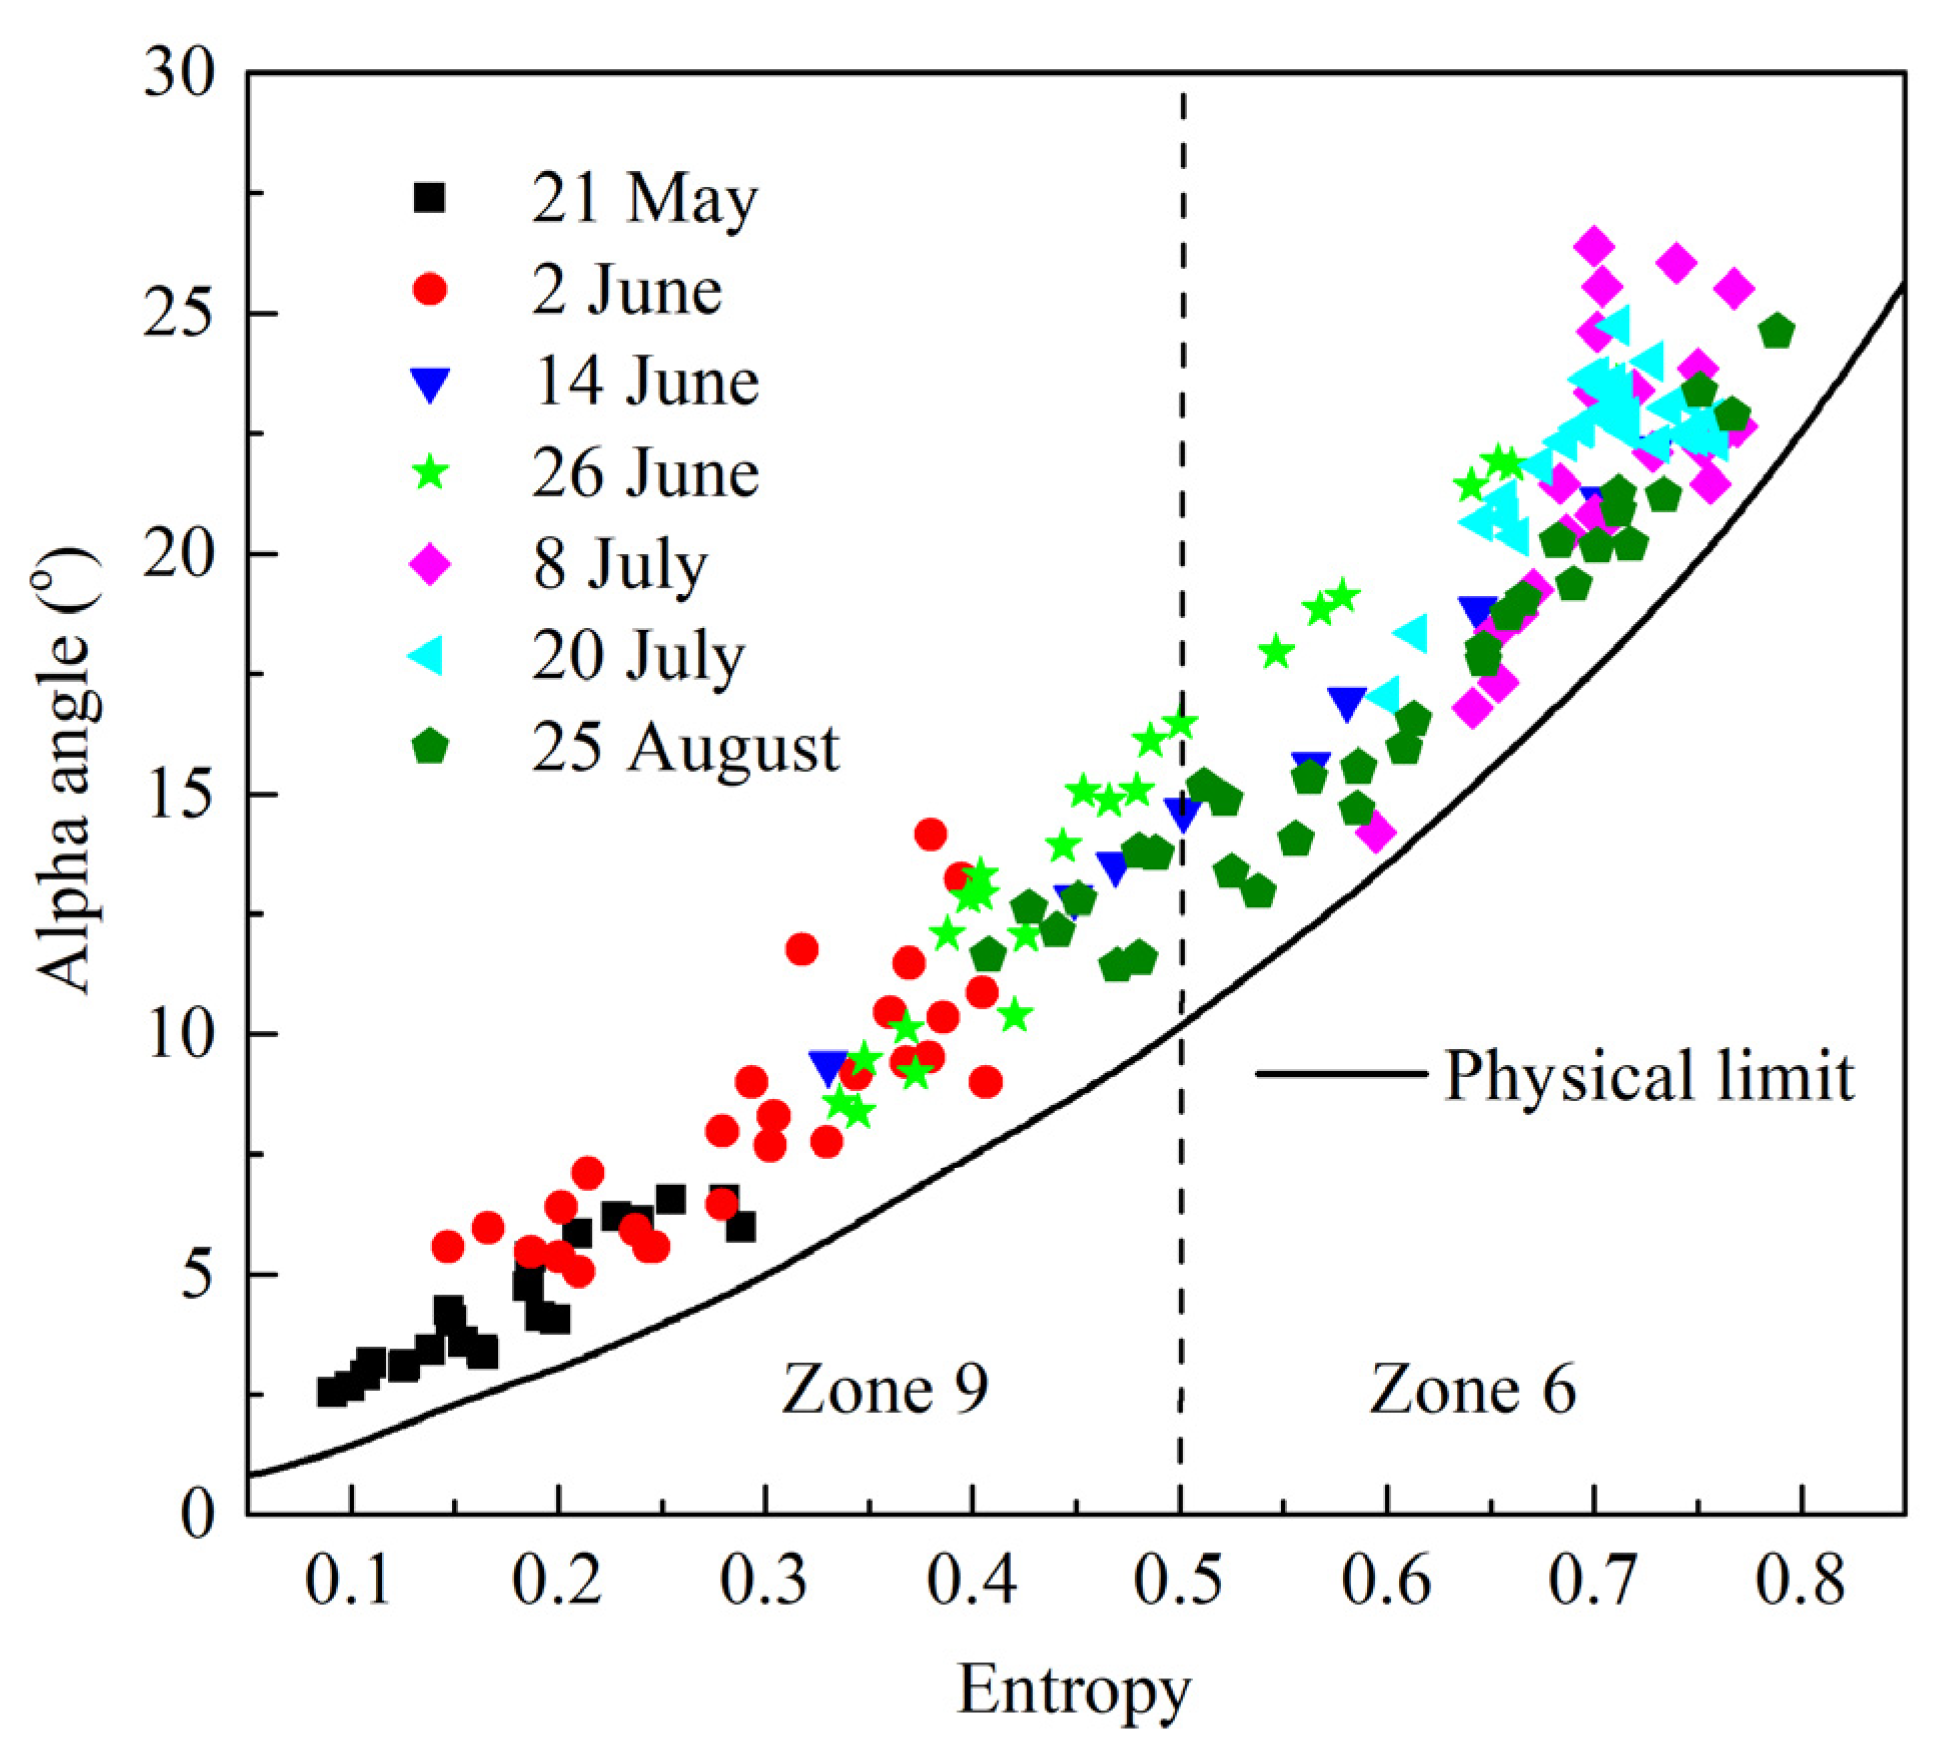
During the experiments, the agriculture field was harrowed several times (the distance between the harrows and their heights were about 0.2–0.3 m and about 0.07–0.12 m, respectively). Even though the agriculture field was in the same place and was harrowed several times, the surface roughness and moisture content of soil were different for each day of Sentinel-1B observations due to natural moisturization by rain, drying and wind erosion. This statement is supported by the carried out polarimetric analysis based on the H-α decomposition [
14] using complex images of the test field at two polarizations VH and VV (
Figure 2).
Despite the close high soil moisture values on June 2 and August 25 (
Table 1), H-α decomposition shows that the points corresponding to observations on August 25 are scattered sufficiently higher than those on June 2 (
Figure 2) because after ploughing of the soil surface roughness increased (
Table 1).
On 21 May, the soil showed the lowest degree of roughness (since ploughing was more than 12 days earlier) and was driest for the entire observation period (
Table 1), determining the position of scattered points near the origin in the H-α diagram. In the H-α diagram (
Figure 2), the scattered points corresponding to 26 June, 8 July, and 20 July lie higher than those were for 21 May, although these soil moisture values were close (
Table 1). This could be explained by the significant change of the soil surface roughness as the test field was several times ploughed in this period (
Table 1). Data in
Figure 2 evidence that the scattered waves undergo a single-diffuse scattering by the soil surface of varying degrees of roughness and moisture, as the variations of alpha angle and scattering entropy were significant.
3. Soil Moisture Retrieval Method Using NNs and Polarimetric Sentinel-1B Data
In accordance with well-known radar scattering models, in the general case, the backscattering coefficient can be represented as the product of two functions, one of which depends on soil moisture, the other on the surface roughness parameters (RMS height and correlation length) [
12]. In the case of the semi-empirical backscattering model (Equation (4) [
13]), the cross-polarized ratio
normalized on Fresnel reflectivity of the surface at nadir-viewing
depends on the RMS height of soil surface roughness
hr exponentially:
where
is the complex permittivity of soil with volumetric moisture of
W,
k0 is the free space wavenumber,
k0hr is a dimensionless quantity characterizing the RMS height of soil surface roughness in wavenumbers of free space,
and
are backscattering coefficient at VH and VV polarizations. The semi-empirical backscattering model (Equation (4) [
13]) was created based on polarimetric radar measurements, which were conducted for bare soil surfaces under a very wide range of roughness from
hr = 0.004 m to
hr = 0.0302 m (from
k0hr = 0.10 to
k0hr = 6.01), correlation length,
l, from
k0l = 2.6 to
k0l = 17.5, and volumetric moisture from 9% to 31% (soil surface), and it combined frequencies in
L (1.5 GHz),
C (4.75 GHz), and
X (9.5 GHz) bands at incidence angles ranging from 10 to 70°. Note that the roughness of the soil surface was collected over ten 1-m and two 3-m profiles for each surface. The articles [
14,
15,
16,
17] show that the scattering anisotropy
A was insensitive to the variation of soil permittivity and the angle of observation at
k0hr < 1, and the linear relationship between
A and
k0hr (at
hr = 0.004 m and ranges of frequencies from 1.5 to 18.5 GHz) was observed. Note that in [
19], based on the RADARSAT-2 experimental data, it was shown that
A has a linear dependence on
hr only in the range of
k0hr < 1.2 (
hr < 0.011 m at a frequency of 5.4 GHz).
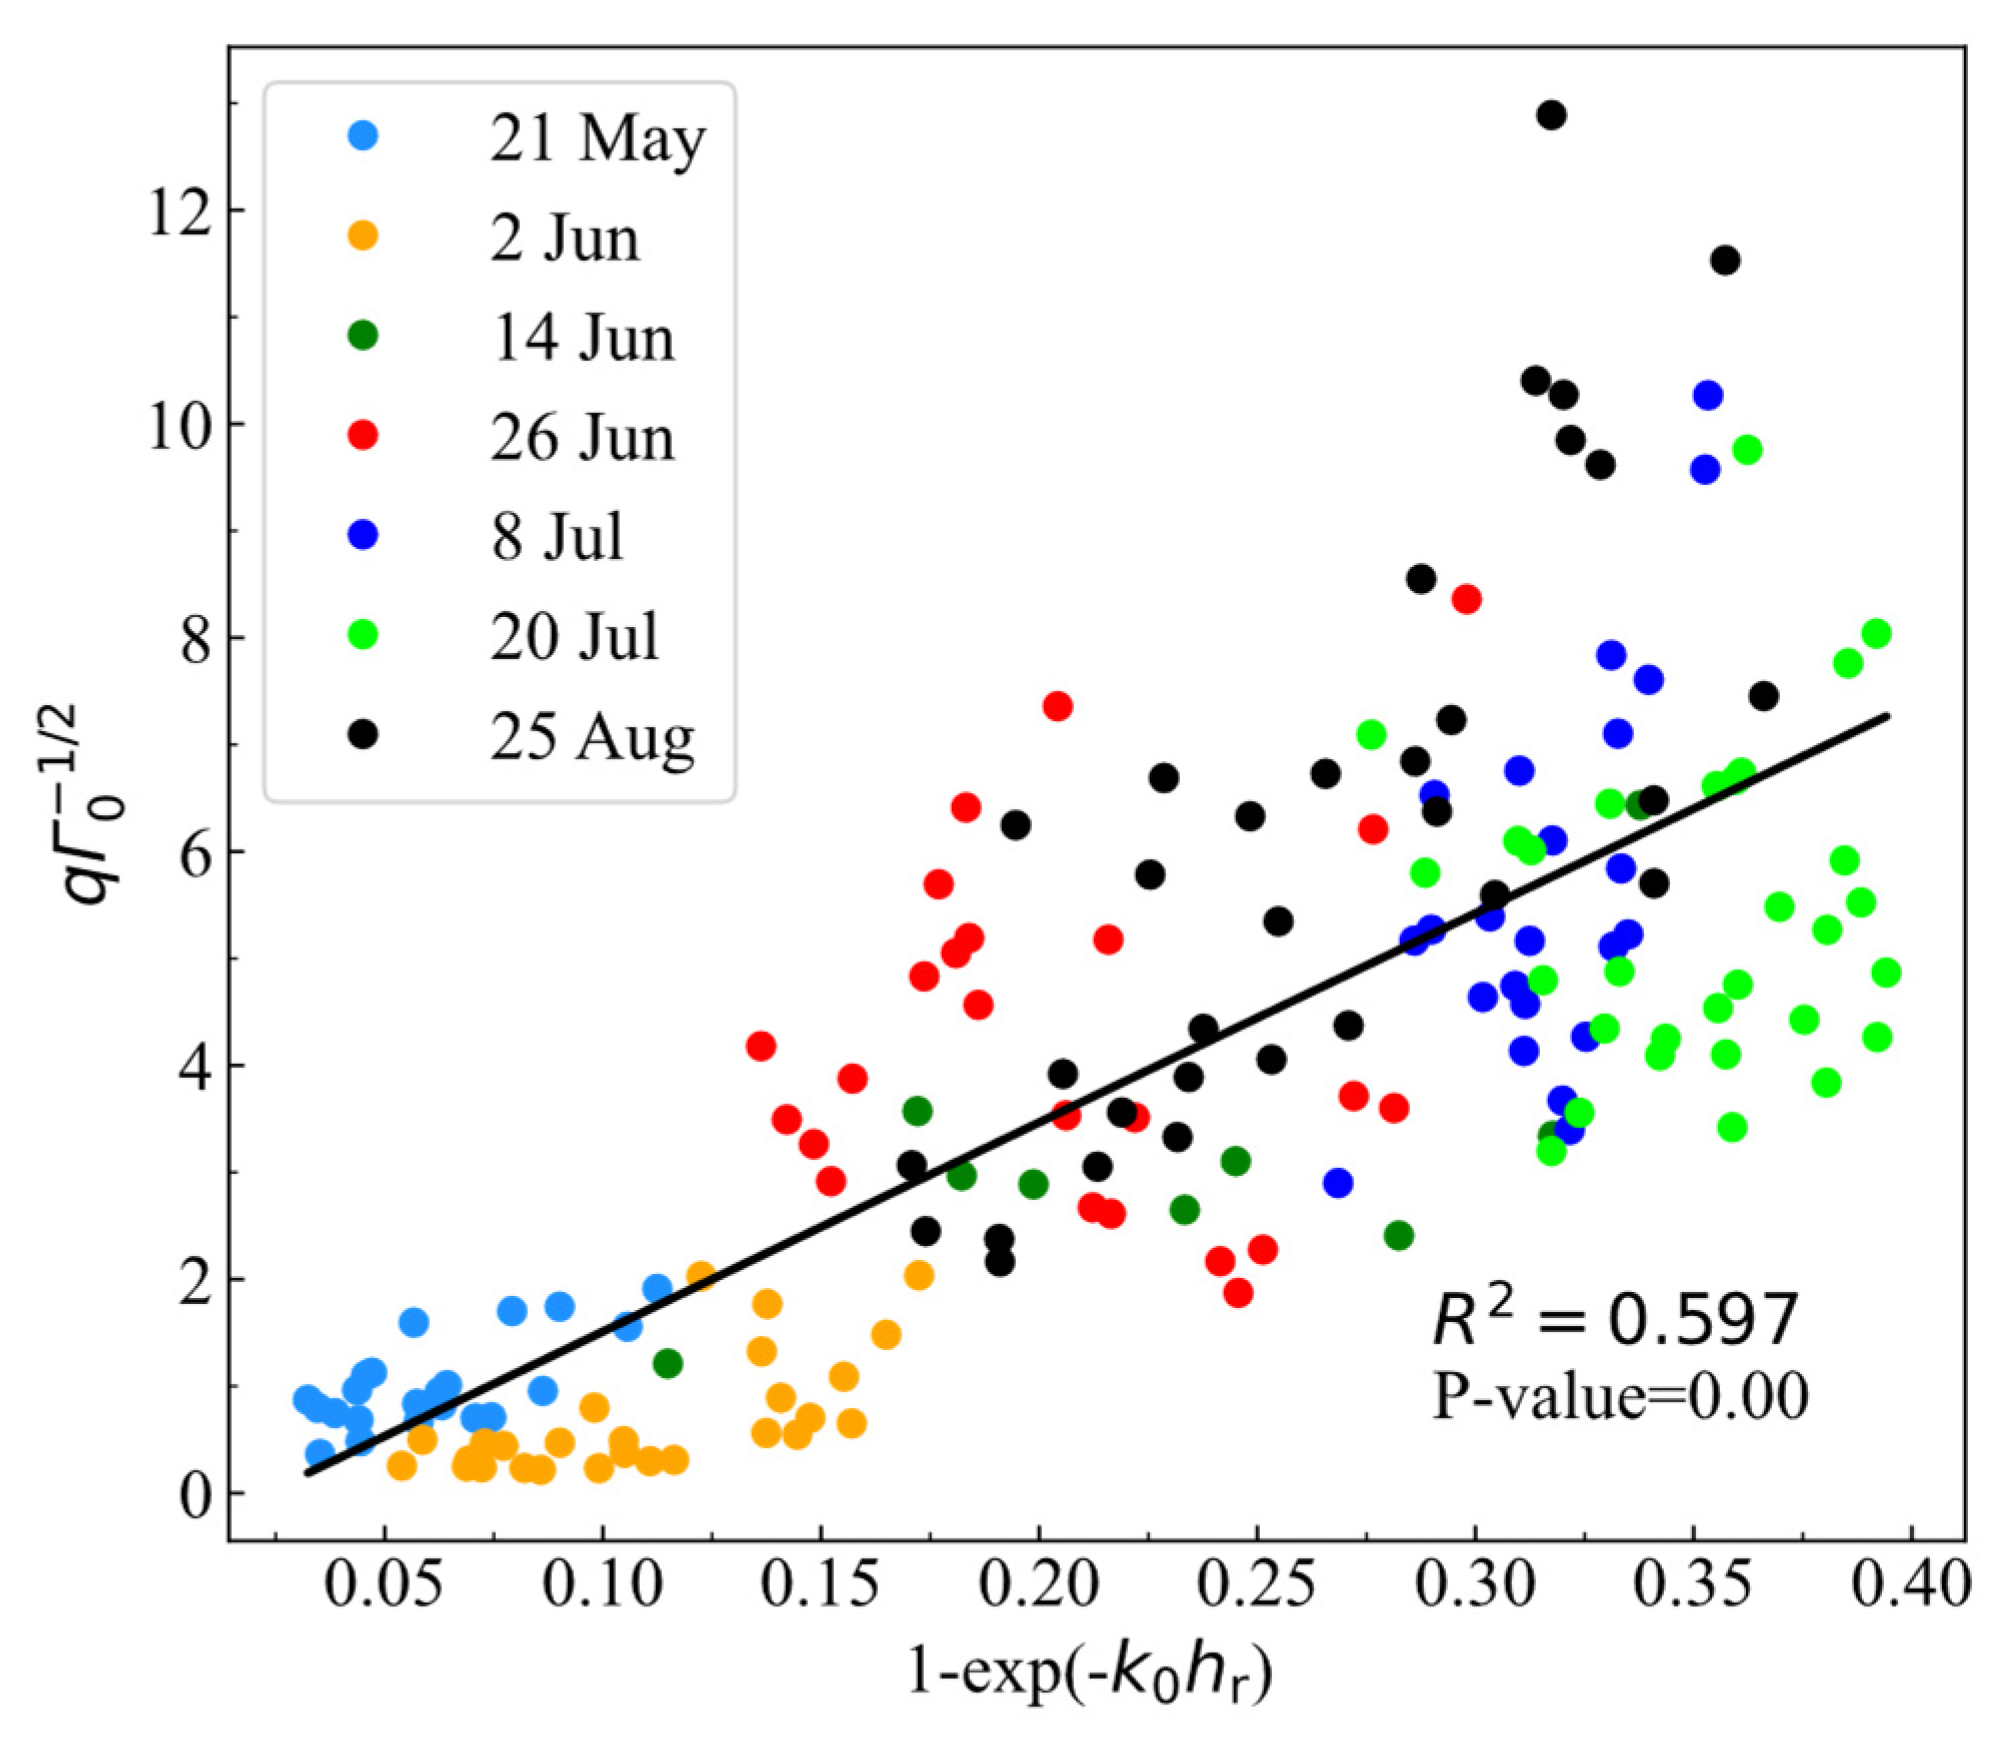
The right and left sides of Equation (1) can be calculated using: (1)
q values (measured by Sentinel-1B from 21 May to 25 August 2020 at the agriculture field for different small local plots); (2) reflectivity
, calculated based on the dielectric model [
20] and experimental soil moisture values, measured at the small local plots within the agriculture field; (3) assuming [
17]:
There is a robust linear relationship (coefficient of determination
R2 = 0.597) between the left and right sides of Equation (1), but there are significant random deviations from it (
Figure 3).
These random deviations are explained by the limited ability of the scatter model (1) and relation (2) to describe the surface roughness caused by different scale topography. In addition, that discrepancy can be explained by the influence of speckle noises on the measured values of the backscattering coefficient
,
and the anisotropy
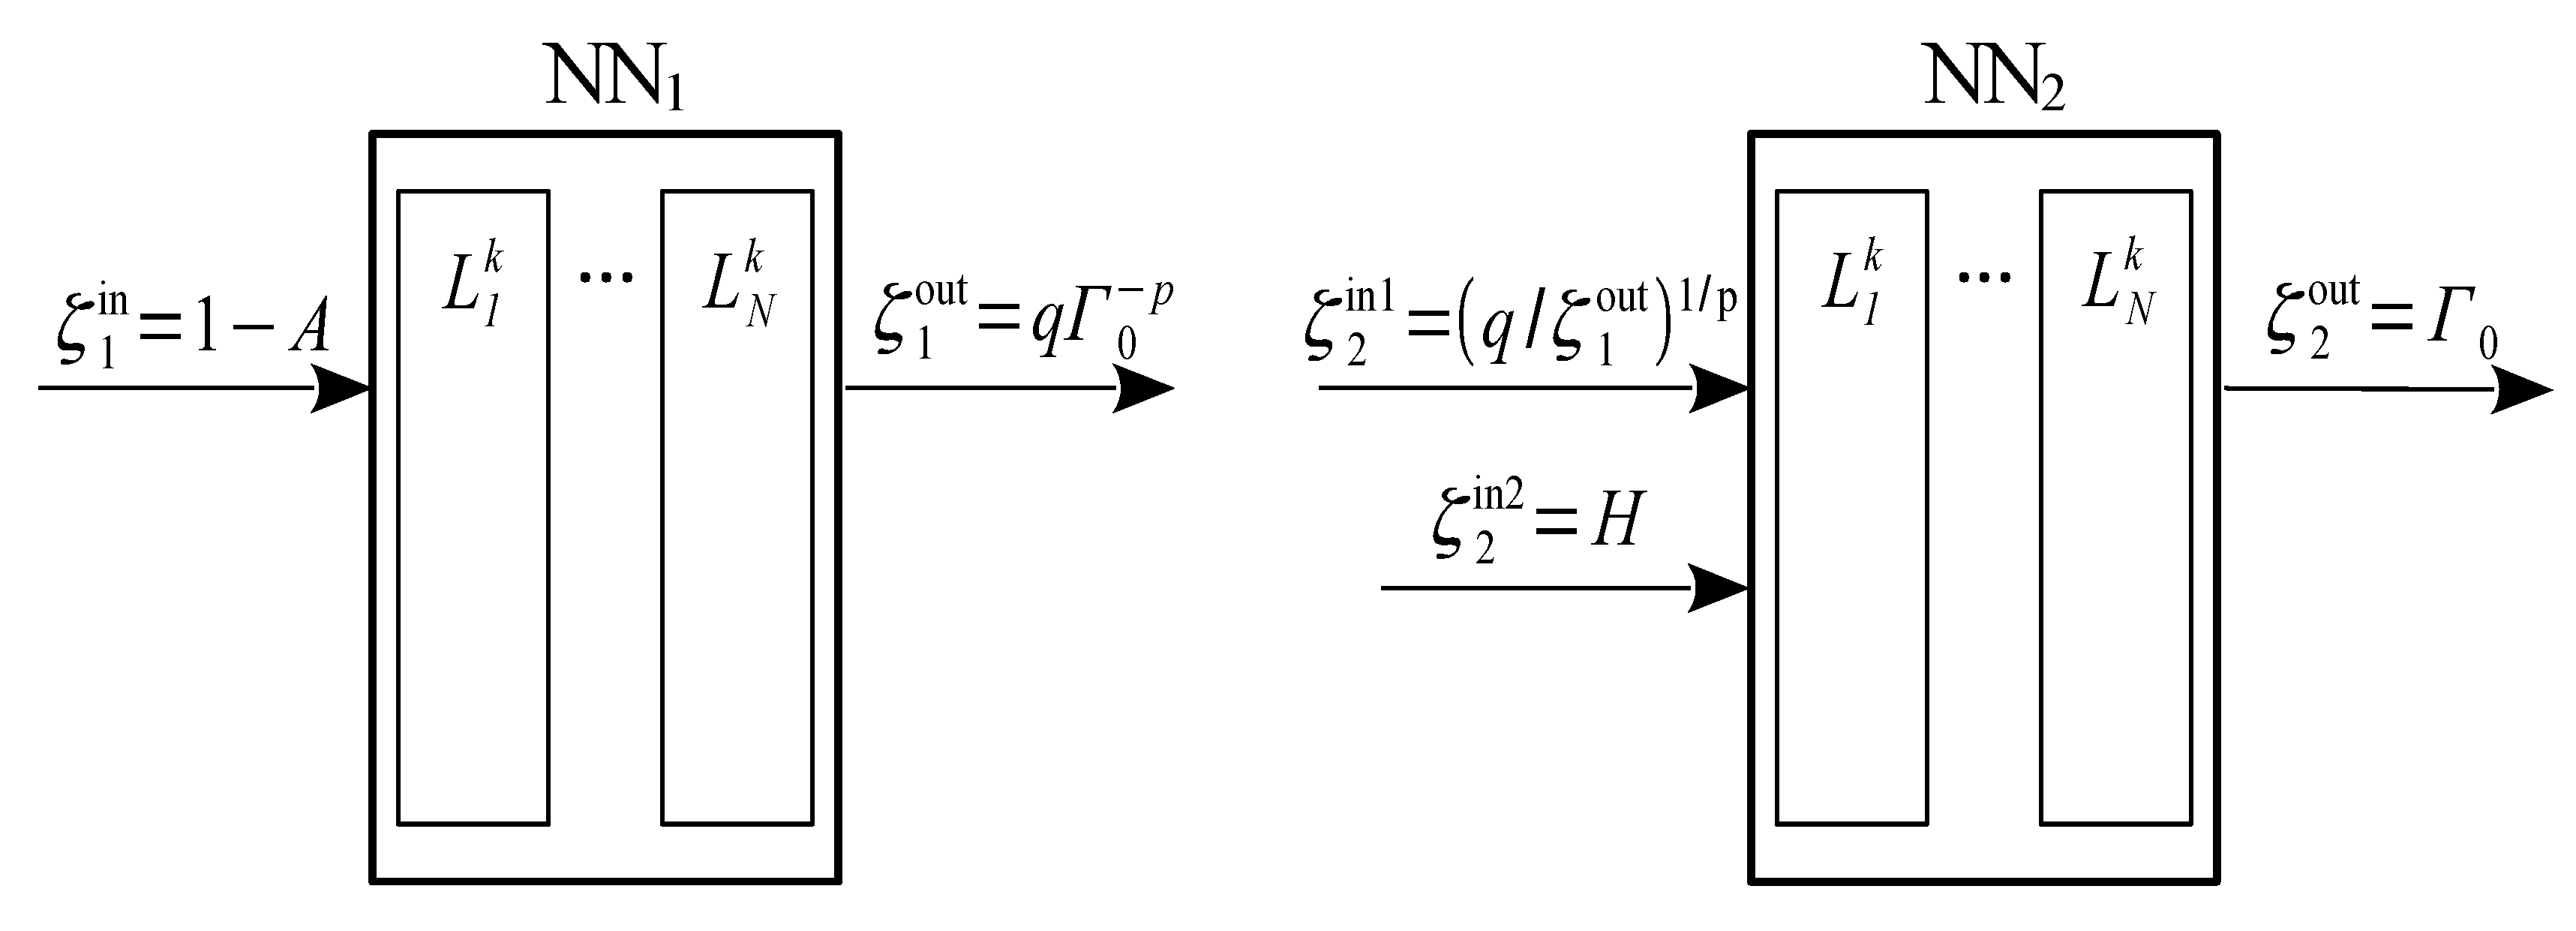
A. Based on the above analysis, we will introduce two NNs to retrieve soil moisture (
Figure 4). The simplest feed-forward NNs, consisting of from one to two hidden layers, were used. NN modeling was performed in the Matlab 2013 software environment (Mathworks, MA, USA). The first neuron network NN
1 implemented the connection between the anisotropy
A and some functional
that, according to model (1), depends only on the soil surface roughness. As a result, the estimate of soil reflectivity
(with the weakened influence of soil roughness) could be obtained on the basis of the
, value predicted by the first neural network NN
1. However, due to the fact that the simple model (1) and the assumption of (2) do not fully describe the relationship between cross-polarized ratio
q, Fresnel reflectivity, and soil surface roughness (
Figure 3), the second NN
2 was used (
Figure 4) to predict the reflectivity
with using the extra parameter of scattering entropy
H (
), which carried additional information about roughness and moisture of soil [
17].
In our case of bare soil, scattering entropy
H and angle alpha were unambiguously related, so we chose only
H. (On the entropy/alpha plane (
Figure 2), the data points located along the azimuthal symmetry line in ninth and sixth zones.) As a result, as input parameters of NNs were used {1 −
A,
,
H}. The value
was used as an output parameter. To train NNs, we used reflectivities
, calculated based on a dielectric model [
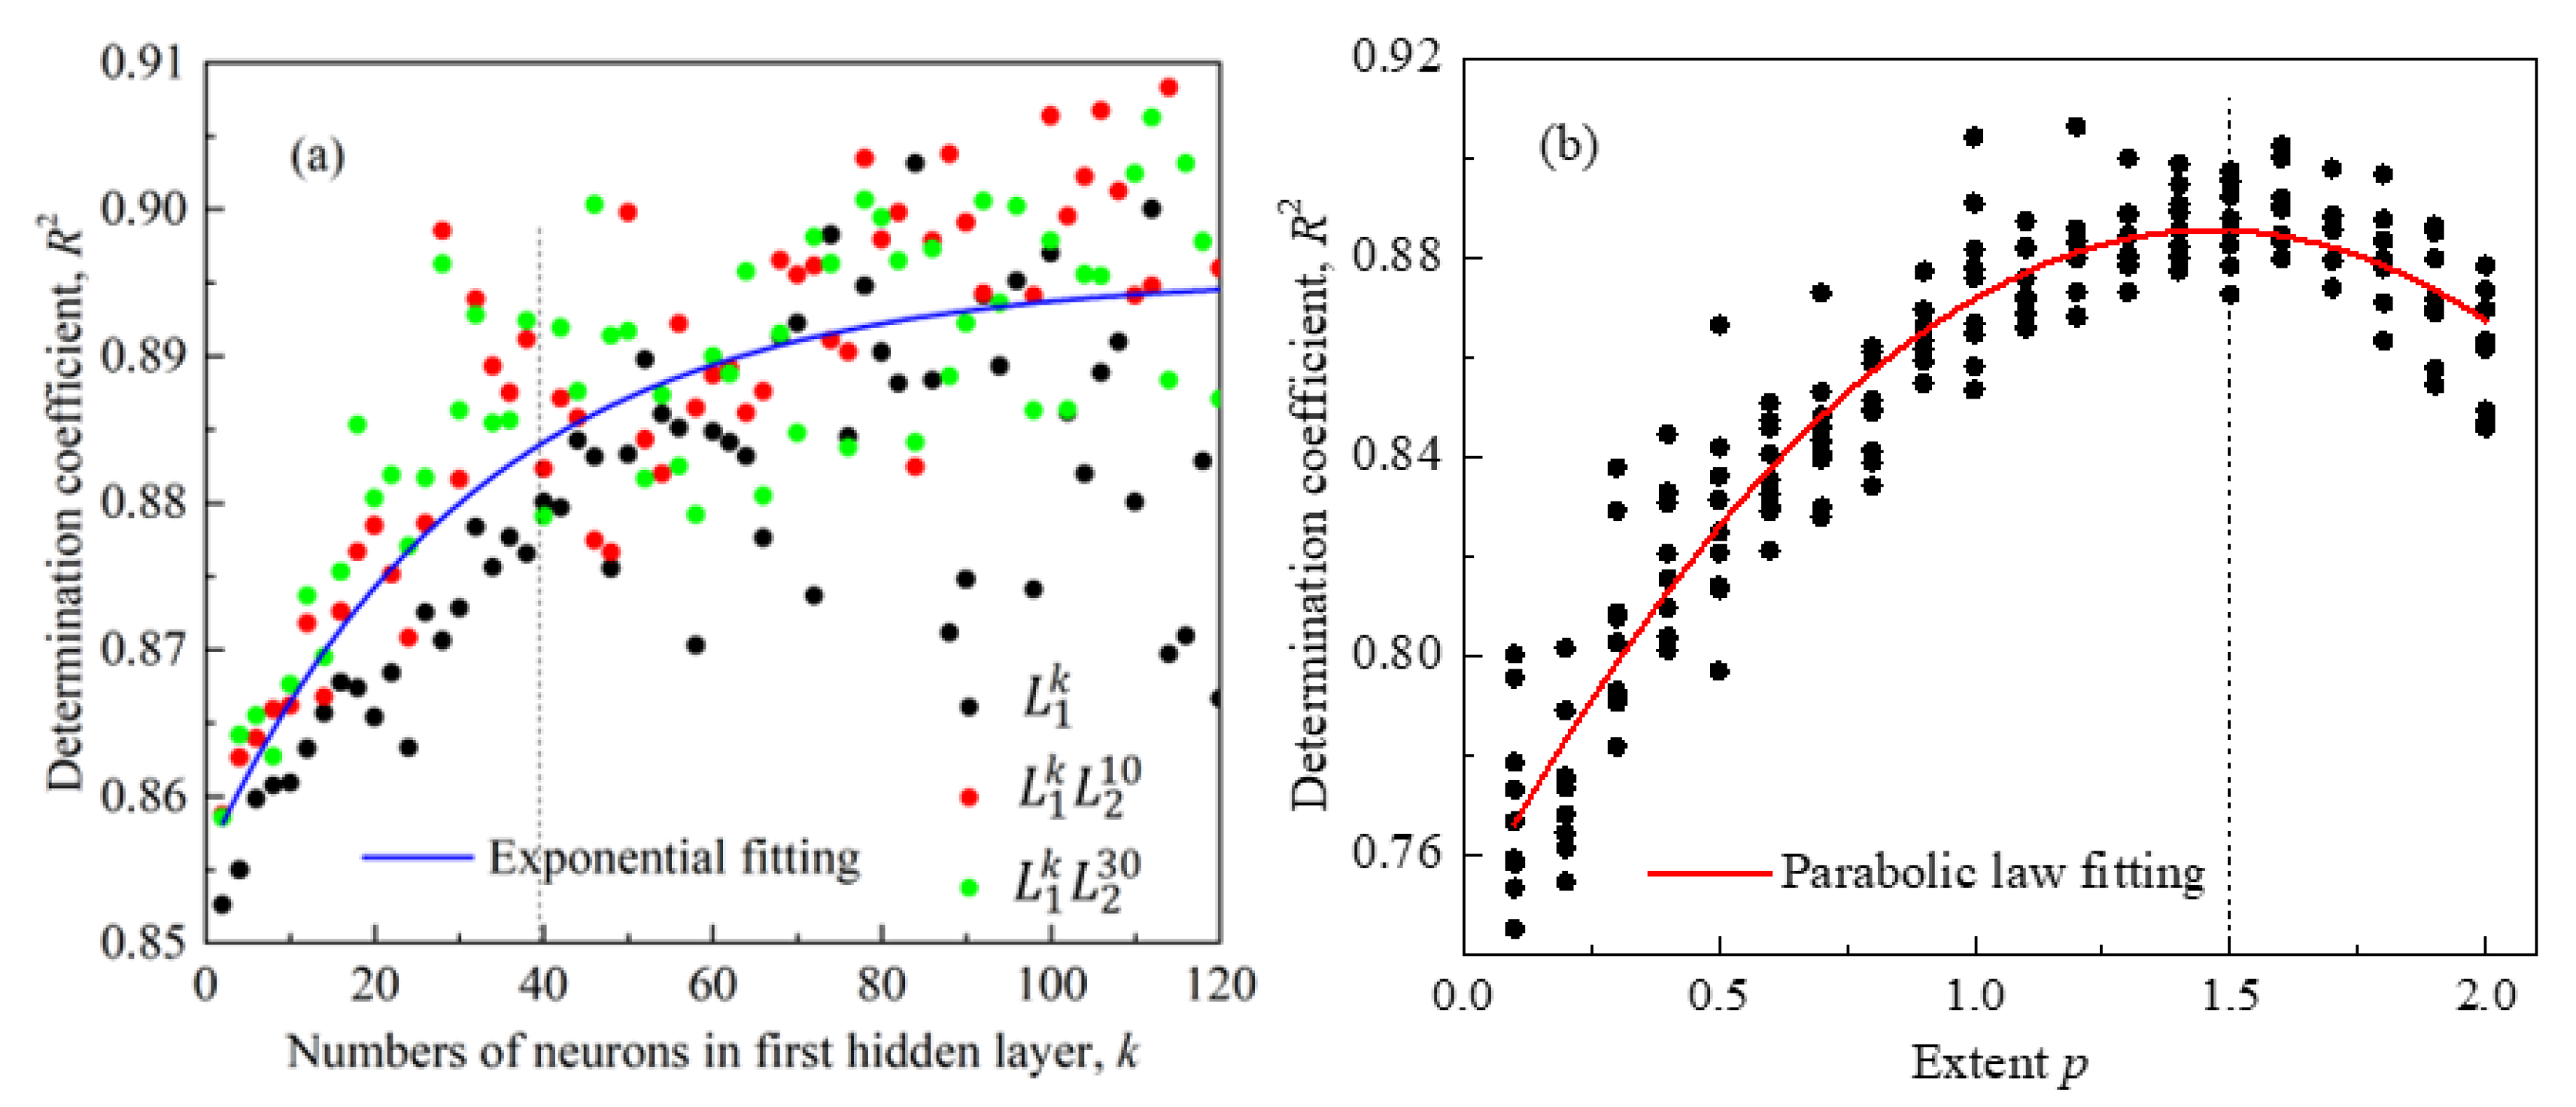
20] and soil moisture, measured in the 0.00–0.05 m layer at the small local plots within the agriculture field from 21 May to 25 August 2020 every twelve days (at the time of Sentinel-1B passages). The NNs were trained on 60% of the dataset, which corresponded to 95 small local plots randomly selected from all datasets. During the training of NNs, the inverse problem to determine the optimal parameter
p using Levenberg-Marquardt algorithm [
21] was also solved. In the first
and second
hidden layers, the number of neurons,
k, varied from 1 to
n = 120 and from 1 to
n = 30, respectively (
Figure 5a). Both NNs were the same and consisted of an equal number of hidden layers and neurons. Numerical experiments have shown that it is sufficient to use only one hidden layer
in each neural network with more than
k = 40 neurons and extent
p equal 1.5 to achieve
R2 ~ 0.89 (at RMSE less than 0.105) between predicted NNs and calculated (based on experimental soil moisture data) reflectivity values
(
Figure 5b). As can be seen from
Figure 5b, it was at
p near 1.5 that a maximum of
R2 was observed (this maximum was observed for the different variants of neural networks structures:
,
,
).
In the course of further numerical analysis, one hidden layer with 40 neurons
was used in each neural network. At the last step, the inverse problem of soil moisture determination from predicted reflectivity by NNs was solved using the permittivity model [
20] and Levenberg–Marquardt algorithm [
21].
4. Results and Discussion
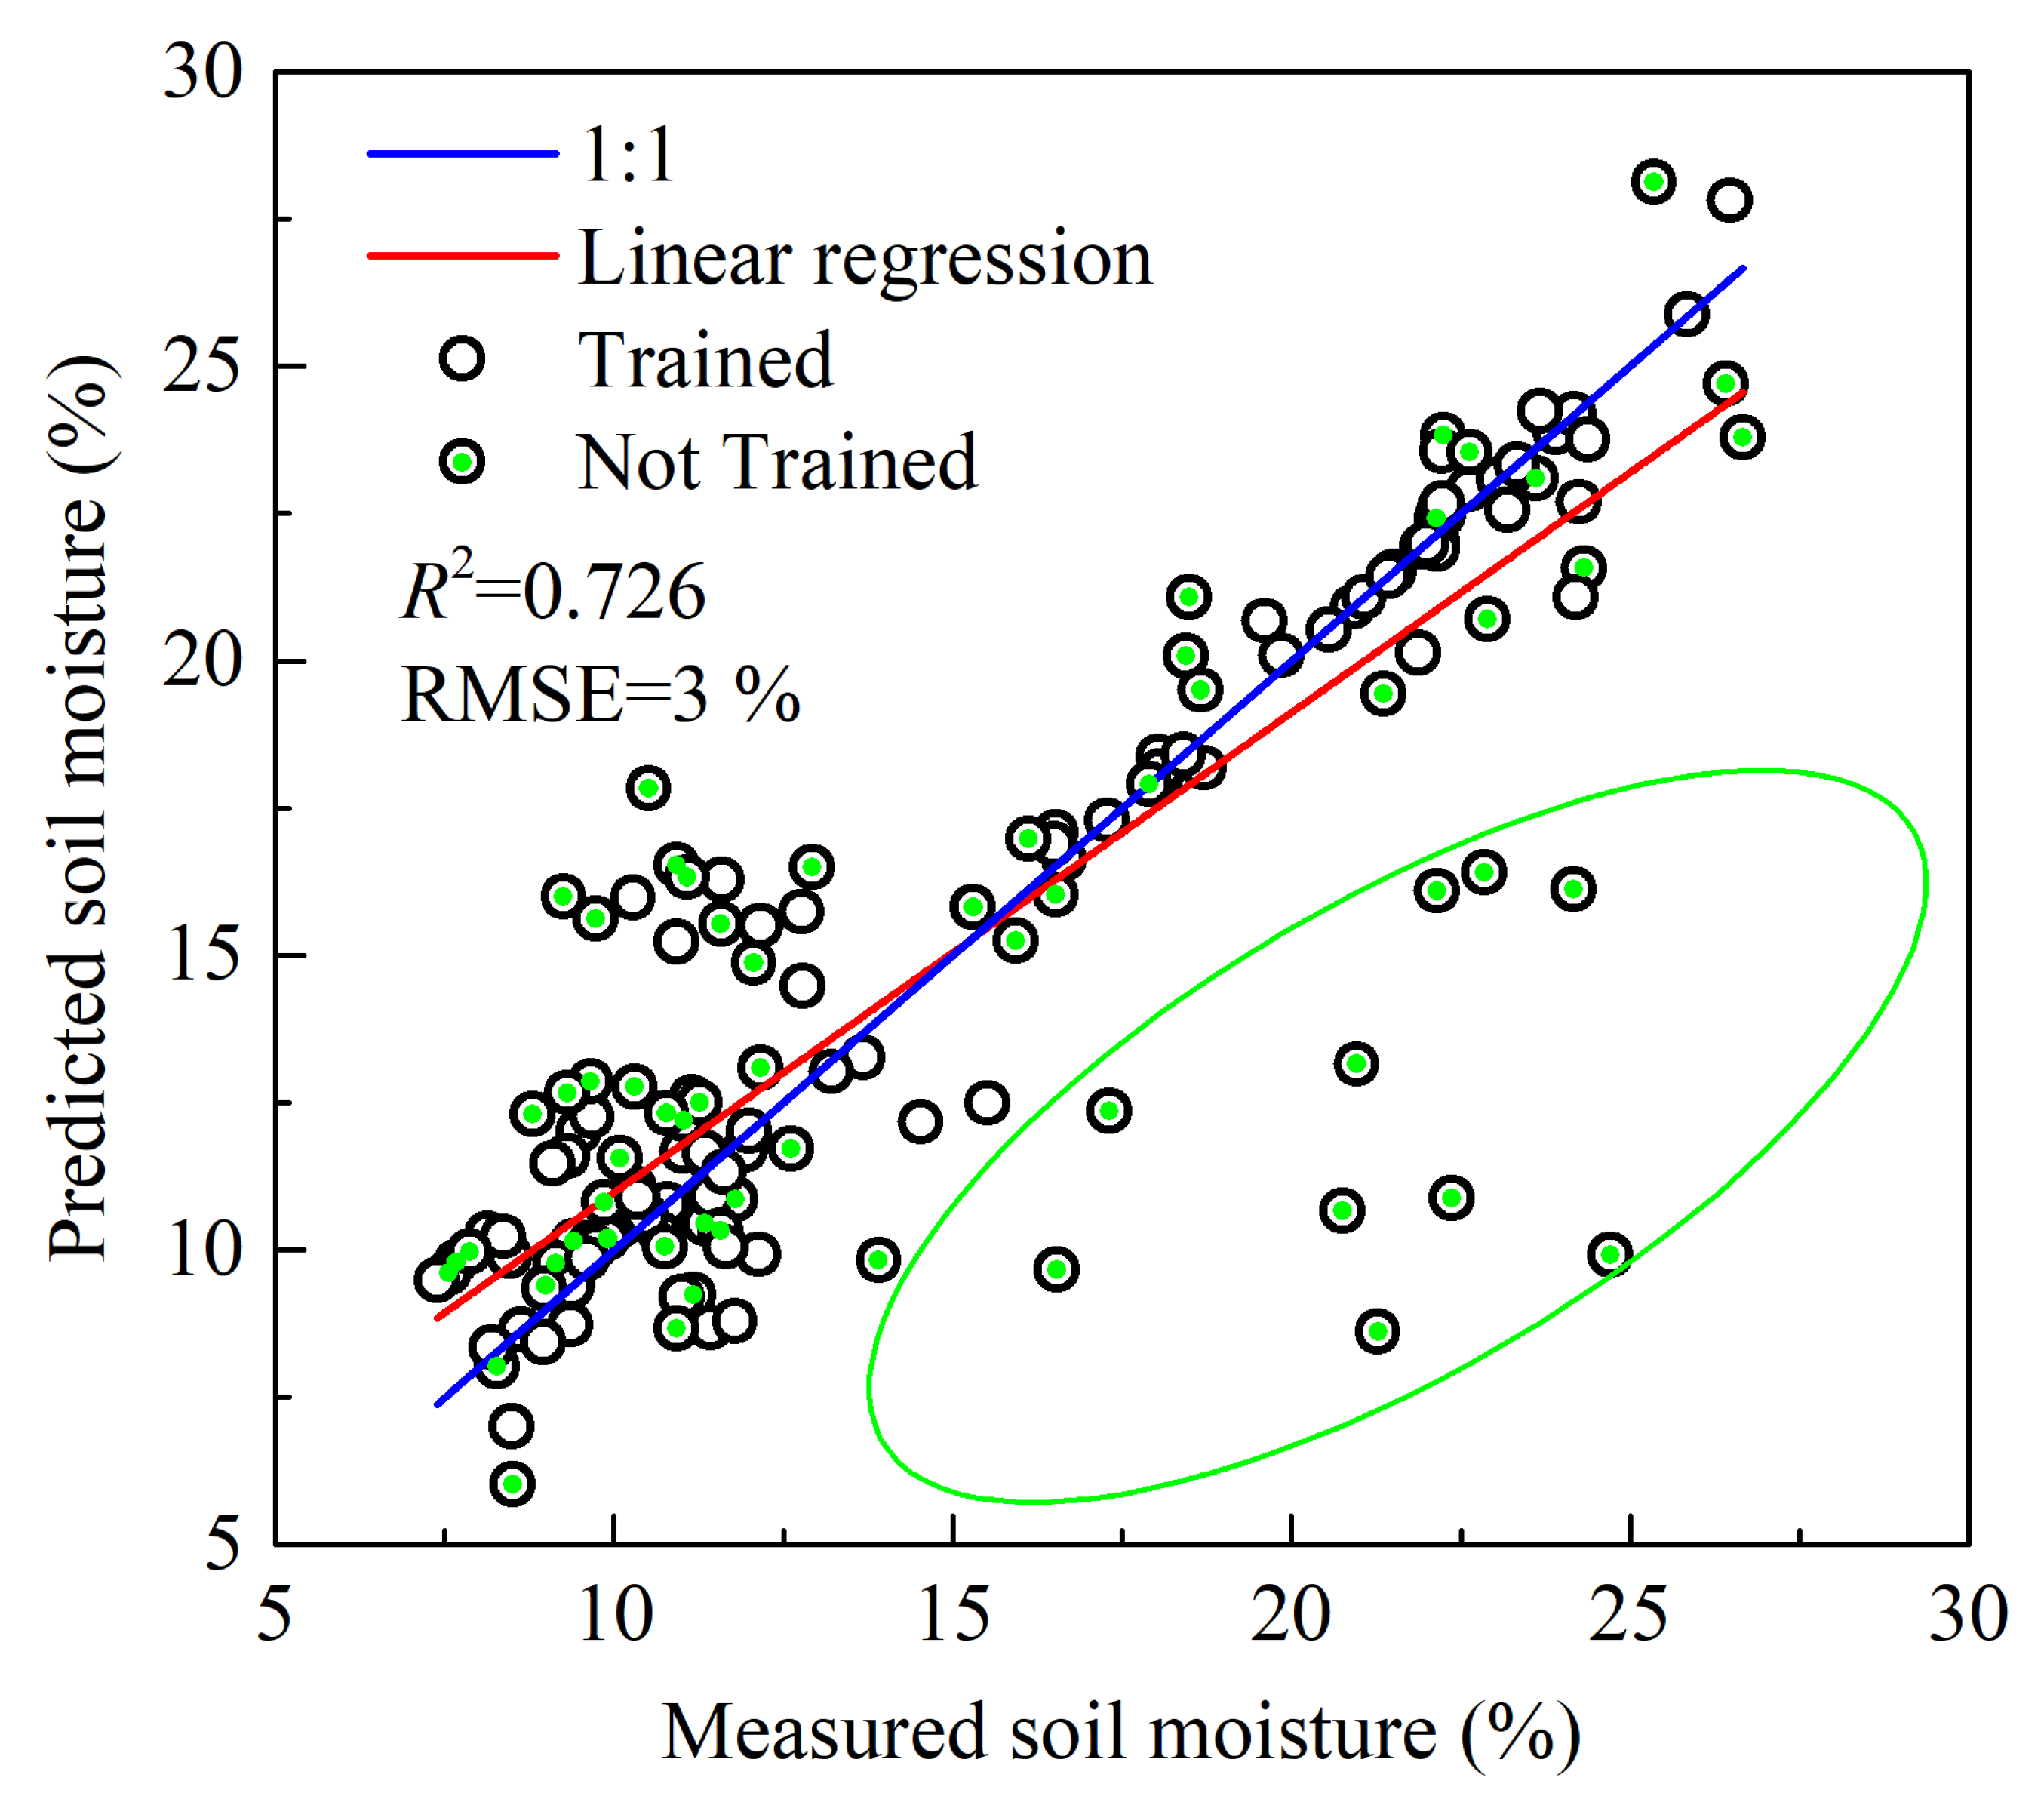
The described process of soil moisture retrieval was applied to validate the created methodology based on the total amount of data (the joint observations of backscattering coefficients and soil moisture) that took and did not take part in training NNs. The correlation between predicted and measured soil moisture values at the small local plots on the agricultural field from 21 May to 25 August 2020 is depicted in
Figure 6. Two NNs (NN
1 with input parameter 1 −
A and NN
2 with input parameters
and
H (
Figure 4) predicted soil moisture values with RMSE = 3% and
R2 = 0.726, relative to ground trough measurements (
Figure 6). (These estimates were derived using all datasets).
The dispersion (
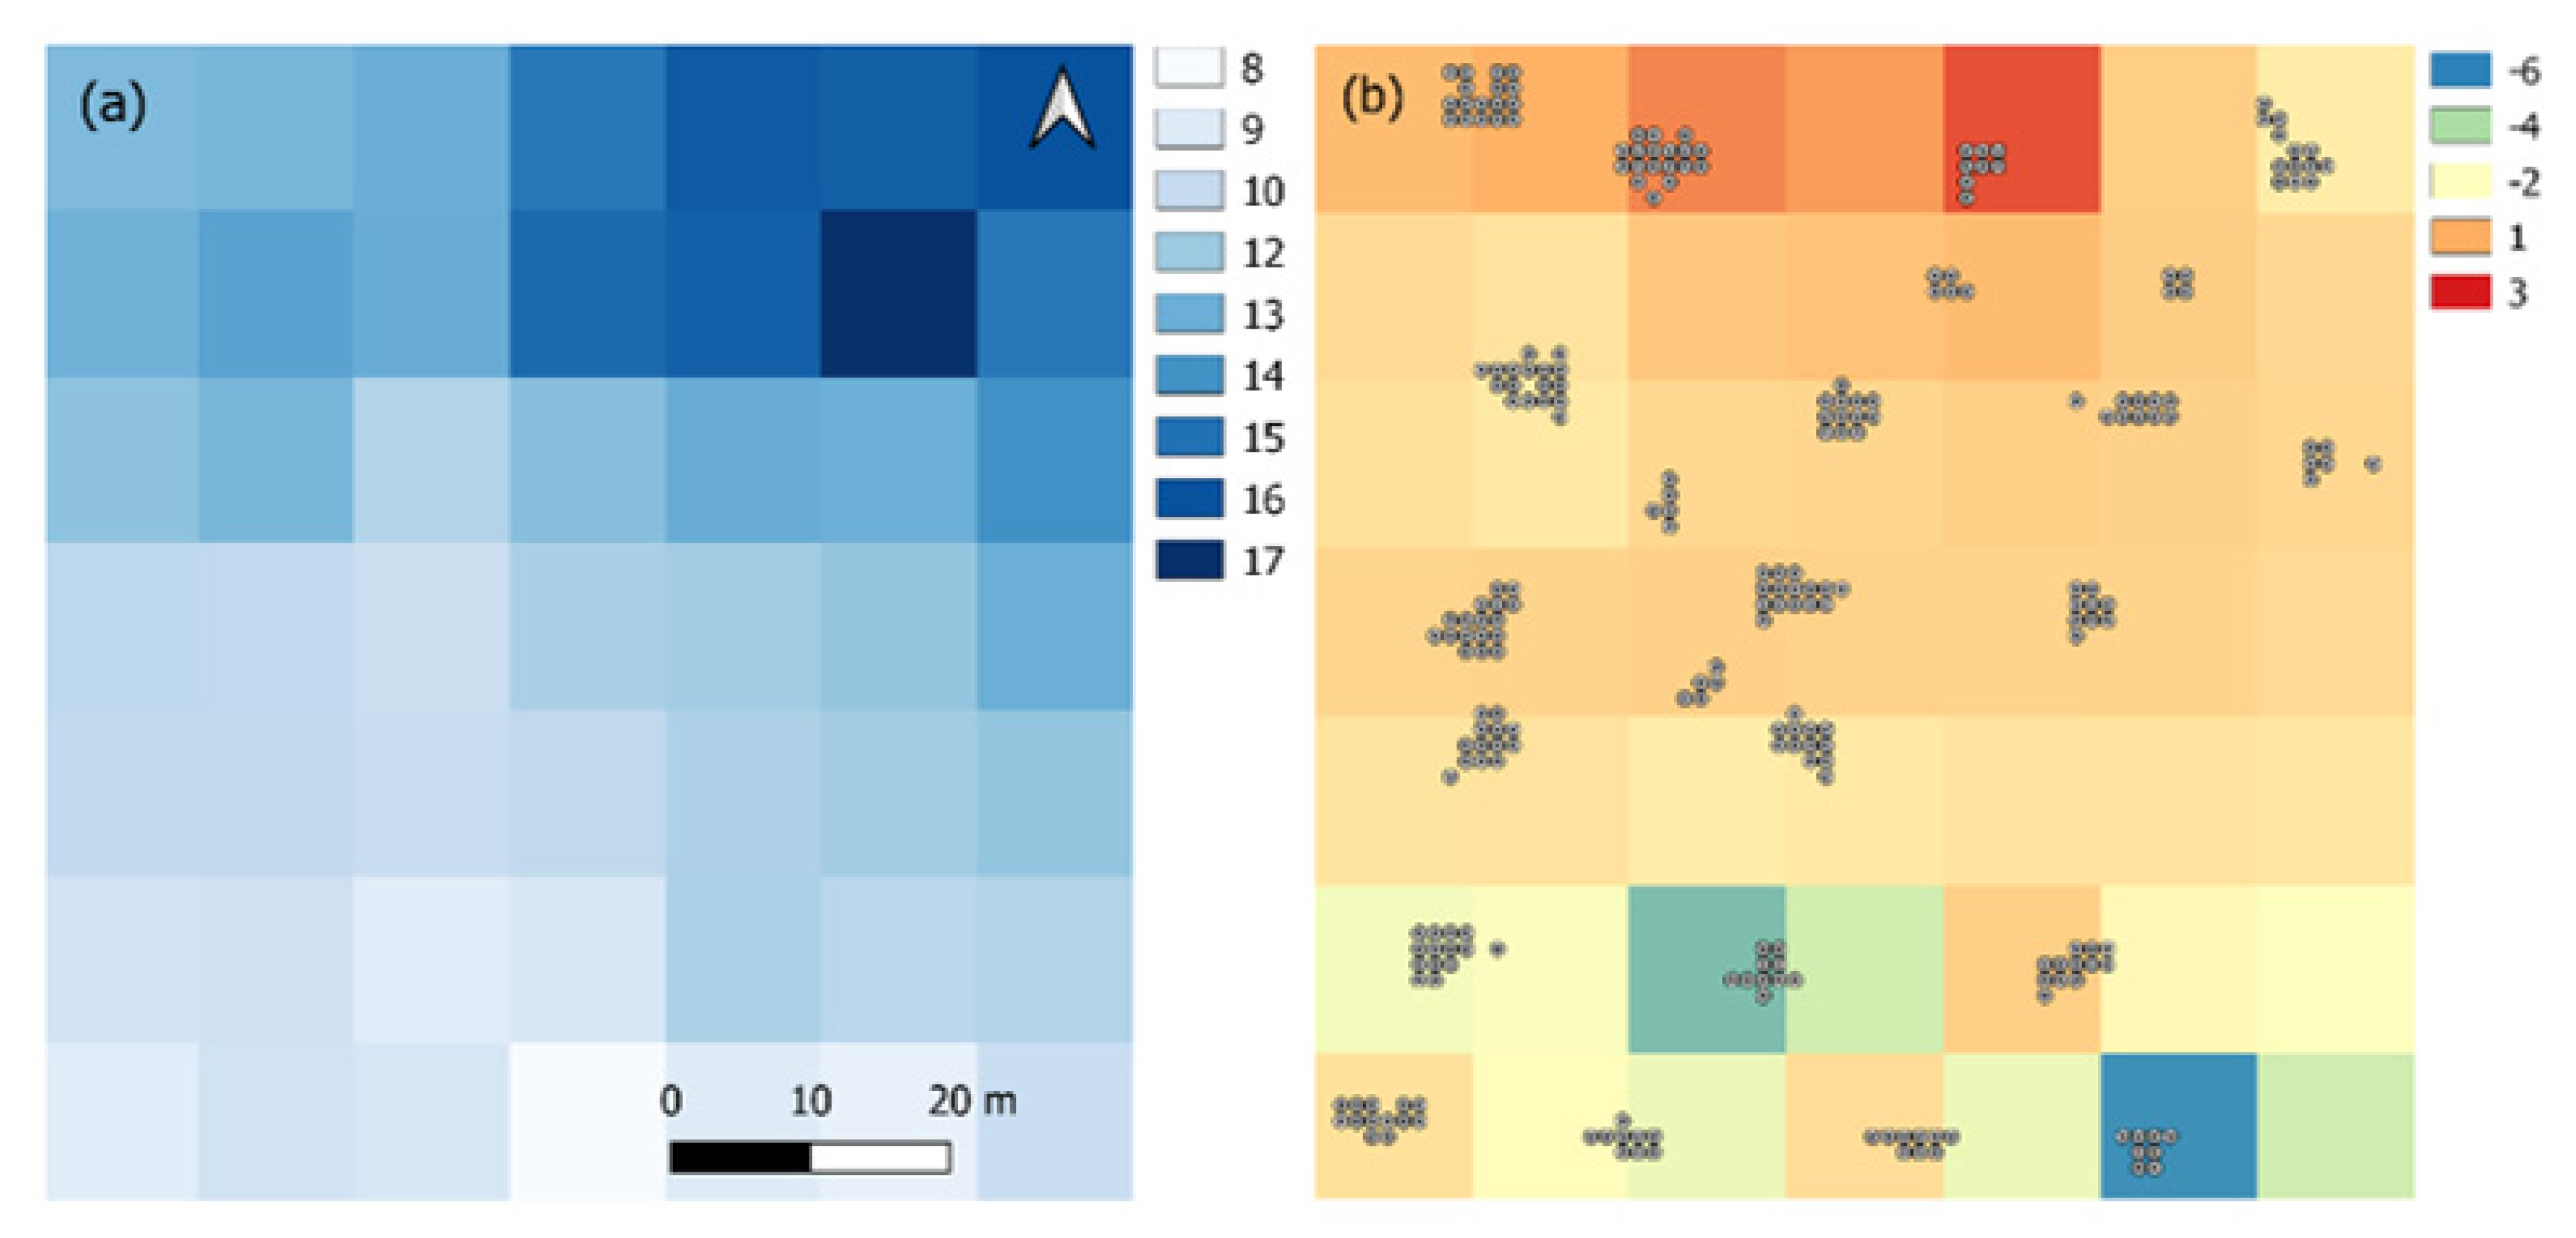
Figure 6, green ellipse) was associated with small local plots that did not participate in NNs training and related to 25 August (statistically atypical day during the field campaign, when the soil surface was strongly wetted by rains the day after ploughing). For example,
Figure 7a shows the map of the retrieved soil moisture values from Sentinel-1B using the proposed approach for the test field on 26 June 2020. The RMSE and
R2 between the retrieved and measured soil moisture values on 26 June 2020 over the entire test area were 2% and 0.819, respectively (
Figure 7). In this case, the maximum absolute deviations of the retrieved from the measured soil moisture values reached −6% and +3% (
Figure 7b).
It should be noted that in this particular case, there was a tendency to overestimate/underestimate the retrieved soil moisture values for more wet/dry areas of the test field.


