Article

Assessing the Use of Optical Satellite Images to Detect Volcanic Impacts on Glacier Surface Morphology

1
Department of Natural Sciences, Manchester Metropolitan University, Chester Street, Manchester M1 5GD, UK
2
Department of Earth Sciences, Dickinson College, Carlisle, PA 17013, USA
3
Department of Geography and Environment, University of Aberdeen, Aberdeen AB24 3UF, UK
*
Author to whom correspondence should be addressed.
Remote Sens. 2021, 13(17), 3453; https://doi.org/10.3390/rs13173453
Submission received: 14 July 2021 / Revised: 24 August 2021 / Accepted: 26 August 2021 / Published: 31 August 2021
(This article belongs to the Special Issue Remote Sensing for Volcano Systems Monitoring)

Abstract

:
Globally, about 250 Holocene volcanoes are either glacier-clad or have glaciers in close proximity. Interactions between volcanoes and glaciers are therefore common, and some of the most deadly (e.g., Nevado del Ruiz, 1985) and most costly (e.g., Eyjafjallajökull, 2010) eruptions of recent years were associated with glaciovolcanism. An improved understanding of volcano-glacier interactions is therefore of both global scientific and societal importance. This study investigates the potential of using optical satellite images to detect volcanic impacts on glaciers, with a view to utilise detected changes in glacier surface morphology to improve glacier-clad volcano monitoring and eruption forecasting. Roughly 1400 optical satellite images are investigated from key, well-documented eruptions around the globe during the satellite remote sensing era (i.e., 1972 to present). The most common observable volcanic impact on glacier morphology (for both thick and thin ice-masses) is the formation of ice cauldrons and openings, often associated with concentric crevassing. Other observable volcanic impacts include ice bulging and fracturing due to subglacial dome growth; localized crevassing adjacent to supraglacial lava flows; widespread glacier crevassing, presumably, due to meltwater-triggered glacier acceleration and advance. The main limitation of using optical satellite images to investigate changes in glacier morphology is the availability of cloud- and eruption-plume-free scenes of sufficient spatial- and temporal resolution. Therefore, for optimal monitoring and eruption prediction at glacier-clad volcanoes, optical satellite images are best used in combination with other sources, including SAR satellite data, aerial images, ground-based observations and satellite-derived products (e.g., DEMs).

Graphical Abstract

1. Introduction

Many (245 of 1413) Holocene volcanoes on Earth are currently ice-clad or have glaciers in close proximity [1,2], and interactions between volcanic activity and ice are therefore common (e.g., [3,4,5,6,7]). Such volcano-ice interactions are important since they often result in hazards, including floods, debris flows (lahars) and/or the distribution of fine-grained ash [3,4,8]. Some of the deadliest (e.g., Nevado del Ruiz, 1985) and most costly (e.g., Eyjafjallajökull, 2010) eruptions in recent history were associated with ice-clad volcanoes [9,10]. The former eruption killed ~23,000 people [3], and the latter heavily impacted air travel in large parts of Europe and caused considerable costs of about 1.3 billion euros (£1.1 billion, US$1.7 billion), due to the widespread dispersal of fine-grained ash [8,9]. Therefore, the investigation of volcano-ice interactions is of considerable social and economic importance. They are also significant for glaciology, since predicting the future behaviour of glaciers requires knowledge of their response to different forcing mechanisms. A notable example is the potential for volcanic controls on the future stability of the West-Antarctic Ice Sheet (WAIS) [11]. Previous publications (e.g., [9,12,13]) reveal that glaciers can be affected by many volcanic processes including (but not limited to) enhanced geothermal heating, subglacial dome growth, sub- and supra-glacial lava flows, pyroclastic density currents and supraglacial flooding. These processes often have a visible impact on the glacier surface morphology as they can cause ice melt and destruction, ice-cauldron (depression) formation, localized ice fracturing and deformation and widespread glacier crevassing [13]. Given this morphological response, monitoring glaciers has the potential to indirectly indicate past, ongoing and imminent periods of volcanic unrest [6,13,14]. However, many ice-clad volcanoes are remote and difficult to access—e.g., Mount Hudson (Chile) or Mount Belinda (South Sandwich Islands)—partly due to the ice cover itself. In a number of cases, remote-sensing techniques have proved useful for indirectly monitoring volcanic activity by observing glaciers on ice-clad volcanoes. For example, with the help of satellite data and aerial photographs, Bleick et al. [6] observed glacier surface changes prior to the 2009 Mount Redoubt eruption. Despite their potential, such studies have often been limited by the cost and spatial coverage of suitable remotely sensed datasets (i.e., those with high spatial and temporal resolution). Therefore, observations of volcanic impacts on glaciers are often restricted to a limited number of specific events, specific volcanoes e.g., [4,5,6,7,15] or specific study areas e.g., [14,16,17,18]. In recent years, new satellite remote-sensing datasets, covering large parts of the globe, have become available (often free of charge), opening up the possibility for global-scale, systematic analyses [2,10,19]. Despite the potential of such data, their utility as a means of studying the effects of volcanism on the surface of glaciers, for the purpose of indirectly monitoring volcanic activity, has yet to be investigated. Our study addresses this gap in knowledge by testing the usefulness of optical remote sensing sources for identifying volcanic impacts on glacier surface morphology at a global scale. To achieve this, we assess the degree to which key, well documented volcanic impacts on glacier surface morphology, as reported in the literature (often based on field observations and aerial imagery), are identifiable from satellite imagery.

2. Background

The events presented in this study cover glaciovolcanic interactions from different geologic settings around the world. This implies variable ice thicknesses and eruption styles and intensities, which influence the way that ice masses are affected by volcanic activity. The ice masses studied in this paper range from comparably small, thin glaciers (commonly, but not exclusively, tens of metres thick) on top of stratovolcanoes, to hundreds of meters thick ice caps in Iceland. This section gives background information on the events presented in the Results section.
A common way that glaciers are affected by volcanoes is via subglacial heating and the formation of ice cauldrons e.g., [4,15,20]. The term ice cauldron covers the range from shallow, non-crevassed depressions in the ice surface to steep-sided, highly crevassed cylindrical chasms, which sometimes extend to bedrock (i.e., to the glacier bed). Cauldrons are generally caused by heat applied at the glacier base at the location of the vent. This rapid basal ice melting results in subsidence of the overlying ice and ice flow towards the vent. Some cauldrons are associated with meltwater accumulation that is rapidly released in jökulhlaups [20,21]. In contrast, openings are associated to meltwater flow through zones of weakness within the ice (e.g., pre-existing crevasses) due to high subglacial water pressures. The openings are formed locally if the meltwater finally reaches the glacier surface and continues flowing supraglacially [5,7]. The 2014–2015 rifting episode between Bárðarbunga and Askja in Iceland resulted in the formation of ice cauldrons (on Dyngjujökull glacier) along the path of a 45-km long subglacial dyke, and included the collapse of the Bárðarbunga caldera [15,22,23,24]. These cauldrons lie within a sector of ice 430–670 m thick [25]. In 1999–2005, geothermal activity on Katla (Iceland), beneath Mýrdalsjökull glacier, resulted in the formation of very large ice cauldrons, ~1–1.5 km in diameter above 400–700 m thick ice [21,26]. During the more violent eruption of Eyjafjallajökull (Iceland) in 2010, ice cauldrons formed in the summit crater and openings appeared in the ice surface along a subglacial flood path down Gígjökull glacier [5,7]. Ice thicknesses are reported to be ~200 m for the caldera region, and typically less than 100 m for Gígjökull glacier [7,27]. Cauldron formation is not exclusive to subglacial volcanic activity in Iceland but has been observed on volcanoes elsewhere globally. For instance, on Mount Redoubt (Alaska), ice cauldrons were observed approximately two months before its eruption in March/April 2009, alongside a variety of other precursors such as crevassing, ice-slurry/debris flows and the emission of ejecta [6]. One of the cauldrons formed in the summit crater of the volcano, where ice is ~150 m thick [28], and was associated with near-vertical walls and clear concentric crevassing [6,29,30]. Cauldrons associated with the emission of gases and pyroclasts were also reported during the eruption of Mount Hudson (Chile) in October to December 2011 [31]. The March–April 2021 eruption of Mount Veniaminof in Alaska also produced a visible cauldron ~1 km in diameter, east of the prominent and active intra-caldera cone within ice that is ~100 m thick [32,33]. During this period, the emission of ash-plumes, (potential) lava effusion under the intra-caldera glacier and subsidence of glacier ice were reported [33].
Crevassing of glacier ice due to volcanic activity, but without cauldron formation has been reported from Mount Belinda (Montagu Island) in the South Sandwich Islands. Mount Belinda is a small volcanic cone in a 6-km wide ice-filled caldera, with a tidewater glacier draining its northern margin. Mount Belinda experienced a low-intensity volcanically-active period from 2001 to 2007. This included active lava flows and subglacial melt, which is presumed to have promoted glacier acceleration (due to basal lubrication), causing the outlet glacier’s surface to become extensively crevassed [34,35]. An example of an ice mass being affected by subglacial dome growth comes from Mount St Helens (United States) during an active period from 2004 to 2006. At this time, a 1 km2 and 200 m thick glacier occupied the volcano’s “amphitheater”-like crater [36]. During the active period, a lava dome extruded in several spines and squeezed the glacier against the crater wall. The dome extrusion finally split the glacier apart and resulted in heavy crevassing and glacier bulging [37,38].

3. Materials and Methods

In this study, ~1400 freely-available low- to medium-resolution, and a limited number of commercial high-resolution, optical satellite images were investigated. We focused on optical satellite data (rather than other datasets, including Synthetic Aperture Radar (SAR)) since only optical satellite data cover almost half a century and the past decade has seen a rapid increase in the variety of free and commercial datasets potentially suitable for glacier-volcano monitoring. Following Elliot et al. [39], we use the term “low-resolution” for image resolutions of 10–100 m, “medium-resolution” for image resolutions of 1–10 m and “high resolution” for images of less than 1 m resolution. The literature reveals ~66 instances of documented volcanic impacts on glaciers at ~42 volcanoes globally during the optical satellite era (i.e., 1972 to present) [13]. Following detailed analysis of each of these events, we focused on a selection of the best-documented examples that represent major potential volcanic impacts on glacier surface morphology and are therefore considered representative (see Figure 1 and Table 1). Supplementary Table S1 reports the characteristics of all investigated events as reported in the literature and provides an overview of all satellite image sources (commercial and non-commercial) used. Satellite images were obtained through geocento (https://geocento.com/, accessed on 18 November 2020), Google Earth Engine Code Editor” (GEE) [40], USGS EarthExplorer (earthexplorer.com, accessed on 24 February 2021) and Planet (planet.com, accessed on 26 May 2021), and images were viewed in the visible and near-infrared range of the electromagnetic spectrum (including panchromatic bands). Images were enhanced for better visibility using contrast enhancement/histogram stretch (where appropriate) in QGIS 3.10. (QGIS.org, 2021. QGIS Geographic Information System. QGIS Association. (http://www.qgis.org, accessed on 07 July 2021).

4. Results

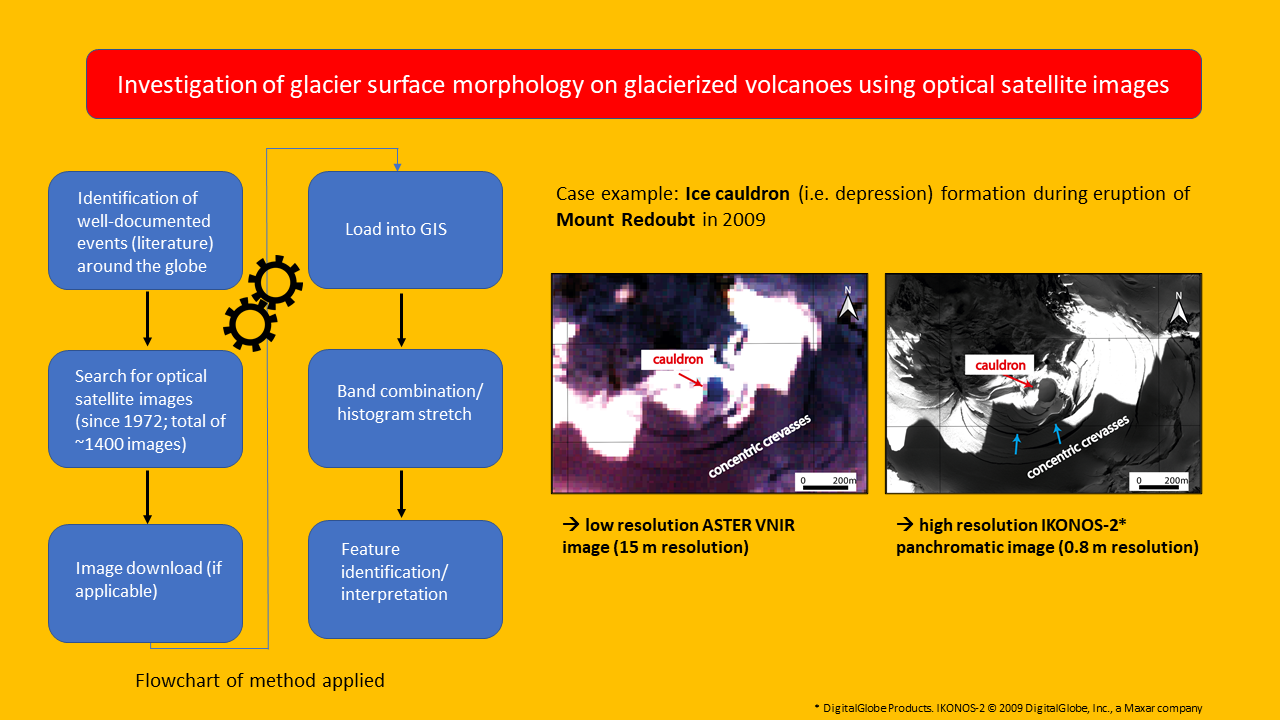
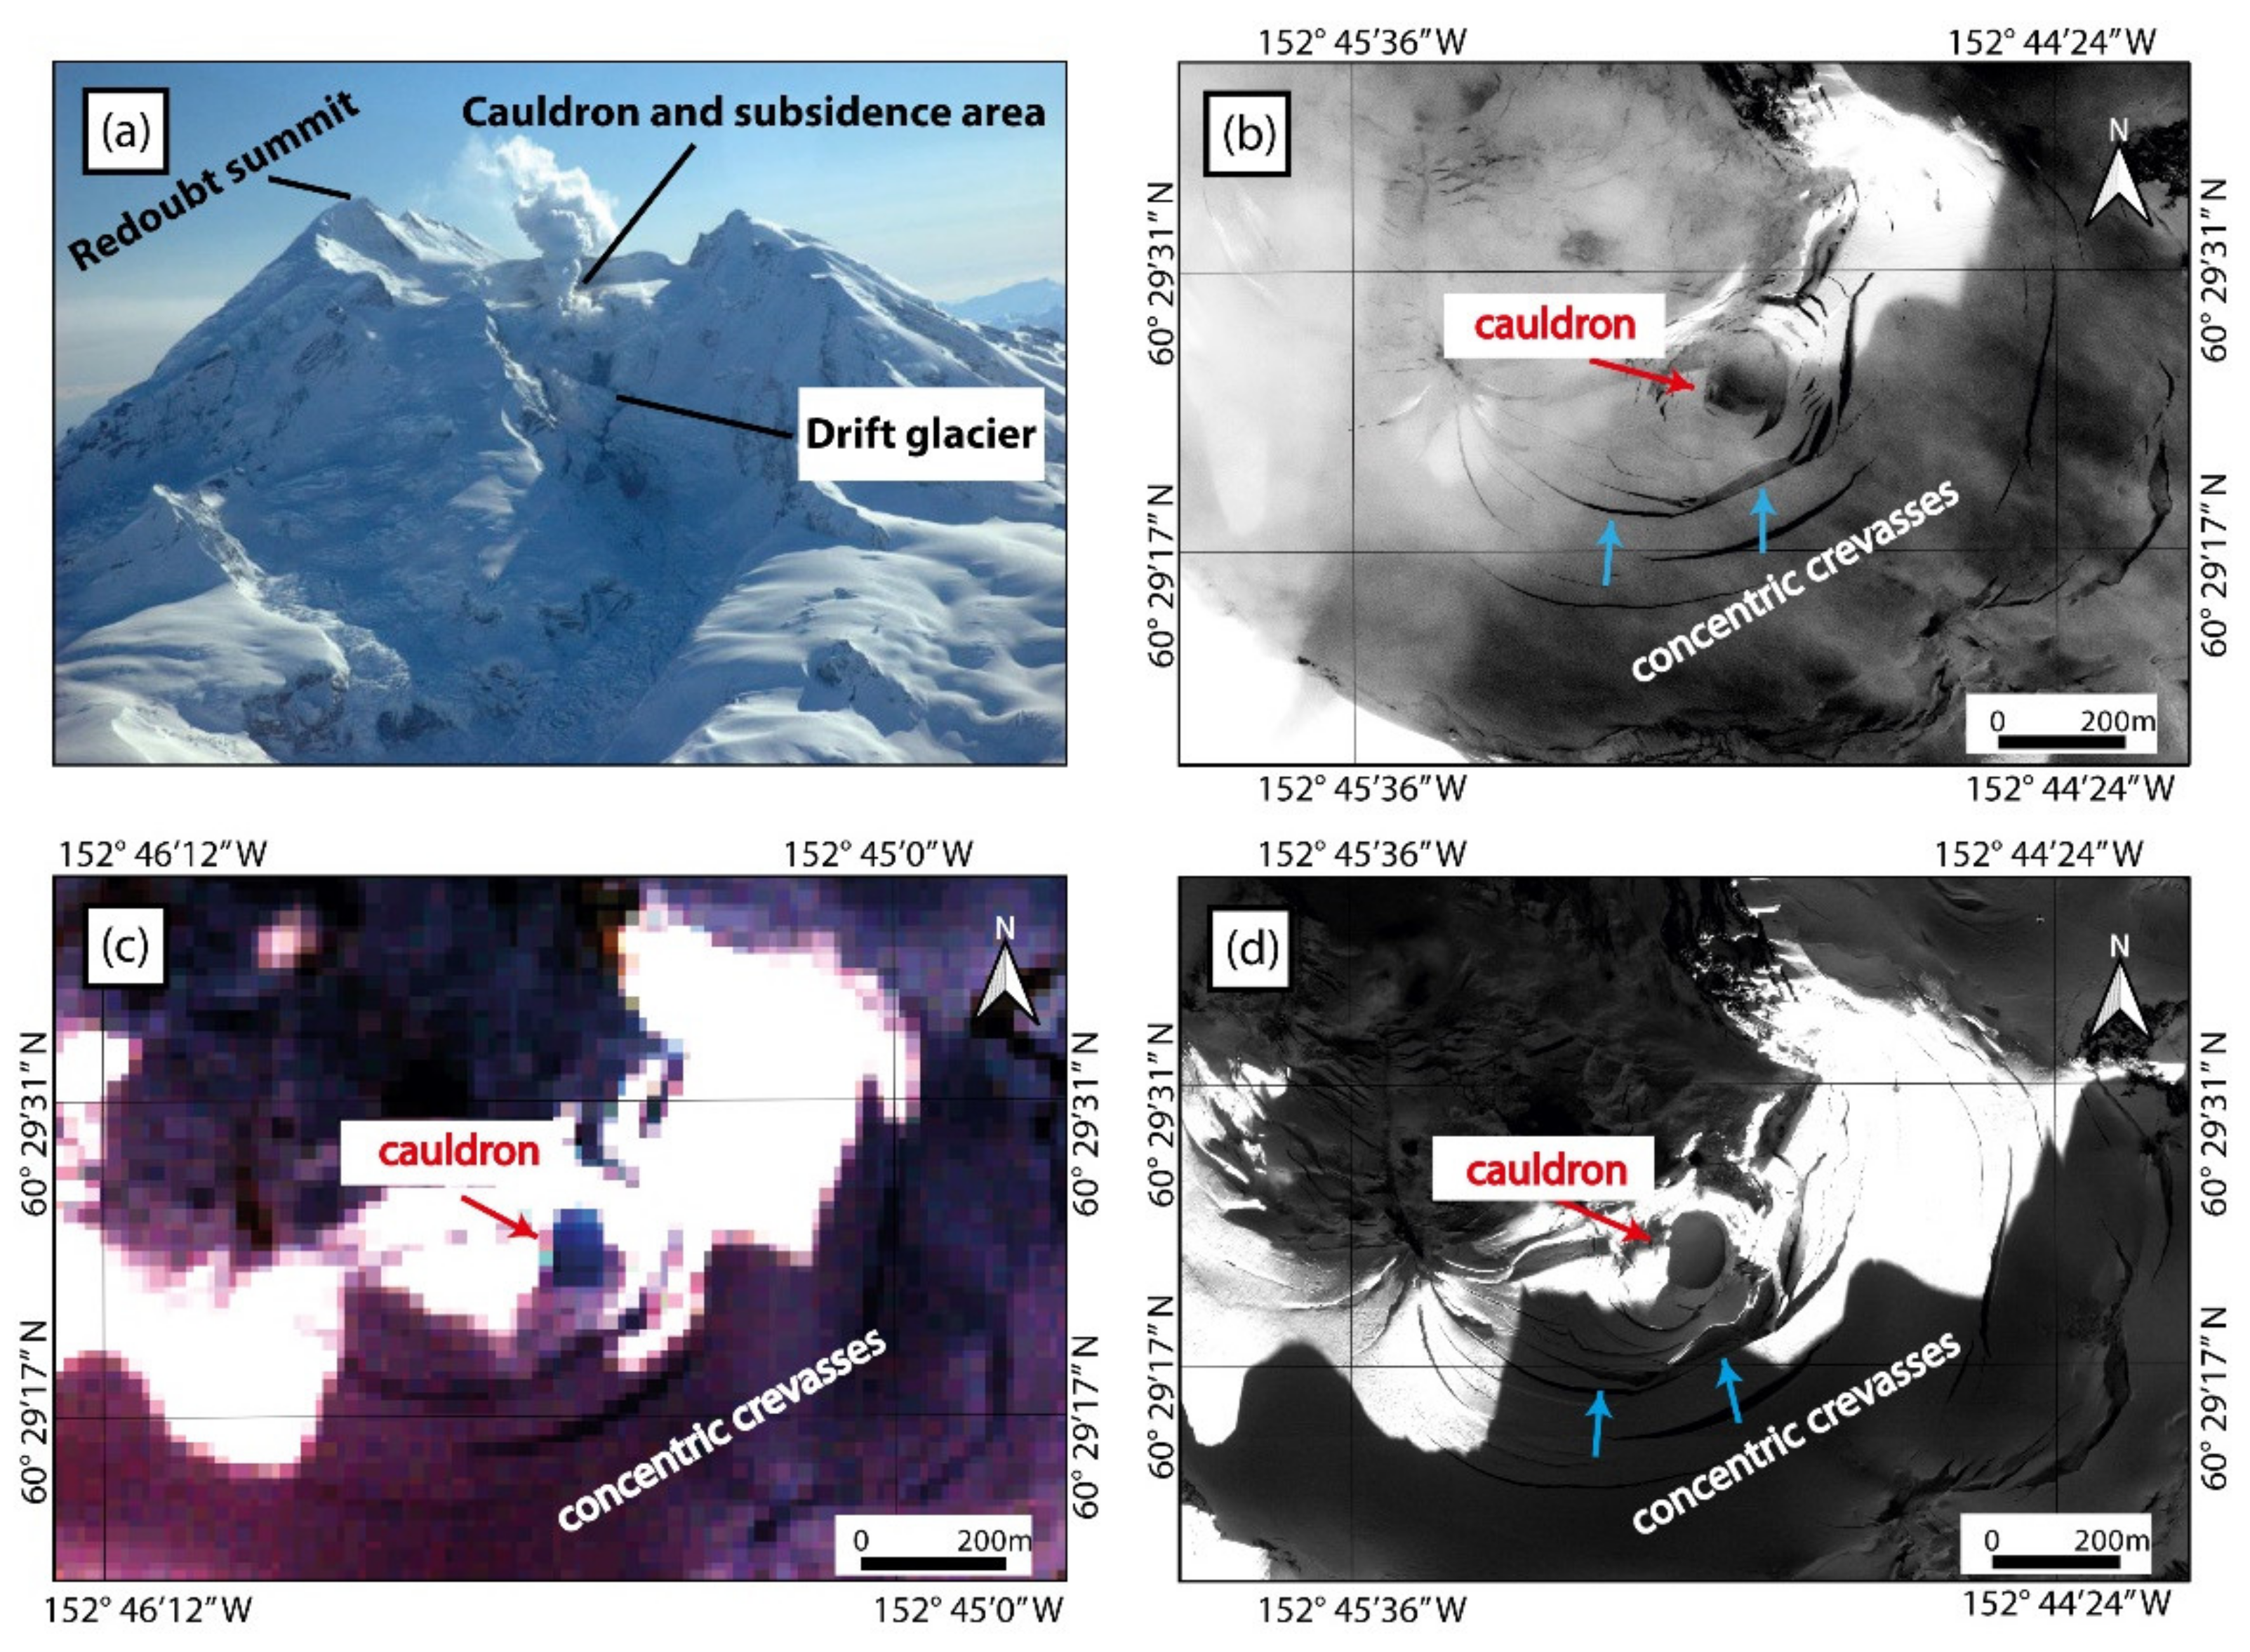
4.1. Ice Cauldron Formation

In principle, ice cauldrons are readily detectable with low-resolution satellite imagery, particularly within thick ice. With satellite sensors operating in the visible and near-infrared range (including multispectral and panchromatic bands), cauldrons appear as dark (shaded) areas against the bright ice surface. A period of geothermal activity beneath Mýrdalsjökull between 1999 and 2005 led to the formation of large ice cauldrons, which were identifiable on ASTER visible and near-infrared (VNIR) images (15 m resolution, Figure 2). During the 2014–2015 Bárðarbunga eruption, three cauldrons developed on the surface of Dyngjujökull glacier in the northern part of the Vatnajökull ice cap. These cauldrons are clearly visible as shadows against the snow-covered ice in a true-colour composite EO-1 ALI image (30 m resolution; Figure 3b). However, in a snow-free EO-1 ALI image (Figure 3c), the cauldrons are not visible, since transmitted radiance from the cauldrons region is not distinguishable from the surrounding dirty ice (even though the cauldrons are present at the time of image capture, as shown by Reynolds et al. [15] using aerial- and TerraSAR-X imagery). An enlarged view of the northernmost cauldron shows evidence of faint concentric crevassing (Figure 3d).

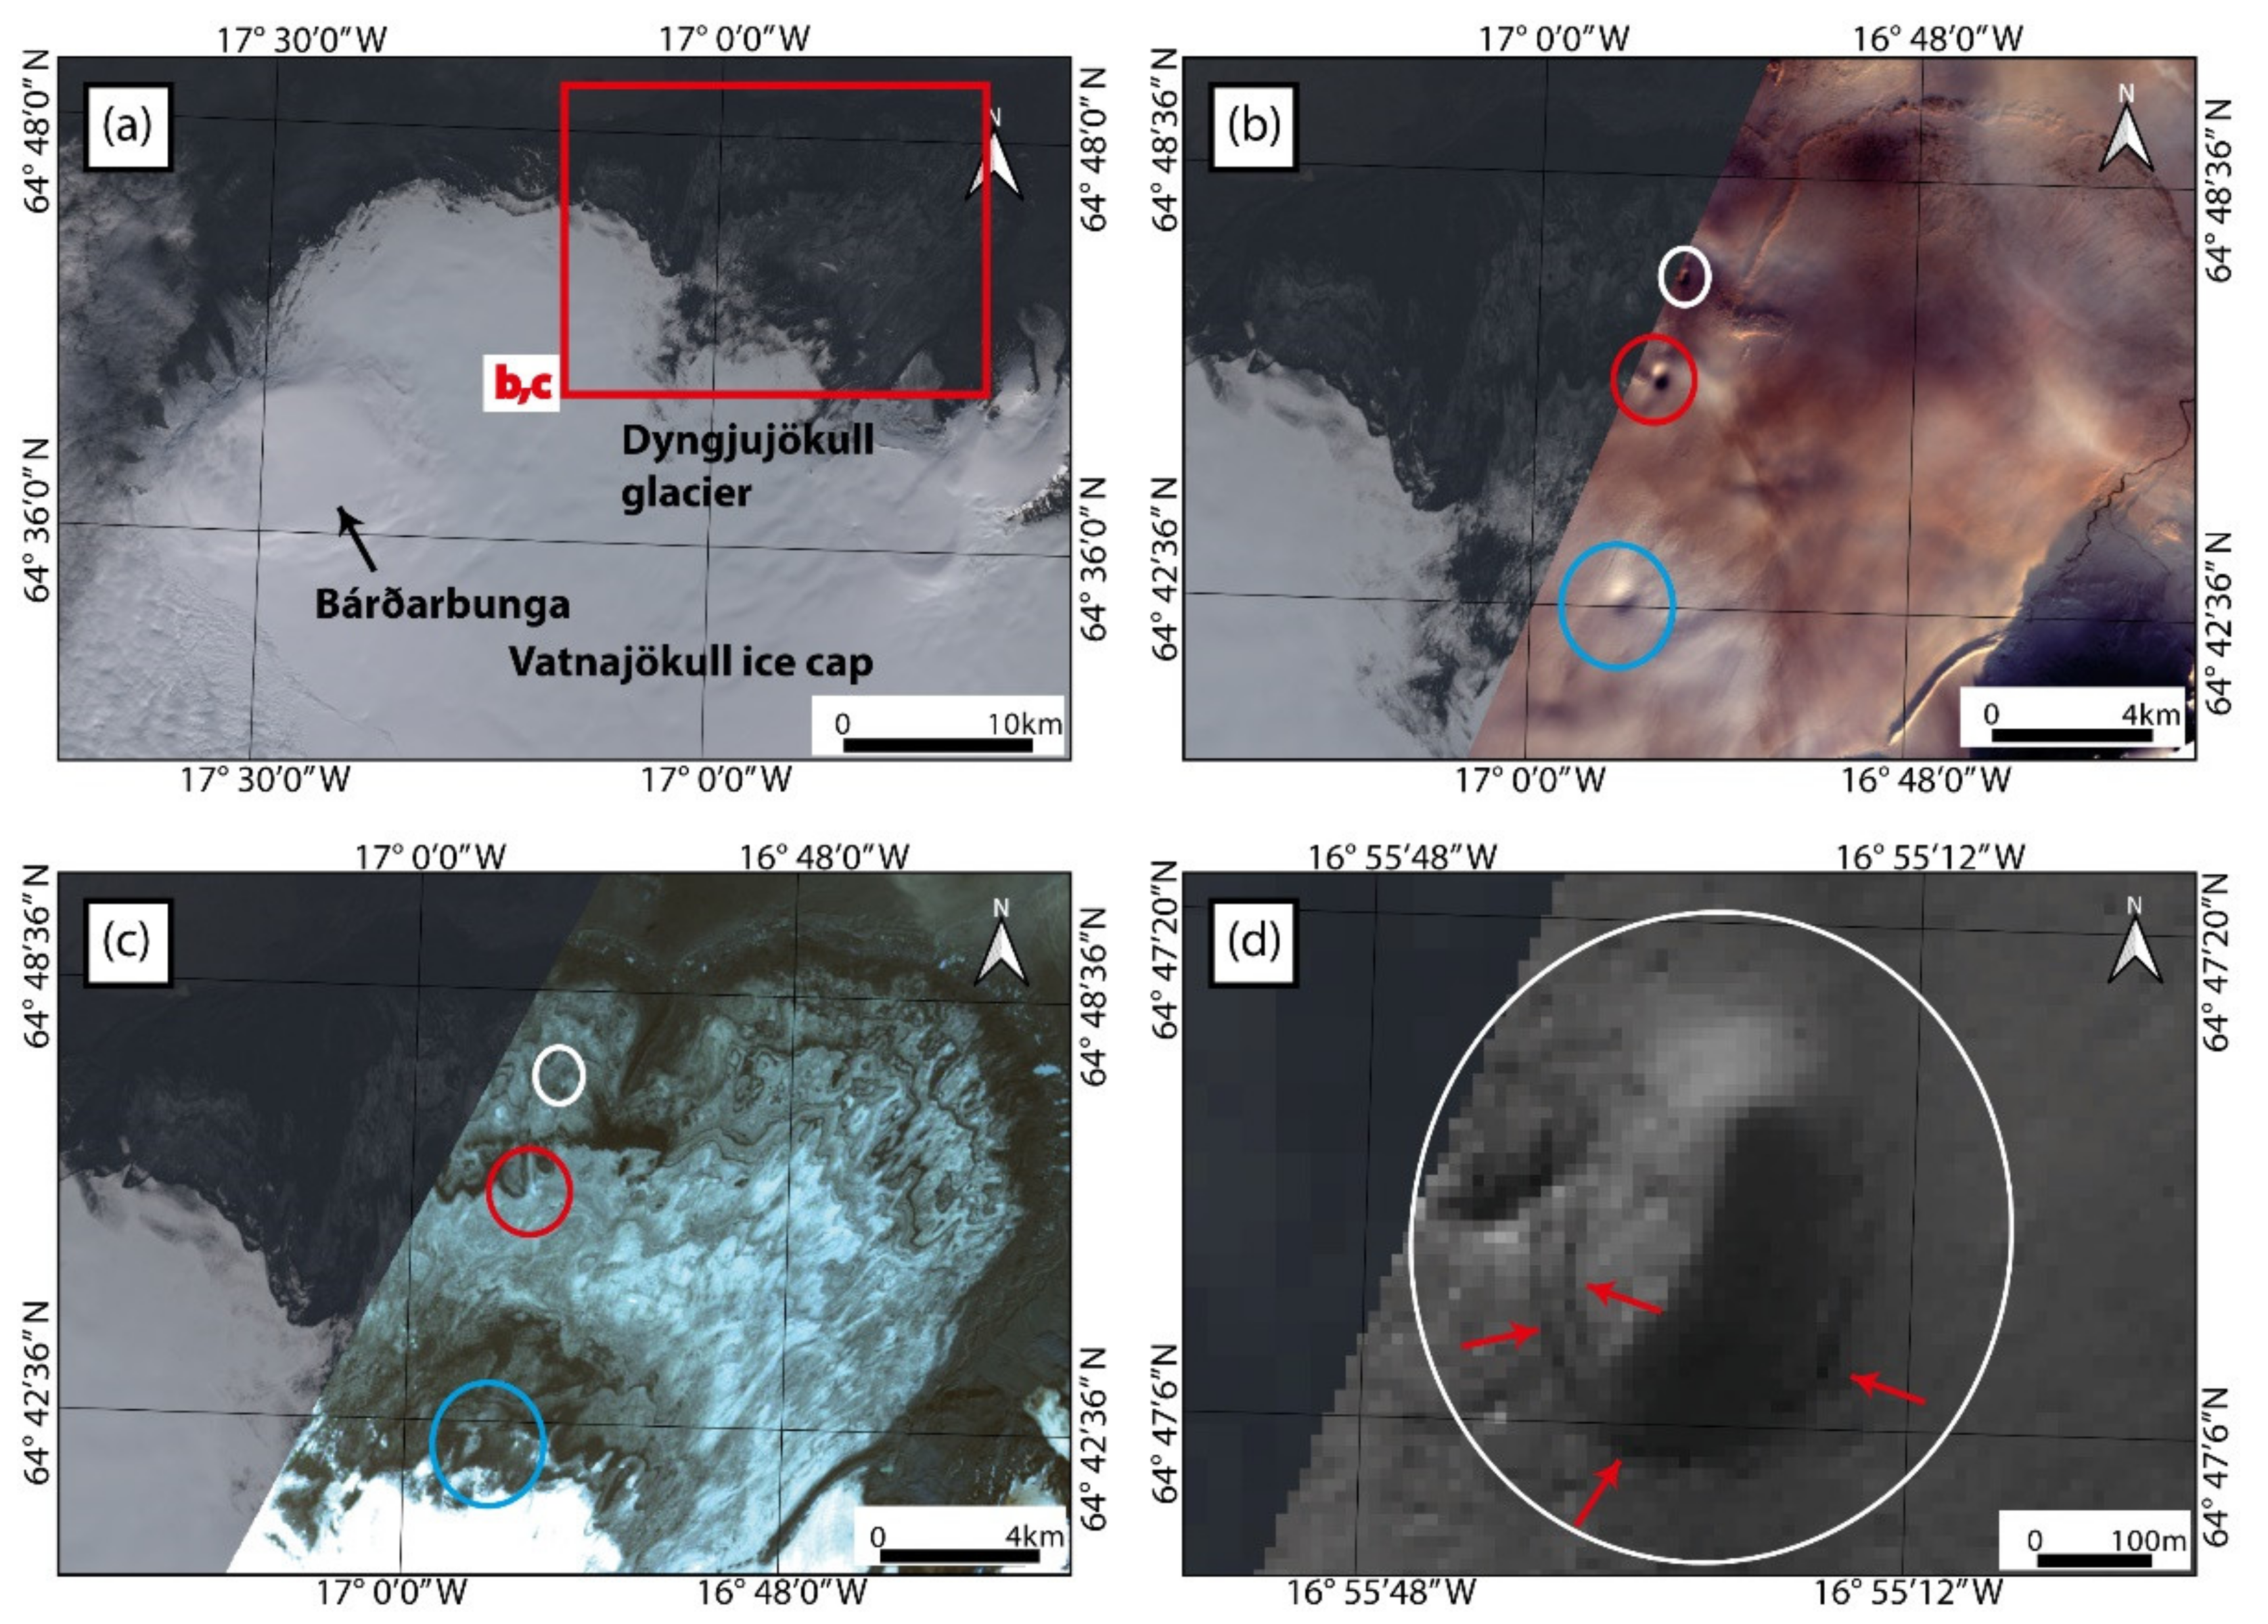
4.2. Opening Formation

Volcanically triggered openings on the glacier surface are in principle observable with low-resolution images (>15 m resolution), however, they are best observed with at least medium-resolution images (~5 m resolution or better) due to the surface texture making it difficult to distinguish between openings and other features on the glacier surface. A notable example comes from Eyjafjallajökull (Figure 4a), where the 2010 eruption, besides melting through the entire ice column in the main crater, produced openings on Gígjökull glacier (Figure 4b,c). A view from April 2010 shows the intact surface of the glacier before the explosive phase of the eruption (inset Figure 4a). Several openings (without concentric crevassing) developed in the upper part of Gígjökull glacier during the eruption due to subglacial meltwater flow [7], and are visible in low-resolution ASTER images (Figure 4b), but better seen with WorldView-1 imagery (2 m resolution) acquired on the same day (red arrows, Figure 4c).

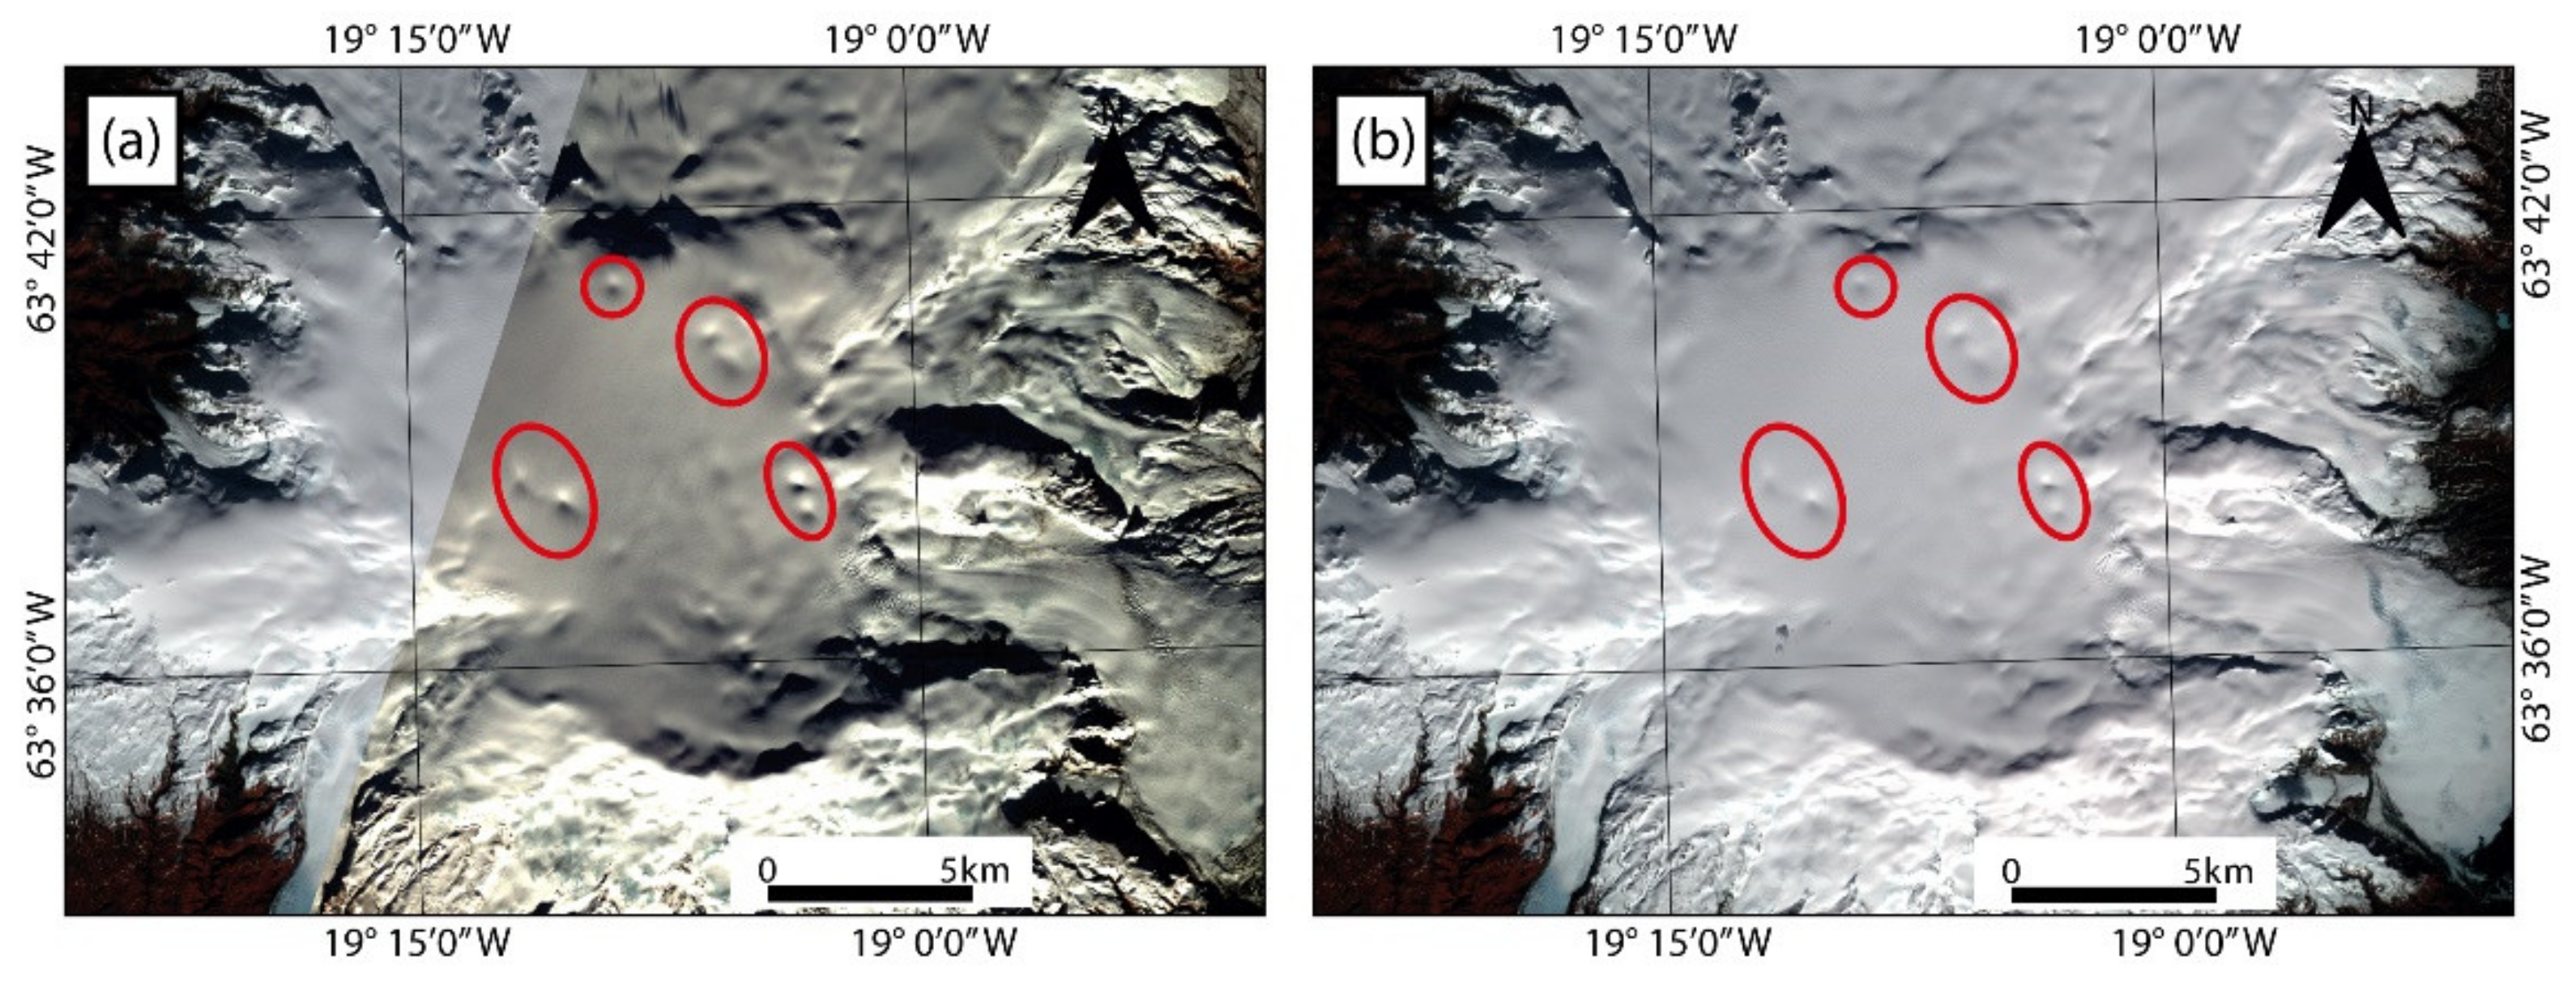
4.3. Glacier Crevassing

In this section, glaciovolcanic factors/events that lead to crevassing of glacial ice are considered. Ice cauldron formation is often associated with concentric crevassing (Section 4.3.1). Other volcanic factors that can lead to glacier crevassing include subglacial lava dome growth (Section 4.3.2), localized crevassing adjacent to supraglacial lava flows (Section 4.3.3) and widespread (glacier-wide) crevassing due to glacier acceleration/advance triggered by increased meltwater at the ice-bed interface (Section 4.3.4).

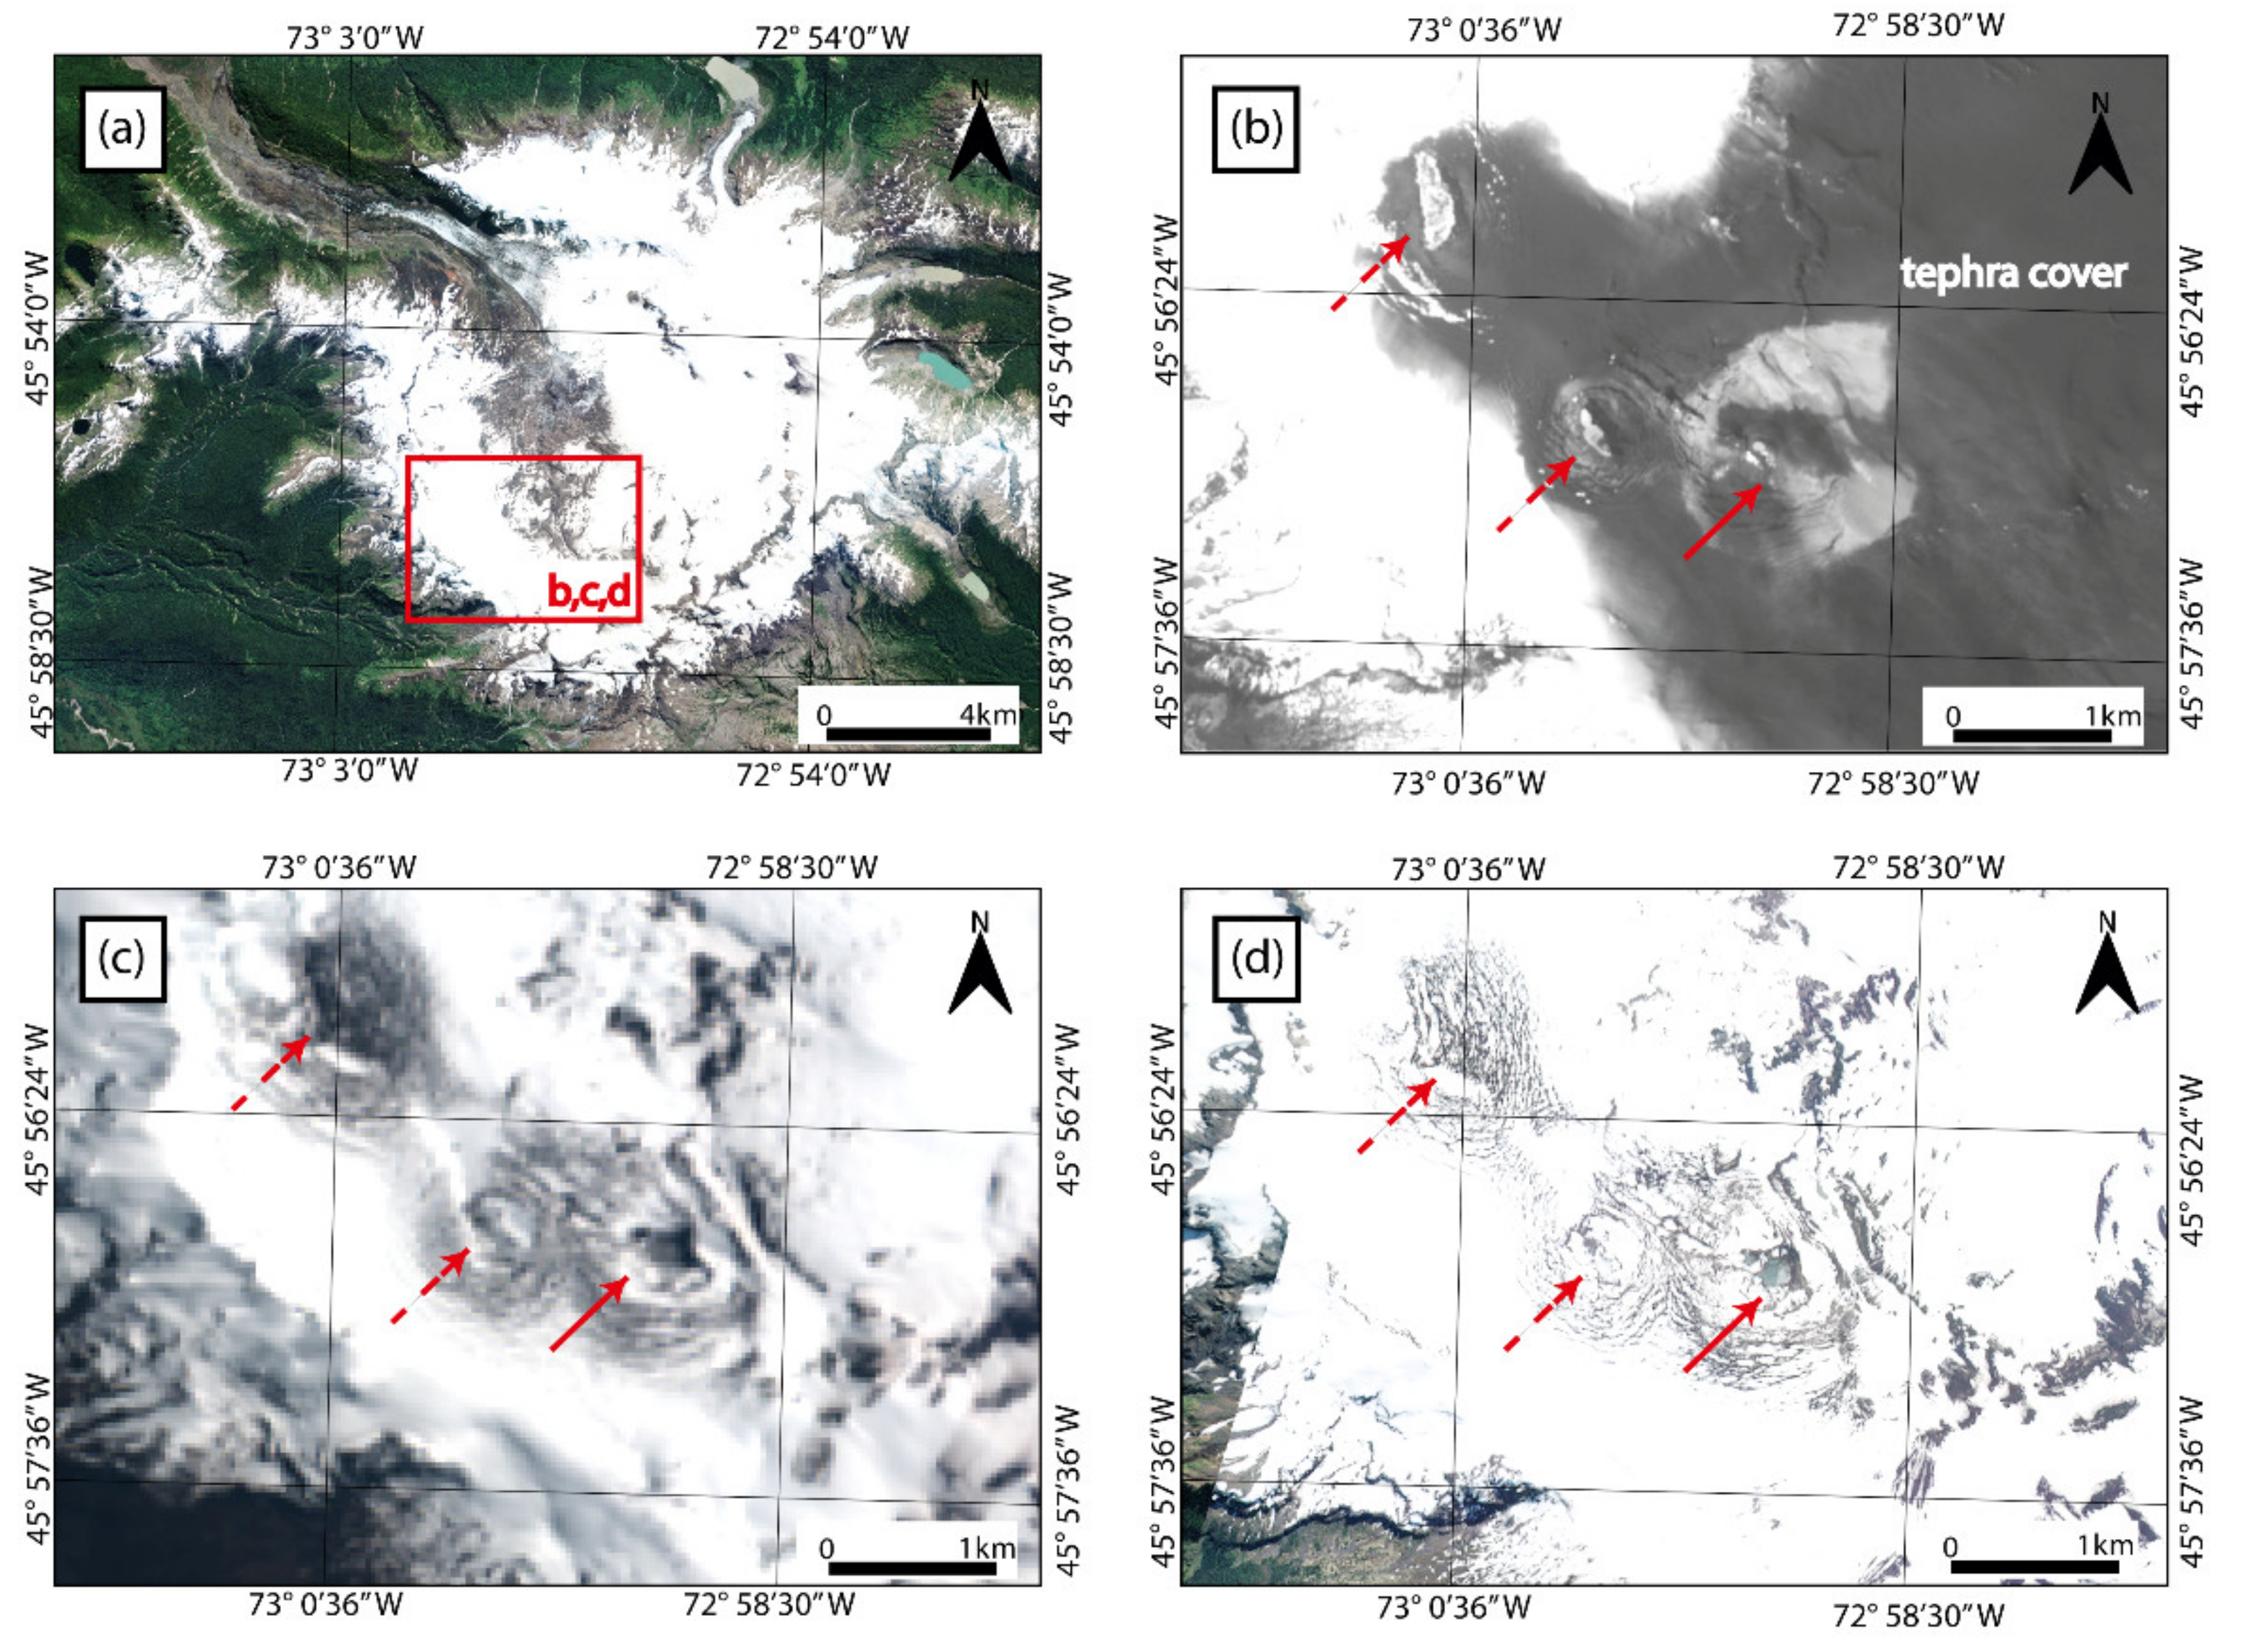
4.3.1. Concentric Crevassing Due to Ice Cauldron Formation

Concentric crevasses related to cauldron formation on ice-covered stratovolcanoes are observed with medium- to high-resolution images, but are too small to be identified with low-resolution images alone. In principle, crevasses can be identified in satellite images as dark fissures on the bright coloured glacial ice and snow. Figure 5a shows Mount Redoubt shortly before its eruption in March 2009, and Figure 5b–d reveal the capabilities of medium- and high-resolution images for ice-cauldron/crevassing detection at this volcano. In this example, the low-resolution ASTER image (Figure 5c) and high-resolution IKONOS-2 image (Figure 5d, 0.8 m resolution) were acquired on the same day. The ice cauldron and concentric crevasses are more clearly visible in the IKONOS-2 image than in the ASTER image due to its high spatial resolution. With high-resolution images, it is not only possible to identify concentric crevasses, but also to accurately monitor their evolution (including changes in their number, length and width). This becomes clear if Figure 5b is compared to Figure 5d. The satellite image in Figure 5b was acquired several days before those of Figure 5c,d and shows a smaller, less evolved cauldron and fewer/smaller crevasses (blue arrows).
In contrast to the cauldrons on Mount Redoubt presented above, in some cases, cauldrons lack a clearly-identifiable central melt-pit and are therefore only indicated by concentric crevassing. This was the case for Mount Hudson during its 2011 eruption, as revealed by Rapid-Eye imagery (5 m resolution, Figure 6).

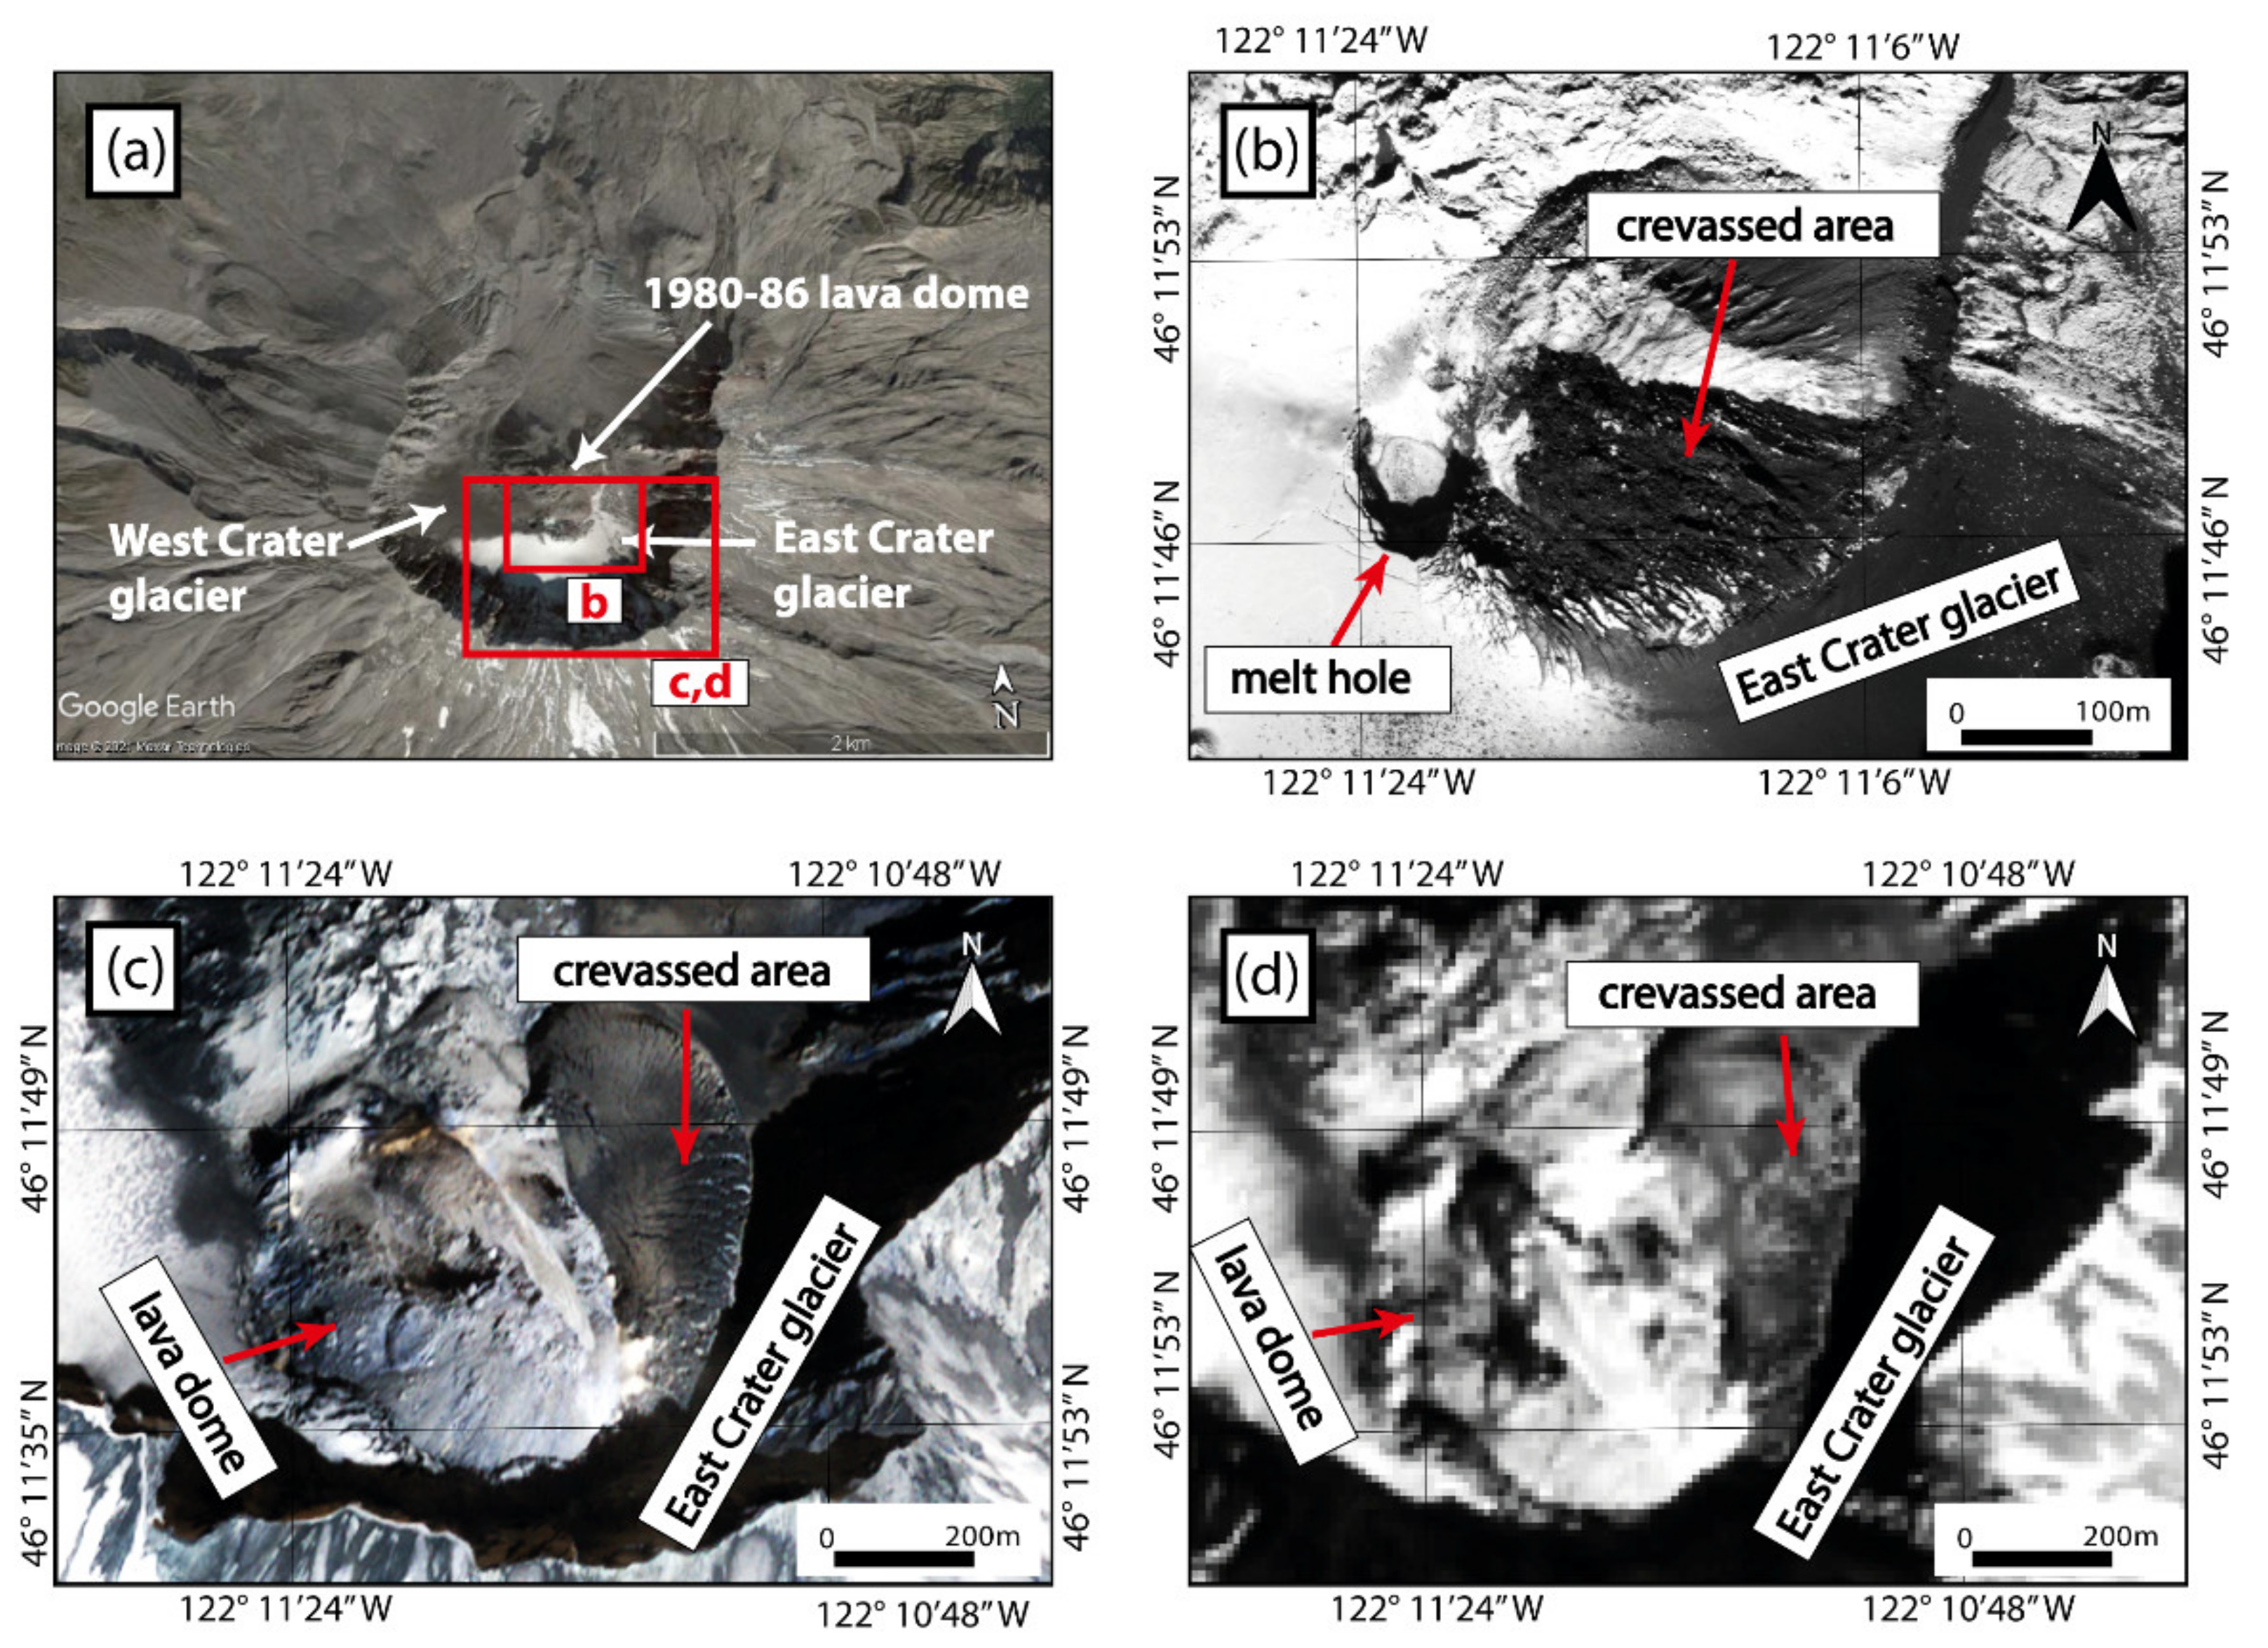
4.3.2. Crevassing Due to Subglacial Lava Dome Growth

Subglacial dome growth on ice-covered stratovolcanoes commonly results in small-scale crevassing, which is often only visible in medium- to high-resolution images. During the eruption of Mount St Helens from 2004 to 2006, a lava dome gradually developed beneath a small crater-occupying glacier. In the initial stage of the eruption in early October 2004, a melt hole formed in the glacier surface (red arrow in Figure 7b) and parts of East Crater glacier became crevassed due to the onset of lava dome growth (Figure 7b). As the lava dome continued to grow, it extruded through the ice, resulting in the deformation and heavy crevassing of East Crater glacier (Figure 7c,d). The impact of dome growth (ice displacement, crevassing and melt-hole formation) on very small glaciers (~1 km2, 200 m thick) such as the one described are best viewed with at least medium-resolution images such as QuickBird 2 (Figure 7c, 2.4 m). High-resolution images (such as QuickBird-2 panchromatic, 0.6 m) might be required particularly when it comes to small scale crevassing (Figure 7b). The impacts mentioned are less clear in medium-resolution EO-1 ALI panchromatic images (10 m resolution, Figure 7d), and almost impossible to observe in low-resolution imagery (>10 m resolution).

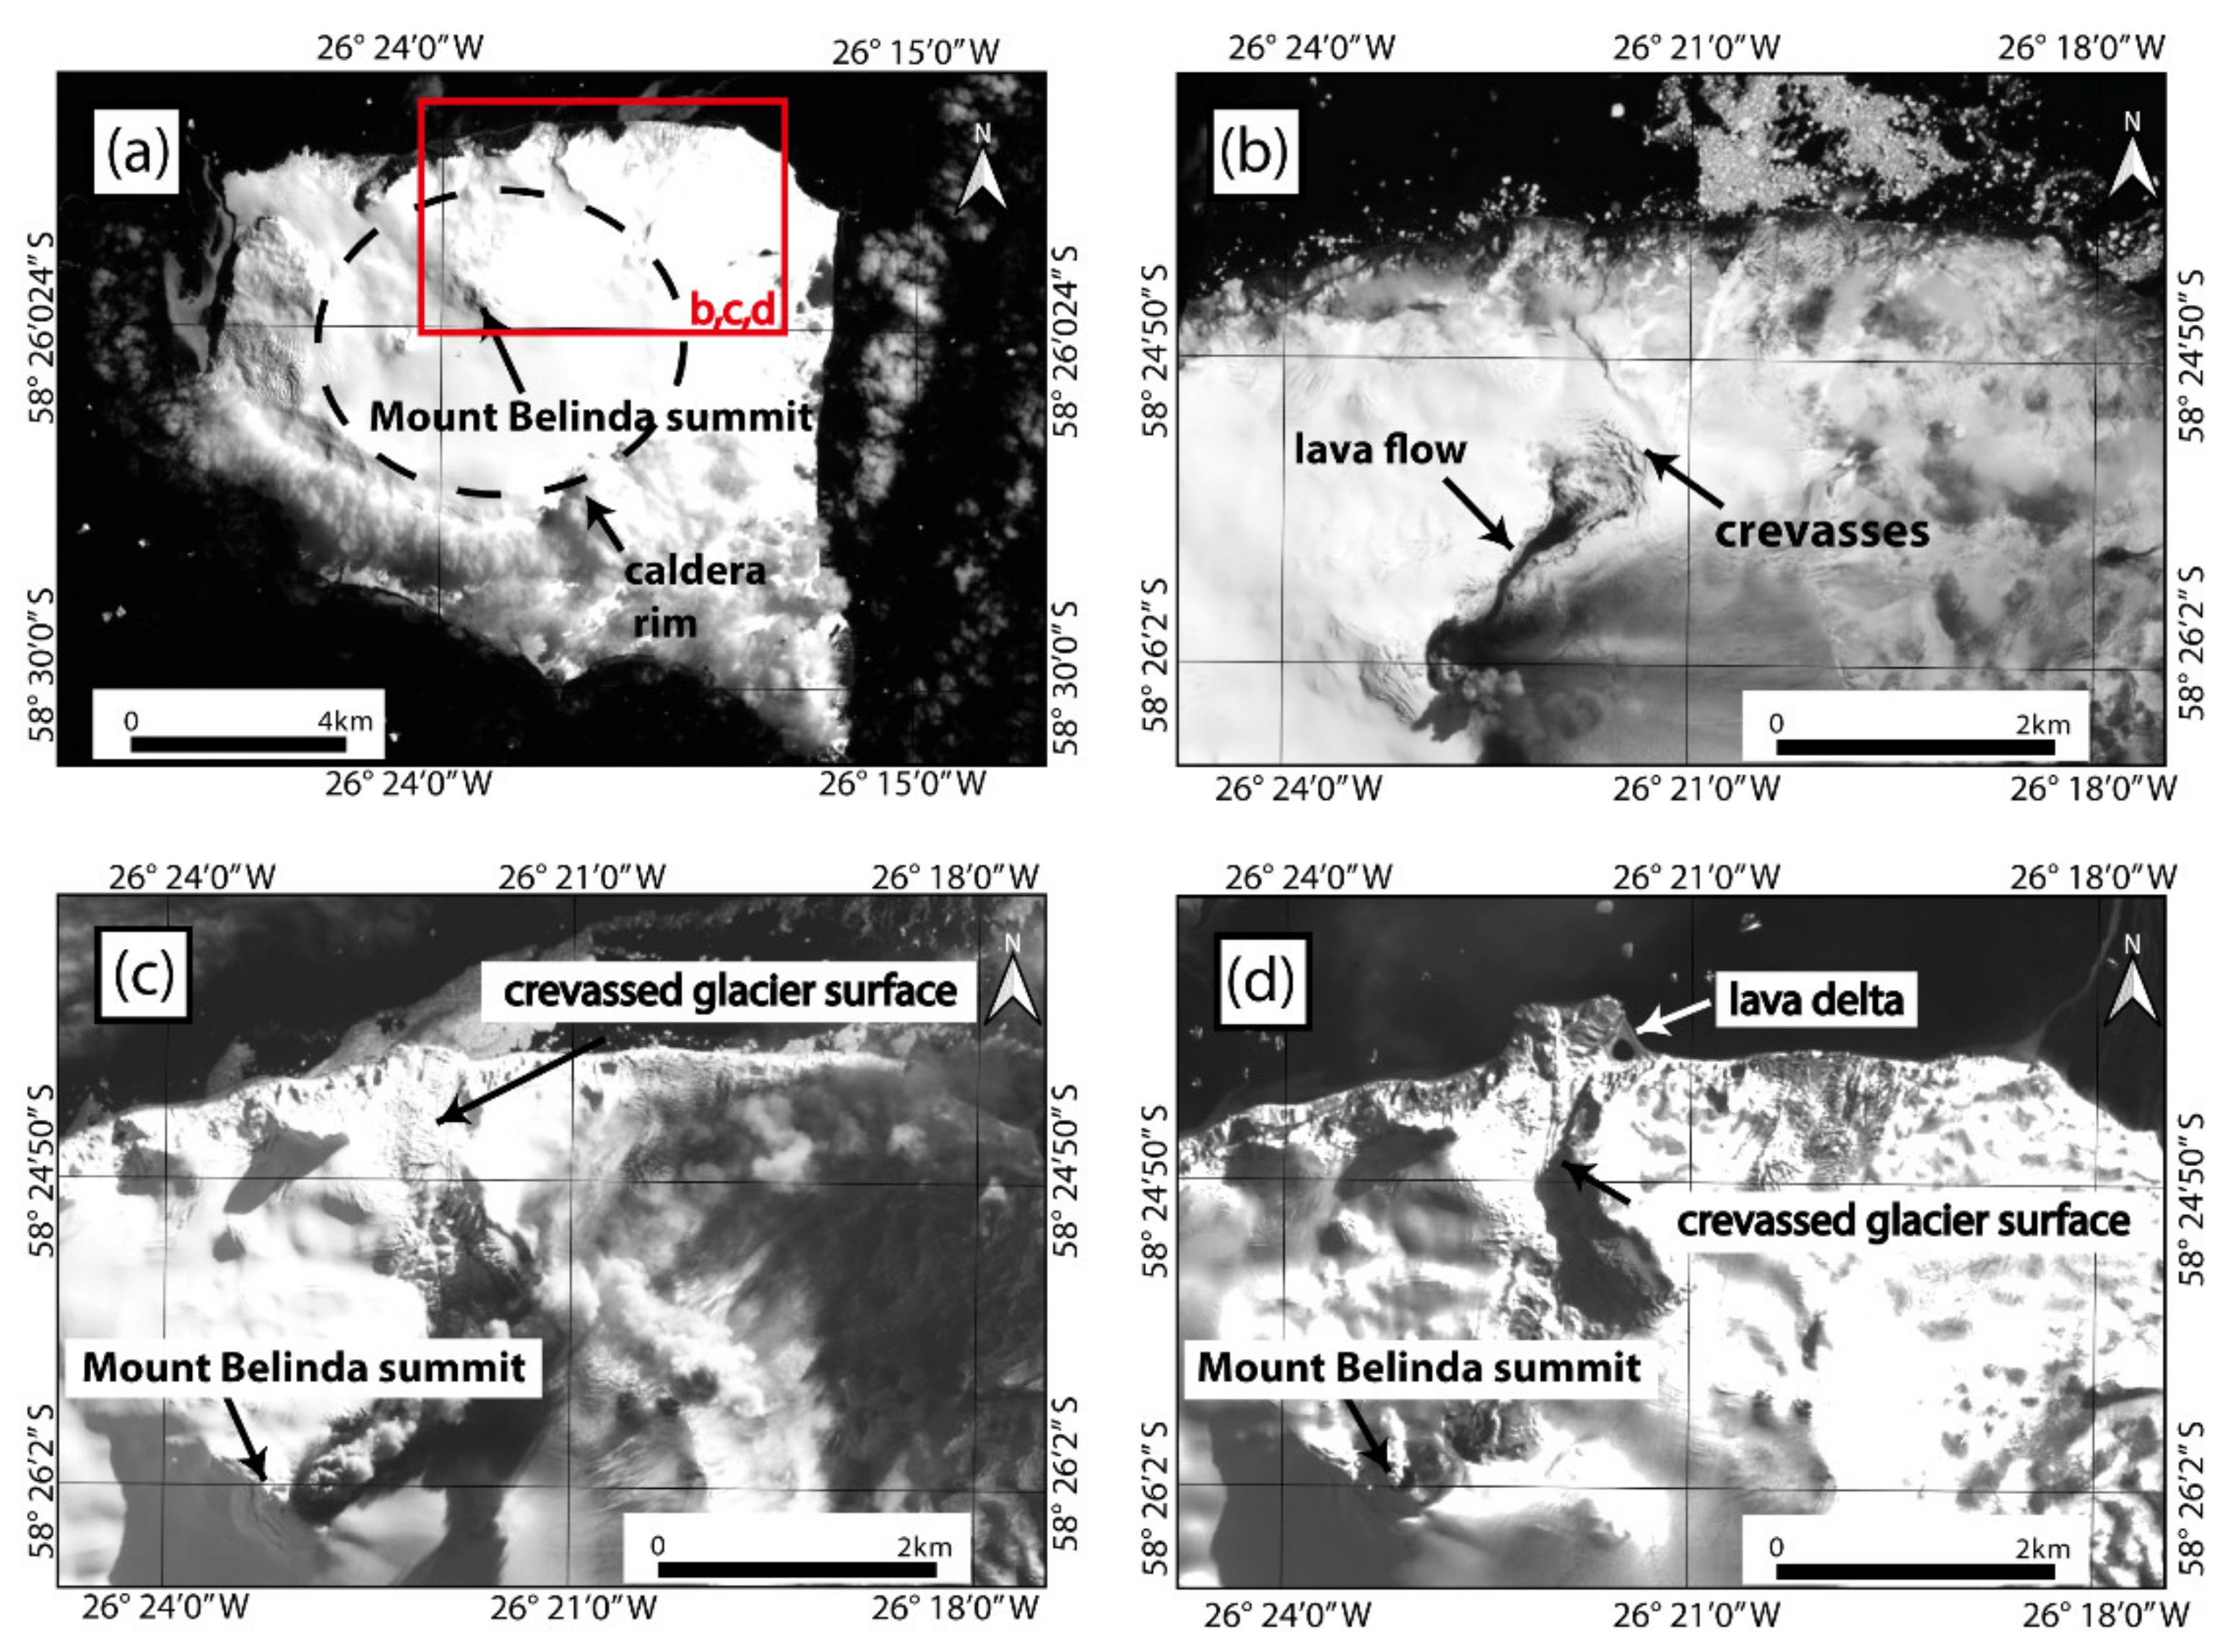
4.3.3. Localized Crevassing Due to Supraglacial Lava Flows

Medium-resolution satellite images (i.e., with resolutions of ~10 m or better) are sufficient to detect crevasses caused by supraglacial lava flows. For example, from 2001–2007, a (mostly effusive) eruption at Mount Belinda (Montagu Island) (Figure 8a) resulted in supraglacial lava flows, which are clearly visible in medium-resolution EO-1 ALI panchromatic imagery (Figure 8b). This medium-resolution imagery also reveals localised crevasses surrounding the supraglacial lava flow (reported by [35]; see Figure 8b). These crevasses presumably indicate that the lava melted deep channels/gullies into the glacier surface [9,34,35]. These melt-gullies are difficult to observe directly, but their impact on the surrounding ice is observed in medium-resolution imagery.

4.3.4. Widespread Crevassing Due to Glacier Acceleration/Advance

During the 2001–2007 eruption at Mount Belinda, the outlet glacier which drains the volcano’s northern flank experienced widespread (i.e., glacier-wide) crevassing. This crevassing is thought to reflect glacier acceleration and advance (i.e., “surging”) in response to subglacial meltwater release during the eruption [9]. The Landsat-7 panchromatic image (15 m resolution) in Figure 8a shows the largely intact (i.e., minimally crevassed) glacier surface ~9 months before the onset of volcanic activity. By contrast, the EO-1 ALI panchromatic images in Figure 8c,d, acquired during the eruptive period, shows widespread crevassing of the glacier surface. Thus, unlike localized crevassing related to ice cauldrons or volcanic dome growth (e.g., Section 4.3.1 and Section 4.3.2), widespread glacier crevassing at Mount Belinda is identifiable even without access to high-resolution imagery.

5. Discussion

From our analysis of the preceding examples of volcano-glacier interactions using optical imagery, we have identified the most readily observed volcanic impacts on glaciers, identified several key challenges to making these observations, and developed some “best practice” guidelines.

5.1. Observable Volcanic Impacts on Glaciers

5.1.1. Ice Cauldron/Opening Formation

Ice cauldrons are the most common volcanic impact on glaciers observable from optical satellite images. For small subglacial eruptions (e.g., Bárðarbunga 2014–2015) or above geothermally active regions (e.g., Mýrdalsjökull) with large ice-thickness, these cauldrons tend not to extend to bedrock (i.e., to the glacier bed), but form depressions that are much wider than deep, typically up to 3-km in diameter see [21]. In optical images, these glacier surface depressions are often observable due to shadowing, which results in areas (inside parts of the ice cauldrons) that are distinct from the usually brighter glacier surface. Due to these often-conspicuous contrasts in surface shading, large surface cauldrons are, in principle, readily observable even in low-resolution satellite images (Figure 3). In some cases, more energetic eruptions can produce ice cauldrons that extend to bedrock. For example, at Gjálp in 1996 ice cauldrons melted through up to 500 m of ice [4]. Though large, these cauldrons can be difficult to observe during, or shortly after eruptions, since the explosive events that lead to their formation also produce ash-laden eruption plumes, preventing direct observation of the ice surface using optical remote sensing sources (e.g., no suitable optical images show the cauldron in the main caldera at Eyjafjallajökull in 2010). Ice cauldron formation is also common at volcanoes with thinner and less extensive ice cover, and cauldrons often extend to bedrock. Using optical satellite images, it is possible to detect these cauldrons on Mount Redoubt during and following its active period in 2009 (Figure 5) and on Mount Hudson during and following its active period in 2011 (see Figure 6). The detection of cauldrons on only partially ice-covered volcanoes creates some difficulties due to an often restricted cauldron size (see Figure 5), combined with a highly variable surface texture, topography and colour at the summit (also see Section 5.2). However, cauldrons are often visible in medium- and high-resolution imagery and appear as either dark spots (<a few pixels) or regions (multiple pixels), depending on image resolution (see Figure 3 and Figure 4). Particularly large lahars might be generated by eruptions through crater lakes depending on the amount of lake water involved [12]. Similarly, large amounts of water stored in ice cauldrons formed before a large eruptive event might increase the likelihood of large lahars, emphasising the importance of identifying ice cauldrons.

5.1.2. Crevassing

Glacier crevassing is another volcanic impact on glaciers commonly observable from optical satellite images. These crevasses are often localized and concentric (e.g., encircling ice cauldrons), but can also be more widespread, and irregular or linear in form. In fact, all volcanic impacts on glaciers discussed in this paper are, to some degree, associated with crevassing. In principle, crevasses are visible as dark stripes in optical satellite images (Figure 8c), though their detection depends on a notable colour contrast between the crevasse and the surrounding glacial ice and snow. Various approaches have been used to detect widespread regions of crevassing on “non-volcanic” glaciers, using low- to high-resolution optical satellite images [41,42,43,44,45,46]. However, some volcanically-generated glacier crevasses (e.g., those forming around the margins of ice caldrons or those forming related to subglacial dome growth) are often small and comparatively isolated (rather than widespread), meaning that individual landform identification can be challenging, and requires medium- to high-resolution imagery. In addition, when investigating glacierized volcanoes, being able to monitor crevasse development (e.g., crevasses appearing where they were formerly absent) and evolution (e.g., growth) is important. This generally requires imagery with both high spatial and temporal resolution, and is easier for glaciers that are not already heavily crevassed (see Figure 8).

5.2. Difficulties with Observing Volcanic Impacts on Glaciers

In this study, we have identified some key challenges of using optical satellite images to study volcanic impacts on glaciers. Often, extensive cloud cover and eruption plumes limit the temporal resolution of useful imagery for a specific volcano. This is a problem common to optical remote sensing of many volcanoes globally, not just those that are glacier-clad. One potential solution (though not the focus of this study) is to use SAR satellite data operating in the microwave region of the electromagnetic spectrum, which can penetrate clouds due to a larger wavelength used. For example, crevassing of the glacier surface yields an increased backscatter of amplitude SAR data used to identify ice cauldrons and meltwater tunnels on Mýrdalsjökull [47]. Supraglacial snow cover also introduces difficulties with observing volcanic impacts on glaciers from optical imagery, since details of the ice surface are often obscured. This is particularly relevant for volcanic events that occur during winter (or the snow season). However, in some cases, snow cover can be an advantage, since it creates a homogeneous surface of low contrast, making subtle changes in topography (e.g., ice surface cauldrons) easier to identify (see Figure 3).
In general, low-resolution optical imagery is useful for identifying and monitoring some larger volcanic impacts on glacier surface morphology, but is unable to resolve smaller features including some crevasses, cauldrons, ice domes and supraglacial channels. Observing volcanic impacts on small (thin) glaciers can also be particularly challenging, since these glaciers typically have steep, and heavily crevassed surfaces (due to the influence of steep and undulating bed topography), with frequent bedrock protrusions sometimes difficult to distinguish from glacial ice and/or volcanic extruding features. Given these issues with scale, detailed investigation of volcanic impacts on glaciers often requires medium-resolution imagery of at least ~5 m. At present, this has cost implications, since freely-available imagery often is of low resolution. A further problem of image availability is that historical eruptions are typically poorly covered by satellite imagery. This applies most notably to events that occurred prior to the widespread availability of imagery from Landsat 7 and ASTER satellites (both launched in 1999). This leads to a strong temporal bias towards more recent eruptions (see examples presented in this study).
In addition to these challenges with image availability, it is also difficult to assess the required (or optimal) frequency of image acquisition for successful monitoring of glacier-clad volcanoes. The timescales that apply for the formation of the features discussed in this paper vary considerably from several minutes to months/years. For instance, the formation of new ice cauldrons in the summit area of Eyjafjallajökull in 2010 took place within minutes [5], whereas squeezing of glacier ice and related crevasse formation on the Crater glacier during the extrusion of a volcanic dome on Mount St. Helens continued for about two years [37,38]. The time-frame for widespread crevassing of a glacier due to increased generation of basal meltwater (as observed on Mount Belinda) likely lies somewhere between those two endmembers. Therefore, in some quickly evolving instances images would ideally be acquired very frequently (~several per day), whereas other instances could, in principle, be sufficiently well monitored based on the common repeat cycle of ~16 days for Landsat or ASTER, though issues with cloud cover and eruption plumes remain.
Finally, when viewing optical satellite imagery, it is sometimes difficult to discern the precise nature of volcano-glacier interactions. For example, supraglacial flow paths of volcanically-triggered floods and lahars are typically easy to distinguish because the debris deposited contrasts with the bright glacier surface. However, using satellite imagery alone, it is difficult to establish whether these events incised channels into the ice, or just flowed across the glacier surface. This also applies to supraglacial lava flows, which are often notably darker than the surrounding ice, but optical images provide little information about whether the glacier surface has been melted/incised. In this latter example, crevasses radiating from a lava flow’s terminus (e.g., Mount Belinda, Figure 8b) can provide some indication that, through melting, the lava has had an impact on the glacier surface morphology (also see [35]). Part of this challenge in observing volcanic impacts on glaciers using optical satellite imagery is the lack of quantitative information on changing ice surface elevations (a key indicator of ice melt, fracture, doming, etc.). This clearly points to digital elevation models (DEMs) as potentially useful sources (though not the focus of this study), particularly when multiple high-resolution DEMs representing conditions before and after periods of volcanic unrest are available. For example, Rossi et al. [24] used pre- and post-event DEMs to identify and measure supraglacial ice cauldrons formed during the 2014–2015 Bárðarbunga eruption.

5.3. Guidelines for Best Practice

For the purposes of monitoring glacier-clad volcanoes, being able to detect volcanic impacts on the surface morphology of glaciers is important. With that in mind, here we outline a set of general guidelines for anyone undertaking (or wishing to undertake) this task using optical satellite imagery.

5.3.1. Site Overview and Image Availability

For a particular volcano, glacier and/or event, satellite image availability is a key factor determining which volcanic impacts on glaciers are identifiable. For historical analysis (rather than monitoring), this is primarily determined by the period of interest. For example, for older events (but still within the satellite era), e.g., those that occurred between 1972 (the launch year of Landsat 1) and 1999, imagery is mostly of low spatial resolution, and choice of satellites is very limited (e.g., Landsat 1-5 and SPOT 1-4) [39]. For events that have occurred since 1999, the range and resolution (spatial and temporal) of available images improves dramatically, particularly in recent years. Some free, but low-resolution, sources (e.g., Landsat 7, ASTER) are available throughout this period. Medium- and high-resolution images are also available (e.g., since the launch of IKONOS in 1999), but are typically commercial, rather than accessible for free.
Given the costs associated with obtaining high-resolution imagery, for the purposes of observing volcanic impacts on glaciers, lower resolution, but freely available, imagery can serve as a foundation. These images can then be supplemented with “targeted” and judiciously selected (i.e., covering specific areas and/or time periods) commercial imagery.
Free and commercial imagery is available via various websites, and some image types (e.g., Landsat and ASTER) are often easiest to access through platforms such as Google Earth Engine [40]. In some cases, freeware virtual globes (e.g., Google Earth and NASA Worldwind) and web mapping services (e.g., Bing Maps and Google Maps) can provide access to high-resolution images (with plugins available to export images into GIS packages such as QGIS). Thus, virtual globes and web mapping services allow access to high-resolution imagery, without the costs associated with commercial data. However, due to the limited availability of images, and the lack of user choice in image selection, these platforms rarely have images (and certainly not multiple images) covering a particular time period of interest (c.f., [13]), and are of limited use when considering highly dynamic environments (such as those associated with active volcanism).

5.3.2. User Experience

The ability to identify volcanic impacts on glaciers using optical satellite imagery partly depends on user experience. For most users (particularly those with comparatively limited experience), examining “known” (or documented) examples, such as those highlighted in this paper, is likely to be useful. This might involve observing volcanic impacts in the field, from existing ground-based or aerial photographs, or by looking at medium- to high-resolution satellite imagery. This is likely to be particularly useful for distinguishing between bedrock protrusions and features related to volcanic activity. Once familiar with the types of features that are present, previously undocumented volcanic impacts on glaciers can be searched for, using lower resolution imagery if necessary.

5.3.3. Using Multi-Temporal Images

Since observing volcanic impacts on glaciers effectively involves change detection (e.g., the development of glacier crevasses where they were previously absent), observing satellite images from a range of time periods (pre-, syn- and post-volcanic activity) is important. This is often possible by generating a time-series of images (in native resolution), e.g., using Google Earth Engine Code Editor, which requires some java script knowledge [40]. When producing such a time series, image availability (see Section 5.3.1) might be a limiting factor; however, where possible, images which show the glacier surface in its “natural” (i.e., non-volcanically impacted) state are key. This is particularly true of images from the same season (but perhaps a different year) as the period of volcanic unrest. How long before, or after, a period of activity images are useful/relevant is unclear, though some glaciers are known to have experienced changes in surface morphology months prior to eruptions (e.g., Mount Redoubt, 2009), and many impacts were still observable years after [13].
As the spatial and temporal resolution of imagery continue to improve over coming years, monitoring volcanic impacts on glaciers will likely be easier (particularly obtaining cloud-free images) and possible with greater detail than for historical events. In many cases, images are likely to be available on cloud-based platforms such as Sentinel Hub Playground (https://apps.sentinel-hub.com/sentinel-playground/, accessed on 18 March 2021), which allow data visualisation and manipulation (e.g., producing different band combinations) without having to download.

5.4. Mount Veniaminof: A Recent Example

Section 5.3, presented guidelines for best practice for monitoring of glacier-clad volcanoes. In this section, we apply these guidelines to document changes in glacier surface morphology on Mount Veniaminof (Alaska) during its very recent active period from March–April 2021. Emission of ash-plumes, (potential) lava effusion under the intra-caldera glacier and subsidence of glacier ice were reported [33]. Both low spatial resolution Landsat-8 panchromatic images (15 m resolution) and medium spatial resolution Sentinel-2 images (10 m resolution) are sufficient to detect a newly developed ice cauldron and concentric crevasses in the glacier surface (Figure 9). Due to repeated image acquisition (i.e., the 5-day repeat cycle of the Sentinel-2 satellites), ice-cauldron evolution could be monitored with a much better temporal and spatial resolution than most of the other cases presented in this work. This example clearly demonstrates the improved potential of recently launched optical satellites for monitoring of glacier-clad volcanoes.

6. Conclusions

Recent years have seen a rapid increase in freely available and commercial optical satellite images, covering large parts of the Earth. In this study, this global data source has been searched for evidence of volcanic impacts on glacier surface morphology, with a focus on well-known (documented) examples from the literature. The main conclusions are:
  • The most common volcanic impact on glacier surface morphology observable in optical satellite imagery is the formation of ice cauldrons (i.e., depressions in the glacier surface). Depending on eruption energy/type, ice thickness and image resolution, these cauldrons often appear as dark points/areas or as regions of distinct shadowing which contrast with the usually bright glacier surface.
  • Other observable volcanic impacts on glacier surface morphology are widespread glacier crevassing, localized crevassing (e.g., adjacent to supraglacial lava flows or ice cauldrons) and ice bulging and fracturing due to subglacial dome growth.
  • All volcanic impacts on glaciers investigated in this work are, to some degree, associated with crevassing, which is commonly visible as dark stripes on optical satellite images.
  • The key challenge when using optical satellite images to study volcano-glacier interactions is the availability of cloud- and plume-free images with sufficient spatial and temporal resolution to observe (and monitor) the evolution of (sometimes) small-scale changes in glacier surface morphology. Useful imagery is increasingly available, but this does not help when observing historical eruptions, and the widespread use of commercial imagery is usually prohibitively expensive. Lower resolution imagery is often freely available, but identifying and interpreting changes in glacier morphology from these sources requires greater user experience.
  • Overall, optical satellite imagery is a useful source for studying changes in glacier morphology caused by volcanic activity, particularly in remote and inaccessible parts of the world. This suggests that global-scale analysis and monitoring are possible. However, due to the costs of high-resolution (spatial and temporal) imagery, and the limited quantitative information that can be extracted, optical satellite imagery is best used in combination with DEMs, radar data, aerial images (derived from planes and/or drones) and ground-based observations.

Supplementary Materials

The following are available online at https://www.mdpi.com/article/10.3390/rs13173453/s1, Table S1, References [48,49,50,51,52,53,54] are cited in Supplementary Table S1. Table S1 presents the characteristics of all the glacier-clad volcanoes investigated in this study and presents the numbers of available/useful images for non-commercial satellite images (Sheet: “non-commercial satellite images”) and the numbers of ordered commercial satellite image (Sheet: “commercial satellite images”). A third Sheet (“satellite specifications”) details characteristics (spatial resolution and revisit time) of the respective satellite sources used.

Author Contributions

Conceptualization, I.B., B.E., E.S. and M.S.; methodology, M.D.M.; investigation, M.D.M.; writing—original draft preparation, M.D.M. and I.B.; writing—review and editing, B.E., E.S., M.S. and S.V.; supervision, I.B., B.E., E.S. M.S.; funding acquisition, I.B., B.E., E.S. and M.S. All authors have read and agreed to the published version of the manuscript.

Funding

This research and APC were funded by a Leverhulme Trust Research Project Grant: RPG-2019-093.

Data Availability Statement

Landsat and EO-1 data available from the USGS Earth Resources Observation and Science (EROS) Center; ASTER data are distributed by the Land Processes Distributed Active Archive Center (LP DAAC), located at USGS/EROS, Sioux Falls, SD. http://lpdaac.usgs.gov (accessed on 26 May 2021); Sentinel-2 data available from European Space Agency (ESA)/Copernicus; RapidEye and PlanetScope images obtained via planet: Planet Team (2017), Planet Application Program Interface: In Space for Life on Earth. San Francisco, CA. https://api.planet.com (accessed on 26 May 2021).

Conflicts of Interest

The authors declare no conflict of interest. The funders had no role in the design of the study; in the collection, analyses, or interpretation of data; in the writing of the manuscript, or in the decision to publish the results.

References

  1. Smithsonian Institution. Volcanoes of the World, Version 4.10.2; Venzke, E., Ed.; Smithsonian Institution: Washington, DC, USA, 2013. [Google Scholar]
  2. Edwards, B.; Kochtitzky, W.; Battersby, S. Global Mapping of Future Glaciovolcanism. Glob. Planet. Chang. 2020, 195, 103356. [Google Scholar] [CrossRef]
  3. Pierson, T.C.; Janda, R.J.; Thouret, J.-C.; Borrero, C.A. Perturbation and Melting of Snow and Ice by the 13 November 1985 Eruption of Nevado Del Ruiz, Colombia, and Consequent Mobilization, Flow and Deposition of Lahars. J. Volcanol. Geotherm. Res. 1990, 41, 17–66. [Google Scholar] [CrossRef]
  4. Gudmundsson, M.T.; Sigmundsson, F.; Björnsson, H. Ice–Volcano Interaction of the 1996 Gjálp Subglacial Eruption, Vatnajökull, Iceland. Nature 1997, 389, 954–957. [Google Scholar] [CrossRef]
  5. Magnússon, E.; Gudmundsson, M.T.; Roberts, M.J.; Sigurðsson, G.; Höskuldsson, F.; Oddsson, B. Ice-Volcano Interactions during the 2010 Eyjafjallajökull Eruption, as Revealed by Airborne Imaging Radar: Ice-Volcano Interactions. J. Geophys. Res. Solid Earth 2012, 117. [Google Scholar] [CrossRef]
  6. Bleick, H.A.; Coombs, M.L.; Cervelli, P.F.; Bull, K.F.; Wessels, R.L. Volcano–Ice Interactions Precursory to the 2009 Eruption of Redoubt Volcano, Alaska. J. Volcanol. Geotherm. Res. 2013, 259, 373–388. [Google Scholar] [CrossRef]
  7. Oddsson, B.; Gudmundsson, M.T.; Edwards, B.R.; Thordarson, T.; Magnússon, E.; Sigurðsson, G. Subglacial Lava Propagation, Ice Melting and Heat Transfer during Emplacement of an Intermediate Lava Flow in the 2010 Eyjafjallajökull Eruption. Bull. Volcanol. 2016, 78, 48. [Google Scholar] [CrossRef]
  8. Gudmundsson, M.T.; Thordarson, T.; Höskuldsson, Á.; Larsen, G.; Björnsson, H.; Prata, F.J.; Oddsson, B.; Magnússon, E.; Högnadóttir, T.; Petersen, G.N.; et al. Ash Generation and Distribution from the April–May 2010 Eruption of Eyjafjallajökull, Iceland. Sci. Rep. 2012, 2, 572. [Google Scholar] [CrossRef] [PubMed] [Green Version]
  9. Smellie, J.L.; Edwards, B.R. Glaciovolcanism on Earth and Mars: Products, Processes and Palaeoenvironmental Significance; Cambridge University Press: Cambridge, UK, 2016; ISBN 978-1-139-76438-4. [Google Scholar]
  10. Curtis, A.; Kyle, P. Methods for Mapping and Monitoring Global Glaciovolcanism. J. Volcanol. Geotherm. Res. 2017, 333, 134–144. [Google Scholar] [CrossRef]
  11. Van Wyk de Vries, M.; Bingham, R.G.; Hein, A.S. A New Volcanic Province: An Inventory of Subglacial Volcanoes in West Antarctica. Geol. Soc. Lond. Spec. Publ. 2018, 461, 231–248. [Google Scholar] [CrossRef]
  12. Major, J.J.; Newhall, C.G. Snow and Ice Perturbation during Historical Volcanic Eruptions and the Formation of Lahars and Floods: A Global Review. Bull. Volcanol. 1989, 52, 1–27. [Google Scholar] [CrossRef]
  13. Barr, I.D.; Lynch, C.M.; Mullan, D.; De Siena, L.; Spagnolo, M. Volcanic Impacts on Modern Glaciers: A Global Synthesis. Earth-Sci. Rev. 2018, 182, 186–203. [Google Scholar] [CrossRef] [Green Version]
  14. Rivera, A.; Bown, F.; Carrión, D.; Zenteno, P. Glacier Responses to Recent Volcanic Activity in Southern Chile. Environ. Res. Lett. 2012, 7, 014036. [Google Scholar] [CrossRef]
  15. Reynolds, H.I.; Gudmundsson, M.T.; Högnadóttir, T.; Magnússon, E.; Pálsson, F. Subglacial Volcanic Activity above a Lateral Dyke Path during the 2014–2015 Bárdarbunga-Holuhraun Rifting Episode, Iceland. Bull. Volcanol. 2017, 79, 38. [Google Scholar] [CrossRef]
  16. Muraviev, A.Y.; Muraviev, Y.D. Fluctuations of Glaciers of the Klyuchevskaya Group of Volcanoes in the 20th–21st Centuries. Led I Sneg-Ice Snow 2016, 56, 480–492. [Google Scholar] [CrossRef] [Green Version]
  17. Barr, I.; Dokukin, M.; Kougkoulos, I.; Livingstone, S.; Lovell, H.; Małecki, J.; Muraviev, A. Using ArcticDEM to Analyse the Dimensions and Dynamics of Debris-Covered Glaciers in Kamchatka, Russia. Geosciences 2018, 8, 216. [Google Scholar] [CrossRef] [Green Version]
  18. Reinthaler, J.; Paul, F.; Granados, H.D.; Rivera, A.; Huggel, C. Area Changes of Glaciers on Active Volcanoes in Latin America between 1986 and 2015 Observed from Multi-Temporal Satellite Imagery. J. Glaciol. 2019, 65, 542–556. [Google Scholar] [CrossRef] [Green Version]
  19. Pfeffer, W.T.; Arendt, A.A.; Bliss, A.; Bolch, T.; Cogley, J.G.; Gardner, A.S.; Hagen, J.-O.; Hock, R.; Kaser, G.; Kienholz, C.; et al. The Randolph Glacier Inventory: A Globally Complete Inventory of Glaciers. J. Glaciol. 2014, 60, 537–552. [Google Scholar] [CrossRef] [Green Version]
  20. Gudmundsson, M.T.; Sigmundsson, F.; Björnsson, H.; Högnadóttir, T. The 1996 Eruption at Gjálp, Vatnajökull Ice Cap, Iceland: Efficiency of Heat Transfer, Ice Deformation and Subglacial Water Pressure. Bull. Volcanol. 2004, 66, 46–65. [Google Scholar] [CrossRef]
  21. Guðmundsson, M.S.T.; Högnadóttir, Þ.; Kristinsson, A.B.; Guðbjörnsson, S. Geothermal Activity in the Subglacial Katla Caldera, Iceland, 1999–2005, Studied with Radar Altimetry. Ann. Glaciol. 2007, 45, 66–72. [Google Scholar] [CrossRef] [Green Version]
  22. Gudmundsson, A.; Lecoeur, N.; Mohajeri, N.; Thordarson, T. Dike Emplacement at Bardarbunga, Iceland, Induces Unusual Stress Changes, Caldera Deformation, and Earthquakes. Bull. Volcanol. 2014, 76, 869. [Google Scholar] [CrossRef]
  23. Riel, B.; Milillo, P.; Simons, M.; Lundgren, P.; Kanamori, H.; Samsonov, S. The Collapse of Bárðarbunga Caldera, Iceland. Geophys. J. Int. 2015, 202, 446–453. [Google Scholar] [CrossRef] [Green Version]
  24. Rossi, C.; Minet, C.; Fritz, T.; Eineder, M.; Bamler, R. Temporal Monitoring of Subglacial Volcanoes with TanDEM-X—Application to the 2014–2015 Eruption within the Bárðarbunga Volcanic System, Iceland. Remote Sens. Environ. 2016, 181, 186–197. [Google Scholar] [CrossRef] [Green Version]
  25. Farinotti, D. A Consensus Estimate for the Ice Thickness Distribution of All Glaciers on Earth. Nat. Geosci. 2019, 12, 168–173. [Google Scholar] [CrossRef] [Green Version]
  26. Björnsson, H.; Guðmundsson, M.T. Surface and Bedrock Topography of Mýrdalsjökull, Iceland: The Katla Caldera, Eruption Sites and Routes of Jökulhlaups. Jökull 2000, 49, 29–46. [Google Scholar]
  27. Strachan, S.M. A Geophysical Investigation of the Eyjafjallajökull Glaciovolcanic System, South Iceland, Using Radio Echo Sounding. Ph.D. Thesis, University of Edingburgh, Edingburgh, UK, 2001. [Google Scholar]
  28. Trabant, D.C.; Hawkins, D.B. Glacier Ice-Volume Modeling and Glacier Volumes on Redoubt Volcano, Alaska. Water-Resour. Investig. 1997, 97, 4187. [Google Scholar]
  29. Schaefer, J.R. The 2009 Eruption of Redoubt Volcano, Alaska. Rep. Investig. 2011, 5, 45. [Google Scholar]
  30. McGimsey, R.G.; Neal, C.A.; Girina, O.A.; Chibisova, M.V.; Rybin, A.V. 2009 Volcanic Activity in Alaska, Kamchatka, and the Kurile Islands—Summary of Events and Response of the Alaska Volcano Observatory. 2014. Available online: http://repository.geologyscience.ru/handle/123456789/1652 (accessed on 24 February 2021).
  31. Amigo, Á.; Silva, C.; Orozo, G.; Bertin, D.; Lara, L.E. La Crisis Eruptiva Del Volcán Hudson Durante Octubre-Noviembre 2011. XII Congr. Geol. Chil. Antofagasta 2012, 457–459. [Google Scholar]
  32. Welch, B.C.; Dwyer, K.; Helgen, M.; Waythomas, C.F.; Jacobel, R.W. Geophysical Survey of the Intra-Caldera Icefield of Mt Veniaminof, Alaska. Ann. Glaciol. 2007, 45, 58–65. [Google Scholar] [CrossRef] [Green Version]
  33. Global Volcanism Program, 2021. Report on Veniaminof (United States). In Weekly Volcanic Activity Report; 03 March-06 April 2021; Smithsonian Institution: Washington, DC, USA; US Geological Survey: Reston, VA, USA, 2021.
  34. Patrick, M.R.; Smellie, J.L.; Harris, A.J.L.; Wright, R.; Dean, K.; Izbekov, P.; Garbeil, H.; Pilger, E. First Recorded Eruption of Mount Belinda Volcano (Montagu Island), South Sandwich Islands. Bull. Volcanol. 2005, 67, 415–422. [Google Scholar] [CrossRef]
  35. Patrick, M.R.; Smellie, J.L. Synthesis A Spaceborne Inventory of Volcanic Activity in Antarctica and Southern Oceans, 2000–2010. Antarct. Sci. 2013, 25, 475–500. [Google Scholar] [CrossRef]
  36. Schilling, S.P.; Carrara, P.E.; Thompson, R.A.; Iwatsubo, E.Y. Posteruption Glacier Development within the Crater of Mount St. Helens, Washington, USA. Quat. Res. 2004, 61, 325–329. [Google Scholar] [CrossRef]
  37. Walder, J.S.; LaHusen, R.G.; Vallance, J.W.; Schilling, S.P. Emplacement of a Silicic Lava Dome through a Crater Glacier: Mount St Helens, 2004–2006. Ann. Glaciol. 2007, 45, 14–20. [Google Scholar] [CrossRef] [Green Version]
  38. Walder, J.S.; Schilling, S.P.; Vallance, J.W.; LaHusen, R.G. A Volcano Rekindled: The Renewed Eruption of Mount St. Helens, 2004–2006; Sherrod, D.R., Scott, W.E., Stauffer, P.H., Eds.; Professional paper; U.S. Dept. of the Interior; U.S. Geological Survey: Reston, VA, USA, 2008; pp. 257–276. ISBN 978-1-4113-2401-5. [Google Scholar]
  39. Elliott, J.R.; Walters, R.J.; Wright, T.J. The Role of Space-Based Observation in Understanding and Responding to Active Tectonics and Earthquakes. Nat. Commun. 2016, 7, 13844. [Google Scholar] [CrossRef] [Green Version]
  40. Gorelick, N.; Hancher, M.; Dixon, M.; Ilyushchenko, S.; Thau, D.; Moore, R. Google Earth Engine: Planetary-Scale Geospatial Analysis for Everyone. Remote Sens. Environ. 2017, 202, 18–27. [Google Scholar] [CrossRef]
  41. Krimmel, R.M.; Meier, M.F. Glacier Applications of Erts Images. J. Glaciol. 1975, 15, 391–402. [Google Scholar] [CrossRef] [Green Version]
  42. Glasser, N.F.; Scambos, T.A. A Structural Glaciological Analysis of the 2002 Larsen B Ice-Shelf Collapse. J. Glaciol. 2008, 54, 3–16. [Google Scholar] [CrossRef] [Green Version]
  43. Colgan, W.; Steffen, K.; McLamb, W.S.; Abdalati, W.; Rajaram, H.; Motyka, R.; Phillips, T.; Anderson, R. An Increase in Crevasse Extent, West Greenland: Hydrologic Implications: Increased Crevasse Extent West Greenland. Geophys. Res. Lett. 2011, 38. [Google Scholar] [CrossRef] [Green Version]
  44. Colgan, W.; Rajaram, H.; Abdalati, W.; McCutchan, C.; Mottram, R.; Moussavi, M.S.; Grigsby, S. Glacier Crevasses: Observations, Models, and Mass Balance Implications: Glacier Crevasses. Rev. Geophys. 2016, 54, 119–161. [Google Scholar] [CrossRef]
  45. Rivera, A.; Cawkwell, F.; Wendt, A.; Zamora, R. Mapping Blue-Ice Areas and Crevasses in West Antarctica Using ASTER Images, GPS, and Radar Measurements. In Global Land Ice Measurements from Space; Kargel, J.S., Leonard, G.J., Bishop, M.P., Kääb, A., Raup, B.H., Eds.; Springer: Berlin/Heidelberg, Germany, 2014; pp. 743–757. ISBN 978-3-540-79817-0. [Google Scholar]
  46. Bhardwaj, A.; Sam, L.; Singh, S.; Kumar, R. Automated Detection and Temporal Monitoring of Crevasses Using Remote Sensing and Their Implications for Glacier Dynamics. Ann. Glaciol. 2016, 57, 81–91. [Google Scholar] [CrossRef] [Green Version]
  47. Scharrer, K.; Spieler, O.; Mayer, C.; Münzer, U. Imprints of Sub-Glacial Volcanic Activity on a Glacier Surface—SAR Study of Katla Volcano, Iceland. Bull. Volcanol. 2008, 70, 495–506. [Google Scholar] [CrossRef]
  48. Delgado, F.; Pritchard, M.; Lohman, R.; Naranjo, J.A. The 2011 Hudson Volcano Eruption (Southern Andes, Chile): Pre-Eruptive Inflation and Hotspots Observed with InSAR and Thermal Imagery. Bull. Volcanol. 2014, 76, 815. [Google Scholar] [CrossRef]
  49. Brugman, M.M.; Post, A. Effects of Volcanism on the Glaciers of Mount St. Helens. Geol. Surv. Circ. 1981, 850, 1–11. [Google Scholar]
  50. Granados, H.D.; Miranda, P.J.; Núñez, G.C.; Alzate, B.P.; Mothes, P.; Roa, H.M.; Cáceres Correa, B.E.; Ramos, J.C. Hazards at Ice-Clad Volcanoes. In Snow and Ice-Related Hazards, Risks and Disasters; Elsevier: Amsterdam, The Netherlands, 2015; pp. 607–646. ISBN 978-0-12-394849-6. [Google Scholar]
  51. Monsalve, M.L.; Pulgarín, B.A.; Mojica, J.; Santacoloma, C.C.; Cardona, C.E. Interpretación de la Actividad Eruptiva del Volcán Nevado del Huila (Colombia), 2007–2009: Análisis de Componentes de Materiales Emitidos. Bol. Geol. 2011, 33, 73–93. [Google Scholar]
  52. Púlgarin, B.; Cardona, C.E.; Santacoloma, C.C.; Agudelo, A.; Calvache, M.; Monsalve, M.L. Erupciones del volcan Nevado del Huila (Colombia) en febrero y abril de 2007 y cambios en su masa glaciar. In Glaciares, Nieves y Hielos de America Latina: Cambio Climatico y Amenezas Glaciares; Lopez, C.D., Ramirez, J., Eds.; INGEOMINAS: Bogotá, Colombia, 2010; pp. 279–305. [Google Scholar]
  53. Naranjo, J.L.; Sigurdsson, H.; Carey, S.N.; Fritz, W. Eruption of the Nevado Del Ruiz Volcano, Colombia, On 13 November 1985: Tephra Fall and Lahars. Science 1986, 233, 961–963. [Google Scholar] [CrossRef] [PubMed]
  54. Esri. “World Continents” [basemap]. Scale not Given. “World Continents.” Centre d’enseignement Saint-Joseph de Chimay. 31 August 2017. Available online: https://hub.arcgis.com/datasets/CESJ::world-continents/explore?location=-0.076095%2C0.000000%2C1.00 (accessed on 10 March 2021).
Figure 1. Glacierized volcanoes around the globe (small orange triangles, [2]) and volcanoes investigated in this study (red triangles, numbered). For some volcanoes, multiple events were investigated. Volcano numbers are detailed in Table 1. Basemap: “World Continents” (accessed on 10 March 2021).
Remotesensing 13 03453 g001
Figure 2. ASTER VNIR images (15 m resolution) of Mýrdalsjökull (Katla volcano beneath ice cap). (a) from 7 November 2002 and (b) from 17 March 2004. Both images show cauldrons over-active geothermal areas (encircled in red).
Remotesensing 13 03453 g002
Figure 3. (a) Landsat 8 overview image (30 m resolution) of the northern part of Vatnajökull ice cap. Red rectangle shows the study area on Dyngjujökull glacier (subfigures b and c). (b) EO-1 ALI true-colour composite images (30 m resolution) from 4 November 2014 (snow-covered) and (c) 20 September 2014 (non- snow-covered) showing Dyngjujökull glacier. For both images, three cauldrons are encircled in white, red and blue. Background image (non snow-covered) from Landsat 8 for all images (bd). (d) EO-1 ALI panchromatic image (10 m resolution) from 4 November 2014, enlarged to show a cauldron with faint concentric crevassing (crevasses indicated with red arrows).
Remotesensing 13 03453 g003
Figure 4. (a) ASTER VNIR (15 m resolution) overview image of Eyjafjallajökull from 01 April 2010, with a small box showing the study area on Gígjökull glacier. The ASTER VNIR image (15 m resolution) in the inset shows the intact glacier surface before the summit eruption. (b) ASTER VNIR (15 m resolution) image and (c) WorldView-1 visible image (2 m resolution), both acquired on 19 April 2010 during the summit eruption showing at least three openings on the glacier surface (red arrows); WorldView-1 image: DigitalGlobe Products. WorldView-1 © 2010 DigitalGlobe, Inc., a Maxar company, Westminster, CO, USA.
Remotesensing 13 03453 g004
Figure 5. (a) photograph of north flank of Mount Redoubt from 15 March 2009 (shortly before its eruption; photo by H. Bleick AVO/USGS). The study site shown in panels (bd) lies within the cauldron and subsidence area. (b) IKONOS-2 panchromatic image (0.8 m resolution) from 19 February 2009 showing an ice-cauldron and concentric crevasses. (c) ASTER VNIR image (15 m resolution). (d) IKONOS-2 panchromatic image (0.8 m resolution) showing a large ice-cauldron and concentric crevassing. Blue arrows show the locations of growing crevasses/increased number of crevasses. Images (c) and (d) were both acquired on 02 March 2009, and all subfigures (bd) cover the same spatial area. IKONOS-2 products: DigitalGlobe Products. IKONOS-2 © 2009 DigitalGlobe, Inc., a Maxar company, Westminster, CO, USA.
Remotesensing 13 03453 g005
Figure 6. (a) Rapid-Eye true-colour overview image (5 m resolution) of Mount Hudson from 19 February 2011, (b) EO-1 ALI panchromatic image (10 m resolution) from 01 Novemer 2011, (c) EO-1 ALI true-colour image (30 m resolution) from 30 Novemer 2011 and (d) Rapid-Eye true-colour image (5 m resolution) from 01 December 2011. All subfigures (bd) show the same extent and show one cauldron (red bold arrow) and the (possible) location of two more cauldrons (red dashed arrows); Rapid-Eye image: Planet Team (2017), https://api.planet.com (accessed on 22 October 2019).
Remotesensing 13 03453 g006
Figure 7. (a) GoogleEarth image from 03 October 2004 showing the Mount St. Helens summit crater (© 2021 Maxar Technologies). (b) QuickBird 2 panchromatic image (0.6 m resolution) from 05 October 2004. (c) QuickBird-2 visible image (2.4 m resolution) from 13 March 2005. (d) EO-1 ALI panchromatic image (10 m resolution) from 15 March 2005. All images show the impacts (crevassing, melt-hole formation) on East Crater glacier due to subglacial lava dome growth (DigitalGlobe Products. QuickBird-2 © 2004, 2005 DigitalGlobe, Inc., a Maxar company, Westminster, CO, USA).
Remotesensing 13 03453 g007
Figure 8. (a) Landsat 7 panchromatic image (15 m resolution) acquired on 24 January 2001 showing Montagu Island before the start of an eruptive period at Mount Belinda. (b) EO-1 ALI panchromatic image (10 m resolution) from 07 December 2003 showing a supraglacial lava flow, and associated crevassing. (c) EO-1 ALI panchromatic image (10 m resolution) from 06 August 2005. (d) EO-1 ALI panchromatic image (10 m resolution) from 18 August 2007. Subfigures (c) and (d) show widespread glacier crevassing. All subfigures (bd) cover the same region of the northern part of the caldera.
Remotesensing 13 03453 g008
Figure 9. Recent volcanic activity on Mount Veniaminof: (a) Sentinel-2 true-colour overview image (10 m resolution) of the Veniaminof caldera from 04 February 2021 with an intra-caldera volcanic cone and (mostly snow-covered) 2018 lava flows; (b) Landsat-8 panchromatic image from 09 March 2021 (15 m resolution); (c,d) Sentinel-2 true-colour images from 11 March 2021 and 21 March 2021, respectively (both 10 m resolution). All subfigures (bd) show an ice-cauldron and concentric crevasses related to the March 2021 active period as zoom-ins on the intra-caldera volcanic cone. Sentinel-2 data: Copernicus Sentinel data (2021).
Remotesensing 13 03453 g009
Table 1. Volcanoes and corresponding eruptive activity investigated in this study (volcano numbers relate to Figure 1). Examples illustrated in figures within the present study, are shown in bold.
Volcano NumberVolcano NameVolcano TypeRegion/CountryCoordinates
(Lat, Lon)
Period of Activity
1Mount RedoubtstratovolcanoAlaska (US)60.485, −152.74203/2009–04/2009
2Mount St HelensstratovolcanoUnited States46.2, −122.1803/1980–10/1980
09/2004–2006
3Nevado del RuizstratovolcanoColombia4.892, −75.32411/1985
4Nevado del HuilastratovolcanoColombia2.93, −76.0302/2007–05/2009
5Mount HudsonstratovolcanoChile−45.9, −72.9710/2011–12/2011
6Mount Belinda (Montagu Island)shieldvolcanoSouth Sandwich-Islands (UK)−58.445, −26.37410/2001–09/2007
7Eyjafjallajökullcentral vocanoIceland63.633, −19.63303/2010–06/2010
8Katla (Mýrdals- jökull)subglacial
central vocano
Iceland63.633, −19.0831999–2005
9Grímsvötn (Gjálp)subglacial
volcanic fisure
Iceland64.416, −17.31609/1996–10/1996
10Bárðarbungasubglacial
central vocano
Iceland64.633, −17.51608/2014–02/2015
Publisher’s Note: MDPI stays neutral with regard to jurisdictional claims in published maps and institutional affiliations.

