
Particle Size-Frequency Distributions of the OSIRIS-REx Candidate Sample Sites on Asteroid (101955) Bennu

 , , ,
, , ,  , , , , , , , , , , add
Show full author list
, , , , , , , , , , add
Show full author list
Abstract
:
1. Introduction
2. Materials and Methods
2.1. Background
2.2. Mapped Image Datasets
2.3. Particle Mapping Team and GIS Environment
2.4. Evaluating Particle Measurements and Calculating the PSFD
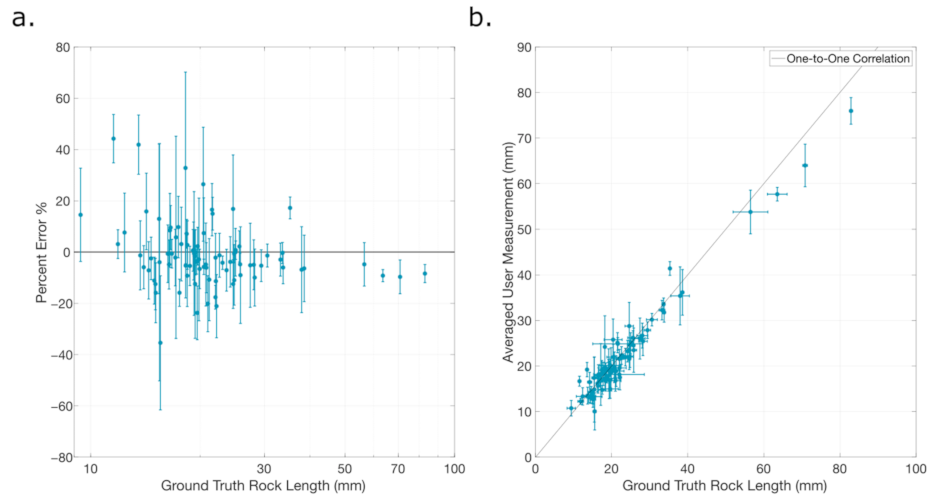
2.5. Connecting Remotely Sensed Measurements to Ground Truth
3. Results
4. Discussion
4.1. Properties of Bennu Discernable from the PSFDs
4.2. Comparison to Ryugu
4.3. Limitations of the Rock Tray Study
5. Conclusions
Author Contributions
Funding
Institutional Review Board Statement
Informed Consent Statement
Data Availability Statement
Acknowledgments
Conflicts of Interest
References
- Turcotte, D.L. Fractals and Chaos in Geology and Geophysics; Cambridge University Press (CUP): Cambridge, UK, 1997. [Google Scholar]
- Hartmann, W.K. Terrestrial, lunar, and interplanetary rock fragmentation. Icarus 1969, 10, 201–213. [Google Scholar] [CrossRef]
- Michel, P.; O’Brien, D.; Abe, S.; Hirata, N. Itokawa’s cratering record as observed by Hayabusa: Implications for its age and collisional history. Icarus 2009, 200, 503–513. [Google Scholar] [CrossRef]
- Golombek, M.; Rapp, D. Size-frequency distributions of rocks on Mars and Earth analog sites: Implications for future landed missions. J. Geophys. Res. Space Phys. 1997, 102, 4117–4129. [Google Scholar] [CrossRef]
- Golombek, M.P.; Haldemann, A.F.C.; Forsberg-Taylor, N.K.; DiMaggio, E.N.; Schroeder, R.D.; Jakosky, B.M.; Mellon, M.T.; Matijevic, J.R. Rock size-frequency distributions on Mars and implications for Mars Exploration Rover landing safety and operations. J. Geophys. Res. Space Phys. 2003, 108. [Google Scholar] [CrossRef]
- Pajola, M.; Lucchetti, A.; Fulle, M.; Mottola, S.; Hamm, M.; Da Deppo, V.; Penasa, L.; Kovacs, G.; Massironi, M.; Shi, X.; et al. The pebbles/boulders size distributions on Sais: Rosetta’s final landing site on comet 67P/Churyumov–Gerasimenko. Mon. Not. R. Astron. Soc. 2017, 469, S636–S645. [Google Scholar] [CrossRef]
- Pajola, M.; Rossato, S.; Baratti, E.; Pozzobon, R.; Quantin, C.; Carter, J.; Thollot, P. Boulder abundances and size-frequency distributions on Oxia Planum-Mars: Scientific implications for the 2020 ESA ExoMars rover. Icarus 2017, 296, 73–90. [Google Scholar] [CrossRef]
- Miyamoto, H.; Yano, H.; Scheeres, D.J.; Abe, S.; Barnouin-Jha, O.; Cheng, A.F.; Demura, H.; Gaskell, R.W.; Hirata, N.; Ishiguro, M.; et al. Regolith Migration and Sorting on Asteroid Itokawa. Science 2007, 316, 1011–1014. [Google Scholar] [CrossRef] [PubMed] [Green Version]
- Michikami, T.; Nakamura, A.M.; Hirata, N.; Gaskell, R.W.; Nakamura, R.; Honda, T.; Honda, C.; Hiraoka, K.; Saito, J.; Demura, H.; et al. Size-frequency statistics of boulders on global surface of asteroid 25143 Itokawa. Earth Planets Space 2008, 60, 13–20. [Google Scholar] [CrossRef] [Green Version]
- Mazrouei, S.; Daly, M.; Barnouin, O.; Ernst, C.; DeSouza, I. Block distributions on Itokawa. Icarus 2014, 229, 181–189. [Google Scholar] [CrossRef]
- Pajola, M.; Vincent, J.-B.; Güttler, C.; Lee, J.-C.; Bertini, I.; Massironi, M.; Simioni, E.; Marzari, F.; Giacomini, L.; Lucchetti, A.; et al. Size-frequency distribution of boulders ≥7 m on comet 67P/Churyumov-Gerasimenko. Astron. Astrophys. 2015, 583, A37. [Google Scholar] [CrossRef]
- Pajola, M.; Lucchetti, A.; Bertini, I.; Marzari, F.; A’Hearn, M.F.; La Forgia, F.; Lazzarin, M.; Naletto, G.; Barbieri, C. Size-frequency distribution of boulders ≥10 m on comet 103P/Hartley 2. Astron. Astrophys. 2015, 585, A85. [Google Scholar] [CrossRef] [Green Version]
- Connolly, H.C.; Lauretta, D.S.; Walsh, K.J.; Tachibana, S.; Bottke, W.F. Towards understanding the dynamical evolution of asteroid 25143 Itokawa: Constraints from sample analysis. Earth Planets Space 2015, 67, 12. [Google Scholar] [CrossRef] [Green Version]
- Basilevsky, A.; Head, J.W.; Horz, F. Survival times of meter-sized boulders on the surface of the Moon. Planet. Space Sci. 2013, 89, 118–126. [Google Scholar] [CrossRef]
- Watkins, R.N.; Jolliff, B.L.; Mistick, K.; Fogerty, C.; Lawrence, S.J.; Singer, K.N.; Ghent, R.R. Boulder Distributions Around Young, Small Lunar Impact Craters and Implications for Regolith Production Rates and Landing Site Safety. J. Geophys. Res. Planets 2019, 124, 2754–2771. [Google Scholar] [CrossRef]
- Bart, G.D.; Melosh, H.J. Using lunar boulders to distinguish primary from distant secondary impact craters. Geophys. Res. Lett. 2007, 34. [Google Scholar] [CrossRef] [Green Version]
- Bart, G.D.; Melosh, H. Distributions of boulders ejected from lunar craters. Icarus 2010, 209, 337–357. [Google Scholar] [CrossRef]
- Singer, K.N.; McKinnon, W.B.; Nowicki, L. Secondary craters from large impacts on Europa and Ganymede: Ejecta size–velocity distributions on icy worlds, and the scaling of ejected blocks. Icarus 2013, 226, 865–884. [Google Scholar] [CrossRef]
- Butler, J.C.; King, E.A., Jr. Analysis of the grain size-frequency distributions of lunar fines. In Lunar and Planetary Science Conference Proceedings; Lunar and Planetary Institute: Houston, TX, USA, 1974; Volume 5, pp. 829–841. [Google Scholar]
- Lauretta, D.S.; Balram-Knutson, S.S.; Beshore, E.; Boynton, W.V.; D’Aubigny, C.D.; DellaGiustina, D.N.; Enos, H.L.; Gholish, D.R.; Hergenrother, C.W.; Howell, E.S.; et al. OSIRIS-REx: Sample Return from Asteroid (101955) Bennu. Space Sci. Rev. 2017, 212, 925–984. [Google Scholar] [CrossRef] [Green Version]
- Bierhaus, E.B.; Clark, B.C.; Harris, J.W.; Payne, K.S.; Dubisher, R.D.; Wurts, D.W.; Hund, R.A.; Kuhns, R.M.; Linn, T.M. The OSIRIS-REx Spacecraft and the Touch-and-Go Sample Acquisition Mechanism (TAGSAM). Space Sci. Rev. 2018, 214, 107. [Google Scholar] [CrossRef] [Green Version]
- Bierhaus, E.; Songer, J.; Clark, B.; Dubisher, R.; Deden, S.; Payne, K.; Wurts, D.; McMahon, J.; Rozitis, B.; Lauretta, D. Bennu regolith mobilized by TAGSAM: Expectations for the OSIRIS-REx sample collection event and application to understanding naturally ejected particles. Icarus 2021, 355, 114142. [Google Scholar] [CrossRef]
- Lauretta, D.S.; DellaGiustina, D.N.; Bennett, C.A.; Golish, D.R.; Becker, K.J.; Balram-Knutson, S.S.; Barnouin, O.S.; Becker, T.L.; Bottke, W.F.; Boynton, W.V.; et al. The unexpected surface of asteroid (101955) Bennu. Nat. Cell Biol. 2019, 568, 55–60. [Google Scholar] [CrossRef] [Green Version]
- DellaGiustina, D.N.; Emery, J.P.; Golish, D.R.; Rozitis, B.; Bennett, C.A.; Burke, K.N.; Ballouz, R.-L.; Becker, K.J.; Christensen, P.R.; the OSIRIS-REx Team; et al. Properties of rubble-pile asteroid (101955) Bennu from OSIRIS-REx imaging and thermal analysis. Nat. Astron. 2019, 3, 341–351. [Google Scholar] [CrossRef] [Green Version]
- DellaGiustina, D.N.; Bennett, C.A.; Becker, K.; Golish, D.R.; Le Corre, L.; Cook, D.A.; Edmundson, K.L.; Chojnacki, M.; Sutton, S.S.; Milazzo, M.P.; et al. Overcoming the Challenges Associated with Image-Based Mapping of Small Bodies in Preparation for the OSIRIS-REx Mission to (101955) Bennu. Earth Space Sci. 2018, 5, 929–949. [Google Scholar] [CrossRef] [Green Version]
- Michikami, T.; Honda, C.; Miyamoto, H.; Hirabayashi, M.; Hagermann, A.; Irie, T.; Nomura, K.; Ernst, C.M.; Kawamura, M.; Sugimoto, K. Boulder size and shape distributions on asteroid Ryugu. Icarus 2019, 331, 179–191. [Google Scholar] [CrossRef]
- Golish, D.R.; D’Aubigny, C.D.; Rizk, B.; DellaGiustina, D.N.; Smith, P.H.; Becker, K.; Shultz, N.; Stone, T.; Barker, M.K.; Mazarico, E.; et al. Ground and in-flight Calibration of the OSIRIS-REx Camera Suite. Space Sci. Rev. 2020, 216, 1–31. [Google Scholar] [CrossRef] [PubMed] [Green Version]
- Edmundson, K.L.; Becker, K.J.; Becker, T.L.; Bennett, C.A.; DellaGiustina, D.N.; Golish, D.R.; Porter, N.A.; Rizk, B.; D’Aubigny, C.D.; Daly, M.G.; et al. Photogrammetric processing of OSIRIS-REx images of asteroid (101955) BENNU. ISPRS Ann. Photogramm. Remote Sens. Spat. Inf. Sci. 2020, 5, 587–594. [Google Scholar] [CrossRef]
- Rizk, B.; D’Aubigny, C.D.; Golish, D.; Fellows, C.; Merrill, C.; Smith, P.; Walker, M.S.; Hendershot, J.E.; Hancock, J.; Bailey, S.H.; et al. OCAMS: The OSIRIS-REx Camera Suite. Space Sci. Rev. 2018, 214, 26. [Google Scholar] [CrossRef] [Green Version]
- Lauretta, D.S.; Enos, H.L.; Polit, A.T.; Roper, H.L.; Wolner, C.W.V. OSIRIS-REx at Bennu: Overcoming Challenges to Collect a Sample of the Early Solar System, in Sample Return Missions; Longobardo, A., Ed.; Elsevier: Amsterdam, The Netherlands, 2020; Chapter 8; in press. [Google Scholar] [CrossRef]
- Bennett, C.; DellaGiustina, D.; Becker, K.; Becker, T.; Edmundson, K.; Golish, D.; Bennett, R.; Burke, K.; Cue, C.; Clark, B.; et al. A high-resolution global basemap of (101955) Bennu. Icarus 2020, 357, 113690. [Google Scholar] [CrossRef]
- ESRI. ArcGIS Desktop: Release 10; Environmental Systems Research Institute: Redlands, CA, USA, 2011. [Google Scholar]
- Keszthelyi, L.; Becker, T.L.; Sides, S.; Barrett, J.; Cook, D.; Lambright, S.; Lee, E.; Milazzo, M.; Oyama, K.; Richie, J.; et al. Support and future vision for the integrated software for imagers and spectrometers (ISIS). In Proceedings of the 44th Lunar and Planetary Science Conference, The Woodlands, TX, USA, 18–22 March 2013; Volume 44, p. 2546. [Google Scholar]
- Robbins, S.J.; Antonenko, I.; Kirchoff, M.R.; Chapman, C.R.; Fassett, C.I.; Herrick, R.R.; Singer, K.; Zanetti, M.; Lehan, C.; Huang, D.; et al. The variability of crater identification among expert and community crater analysts. Icarus 2014, 234, 109–131. [Google Scholar] [CrossRef] [Green Version]
- Nyquist, H. Certain Topics in Telegraph Transmission Theory. Trans. Am. Inst. Electr. Eng. 1928, 47, 617–644. [Google Scholar] [CrossRef]
- Ester, M.; Kriegel, H.P.; Sander, J.; Xu, X. A Density-based algorithm for discovering clusters in large spatial databases with noise. In Proceedings of the 2nd International Conference on Knowledge Discovery and Data Mining KDD-96, Portland, OR, USA, 2–4 August 1996; Volume 96, pp. 226–231. [Google Scholar]
- Barnouin, O.S.; Daly, M.G.; Palmer, E.E.; Gaskell, R.W.; Weirich, J.R.; Johnson, C.L.; Al Asad, M.M.; Roberts, J.H.; Perry, M.E. Shape of (101955) Bennu indicative of a rubble pile with internal stiffness. Nat. Geosci. 2019, 12, 247–252. [Google Scholar] [CrossRef] [Green Version]
- Barnouin, O.; Daly, M.; Palmer, E.; Johnson, C.; Gaskell, R.; Al Asad, M.; Bierhaus, E.; Craft, K.; Ernst, C.; Espiritu, R.; et al. Digital terrain mapping by the OSIRIS-REx mission. Planet. Space Sci. 2020, 180, 104764. [Google Scholar] [CrossRef]
- Rodgers, D.J.; Ernst, C.M.; Barnouin, O.S.; Murchie, S.L.; Chabot, N.L. Methodology for finding and evaluating safe landing sites on small bodies. Planet. Space Sci. 2016, 134, 71–81. [Google Scholar] [CrossRef]
- Dombard, A.J.; Barnouin, O.S.; Prockter, L.M.; Thomas, P.C. Boulders and ponds on the Asteroid 433 Eros. Icarus 2010, 210, 713–721. [Google Scholar] [CrossRef]
- Krishna, N.; Kumar, P.S. Impact spallation processes on the Moon: A case study from the size and shape analysis of ejecta boulders and secondary craters of Censorinus crater. Icarus 2016, 264, 274–299. [Google Scholar] [CrossRef]
- Küppers, M.; Moissl, R.; Vincent, J.-B.; Besse, S.; Hviid, S.F.; Carry, B.; Grieger, B.; Sierks, H.; Keller, H.U.; Marchi, S. Boulders on Lutetia. Planet. Space Sci. 2012, 66, 71–78. [Google Scholar] [CrossRef]
- Thomas, P.C.; Veverka, J.; Robinson, M.S.; Murchie, S. Shoemaker crater as the source of most ejecta blocks on the asteroid 433 Eros. Nat. Cell Biol. 2001, 413, 394–396. [Google Scholar] [CrossRef]
- Hartmann, W.K. Does crater “saturation equilibrium” occur in the solar system? Icarus 1984, 60, 56–74. [Google Scholar] [CrossRef]
- Michael, G.; Neukum, G. Planetary surface dating from crater size–frequency distribution measurements: Partial resurfacing events and statistical age uncertainty. Earth Planet. Sci. Lett. 2010, 294, 223–229. [Google Scholar] [CrossRef]
- Clauset, A.; Shalizi, C.R.; Newman, M.E.J. Power-Law Distributions in Empirical Data. SIAM Rev. 2009, 51, 661–703. [Google Scholar] [CrossRef] [Green Version]
- DeSouza, I.; Daly, M.; Barnouin, O.; Ernst, C.; Bierhaus, E. Improved techniques for size–frequency distribution analysis in the planetary sciences: Application to blocks on 25143 Itokawa. Icarus 2015, 247, 77–80. [Google Scholar] [CrossRef]
- Standard techniques for presentation and analysis of crater size-frequency data. Icarus 1979, 37, 467–474. [CrossRef] [Green Version]
- Golombek, M.P.; Huertas, A.; Marlow, J.; McGrane, B.; Klein, C.; Martinez, M.; Arvidson, R.E.; Heet, T.; Barry, L.; Seelos, K.; et al. Size-frequency distributions of rocks on the northern plains of Mars with special reference to Phoenix landing surfaces. J. Geophys. Res. Space Phys. 2008, 113. [Google Scholar] [CrossRef] [Green Version]
- Pajola, M.; Pozzobon, R.; Lucchetti, A.; Rossato, S.; Baratti, E.; Galluzzi, V.; Cremonese, G. Abundance and size-frequency distribution of boulders in Linné crater’s ejecta (Moon). Planet. Space Sci. 2019, 165, 99–109. [Google Scholar] [CrossRef]
- Schröder, S.E.; Carsenty, U.; Hauber, E.; Schulzeck, F.; Raymond, C.A.; Russell, C.T. The Boulder Population of Asteroid 4 Vesta: Size-Frequency Distribution and Survival Time. Earth Space Sci. 2021, 8, e2019EA000941. [Google Scholar] [CrossRef]
- Walsh, K.J.; Jawin, E.R.; Ballouz, R.-L.; Barnouin, O.S.; Bierhaus, E.B.; Connolly, H.C., Jr.; Molaro, J.L.; McCoy, T.J.; Delbo’, M. Craters, boulders and regolith of (101955) Bennu indicative of an old and dynamic surface. Nat. Geosci. 2019, 12, 242–246. [Google Scholar] [CrossRef]
- Michel, P. Collisions and Gravitational Reaccumulation: Forming Asteroid Families and Satellites. Science 2001, 294, 1696–1700. [Google Scholar] [CrossRef] [PubMed] [Green Version]
- Michel, P.; Ballouz, R.-L.; Barnouin, O.S.; Jutzi, M.; Walsh, K.J.; May, B.H.; Manzoni, C.; Richardson, D.C.; Schwartz, S.R.; Sugita, S.; et al. Collisional formation of top-shaped asteroids and implications for the origins of Ryugu and Bennu. Nat. Commun. 2020, 11, 1–11. [Google Scholar] [CrossRef] [PubMed]
- Ballouz, R.-L.; Walsh, K.J.; Barnouin, O.S.; DellaGiustina, D.N.; Al Asad, M.; Jawin, E.R.; Daly, M.G.; Bottke, W.F.; Michel, P.; Avdellidou, C.; et al. Bennu’s near-Earth lifetime of 1.75 million years inferred from craters on its boulders. Nat. Cell Biol. 2020, 587, 205–209. [Google Scholar] [CrossRef]
- Delbo, M.; Libourel, G.; Wilkerson, J.; Murdoch, N.; Michel, P.; Ramesh, K.T.; Ganino, C.; Verati, C.; Marchi, S. Thermal fatigue as the origin of regolith on small asteroids. Nat. Cell Biol. 2014, 508, 233–236. [Google Scholar] [CrossRef]
- Molaro, J.L.; Hergenrother, C.W.; Chesley, S.R.; Walsh, K.J.; Hanna, R.D.; Haberle, C.W.; Schwartz, S.R.; Ballouz, R.; Bottke, W.F.; Campins, H.J.; et al. Thermal Fatigue as a Driving Mechanism for Activity on Asteroid Bennu. J. Geophys. Res. Planets 2020, 125. [Google Scholar] [CrossRef]
- DellaGiustina, D.N.; Burke, K.N.; Walsh, K.J.; Smith, P.H.; Golish, D.R.; Bierhaus, E.B.; Ballouz, R.-L.; Becker, T.L.; Campins, H.; Tatsumi, E.; et al. Variations in color and reflectance on the surface of asteroid (101955) Bennu. Science 2020, 370, eabc3660. [Google Scholar] [CrossRef] [PubMed]
- Bierhaus, E.B.; Trang, D.; Barnouin, O.S.; Walsh, K.J.; Daly, R.T.; Pajola, M.; Jawin, E.R.; McCoy, T.J.; Connolly, H.C., Jr.; Hamilton, V.E.; et al. Impact craters on Bennu: Their morphology, size-frequency distribution, and correlation with other data sets. LPI Contrib. 2019, 2189, 2129. [Google Scholar]
- Jawin, E.R.; Walsh, K.J.; Barnouin, O.S.; McCoy, T.J.; Ballouz, R.; DellaGiustina, D.N.; Connolly, H.C., Jr.; Marshall, J.; Beddingfield, C.; Nolan, M.C.; et al. Global Patterns of Recent Mass Movement on Asteroid (101955) Bennu. J. Geophys. Res. Planets 2020, 125, e2020JE006549. [Google Scholar] [CrossRef]
- Hergenrother, C.W.; Adam, C.D.; Chesley, S.R.; Lauretta, D.S. Introduction to the Special Issue: Exploration of the Activity of Asteroid (101955) Bennu. J. Geophys. Res. Planets 2020, 125, e2020JE006549. [Google Scholar] [CrossRef]
- Rozitis, B.; Ryan, A.J.; Emery, J.P.; Christensen, P.R.; Hamilton, V.E.; Simon, A.A.; Reuter, D.C.; Al Asad, M.; Ballouz, R.-L.; Bandfield, J.L.; et al. Asteroid (101955) Bennu’s weak boulders and thermally anomalous equator. Sci. Adv. 2020, 6, eabc3699. [Google Scholar] [CrossRef] [PubMed]
- Golish, D.; Shultz, N.; Becker, T.; Becker, K.; Edmundson, K.; DellaGiustina, D.; D’Aubigny, C.D.; Bennett, C.; Rizk, B.; Barnouin, O.; et al. A high-resolution normal albedo map of asteroid (101955) Bennu. Icarus 2021, 355, 114133. [Google Scholar] [CrossRef]
- Hirata, N.; Nakamura, A.M. Secondary craters of Tycho: Size-frequency distributions and estimated fragment size–velocity relationships. J. Geophys. Res. Space Phys. 2006, 111. [Google Scholar] [CrossRef]
- Biele, J.; Burke, K.; Grott, M.; Ryan, A.; DellaGiustina, D.; Rozitis, B.; Michel, P.; Schröder, S.; Neumann, W. macroporosity and grain density of rubble pile asteroid (101955) Bennu. In Proceedings of the AGU Fall Meeting, San Francisco, CA, USA, 10 December 2020. [Google Scholar]
- Tatsumi, E.; Sugita, S. Cratering efficiency on coarse-grain targets: Implications for the dynamical evolution of asteroid 25143 Itokawa. Icarus 2018, 300, 227–248. [Google Scholar] [CrossRef]
- Turrini, D. The primordial collisional history of Vesta: Crater saturation, surface evolution and survival of the basaltic crust. Planet. Space Sci. 2014, 103, 82–95. [Google Scholar] [CrossRef] [Green Version]
- Grott, M.; Biele, J.; Michel, P.; Sugita, S.; Schröder, S.; Sakatani, N.; Neumann, W.; Kameda, S.; Michikami, T.; Honda, C. Macroporosity and Grain Density of Rubble Pile Asteroid (162173) Ryugu. J. Geophys. Res. Planets 2020, 125. [Google Scholar] [CrossRef]
- Mastropietro, M.; Pajola, M.; Cremonese, G.; Munaretto, G.; Lucchetti, A. Boulder Analysis on the Oxia Planum ExoMars 2022 Rover Landing Site: Scientific and Engineering Perspectives. Sol. Syst. Res. 2020, 54, 504–519. [Google Scholar] [CrossRef]
- Michikami, T.; Nakamura, A.M.; Hirata, N. The shape distribution of boulders on Asteroid 25143 Itokawa: Comparison with fragments from impact experiments. Icarus 2010, 207, 277–284. [Google Scholar] [CrossRef]
- Rizk, B.; d’Aubigny, C.D.; Golish, D.; DellaGiustina, D.N.; Lauretta, D.S. Origins, Spectral Interpretation, Resource Identification, Security, Regolith Explorer (OSIRIS-REx): OSIRIS-REx Camera Suite (OCAMS) Bundle. NASA Planetary Data System, urn:nasa:pds:orex.ocams. 2019. Available online: https://sbn.psi.edu/pds/resource/orex/ocams.html (accessed on 26 March 2021).
- Crombie, M.K.; Selznick, S. Origins, Spectral Interpretation, Resource Identification, Security, Regolith Explorer (OSIRIS-REx): Mission Bundle. NASA Planetary Data System, urn: Nasa: Pds: Orex. Mission. 2019. Available online: https://sbn.psi.edu/pds/resource/orex/orexmission.html (accessed on 26 March 2021).


| Region | Mission Phase | Image Acquisition Date (MM-DD-YYY) | No. Images Mapped | No. Users | No. Unique Image/ User Pairs | Average Pixel Scale (m) | Average Phase Angle | Average Emission Angle | Average Incidence Angle |
|---|---|---|---|---|---|---|---|---|---|
| Global | Approach | 12-01-2018 | 7 | 1 | 7 | 0.42 | 34.47° | 15.21° | 36.62° |
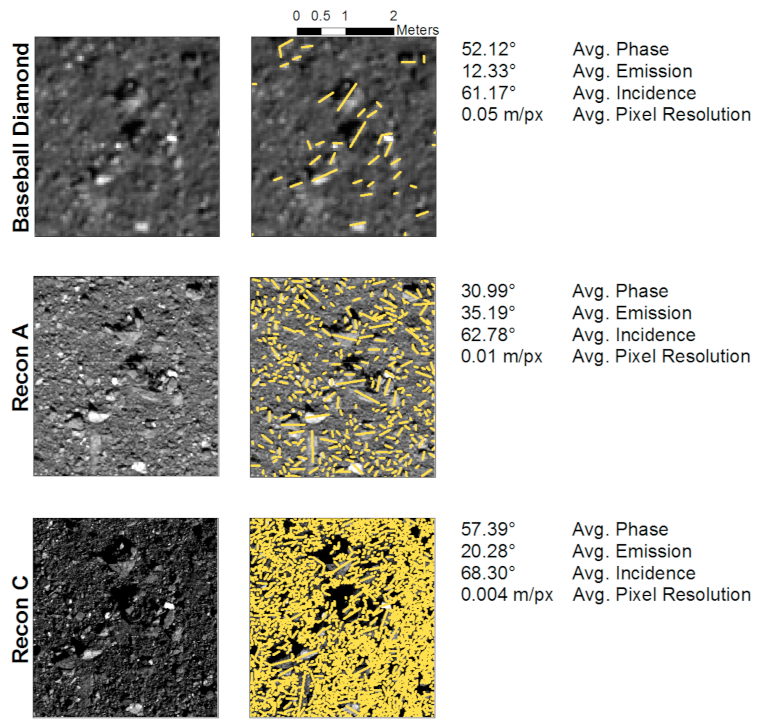
| Nightingale | BBD | 03-29-2019 | 1 | 1 | 1 | 0.05 | 52.12° | 12.33° | 61.17° |
| Recon A | 10-26-2019 | 6 | 10 | 18 | 0.01 | 30.99° | 35.19° | 62.78° | |
| Recon C | 03-03-2020 | 9 | 10 | 12 | 0.004 | 57.39° | 20.28° | 68.30° | |
| Osprey | BBD | 03-21-2019 | 1 | 1 | 1 | 0.05 | 30.18° | 6.40° | 31.07° |
| Recon A | 10-12-2019 | 5 | 11 | 23 | 0.01 | 43.04° | 34.59° | 20.53° | |
| Recon C | 05-26-2020 | 9 | 8 | 11 | 0.003 | 41.96° | 25.35° | 17.11° | |
| Sandpiper | BBD | 03-28-2019 | 1 | 1 | 1 | 0.05 | 44.97° | 20.73° | 62.18° |
| Recon A | 10-05-2019 | 3 | 13 | 27 | 0.01 | 34.71° | 21.32° | 54.61° | |
| Kingfisher | BBD | 03-21-2019 | 1 | 1 | 1 | 0.05 | 30.24° | 13.69° | 29.71° |
| Recon A | 10-19-2019 | 3 | 13 | 18 | 0.01 | 42.88° | 40.02° | 21.04° |
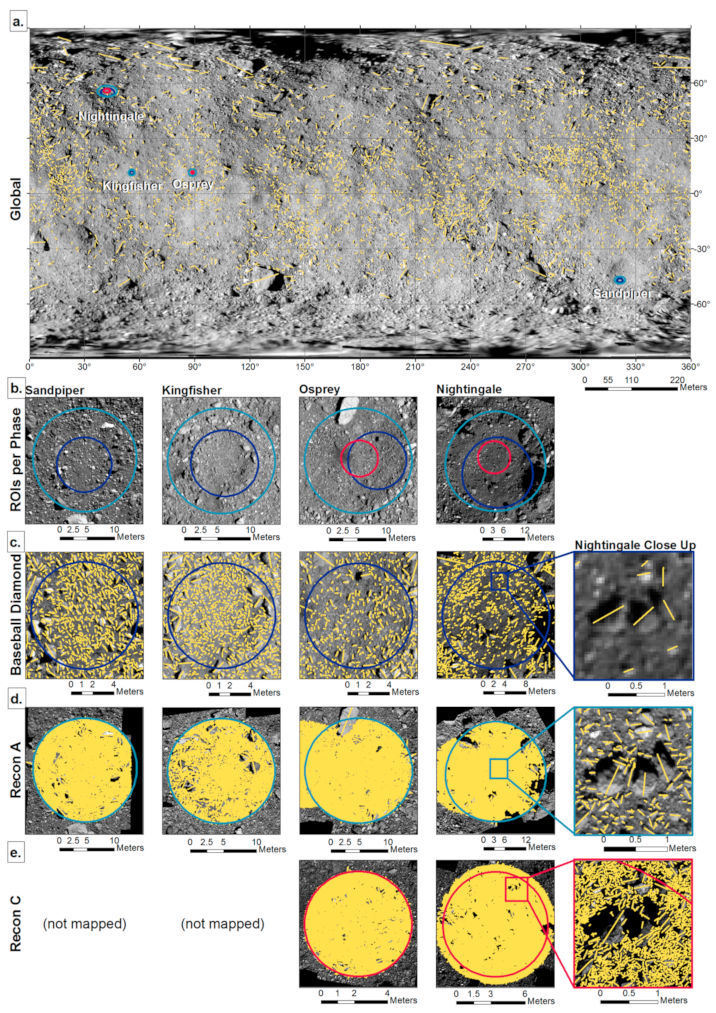
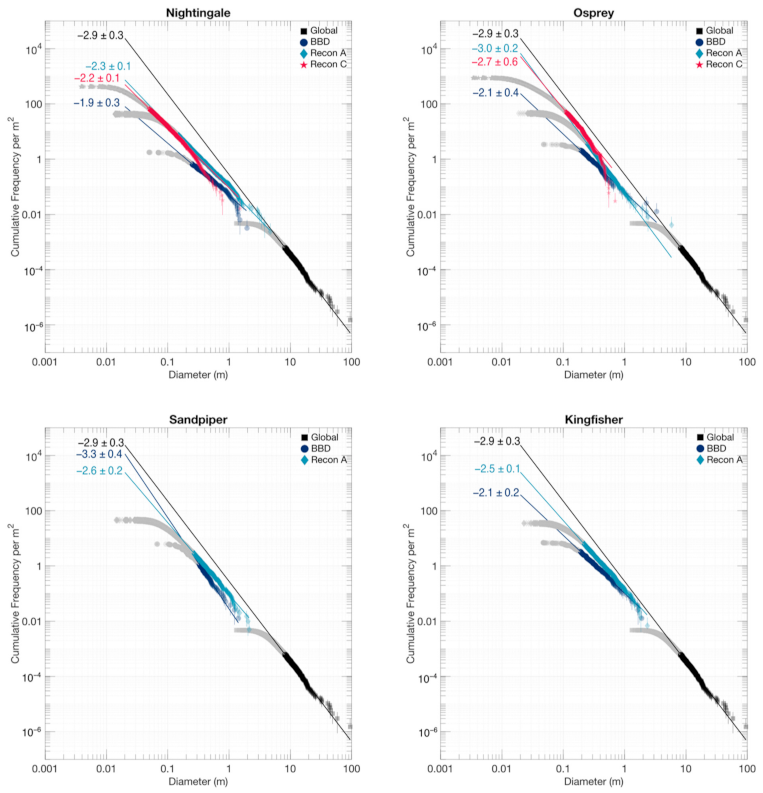
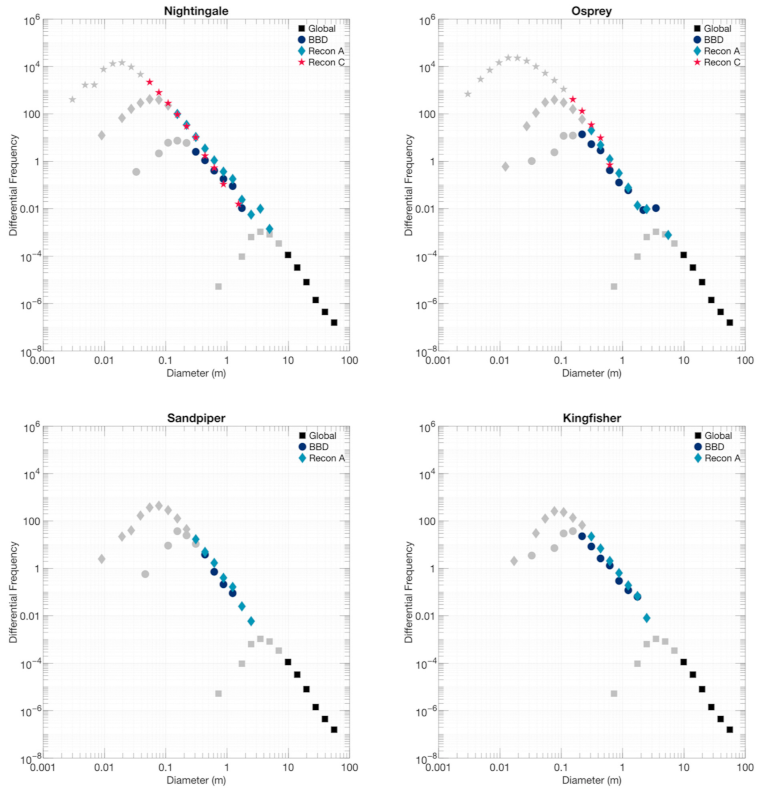
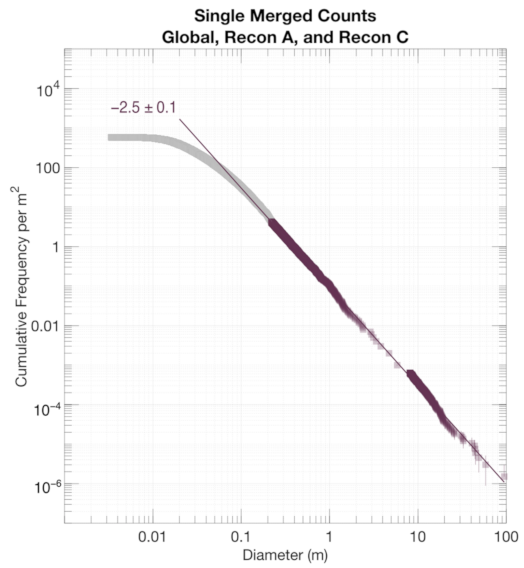
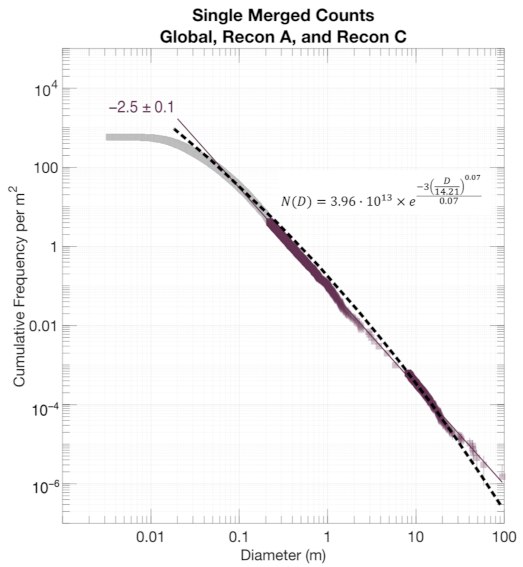
| Region | Mission Phase | Center Latitude/ Longitude | ROI Radius (m) | Surface Area Counted (m2) | Total Particles Counted | Min. Particle Length (m) | Max. Particle Length (m) | Est. CompletenessLimit (m) | Est. Power Law Index |
|---|---|---|---|---|---|---|---|---|---|
| Global | Approach | [−70, +70], [0, 360] | N/A | 663,000 | 3136 | 1.30 | 58.38 | 8.12 ± 1.59 | −2.9 ± 0.3 |
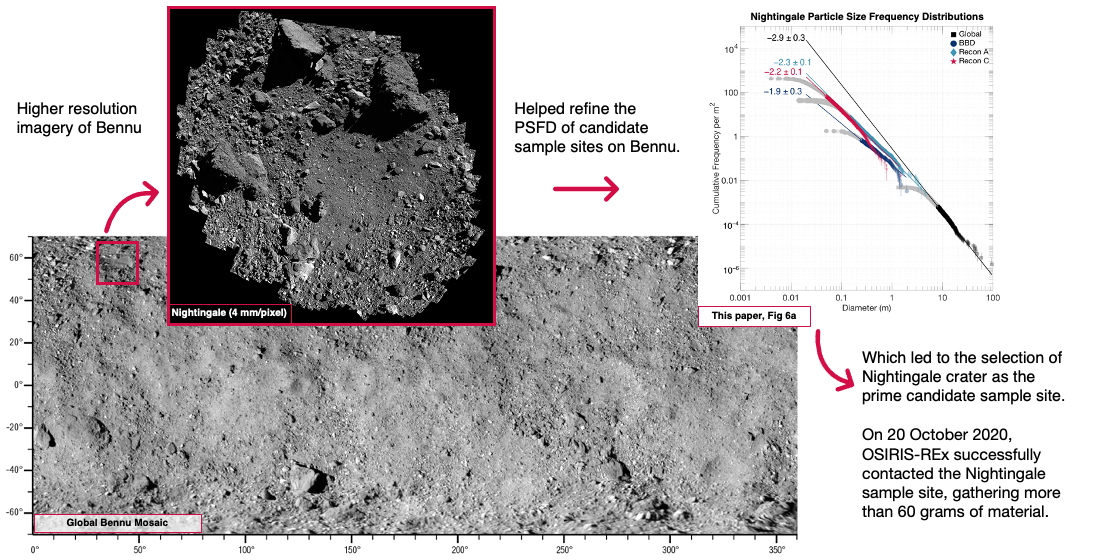
| Nightingale | BBD | 55.13, 42.41 | 10.00 | 314.14 | 556 | 0.05 | 1.96 | 0.25 ± 0.07 | −1.9 ± 0.3 |
| Recon A | 55.81, 42.20 | 13.10 | 417.75 | 17,867 | 0.01 | 4.71 | 0.15 ± 0.02 | −2.3 ± 0.1 | |
| Recon C | 56.05, 42.05 | 4.24 | 61.74 | 26,171 | 0.004 | 1.51 | 0.05 ± 0.02 | −2.2 ± 0.1 | |
| Osprey | BBD | 11.55, 89.23 | 5.00 | 78.49 | 269 | 0.05 | 3.32 | 0.19 ± 0.05 | −2.1 ± 0.4 |
| Recon A | 11.54, 88.58 | 8.50 | 242.50 | 11,013 | 0.02 | 5.83 | 0.25 ± 0.03 | −3.0 ± 0.2 | |
| Recon C | 11.62, 88.63 | 3.02 | 33.27 | 28,929 | 0.003 | 0.70 | 0.11 ± 0.04 | −2.7 ± 0.6 | |
| Sandpiper | BBD | −47.17, 321.31 | 5.00 | 78.49 | 487 | 0.07 | 1.42 | 0.32 ± 0.05 | −3.3 ± 0.4 |
| Recon A | −46.98, 321.34 | 8.75 | 199.01 | 9059 | 0.01 | 2.14 | 0.27 ± 0.05 | −2.6 ± 0.2 | |
| Kingfisher | BBD | 11.41, 55.59 | 5.00 | 78.49 | 547 | 0.05 | 1.90 | 0.19 ± 0.05 | −2.1 ± 0.2 |
| Recon A | 11.49, 55.49 | 7.75 | 146.02 | 5111 | 0.02 | 2.35 | 0.22 ± 0.02 | −2.5 ± 0.1 |
Publisher’s Note: MDPI stays neutral with regard to jurisdictional claims in published maps and institutional affiliations. |
© 2021 by the authors. Licensee MDPI, Basel, Switzerland. This article is an open access article distributed under the terms and conditions of the Creative Commons Attribution (CC BY) license (https://creativecommons.org/licenses/by/4.0/).
Share and Cite
Burke, K.N.; DellaGiustina, D.N.; Bennett, C.A.; Walsh, K.J.; Pajola, M.; Bierhaus, E.B.; Nolan, M.C.; Boynton, W.V.; Brodbeck, J.I.; Connolly, H.C., Jr.; et al. Particle Size-Frequency Distributions of the OSIRIS-REx Candidate Sample Sites on Asteroid (101955) Bennu. Remote Sens. 2021, 13, 1315. https://doi.org/10.3390/rs13071315
Burke KN, DellaGiustina DN, Bennett CA, Walsh KJ, Pajola M, Bierhaus EB, Nolan MC, Boynton WV, Brodbeck JI, Connolly HC Jr., et al. Particle Size-Frequency Distributions of the OSIRIS-REx Candidate Sample Sites on Asteroid (101955) Bennu. Remote Sensing. 2021; 13(7):1315. https://doi.org/10.3390/rs13071315
Chicago/Turabian StyleBurke, Keara N., Daniella N. DellaGiustina, Carina A. Bennett, Kevin J. Walsh, Maurizio Pajola, Edward B. Bierhaus, Michael C. Nolan, William V. Boynton, Juliette I. Brodbeck, Harold C. Connolly, Jr., and et al. 2021. "Particle Size-Frequency Distributions of the OSIRIS-REx Candidate Sample Sites on Asteroid (101955) Bennu" Remote Sensing 13, no. 7: 1315. https://doi.org/10.3390/rs13071315