
A Lightweight Object Detection Framework for Remote Sensing Images
by
Lang Huyan
1,2, 
Yunpeng Bai
1,3,
Ying Li
1,*, 
Dongmei Jiang
1,
Yanning Zhang
1,
Quan Zhou
2,
Jiayuan Wei
2,
Juanni Liu
2,
Yi Zhang
2 and
Tao Cui
2 1
School of Computer Science, National Engineering Laboratory for Integrated Aero-Space-Ground-Ocean Big Data Application Technology, Shaanxi Provincial Key Laboratory of Speech & Image Information Processing, Northwestern Polytechnical University, Xi’an 710129, China
2
Key Laboratory of Science and Technology on Space Microwave, CAST Xi’an, Xi’an 710100, China
3
School of Communication and Information Engineering, Xi’an University of Posts and Telecommunications, Shaanxi, Xi’an 710121, China
*
Author to whom correspondence should be addressed.
Remote Sens. 2021, 13(4), 683; https://doi.org/10.3390/rs13040683
Submission received: 8 January 2021
/
Revised: 28 January 2021
/
Accepted: 10 February 2021
/
Published: 13 February 2021
(This article belongs to the Special Issue Advances in Optical Remote Sensing Image Processing and Applications)
Abstract
:Onboard real-time object detection in remote sensing images is a crucial but challenging task in this computation-constrained scenario. This task not only requires the algorithm to yield excellent performance but also requests limited time and space complexity of the algorithm. However, previous convolutional neural networks (CNN) based object detectors for remote sensing images suffer from heavy computational cost, which hinders them from being deployed on satellites. Moreover, an onboard detector is desired to detect objects at vastly different scales. To address these issues, we proposed a lightweight one-stage multi-scale feature fusion detector called MSF-SNET for onboard real-time object detection of remote sensing images. Using lightweight SNET as the backbone network reduces the number of parameters and computational complexity. To strengthen the detection performance of small objects, three low-level features are extracted from the three stages of SNET respectively. In the detection part, another three convolutional layers are designed to further extract deep features with rich semantic information for large-scale object detection. To improve detection accuracy, the deep features and low-level features are fused to enhance the feature representation. Extensive experiments and comprehensive evaluations on the openly available NWPU VHR-10 dataset and DIOR dataset are conducted to evaluate the proposed method. Compared with other state-of-art detectors, the proposed detection framework has fewer parameters and calculations, while maintaining consistent accuracy.
1. Introduction
Object detection in remote sensing images is one of the basic tasks within satellite imagery processing. Its initial purpose is to extract the category and location information of the object from a remote sensing image [1]. This task involves a wide range of applications in various fields, such as remote sensing image road detection [2], ship detection [3], aircraft detection [4], etc. It is also a high-advance technique for remote sensing image analysis, image content understanding, and scene understanding. Since object detection is the foundation of many other tasks, its importance has attracted the attention of many scholars, and extensive and in-depth research has been carried out, resulting in many research achievements.
However, object detection in remote sensing images is still a challenging task due to multiple reasons [5,6]. First, the remote sensing image is obtained from an overhead perspective, so objects can have any orientation. Second, the scale of different types of objects varies greatly. Third, the size of remote sensing images is extremely large, it is an inhibitor for existing algorithms to be applied to images with such a large size. Besides, labeled remote sensing image samples are scarce [5], and thus the available labeled samples are insufficient for training an onboard detector, which increases the difficulty of object detection.
Generally, remote sensing images are transmitted back to the ground through a satellite data transmission system, and then an object detection task is performed, which requires several procedures to complete. However, object detection on satellite has its unique advantages in military and civilian missions, it responds to ground conditions and provides feedback in real-time. For reasons that direct object detection on satellite makes it possible to transfer what the user might be looking for, and thus the bandwidth and cost of the data transmission technology used to send images data from the satellite camera to the ground station can be reduced greatly. It is a promising direction in this domain.
The focus is on performance when performing remote sensing image object detection on the ground. In the past ten years, a variety of algorithms have been proposed for object detection in remote sensing images. These methods can be roughly divided into traditional methods and deep learning (DL)-based methods. Traditional machine learning methods such as template matching-based object detection, knowledge-based object detection, object-based image analysis (OBIA) object detection, and machine learning-based object detection have made great efforts to improve the performance of object detection algorithm, but DL-based methods can often result in better performance.
These methods mentioned above all use low-level features for object detection. The disadvantage of using low-level features is that it requires manual extraction of features. Although it can achieve better results in specific application scenarios, this type of method is highly dependent on prior knowledge, resulting in the poor adaptability and generalization of the detection model.
However, with the continuous development of deep learning technology, its performance grows to be excellent, such as faster regions with CNN features (Faster-RCNN) [7], you only look once (YOLO) [8,9,10], single-shot multi-box detector (SSD) [11], and ThunderNet [12]. Various methods have been proposed by applying deep learning technology to remote sensing image object detection, such as rotation-invariant convolutional neural networks (RICNN) [13], newly trained CNN [13], and context-based feature fusion single shot multi-box detector (CBFF-SSD) [14], which deploys feature fusion methods to improve detection performance. Although the use of deep learning methods for remote sensing image object detection greatly improves the performance of the detectors, its massive computational complexity and extremely large storage space requirements hinder its deployment on satellites.
With the progress of remote sensing technology, the demand for object detection on satellites is becoming increasingly urgent. However, limited by the space environment, the computing power that can be provided on the satellite is far from that on the ground. In this situation, remote sensing image object detection on satellites not only has to deal with the ongoing challenges but also needs to solve the problem of the feasibility of the detector. The feasibility of the detector on the satellite is equally important as its performance. To improve the performance of the detector, some techniques used on the ground, such as feature fusion, and the use of a deeper network, may consume massive storage space and calculations that may make them impossible to implement on satellites.
To solve the problems mentioned above, this paper introduces the idea of a lightweight network into remote sensing image object detection and proposes a lightweight remote sensing image object detection framework called multi-scale feature fusion SNET (MSF-SNET). The backbone network of the proposed framework is partly modified based on the lightweight network SNET [12] to reduce the on-board processing complexity and the number of parameters. In this framework, a recursive feature fusion strategy is used to balance performance and feasibility. The proposed framework performs object detection on multiple feature maps to solve the problem of large-scale changes between different classes of objects.
Due to the lack of training samples and the large changes in the object appearance affected by the imaging conditions, the training samples are particularly rotated, cut, symmetrically flipped, zoomed, and moderately occluded. It is worth noting that the remote sensing image is difficult to adapt to the input of the deep learning model, the large size image is split according to a certain overlap ratio during training and detection.
The main contributions of this paper are summarized as follows.
1. We introduce a novel lightweight remote sensing image object detection framework called MSF-SNET. The proposed framework is an end-to-end detection model with multiple scale features in the detection part and feature reuse and fusion strategy is adopted. It is applicable to object detection on satellite.
2. Through experiments on NWPU-VHR-10 [15] and DIOR [16] remote sensing image object detection dataset we show that our framework achieves acceptable performance with fewer parameters and less computational cost compared with state-of-the-art methods [12,13,14]. The feasibility of the framework is important as its performance. We make a balance between performance and feasibility by reducing network parameters and computing costs.
3. A feature fusion method is proposed to take advantage of low-level features and deep features to improve the performance of object detection with a negligible amount of parameters and computational cost increase.
4. Cost Density is proposed in this paper. It is a fair and effective metric suitable for evaluating the performance of the algorithm under the condition of consuming the same resources. It provides a quantitative approach to evaluate the algorithm with effectiveness.
The rest of this paper is organized as follows. Section 2 reviews the related work of the object detection framework for remote sensing images. In Section 3, we introduce our proposed method and present the details of the proposed framework, namely Multi-scale fusion SNET, MSF-SNET. In Section 4, experimental results on two different datasets are illustrated to demonstrate the performance of our method. Section 5 contains a discussion of the implication of the results of Section 4. Section 6 involves our conclusions plus some ideas for further work.
2. Related Work
Remote sensing image object detection methods can be roughly divided into four categories: expert-based methods, machine learning (ML)-based methods, deep learning (DL)-based methods, and light DL methods.
Expert-based methods are further divided into three classes as template matching-based methods, knowledge-based methods, and object-based image analysis (OBIA) [1].
Template matching-based methods regard the object detection task as a similarity matching problem between template and objects. For example, these methods are used to detect roads in remote sensing images because roads can be viewed as a simple template and shifted through the image [17,18,19,20,21] to find the best matches. Although this method is simple and effective, it is easily affected by rotation, scale changes, and viewpoint change.
Knowledge-based methods regard the object detection problem as a hypothesis testing problem [22], such as using the geometric knowledge of the object to detect buildings in the image [23,24,25,26]. In this type of method, the establishment of prior knowledge and rules is essential. The performance of these methods depends heavily on the prior knowledge of experts and detection rules. However, complete prior knowledge establishment is difficult and detection rules are subjective.
OBIA object detection converts the object detection task into a classification problem. The image is first broken up into objects representing land-based features, and then prior knowledge or established rules are applied to classify these objects [27,28]. This type of method can comprehensively use the object shape, texture, context knowledge, expert knowledge, and other information for object detection. For example, these methods are used to detect landslide mapping [29,30,31,32,33], land cover, and land-use mapping [34,35]. Moreover, the prior knowledge is not complete and expert knowledge used in classification is still subjective.
ML-based methods play an important role in remote sensing image object detection. These methods first extract features from the training data, such as histogram of gradient (HOG) features [36], bag-of-words (BoW) features [37], local binary patterns (LBP) features [38], and Haar-like features [39]. Then supervised, semi-supervised, or weakly supervised methods are used to train a classifier, such as support vector machine (SVM) classifier [40], AdaBoost [41], and k-nearest-neighbor (kNN) [42] to classify the extracted features. These methods are used in many applications, for example, aircraft detection [43,44], ship detection [45,46], vehicle detection [47,48], and airport runway detection [49]. Although these methods have achieved promising performance in applications mentioned above, they still rely on handcrafted feature descriptors. Generic feature descriptor is still not available. It is still a challenging issue to design a general discriminative feature for object detection.
DL-based methods, especially deep convolutional neural networks (CNN), have started to dominate the object detection task. One significant advantage of CNN is completely unsupervised feature learning. It can learn discriminative features directly from data.
These methods can be categorized into two main types: one-stage methods and two-stage methods. One-stage methods adopt a fully convolutional architecture that outputs a fixed number of predictions on the grid. While two-stage methods leverage a proposal network to find regions that have a high probability to contain an object. Then a second network is used to get the classification score and spatial offsets of the proposals from the proposal network. One-stage methods prioritize inference speed. While two-stage methods prioritize detection accuracy.
The typical two-stage methods are R-CNN [50], Fast R-CNN [51], and Faster R-CNN [7]. The typical single-stage methods are YOLO [8], YOLO9000 [9], YOLO V3 [10], YOLO V4 [52], SSD [11], and DSSD [53].
Although the CNN-based algorithms perform well in the object detection task, their excellent performance comes at the cost of many parameters and high computational cost.
Light CNN methods have been proposed, such as ThunderNet [54], MobilenetV1 [55], MobilenetV2 [56], SqueezeNet [57], ShuffleNet [58], ShuffleNet V2 [57], Xception [59], Light Head R-CNN [60], and model compression to reduce the time complexity and space complexity of the network.
Some of these light CNN methods use a lightweight backbone such as SNET used in ThunderNet. While some of these methods use a light head such as Light Head R-CNN. Otherwise, model compression is also used to shrink trained neural networks. Compressed models usually perform similarly to the original model while using a fraction of the computational resources.
In the field of remote sensing, the excellent performance of CNN in object detection task has attracted many researchers to make great efforts to CNN based remote sensing image object detection [61,62,63,64].
To solve the problem of object rotation variations in remote sensing images, some methods are proposed based on or Faster-RCNN architecture. For example, a rotation-invariant layer [13] is proposed and added to RCNN. Besides, rotation-invariant regularity and Fisher discrimination regularizer [65] are added to Faster-RCNN. Multi-angle anchors [66] are also introduced into the region proposal network (RPN) [7] to solve this problem.
To improve the object positioning accuracy, an unsupervised score-based bounding box regression (USB-BBR) method [61] is proposed, and a position-sensitive balancing (PSB) method [6] is used to enhance the quality of the generated region proposal.
For the sake of inference speed, some one-stage methods are proposed. For example, a regression-based vehicle detection method [67] and a rotation-invariant detector [68] with a rotatable bounding box are proposed based on SSD. A method [69] that can detect ships in any direction is proposed based on YOLOv2. A detection framework [70] with multi-scale feature fusion is proposed based on YOLO, and a novel effectively optimized one-stage network (NEOON) [71] method based on YOLOV3 is proposed.
The abovementioned methods have achieved superior performance and facilitated the development of remote sensing image object detection greatly. However, there are still some challenges to be addressed when the detector is deployed on the satellite. Constrained by affordable resources in the space environment, a more lightweight model is desired to reduce calculations, parameter storage space, and power consumption.
In this paper, we tackle the previous problem and propose a lightweight object detection framework for remote sensing images. Due to the lightweight property of ThunderNet, we construct our framework based on its backbone network named SNET. Inspired by the idea of the deconvolutional single shot detector (DSSD), a lightweight feature fusion method is proposed and we detect small objects on shallow features and big objects on the deep features. The experimental results confirmed that the proposed lightweight object detection framework can achieve excellent performance in remote sensing image object detection.
3. Method
Remote sensing datasets may involve a variety of objects at different scales. For example, among the ten classes of objects contained in NWPU VHR-10 dataset, vehicles and storage tanks are very different in scale from ships, baseball fields, and basketball courts. Therefore, the remote sensing image object detection network is required to be able to detect objects in large and small sizes in an onboard environment. Constrained by affordable computing power, it is still a very challenging problem to achieve the object detection of satellite imagery.
This paper proposes an onboard object detection framework based on SNET, called Multi-scale fusion SNET (MSF-SNET), which is optimized for the onboard application environment and is a lightweight framework. Next, the characteristics of MSF-SNET will be analyzed. The working process of MSF- SNET framework on the satellite is shown in Figure 1.
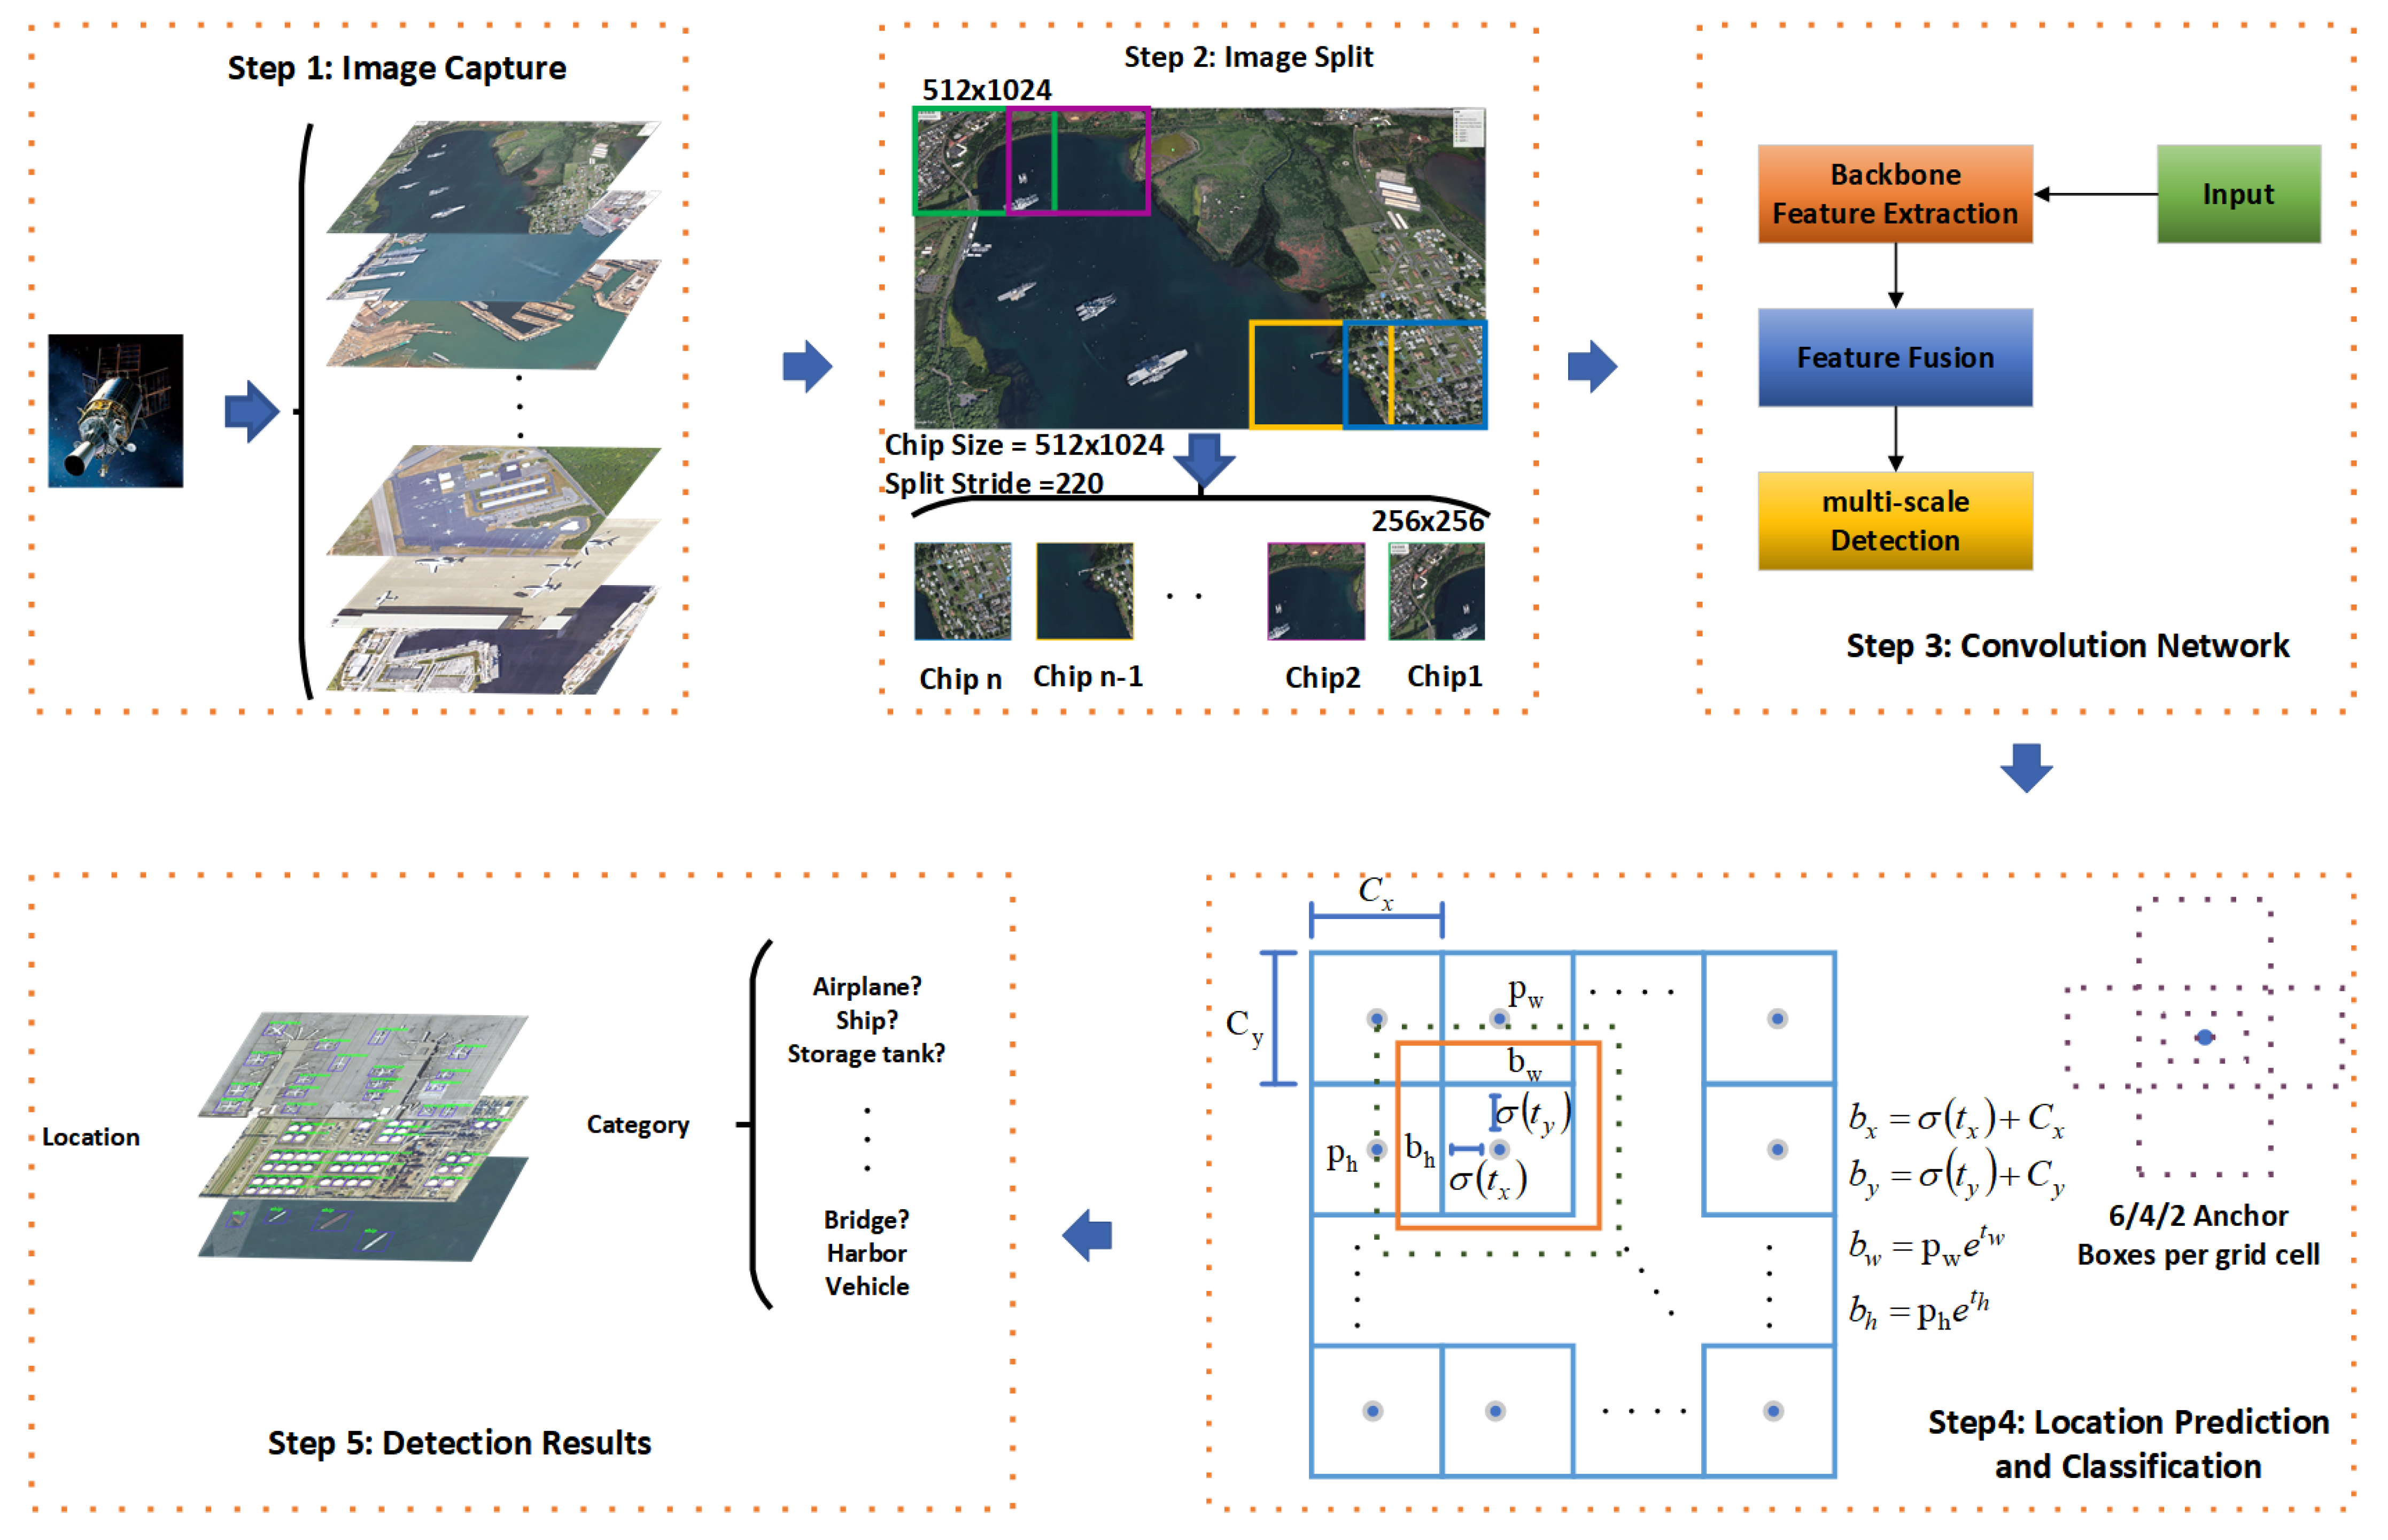
The workflow of an onboard object detection system in which MSF-SNET is used is divided into five steps.
Step1: image capture. The image obtained by the satellite camera has an ultra-large size, which far exceeds the input image size of the convolutional network.
Step 2: slice the image. Although the captured image can be rescaled, adjusting the size will cause information loss, particularly small objects may be lost completely. Therefore, it is necessary to slice the captured image to make the size meet the input requirements of the convolutional network. Considering the hardware implementation of the onboard environment, each slice is fixed at 256 × 256 in this article, and the step size is 220, that is, the input size of the convolutional network is 256 × 256.
Step 3: features extraction. The backbone network of MSF-SNET plays a vital role in the overall architecture which is responsible for extracting features. The performance of the backbone network determines the performance of the entire detector, and its computational cost also occupies most of the calculation of the entire detector. MSF-SNET uses a lightweight backbone network to reduce the amount of calculation while maintaining its performance.
Step 4: position regression and classification. Position regression and classification are performed on six different scale feature maps to get the locations and classes of objets reside in each chip. The location regression and classification method are logistic regression which was also adopted by YOLO V3.
Step 5: detection results. The final detection results are obtained according to indices of the slices and the detection result of each slice.
3.1. Multi-Scale Fusion SNET
In this part, the details of MSF-SNET are described. Our model design emphasizes the lightweight feature and computational efficiency of the model without reduction of detection accuracy. The MSF-SNET network structure is illustrated in Figure 2.
3.1.1. Input Image Size
The input image size in the object detection network is relatively large. For instance, the YOLO input image size is 416 × 416, and the FPN input image size exceeds 800 × 800. Although the input image with large size has certain advantages, it will cause huge calculation burden. The results of ThunderNet indicate that the input image size of the CNN network needs to be compatible with its backbone network. When a large backbone network is used to extract features of a small image, the size of the extracted features is low, and detailed features will be lost. On the contrary, when a small backbone network is used to extract features of a large image, its ability to extract features is limited by the network, so that information of the image is lost. In practical scenarios, satellite images are sent to the detection model after being sliced and the model is implemented by dedicated hardware, which limited the input image size. The selected image size needs to be suitable and simple for hardware implementation. Considering comprehensively, the input image size is set to 256 × 256. The input image into the model in this work is an RGB image.
3.1.2. Backbone Network
The basic function of the backbone network is to extract features from the image, which has a significant impact on the performance of object detection. The design goal of the MSF-SNET backbone network is to obtain as many objects features as possible with a low computational cost.
Previous work [60] has proved the importance of the receptive field to the object detection model. In terms of large objects in remote sensing images, such as baseball fields, basketball courts, ships, etc., they require a larger receptive field to extract contextual information and related feature information. Large receptive fields can effectively represent more features of large objects. The small receptive field only perceives the local information of the object, which causes the decrease of the precision rate. For large objects detection, deeper features with a large receptive field are required, while for small objects detection, low-level features are required.
Besides, low-level features contain a large amount of spatial location information. The localization subtask is more sensitive to the low-level features, but deep features are more discriminative and important to the classification subtasks. The lightweight backbone network needs to consider the impact of both features on two types of subtasks. Therefore, our backbone uses multi-stage to extract both deep features and low-level features, so that MSF-SNET can make use of the discriminability of deep features to improve the accuracy of a classification and make use of the spatial detail information of low-level features to improve the accuracy of the location.
While the previous lightweight object detection models can improve speed and reduce model parameters, there are still some limitations, for example, ShuffleNetV1/V2 has restricted receptive field, MobileNetV2 lacks low-level features, and Xception suffer from the insufficient high-level features under small computational budgets [54].
ThunderNet considers the above factors and makes improvements based on ShuffleNet V2, but it can still be improved.
Based on these insights, we built a more lightweight backbone network based on the backbone network (SNET) of Thundernet.
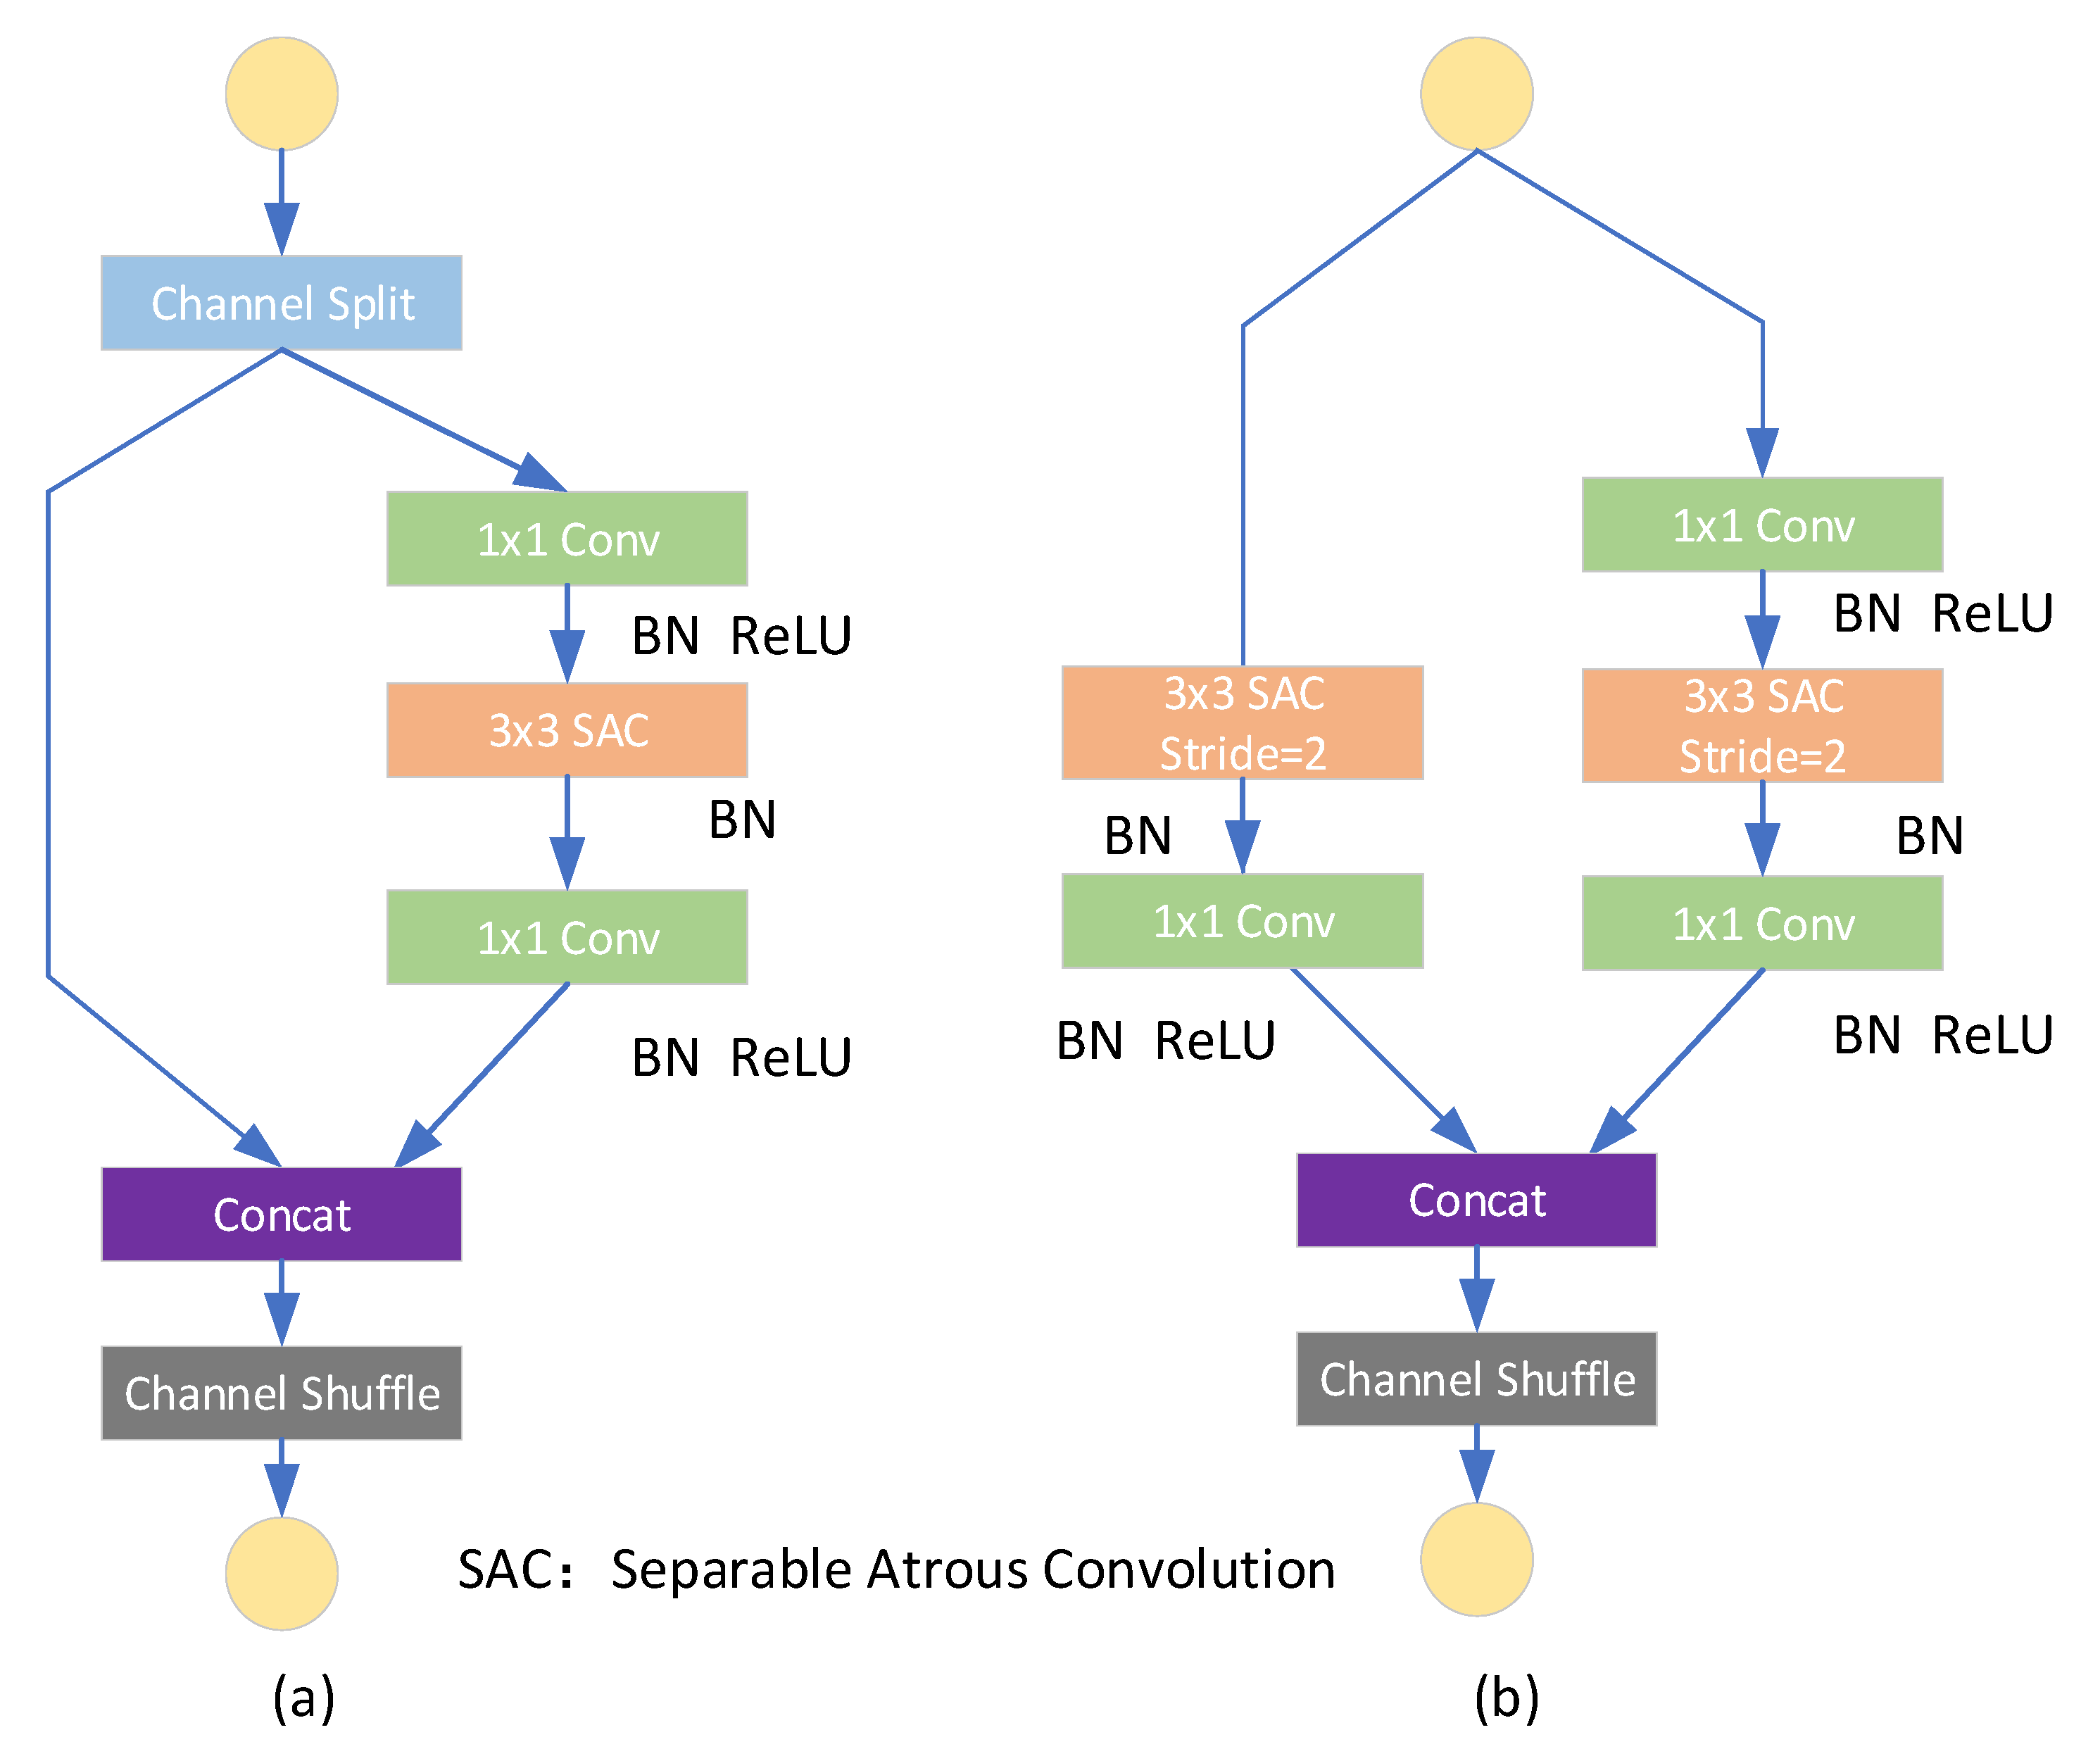
First, we replace the 5 × 5 depthwise convolutions with a 3 × 3 separable atrous convolution (dilated rate = 2) [72]. It effectively reduces the computational cost and the number of parameters while maintaining its receptive field.
Second, to adapt to the detection of super-large objects, three additional convolutional layers are added to extract deeper features. At the same time, to perform position regression and improve the detection ability of small objects, and balance the deep and low-level features, three feature layers from the backbone network together with the last three layers are used as detection feature layers.
The last convolutional layer of stage2 is denoted as C2, the last convolutional layer of stage3 is denoted as C3, and the last convolutional layer of Stage4 is denoted as C4. Three newly added convolutional layers are denoted as C5, C6, and C7 respectively. Object detection and position regression are performed on the output feature maps of these 6 convolutional layers. Table 1 shows the overall architecture of the backbone.
The basic building blocks of MSF-SNET are shown in Figure 3. In Table 1, the basic components of stage2, stage3, and stage4 use the same units as Shufflenet v2 used. Stage2 is composed of one SDU and three BUs cascaded to each other. The SDU achieves 2 times downsampling, and BU is the basic component of the backbone network.
As shown in Table 1 the backbone is made up of three stages and four convolution layers. The three stages contain two basic units named spatial down-sampling unit (SDU) and basic building (BU) which are shown in Figure 3. The first layer in the backbone is a 3 × 3 convolution layer with twenty-four filters followed by a max-pooling layer. The max-pooling layer uses a window of size 3 × 3 with a stride of 2. Stage 2, stage 3, and stage 4 are the main blocks of the backbone. One SDU and three BUs are stacked to form stage2 and stage 4, one SDU, and seven BUs are stacked to form stage 3. the output size of each layer or block is shown in Table 1. The output of the previous layer is the input of the next layer, so the input size and output size of each layer can be obtained according to Table 1.
We compared the proposed framework with ThunderNet in terms of network parameters and computational cost (Flops, one Flop stands for one multiplication and one addition operation). The comparison results in Table 2, it implies that the network parameters of the proposed framework have been reduced by 4.2%, and the computational cost has been reduced by 5.0% when the input image size is 256 × 256. By reducing the number of parameters and the computational complexity, the proposed algorithm is more efficient.
3.2. Feature Fusion
To improve the accuracy of classification and location, deep features and low-level features are combined so that the discriminability of deep features can be fully utilized. The most common feature fusion method is the feature pyramid network (FPN) [73]. While improving the detection performance, FPN tends to obtain a limited receptive field and an increase of the number of blocks will lead to a large parameter burden and memory consumption. Thus, it is not suitable for application in lightweight networks. Inspired by previous work [53,74], a lightweight feature fusion method is proposed. The proposed method is illustrated in Figure 4.
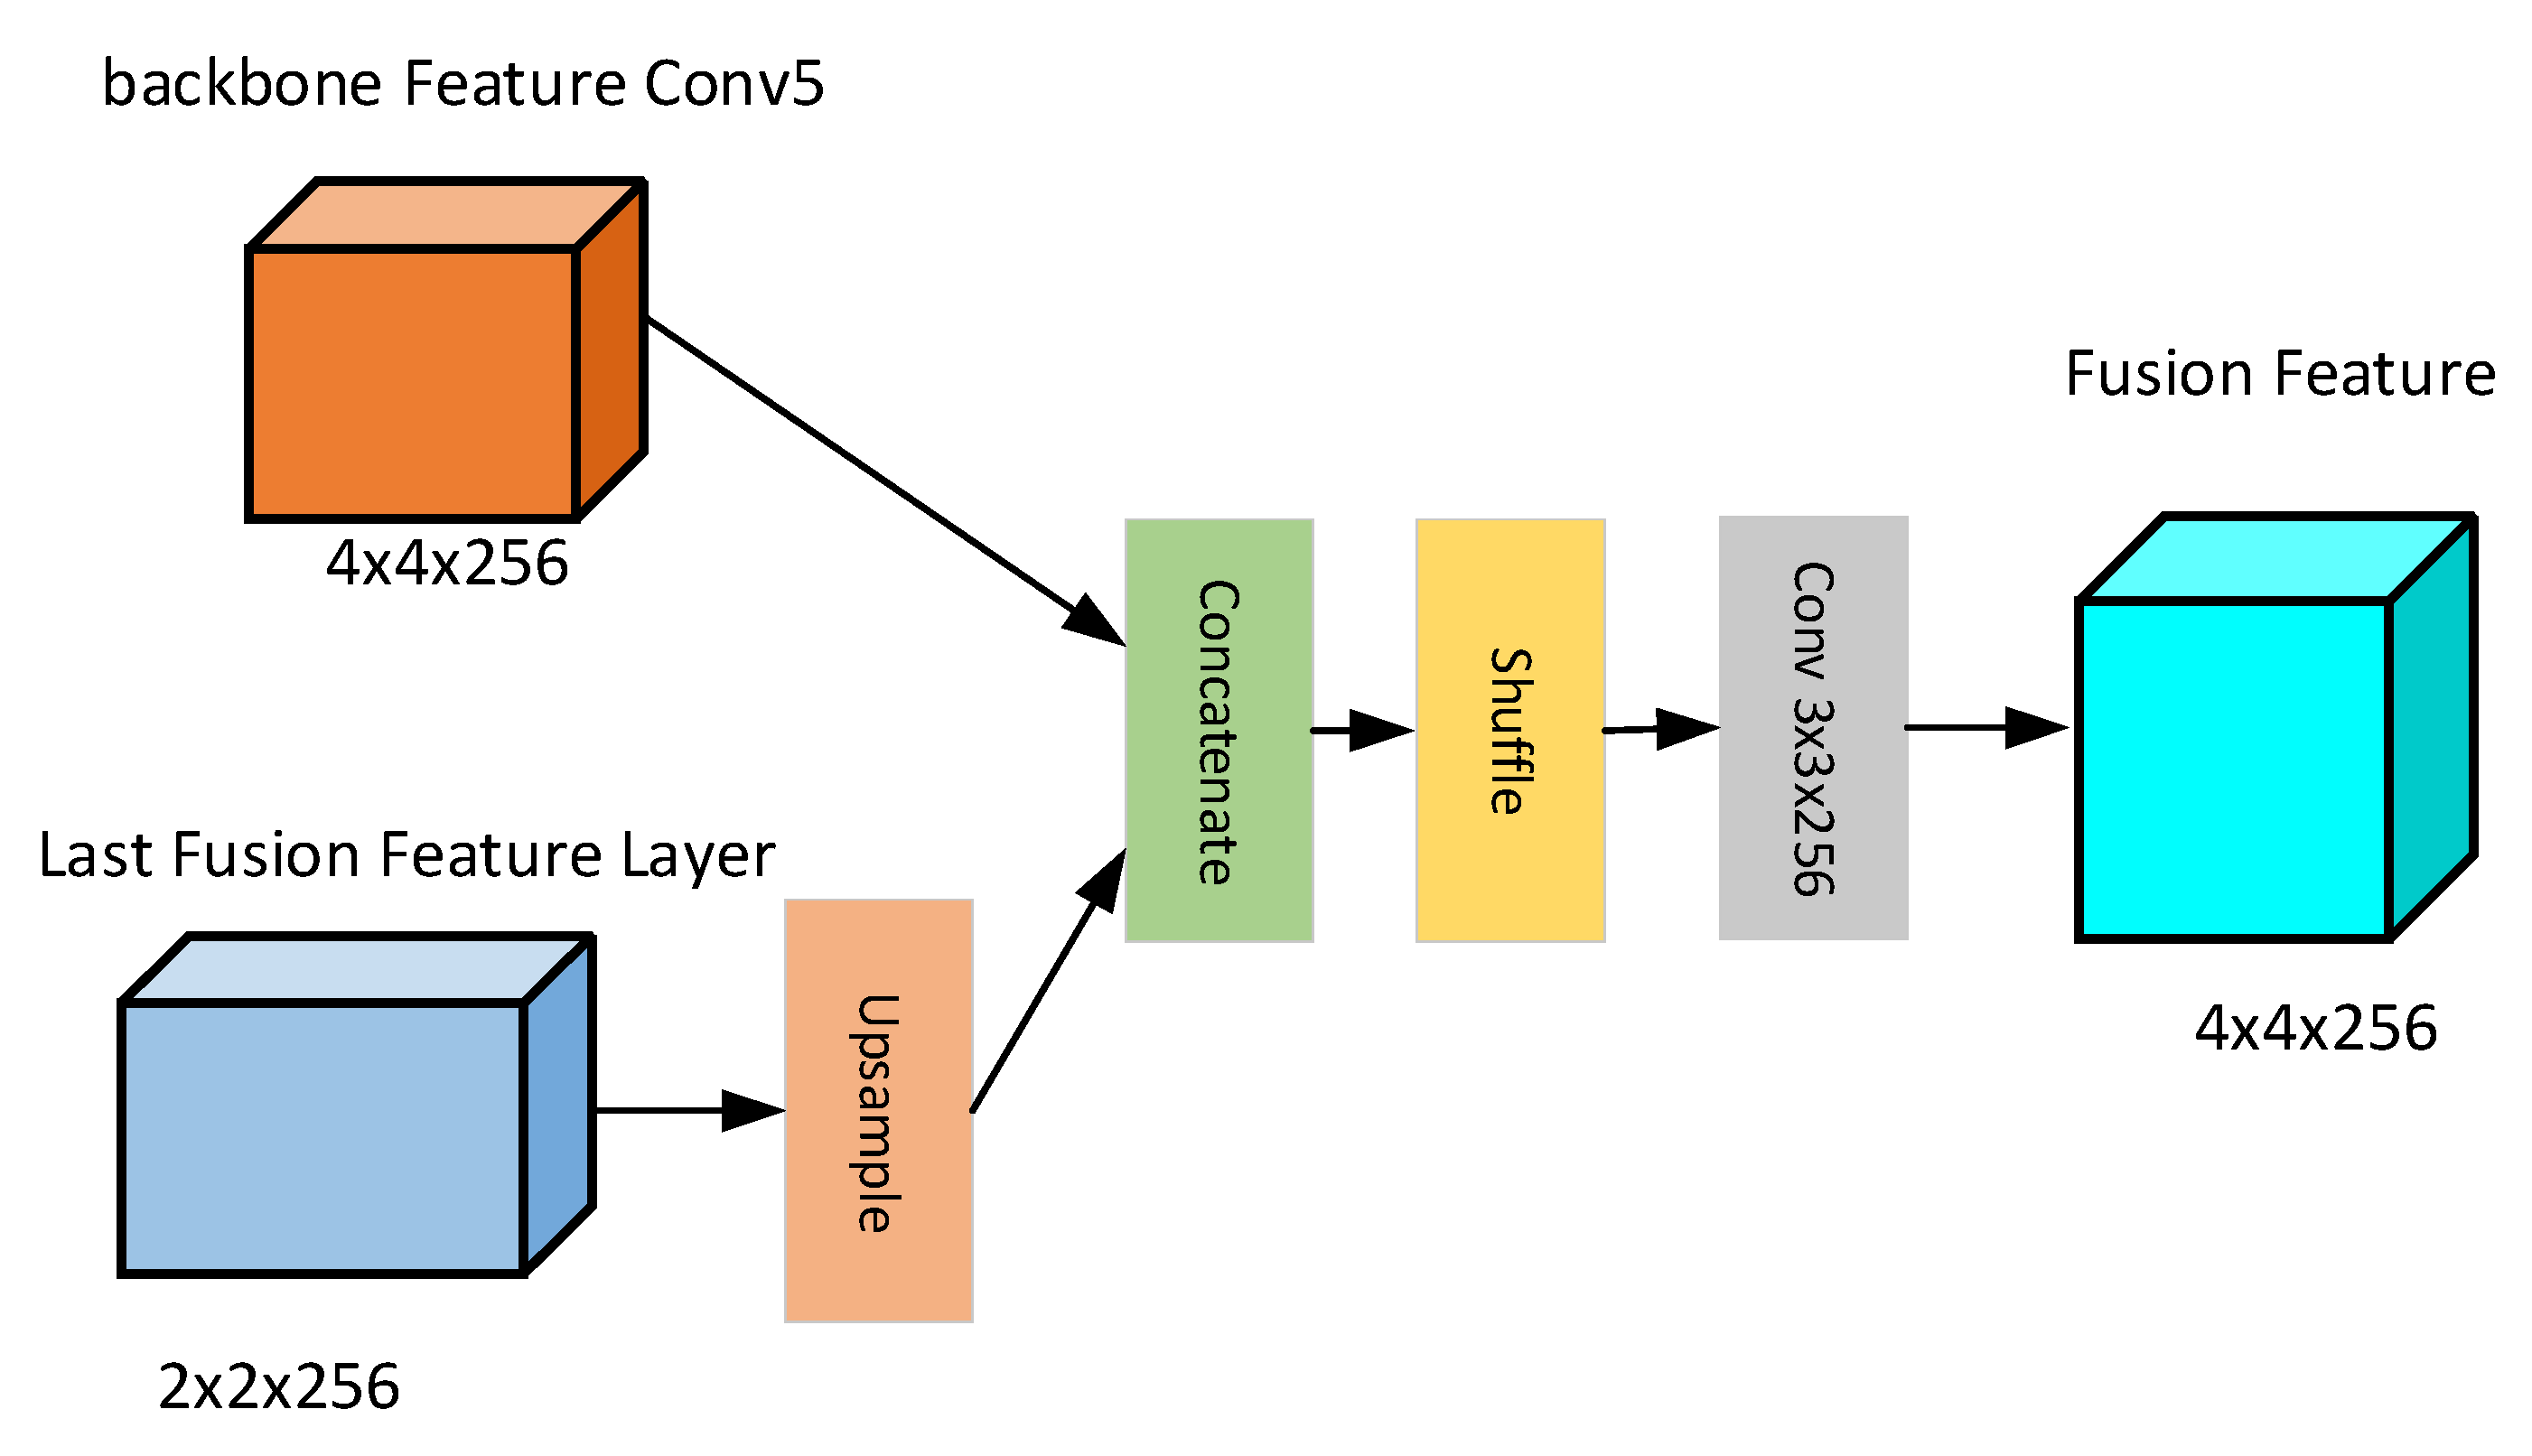
The output features of the last layer are up-sampled and then subjected to a 3 × 3 convolution to obtain the features of the same size as the previous node. Then the two features are cascaded, and feature shuffle is performed to form the final detection feature map. For example, the last output feature map C7 is up-sampled and convolved to obtain C7_lat, which has the same size as C6. C7_lat and C6 are concatenated and shuffled to form a feature map f6 for object detection. Then f6 is up-sampled and convolved to obtain C6_lat. Concatenate C6_lat and C5 to form a feature map of another scale. By analogy, all object detection feature maps are obtained. This method achieves the fusion of deep features and low-level features with a little computational cost.
Many references have concluded that although the fusion of multi-layer features can improve the performance of the algorithm, it requires many computing resources. SSD experimental results suggest that feature fusion can improve the accuracy by about 1-1.5%. Although the performance was slightly improved, the computation cost of feature fusion was 5.04G Flops (one multiplication and one addition), which increased by 14.2%. Computation cost is too high compared with the performance improvement brought by feature fusion. Unlike DSSD, our method abandons the use of deconvolution. Instead, the fused features are directly up-sampled and cascaded with the features obtained from the backbone network. The features are shuffled and convolved to obtain the fusion features of the upper layer. The experimental results demonstrate that this method achieves similar performance as the feature fusion method of DSSD, but the method results in a reduction of computing cost.
3.3. Predict Module
RCNN series are the representatives of two-stage detection algorithms, YOLO and SSD are the typical representatives of one-stage detection algorithms. For two-stage detection algorithms, the proposed boxes are first obtained through the region proposal network (RPN), and then position regression and classification are performed on this basis. The one-stage object detection network considers that each point on the feature map as a detection point, which corresponds to several anchors, and then performs position regression and classification based on these anchors. Compared with the one-stage algorithm, the two-stage algorithm requires an additional RPN network to propose a frame. Therefore, it needs to take up extra storage space for parameters and occupy extra computing resources, while its accuracy will be slightly higher than that of the one-stage object detection algorithm. For object detection onboard, a balance needs to be made between accuracy and computational cost. High accuracy is not the only pursuit. Moreover, it is expected that the detection part is simple and efficient, thus the computational complexity is reduced.
A one-stage detection network is more suitable for satellite applications due to its simplicity and rapidity. To this end, we adopt the one-stage network as the basic detection method. Inspired by SSD and DSSD algorithms, objects are detected on multiple feature scales. The second stage output, third stage output, and fourth stage output of SNET are employed as the detection feature maps. These features are low-level features that contain rich location information and are more beneficial to small object detection. Besides, to detect large-scale objects, another three convolution layers are added to the network, thus three more feature maps are generated respectively. These three feature maps are extracted from deep features that contain rich semantic information. Therefore, it is convenient for large object detection.
After trying four kinds of detection modules, DSSD describes the result that the detection module shown in Figure 5 conducted the highest efficiency. In this paper, this detection module is used as the object detection part.
3.4. Detection Architecture
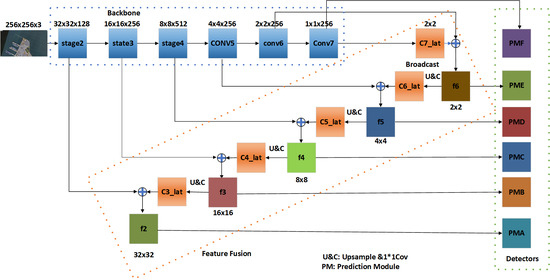
As shown in Figure 2, the output size of stage2, stage3, and stage4 are 32 × 32 × 128, 16 × 16 × 256, 8 × 8 × 512 respectively. The feature map size is reduced to half of the original size after each stage by convolution with a stride of 2. To build a rich feature representation of the original image, another three convolution layers named C5, C6, and C7 are added. The feature map size of each layer is also reduced to half of the original size after each layer by maxpooling with a stride of 2. So, the output size of C5, C6, and C7 are 4 × 4 × 256, 2 × 2 × 256, and 1 × 1 × 256 respectively. The strategy for feature fusion shown in Figure 4 is adopted to generate the fused feature maps, i.e., f2, f3, f4, f5, and f6.
The prediction module shown in Figure 5 is used as a detector to perform detection. Six detectors (PMA, PMB, PMC, PMD, PME, and PMF) are set up to perform detection on different fused feature maps and the output of conv7 simultaneously. The six detectors of diverse sizes and sensitivities could take advantage of both low-level and high-level features in this way to improve the detection performance.
The input image is split into a grid of S × S cells in YOLO network. A cell is responsible for detecting the existence of the object if the center of which is failed into the cell. Similarly, these six detectors make detection at feature maps of six different sizes, having strides 256, 128, 64, 32, 2, and 16 respectively. This means, with an input image of size 256 × 256, we make detections on scales 1 × 1, 2 × 2, 4 × 4, 8 × 8, 16 × 16, and 32 × 32. The 1 × 1 and 2 × 2 layers are responsible for detecting large objects, the 4 × 4 and 8 × 8 layers are for detecting medium objects, and the 16 × 16 and 32 × 32 layers detect the smaller objects. Therefore, the sensitivity of the six detectors is different from each other. Each of them plays a complementary role with each other.
3.5. Model Training
MSF-SNET uses multiple detectors to detect objects on feature maps of different scales. The scales of the feature maps sizes are 32 × 32, 16 × 16, 8 × 8, 4 × 4, 2 × 2, and 1 × 1 respectively. The network adopts the same training strategy as YOLO V3. Several preselected boxes are preset on the grid of each feature map. Each preselected box has a different scale and aspect ratio. The preselected box is matched with the real box (GT box) during the training process. The matching rule is that the intersection over union (IOU) value between the preselected box and the real box is greater than a certain threshold (IOU > 0.5). To remove the overlap detections, non-maximum suppression (NMS) is used for post-processing. The NMS threshold is equal to 0.5.
After the above matching process, a small number of predicted bounding boxes can be matched with the real bounding boxes, while most of the predicted bounding boxes are filtered. This will result in an imbalance between positive and negative samples. To avoid this situation, we sort the probability of each predicted bounding box and discard the predicted bounding box with low probability to adjust the ratio between positive and negative samples to 1:3. This will make the training process converge more easily.
Normally, the number of large objects in an image is much smaller than the number of tiny objects. We put this factor into consideration when setting anchors. The number of anchors set on each grid of the low-level feature map is greater than that of the deep feature map. Six anchors are set on each grid of the first two feature maps, four anchors are set on each grid of the middle two feature maps, and two anchors are set on each grid of the last two feature maps. The final setting is [6,6,4,4,2,2], which greatly reduces the number of anchors on these feature maps. The aspect ratio of Anchors is set to [1,2,3,1/2,1/3,1]. Each anchor corresponds to six parameters, which refer to four positional parameters, one confidence parameter, and one class parameter respectively.
As shown in Equation (1), the loss function of YOLO V3 is adopted as the loss function of MSF-SNET whichconsists of three parts, i.e., position loss, class loss, and confidence loss.
For each predicted bounding box, the four parameters output by the network are the normalized coordinate offset value and of the object center point and the scaling factor and of the bounding box. The coordinates of the center point and the width and height of the predicted bounding box are represented by , , , and respectively. and are the width and height of the anchor mapped to the feature map. The relationship between these parameters can be expressed by Equation (2).
The position loss function uses squared error loss, which can be expressed byEquation (3).
where is a binary factor, which means that the value is 1 only when the IOU between the j-th predicted bounding box in the i-th grid and the ground truth box is the largest, otherwise it is 0. That is, only those predicted bounding boxes with the largest IOU of the ground truth boxes contribute to the loss function, otherwise, they are not included in the loss function.
To improve the detection rate of the model for small objects, a penalty factor is added to the loss function, which can be expressed as Equation (4).
SE stands for squared error and can be expressed as Equation (5).
The class loss function adopts the cross-entropy loss function, which can be expressed as Equation (6).
The confidence loss function also uses the cross-entropy loss function. Unlike the class loss function, which only calculates the loss corresponding to the prediction bounding box with the largest IOU, the confidence loss function calculates all prediction boxes, which can be expressed as Equation (7).
where BCE represents cross-entropy loss, which can be expressed as Equation (8).
The parameter λ involved in the above loss function is the adjustment factor of the loss function, and the proportion of each part of the loss function can be adjusted according to the actual situation. Here λ is equal to 1.
To strengthen the robustness and generalization of the model, image data are augmented. Since the remote sensing image is obtained overhead, the same object may present different directions and multiple perspectives. Therefore, image rotation, object rotation, and image scaling are used to augment the data, with a scaling range of [0.5, 2]. In both the training and testing process, the image size input to the model is 256 × 256. Therefore, the remote sensing images are clipped at a 20% overlap rate before being sent to the model. Besides, we add objects randomly in the image to improve the detection performance of small objects.
4. Experimental Results
To verify and evaluate the performance of the proposed MSF-SNET framework, the public dataset NWPU VHR-10 and the DIOR dataset are used in our work. The following is a detailed description of the experimental environment, test procedures, and dataset used in our work.
4.1. Datasets
The NWPU VHR-10 dataset contains ten types of objects. A total of 650 images, including 757 airplanes, 302 ships, 655 storage tanks, 390 baseball diamonds, 524 tennis courts, 159 basketball courts, 163 ground track fields, 224 harbors, 124 bridges, and 477 vehicles, with the bounding boxes of manual annotation. The maximum size of images in NWPU VHR-10 dataset is 1728 × 1028 pixels, and the minimum size is 533 × 597 pixels. The DIOR data set contains 20 types of objects and a total of 23,463 images. The size of images in the DIOR dataset is 800 × 800 pixels.
The number of images in NWPU VHR-10 is relatively small compared with DIOR dataset. Two datasets with different number of images are both utilized to verify whether the model is effective on different dataset. Meanwhile, DIOR dataset covers more object types, which can effectively verify the adaptability performance of the model.
4.2. Implementation
Due to the number of images in the NWPU VHR-10 dataset is small, 80% of the images were randomly selected as the training set and 20% of the images as the test set in our experiment. In contrast, The DIOR dataset is larger. In the experiment, 90% of the images were randomly selected as the training set and 10% of the images as the test set. Besides, to improve the generalization ability of the model, the data within these two datasets are augmented as described in Section 3.3.
The MSF-SNET model is an end-to-end model. We implemented the model using the open-source PyTorch1.3 framework and trained it using graphics processing units (GPUs). Since MSF-SNET is modified based on SNET, we use the pre-training weight of SNET on the VOC2007 dataset as the initial weight of MSF-SNET. Then fine-tuned it on the NWPU VHR-10 and DIOR datasets. In our experiment, we used a stochastic gradient descent algorithm (SGD) to update the parameters. The batch size used in the experiment is 16, and a total of 300 epochs were performed. The learning rate of the first 100 Epochs is 0.01, that of the middle 100 epochs is 0.001, and that of the next 100 epochs is 0.0001. The momentum and weight decay were set to 0.9 and 0.0005 respectively. The PC operating system used in the experiment is Ubuntu 18.04, the CPU is Intel i7-7700, the RAM is 16GB and the GPU is NVIDIA GeForce GTX1080.
4.3. Evaluation Metrics
Precision-Recall Curve, average precision (AP) and mean average precision (mAP) is widely applied as quantitative evaluation indicators for object detection. In this paper, these indicators are also adopted to evaluate the performance of the proposed algorithm. Besides, the time complexity and space complexity of the proposed framework are also evaluated by cost density.
Precision and recall are defined as Equations (9) and (10).
Accuracy indicates how many of all positive objects are correctly predicted, and the recall rate shows how many of all positive objects are correctly predicted. AP calculates the average of all precisions with a recall rate between 0 and 1. AP is a commonly used index to measure the detection accuracy of the detector. For example, algorithms such as RCNN, YOLO, and SSD also use this evaluation index. In practical applications, the calculation method is as Equation (11)
where .
For single class objects, AP is used to measure algorithm performance, but in multi-class object detection tasks, mAP (see Equation (12)) is used to measure detector performance, which is defined as the average value of AP on multiple classes of objects.
The time complexity of a model is measured by the amount of calculation it consumes. The greater the amount of calculation it consumes, the higher its time complexity is. In this paper, the time complexity of the model is measured by counting the number of Flops consumed in the testing phase. Flop is defined as multiply and accumulation (MAC). Besides, the number of parameters is also an important indicator of model performance, as well as algorithm space complexity, which determines whether the model can be deployed.
As each algorithm runs on different platforms with different performances, the computing power is not the same. A comparison of average running time per image does not indicate the pros and cons of the algorithm. To fairly compare the performance of the algorithm, a cost density evaluation metrics is proposed, which is related to the number of parameters and computational costs required by the algorithm. The calculation method is as Equation (13).
The smaller the cost density is, the better performance the algorithm can achieve while consuming the same resources.
4.4. Experimental Results and Analysis
4.4.1. Results for NWPU VHR-10 dataset
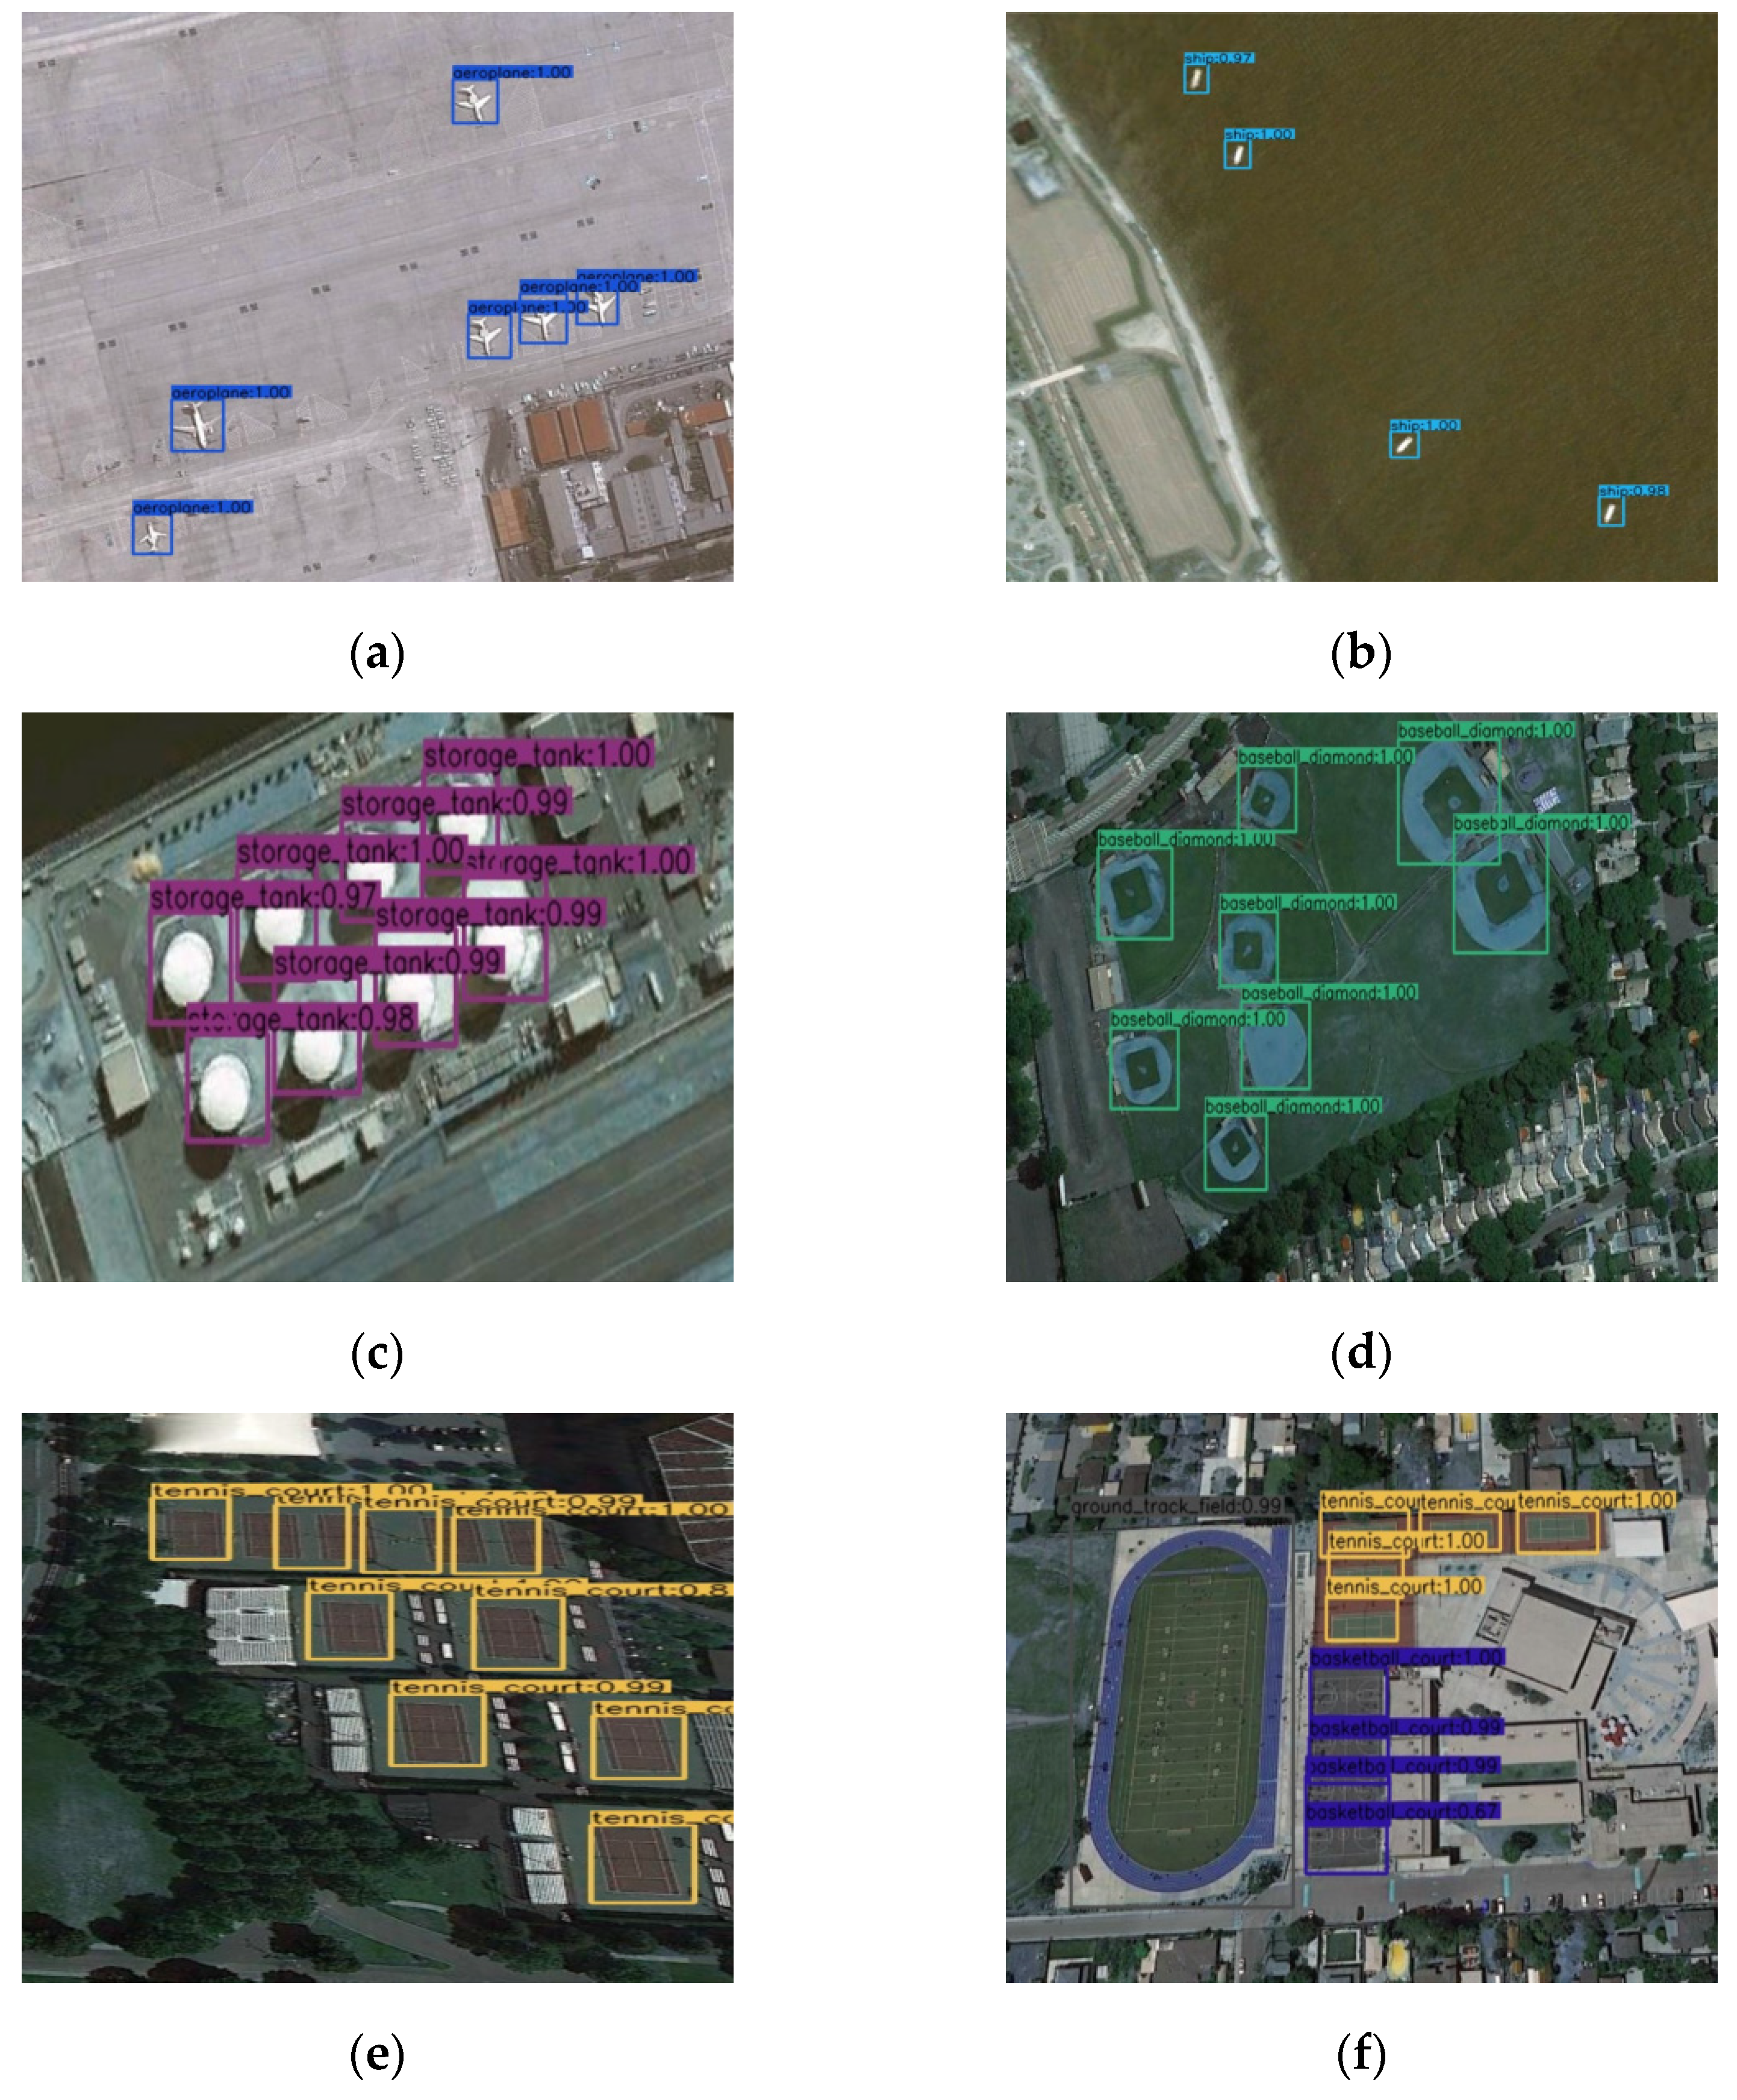
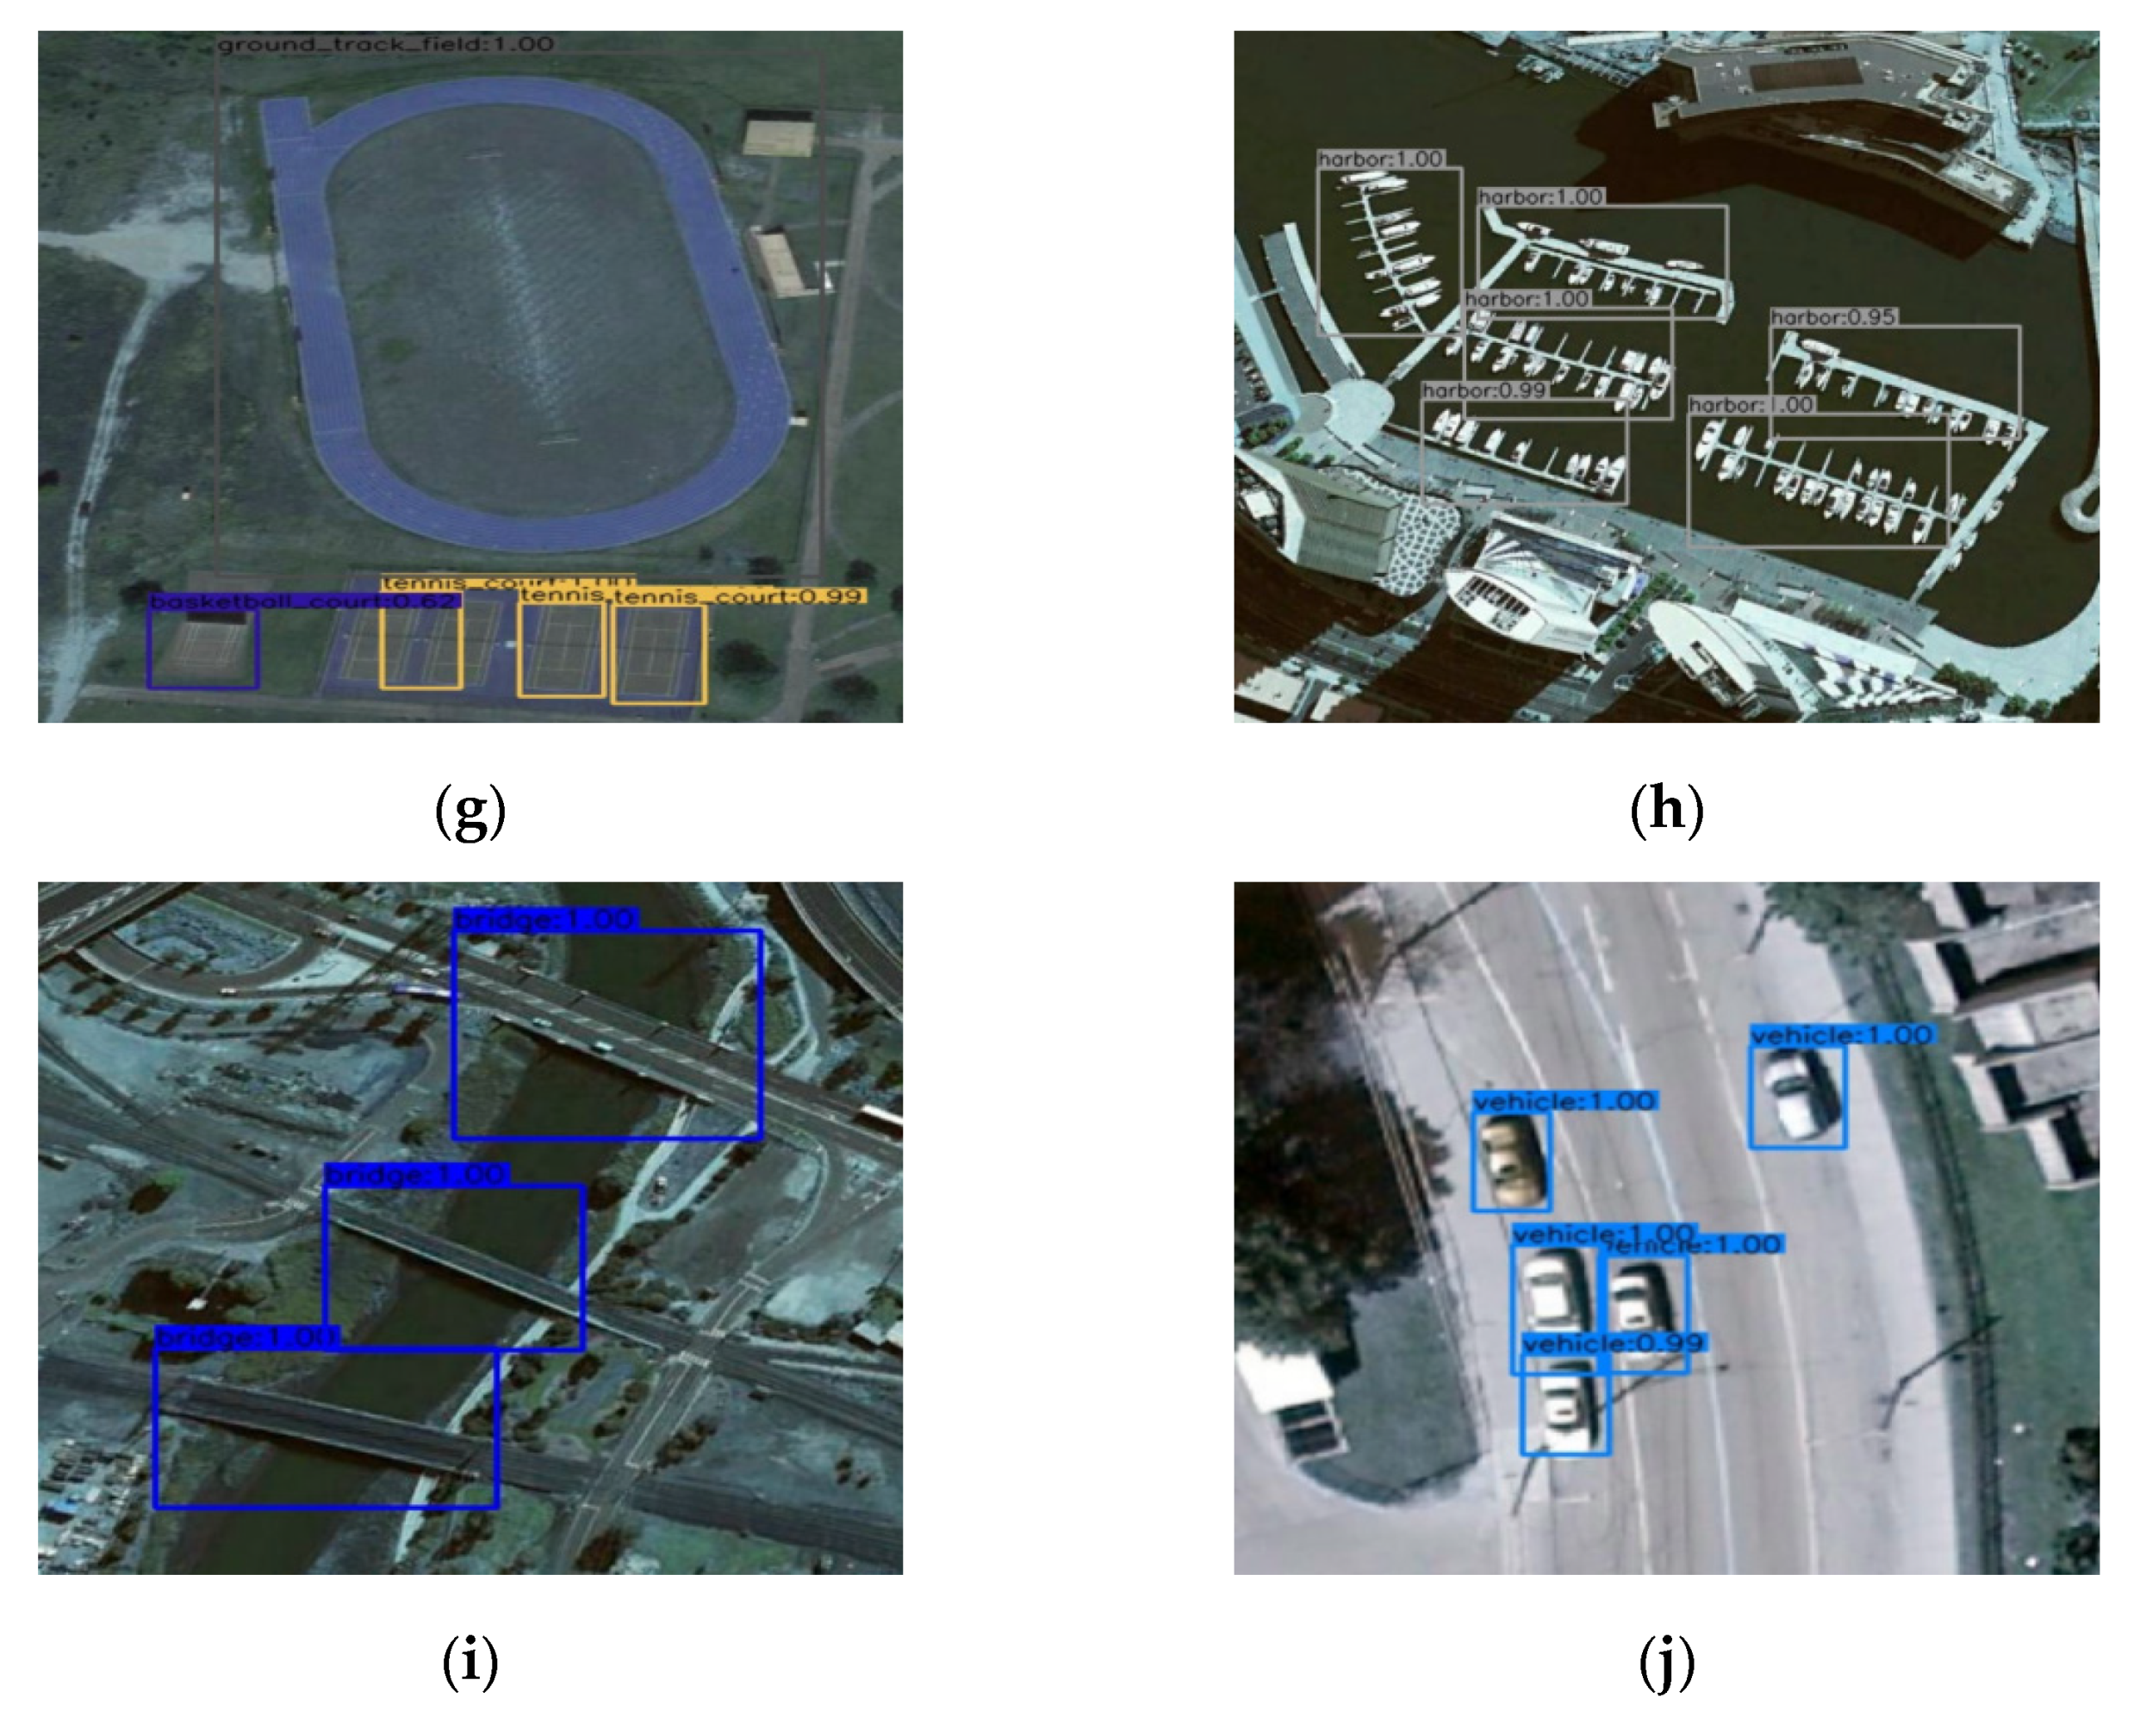
Some examples of the detection results of the proposed framework MSF-SNET on NWPU VHR-10 are illustrated in Figure 6. The results imply that the proposed algorithm is effective when detecting ten classes of objects. The proposed algorithm is not only effective for large objects detection, (for example, the Ground track field in Figure 6f,g, the harbor in Figure 6h and the bridge in Figure 6i), but also effective for small objects. For example, it can detect the small ship object in Figure 6b and the Vehicle small object in Figure 6j.
To examine and evaluate the performance of the proposed framework MSF-SNET, we compared this algorithm with the other five benchmark algorithms on AP and mAP indicators, and the results are presented in Table 3.
As shown in Table 3, the MSF-SNET algorithm is slightly better than the Thundernet algorithm which is due to the adopted multi-scale feature detection method in our proposed algorithm and the improvement brought by the fusion of deep and low-level features. Compared with Thundernet, the MSF-SNET algorithm has a higher average detection accuracy (AP) in all categories. In particular, the AP on the three types of objects of Storage tank, Tennis court, and Vehicle exceed the Thundernet algorithm by nearly 10% and the mAP is 9.92% higher than Thundernet.
Compared with CBFF-SSD [14], MSF-SNET only has a slightly higher average detection accuracy of the Bridge category, and the average detection accuracy of other categories is slightly lower than that of the CBFF-SSD algorithm, and mAP is 9% lower than this algorithm. Although the MSF-SNET algorithm is inferior to the CBFF-SSD algorithm in performance, it has obvious advantages in terms of the number of parameters and computational complexity. The number of parameters of MSF-SNET is 1.52M, and CBFF-SSD is 14.74M, which is 9 times of the proposed framework. The computational cost of the MSF-SNET is 0.327 GFlops, while that of the CBFF-SSD is 5.51 GFlops, which is 16.85 times that of the algorithm proposed in this article.
As shown in Table 4, the Cost Density of MSF-SNET is the lowest among these algorithms, which is only 0.39, It implies that the algorithm proposed in this paper has the best performance within the same computational resources.
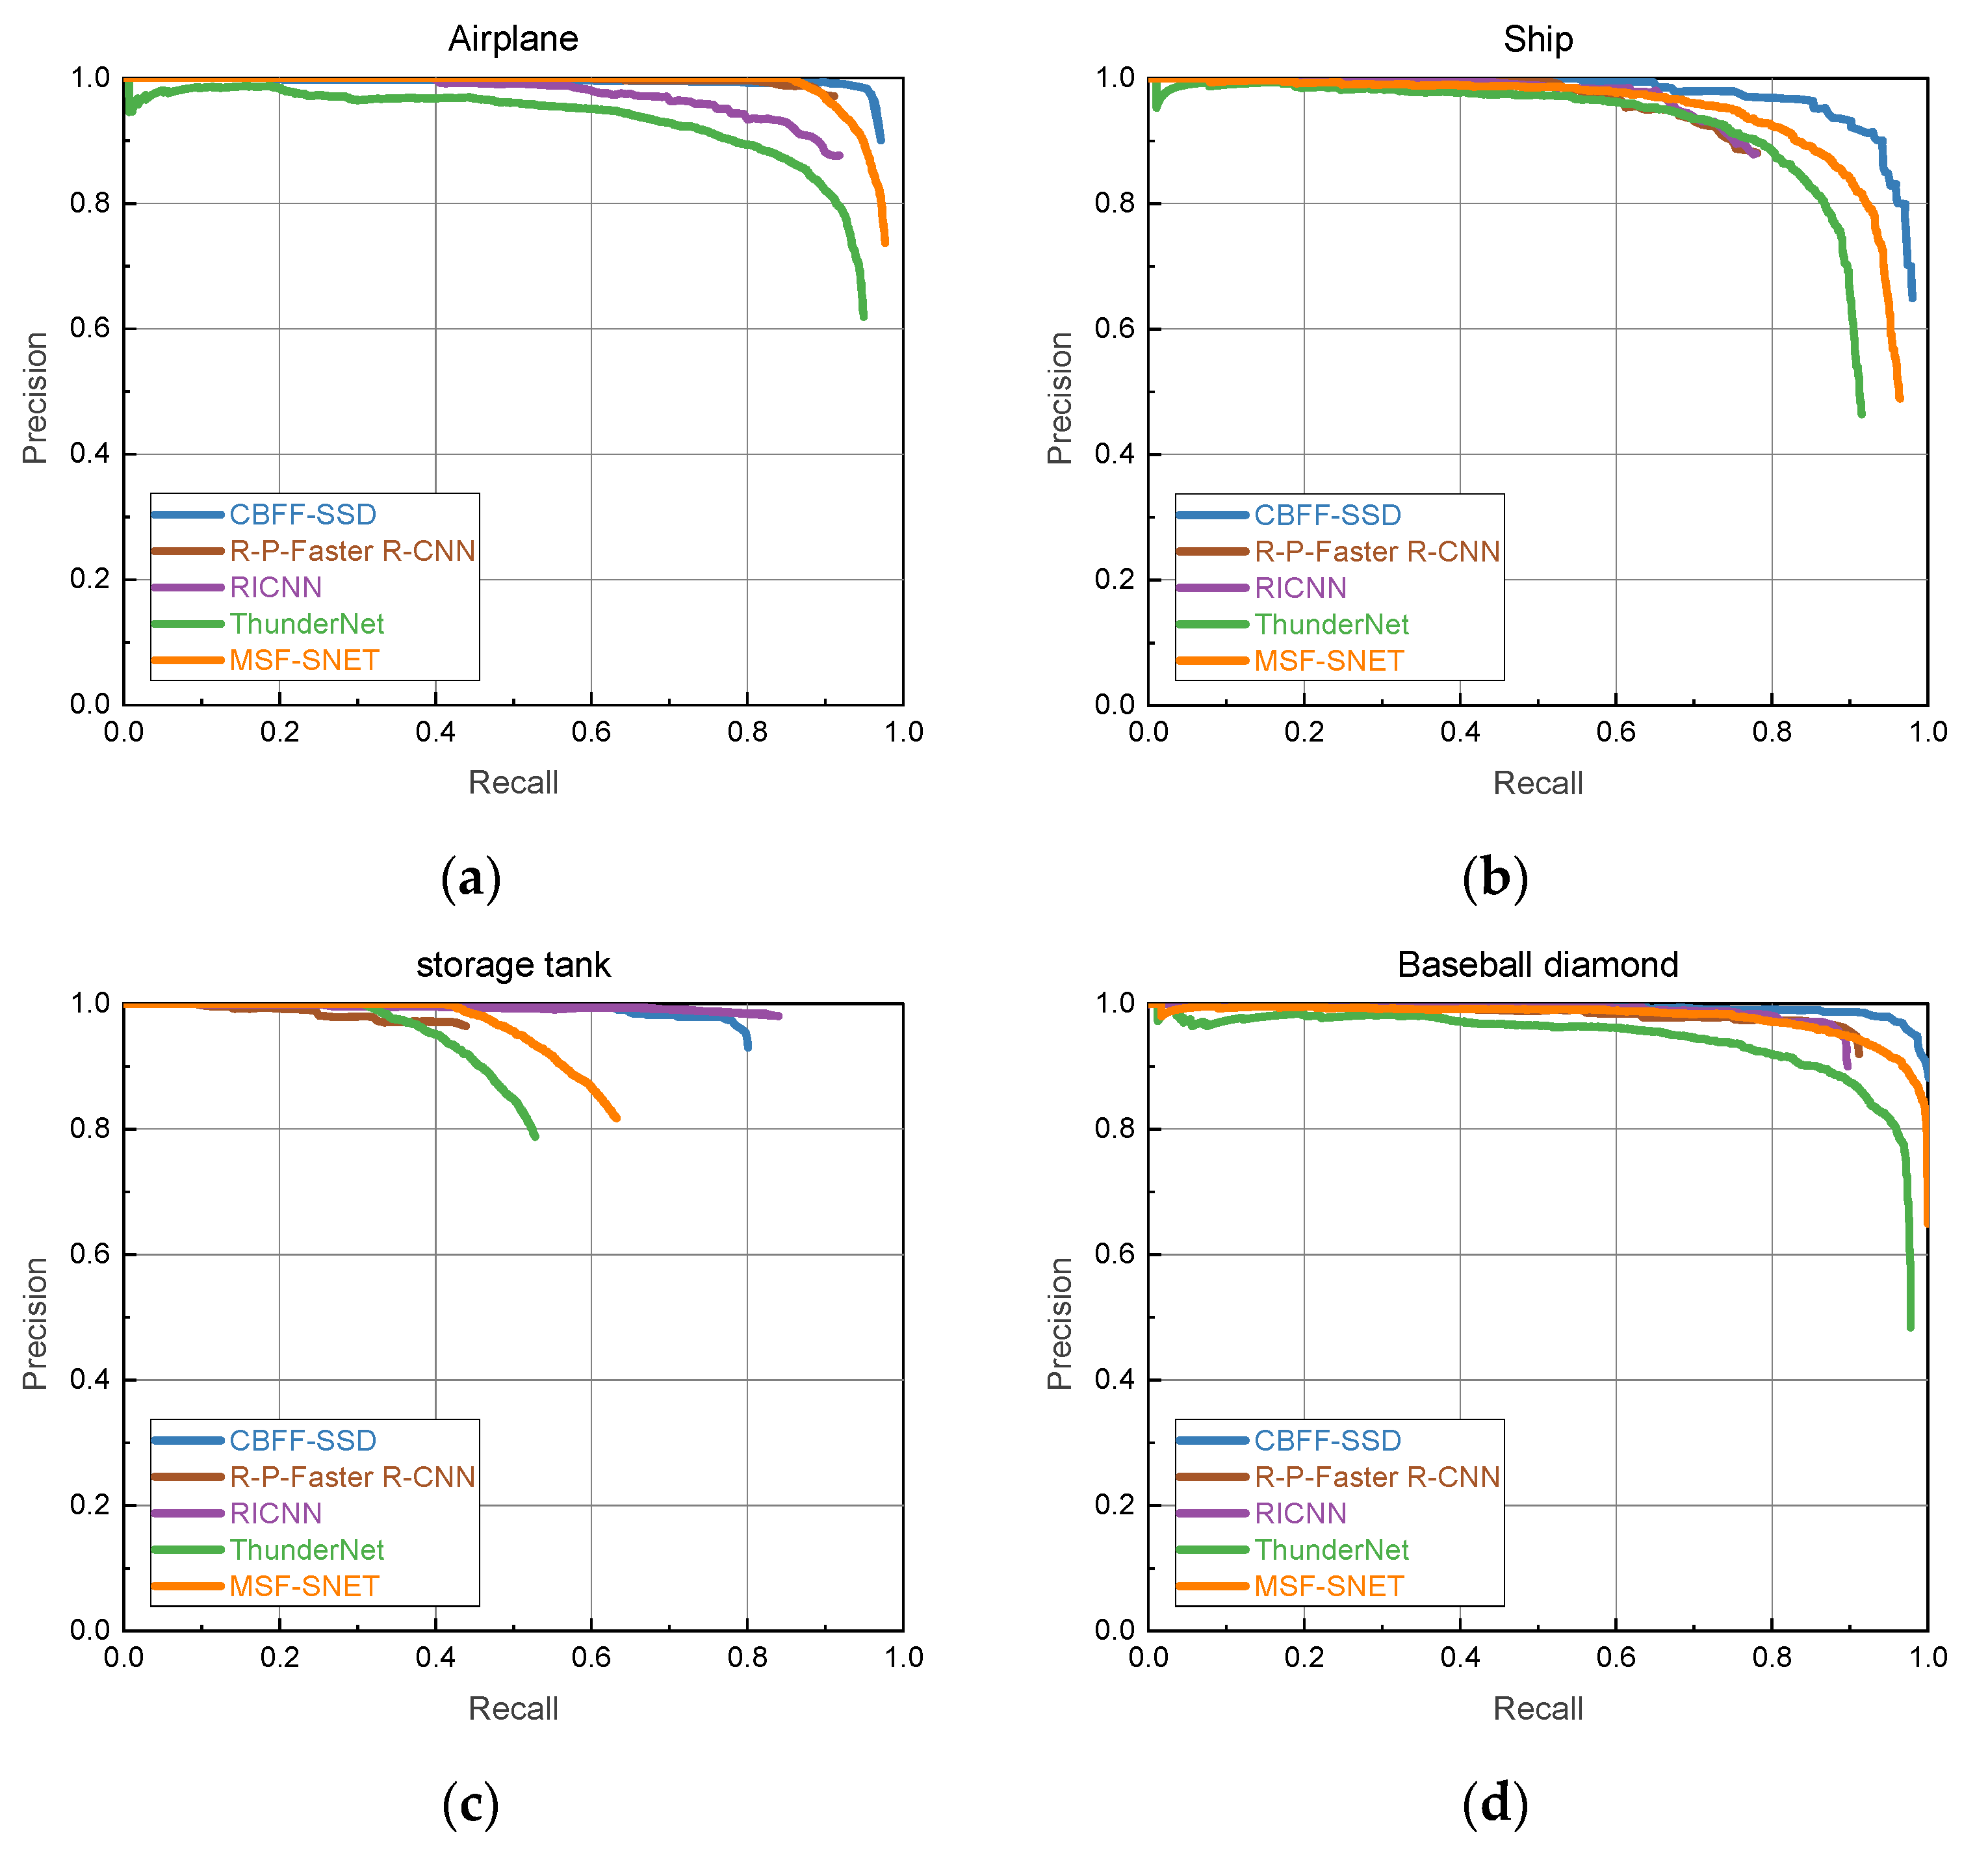
Figure 7 shows the PR curves of MSF-SNET in each category. It can be seen from the figure that although the algorithm’s mAP reaches 82.42%, the detection accuracy on the storage tank and tennis court categories is relatively low.
4.4.2. Results for DIOR Dataset
To further evaluate the performance of the proposed MSF-SNET framework, it was also trained on DIOR dataset. The detection average precision (%) of the proposed framework and other 13 representative deep learning-based algorithms are shown in Table 5 from category 1 to category 10, and in Table 6 from category 11 to category 20. each object category in DIOR is assigned an index. In Table 5 and Table 6, C1, C2, C3, C4, C5, C6, C7, C8, C9, C10, C11, C12, C13, C14, C15, C16, C17, C18, C19, and C20 are corresponding to Airplane, Airport, Baseball field, Basketball court, Bridge, Chimney, Dam, Expressway service area, Expressway, toll station, Golf course, Ground track field, Harbor, Overpass, Ship, Stadium, Storage tank, Tennis court, Train station, Vehicle, and Wind mill respectively.
Nine region proposal-based algorithms and four regression-based algorithms are selected as the benchmark algorithms for tests [16]. Proposal-based algorithms include R-CNN [50], RICNN [13], RICAOD [66], Faster R-CNN (FRCNN) [7], RIFD-CNN [75], Faster R-CNN with FPN, Mask R-CNN (MRCNN) [76] with FPN, PANet [77] and Thundernet. regression-based algorithms include YOLOv3 [10], SSD [11], RetinaNet [78], and CornerNet [79].
As shown in Table 5 and Table 6, MSF-SNET achieves the best mAP value of 66.5%. Compared with Thundernet, MSF-SNET obtains 3% mAP gains and MSF-SNET improves AP values of twenty object categories, which illustrated that our multi-scale feature detector works properly.
Besides, MSF-SNET outperforms other representative algorithms in terms of mAP and obtains the best AP value for Airplane, Baseball field, Chimney, Harbor, Stadium, and Storage tank. These results demonstrate that our lightweight object detection framework can get even better performance with much fewer parameters and fewer computing operations.
SSD gets the best mAP in four regression-based algorithms and RetinaNet gets the best mAP in Nine region proposal-based algorithms. In this experiment, we choose SSD and RetinaNet as two representative models to compared Cost Density metrics for fair evaluations, in which three representative backbone networks are used.
Table 7 shows that our framework has the lowest Cost Density compared with VGG16, Resnet-50, Resnet-101, which are set in SSD and RetinaNet respectively. It illustrated that our proposed framework gets the best mAP with only about half Cost Density compared with RetinaNet algorithm (Resnet-50 backbone). SSD has about 49 times of Cost Density compared proposed framework with accuracy dropping nearly 8%.
The experiment results show that MSF-SNET is a superior lightweight object detection framework. It not only surpasses other benchmark models on mAP performance but also significantly reduces the computational costs compared with other models.
5. Discussion
The experimental results show that the MSF-SNET proposed in this paper has comparable performance in remote sensing image object detection, and it is effective on both the NWPU VHR-10 dataset and the DIOR dataset. When the performance of the detection algorithm is not inferior or slightly inferior, the time complexity and space complexity of the model reaches SOTA. At present, most of the object detection algorithms only focus on the evaluation indicators of the algorithm itself, such as accuracy, AP, and mAP, while few of them consider the time complexity of the algorithm.
There are generally two application scenarios for remote sensing image object detectors. One of the scenarios is to detect objects in remote sensing images on the ground. Another application scenario is to apply the detector in an onboard environment, which is the application scenario that this article focuses on. In this application scenario, the detector has too many parameters to store or is too expensive to be applied on the satellite due to the computational cost of predictions. In fact, for satellite detection, the number of parameters and the computational cost is as important as the performance. The advantage of our proposed algorithm lies in that it not only enhances the performance of the algorithm itself but also carefully considers the key issues that need to be urgently solved in actual satellite application scenarios.
The number of parameters of our detector and its computational cost is compared with the current mainstream remote sensing image object detection algorithms in Table 4, and the SOTA results are obtained. The test results show that the architecture proposed in this paper can be used in scenarios where storage resources and computing resources are limited, especially is suitable for satellites application. The results will promote the deployment of object detection frameworks on satellites by easing the burden of computation.
Besides, the Cost Density parameter proposed in this paper can be further applied to better evaluate the performance of different algorithms in case of consuming the same resources, and can also be used to evaluate the performance of the algorithms in situations of limited resources.
It should be noted that when designing the detector in this article, we did not consider the types of accelerators to deploying on the satellite, such as CPU, GPU, a dedicated processor, or FPGA. Therefore, it is not optimized for a certain accelerator. For example, when using an accelerator on field programmable gate array (FPGA), it is necessary to pay attention to the influence of network structure, quantization method, whether pruning is required, model parameters, and image data loading, etc. It is worthwhile to further study the detector based on a hardware for a certain accelerator.
6. Conclusions
In our research, we use modified SNET to extract features. However, the difference is that MSF-SNET adopts a one-stage end-to-end model, which considers the two aspects of accuracy and lightweight comprehensively and makes a compromise between them. The number of parameters and the amount of calculation consumed by CNN is further significantly reduced without loss of performance.
The test results on the NWPU VHR-10 dataset and the DIOR dataset demonstrate that our proposed lightweight model is not inferior to other algorithms in accuracy and mAP, but has notable advantages in terms of parameters and computational cost reduction. Through training and testing of the network, we can draw the following conclusions:
- The performance of the lightweight model MSF-SNET is not inferior to other deep network models.
- Although MSF-SNET has been tested on the NWPU VHR-10 dataset and DIOR dataset, which indicates our model MSF-SNET can be widely applied to remote sensing object detection tasks.
- Due to its lightweight characteristics, MSF-SNET can meet the strict requirements of onboard object detection with the constraints of time and space complexity.
- The design goal of MSF-SNET is not the pursuit of the ultimate performance, but rather a balance between performance and complexity. This research is more inclined to use limited performance loss to reduce the implementation complexity.
However, in this study, no assumption is made about the accelerator used in the proposed algorithm. In future research, we will further explore the use of specific accelerators in remote sensing image object detection tasks, the further optimization of the lightweight model, and the impact on network design. As far as we know, there is no mature remote sensing image object detection model deployed on satellites. We are committed to advancing the application of the deep learning network model with our research.
Author Contributions
Conceptualization, L.H., and Y.L.; methodology, Y.B., D.J. and Y.Z. (Yanning Zhang); software, L.H. and J.W.; validation, L.H., and J.W.; formal analysis, Q.Z. and Y.Z. (Yi Zhang); investigation, J.W.; resources, L.H.; data curation, J.W., and J.L.; writing—original draft preparation, L.H.; writing—review and editing, Q.Z.; visualization, J.W. and T.C.; supervision, Y.L.; project administration, Q.Z.; funding acquisition, Q.Z. All authors have read and agreed to the published version of the manuscript.
Funding
This research was funded by the Innovation Foundation of CASC, grant number Y20-JTKJCX-02, National Key Laboratory Foundation of China, grant number 6142411204306, 6142411192205, and HTKJ2020KL504011.
Institutional Review Board Statement
Not applicable.
Informed Consent Statement
Not applicable.
Data Availability Statement
Acknowledgments
The authors would like to express gratitude to Gong Cheng from Northwestern Polytechnical University for providing the remote sensing objection dataset NWPU VHR-10. The authors would also like to express thanks to the anonymous reviewers for their very competent comments and helpful suggestions.
Conflicts of Interest
The authors declare no conflict of interest.
References
- Cheng, G.; Han, J. A survey on object detection in optical remote sensing images. ISPRS J. Photogramm. Remote Sens. 2016, 117, 11–28. [Google Scholar] [CrossRef] [Green Version]
- He, H.; Yang, D.; Wang, S.; Wang, S.; Li, Y. Road extraction by using atrous spatial pyramid pooling integrated encoder-decoder network and structural similarity loss. Remote Sens. 2019, 11, 1015. [Google Scholar] [CrossRef] [Green Version]
- Zou, Z.; Shi, Z. Ship detection in spaceborne optical image with SVD networks. IEEE Trans. Geosci. Remote Sens. 2016, 54, 5832–5845. [Google Scholar] [CrossRef]
- Zhu, M.; Xu, Y.; Ma, S.; Li, S.; Ma, H.; Han, Y. Effective airplane detection in remote sensing images based on multilayer feature fusion and improved nonmaximal suppression algorithm. Remote Sens. 2019, 11, 1062. [Google Scholar] [CrossRef] [Green Version]
- Etten, A.V. You only look twice: Rapid multi-scale object detection in satellite imagery. arXiv 2018, arXiv:1805.09512. [Google Scholar]
- Han, X.; Zhong, Y.; Zhang, L. An efficient and robust integrated geospatial object detection framework for high spatial resolution remote sensing imagery. Remote Sens. 2017, 9, 666. [Google Scholar] [CrossRef] [Green Version]
- Ren, S.; He, K.; Girshick, R.; Sun, J. Faster R-CNN: Towards real-time object detection with region proposal networks. IEEE Trans. Pattern Anal. Mach. Intell. 2017, 39, 1137–1149. [Google Scholar] [CrossRef] [Green Version]
- Redmon, J.; Divvala, S.; Girshick, R.; Farhadi, A. You only look once: Unified, real-time object detection. In Proceedings of the 2016 IEEE Conference on Computer Vision and Pattern Recognition (CVPR), Las Vegas, NV, USA, 27–30 June 2016; IEEE: New York, NY, USA, 2016; pp. 779–788, ISBN 978-1-4673-8851-1. [Google Scholar]
- Redmon, J.; Farhadi, A. YOLO9000: Better, faster, stronger. In Proceedings of the 2017 IEEE Conference on Computer Vision and Pattern Recognition (CVPR), Honolulu, HI, USA, 21–26 July 2017; IEEE: New York, NY, USA, 2017; pp. 6517–6525, ISBN 978-1-5386-0457-1. [Google Scholar]
- Redmon, J.; Farhadi, A. YOLOv3: An incremental improvement. arXiv 2018, arXiv:1804.02767. [Google Scholar]
- Liu, W.; Anguelov, D.; Erhan, D.; Szegedy, C.; Reed, S.; Fu, C.-Y.; Berg, A.C. SSD: Single shot multibox detector. Computer Vision – ECCV 2016, Amsterdam, The Netherlands, 8–16 October 2016; Leibe, B., Matas, J., Sebe, N., Welling, M., Eds.; Springer: Cham, Switzerland, 2016; pp. 21–37. ISBN 978-3-319-46447-3. [Google Scholar]
- Zheng, Q.; Zeming, L.; Zhaoning, Z.; Yiping, B.; Gang, Y.; Yuxing, P.; Jian, S. ThunderNet: Towards real-time generic object detection. arXiv 2019, arXiv:1903.11752. [Google Scholar]
- Cheng, G.; Zhou, P.; Han, J. Learning rotation-invariant convolutional neural networks for object detection in VHR optical remote sensing images. IEEE Trans. Geosci. Remote Sens. 2016, 54, 7405–7415. [Google Scholar] [CrossRef]
- Li, L.; Zhang, S.; Wu, J. Efficient object detection framework and hardware architecture for remote sensing images. Remote Sens. 2019, 11, 2376. [Google Scholar] [CrossRef] [Green Version]
- Cheng, G.; Han, J.; Zhou, P.; Guo, L. Multi-class geospatial object detection and geographic image classification based on collection of part detectors. ISPRS J. Photogramm. Remote Sens. 2014, 98, 119–132. [Google Scholar] [CrossRef]
- Li, K.; Wan, G.; Cheng, G.; Meng, L.; Han, J. Object detection in optical remote sensing images: A survey and a new benchmark. ISPRS J. Photogramm. Remote Sens. 2020, 159, 296–307. [Google Scholar] [CrossRef]
- Chaudhuri, D.; Kushwaha, N.; Samal, A. Semi-automated road detection from high resolution satellite images by directional morphological enhancement and segmentation techniques. IEEE J. Sel. Top. Appl. Earth Obs. Remote Sens. 2012, 5, 1538–1544. [Google Scholar] [CrossRef]
- Kim, T.; Park, S.-R.; Kim, M.-G.; Jeong, S.; Kim, K.-O. Tracking road centerlines from high resolution remote sensing images by least squares correlation matching. Photogramm. Eng. Remote Sens. 2004, 70, 1417–1422. [Google Scholar] [CrossRef]
- McKeown, D.M., Jr.; Denlinger, J.L. Cooperative methods for road tracking in aerial imagery. In Proceedings of the Computer Society Conference on Computer Vision and Pattern Recognition, Ann Arbor, MI, USA, 5–9 June 1988; pp. 662–672, ISBN 0-8186-0862-5. [Google Scholar]
- Zhang, J.; Lin, X.; Liu, Z.; Shen, J. Semi-automatic road tracking by template matching and distance transformation in urban areas. Int. J. Remote Sens. 2011, 32, 8331–8347. [Google Scholar] [CrossRef]
- Zhou, J.; Bischof, W.F.; Caelli, T. Road tracking in aerial images based on human-computer interaction and Bayesian filtering. ISPRS J. Photogramm. Remote Sens. 2006, 61, 108–124. [Google Scholar] [CrossRef] [Green Version]
- Baltsavias, E.P. Object extraction and revision by image analysis using existing geodata and knowledge: Current status and steps towards operational systems. ISPRS J. Photogramm. Remote Sens. 2004, 58, 129–151. [Google Scholar] [CrossRef]
- Huertas, A.; Nevatia, R. Detecting buildings in aerial images. Comput. Vis. Graph. Image Process. 1988, 41, 131–152. [Google Scholar] [CrossRef]
- Leninisha, S.; Vani, K. Water flow based geometric active deformable model for road network. ISPRS J. Photogramm. Remote Sens. 2015, 102, 140–147. [Google Scholar] [CrossRef]
- McGlone, J.C.; Shufelt, J.A. Projective and object space geometry for monocular building extraction. In Proceedings of the 1994 IEEE Conference on Computer Vision and Pattern Recognition, Seattle, WA, USA, 21–23 June 1994; pp. 54–61. [Google Scholar]
- Weidner, U.; Förstner, W. Towards automatic building extraction from high-resolution digital elevation models. ISPRS J. Photogramm. Remote Sens. 1995, 50, 38–49. [Google Scholar] [CrossRef]
- Blaschke, T. Object based image analysis for remote sensing. ISPRS J. Photogramm. Remote Sens. 2010, 65, 2–16. [Google Scholar] [CrossRef] [Green Version]
- Blaschke, T.; Hay, G.J.; Kelly, M.; Lang, S.; Hofmann, P.; Addink, E.; Queiroz Feitosa, R.; van der Meer, F.; van der Werff, H.; van Coillie, F.; et al. Geographic object-based image analysis—Towards a new paradigm. ISPRS J. Photogramm. Remote Sens. 2014, 87, 180–191. [Google Scholar] [CrossRef] [Green Version]
- Feizizadeh, B.; Tiede, D.; Rezaei Moghaddam, M.H.; Blaschke, T. Systematic evaluation of fuzzy operators for object-based landslide mapping. South East. Eur. J. Earth Obs. Geomat. 2014, 3, 219–222. [Google Scholar]
- Li, X.; Cheng, X.; Chen, W.; Chen, G.; Liu, S. Identification of forested landslides using LiDar data, object-based image analysis, and machine learning algorithms. Remote Sens. 2015, 7, 9705–9726. [Google Scholar] [CrossRef] [Green Version]
- Martha, T.; Kerle, N.; Westen, C.J.; Jetten, V.G.; vinod Kumar, K. Segment optimization and data-driven thresholding for knowledge-based landslide detection by object-based image analysis. IEEE Trans. Geosci. Remote Sens. 2011, 49, 4928–4943. [Google Scholar] [CrossRef]
- Martha, T.R.; Kerle, N.; Jetten, V.; van Westen, C.J.; Kumar, K.V. Characterising spectral, spatial and morphometric properties of landslides for semi-automatic detection using object-oriented methods. Geomorphology 2010, 116, 24–36. [Google Scholar] [CrossRef]
- Martha, T.R.; Kerle, N.; van Westen, C.J.; Jetten, V.; Vinod Kumar, K. Object-oriented analysis of multi-temporal panchromatic images for creation of historical landslide inventories. ISPRS J. Photogramm. Remote Sens. 2012, 67, 105–119. [Google Scholar] [CrossRef]
- Baker, B.A.; Warner, T.A.; Conley, J.F.; McNeil, B.E. Does spatial resolution matter? A multi-scale comparison of object-based and pixel-based methods for detecting change associated with gas well drilling operations. Int. J. Remote Sens. 2013, 34, 1633–1651. [Google Scholar] [CrossRef]
- Benz, U.C.; Hofmann, P.; Willhauck, G.; Lingenfelder, I.; Heynen, M. Multi-resolution, object-oriented fuzzy analysis of remote sensing data for GIS-ready information. ISPRS J. Photogramm. Remote Sens. 2004, 58, 239–258. [Google Scholar] [CrossRef]
- Dalal, N.; Triggs, B. Histograms of oriented gradients for human detection. In Proceedings of the 2005 IEEE Computer Society Conference on Computer Vision and Pattern Recognition (CVPR’05), San Diego, CA, USA, 20–26 June 2005; IEEE: New York, NY, USA, 2005; pp. 886–893, ISBN 0-7695-2372-2. [Google Scholar]
- Li, F.-F.; Perona, P. A Bayesian hierarchical model for learning natural scene categories. In Proceedings of the 2005 IEEE Computer Society Conference on Computer Vision and Pattern Recognition (CVPR’05), San Diego, CA, USA, 20–26 June 2005; IEEE: New York, NY, USA, 2005; pp. 524–531, ISBN 0-7695-2372-2. [Google Scholar]
- Ojala, T.; Pietikainen, M.; Maenpaa, T. Multiresolution gray-scale and rotation invariant texture classification with local binary patterns. IEEE Trans. Pattern Anal. Mach. Intell. 2002, 24, 971–987. [Google Scholar] [CrossRef]
- Viola, P.; Jones, M. Rapid object detection using a boosted cascade of simple features. In Proceedings of the 2001 IEEE Computer Society Conference on Computer Vision and Pattern Recognition (CVPR), Kauai, HI, USA, 8–14 December 2001; IEEE Computer Society: New York, NY, USA, 2001; pp. I-511–I-518, ISBN 0-7695-1272-0. [Google Scholar]
- Mountrakis, G.; Im, J.; Ogole, C. Support vector machines in remote sensing: A review. ISPRS J. Photogramm. Remote Sens. 2011, 66, 247–259. [Google Scholar] [CrossRef]
- Schapire, R. Boosting a weak learning by maiority. INFORMS J. Comput. 1996, 121, 256–285. [Google Scholar]
- Cover, T.M.; Hart, P.E. Nearest neighbor pattern classification. IEEE Trans. Inf. Theory 1967, 13, 21–27. [Google Scholar] [CrossRef]
- Liu, L.; Shi, Z. Airplane detection based on rotation invariant and sparse coding in remote sensing images. Opt. Int. J. Light Electron Opt. 2014, 125, 5327–5333. [Google Scholar] [CrossRef]
- Zhang, W.; Sun, X.; Wang, H.; Fu, K. A generic discriminative part-based model for geospatial object detection in optical remote sensing images. ISPRS J. Photogramm. Remote Sens. 2014, 99, 30–44. [Google Scholar] [CrossRef]
- Corbane, C.; Najman, L.; Pecoul, E.; Demagistri, L.; Petit, M. A complete processing chain for ship detection using optical satellite imagery. Int. J. Remote Sens. 2010, 31, 5837–5854. [Google Scholar] [CrossRef]
- Bi, F.; Zhu, B.; Gao, L.; Bian, M. A visual search inspired computational model for ship detection in optical satellite images. IEEE Geosci. Remote Sens. Lett. 2012, 9, 749–753. [Google Scholar] [CrossRef]
- Jin, X.; Davis, C.H. Vehicle detection from high-resolution satellite imagery using morphological shared-weight neural networks. Image Vis. Comput. 2007, 25, 1422–1431. [Google Scholar] [CrossRef]
- Eikvil, L.; Aurdal, L.; Koren, H. Classification-based vehicle detection in high-resolution satellite images. ISPRS J. Photogramm. Remote Sens. 2009, 64, 65–72. [Google Scholar] [CrossRef]
- Aytekin, Ö.; Zongur, U.; Halici, U. Texture-based airport runway detection. IEEE Geosci. Remote Sens. Lett. 2013, 10, 471–475. [Google Scholar] [CrossRef]
- Girshick, R.; Donahue, J.; Darrell, T.; Malik, J. Rich feature hierarchies for accurate object detection and semantic segmentation. In Proceedings of the 2014 IEEE Conference on Computer Vision and Pattern Recognition, Columbus, OH, USA, 23–28 June 2014; IEEE: New York, NY, USA, 2014; pp. 580–587, ISBN 978-1-4799-5118-5. [Google Scholar]
- Girshick, R. Fast R-CNN. In Proceedings of the 2015 IEEE International Conference on Computer Vision (ICCV), Santiago, Chile, 7–13 December 2015; IEEE: New York, NY, USA, 2015; pp. 1440–1448, ISBN 978-1-4673-8391-2. [Google Scholar]
- Bochkovskiy, A.; Wang, C.Y.; Liao, H.Y. YOLOv4: Optimal speed and accuracy of object detection. arXiv 2020, arXiv:2004.10934. [Google Scholar]
- Fu, C.Y.; Liu, W.; Ranga, A.; Tyagi, A.; Berg, A.C. DSSD deconvolutional single shot detector. arXiv 2017, arXiv:1701.06659. [Google Scholar]
- Qin, Z.; Li, Z.; Zhang, Z.; Bao, Y.; Yu, G.; Peng, Y.; Sun, J. ThunderNet: Towards real-time generic object detection on mobile devices. In Proceedings of the 2019 IEEE/CVF International Conference on Computer Vision (ICCV), Seoul, Korea, 27 October–2 November 2019; IEEE: New York, NY, USA, 2019; pp. 6717–6726, ISBN 978-1-7281-4803-8. [Google Scholar]
- Howard, A.G.; Zhu, M.; Chen, B.; Kalenichenko, D.; Wang, W.; Weyand, T.; Andreetto, M.; Adam, H. MobileNets: Efficient convolutional neural networks for mobile vision applications. arXiv 2017, arXiv:1704.04861. [Google Scholar]
- Sandler, M.; Howard, A.; Zhu, M.; Zhmoginov, A.; Chen, L.-C. MobileNetV2: Inverted residuals and linear bottlenecks. In Proceedings of the 2018 IEEE/CVF Conference on Computer Vision and Pattern Recognition, Salt Lake City, UT, USA, 18–23 June 2018; IEEE: New York, NY, USA, 2018; pp. 4510–4520, ISBN 978-1-5386-6420-9. [Google Scholar]
- Ma, N.; Zhang, X.; Zheng, H.T.; Sun, J. ShuffleNet V2: Practical guidelines for efficient CNN architecture design. arXiv 2018, arXiv:1807.11164. [Google Scholar]
- Zhang, X.; Zhou, X.; Lin, M.; Sun, J. ShuffleNet: An extremely efficient convolutional neural network for mobile devices. In Proceedings of the 2018 IEEE/CVF Conference on Computer Vision and Pattern Recognition, Salt Lake City, UT, USA, 18–23 June 2018; IEEE: New York, NY, USA, 2018; pp. 6848–6856, ISBN 978-1-5386-6420-9. [Google Scholar]
- Chollet, F. Xception: Deep learning with depthwise separable convolutions. In Proceedings of the 2017 IEEE Conference on Computer Vision and Pattern Recognition (CVPR), Honolulu, HI, USA, 21–26 July 2017; IEEE: New York, NY, USA, 2017; pp. 1800–1807, ISBN 978-1-5386-0457-1. [Google Scholar]
- Li, Z.; Peng, C.; Yu, G.; Zhang, X.; Deng, Y.D.; Sun, J. Light-head R-CNN: In defense of two-stage object detector. arXiv 2017, arXiv:1711.07264. [Google Scholar]
- Long, Y.; Gong, Y.; Xiao, Z.; Liu, Q. Accurate object localization in remote sensing images based on convolutional neural networks. IEEE Trans. Geosci. Remote Sens. 2017, 55, 2486–2498. [Google Scholar] [CrossRef]
- Salberg, A.-B. Detection of seals in remote sensing images using features extracted from deep convolutional neural networks. In Proceedings of the 2015 IEEE International Geoscience and Remote Sens. Symposium (IGARSS), Milan, Italy, 26–31 July 2015; IEEE: New York, NY, USA, 2015; pp. 1893–1896, ISBN 978-1-4799-7929-5. [Google Scholar]
- Sevo, I.; Avramovic, A. Convolutional neural network based automatic object detection on aerial images. IEEE Geosci. Remote Sens. Lett. 2016, 13, 740–744. [Google Scholar] [CrossRef]
- Deng, Z.; Sun, H.; Zhou, S.; Zhao, J.; Zou, H. Toward fast and accurate vehicle detection in aerial images using coupled region-based convolutional neural networks. IEEE J. Sel. Top. Appl. Earth Obs. Remote Sens. 2017, 10, 3652–3664. [Google Scholar] [CrossRef]
- Cheng, G.; Han, J.; Zhou, P.; Xu, D. Learning rotation-invariant and fisher discriminative convolutional neural networks for object detection. IEEE Trans. Image Process. 2019, 28, 265–278. [Google Scholar] [CrossRef] [PubMed]
- Li, K.; Cheng, G.; Bu, S.; You, X. Rotation-insensitive and context-augmented object detection in remote sensing images. IEEE Trans. Geosci. Remote Sens. 2018, 56, 2337–2348. [Google Scholar] [CrossRef]
- Tang, T.; Zhou, S.L.; Deng, Z.P.; Lei, L.; Zou, H.X. Arbitrary-oriented vehicle detection in aerial imagery with single convolutional neural networks. Remote Sens. 2017, 9, 1170. [Google Scholar] [CrossRef] [Green Version]
- Liu, L.; Pan, Z.; Lei, B. Learning a rotation invariant detector with rotatable bounding box. arXiv 2017, arXiv:1711.09405. [Google Scholar]
- Liu, W.; Ma, L.; Chen, H. Arbitrary-oriented ship detection framework in optical remote-sensing images. IEEE Geosci. Remote Sens. Lett. 2018, 15, 937–941. [Google Scholar] [CrossRef]
- Zhuang, S.; Wang, P.; Jiang, B.; Wang, G.; Wang, C. A single shot framework with multi-scale feature fusion for geospatial object detection. Remote Sens. 2019, 11, 594. [Google Scholar] [CrossRef] [Green Version]
- Xie, W.; Qin, H.; Li, Y.; Wang, Z.; Lei, J. A novel effectively optimized one-stage network for object detection in remote sensing imagery. Remote Sens. 2019, 11, 1376. [Google Scholar] [CrossRef] [Green Version]
- Chen, L.-C.; Zhu, Y.; Papandreou, G.; Schroff, F.; Adam, H. Encoder-Decoder with Atrous Separable Convolution for Semantic Image Segmentation. In Computer Vision—ECCV 2018; Ferrari, V., Hebert, M., Sminchisescu, C., Weiss, Y., Eds.; Springer: Cham, Switzerland, 2018; pp. 833–851. ISBN 978-3-030-01233-5. [Google Scholar]
- Lin, T.; Dollar, P.; Girshick, R.; He, K.; Hariharan, B.; Belongie, S. Feature pyramid networks for object detection. In Proceedings of the IEEE Conference on Computer Vision and Pattern Recognition (CVPR), Honolulu, HI, USA, 21–26 July 2017; pp. 2117–2125. [Google Scholar]
- Ghassemi, S.; Fiandrotti, A.; Francini, G.; Magli, E. Learning and adapting robust features for satellite image segmentation on heterogeneous data sets. IEEE Trans. Geosci. Remote Sens. 2019, 57, 6517–6529. [Google Scholar] [CrossRef]
- Cheng, G.; Zhou, P.; Han, J. RIFD-CNN: Rotation-invariant and fisher discriminative convolutional neural networks for object detection. In Proceedings of the 2016 IEEE Conference on Computer Vision and Pattern Recognition (CVPR), Las Vegas, NV, USA, 27–30 June 2016; IEEE: New York, NY, USA, 2016; pp. 2884–2893, ISBN 978-1-4673-8851-1. [Google Scholar]
- He, K.; Gkioxari, G.; Dollar, P.; Girshick, R. Mask R-CNN. In Proceedings of the 2017 IEEE International Conference on Computer Vision (ICCV), Venice, Italy, 22–29 October 2017; IEEE: New York, NY, USA, 2017; pp. 2980–2988, ISBN 978-1-5386-1032-9. [Google Scholar]
- Liu, S.; Qi, L.; Qin, H.; Shi, J.; Jia, J. Path aggregation network for instance segmentation. In Proceedings of the 2018 IEEE/CVF Conference on Computer Vision and Pattern Recognition, Salt Lake City, UT, USA, 18–23 June 2018; IEEE: New York, NY, USA, 2018; pp. 8759–8768, ISBN 978-1-5386-6420-9. [Google Scholar]
- Lin, T.-Y.; Goyal, P.; Girshick, R.; He, K.; Dollar, P. Focal loss for dense object detection. IEEE Trans. Pattern Anal. Mach. Intell. 2020, 42, 318–327. [Google Scholar] [CrossRef] [PubMed] [Green Version]
- Law, H.; Deng, J. CornerNet: Detecting objects as paired keypoints. In Computer Vision—ECCV 2018; Ferrari, V., Hebert, M., Sminchisescu, C., Weiss, Y., Eds.; Springer: Cham, Switzerland, 2018; pp. 765–781. ISBN 978-3-030-01263-2. [Google Scholar]
Figure 1.
Onboard detection process. First, capture images by an onboard camera. Second, split large size image into small chips. Third, feature extraction. Fourth, location regression and classification. Fifth, get detection results.
Figure 1.
Onboard detection process. First, capture images by an onboard camera. Second, split large size image into small chips. Third, feature extraction. Fourth, location regression and classification. Fifth, get detection results.

Figure 2.
The overall structure of the proposed multi-scale feature detector (MSF-SNET) algorithm framework with six detectors, named (prediction module A) PMA, PMB, PMC, PMD, PME, and PMF. Each component consists of this framework will be described in detail in Section 3.1.2.
Figure 2.
The overall structure of the proposed multi-scale feature detector (MSF-SNET) algorithm framework with six detectors, named (prediction module A) PMA, PMB, PMC, PMD, PME, and PMF. Each component consists of this framework will be described in detail in Section 3.1.2.

Figure 3.
Building blocks of MSF-SNET. (a) SDU: spatial downsampling (2x) unit; (b) BU: basic building unit.
Figure 3.
Building blocks of MSF-SNET. (a) SDU: spatial downsampling (2x) unit; (b) BU: basic building unit.

Figure 4.
Feature fusion method. The deeper fused feature was up-sampled and concatenate with the upper feature. The fusion feature is generated by shuffling the concatenated feature and convoluted with a 3 × 3 convolution kernel.
Figure 4.
Feature fusion method. The deeper fused feature was up-sampled and concatenate with the upper feature. The fusion feature is generated by shuffling the concatenated feature and convoluted with a 3 × 3 convolution kernel.

Figure 5.
Prediction module. This module was proved to be an efficient prediction module and was used as the detection part in DSSD. The outputs of this module in DSSD are the probability of classes and location information, while the confidence information is added in the proposed framework.
Figure 5.
Prediction module. This module was proved to be an efficient prediction module and was used as the detection part in DSSD. The outputs of this module in DSSD are the probability of classes and location information, while the confidence information is added in the proposed framework.

Figure 6.
Object detection examples on NWPU-VHR-10 dataset. (a) Airplane; (b)ship; (c) storage tank; (d) baseball diamond; (e) tennis court; (f) basketball court; (g) ground track field; (h) harbor; (i) bridge and(j) vehicle.
Figure 6.
Object detection examples on NWPU-VHR-10 dataset. (a) Airplane; (b)ship; (c) storage tank; (d) baseball diamond; (e) tennis court; (f) basketball court; (g) ground track field; (h) harbor; (i) bridge and(j) vehicle.


Figure 7.
The precision recall curves of the proposed algorithm. (a) Airplane; (b) ship; (c) storage tank; (d) baseball diamond; (e) tennis court; (f) basketball court; (g) ground track field; (h) harbor; (i) bridge and (j) vehicle.
Figure 7.
The precision recall curves of the proposed algorithm. (a) Airplane; (b) ship; (c) storage tank; (d) baseball diamond; (e) tennis court; (f) basketball court; (g) ground track field; (h) harbor; (i) bridge and (j) vehicle.


Table 1.
The architecture of the MSF-SNET backbone networks. SNet was used as a basic framework but replaces all 5 × 5 depthwise convolutions with 3 × 3 separable atrous convolutions (dilated rate = 2). SAC in the table stands for separable atrous convolution. The number after close bracket means this module will be repeated the number times. For example, SAC3 × 3, [128, s1] × 3 in stage 2, 3 after close bracket means this module will be repeated 3 times.
| Stage | Output Size | Layer |
|---|---|---|
| input | 256 × 256 | image |
| Conv1 | 128 × 128 × 24 | 3 × 3.24, s2 |
| Pool | 64 × 64 × 24 | 3 × 3 maxpool, s2 |
| Stage2 | 32 × 32 × 128 32 × 32 × 128 | SAC3 × 3, [128, s2] SAC3 × 3, [128, s1] × 3 |
| Stage3 | 16 × 16 × 256 16 × 16 × 256 | SAC3 × 3, [256, s2] SAC3 × 3, [256, s1] × 7 |
| Stage4 | 8 × 8 × 512 8 × 8 × 512 | SAC3 × 3, [512, s2] SAC3 × 3, [512, s1] × 3 |
| Conv5 | 4 × 4 × 128 4 × 4 × 256 | conv1 × 1 × 128 conv3 × 3 × 256 |
| Conv6 | 2 × 2 × 128 2 × 2 × 256 | Conv1 × 1 × 128 Conv3 × 3 × 256 |
| Conv7 | 1 × 1 × 128 1 × 1 × 256 | Conv1 × 1 × 128 Conv3 × 3 × 256 |
Table 2.
Parameters and computing cost for MSF-SNET.
| Algorithms | Input Size | Parameters | Flops |
|---|---|---|---|
| ThunderNet | 224 × 224 | 1.58 M | 168.65 M |
| 256 × 256 | 220.12 M | ||
| 320 × 320 | 343.64 M | ||
| MSF-SNET | 224 × 224 | 1.54 M | 160.28 M |
| 256 × 256 | 209.18 M | ||
| 320 × 320 | 326.55 M |
Table 3.
Performance comparison of different algorithms on NWPU-VHR-10 dataset.
| RICNN | R-P-Faster R-CNN | NEOON | Thundernet | CBFF-SSD | MSF-SNET | |
|---|---|---|---|---|---|---|
| Airplane | 88.4% | 90.4% | 78.29% | 86.06% | 96.93% | 93.53% |
| Ship | 77.3% | 75.0% | 81.68% | 85.04% | 94.26% | 92.18% |
| Storage tank | 85.3% | 44.4% | 94.62% | 47.28% | 80.95% | 58.77% |
| Baseball diamond | 88.1% | 89.9% | 89.74% | 89.57% | 99.09% | 97.93% |
| Tennis court | 40.8% | 79.7% | 61.25% | 51.32% | 91.50% | 65.06% |
| Basketball court | 58.5% | 77.6% | 65.04% | 68.31% | 92.64% | 79.46% |
| Ground track field | 86.7% | 87.7% | 93.23% | 86.81% | 98.82% | 94.68% |
| Harbor | 68.6% | 79.1% | 73.15% | 60.35% | 91.59% | 75.55% |
| Bridge | 61.5% | 68.2% | 59.46% | 86.25% | 89.68% | 91.43% |
| Vehicle | 71.1% | 73.2% | 78.26% | 63.80% | 78.78% | 75.46% |
| Mean AP | 72.6% | 76.5% | 77.47% | 72.48% | 91.42% | 82.40% |
Table 4.
Cost comparison of different algorithms.
| CBFF-SSD | Thundernet | MSF-SNET | |
|---|---|---|---|
| Parameters (M) | 14.74 | 1.58 | 1.54 |
| Computing Cost (GFlops) | 5.51 | 0.344 | 0.21 |
| mAP (%) | 91.42 | 77.78 | 82.42 |
| Cost Density | 88.83 | 0.69 | 0.39 |
Table 5.
Detection AP (%) comparison of different algorithms on DIOR dataset (C1–C10).
| Backbone | C1 | C2 | C3 | C4 | C5 | C6 | C7 | C8 | C9 | C10 | |
|---|---|---|---|---|---|---|---|---|---|---|---|
| R-CNN | VGG16 | 35.6 | 43.0 | 53.8 | 62.3 | 15.6 | 53.7 | 33.7 | 50.2 | 33.5 | 50.1 |
| RICNN | VGG16 | 39.1 | 61.0 | 60.1 | 66.3 | 25.3 | 63.3 | 41.1 | 51.7 | 36.6 | 55.9 |
| RICAOD | VGG16 | 42.2 | 69.7 | 62.0 | 79.0 | 27.7 | 68.9 | 50.1 | 60.5 | 49.3 | 64.4 |
| RIFD-CNN | VGG16 | 56.6 | 53.2 | 79.9 | 69.0 | 29.0 | 71.5 | 63.1 | 69.0 | 56.0 | 68.9 |
| FRCNN | VGG16 | 53.6 | 49.3 | 78.8 | 66.2 | 28.0 | 70.9 | 62.3 | 69.0 | 55.2 | 68.0 |
| SSD | VGG16 | 59.5 | 72.7 | 72.4 | 75.7 | 29.7 | 65.8 | 56.6 | 63.5 | 53.1 | 65.3 |
| YOLOv3 | Darknet-53 | 72.2 | 29.2 | 74.0 | 78.6 | 31.2 | 69.7 | 26.9 | 48.6 | 54.4 | 31.1 |
| FRCNN with FPN | Resnet-50 | 54.1 | 71.4 | 63.3 | 81.0 | 42.6 | 72.5 | 57.5 | 68.7 | 62.1 | 73.1 |
| Resnet-101 | 54.0 | 74.5 | 63.3 | 80.7 | 44.8 | 72.5 | 60.0 | 75.6 | 62.3 | 76.0 | |
| MRCNN with FPN | Resnet-50 | 53.8 | 72.3 | 63.2 | 81.0 | 38.7 | 72.6 | 55.9 | 71.6 | 67.0 | 73.0 |
| Resnet-101 | 53.9 | 76.6 | 63.2 | 80.9 | 40.2 | 72.5 | 60.4 | 76.3 | 62.5 | 76.0 | |
| RetinaNet | Resnet-50 | 53.7 | 77.3 | 69.0 | 81.3 | 44.1 | 72.3 | 62.5 | 76.2 | 66.0 | 77.7 |
| Resnet-101 | 53.3 | 77.0 | 69.3 | 85.0 | 44.1 | 73.2 | 62.4 | 78.6 | 62.8 | 78.6 | |
| PANet | Resnet-50 | 61.9 | 70.4 | 71.0 | 80.4 | 38.9 | 72.5 | 56.6 | 68.4 | 60.0 | 69.0 |
| Resnet-101 | 60.2 | 72.0 | 70.6 | 80.5 | 43.6 | 72.3 | 61.4 | 72.1 | 66.7 | 72.0 | |
| CornerNet | Hourglass-104 | 58.8 | 84.2 | 72.0 | 80.8 | 46.4 | 75.3 | 64.3 | 81.6 | 76.3 | 79.5 |
| Thundernet | Snet | 90.1 | 68.8 | 90.8 | 67.4 | 38.3 | 86.8 | 59.5 | 68.6 | 61.0 | 67.3 |
| MSF-SNET | Ours | 90.3 | 76.6 | 90.9 | 69.6 | 37.5 | 88.3 | 70.6 | 70.8 | 63.6 | 69.9 |
Table 6.
Detection AP (%) comparison of different algorithms on DIOR dataset (C11–C20).
| Backbone | C11 | C12 | C13 | C14 | C15 | C16 | C17 | C18 | C19 | C20 | mAP | |
|---|---|---|---|---|---|---|---|---|---|---|---|---|
| R-CNN [50] | VGG16 | 49.3 | 39.5 | 30.9 | 9.1 | 60.8 | 18.0 | 54.0 | 36.1 | 9.1 | 16.4 | 37.7 |
| RICNN [13] | VGG16 | 58.9 | 43.5 | 39.0 | 9.1 | 61.1 | 19.1 | 63.5 | 46.1 | 11.4 | 31.5 | 44.2 |
| RICAOD [73] | VGG16 | 65.3 | 42.3 | 46.8 | 11.7 | 53.5 | 24.5 | 70.3 | 53.3 | 20.4 | 56.2 | 50.9 |
| RIFD-CNN | VGG16 | 62.4 | 51.2 | 51.1 | 31.7 | 73.6 | 41.5 | 79.5 | 40.1 | 28.5 | 46.9 | 56.1 |
| FRCNN | VGG16 | 56.9 | 50.2 | 50.1 | 27.7 | 73.0 | 39.8 | 75.2 | 38.6 | 23.6 | 45.4 | 54.1 |
| SSD | VGG16 | 68.6 | 49.4 | 48.1 | 59.2 | 61.0 | 46.6 | 76.3 | 55.1 | 27.4 | 65.7 | 58.6 |
| YOLOv3 | Dk-53 | 61.1 | 44.9 | 49.7 | 87.4 | 70.6 | 68.7 | 87.3 | 29.4 | 48.3 | 78.7 | 57.1 |
| FRCNN with FPN | Resnet-50 | 76.5 | 42.8 | 56.0 | 71.8 | 57.0 | 53.5 | 81.2 | 53.0 | 43.1 | 80.9 | 63.1 |
| Resnet-101 | 76.8 | 46.4 | 57.2 | 71.8 | 68.3 | 53.8 | 81.1 | 59.5 | 43.1 | 81.2 | 65.1 | |
| MRCNN with FPN | Resnet-50 | 75.8 | 44.2 | 56.5 | 71.9 | 58.6 | 53.6 | 81.1 | 54.0 | 43.1 | 81.1 | 63.5 |
| Resnet-101 | 75.9 | 46.5 | 57.4 | 71.8 | 68.3 | 53.7 | 81 | 62.3 | 43.0 | 81.0 | 65.2 | |
| RetinaNet | Resnet-50 | 74.2 | 50.7 | 59.6 | 71.2 | 69.3 | 44.8 | 81.3 | 54.2 | 45.1 | 83.4 | 65.7 |
| Resnet-101 | 76.6 | 49.9 | 59.6 | 71.1 | 68.4 | 45.8 | 81.3 | 55.2 | 44.4 | 85.5 | 66.1 | |
| PANet | Resnet-50 | 74.6 | 41.6 | 55.8 | 71.7 | 72.9 | 62.3 | 81.2 | 54.6 | 48.2 | 86.7 | 63.8 |
| Resnet-101 | 73.4 | 45.3 | 56.9 | 71.7 | 70.4 | 62.0 | 80.9 | 57.0 | 47.2 | 84.5 | 66.1 | |
| CornerNet | Hourglass-104 | 79.5 | 26.1 | 60.6 | 37.6 | 70.7 | 45.2 | 84.0 | 57.1 | 43.0 | 75.9 | 64.9 |
| Thundernet | Snet | 57.7 | 51.8 | 56.0 | 18.3 | 89.5 | 72.0 | 80.4 | 56.5 | 34.8 | 54.2 | 63.5 |
| MSF-SNET | Ours | 61.9 | 59.0 | 57.5 | 20.5 | 90.6 | 72.4 | 80.9 | 60.3 | 39.8 | 58.6 | 66.5 |
Table 7.
Cost comparison of different backbones.
| VGG16 | Resnet-50 | Resnet-101 | Ours | |
|---|---|---|---|---|
| Parameters (M) | 138.36 | 25.56 | 44.55 | 1.54 |
| Computing Cost (GFlops) | 15.5 | 4.12 | 7.85 | 0.21 |
| mAP (%) | 58.6 | 65.7 | 66.1 | 66.5 |
| Cost Density | 36.59 | 1.60 | 5.29 | 0.49 |
Publisher’s Note: MDPI stays neutral with regard to jurisdictional claims in published maps and institutional affiliations. |
© 2021 by the authors. Licensee MDPI, Basel, Switzerland. This article is an open access article distributed under the terms and conditions of the Creative Commons Attribution (CC BY) license (http://creativecommons.org/licenses/by/4.0/).
Share and Cite
MDPI and ACS Style
Huyan, L.; Bai, Y.; Li, Y.; Jiang, D.; Zhang, Y.; Zhou, Q.; Wei, J.; Liu, J.; Zhang, Y.; Cui, T. A Lightweight Object Detection Framework for Remote Sensing Images. Remote Sens. 2021, 13, 683. https://doi.org/10.3390/rs13040683
AMA Style
Huyan L, Bai Y, Li Y, Jiang D, Zhang Y, Zhou Q, Wei J, Liu J, Zhang Y, Cui T. A Lightweight Object Detection Framework for Remote Sensing Images. Remote Sensing. 2021; 13(4):683. https://doi.org/10.3390/rs13040683
Chicago/Turabian StyleHuyan, Lang, Yunpeng Bai, Ying Li, Dongmei Jiang, Yanning Zhang, Quan Zhou, Jiayuan Wei, Juanni Liu, Yi Zhang, and Tao Cui. 2021. "A Lightweight Object Detection Framework for Remote Sensing Images" Remote Sensing 13, no. 4: 683. https://doi.org/10.3390/rs13040683
Note that from the first issue of 2016, this journal uses article numbers instead of page numbers. See further details here.