Article

Drivers of Bornean Orangutan Distribution across a Multiple-Use Tropical Landscape

1
School of Biological Sciences, University of Aberdeen, Cruickshank Building, St Machar Drive, Aberdeen AB24 3UU, UK
2
Department of Biology, University of Ottawa, Gendron Hall, 30 Marie Curie, Ottawa, ON K1N 6N5, Canada
3
South East Asia Rainforest Research Partnership, Danum Valley Field Centre, P.O. Box 60282, Lahad Datu 91112, Sabah, Malaysia
4
Institute for Tropical Biology and Conservation, Universiti Malaysia Sabah, Jalan UMS, Kota Kinabalu 88400, Sabah, Malaysia
5
Asian School of the Environment, Nanyang Technological University, 50 Nanyang Avenue Singapore, Singapore 639798, Singapore
6
Division of Biological Sciences & Wildlife Biology Program, University of Montana, Missoula, MT 59812, USA
7
School of Biological and Environmental Sciences, Liverpool John Moores University, Exchange Station, Liverpool L2 2QP, UK
*
Author to whom correspondence should be addressed.
Remote Sens. 2021, 13(3), 458; https://doi.org/10.3390/rs13030458
Submission received: 15 December 2020 / Revised: 22 January 2021 / Accepted: 25 January 2021 / Published: 28 January 2021
(This article belongs to the Special Issue Drone-Based Ecological Conservation)

Abstract

:
Logging and conversion of tropical forests in Southeast Asia have resulted in the expansion of landscapes containing a mosaic of habitats that may vary in their ability to sustain local biodiversity. However, the complexity of these landscapes makes it difficult to assess abundance and distribution of some species using ground-based surveys alone. Here, we deployed a combination of ground-transects and aerial surveys to determine drivers of the critically endangered Bornean Orangutan (Pongo pygmaeus morio) distribution across a large multiple-use landscape in Sabah, Malaysian Borneo. Ground-transects and aerial surveys using drones were conducted for orangutan nests and hemi-epiphytic strangler fig trees (Ficus spp.) (an important food resource) in 48 survey areas across 76 km2, within a study landscape of 261 km2. Orangutan nest count data were fitted to models accounting for variation in land use, above-ground carbon density (ACD, a surrogate for forest quality), strangler fig density, and elevation (between 117 and 675 m). Orangutan nest counts were significantly higher in all land uses possessing natural forest cover, regardless of degradation status, than in monoculture plantations. Within these natural forests, nest counts increased with higher ACD and strangler fig density, but not with elevation. In logged forest (ACD 14–150 Mg ha−1), strangler fig density had a significant, positive relationship with orangutan nest counts, but this relationship disappeared in a forest with higher carbon content (ACD 150–209 Mg ha−1). Based on an area-to-area comparison, orangutan nest counts from ground transects were higher than from counts derived from aerial surveys, but this did not constitute a statistically significant difference. Although the difference in nest counts was not significantly different, this analysis indicates that both methods under-sample the total number of nests present within a given area. Aerial surveys are, therefore, a useful method for assessing the orangutan habitat use over large areas. However, the under-estimation of nest counts by both methods suggests that a small number of ground surveys should be retained in future surveys using this technique, particularly in areas with dense understory vegetation. This study shows that even highly degraded forests may be a suitable orangutan habitat as long as strangler fig trees remain intact after areas of forest are logged. Enrichment planting of strangler figs may, therefore, be a valuable tool for orangutan conservation in these landscapes.

Graphical Abstract

1. Introduction

Tropical forests are home to two-thirds of the world’s biodiversity, but are being lost or degraded due to the expansion of agriculture and logging [1]. Since 2000, the area of intact forest has been reduced by 7.2% globally, and South East-Asian forests specifically have shrunk by 13.9% [2]. As intact forest declines, species are forced to adapt to more degraded habitat conditions and to mosaics of anthropogenic land use types. Understanding how species respond to human modified forests can inform land use decisions and species-specific management strategies.
Bornean orangutans (Pongo pygmaeus morio) are critically endangered due to hunting [3,4] as well as habitat loss arising from logging and conversion of forest to industrial oil palm plantations and other forms of agriculture [3]. It is estimated that habitat destruction, fragmentation, and hunting drove a decline of approximately 100,000 Bornean orangutans between 1999 and 2015 [3] and that 78% of a Bornean orangutan range lies outside protected areas, within logging concessions and partially forested oil palm and timber plantations [5]. This suggests that the capacity of orangutans to survive in human-modified habitats and across a mosaic of land use types is critical to their future persistence.
Orangutans construct a nest in the branches of trees on an almost daily basis for resting overnight and sometimes during the day [6]. The traditional approach to surveying orangutan density is to make observations of their nests along ground-transects within discrete areas of a homogenous habitat [4,7]. However, unless multiple surveys can be conducted across a large area, information collected from ground-transects is based on orangutan activity within a narrow band of habitat, which is limited by the horizontal distance at which an observer can identify a nest under forest cover [6]. Moreover, in human-modified landscapes, the small size of forest fragments and presence of multiple land use types can result in a complex mosaic of habitats difficult to survey using a ground-transect approach.
An alternative method to overcoming the small-scale habitat complexity and large-scale sampling effort is to implement aerial surveys using helicopters or drones and to quantify the number of canopy-visible nests. Information gained from aerial surveys can capture data from a rapidly changing landscape and provides more extensive coverage at lower cost than ground-based surveys [8]. Helicopter surveys have been used to assess orangutan population densities for several years. However, helicopter flights are significantly more expensive than aerial surveys by drones and can be prohibitively expensive for small NGOs [9]. Helicopters are also in high demand and can, therefore, be difficult to secure for surveying purposes. Additionally, helicopter surveys do not generally collect precise information on nest locations, which is required for research on the fine-scale drivers of orangutan habitat choice. A comparison of these methods across a relatively small study area (5 km2) in Sumatra found that orangutan nest counts were significantly lower in aerial surveys by drone than from ground-transects [8]. The aerial survey reported by Wich et al., (2016), was conducted at 150 m above the ground level with a 12 MP camera [8], whereas a similar study of chimpanzee nest detection by the drone survey found that the nest detectability increased with image resolution [8]. Image resolution is, therefore, expected to have a strong effect on nest detection and, therefore, on the difference in nest encounter rates between aerial and ground-transects for nests. In this study, we compare nest counts from aerial surveys and ground-transects over a much larger and more complex landscape to fully understand the strengths and weaknesses of each approach to sample orangutan populations and to assess the conditions and resources associated with estimating orangutan population density.
Environmental variables known to affect orangutan nest distribution and habitat preference were mapped in order to determine the drivers of orangutan nest distribution within this landscape. It is well-known that forest quality is a strong predictor of orangutan habitat suitability [10]. Forest degradation due to logging and agricultural conversion generally results in lower food resource availability and higher energetic costs associated with dispersal [11]. However, this relationship may not be linear, as low-intensity disturbance to forests can result in higher availability of fruit-producing tree species, providing greater foraging opportunities [12,13]. Additionally, the highest recorded orangutan abundances in Borneo occur in selectively logged forests in Kalimantan and Sabah, and an old growth forest in Sarawak [3]. However, high orangutan densities in the degraded forest may also be the result of refugee crowding, as individuals flee from areas of active logging into a neighbouring intact forest [14]. The relationship between forest quality and orangutan nest density in regions with multiple land uses is, therefore, worthy of further study. In this study, above-ground carbon density (ACD) was used as a surrogate for forest quality across the study landscape, which is justified by the sensitivity of ACD to logging intensity across our study region [15].
The highest orangutan densities occur within lowland habitats, and they are generally rare or absent at elevations over 500 m [14]. This elevational decline may be driven by changes in the abundance and phenology of important food sources, such as strangler fig trees and fruit-producing lianas [16]. Strangler fig (Ficus spp.) trees are considered a keystone food resource for multiple frugivores in Bornean forests, including orangutans [17], providing a rich source of sugars, protein, carbohydrates, and calcium [18]. Bornean forests possess a distinct episodic reproductive phenology, characterised by irregular synchronous masting of canopy trees on cycles of 7–10 years [19]. Thus, it has been suggested that the carrying-capacity of orangutans in a lowland dipterocarp forest is largely dependent on the amount of fall-back food resources available outside masting events, including leaves, bark, pith, and insects [20]. Fig trees are a key component of this resource as they produce fruit asynchronously throughout the year [21]. In Sumatran upland forests and Kalimantan peat swamp forests, orangutan density is positively related to strangler fig density [22]. However, the relationship between strangler fig abundance and the distribution of orangutan nests has not been studied in Bornean forests on mineral soils, which represent the majority of orangutan habitats in Borneo.
The specific questions addressed by this study are as follows.
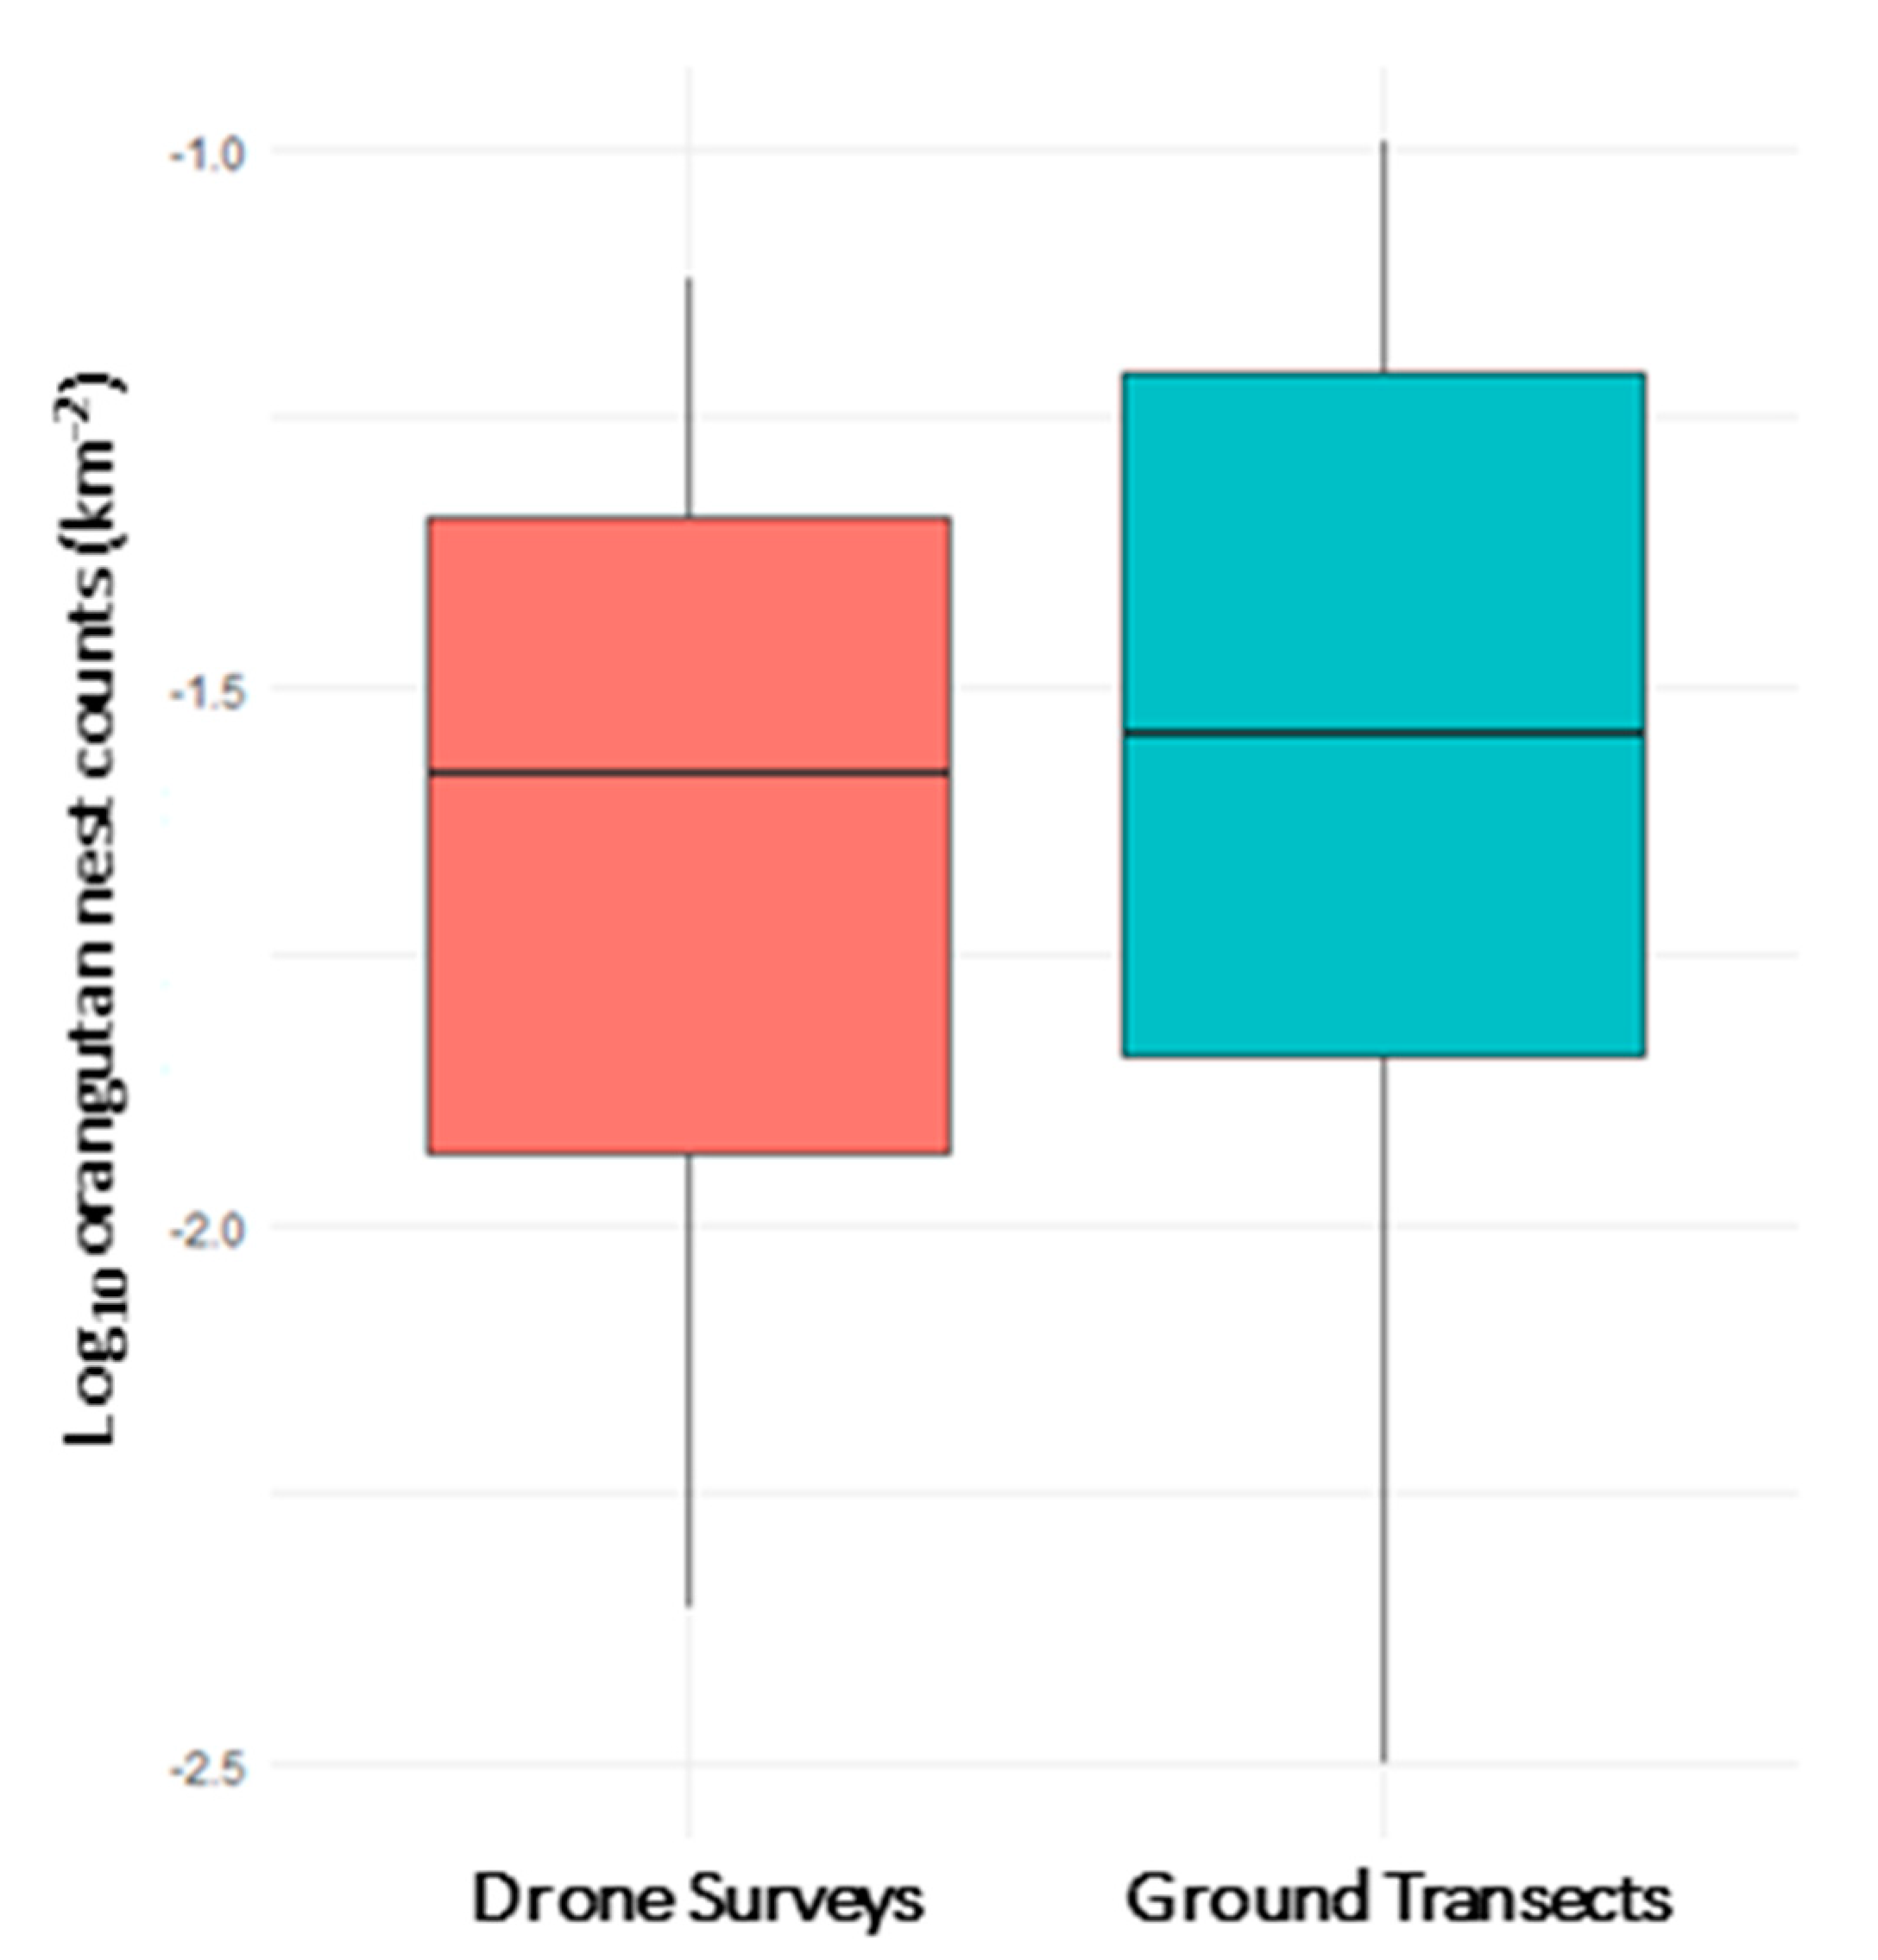
  • How do nest counts derived from aerial surveys compare to those derived from ground-transects?
  • How is orangutan nest density abundance affected by conversion of forests to alternative land uses?
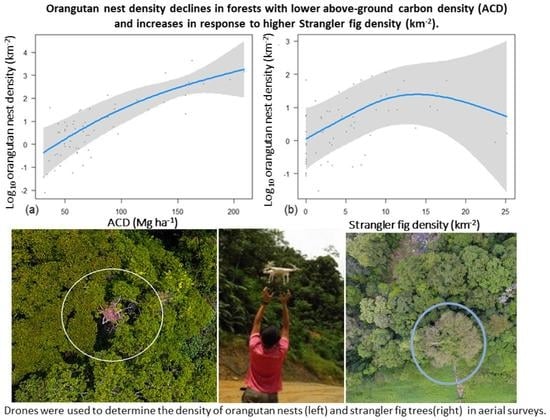
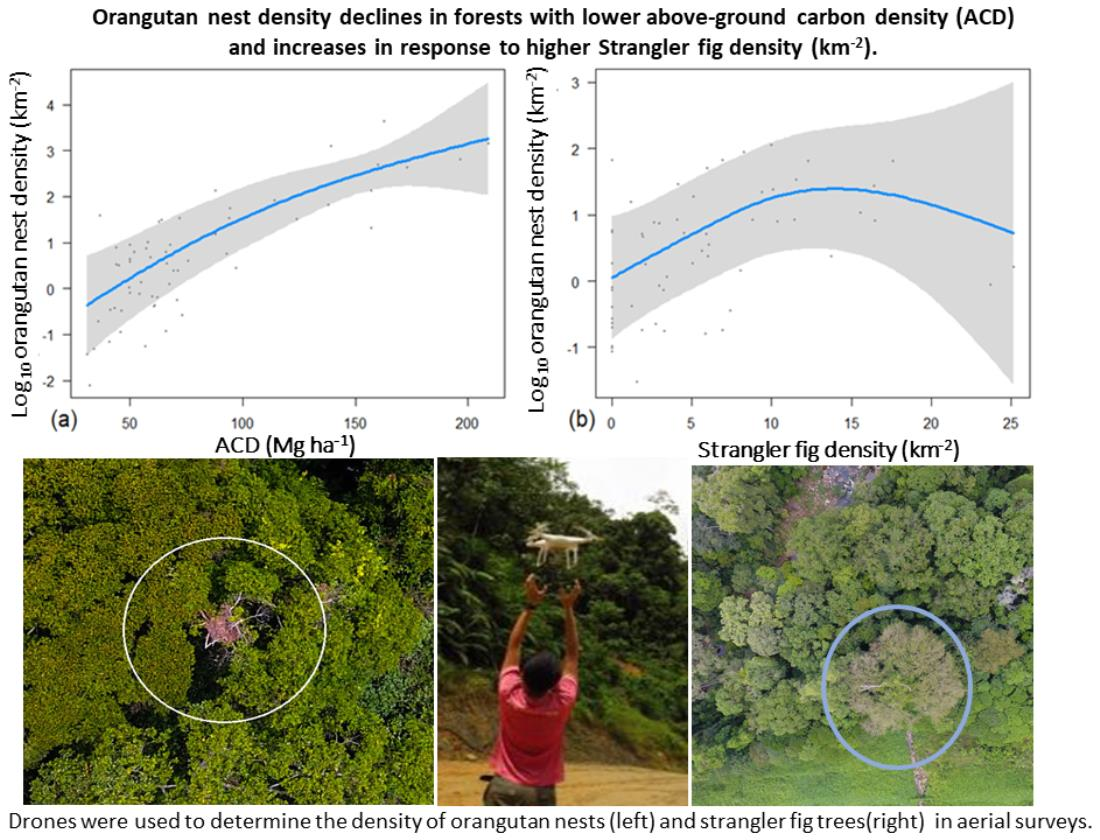
  • How does the density of orangutan nests respond to variation in forest quality, strangler fig density, and elevation within a multiple-use landscape in Borneo?

2. Materials and Methods
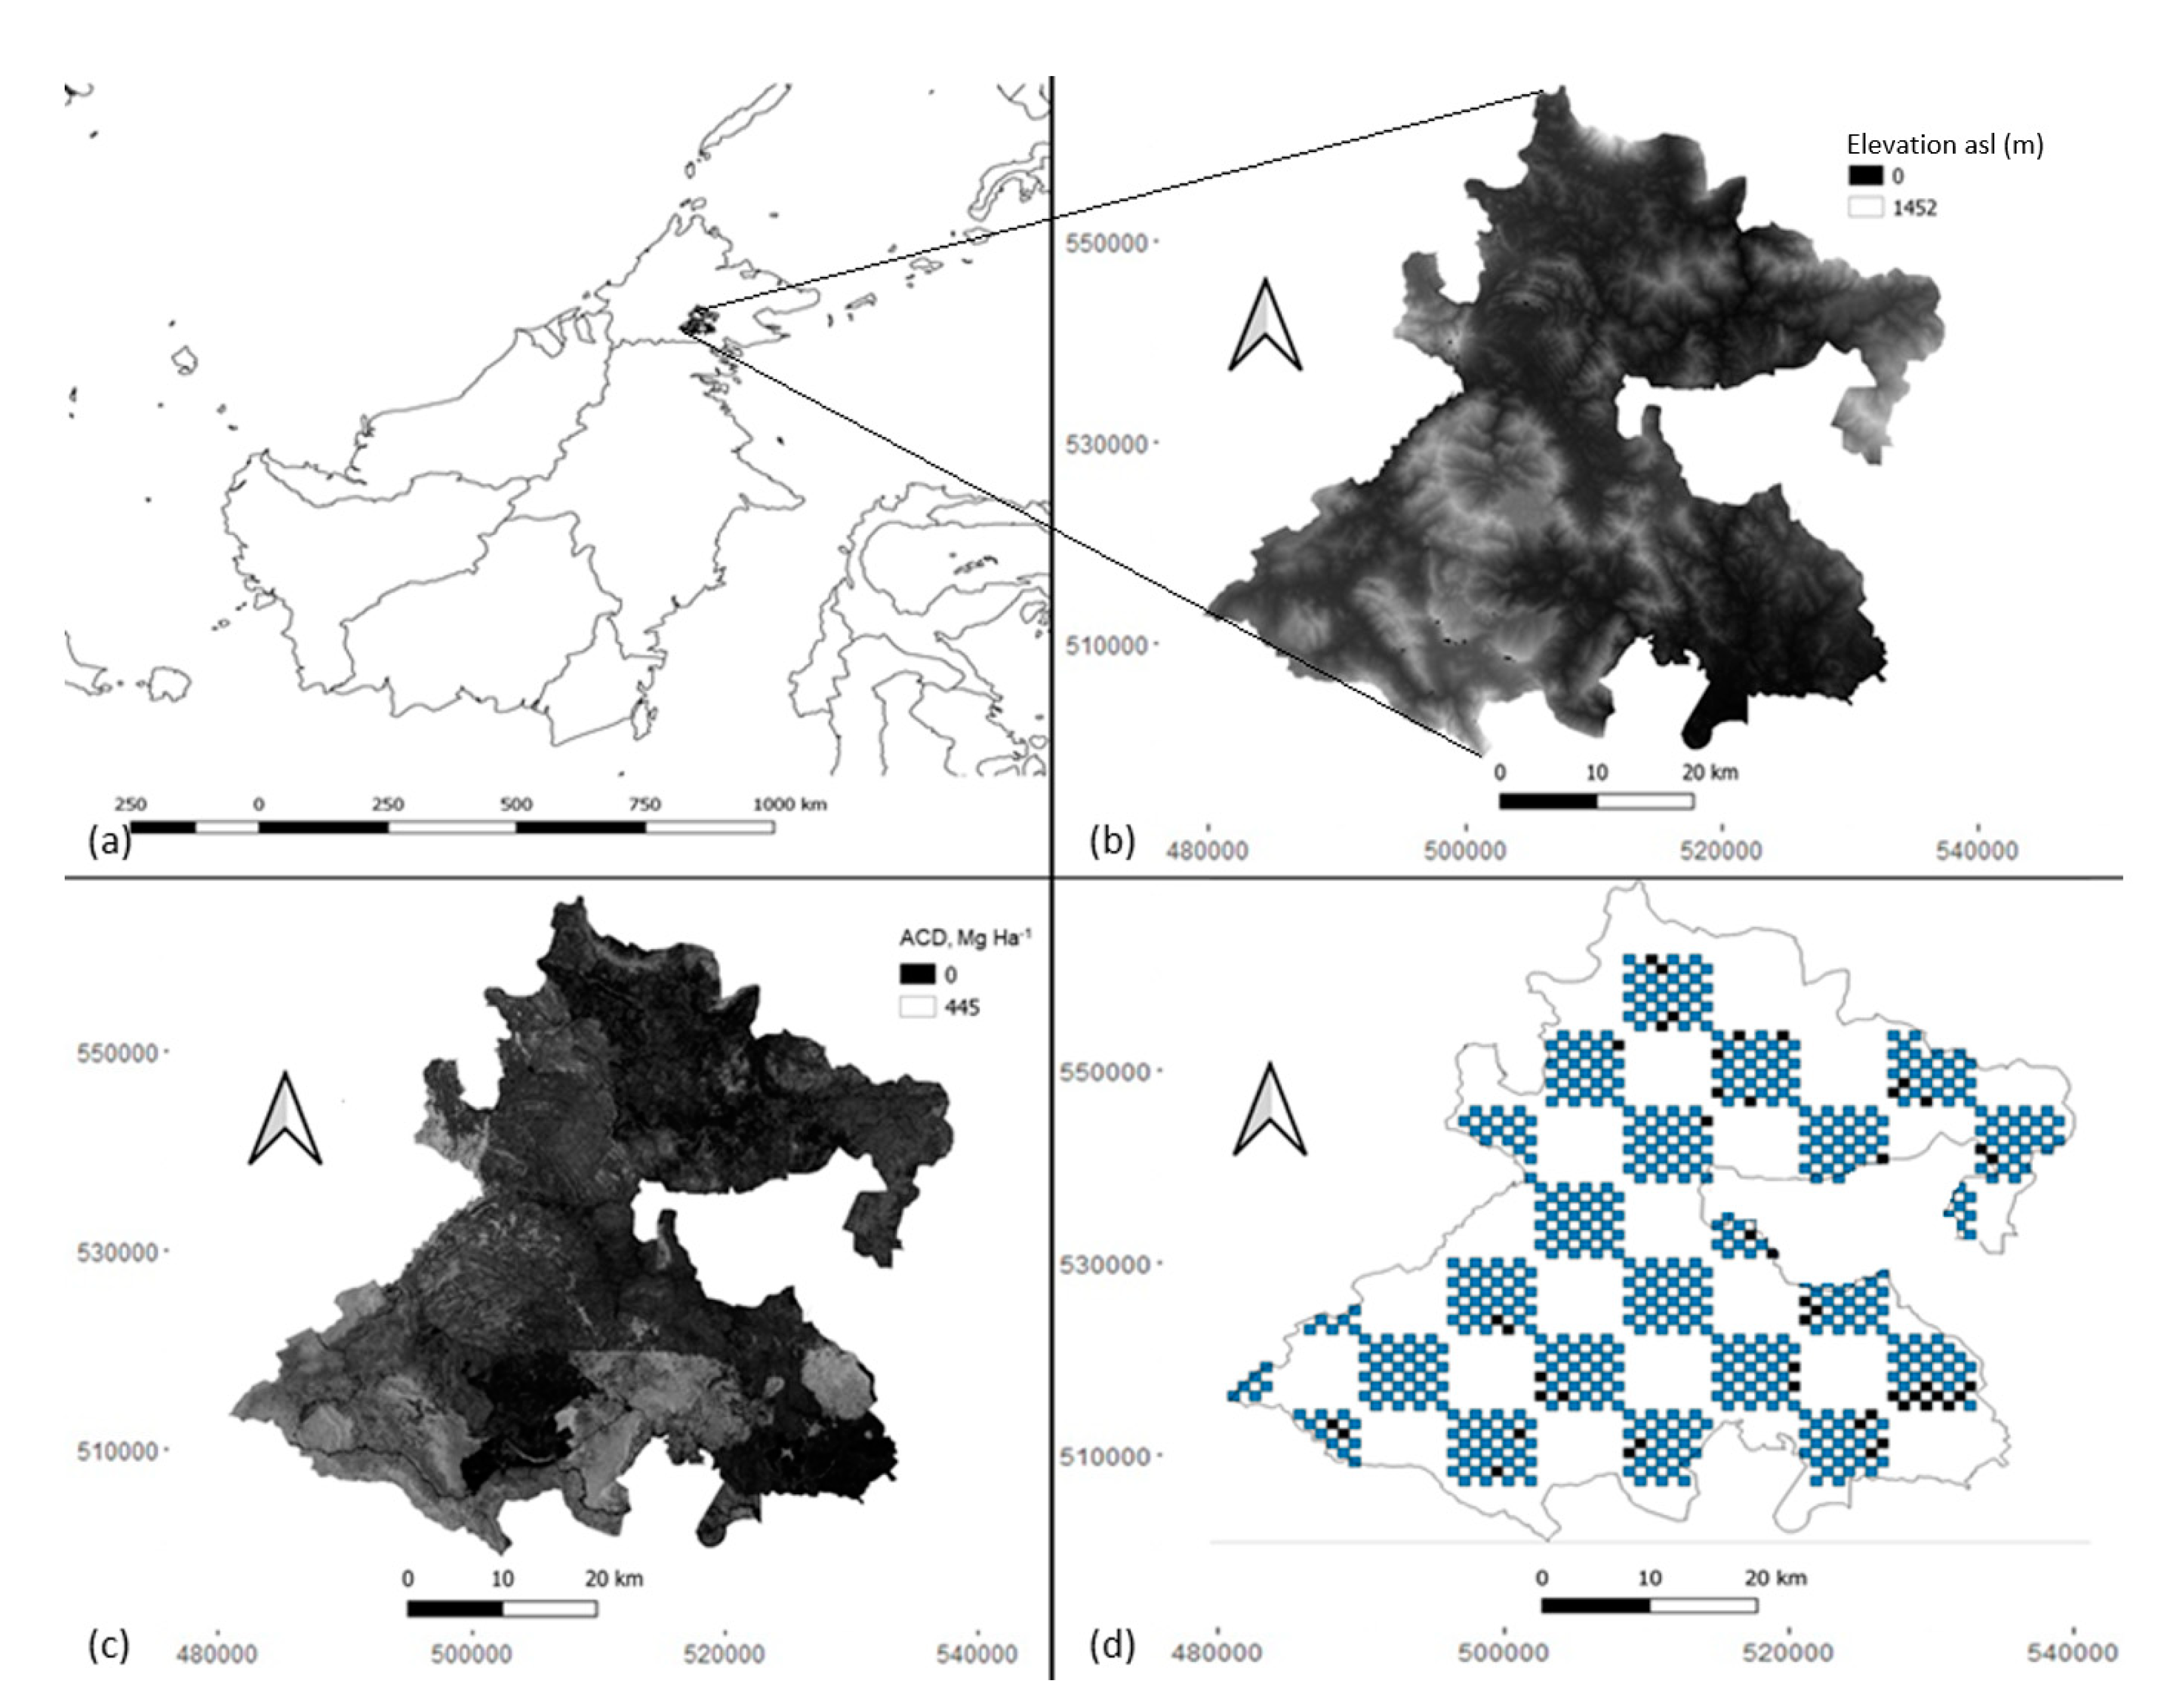
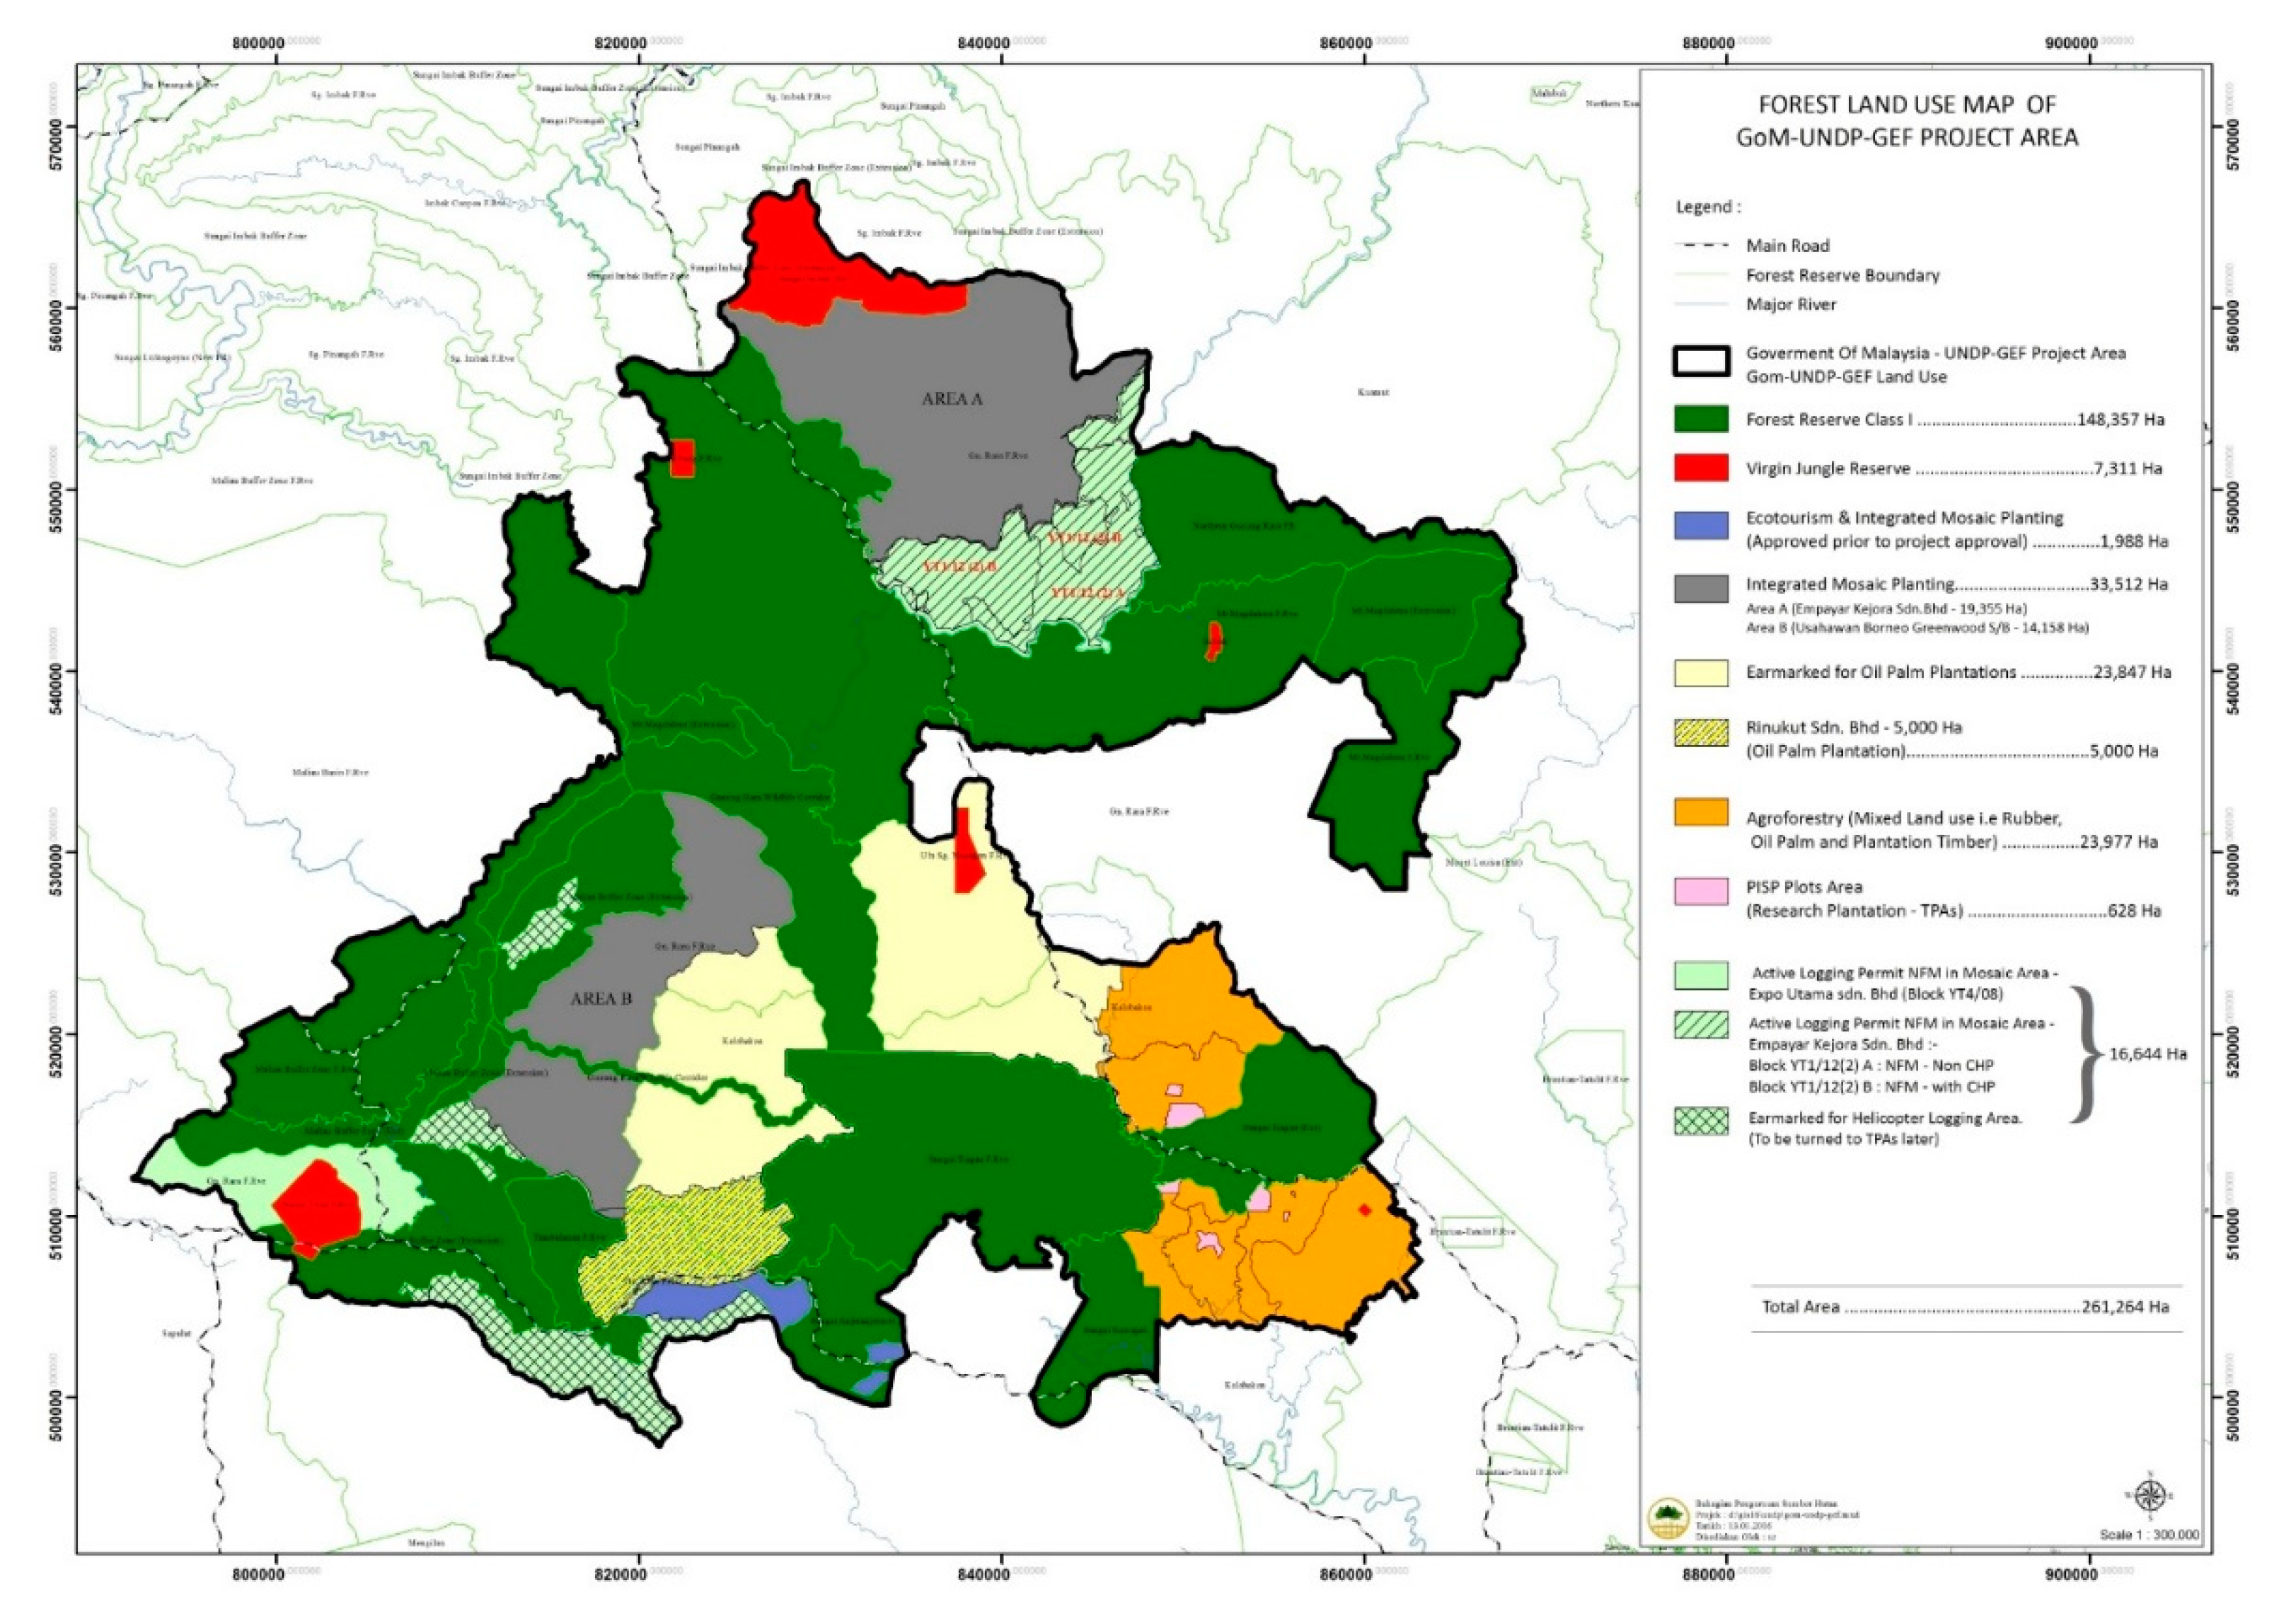
2.1. Study Area

The study area (Figure 1a) is a 261,264-ha multiple-use forest landscape located in Southeast Sabah, Malaysia (5.11394–4.41325° N, 116.99576–117.49802° E, Figure 1). The study area has a rugged terrain lying between 94 and 1140 m, even though most of the landscape lies below 500 m asl (Figure 1b).
The multiple-use forest landscape was defined by the Sabah State government in 2012 to bring the management of protected areas and commercial land use types under a common management umbrella (Figure A1). Heavy historical timber extraction from forests in Sabah has resulted in a recent decline in logging revenue, and efforts are being made to create revenue from production forests by embedding short (8–15 years) rotation plantations within existing logging concessions, referred to hereafter as Integrated Mosaic Planting (IMP) areas, which cover 12.8% of the study area (33,512 ha). Approximately 56.7% of the study area (148,357 ha) is composed of protected Class 1 Forest Reserves, which contain a mix of logged and unlogged forest where logging and hunting are banned. A further 9.0% of the study area (23,977 ha) consists of unmanaged rubber (Hevea brasiliensis) and acacia (Acacia mangium) plantations. Approximately 9.0% of the study area (23,847 ha) is proposed for conversion to oil palm plantations, of which a quarter had been cleared and terraced by the mid-point of our sampling in 2017. Five separate forest fragments, amounting to 7311 ha, or 2.8% of the total study area, are protected as ‘Virgin Jungle Reserves,’ which consist mainly of unlogged primary forest on steep topography.
For the purposes of this analysis, five land uses were recognised: (i) Class 1 protected forest, (30 survey areas, 59.31 km2), (ii) oil palm plantations (3 survey areas, 1.15 km2), (iii) silvicultural plantations of rubber (three survey areas, 3.23 km2) or Acacia mangium (two survey areas, 1.37 km2 total) labelled ‘silviculture’ from hereon, (iv) integrated mosaic plantations (five survey areas consisting of 1–5 ha patches of timber trees, interspersed with remnant forest patches, 7.25 km2 total), and small ‘agroforestry’ areas two survey areas, 2.98 km2 total) labelled ‘IMP areas’ from hereon, and (v) natural riparian forest of roughly 100 m in width embedded within oil palm plantations (three survey areas, 1.1 km2 total).

2.2. Sampling Design and Survey Methods

Orangutan nests and large strangler fig trees (Ficus spp.) were surveyed across 48 areas. These survey areas were determined at random to sample at least three survey areas within all land use types (after combining Acacia and rubber plantations, due to similar land-cover characteristics) and subject to the constraint that surveys had to be accessible to sampling on foot and by drone (i.e., <2.5 km from a road). Furthermore, land uses that covered larger areas were sampled more comprehensively based on their relative representation within the study landscape. On average, the 48 aerial surveys covered 149 ha (range of 38 to 252 ha, SEM 0.083), for a total area of 76.39 km2, or approximately 28% of the study landscape. Forty-four areas were surveyed using both aerial and ground-transect methods (Figure 1d). A total of four areas, in Class I forest, integrated mosaic plantations were only surveyed by drone due to access limitations on the ground.
Aerial surveys were conducted using either fixed-wing or quadcopter drones. The fixed wing drone (Zeta Phantom FX 61 with HKPilot Mega 2.7 Flight Controller, Hobbyking, Fotan, Hong Kong) had a wingspan of 1550 mm, an approximate flight time of 50 min, and an average cruising speed of 25 kph. Images were acquired using a Canon S100 camera (Canon, Ōta, Tokyo, Japan) with a 12 MP resolution and image sensor size of 7.44 × 5.58 mm. The camera was triggered to take pictures at 2-s intervals using the Canon Hack Development Kit (CHDK) intervalometer (chdk.wikia.com/wiki/Adding_Firmware_Features). An internal GPS and barometer recorded information on position and altitude. The quadcopter (DJI Phantom 4 Pro quadcopter, Shenzhen, China 518057) was used for 46 of the 48 flights. It had a maximum dimension of 350 mm, using standard 127-mm DJI Phantom 4 rotors, with a flight time of approximately 26 min and a cruising speed of 50–72 kph. Images were acquired using an onboard 20 MP camera with a sensor size of 12.8 mm × 9.6 mm.
For both drones, surveys were initially designed using Garmin Basecamp software (Garmin BaseCamp version 4.5.2, Garmin Europe Ltd., Southampton, UK) to specify a 1.5-km2 survey area. These coordinates were then uploaded to Mission Planner 1.3.46 software (Ardupilot.org/planner/), to calculate a safe flight altitude, defined as a minimum of 100 m above the highest point on the ground. For the fixed-wing drone, flight plans were uploaded directly to the vehicle using Mission Planner. For the quadcopter, coordinates for each corner of the survey area were uploaded to DJI Ground Station Pro (GSPro), and then sent to the drone. Each survey had a minimum of 75% overlap and 60% side lap between captured images for mapping purposes. The coordinates of the outer corners of images along the survey boundary were used to calculate the full extent of the area covered by drone, incorporating variations in topography. Aerial surveys covered an average of 1.5 km2, which is an area approximately 24 times larger than the ground-transects.
Ultimately, the fixed wing drone was only used for the aerial survey of one survey area of 1.4 km2, with a secondary flight over this area by quadcopter. A total of 14,029 individual images were captured in the drone surveys. Each image was searched for orangutan nests and fig trees by a single experienced reviewer (SM) for a minimum of 30 s and repeated three times for the entire set of images. Images taken at higher altitude were searched for longer (up to 2 min) to account for the larger canopy surface area displayed in these images and were analysed three times in order to standardise methods.
A trigonometric approach was employed to georeference the locations of individual orangutan nests, fig trees, and boundaries of aerial surveys. Exiftool [23] was used to extract the GPS metadata recorded with each image, and the coordinates of any pixel of interest was determined by calculating the bearing from the pixel of interest to the centre of each image using the ‘bear’ function of the ‘Fossil’ package in R [24]. The bearing was then adjusted to account for the difference between the direction of the drone and true north. The distance between pixels on the ground was calculated using the ground-surface distance formula [25] and Vincenty’s Formula [26] was used to determine the GPS coordinates of the target pixel for each nest and fig tree. Given that every nest and fig tree detected in aerial surveys was geo-located, we were able to directly count the number of nests and fig trees detected from aerial surveys that were located within areas surveyed on foot during ground-transects. The spatial accuracy of GPS coordinates recorded by drone surveys were within 1.5 m [27].
Ground-transects were conducted prior to the aerial survey and were positioned in the centre of areas covered by aerial surveys. Ground-transects were based on a straight 1500-m distance in Garmin Basecamp, but undulations in the terrain consistently increased this distance. Tracks recorded using a Garmin GPSMAP 60CS GPS (Garmin Europe Ltd., United Kingdom) were used as the length measurement for calculating the actual distance covered during each transect. It is estimated that this model has an average positioning accuracy of 4.5 m [28]. Transect width was calculated using the Effective Strip Width (ESW) function of the ‘Distance’ package [29] in R version 2.15.3 (R Core Team, 2019), calculated by pooling data collected across all transects, using horizontal distances of all nest observations taken during the course of the survey and a truncation distance of 42.4 m. The transect ESW was multiplied by its length to produce a polygon covering the area surveyed.
Transects varied in length due to topographic variation at each site but averaged 42 m × 1523 m. At each nest, the nest decay status, height, perpendicular distance to the main transect line, and GPS position were recorded. Mature strangler fig trees of ≥10 cm in diameter at breast height (DBH) that had fully encompassed their hosts were also recorded. Locations were recorded by GPS, and a perpendicular distance from the transect line was measured by tape measure.
A state-wide airborne LiDAR survey (ALS) in 2016 [15] was used to provide information about above-ground carbon density (ACD) as a surrogate for forest quality across the survey area. LiDAR reconstructs the three-dimensional structure of the forest canopy and provides data on mean top-of-canopy height (TCH, in m) from which ACD is derived using regression methods. Based on data from this survey, ACD and elevation were derived at 30 × 30 m resolution (Figure 1c). All survey areas were then subdivided into polygons based on land use type and inferred barriers to orangutan dispersal. For example, wide rivers can pose a barrier to orangutan dispersal and impact habitat use [14] and were used to divide survey areas into discrete partitions. Areas of river, roads, and settlements were excluded from calculations of mean ACD within survey areas, but roads were not treated as a direct barrier to dispersal as orangutans are known to be able to cross roads on foot. For each polygon representing a discrete land use type, or a subdivision defined by a river or road, we estimated the mean ACD and mean elevation, and extracted the number of nest and fig trees detected in these areas based on GPS coordinates. Orangutan nest and fig tree counts within these polygons were the response variables for the analyses described below.

2.3. Data Analysis

Question one addresses the difference in orangutan nest counts between aerial surveys and ground-transects. To answer this, the number of nests detected in ground-transects and aerial surveys were compared directly by identifying a polygon in the aerial surveys representing the transects surveyed on the ground and counting only nests and figs within those polygons. This allowed for a direct comparison between the number of nests and figs detected by the two methods within the same area. To accommodate spatial non-independence among samples, the entire study area was gridded at a resolution of 8 × 8 km (Figure 1d) and data derived from within the same grid cell were regarded as spatially autocorrelated. Nest counts were fitted to a linear mixed-effects model with Poisson distributed residuals, using the ‘glmer’ function of the ‘MASS’ package in R. This model possessed fixed effects for the survey method (drone survey vs. ground-transect), mean ACD, the interaction between ACD and survey method, and a random effect of the location of survey areas within the wider landscape (represented as its 64 km2 grid cell, Figure 1d) to account for the nested structure of the data.
For question two, we assessed the effects of land uses (continuous forest, integrated mosaic plantation areas, oil palm plantations, oil palm riparian strips, and silviculture areas) on nest counts, fig counts, and ACD within each aerial survey area. We used a generalised linear mixed model with a Poisson error structure for the count data and a linear mixed effects model for ACD, using the ‘lmer’ function in the ‘lme4′ package in R [30]. The location of samples within grids was included as a random effect to account for spatial autocorrelation as above. The log transformed area of each polygon used in this analysis was included using the ‘offset’ function to account for differing polygon sizes.
For question three, we investigated how forest degradation affects orangutan nest density, estimating the influence of ACD, elevation, and strangler fig density on orangutan nest counts derived from aerial surveys within the subset of polygons containing forest along a disturbance gradient. Survey areas covering monocultures and IMP were excluded, but those with riparian forest within oil palm plantations were included. This set of samples encapsulated an ACD range from 31 to 209 Mg ha−1 that is assumed to reflect a gradient of forest quality, as tree species diversity is known to increase with aboveground carbon density in human modified landscapes [31]. Data were fitted to generalised additive models (GAM) using the ‘mgcv’ package in R, assuming a negative binomial distribution of residuals. The model fitted the fixed main effects of ACD, elevation, fig density per km2, and the two-way interaction between ACD and fig density, which tests the hypothesis that the response of orangutan nest density to forest quality depends on fig tree density. Locations of each polygon were included as a random effect, and a log transformation of the polygon area was included using the ‘offset’ function to account for the varying size of polygons. Tensors were used to account for differences in scaling between fig density and mean ACD, and splines were included to smooth the non-linear covariates comprising the main effects [32]. Finally, the values for the 25th and 75th percentiles of fig density from aerial surveys were fitted to this GAM and used to predict the effect of increasing ACD on orangutan nest counts. All models were validated by the inspection of residuals and Cook’s distance.

3. Results

3.1. Orangutan Nest Density from Aerial and Ground Surveys

In total, 813 individual orangutan nests and 360 strangler fig trees were identified in the 48 aerial surveys covering 75.5 km2. The mean (± SEM) nest encounter rate from aerial surveys was 11.8 ± 3.4 km−2 (median = 3.2 km−2, range 0–93.6 km−2, n = 48), the mean fig encounter rate was 5.14 ± 0.7 km−2 (median = 1.6 km−2, range 0.0–27.0 km−2, n = 48). In the 43 ground-transects covering a total of 2.75 km2, 64 orangutan nests and 18 fig trees were encountered. The mean nest encounter rate for ground-transects was 20.6 ± 9.1 km−2 (median = 0.0 km−2, range 0–98.3 km−2, n = 43), and the mean strangler fig encounter rate was 6.5 ± 1.6 km−2 (median = 0.0 km−2, range = 0.0–3.0 km−2, n = 43).

3.2. Effects of Survey Method on Orangutan Nest Counts

Based on an area-to-area comparison of nest counts derived from each method, mean (± SEM) orangutan nest count derived from aerial surveys (16.6 ± 6.2 nests km−2) was not significantly different (F1,80 = 1.007, P = 0.773, Figure 2) to those recorded during ground-transects (20.6 ± 9.1 nests km−2). Within this sample, ACD did not significantly affect the number of nests detected using either survey method (F1,80 = 2.675, P = 0.144). The interaction between ACD and the survey method type also did not have a significant effect on the nest counts recorded (F1,80 = 0.097, P = 0.753).

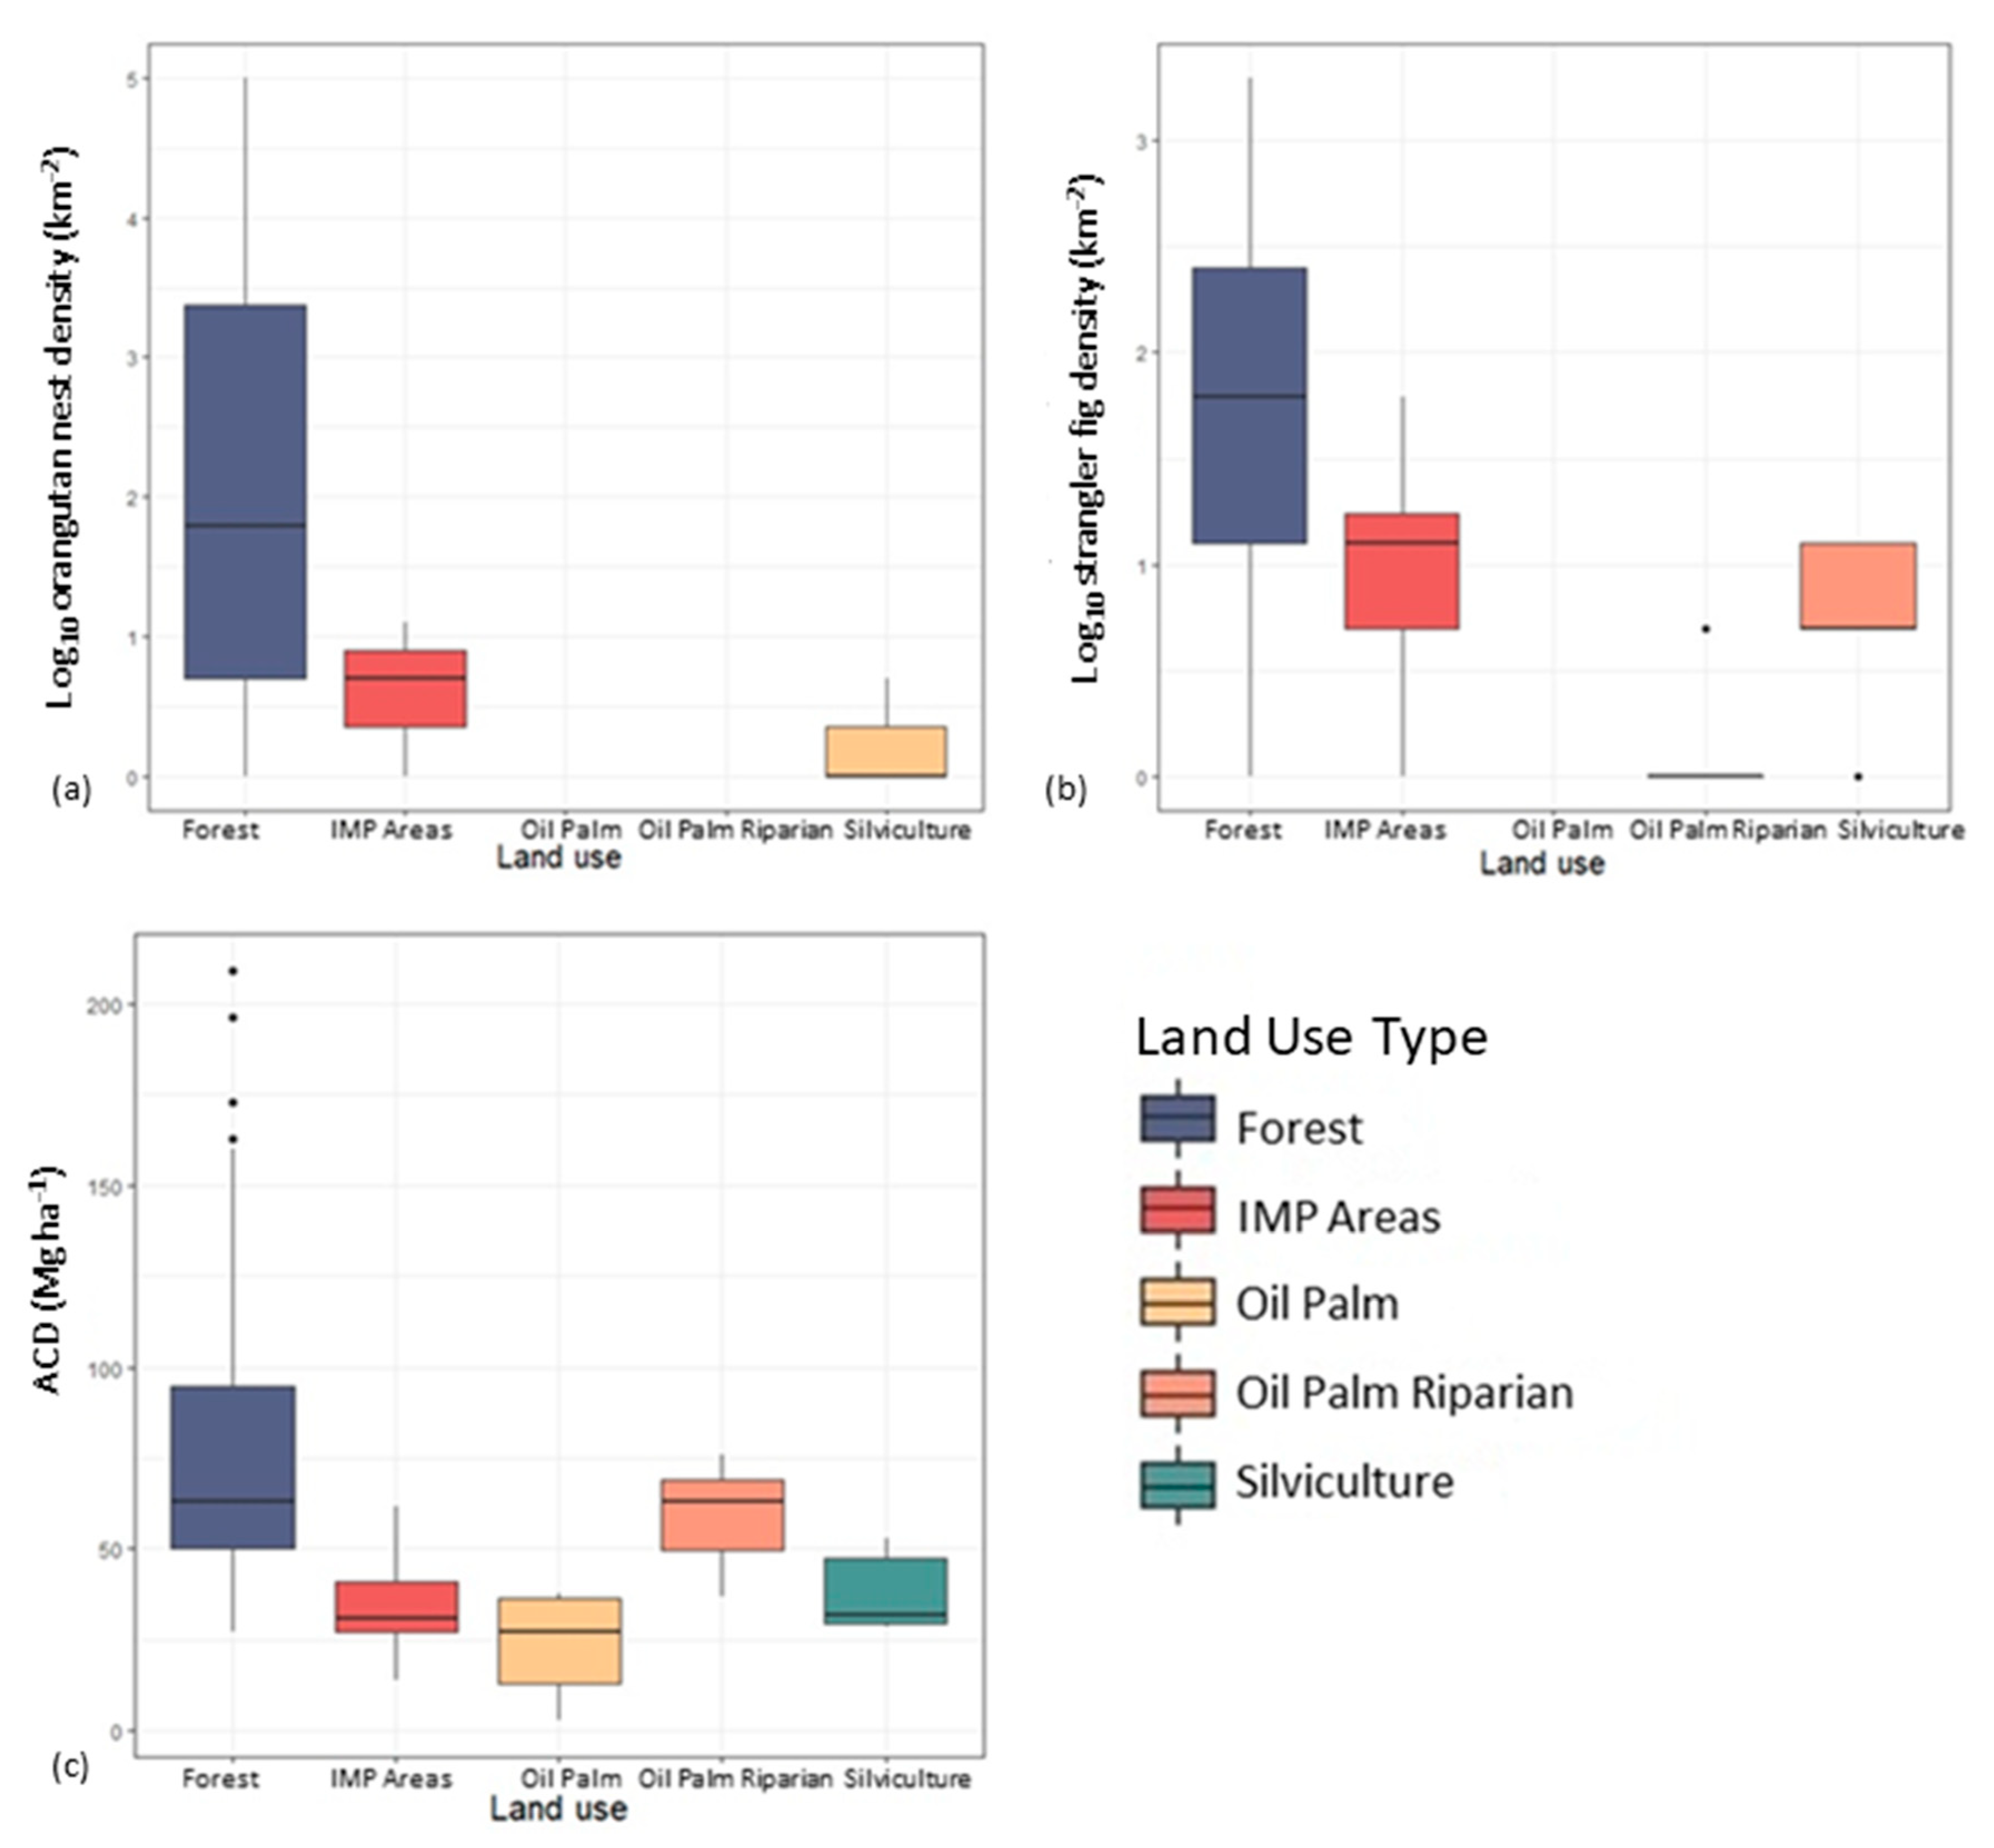
3.3. Influence of Land Use on Nest Counts, Strangler Fig Counts, and ACD in Aerial Surveys

Orangutan nest counts in a continuous forest were significantly higher than in any other land use type studied, including integrated mosaic plantations, oil palm plantations, oil palm riparian strips, or silviculture (F 4, 61.769 = 4.371, P < 0.003, Figure 3a). Strangler fig counts were significantly lower in oil palm plantations than continuous forest, but they did not vary significantly among other land uses studied (P = 0.038, F 4, 47.15 = 2.761, Figure 3b). Mean ACD was significantly higher in a continuous forest than any other land use type surveyed (F 4, 67.427 = 9.589, P < 0.001, Figure 3c), while the difference in ACD between rubber and acacia plantations and continuous was marginally non-significant (P = 0.052, Figure 3c).

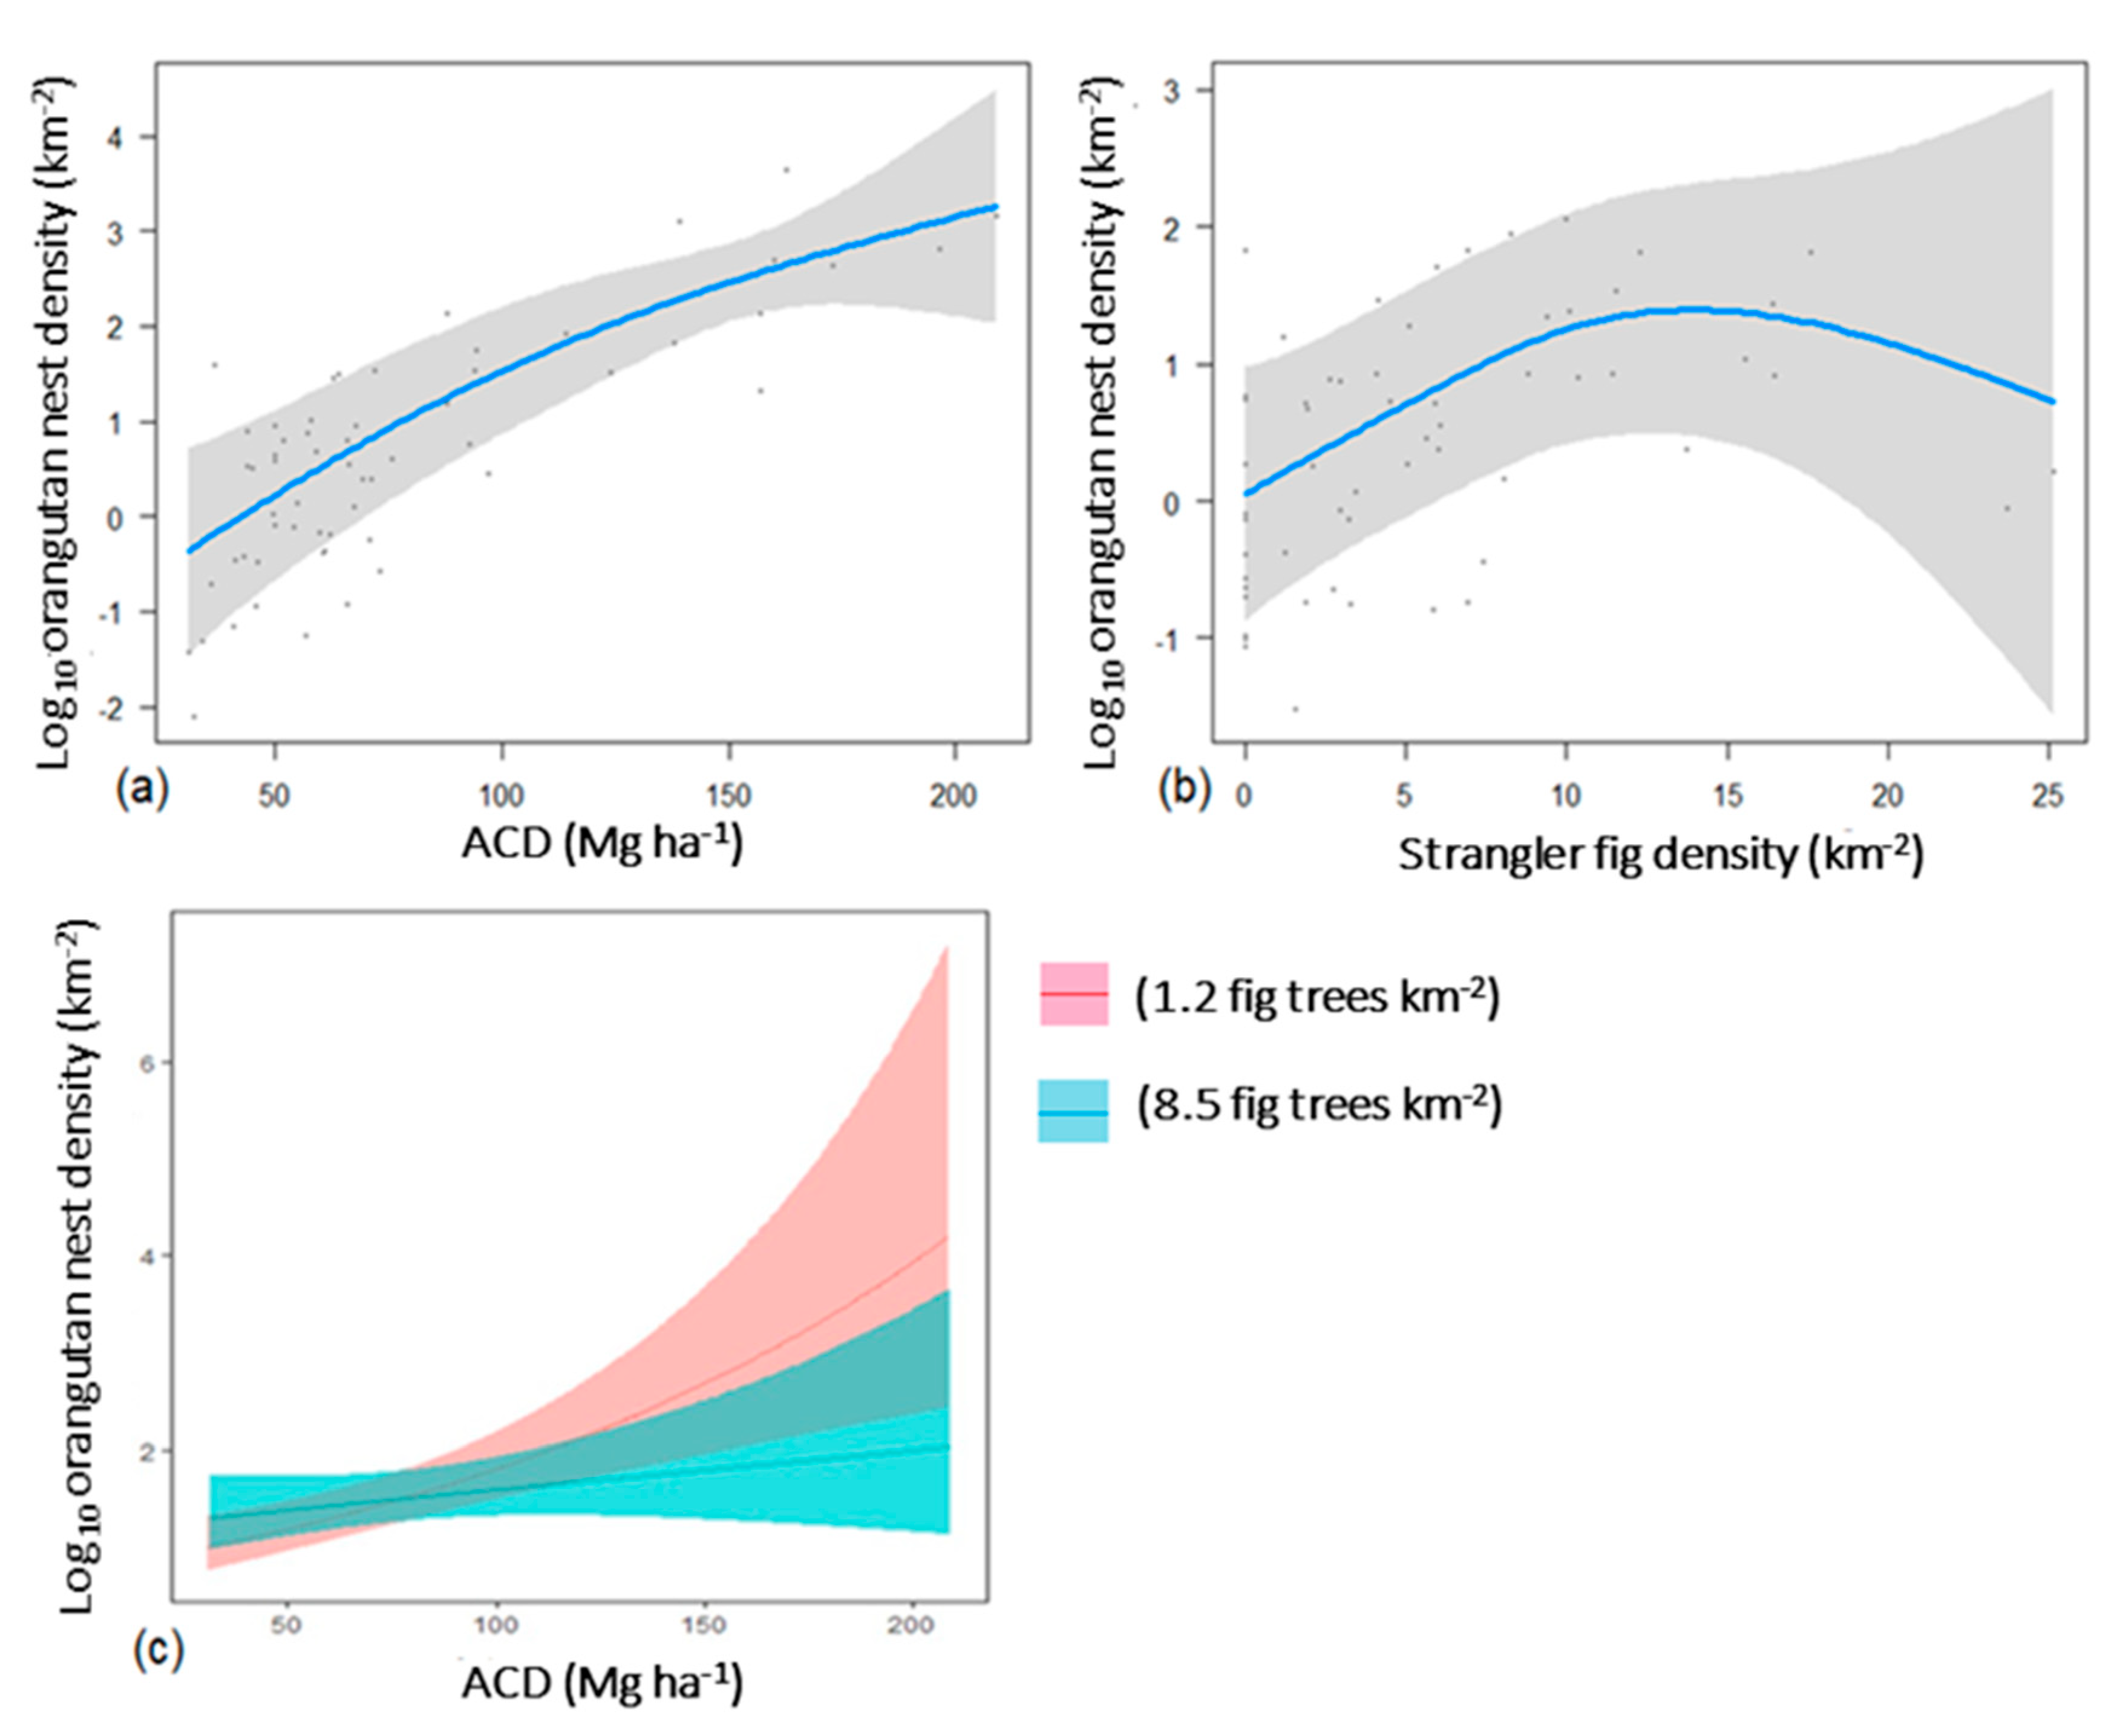
3.4. Effects of Forest Quality, Strangler Fig Density, and Elevation on Orangutan Nest Counts in Aerial Surveys

Orangutan nest counts increased with the mean ACD of a survey area. There were few survey areas with ACD greater than 150 Mg ha−1, which expands the uncertainty associated with values in this range (Table 1, Figure 4a). Strangler fig density also had a significant positive impact on orangutan nest counts in aerial surveys (Table 1, Figure 4b). There was a marginally non-significant interaction between ACD and strangler fig density, which suggested that high fig densities may have had a stronger impact on nest counts in a low ACD forest than in a more intact forest with higher ACD (Table 1, Figure 4c). Elevation had no significant impact on orangutan nest counts across the areas surveyed in this study (Table 1).

4. Discussion

4.1. Comparison of Survey Methods

Mean orangutan nest count density did not differ between aerial surveys and ground-transects across our study area in Southeast Sabah. This result contrasts with previous research in Sumatra showing that orangutan nest counts were significantly lower in aerial surveys by a fixed-wing drone than in ground-transects that sampled the same habitat [8]. However, the aerial surveys in the Sumatran study were made from approximately 50 m higher than that adopted in our study, and using a 12 MP camera [8], which is a significantly lower resolution than the 20 MP camera used for 96% of the surveys in this study. Therefore, it remains a possibility that the lower nest count density in the aerial surveys of the Sumatran study is a methodological artefact, resulting from the higher altitude surveys and use of a lower resolution camera.
Despite the absence of a difference in nest counts between the two survey methods, it is likely that both methods under-estimate the true density of Orangutan nests. This is because nests constructed on top of tree crowns, which are most visible in aerial surveys, are difficult to detect by an observer from the ground, and, conversely, nests below the tree crown may be invisible in drone surveys. The under-estimation of nest counts in ground-transects may be particularly acute in the dense second vegetation typical of highly degraded forest, while aerial surveys might be expected to under-estimate nest counts in high quality forest with a more heterogeneous canopy structure [8]. However, the absence of a significant interaction between the survey method and ACD in our study suggests that the relative success of the two survey methods does not vary in response to forest quality. In order to estimate the extent to which each survey method under-estimates true nest density, future studies should record precise coordinates of each nest and then overlay maps of nest locations to determine those that had been missed in each case. This would allow researchers to compute a local conversion factor for scaling nest counts from aerial surveys to total counts in each setting. In order to compute these conversion factors, ground transects are still required to complement aerial survey techniques in orangutan nest surveys.

4.2. Effect of Land Use on Orangutan Nest Counts, Strangler Fig Counts, and Above-Ground Carbon Density

Conversion of logged forest to create single-species plantations of oil palm, acacia, or rubber resulted in a reduction in orangutan nest counts, even when these plantations retained small patches of remnant forest. Only one nest was observed in 3.2 km2 of rubber plantations surveyed, and none were observed in 1.5 km2 of oil palm plantations, 0.21 km2 of oil palm riparian strips, or 1.4 km2 of acacia plantations. Integrated mosaic plantation areas had higher median orangutan nest counts and fig density than monoculture plantations, but values were still substantially lower than in areas with a continuous cover forest, except where that forest was very heavily degraded. These data suggest that loss of forest cover reduces habitat quality for orangutans, even when natural forest cover is replaced by tree plantations equivalent in height and ACD to some natural forests. The factor that unites all the non-forest land uses compared here is the clearance of land prior to planting, and the creation of a woody vegetation with a much more homogeneous structure and species composition. Orangutans have been documented feeding on oil palm fruits within plantations. However, agricultural monocultures are infrequently used by orangutans for nesting purposes [13]. Therefore, nest construction in these land use types is unlikely even if orangutans are present. This study confirms this finding and extends it by recording limited use by orangutans of rubber and acacia plantations.
The low abundance of orangutan nests in silviculture plantations may arise for multiple reasons, including an inappropriate forest structure for nesting or arboreal dispersal [33], increased likelihood of disturbance or mortality of orangutans due to contact with humans and domestic animals [3], or an absence of food resources [34]. Our surveys showed that strangler fig density also declined following forest clearance and selective logging, as these trees are targeted for removal when the host tree is a valuable timber species [35]. Even though some strangler fig trees were left standing in silviculture and integrated mosaic plantations, the combination of these factors has resulted in a significant decrease in nest counts in converted areas.
No orangutan nests were encountered in 0.21 km2 of riparian forest strips embedded within oil palm plantations, despite the presence of figs and an intact forest in these areas. Isolated forest fragments within oil palm estates have been shown to be important orangutan habitats in adjacent areas of Sabah [36]. It is possible that the limited sampling of these areas coupled with unique characteristics of this study site explains the low number of nests recorded. In our study area, a major road passes between the single estate surveyed and neighbouring natural forest. Therefore, the riparian strips sampled are only connected to one fragment of continuous forest and they would not be able to function as uninterrupted dispersal corridors. Ficus spp have been observed growing in higher densities in riparian forest in Thailand [37], which may explain the high numbers observed in our study, despite the small area sampled. These observations suggest that the relationship between orangutan occupancy of a habitat and the availability of figs may be decoupled by the spatial structure of the habitat, as a lack of connectivity between these riparian strips and larger forest fragments makes dispersing for this food resource a less viable feeding strategy.

4.3. Variation in Orangutan Nest Counts Across a Gradient of Forest Degradation

Orangutan nest density estimates derived from aerial surveys showed a positive relationship with ACD. The survey areas encompassed a wide gradient of forest degradation arising from variation in logging impacts, leading to a mosaic landscape composed of residual unlogged forest patches with high ACD embedded within a matrix of highly heterogeneous disturbed forest environments possessing lower and more variable values of ACD. This result contrasts with research in the Lower Kinabatangan Wildlife Sanctuary (LKWS) in Sabah [38], which showed that the correlation between nest density and ACD was weak and non-significant. However, this may be because the LKWS covers a smaller range of land use types, comprising primarily disturbed forest that possesses a narrower range of ACD values (0–150 Mg ha−1) than those included in the multiple-use forest landscape we examined [38].
Higher nest counts in less degraded forest may arise because of orangutan preferences for specific forest structural characteristics that are modified by logging, combined with changes in food resource availability linked to logging disturbance. Tall and stable trees with a complex branching structure are preferred for nest building because they create a stable platform for nests in wind and rain and provide a useful vantage point over the forest [9]. Additionally, undisturbed forests have fewer canopy gaps [39], which are energetically expensive for orangutans to cross [5]. Disturbed forests also have a more uniform canopy height, which was negatively correlated with orangutan density in other studies in Sabah [36]. Further analysis of these metrics would help us to understand how forest structure drives orangutan nest site selection in a multiple-use landscape.
Our results revealed that orangutan dependence on strangler figs may be greater in a more degraded forest (<150 Mg ha−1) than in relatively undisturbed forests. In a higher quality forest, orangutan nest density became decoupled from strangler fig density because food derived from other fruiting tree species became more available. This finding supports previous research in Sumatra showing that the importance of fig trees to orangutan habitat usage increases in a more degraded forest [33]. This may be associated with a decline in the abundance of other food sources, as fig trees are an important source of proteins, carbohydrates, lipids, and minerals for orangutans and other frugivores [18,39]. Figs are also a reliable and consistent food resource because different species fruit asynchronously and the intervals between fruiting events are short [40]. Consequently, they are highly sought after, and trees possessing large fruit crops can result in aggregations of orangutans and other frugivores [41].
Changes in food availability in response to logging may also be a significant driver of orangutan nest abundance. Mean fruit availability is a strong predictor of orangutan density [42] and disturbed forests are known to have lower food availability for orangutans [14]. This is reflected by the findings of this study, as nest counts generally increased with higher ACD. On the other hand, the five highest nest counts observed in this study were located in a more disturbed forest (ACD < 150 Mg ha−1). This partial decoupling may occur for several reasons. First, Bornean orangutans display considerable dietary flexibility, which allows them to extend their range into more disturbed environments when foraging for alternative food sources [12]. The fruits and leaves of pioneer species, such as Macaranga pearsonii and Neolamarckia cadamba abundant in degraded forests across the study area, are potentially important alternative food sources [12], while tree bark and insects also provide a reliable source of nutrients [43]. Second, in areas where food resources are scarce, orangutans are known to rest more frequently and construct day nests [44]. This study suggests that degraded forest (ACD < 150 Mg ha−1) where mature strangler fig trees are left unlogged retains higher orangutan nest counts than forest of the same ACD range where fig trees have been removed. However, without location-specific phenological data on fig fruiting events, we are not able to attribute high nest densities in low ACD forest to fig tree abundance directly. Lastly, high densities of strangler fig trees were observed in a heavily logged forest, indicating that at least some large, mature trees were left intact and remained a viable food source in degraded areas.
Contrary to expectations, there was no evidence of a decline in orangutan nest counts across the range of elevations surveyed in this study (117 to 675 m). A possible explanation for this lack of effect of elevation is that our entire study area was above the threshold elevation of 100 m that makes a difference for orangutan abundance. For example, a previous study of Bornean orangutan populations in Kalimantan showed that densities declined beyond 100 m asl. [4]. That interpretation may also explain the generally low population densities of orangutans across our study area in Sabah (nest densities in the range of 0–93.6 km−2 in forested habitats) compared to populations examined in forests at lower altitudes (10–20 m asl) where nest densities range from 87.5 to 1149.9 km−2 in forested habitats [45].

5. Conclusions

This study highlights the drivers of orangutan distribution in a multiple-use landscape, based on the observation of nest counts across multiple survey areas within this landscape. Orangutan nest counts declined significantly in response to increasing intensity of land use (Figure 3a), in conjunction with decreasing ACD (Figure 4b). These results emphasize the importance of a remnant forest, with low rates of human disturbance as an important orangutan habitat in multiple-use forest landscapes. Strangler fig density was also shown to be a significant driver of orangutan nest density, with high nest counts observed in a forest with a higher density of strangler fig trees (Figure 4b). The importance of strangler fig trees as food sources for orangutans in logged and degraded forests, which is supported by our study as well as others [18,22], justifies specific management interventions that might enhance the conservation of orangutans in these habitats. For example, enrichment planting of strangler fig trees might be an effective technique for increasing food availability and habitat quality in degraded secondary forests, especially when combined with other measures for restoring the forest structure and species composition [42]. In addition, restrictions on cutting lianas with fleshy fruits consumed by orangutans would limit the reduction in strangler fig trees and fruit-producing lianas that occurs when generic climber cutting practices are used to aid regrowth of mature trees in a logged forest [46]. In multiple-use landscapes, forest patches may be small and isolated, but they often possess sub-populations of orangutans vital to sustaining the viability of the regional metapopulation, distributed across a heterogeneous landscape [14]. The ability to conduct rapid surveys of forest fragments in their entirety across these landscapes may be a vital tool for monitoring the status of orangutan populations in the future. Our work demonstrates that drone surveys have the potential to play an important role in that effort.
Despite the under-estimation of orangutan nest density by both aerial surveys and ground-transects, the larger area sampled by drones than ground surveys for an equivalent effort expands the scope and accuracy of inferences about the drivers of orangutan abundance and distribution, particularly when sampling heavily disturbed environments or populations with low individual density. When coupled with an effective correction factor for under-sampling of nests, and high throughput image analysis, drone surveying could serve as an effective rapid assessment tool for monitoring orangutan populations [8]. However, the process of sorting through aerial images individually was time-consuming and prone to human error. Adopting a machine learning approach for identifying orangutan nests in aerial images may save time and improve standardisation in future surveys [47].

Author Contributions

Conceptualization, S.M., D.F.R.P.B. and J.G.A.M.; methodology, S.M., D.F.R.P.B., J.G.A.M.; validation, S.M., D.F.R.P.B. and J.G.A.M.; formal analysis, S.M., D.F.R.P.B. and J.G.A.M.; investigation, S.M., D.F.R.P.B. and J.G.A.M.; writing—original draft preparation, S.M.; writing—review and editing S.M., D.F.R.P.B., J.G.A.M., E.M.S., J.F.B., G.R., N.W., S.A.W. and C.S.V. All authors have read and agreed to the published version of the manuscript.

Funding

This research was funded by the Government of Malaysia-UNDP-GEF project on biodiversity conservation in multiple-use forest landscapes in Sabah, Sub-Contract SC-6B.

Data Availability Statement

The data presented in this study are available on request from the corresponding author.

Acknowledgments

We are grateful to the Sabah Biodiversity Council for research approval (ref: JKM/MBS.1000-2/2 JLD.6 (79)), the Department of Aviation Malaysia for approving the use of drones at the research site (ref: UMS/IBTP7.2/800), Yayasan Sabah Sdn. Bhd, Charles Garcia and Ronnie Bibi and the Sabah Forestry Department for logistical support, and HUTAN/ KOCP for training. We are indebted to the team of research assistants (Azuan, Adzim, Alul, Daus, Pidiy, Alex, and Jerry), and to funding from UNDP-GEF, without whom this fieldwork would not have been possible.

Conflicts of Interest

The authors declare no conflict of interest. The funders had no role in the design of the study; in the collection, analyses, or interpretation of data; in the writing of the manuscript, or in the decision to publish the results.

Appendix A

Figure A1. Land use map for the UNDP-GEF study area, comprised of proposed land uses for associated areas throughout the region (Sabah Forestry Dept., 2016) [48].
Remotesensing 13 00458 g0a1

References

  1. Giam, X. Global biodiversity loss from tropical deforestation. Proc. Natl. Acad. Sci. USA 2017, 114, 5775–5777. [Google Scholar] [CrossRef] [PubMed] [Green Version]
  2. Potapov, P.; Hansen, M.C.; Laestadius, L.; Turubanova, S.; Yaroshenko, A.; Thies, C.; Smith, W.; Zhuravleva, I.; Komarova, A.; Minnemeyer, S.; et al. The last frontiers of wilderness: Tracking loss of intact forest landscapes from 2000 to 2013. Sci. Adv. 2017, 3, e1600821. [Google Scholar] [CrossRef] [PubMed] [Green Version]
  3. Voigt, M.; Wich, S.; Ancrenaz, M.; Meijaard, E.; Abram, N.; Banes, G.L.; Campbell-Smith, G.; D’Arcy, L.J.; Delgado, R.A.; Erman, A.; et al. Global Demand for Natural Resources Eliminated More Than 100,000 Bornean Orangutans. Curr. Biol. 2018, 28, 761–769.e5. [Google Scholar] [CrossRef] [PubMed] [Green Version]
  4. Johnson, A.E.; Knott, C.D.; Pamungkas, B.; Pasaribu, F.H.; Marshall, A.J. A survey of the orangutan (Pongo pygmaeus wurmbii) population in and around Gunung Palung National Park, West Kalimantan, Indonesia based on nest counts. Biol. Conserv. 2005, 121, 495–507. [Google Scholar] [CrossRef]
  5. Meijaard, E.; Sheil, D. The persistence and conservation of Borneo’s mammals in lowland rain forests managed for timber: Observations, overviews and opportunities. Ecol. Res. 2007, 23, 21–34. [Google Scholar] [CrossRef] [Green Version]
  6. Kamaruszaman, S.A.; Fadzly, N.; Abd-Mutalib, A.H.; Muslim, A.M.; Atmoko, S.S.U.; Mansor, M. Measuring Orangutan nest structure using Unmanned Aerial Vehicle (UAV) and ImageJ. bioRxiv 2018, 365338. [Google Scholar] [CrossRef]
  7. Buij, R.; Singleton, I.; Krakauer, E.; van Schaik, C.P. Rapid assessment of orangutan density. Biol. Conserv. 2003, 114, 103–113. [Google Scholar] [CrossRef]
  8. Wich, S.; Dellatore, D.; Houghton, M.; Ardi, R.; Koh, L.P. A preliminary assessment of using conservation drones for Sumatran orang-utan (Pongo abelii) distribution and density. J. Unmanned Veh. Syst. 2016, 4, 45–52. [Google Scholar] [CrossRef]
  9. Koh, L.P.; Wich, S. Dawn of drone ecology: Low-cost autonomous aerial vehicles for conservation. Trop. Conserv. Sci. 2012, 5, 121–132. [Google Scholar] [CrossRef] [Green Version]
  10. Wilson, H.B.; Meijaard, E.; Venter, O.; Ancrenaz, M.; Possingham, H.P. Conservation Strategies for Orangutans: Reintroduction versus Habitat Preservation and the Benefits of Sustainably Logged Forest. PLoS ONE 2014, 9, e102174. [Google Scholar] [CrossRef] [Green Version]
  11. Ancrenaz, M.; Sollmann, R.; Meijaard, E.; Hearn, A.J.; Ross, J.; Samejima, H.; Loken, B.; Cheyne, S.M.; Stark, D.J.; Gardner, P.C.; et al. Coming down from the trees: Is terrestrial activity in Bornean orangutans natural or disturbance driven? Sci. Rep. 2014, 4. [Google Scholar] [CrossRef] [PubMed]
  12. Hardus, M.E.; Lameira, A.R.; Menken, S.B.; Wich, S. Effects of logging on orangutan behavior. Biol. Conserv. 2012, 146, 177–187. [Google Scholar] [CrossRef]
  13. Ancrenaz, M.; Oram, F.; Ambu, L.; Lackman, I.; Ahmad, E.; Elahan, H.; Kler, H.; Abram, N.K.; Meijaard, E. Of Pongo, palms and perceptions: A multidisciplinary assessment of Bornean orang-utans Pongo pygmaeus in an oil palm context. Oryx 2014, 49, 465–472. [Google Scholar] [CrossRef]
  14. Husson, S.J.; Wich, S.A.; Marshall, A.J.; Dennis, R.D.; Ancrenaz, M.; Brassey, R. Orangutan distribution, density, abundance and impacts of disturbance. In Orangutans: Geographic Variation in Behavioral Ecology and Conservation; Oxford University Press: Oxford, UK, 2009. [Google Scholar]
  15. Jucker, T.; Asner, G.P.; Dalponte, M.; Brodricki D, P.; Philipson, C.; Vaughn, N.R.; Teh, Y.A.; Brelsford, C.; Burslem, D.F.R.P.; Deere, N.J.; et al. Estimating aboveground carbon density and its uncertainty in Borneo’s structurally complex tropical forests using airborne laser scanning. Biogeosciences 2018, 15, 3811–3830. [Google Scholar] [CrossRef]
  16. Djojosudharmo, S.; van Schaik, C. Why are orang utans so rare in the highlands? Altitudinal changes in a Sumatran forest. Trop. Biodivers. 1992, 1, 11–22. [Google Scholar]
  17. Curran, L.M.; Trigg, S.; McDonald, A.K.; Astiani, D.; Hardiono, Y.M.; Siregar, P.; Caniago, I.; Kasischke, E. Lowland Forest Loss in Protected Areas of Indonesian Borneo. Science 2004, 303, 1000–1003. [Google Scholar] [CrossRef] [Green Version]
  18. Shanahan, M.; Compton, S.G. Vertical stratification of figs and fig-eaters in a Bornean low-land rain forest: How is the canopy different? In Plant Ecology; Springer: Berlin/Heidelberg, Germany, 2001; pp. 121–132. [Google Scholar]
  19. Janzen, D.H. Seed Predation by Animals. Annu. Rev. Ecol. Syst. 1971, 2, 465–492. [Google Scholar] [CrossRef]
  20. Marshall, A.J.; Wrangham, R.W. Evolutionary Consequences of Fallback Foods. Int. J. Primatol. 2007, 28, 1219–1235. [Google Scholar] [CrossRef]
  21. Dew, J.L.; Boubli, J.P. Tropical fruits and frugivores: The search for strong interactors. In Tropical Fruits and Frugivores: The Search for Strong Interactors; Springer: Berlin/Heidelberg, Germany, 2005; pp. 1–260. [Google Scholar]
  22. Wich, S.; Buij, R.; van Schaik, C. Determinants of orangutan density in the dryland forests of the Leuser Ecosystem. Primates 2004, 45, 177–182. [Google Scholar] [CrossRef]
  23. Toevs, B. Processing of Metadata on Multimedia Using ExifTool: A Programming Approach in Python. In 2015 Annual Global Online Conference on Information and Computer Technology (GOCICT); IEEE: Piscataway, NJ, USA, 2016; pp. 26–30. [Google Scholar]
  24. Vavrek, M.J. Fossil: Palaeoecological and Palaeogeographical Analysis Tools. Available online: https://cran.r-project.org/web/packages/fossil/ (accessed on 13 April 2018).
  25. Aero, P. Ground Sample Distance (GSD) and How Does it Affect Your Drone Data? Available online: https://www.propelleraero.com/blog/ground-sample-distance-gsd-calculate-drone-data/ (accessed on 16 July 2018).
  26. Thomas, C.M.; Featherstone, W.E. Validation of Vincenty’s Formulas for the Geodesic Using a New Fourth-Order Extension of Kivioja’s Formula. J. Surv. Eng. 2005, 131, 20–26. [Google Scholar] [CrossRef]
  27. DJI. PHANTOM 4. Available online: https://dl.djicdn.com/downloads/Phantom_4_Advanced/20170609/Phantom_4_Advanced_Release_Notes_EN.pdf (accessed on 18 January 2019).
  28. Kluga, A.; Zelenkov, A.; Grab, E.; Belinska, V. Accuracy estimation of GPS receiver parameters with simulator in dynamic mode. Elektron. Elektrotech. 2009, 6, 9–14. [Google Scholar]
  29. Marshall, M.L.; David, A.; Miller, L. Package ‘Distance’. Gastroenterology 2020, 160, 362–377. [Google Scholar]
  30. Bates, D.; Mächler, M.; Bolker, B.M.; Walker, S.C. Fitting linear mixed-effects models using lme4. J. Stat. Softw. 2015, 67. [Google Scholar] [CrossRef]
  31. Osuri, A.M.; Machado, S.J.; Ratnam, J.; Sankaran, M.; Ayyappan, N.; Muthuramkumar, S.; Parthasarathy, N.; Pelissier, R.; Ramesh, B.R.; de Fries, R.S.; et al. Tree diversity and carbon storage cobenefits in tropical human-dominated landscapes. Conserv. Lett. 2020, 13, 1–9. [Google Scholar] [CrossRef] [Green Version]
  32. Wood, S.N. Low-Rank Scale-Invariant Tensor Product Smooths for Generalized Additive Mixed Models. Biometrics 2006, 62, 1025–1036. [Google Scholar] [CrossRef] [Green Version]
  33. Thorpe, K.S.; Crompton, R.S. Orangutans: Geographic Variation in Behavioral Ecology and Conservation, Orangutan Positional Behavior Interspecific; Oxford University Press: Oxford, UK, 2009. [Google Scholar] [CrossRef]
  34. Campbell-Smith, G.; Campbell-Smith, M.; Singleton, I.; Linkie, M. Apes in Space: Saving an Imperilled Orangutan Population in Sumatra. PLoS ONE 2011, 6, e17210. [Google Scholar] [CrossRef] [Green Version]
  35. Wearn, O.R. Mammalian Community Responses to a Gradient of Land Use Intensity on the Island of Borneo. Ph.D. Thesis, Imperial College London, London, UK, 2016. [Google Scholar]
  36. Seaman, D.J.I.; Bernard, H.; Ancrenaz, M.; Coomes, D.; Swinfield, T.; Milodowski, D.T. Densities of Bornean orang-utans (Pongo pygmaeus morio) in heavily degraded forest and oil palm plantations in Sabah, Borneo. Am. J. Primatol. 2019, 81, 1–12. [Google Scholar] [CrossRef] [Green Version]
  37. Pothasin, P.; Compton, S.G.; Wangpakapattanawong, P. Riparian Ficus Tree Communities: The Distribution and Abundance of Riparian Fig Trees in Northern Thailand. PLoS ONE 2014, 9, e108945. [Google Scholar] [CrossRef] [Green Version]
  38. Davies, A.B.; Oram, F.; Ancrenaz, M.; Asner, G.P. Combining behavioural and LiDAR data to reveal relationships between canopy structure and orangutan nest site selection in disturbed forests. Biol. Conserv. 2019, 232, 97–107. [Google Scholar] [CrossRef]
  39. Groves, C.P.; Bahir, M.M. Scientific Correspondence. Mar. Mammal. Sci. 2014, 30, 1279–1280. [Google Scholar] [CrossRef]
  40. Harrison, R.D.; Hamid, A.A.; Kenta, T.; LaFrankie, J.; Lee, H.-S.; Nagamasu, H.; Nakashizuka, T.; Palmiotto, P. The diversity of hemi-epiphytic figs (Ficus; Moraceae) in a Bornean lowland rain forest. Biol. J. Linn. Soc. 2003, 78, 439–455. [Google Scholar] [CrossRef] [Green Version]
  41. Utami, S.; Wich, S.; Sterck, E.H.M.; van Hooff, J.A.R.A.M. Food Competition Between Wild Orangutans in Large Fig Trees. Int. J. Primatol. 1997, 18, 909–927. [Google Scholar] [CrossRef]
  42. Marshall, A.J.; Ancrenaz, M.; Brearley, F.Q.; Fredriksson, G.M.; Ghaffar, N.; Heydon, M. The effects of forest phenology and floristics on populations of Bornean and Sumatran orangutans Are Sumatran forests better orangutan habitat than Bornean forests? In Orangutans: Geographic Variation in Behavioral Ecology and Conservation; Oxford University Press: Oxford, UK, 2009; pp. 97–118. [Google Scholar]
  43. Russon, A.E.; Wich, S.; Ancrenaz, M.; Kanamori, T.; Knott, C.D.; Kuze, N.; Morrogh-Bernard, H.C.; Pratje, P.; Ramlee, H.; Rodman, P.; et al. Geographic variation in orangutan diets. Orangutans 2008, 135–156. [Google Scholar] [CrossRef] [Green Version]
  44. Meijaard, E.; Albar, G.; Nardiyono-Rayadin, Y.; Ancrenaz, M.; Spehar, S. Unexpected Ecological Resilience in Bornean Orangutans and Implications for Pulp and Paper Plantation Management. PLoS ONE 2010, 5, e12813. [Google Scholar] [CrossRef] [PubMed]
  45. Ancrenaz, M.; Goossens, B.; Gimenez, O.; Sawang, A.; Lackman-Ancrenaz, I. Determination of ape distribution and population size using ground and aerial surveys: A case study with orang-utans in lower Kinabatangan, Sabah, Malaysia. Anim Conserv. 2004, 7, 375–385.46. [Google Scholar] [CrossRef] [Green Version]
  46. Philipson, C.D.; Cutler, M.E.; BrodrickiD, P.; Asner, G.P.; Boyd, D.S.; Costa, P.M.; Fiddes, J.; Foody, G.; van der Heijden, G.; Ledo, A.; et al. Active restoration accelerates the carbon recovery of human-modified tropical forests. Science 2020, 369, 838–841. [Google Scholar] [CrossRef]
  47. Dujon, A.M.; Schofield, G. Importance of machine learning for enhancing ecological studies using information-rich imagery. Endanger. Species Res. 2019, 39, 91–104. [Google Scholar] [CrossRef] [Green Version]
  48. Sabah Forestry Department. Proposed Land Use Map for UNDP-GEF Study Area; Sabah Forestry Department: Sandakan, Malaysia, 2012. [Google Scholar]
Figure 1. (a) Map of the study area in relation to the whole island of Borneo. (b) Map of elevation above sea level (asl) across the study area [15]. (c) Map of above-ground carbon (ACD) Mg ha−1, derived from the LiDAR survey across the study area [15]. (d) The grid system used to organise the distribution of aerial plots within the study area provide a reference for the spatial random effect used in the model. Each blue square represents 1 km2 with each black square representing the location of survey areas.
Remotesensing 13 00458 g001
Figure 2. Boxplots of log10 (orangutan nest counts, km−2) nest counts, based on surveys from equal area surveys for ground-transects and drone surveys.
Remotesensing 13 00458 g002
Figure 3. Boxplots showing (a) Log10 orangutan nest counts (km−2 on untransformed scale) from aerial surveys, (b) Log fig counts (km−2 on untransformed scale) from aerial surveys, and (c) above-ground carbon density (ACD) (Mg ha−1) for different land use types within aerial survey areas: continuous forest, IMP areas, silviculture plantations, oil palm plantations, and riparian forest embedded within oil palm plantations. The horizontal lines represent the median values for each land use, the boxes represent the 25th to 75th percentile values, and the whiskers represent the values outside of this range.
Remotesensing 13 00458 g003
Figure 4. (a) Predicted relationship (±95% confidence envelope) from a generalized additive model (GAM) fitting data on log-transformed orangutan nest counts to ACD in aerial surveys of forested areas, (b) predicted relationship (±95% confidence envelope) from a generalised additive model (GAM) fitting data on log-transformed orangutan nest counts to strangler fig density in aerial surveys of forested areas and (c) predicted relationships from a GAM fitting data on log-transformed orangutan nest density to ACD in aerial surveys of forested areas assuming either the 25th percentile value of strangler fig tree density (1.2 fig trees km−2: pink line and shading showing a 95% confidence envelope) or the 75th percentile of strangler fig tree densities (8.5 fig trees km−2: blue line and shading showing 95% confidence envelope).
Remotesensing 13 00458 g004
Table 1. Results of the generalised additive models (GAM) used to predict the effects of mean above-ground carbon density (ACD), strangler fig density, mean elevation, and the interaction between fig density and ACD on aerial orangutan nest counts, including expected default frequency (edf), reference degrees of freedom (Ref.df), and Chi-squared statistics (Chi.sq). * denotes significant model results, with * p < 0.05, *** p < 0.001.
VariablesedfRef.dfChi.sqp-Value
Fig Density2.2302.68710.4280.012 *
Mean ACD1.6031.86421.999<0.001 ***
Mean Elevation1.0001.0001.3650.243
Fig Density * Mean ACD1.0001.0003.7000.054
Random Effect (Plot Location)12.80615.000165.475<2 × 10⁻¹⁶ ***
Publisher’s Note: MDPI stays neutral with regard to jurisdictional claims in published maps and institutional affiliations.

