Article

Spatial and Temporal Changes in the Normalized Difference Vegetation Index and Their Driving Factors in the Desert/Grassland Biome Transition Zone of the Sahel Region of Africa

1
State Key Laboratory of Desert and Oasis Ecology, Xinjiang Institute of Ecology and Geography, Chinese Academy of Sciences, 818 South Beijing Road, Urumqi 830011, China
2
University of Chinese Academy of Sciences, Beijing 100049, China
*
Author to whom correspondence should be addressed.
Remote Sens. 2020, 12(24), 4119; https://doi.org/10.3390/rs12244119
Submission received: 9 November 2020 / Revised: 10 December 2020 / Accepted: 14 December 2020 / Published: 16 December 2020
(This article belongs to the Collection Google Earth Engine Applications)

Abstract

:
The ecological system of the desert/grassland biome transition zone is fragile and extremely sensitive to climate change and human activities. Analyzing the relationships between vegetation, climate factors (precipitation and temperature), and human activities in this zone can inform us about vegetation succession rules and driving mechanisms. Here, we used Landsat series images to study changes in the normalized difference vegetation index (NDVI) over this zone in the Sahel region of Africa. We selected 6315 sampling points for machine-learning training, across four types: desert, desert/grassland biome transition zone, grassland, and water bodies. We then extracted the range of the desert/grassland biome transition zone using the random forest method. We used Global Inventory Monitoring and Modelling Studies (GIMMS) data and the fifth-generation atmospheric reanalysis of the European Centre for Medium-Range Weather Forecasts (ERA5) meteorological assimilation data to explore the spatiotemporal characteristics of NDVI and climatic factors (temperature and precipitation). We used the multiple regression residual method to analyze the contributions of human activities and climate change to NDVI. The cellular automation (CA)-Markov model was used to predict the spatial position of the desert/grassland biome transition zone. From 1982 to 2015, the NDVI and temperature increased; no distinct trend was found for precipitation. The climate change and NDVI change trends both showed spatial stratified heterogeneity. Temperature and precipitation had a significant impact on NDVI in the desert/grassland biome transition zone; precipitation and NDVI were positively correlated, and temperature and NDVI were negatively correlated. Both human activities and climate factors influenced vegetation changes. The contribution rates of human activities and climate factors to the increase in vegetation were 97.7% and 48.1%, respectively. Human activities and climate factors together contributed 47.5% to this increase. The CA-Markov model predicted that the area of the desert/grassland biome transition zone in the Sahel region will expand northward and southward in the next 30 years.

1. Introduction

Vegetation is an important part of the global ecosystem, which is very sensitive to both climate change and human activities. It thus acts as an indicator of global environmental change [1]. The desert/grassland biome transition zone is a cross-regional ecosystem, that has desert to grassland characteristics. It is also very fragile and sensitive to climate change [2]. Studying the development and changes of the desert/grassland biome transition zone is of great significance for exploring the impacts of human activities and climate factors on changes in the surface environment in arid and semi-arid regions. To date, relatively few studies have focused on the desert/grassland biome transition zone, and their research topics mainly focus on the following aspects: first, long-term studies of the vegetation phenology of the desert/grassland biome transition zone from the perspective of climate change [2]; second, investigations of soil microbial community structures and metabolic characteristics in the desert/grassland biome transition zone [3]; and third, studies of the vegetation species in the desert/grassland biome transition zone [4].
The Sahel region of Africa is a sensitive area and is vulnerable to climate change. This area is most severely affected by the process of desertification. In order to curb the spread of desertification, the “Great Green Wall” (GGW) of Africa was proposed in 2007. This comprises a continuous tree belt across the Sahel region. The plan is to build a 15 km wide, 7775 km long shelterbelt, passing through Senegal, Mauritania, Mali, Nigeria, Niger, Chad, Sudan, Burkina Faso, Ethiopia, Eritrea, and Djibouti [5]. The tree belt was designed to regulate the temperature along the route, reduce wind speed and soil erosion, and increase the humidity of the local agricultural microclimate [6]. This project involves all aspects of the environmental ecologies and social economies of the participating countries. The “Great Green Wall” tree belt is close to the desert/grassland biome transition zone in the Sahel region of Africa. Analysis of the temporal and spatial changes in the normalized difference vegetation index (NDVI) in the desert/grassland biome transition zone of the Sahel region of Africa permits the investigation of the response mechanisms of vegetation in arid and semi-arid areas to climate change and human activities, which is significant for theoretical guidance regarding sustainable ecological construction in the Sahel region.
To date, there have been many research achievements regarding analysis of long-term changes in vegetation driven by human activities and climate factors. Shi et al., used random forest regression and residual analysis methods to quantitatively analyze the contributions of climate factors and human activities to changes in vegetation in China’s shelterbelt areas [7]. Wu et al., used partial derivatives to analyze the impacts of climate change and human activities on vegetation productivity [8]. Jiang et al., used correlation analysis to find that precipitation was the main driving factor for vegetation growth and changes in the farming–pastoral ecotone in northern China [9]. Huang et al., evaluated the quantitative contributions of climate change and changes in human activity on vegetation coverage, based on the support vector machine model [10]. Yan et al., used multiple linear regression, spatial autocorrelation, and other methods to quantitatively determine the degree to which human activity affects the NDVI; their study has further deepened the understanding of the interactions between the factors that affect NDVI [11].
In summary, climate factors (temperature and precipitation) and human activities are the two main driving forces for vegetation change [12]. Various evaluation methods and models have emerged for measuring the degree of influence of various driving factors on vegetation growth and changes. However, current research mostly focuses on areas with lush vegetation; there have been only a few studies on the response mechanisms of vegetation to human activities and climate factors in arid and semi-arid areas, especially in the desert/grassland biome transition zone. Thus, the main objectives of this study are as follows: (1) investigate the climatic factors and NDVI variation trend from 1982 to 2015; (2) identify the impacts of climatic factors and human activities on the NDVI variation; (3) explore the spatial variation trend of the desert/grassland biome transition zone in the future. Furthermore, this study may provide a theoretical reference for the construction of the “Great Green Wall” ecological project in the desert/grassland biome transition zone in the Sahel region.

2. Materials and Methods
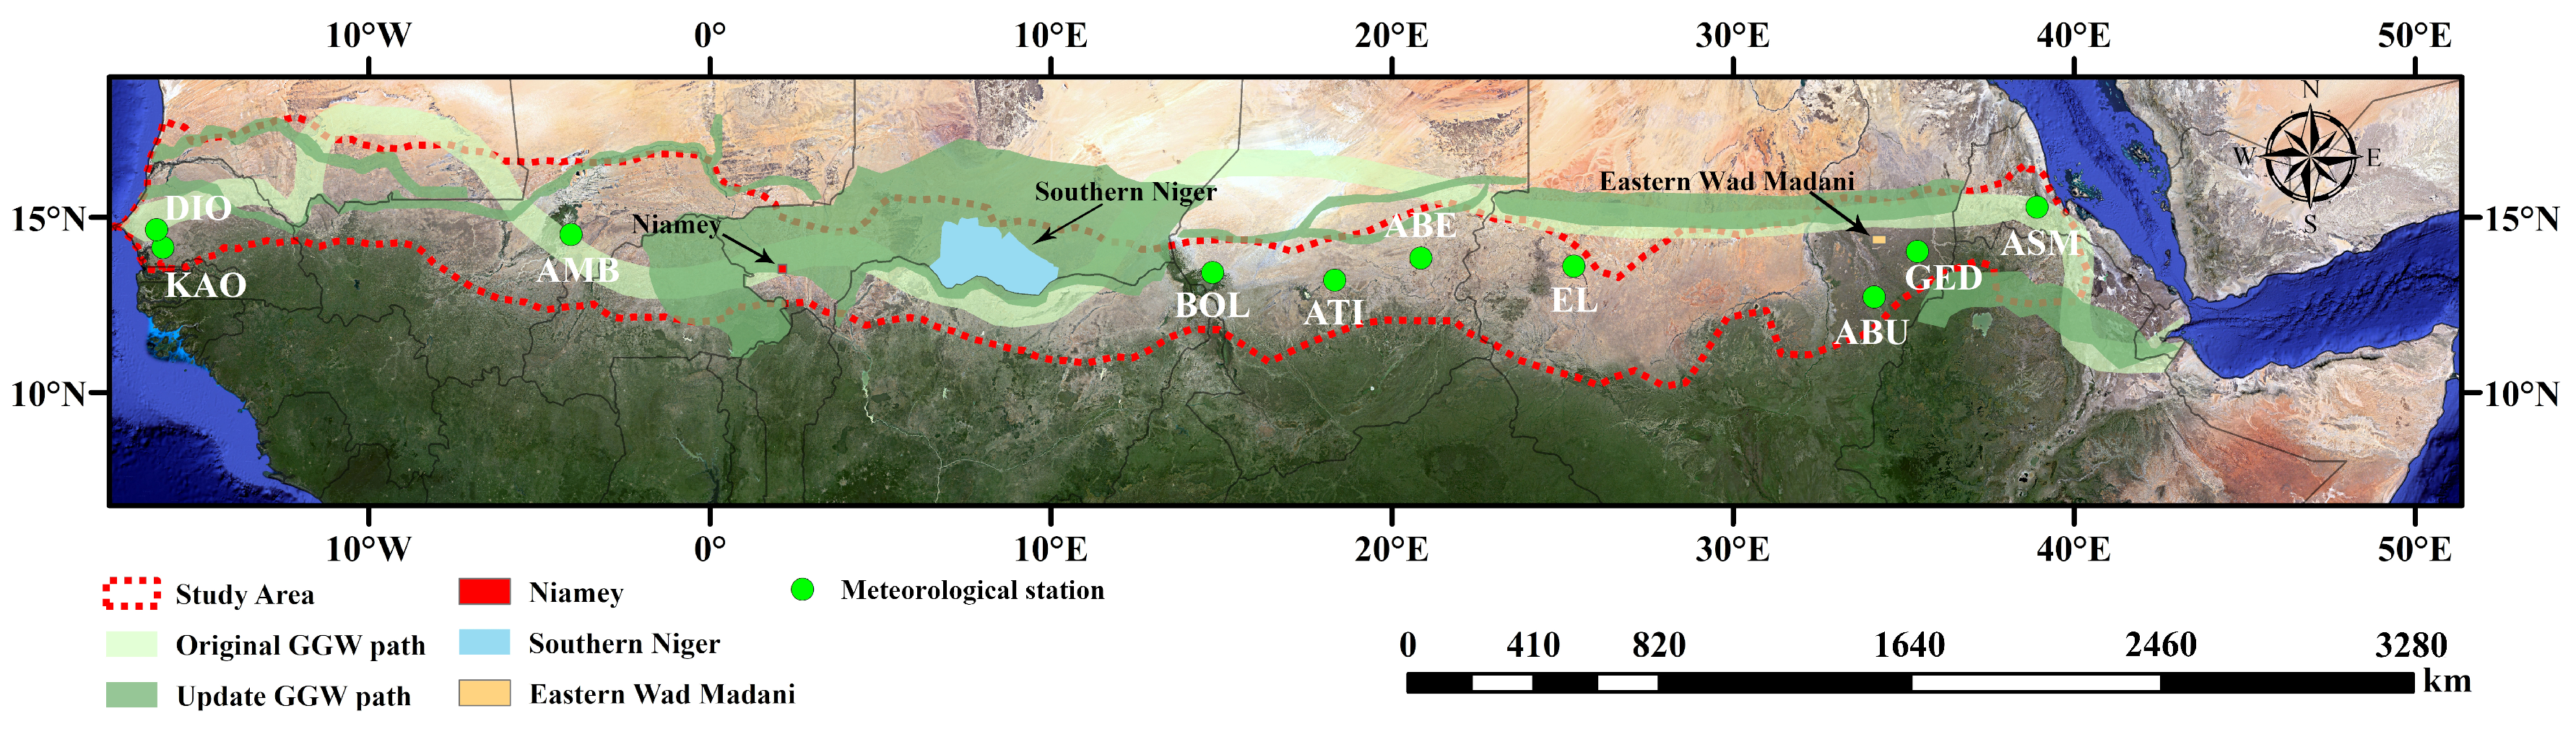
2.1. Study Area

The Sahelian desert/grassland biome transition zone is a semi-arid zone between the Sahara Desert and the Sudan savanna zone. It is a trans-regional ecological system [2]. The zone starts from the Atlantic Ocean in the west and reaches the Red Sea in the east. Its length is approximately 6000 km from east to west, and it passes through Mauritania, Mali, Burkina Faso, Algeria, Niger, Chad, Nigeria, South Sudan, and Ethiopia. The terrain of this area comprises undulating plateaus; the climate is dry and hot, and the precipitation varies greatly from north to south. At the same time, the annual precipitation varies greatly between the dry and wet seasons; the precipitation is mostly concentrated in the period from June to September. The average precipitation in the Sahel region of Africa (the transition zone from desert to grassland) is 150 mm to 600 mm/year, and the average precipitation in the Sudan savanna zone is 600–1200 mm/year. The Sahel region of Africa is approximately 6000 km from east to west, and approximately 300 km wide. The vegetation in the desert/grassland biome transition zone of the Sahel region comprises open herbaceous plants mixed with woody plants, but there are relatively few types of woody plants [13]. The climate in the Sahel region of Africa is arid, and wind and sand disasters are common. Due to the rapid population growth in the Sahel region, the area taken up by arable and pastoral land continues to expand, leading to the deterioration of the ecological environment and the intensification of desertification. In order to cope with the environmental status caused by human activities and climate change in the Sahel region, the strategic concept of the GGW was proposed, as explained in Section 1. Later, this idea gradually developed into the current GGW plan. In Figure 1, the green area represents the scope of the current GGW plan. The light green area represents the current scope of the previous GGW plan. It can be seen that the study area of the desert/grassland biome transition zone in the Sahel region of Africa is at a similar latitude to the GGW project, and they overlap each other in some areas.

2.2. Data Processing and Analysis Methods

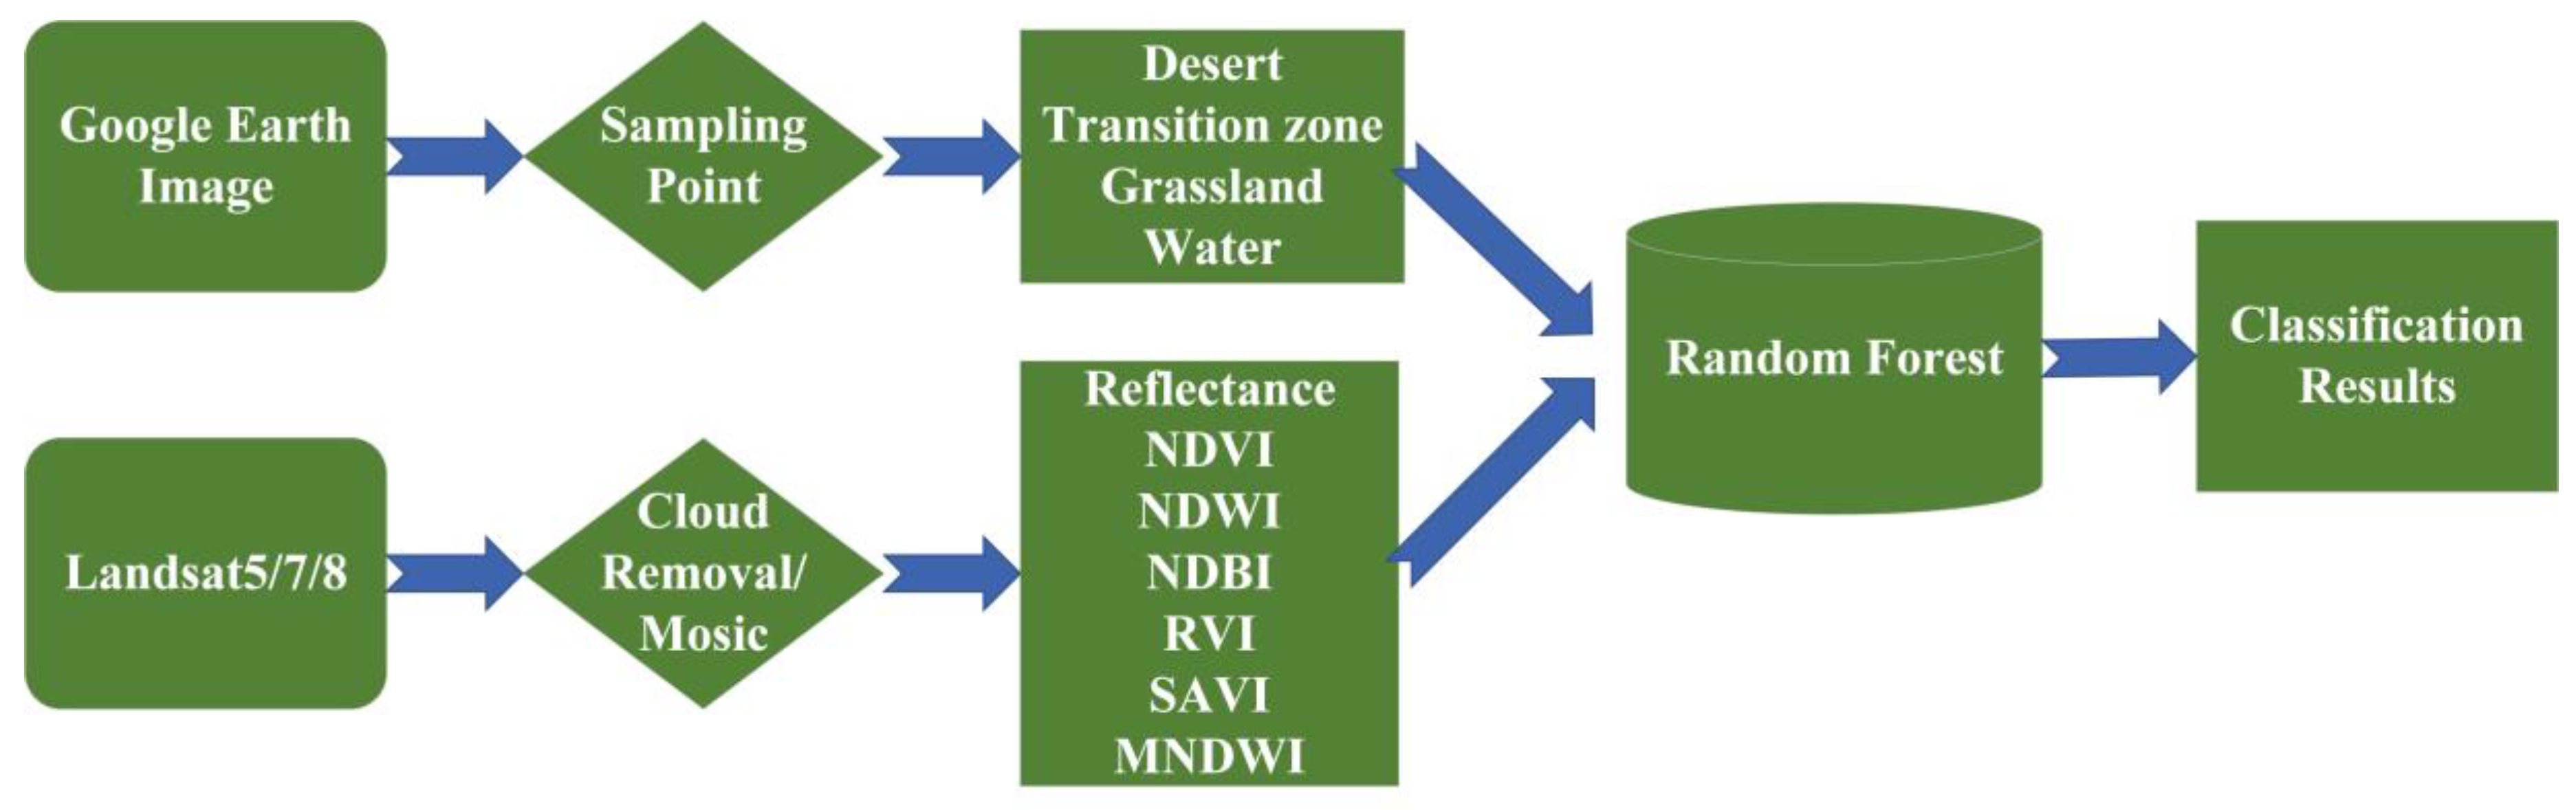
2.2.1. Remote-Sensing Data and Processing

The NDVI data were obtained from the long-term global vegetation data set produced by the Global Inventory Modelling and Mapping Studies (GIMMS) of the National Aeronautics and Space Administration (NASA). The data were preprocessed to eliminate the influence of atmospheric water vapor and volcanic eruptions. The NDVI time series used covered the period from 1981 to 2015, and its spatial resolution was 0.083°. We used the maximum value composites (MVC) method to obtain the monthly NDVI value [14]; then, we calculated the monthly average value of the NDVI. We used the monthly average as the NDVI value for each year. At the same time, the average values of NDVI in the four months of July, August, September, and October were extracted as the NDVI values of the growing season of the desert/grassland biome transition zone in the Sahel region, and these data were preprocessed for the trend analysis.
The remote-sensing data were obtained from the Landsat series data. We used the Google Earth Engine (GEE) computing platform to process the Landsat5, Landsat7, and Landsat8 data sets [15], these data sets were atmospherically corrected surface reflectance from the Landsat sensor. We created training samples based on Google Earth high-resolution images and the Landcover Global 30 m data. Finally, we used the random forest algorithm and the visual interpretation method to extract the range of the desert/grassland biome transition zone in 2001, 2010, and 2019. As the study area is very large, and some images are missing or the cloud cover is too large, multi-temporal data from adjacent years were used for splicing. The data in 2001 were spliced from June to October in 2000 and 2001. The data in 2010 were spliced from June to October in 2009 and 2011. The data in 2019 were spliced from June to October in 2019 and 2020. In order to reduce the impact of changes in data pixel values at different times in the same area, we used the median function from GEE to extract the median value for each pixel.

2.2.2. Meteorological Data and Processing

ERA5 data are fifth-generation analysis data newly developed by the European Centre for Medium-Range Weather Forecasts (ECMWF) which are an improvement on the ERA-Interim data. These are generated by assimilation of four-dimensional variational analysis (4D-Var) data in CY41R2 from ECMWF, and contains two-dimensional (2D) parameters such as precipitation and temperature [16]. We used mathematical calculations to obtain climate data in the vegetation growing season and throughout the year.
The data from meteorological stations play a very important role in the study of climate change on the small regional scale. We used the meteorological data set provided by National Centers for Environmental Information (NCEI), combined with the spatial location of the meteorological stations and the time series length of the data to select 10 stations, namely Abeche, Abu Na Ama, Ambodedjo, Asmara International, Ati, Bol Berim, Diourbel, El Fashir, Gedaref Azaza, and Kaolack. The specific locations of the meteorological stations are shown in Figure 1. The meteorological data which were provided by the 10 stations were used to extract the time and location of any “special event”, such as “sudden precipitation events”, “extremely low temperature events”, and “extremely high temperature events”, and we used the spatial location of each meteorological station as the central point. The 3 × 3-pixel NDVI data were cropped from the GIMMS data to analyze the impact of “sudden precipitation events”, “extremely high temperature events”, and “extremely low temperature events” on NDVI. The meteorological data were filtered for small fluctuations in the time series. Specifically, when investigating the impact of sudden precipitation events and extreme temperature events on NDVI, only small temperature and small precipitation fluctuations were searched for in the time series data, respectively. Following this rule, we selected 147 “sudden precipitation events”, 50 “extremely low-temperature events” and 50 “extremely high-temperature events”. Then, we compared the NDVI values in the meteorological station area before and after the “special event”.

2.2.3. Extraction Method for the Desert/Grassland Biome Transition Zone

We used the random forest algorithm to extract the desert/grassland biome transition zone based on the GEE. Figure 2 shows the specific extraction process. First, according to the historical Google Earth Pro images from 2001, 2010, 2019, and annual isohyet data, we visually interpreted 6315 training sampling points of water bodies, grassland, desert/grassland biome transition zone, and desert (Figure 3). Second, we calculated various remote-sensing indexes and with the reflectance data used for feature collection. The calculations of various remote-sensing indexes are shown in Table 1. Consequently, we used a total of 299,504 Landsat5, Landsat7, and Landsat8 remote-sensing images to define desert, grassland, desert/grassland biome transition zone, and water bodies. The classification results of the three phases were compared with Google Earth Pro software high resolution data for manual vectorization extraction to ensure the accuracy of the classification results to the greatest extent possible. The final results were close to the desert/grassland biome transition zone extracted from the previous meteorological data and NDVI data [2].
NDVI is the normalized difference vegetation index, NDWI is the normalized difference water index, NDBI is the normalized difference building index, RVI is the ratio vegetation index, SAVI is the soil-adjusted vegetation index, MNDWI is the modified normalized difference water index, NIR is the near-infrared reflectance, R is the red reflectance, MIR is the mid-infrared reflectance, Green is the green reflectance, and L is a soil adjustment parameter set to reduce the influence of the soil background. The value of L changes with the density of vegetation. Huete believes that when the value of L is 0.5 in a large area of sparse vegetation coverage, the effect of eliminating soil background is the best [17].

2.2.4. Analysis Method

(1)
Correlation, partial correlation, and multiple correlation analysis
Correlation analysis is used to study the degree of correlation between two or more random variables in the same position. We used correlation analysis, partial correlation analysis, and multiple correlation analysis to study the relationships between NDVI and climate factors in the desert/grassland biome transition zone. The NDVI data comprised the annual average NDVI values and the climate data comprised annual cumulative precipitation and annual mean temperature data from ERA5.
(2)
Volatility analysis
The coefficient of variation (CV) was used to reflect the relative fluctuation of NDVI and climate factors in the desert/grassland biome transition zone from 1982 to 2015.
(3)
Linear regression
The linear regression method was used to analyze the interannual trend change of NDVI in the study area from 1982 to 2015, which reflects the overall and local changes of vegetation in the desert/grassland biome transition zone.
(4)
Mann–Kendall trend test
The Mann–Kendall (M–K) trend test method is a non-parametric test method proposed by H.B. Mann and M.G. Kendall [18,19]. It has been widely used in meteorological fields. The advantage of the M–K test is that the sample sequence does not need to obey a certain distribution, and it can accurately reflect the distribution trend of the time series.
In the M–K trend test, the null hypothesis H0 is time series data (X1, X2, X3, …); the formula is as follows:
β = median ( X j X i j i ) , i < j , τ = 4 P n ( n 1 ) 1 , σ τ 2 = n ( n 1 ) ( 2 n + 5 ) 18 , Z = τ σ τ ,
where n is the length of the time series; τ and σ τ are factors of Z; Z is Kendal rank correlation test coefficient; a positive Z value has an upward trend, and a negative Z value signifies a downward or decreasing trend. When Z > 1.64, 1.96, 2.58, this means that the time series has passed the 90%, 95%, and 99% confidence tests, respectively.
(5)
Multiple regression residual analysis
Many studies have used multiple regression residual methods to analyze the driving influence of climate change and human activities on the NDVI of the growing season [20,21]. Here, the steps were as follows: First, we used climate data (precipitation and temperature) as the independent variable and NDVI as the dependent variable; then, we established a binary linear regression model to calculate various parameters of the model. Second, we calculated the predicted value of NDVI (NDVICC) based on the climate data and the parameters of the regression model. NDVICC was used to represent the value of NDVI under the influence of climate change. Finally, we calculated the difference between the predicted value of NDVI and the observed value of NDVI to measure the impact of human activities (e.g., afforestation, expanded impervious area, abandoned land, cropland degradation) on vegetation (NDVIHA). This study method, combined with the linear regression analysis method, can quantitatively analyze the relative impact of human activities and climate change on vegetation. We calculated the linear trend rates of NDVICC and NDVIHA, which can directly reflect the driving factors of vegetation change in various regions in the desert/grassland biome transition zone, under the background of human activities and climate change. The relative contribution rate of climate change and human activities to NDVI changes can be calculated.
The specific calculation formula is as follows:
N D V I C C = a × T + b × P + c , N D V I H A = N D V I o b s N D V I C C ,
where N D V I C C refers to the predicted value of NDVI based on the regression model prediction, and N D V I o b s refers to the observed value of NDVI based on remote sensing images; a, b, and c are model parameters; T and P refer to average temperature (°C) and precipitation (mm) of the growing season respectively; and N D V I H A is the residual.
(6)
Cellular automation (CA)-Markov model
The cellular automation (CA) model was developed by von Neumann to simulate the self-replication function of living systems. It uses a discrete spatial layout, and divides cells into a limited number of states. The evolution of the individual states of the cells is only related to the current state and the state of a local neighborhood. The specific formula is as follows:
S(t + 1) = f(S(t), N),
where S is a finite and discrete state set of cells, N is the neighborhood of the cell, and f is the transformation rule of the local cell state.
The Markov model was proposed by Andrey Markov in the 1940s. It is a dynamic random model that can predict the probability of future events by studying the law of change. The conversion process has the characteristics of being non-aftereffect and discreteness. The CA-Markov model organically combines the CA and the Markov models. First, the system transition matrix and the transition suitability image set are generated according to the Markov model. According to the distance from the center cell, the weight factor is determined, and the CA filter is constructed. Subsequently, the CA model conversion rules are constructed based on the system transition matrix to determine the iterative boundary conditions. Finally, the change in the center state of each cell is determined.
This study simulated the characteristics of future change trends in the desert/grassland biome transition zone, based on ArcMap10.6 software and IDRISI software. To reduce computing time, we resampled the classified data from 30 m spatial resolution into 0.01° spatial resolution. The transformation process was regarded as a Markov process, meaning that the desert, desert/grassland biome transition zone, grassland and water bodies could all convert to each other, and they all correspond to the “possible states” in the Markov process. However, the ratio of the mutual transformation of various land-cover types corresponds to the transfer area matrix and transfer probability matrix of land types. In the remote sensing interpretation map, each grid is a cell, and the feature type corresponding to the grid is the state of the cell. When we use the CA-Markov model for simulation prediction, the interval years between the initial, final, and forecast periods of the study should be kept as similar as possible, that is, the prediction interval should be equal. We used 2001 and 2010 classified data as benchmark data, and then predicted the spatial position of the desert/grassland biome transition zone in 2019, 2028, 2037, 2046, 2055.

3. Results

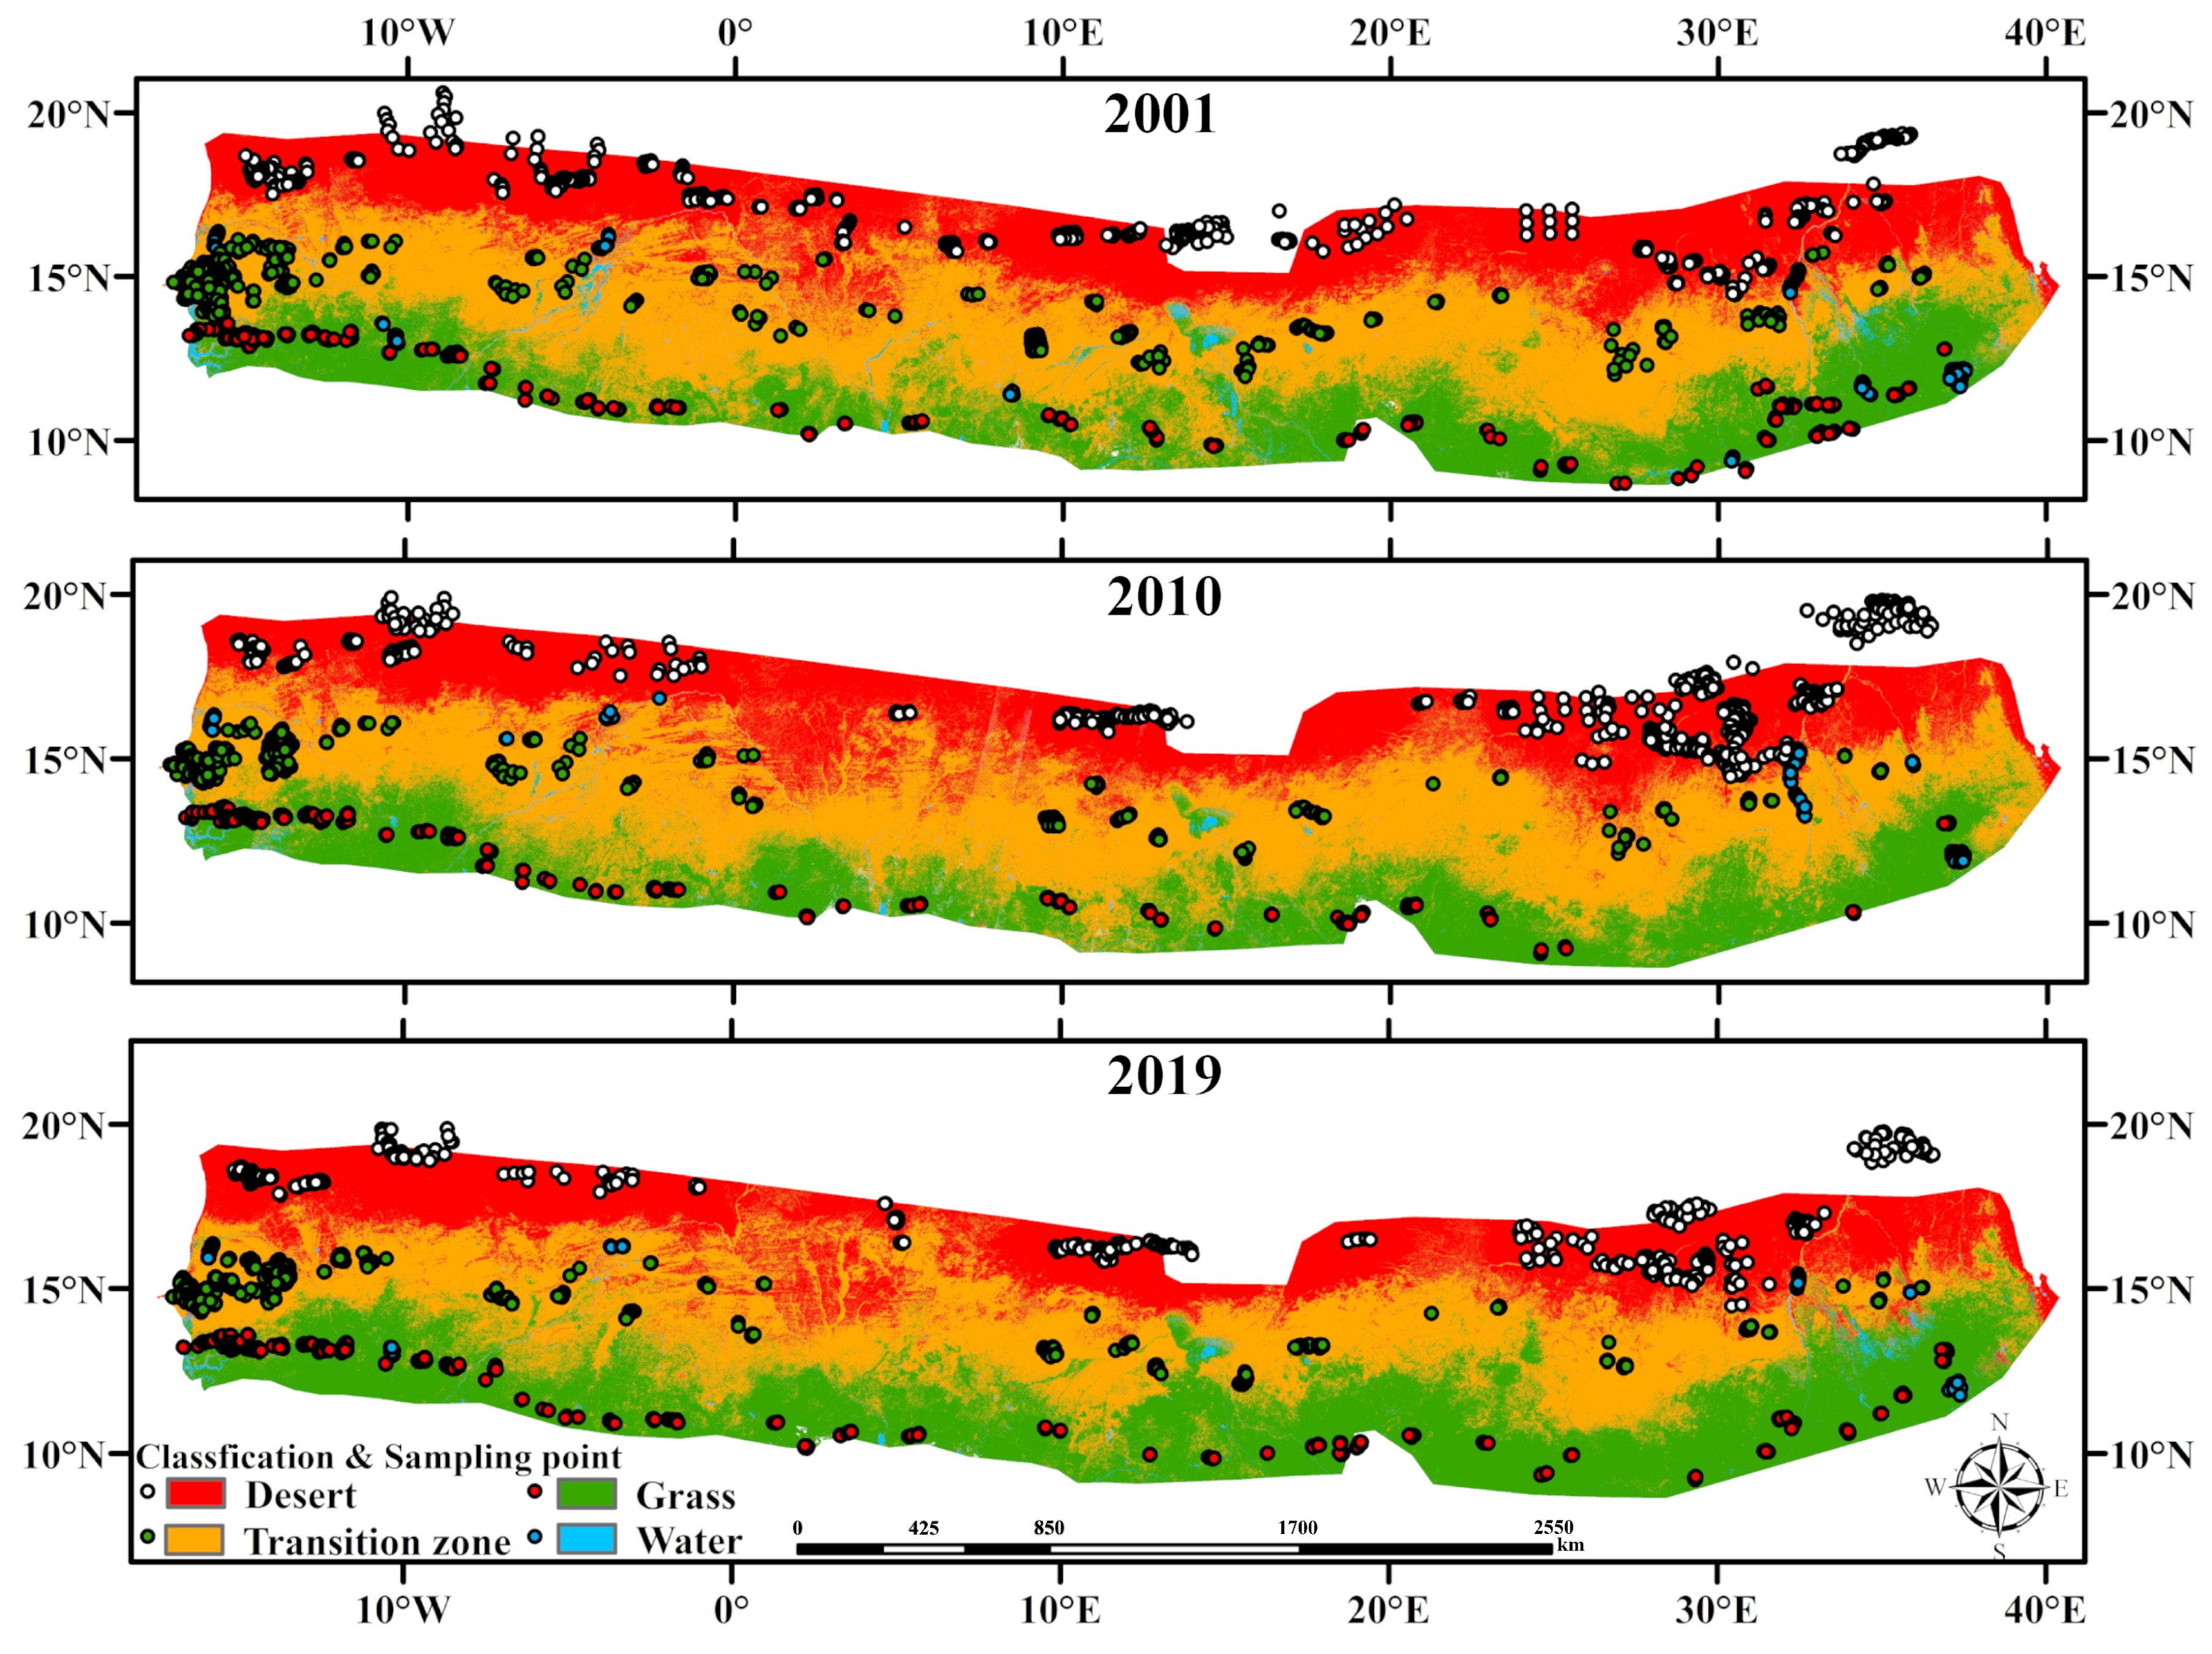
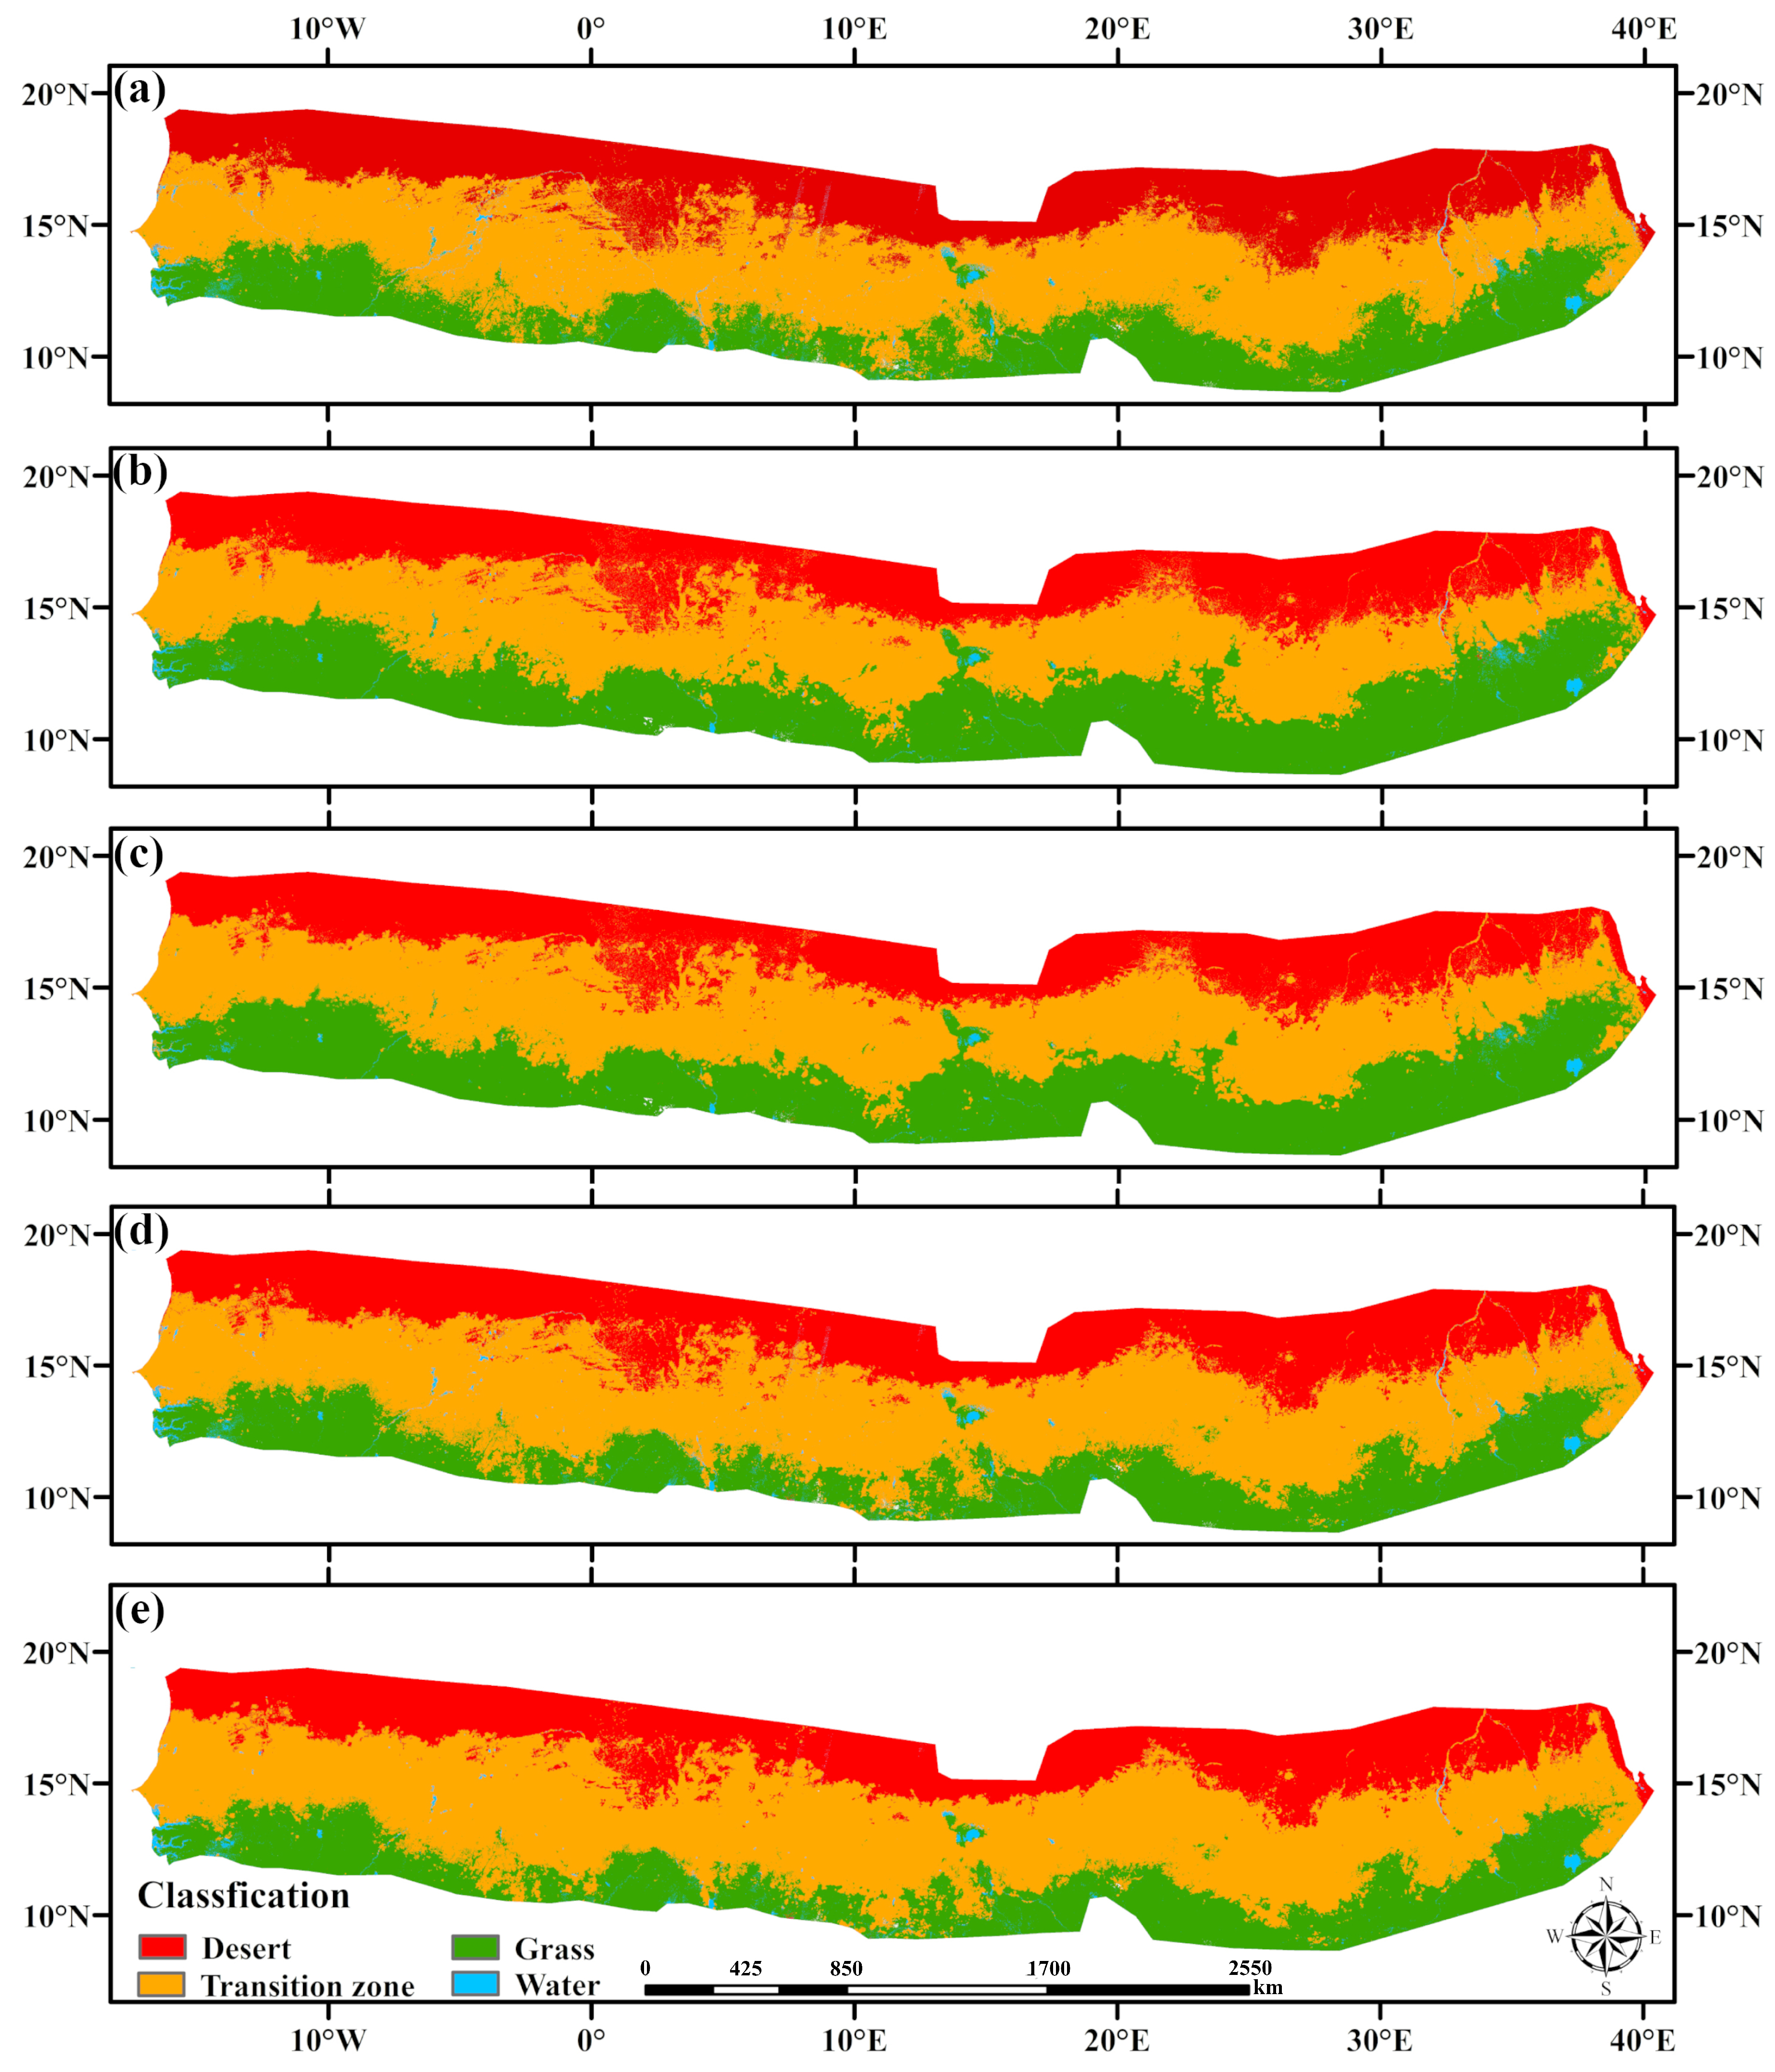
3.1. Changes of Desert/Grassland Biome Transition Zone

Figure 3 shows that the area of the desert/grassland biome transition zone has not been at a steady state over the years. As human activities and climatic factors changed, the area of the desert/grassland biome transition zone also continuously changed. The overall width of the desert/grassland biome transition zone is about 250 km, but the difference between the east and the west is very distinct. This is mainly manifested in the narrow width of the east-Kordofan Plateau and the Ethiopian Plateau. The plateau topography blocks gradient features of moisture and heat, which creates a landscape of “desert–desert/grassland–grassland” with non-zonal characteristics. In 2001–2019, the desert area in the entire region decreased by 10.1 × 10⁴ km2; the desert/grassland biome transition zone decreased by 33.5 × 10⁴ km2; the grassland area increased by 45.9 × 10⁴ km2; and the water body area decreased by 3.2 × 10⁴ km2. In general, the areas of desert, desert/grassland biome transition zone, and water bodies decreased, and the area of grassland increased.

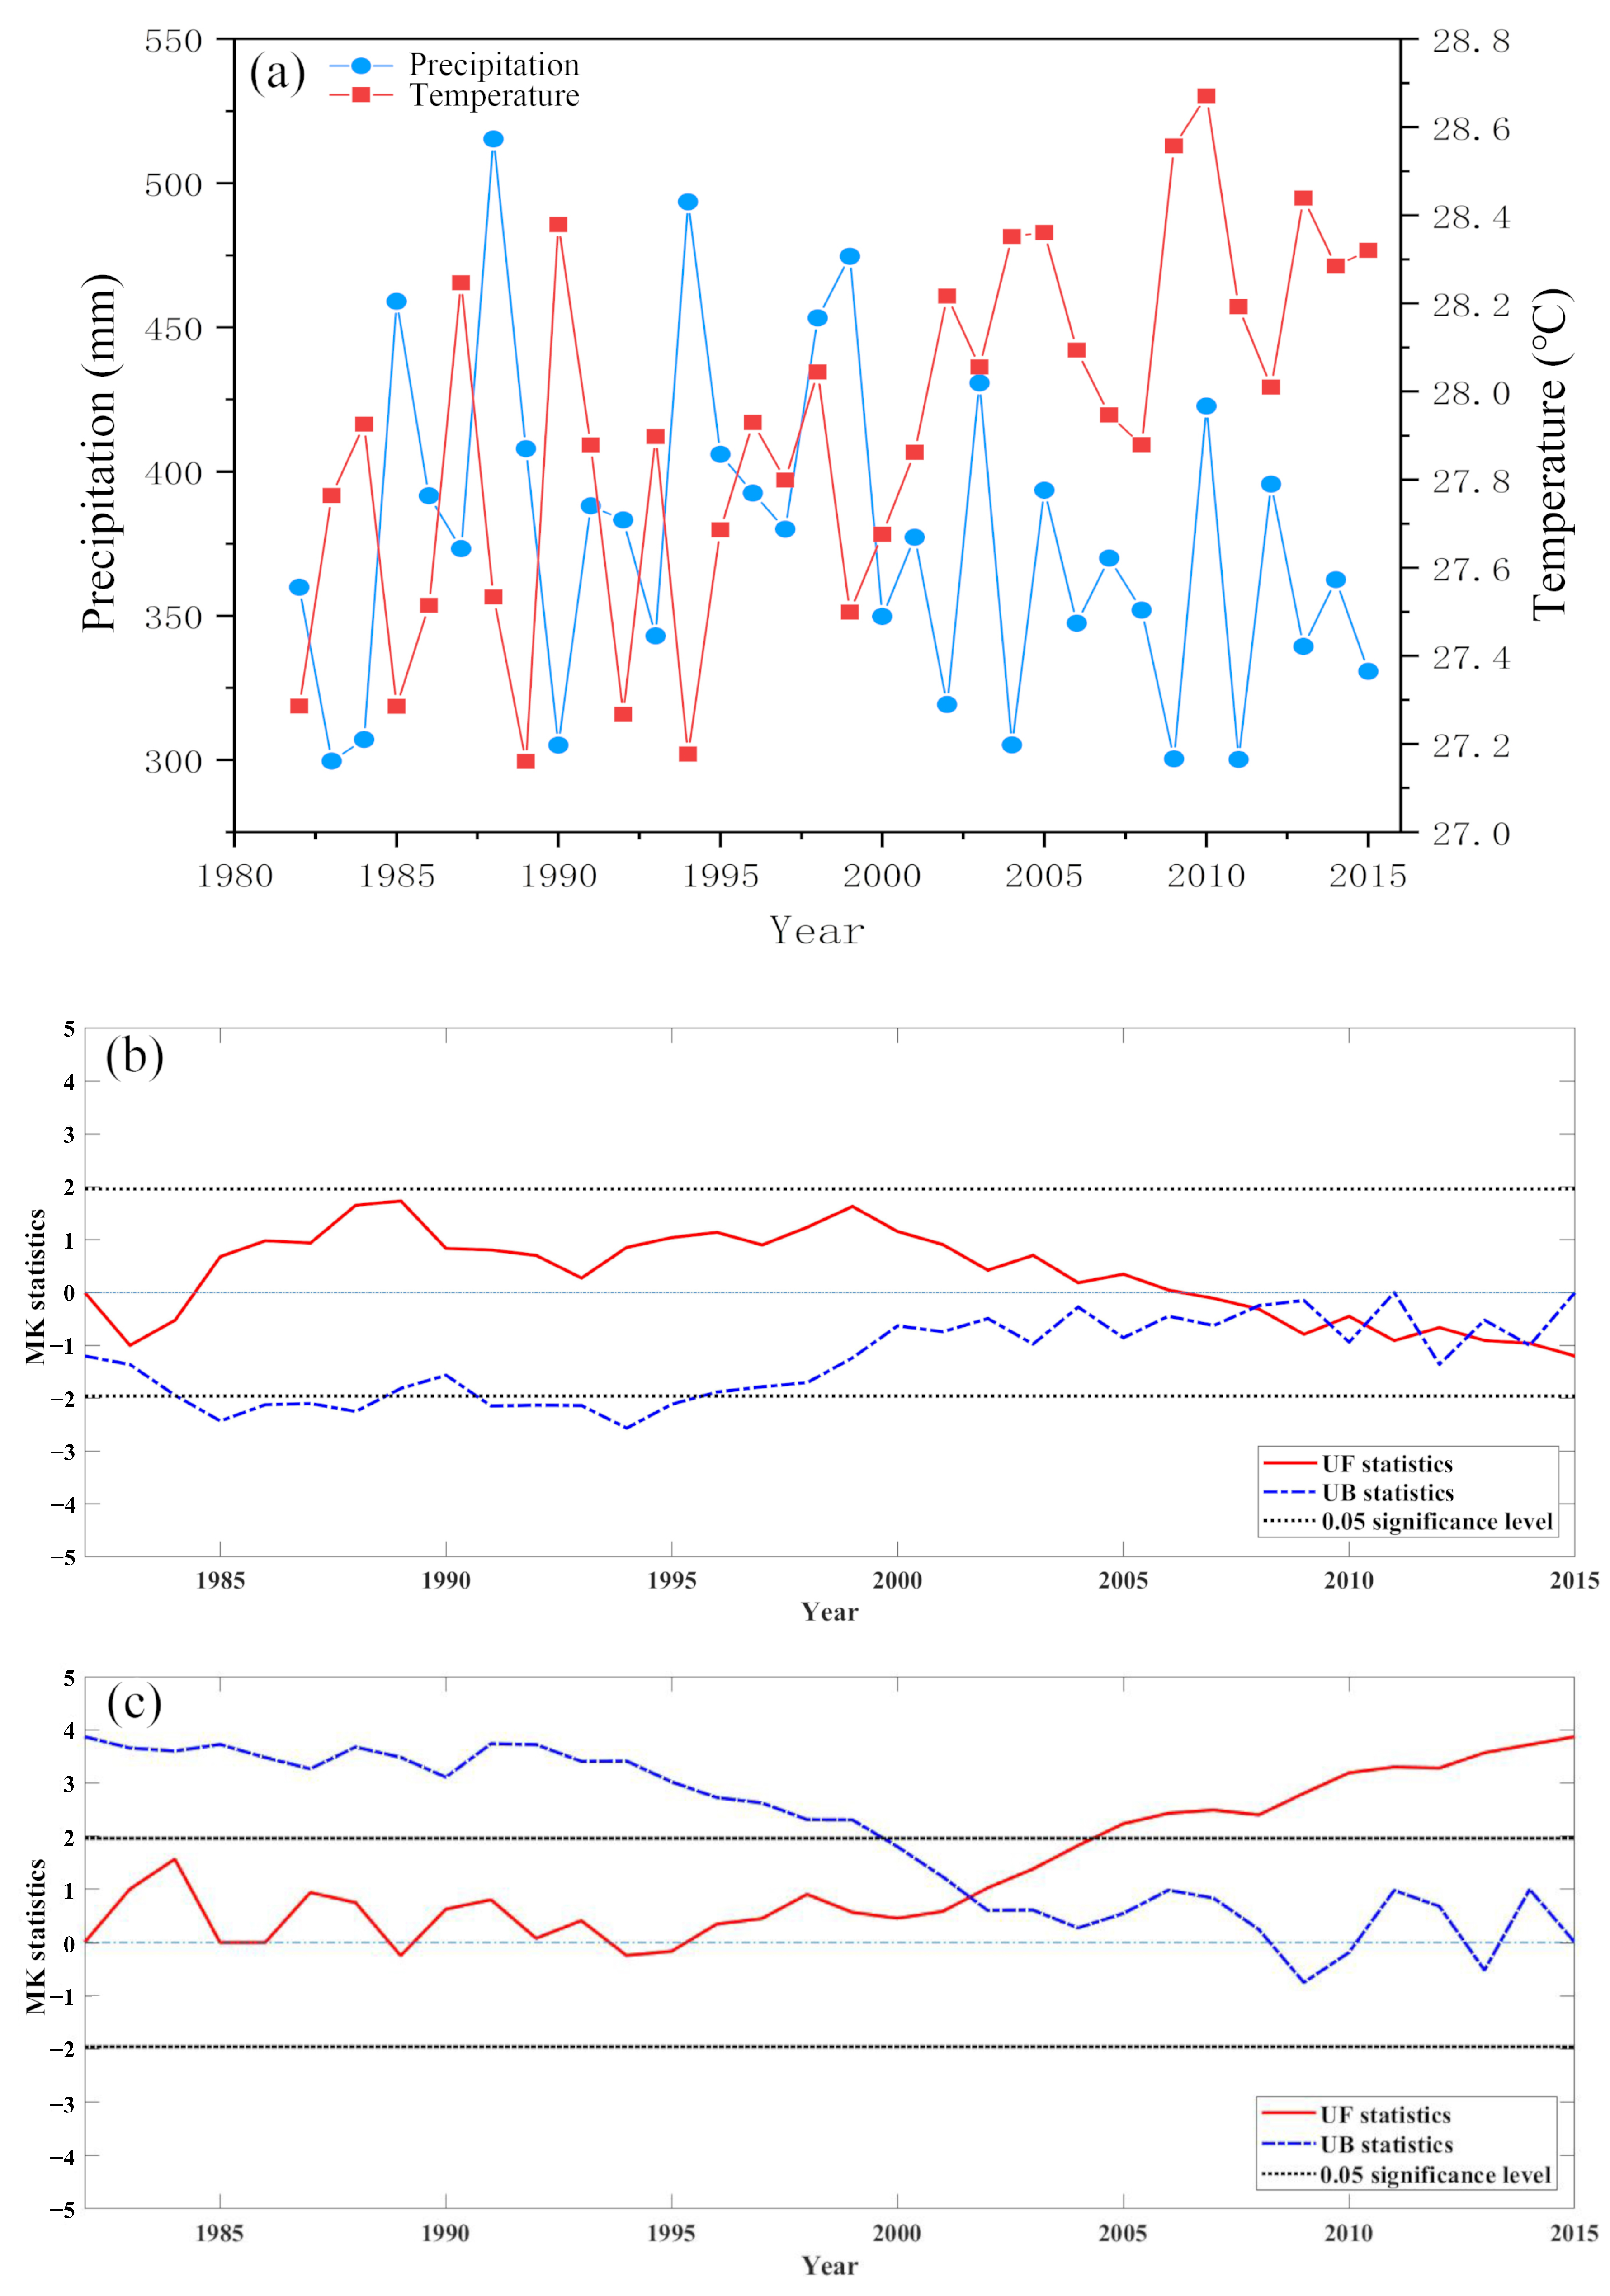
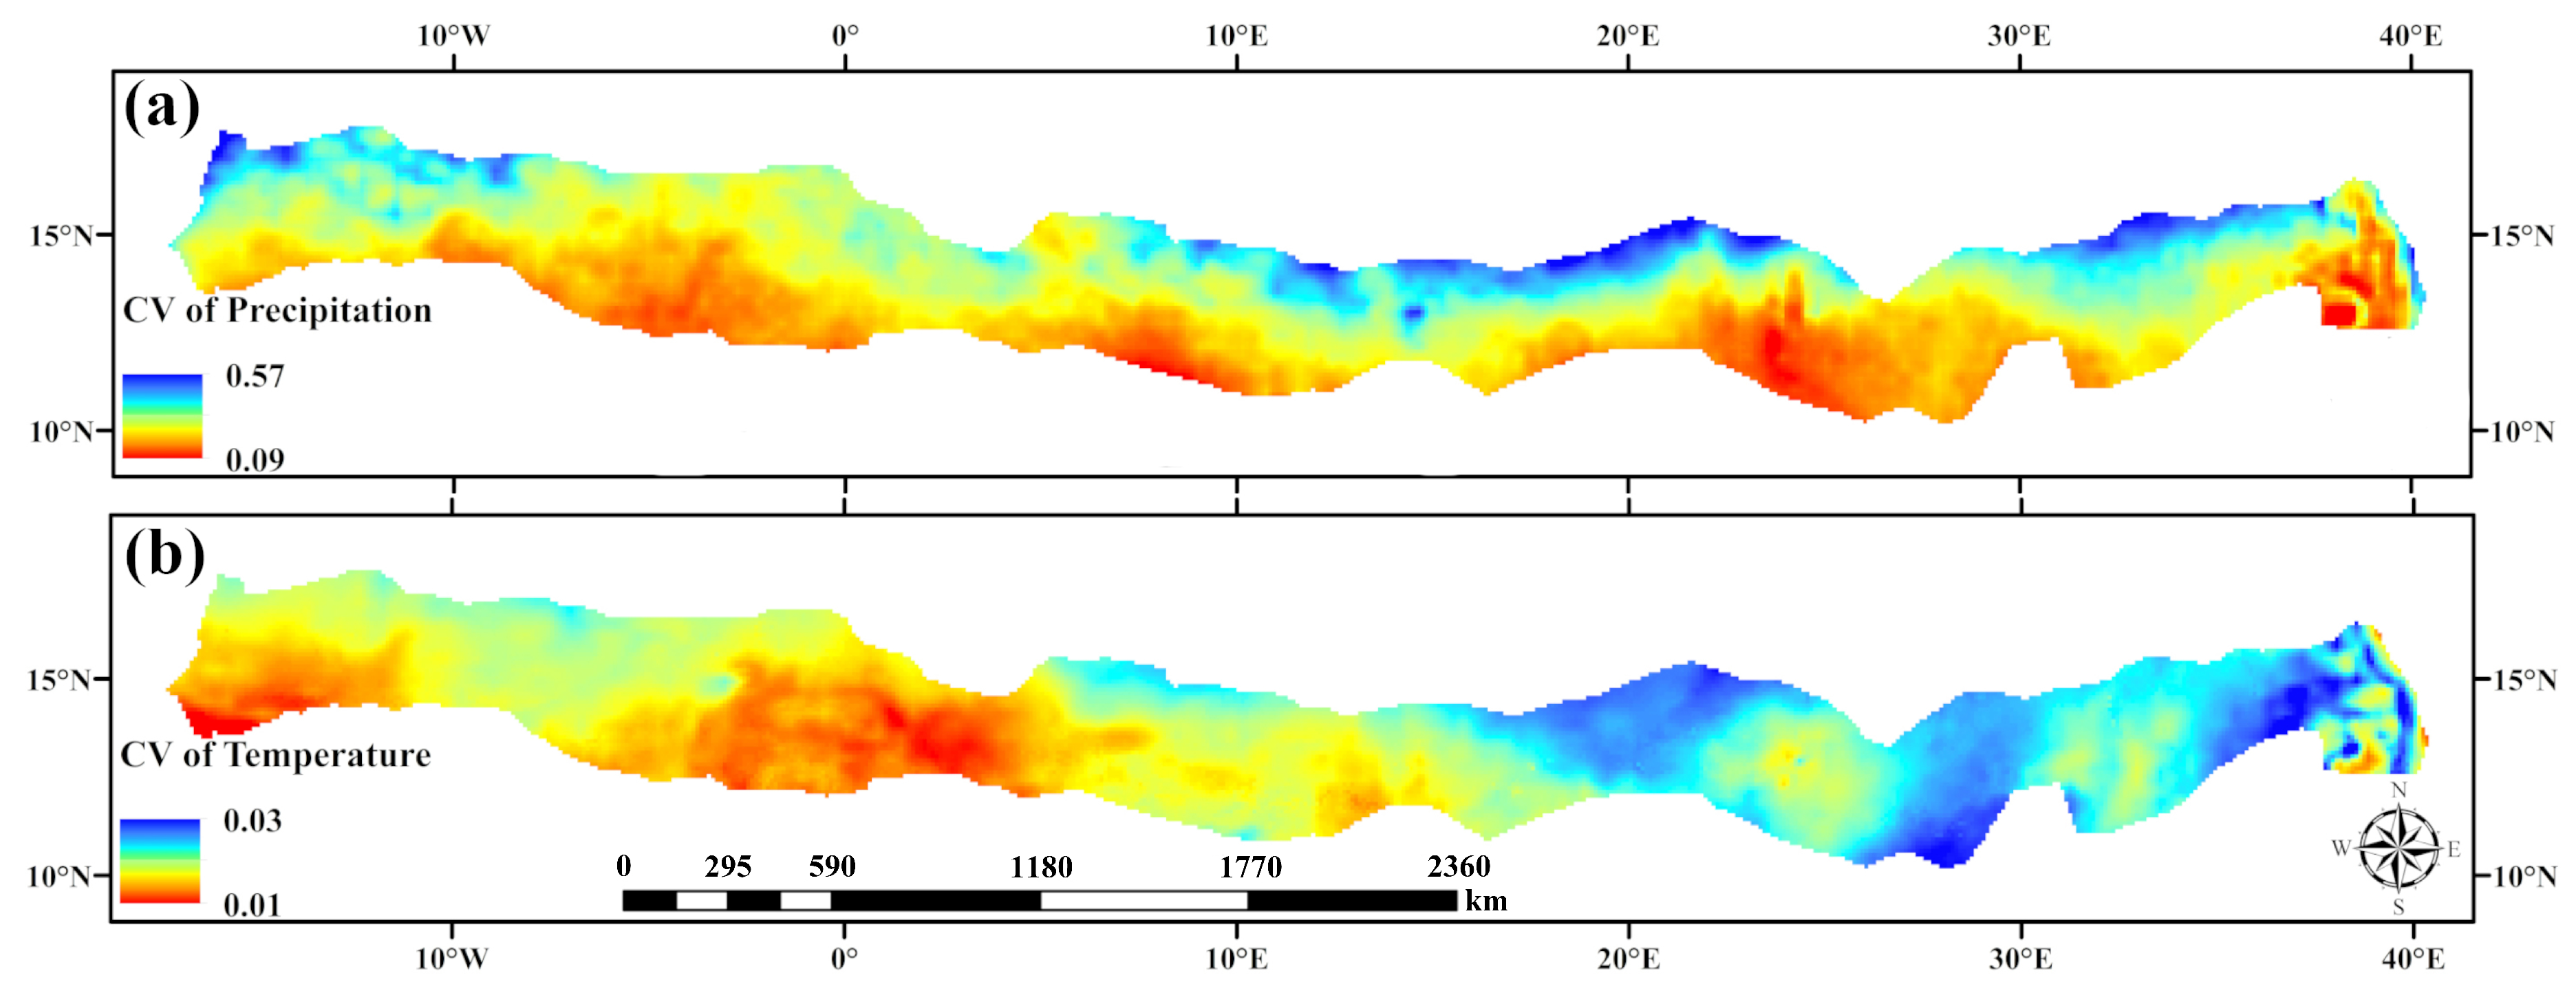
3.2. Climate Factors’s Trend in the Desert/Grassland Biome Transition Zone in the Sahel Region of Africa

3.2.1. Changes in Precipitation

Figure 4a shows that the annual average precipitation within the region from 1982 to 2015 was 377.37 mm, the maximum precipitation was 515.35 mm (1988), and the minimum precipitation was 299.67 mm (1983). Precipitation showed an insignificant downward trend. Figure 4b shows that in 1982–1998, the precipitation in the desert/grassland biome transition zone showed a fluctuating upward trend, whereas in 1999–2015, the precipitation showed a downward trend. UF and UB are the order statistics and reversed order statistics of the precipitation data, respectively. In the period 2008–2015, the UF and UB lines intersect many times; they lie between the critical lines, illustrating the volatility of precipitation. Figure 5a shows that the precipitation CV in the study area had a large spatial differentiation from north to south. The precipitation CV on the north side was larger than that on the south side, which may be related to the global convective cell and the monsoon circulation [22].

3.2.2. Changes in Temperature

Figure 4a shows that the annual average temperature from 1982 to 2015 was 27.9 °C, the maximum temperature was 28.7 °C (2010), and the minimum temperature was 27.2 °C (1989). The temperature showed an increasing trend, with a rate of 0.263 °C /10a. UF is the order statistics of the temperature data, UB is the reversed order statistics of the temperature data. According to Figure 4c, the year corresponding to the intersection of the UF and UB lines was 2002, indicating that the annual average temperature of the desert/grassland biome transition zone began to change suddenly in 2002. The annual temperature of the desert/grassland biome transition zone produced a significant sudden change in 2002. This shows that the temperature rise in the desert/grassland biome transition zone was significant. Figure 5b shows that the area with a large temperature CV was mainly distributed in the northern edge of the desert/grassland biome transition zone, whereas the southern edge of the transition zone exhibited relatively small interannual temperature changes. The desert/grassland biome transition zone was located in the intermediate transitional area between the desert and grassland areas. Its northern and southern boundaries in the desert/grassland biome transition zone belonged to different ecological regions, with differing temperature and precipitation, and the surface conditions of the north and south boundaries were obviously different. Different surface conditions result in different solar radiation transmission and energy absorption [23,24].
According to the analysis of the long-term sequence of temperature and precipitation factors in the desert/grassland biome transition zone, temperature in the desert/grassland biome transition zone showed an obvious rising trend, whereas the precipitation trend fluctuated greatly. Rising temperature and greater precipitation volatility were the overall characteristics of the climate in the desert/grassland biome transition zone. Furthermore, the transition zone was located in the transitional region of the two ecosystems, and it had a large span from east to west. The precipitation and temperature both showed obvious spatial stratified heterogeneity. Driven by climatic factors, vegetation in the desert/grassland biome transition zone also exhibited a certain regularity in its temporal and spatial changes [25].

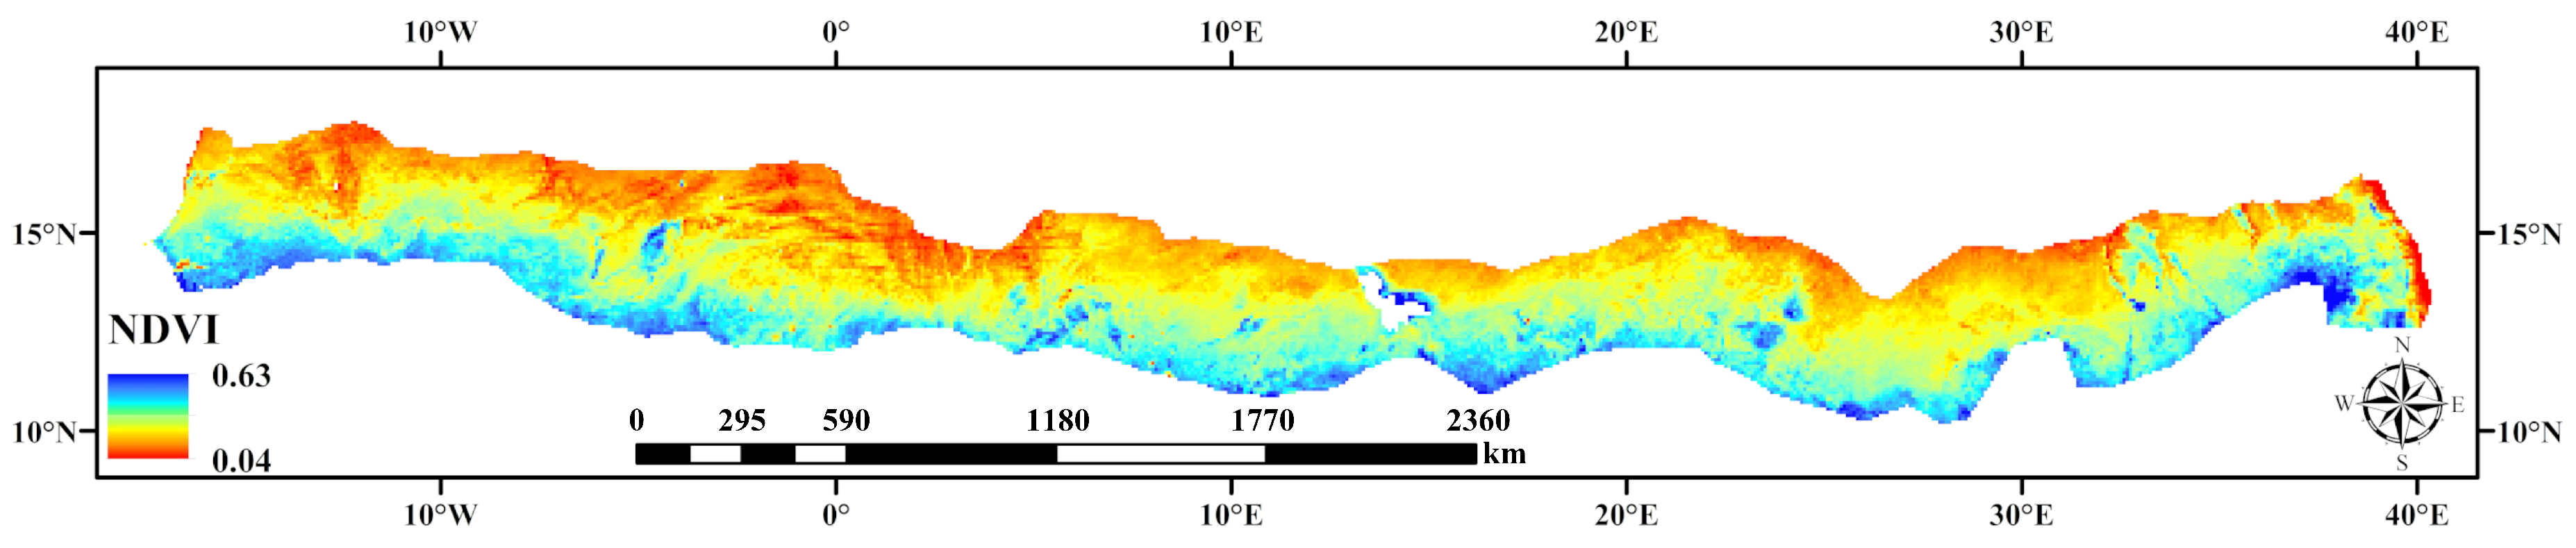
3.3. Temporal and Spatial Changes of Normalized Difference Vegetation Index (NDVI) in the Desert/Grassland Biome Transition Zone

3.3.1. NDVI in the Desert/Grassland Biome Transition Zone

Vegetation inherently reflects the state of the ecological environment and plays a role as a link in the terrestrial ecosystem. The NDVI obtained by remote sensing can accurately represent the temporal–spatial characteristics of vegetation.
In this study, we calculated the average value of NDVI in the desert/grassland biome transition zone from 1982 to 2015. Figure 6 shows that the NDVI of the desert/grassland biome transition zone exhibited spatial stratified heterogeneity. The desert/grassland biome transition zone was located between the tropical desert and savanna. The combination of moisture and heat showed an obvious gradient from north to south. The NDVI also showed gradient characteristics. The overall NDVI showed a gradual increase from north to south. The average NDVI of the desert/grassland biome transition zone was 0.25. The recorded vegetation was sparse, indicating a fragile ecological environment that is extremely vulnerable to human activities and climate change.

3.3.2. Seasonal Changes of NDVI in the Desert/Grassland Biome Transition Zone

We accumulated the NDVI data of the same month in different years and obtained the average value of each month. The yearly trend in NDVI grew from April to September, reaching its maximum value in September. From October to April of the next year, the NDVI value was in a state of decline, when the vegetation was in a state of withering, reaching its minimum value in April. Precipitation in the desert/grassland biome transition zone was very limited; it was concentrated in the period from July to September. The ratio of the highest value to the lowest value of NDVI throughout the year in the transition zone was 1.84, the CV during the year was 0.242, and the vegetation status varied greatly throughout the year.

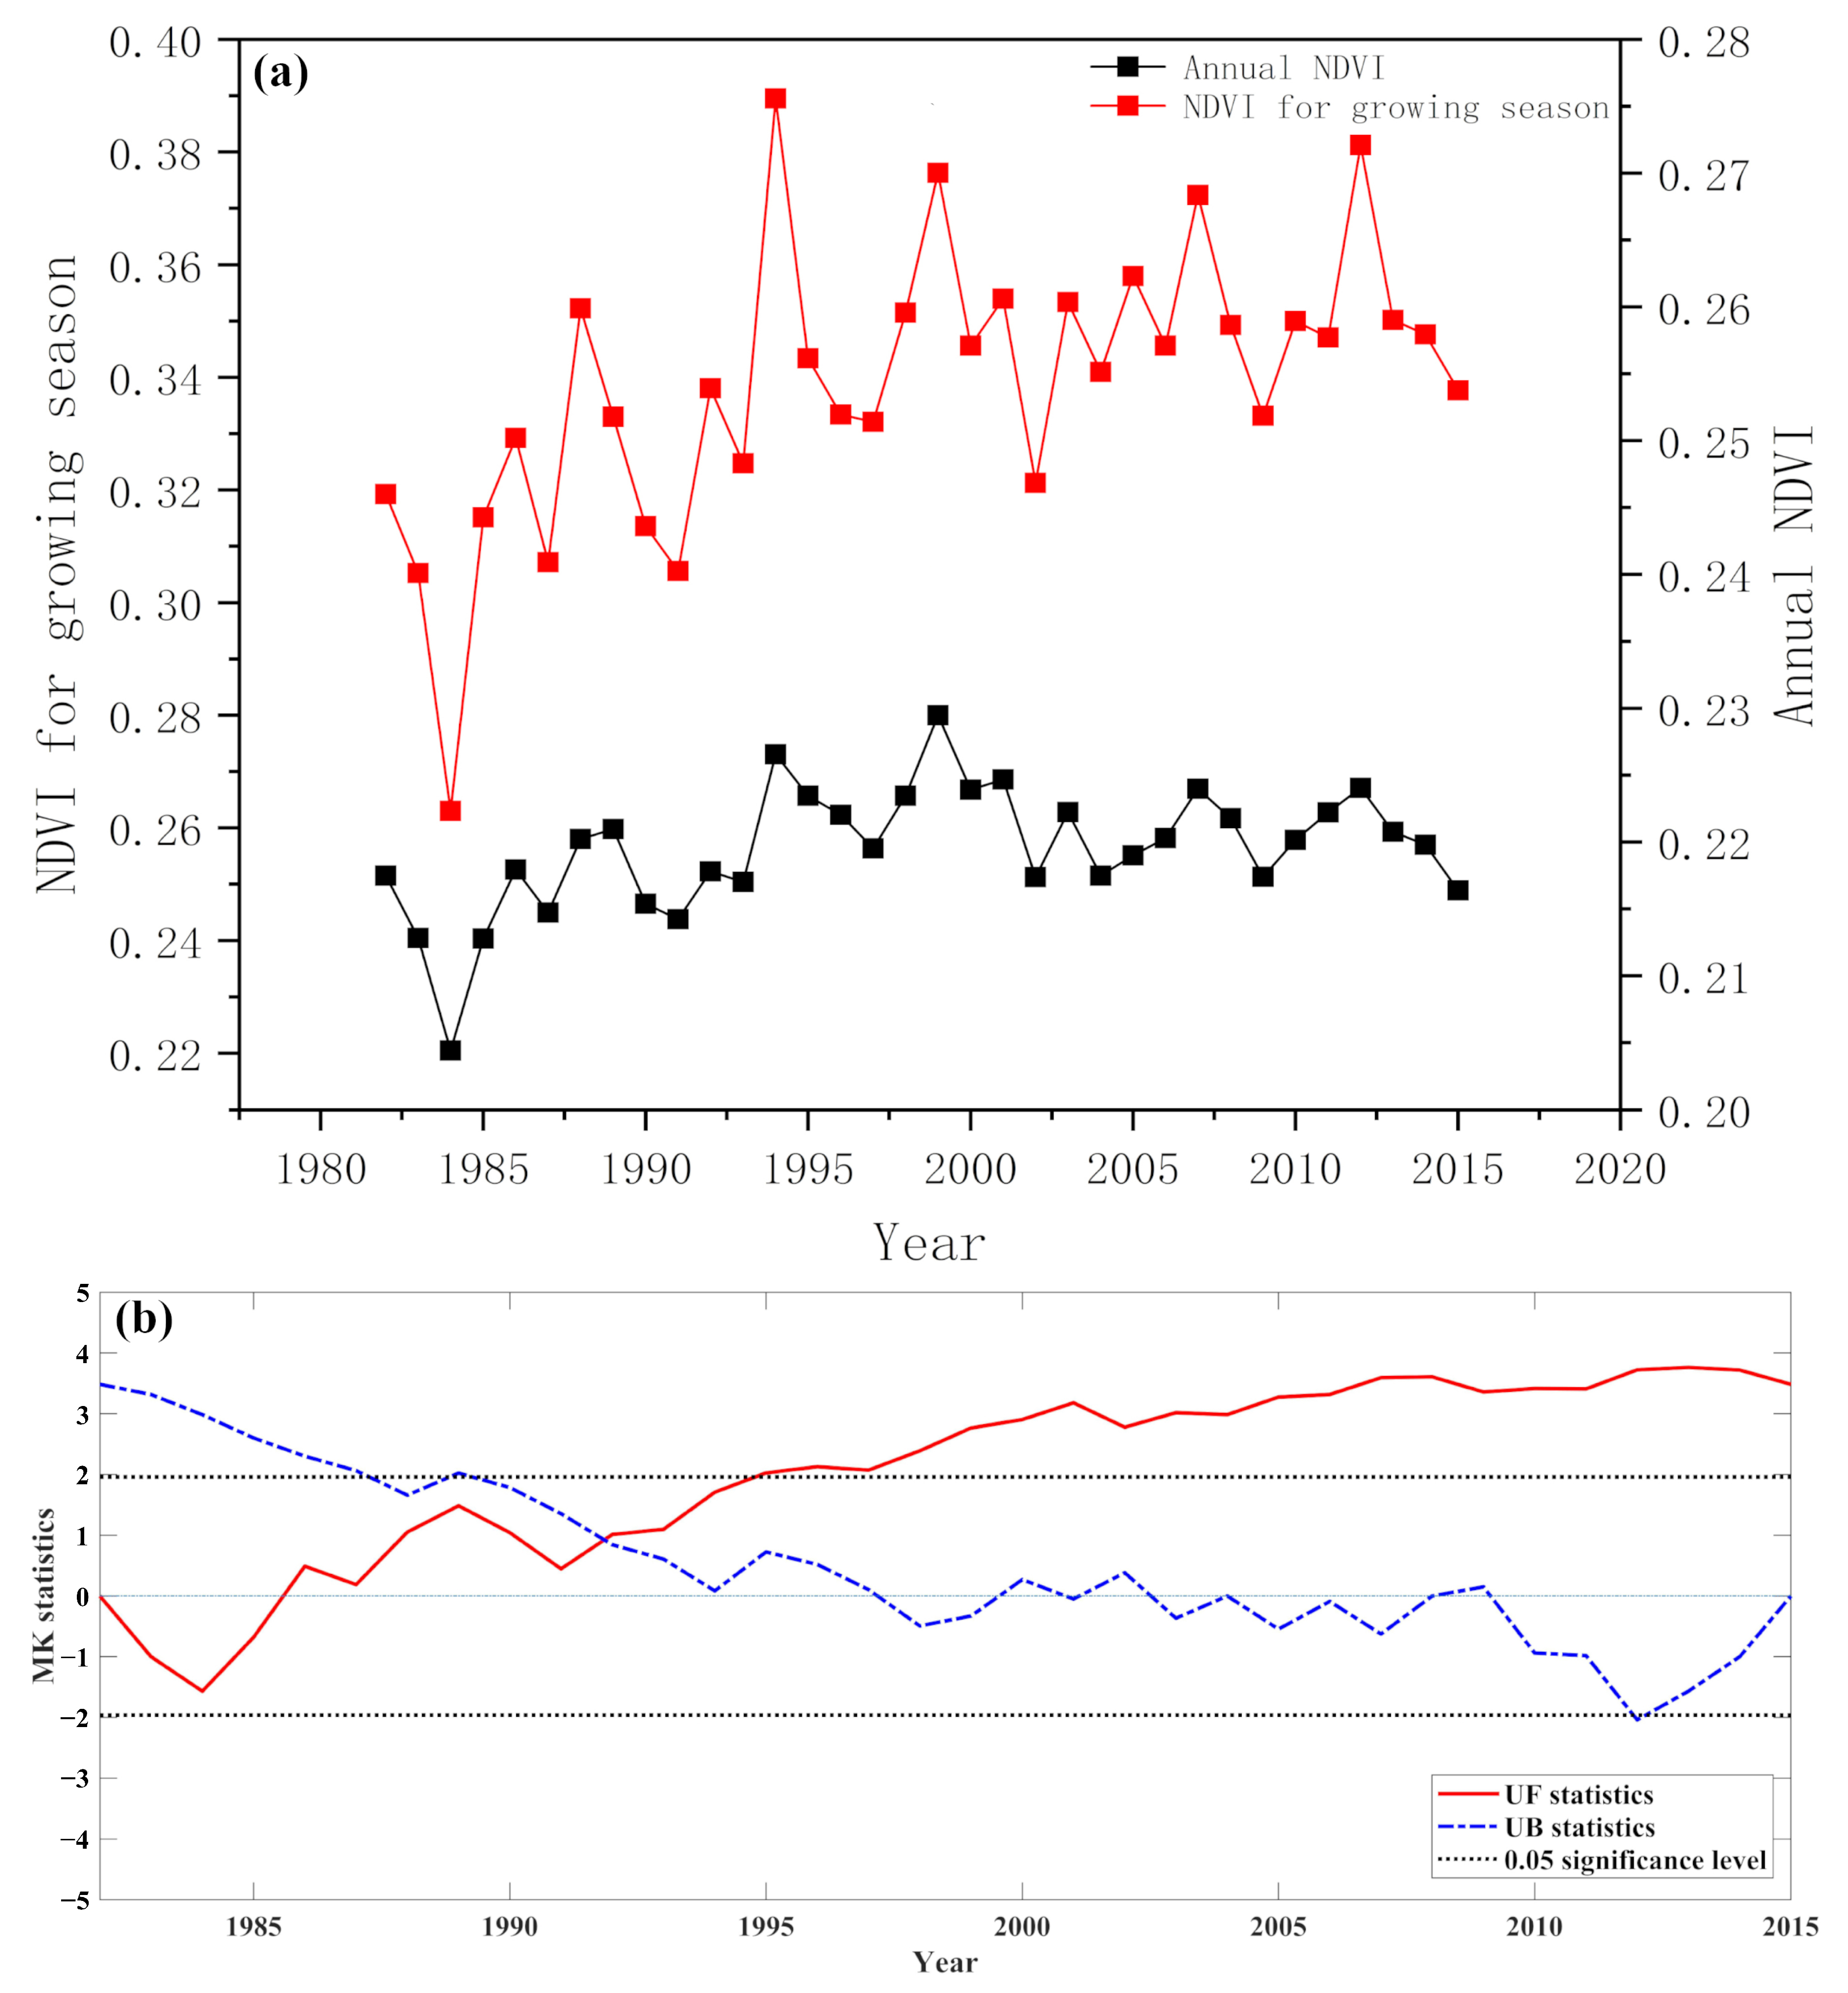
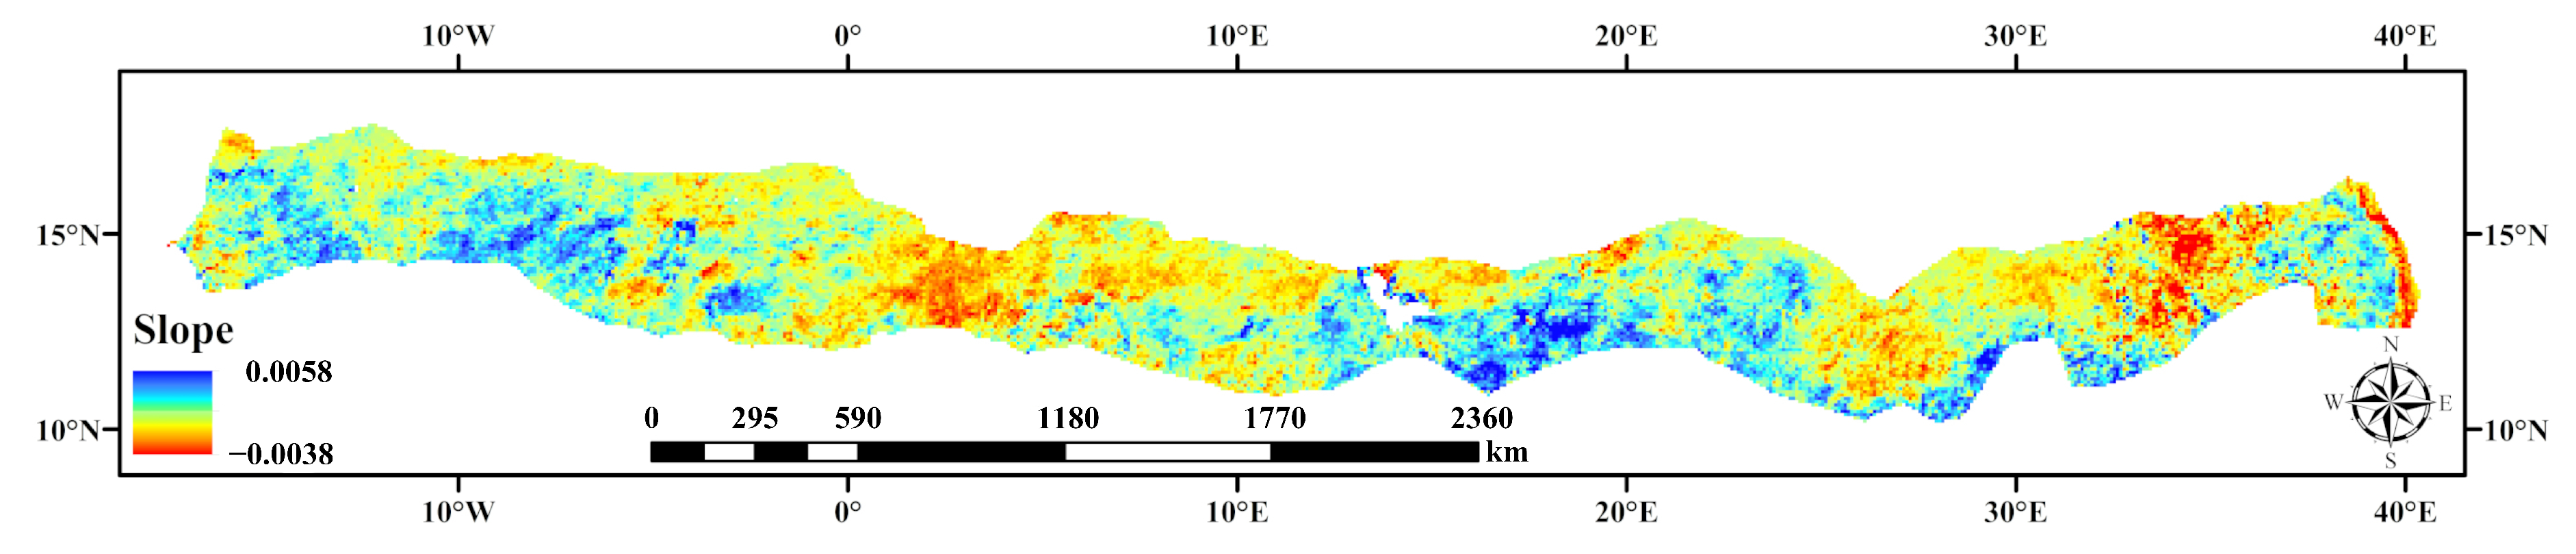
3.3.3. Interannual Trend Characteristics of NDVI in the Desert/Grassland Biome Transition Zone

Figure 7 shows the annual average NDVI of the desert/grassland biome transitional zone from 1982 to 2015. The NDVI in the growing season (July to October) showed a fluctuating increasing trend. Furthermore, the annual average NDVI and annual growing season NDVI had an obvious trend correlation. We used the NDVI in the growing season of the desert/grassland biome transition zone to analyze NDVI changes. From 1982 to 1995, the overall growth rate of NDVI in the growing season was relatively fast in the desert/grassland biome transition zone. From 1995 to 2015, although the overall NDVI in the study area was still increasing, the growth rate of NDVI in the growing season was significantly lower than that from 1982 to 1995. This may be due to the changing trend of precipitation. In 1982–2015, the highest NDVI value in the growing season of the desert/grassland biome transition zone was 0.39 (1994), and the lowest NDVI value of the growing season was 0.26 (1984). The average growth rate of NDVI in the desert/grassland biome transition zone in the Sahel region of Africa was 1.4 × 10⁻³ /a from 1982 to 2015, and the vegetation growth in the desert/grassland biome transition zone showed an overall upward trend.
Figure 8 shows that the trend of annual NDVI in the desert/grassland biome transition zone of the Sahel region of Africa demonstrated obvious spatial heterogeneity from 1982 to 2015. The area with increasing NDVI (slope > 0) accounted for 74.4% of the total area, the area with decreasing NDVI (slope < 0) accounted for 25.6% of the total area. In the desert/grassland biome transition zone, the growth rate from east to west showed the characteristics of “small–large–small–large.” Under the background of the overall greening of the desert/grassland biome transition zone, there were still some areas where vegetation appeared to be unchanged, or even to have degraded. This phenomenon may have been caused by the deterioration of the climate in a small area, or by the influence of human activities.
The study area covered 10 countries located close to the desert/grassland biome transition zone in total. The inter-annual variation in the annual NDVI in the desert/grassland biome regions of various countries showed an increasing trend; however, the vegetation growth state exhibited obvious spatial heterogeneity. Among these countries, Senegal’s desert/grassland biome transition zone had the fastest annual NDVI growth rate, with a trend rate of 0.9 × 10⁻³a−1. This was followed by Chad, with a trend rate of 0.8 × 10⁻³a−1. Niger and Sudan had slower NDVI growth rates, at 0.01 × 10⁻³a−1 and 0.3 × 10⁻³a−1, respectively. With the development of the “Great Green Wall” project in Africa, a total of 27,000 hectares of land have been restored in Senegal; there are also afforestation operations in Chad. Following, the comprehensive undertaking of human activities (in addition to climate factors), most of the vegetation in the desert/grassland biome transition zone of the countries along the route has shown a state of restoration.

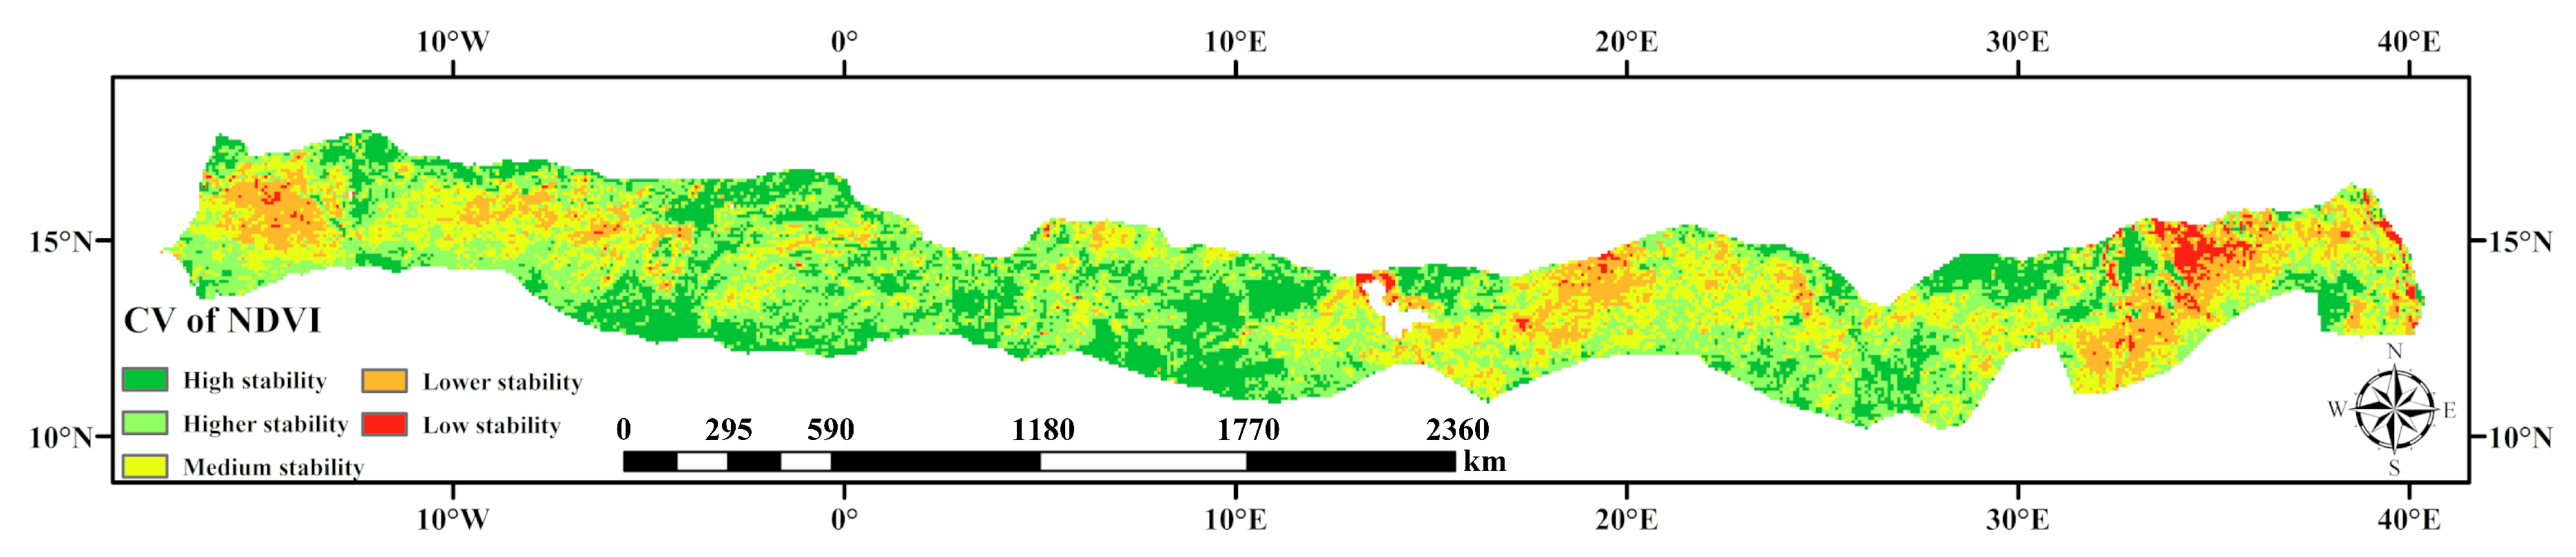
3.3.4. Interannual Fluctuation Characteristics of NDVI in the Desert/Grassland Biome Transition Zone

Figure 9 shows the temporal and spatial stability of NDVI in the desert/grassland biome transition zone in the Sahel region of Africa. We used the Jenks classification method to divide the NDVI coefficient of variation into five levels (Table 2). Among these, the distribution area of the higher stability grade was the largest, accounting for 35.31% of the total desert/grassland biome transition zone area. The areas with medium stability and high stability grades were also relatively large, accounting for 26.33% and 24.27% of the total desert/grassland biome transition zone area, respectively. The low stability and lower stability levels had smaller proportions, accounting for 2.05% and 12.03% of the desert/grassland biome transition zone area, respectively. This indicates that the interannual fluctuation characteristics of NDVI in the desert/grassland biome transition zone exhibited spatial differentiation. Verification of high-resolution images from Google Earth Pro and global land use products showed that the large regional coefficient of variations on the west side and the east side of the desert/grassland biome transition zone may have occurred owing to the proximity of human gathering areas and, thus, that human activities can have a great impact on vegetation changes. The NDVI CV around the Lake Chad basin was relatively large. This may be caused by the extremely unstable changes in the microclimate of the Lake Chad basin. Lake Chad is gradually shrinking under the influence of climate change and human activities, which will eventually affect the vegetation around it [26,27]. On the whole, high stability and higher stability areas were mainly distributed on the northern and southern sides of the desert/grassland biome transition zone, because the northern and southern sides were biased toward their respective steady-state systems (desert and grassland). The area with low stability and lower stability were mostly distributed in the “core part” of the entire transition zone. This was mainly owing to the fact that, under the influence of human disturbance and climate change, drastic changes are prone to occur in the fragile area between the two steady-state ecosystems (desert and grassland).

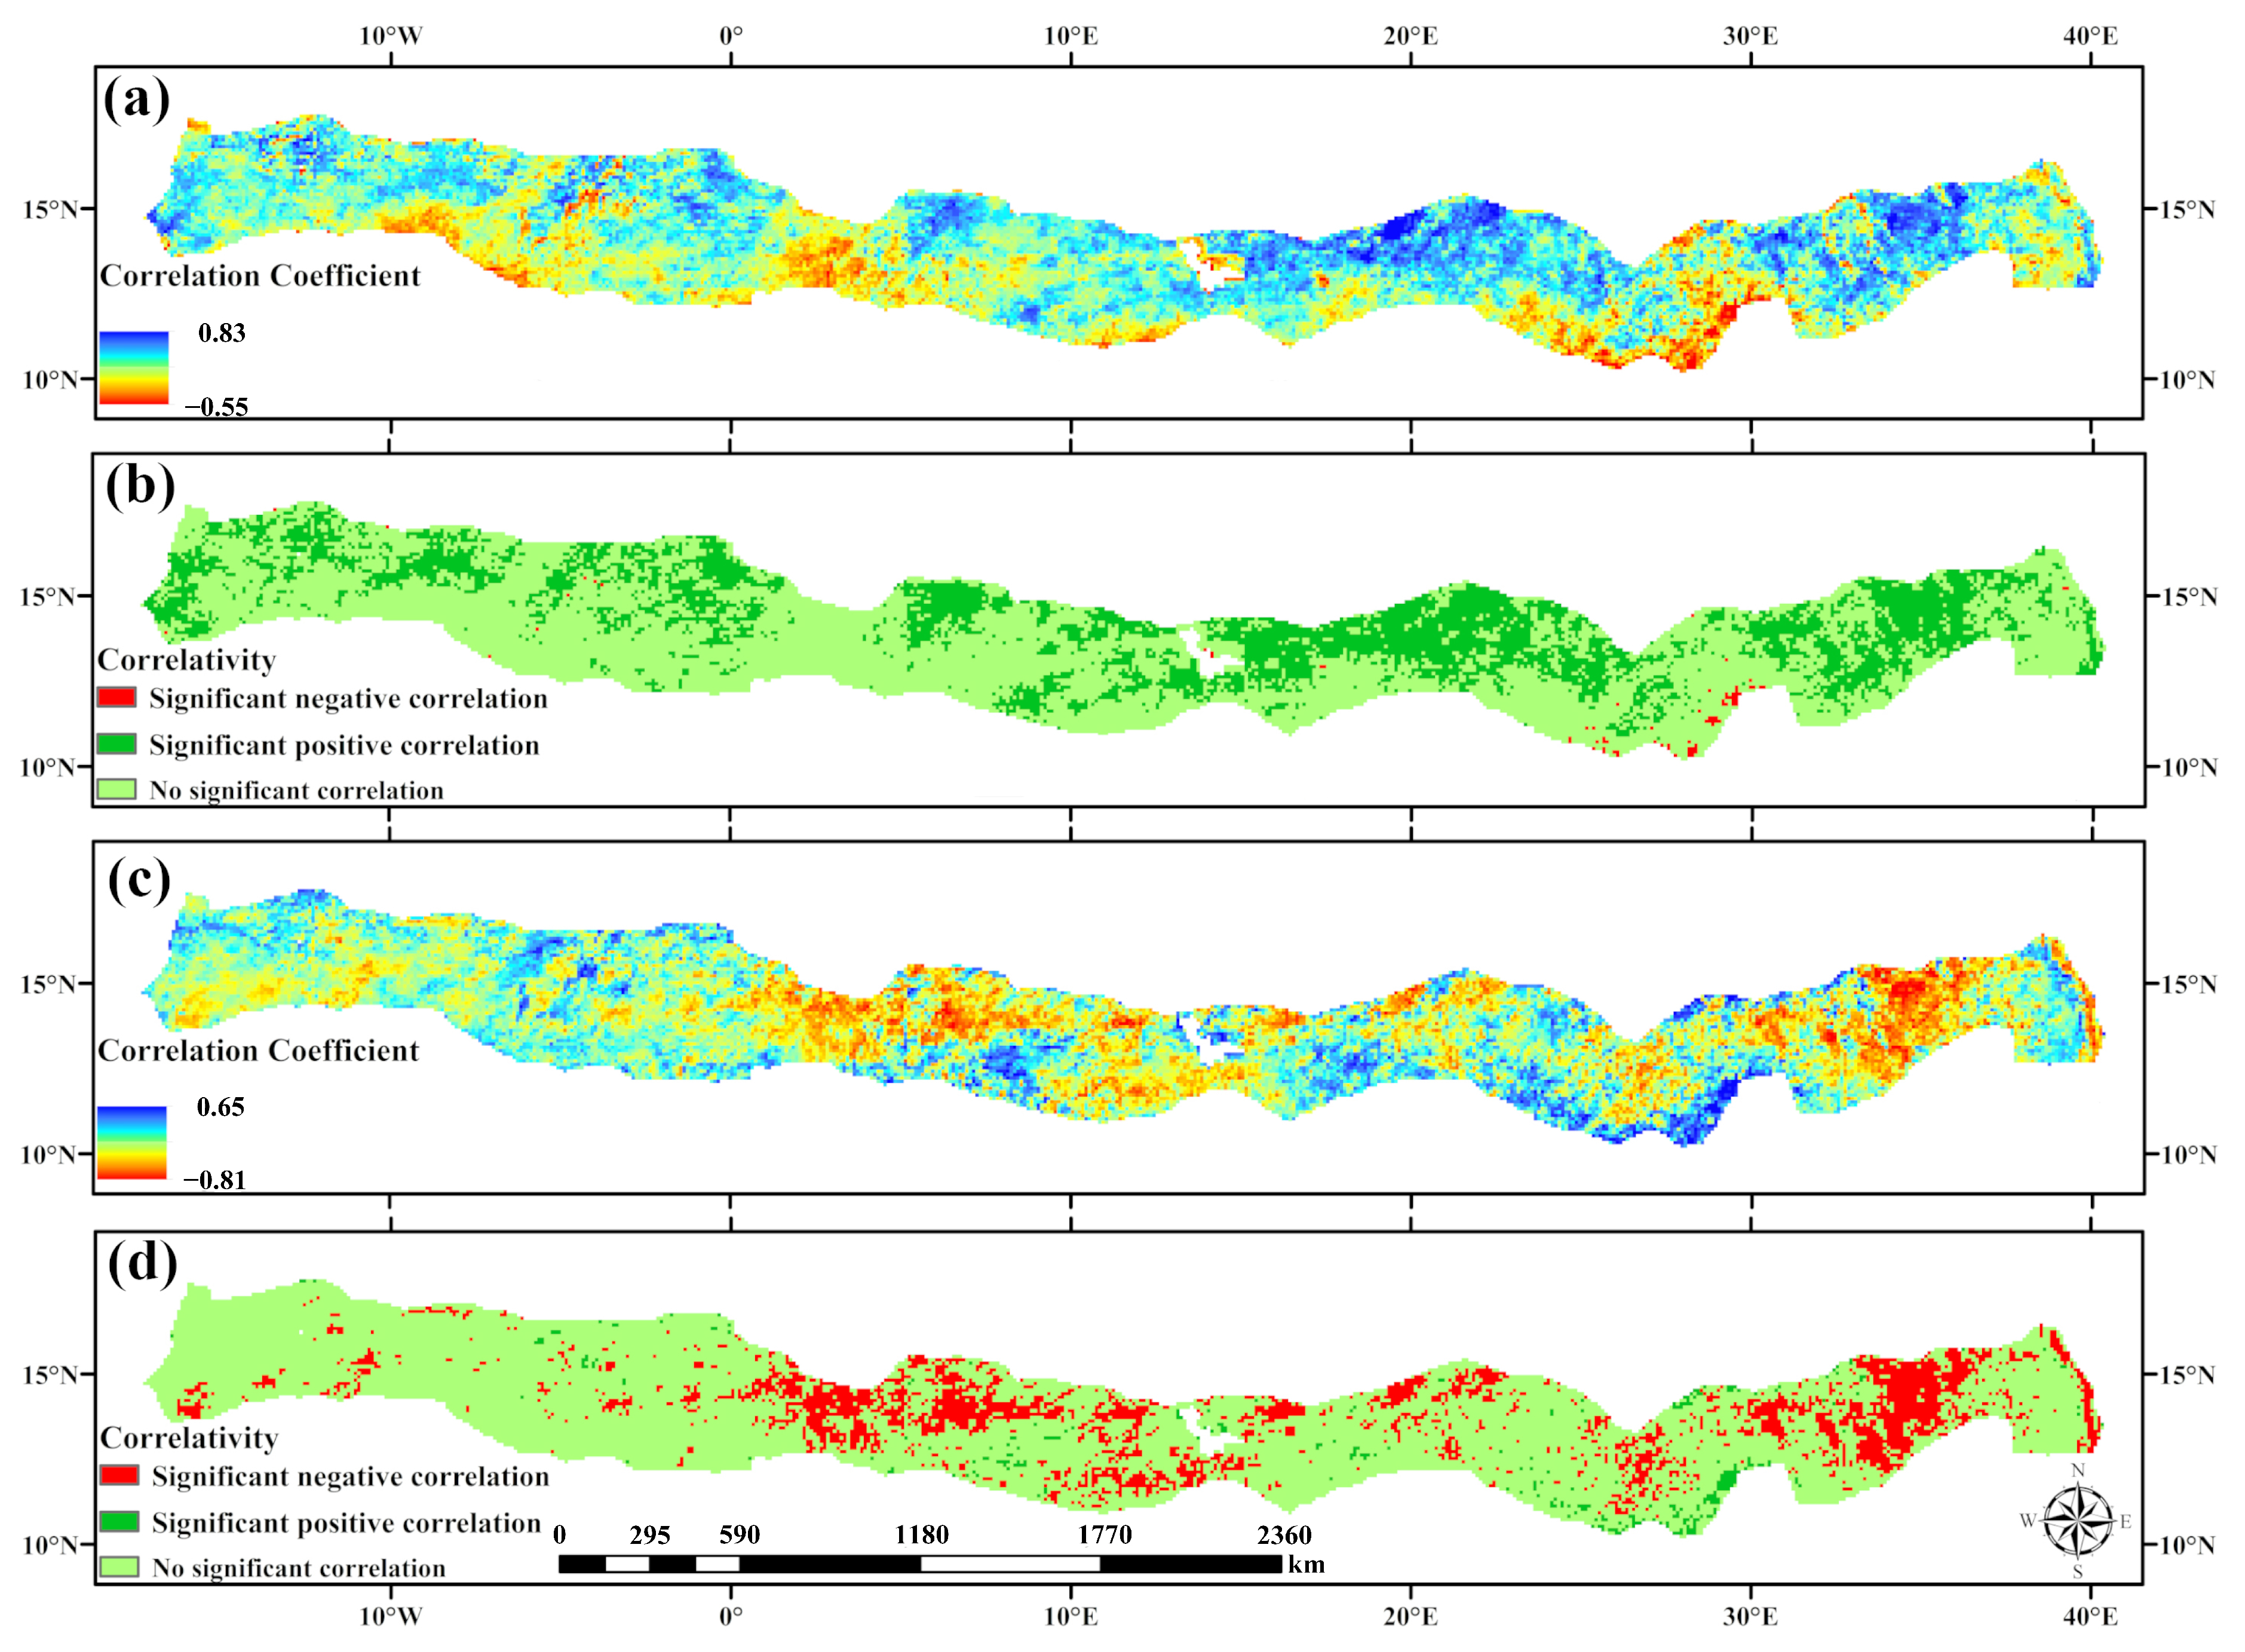
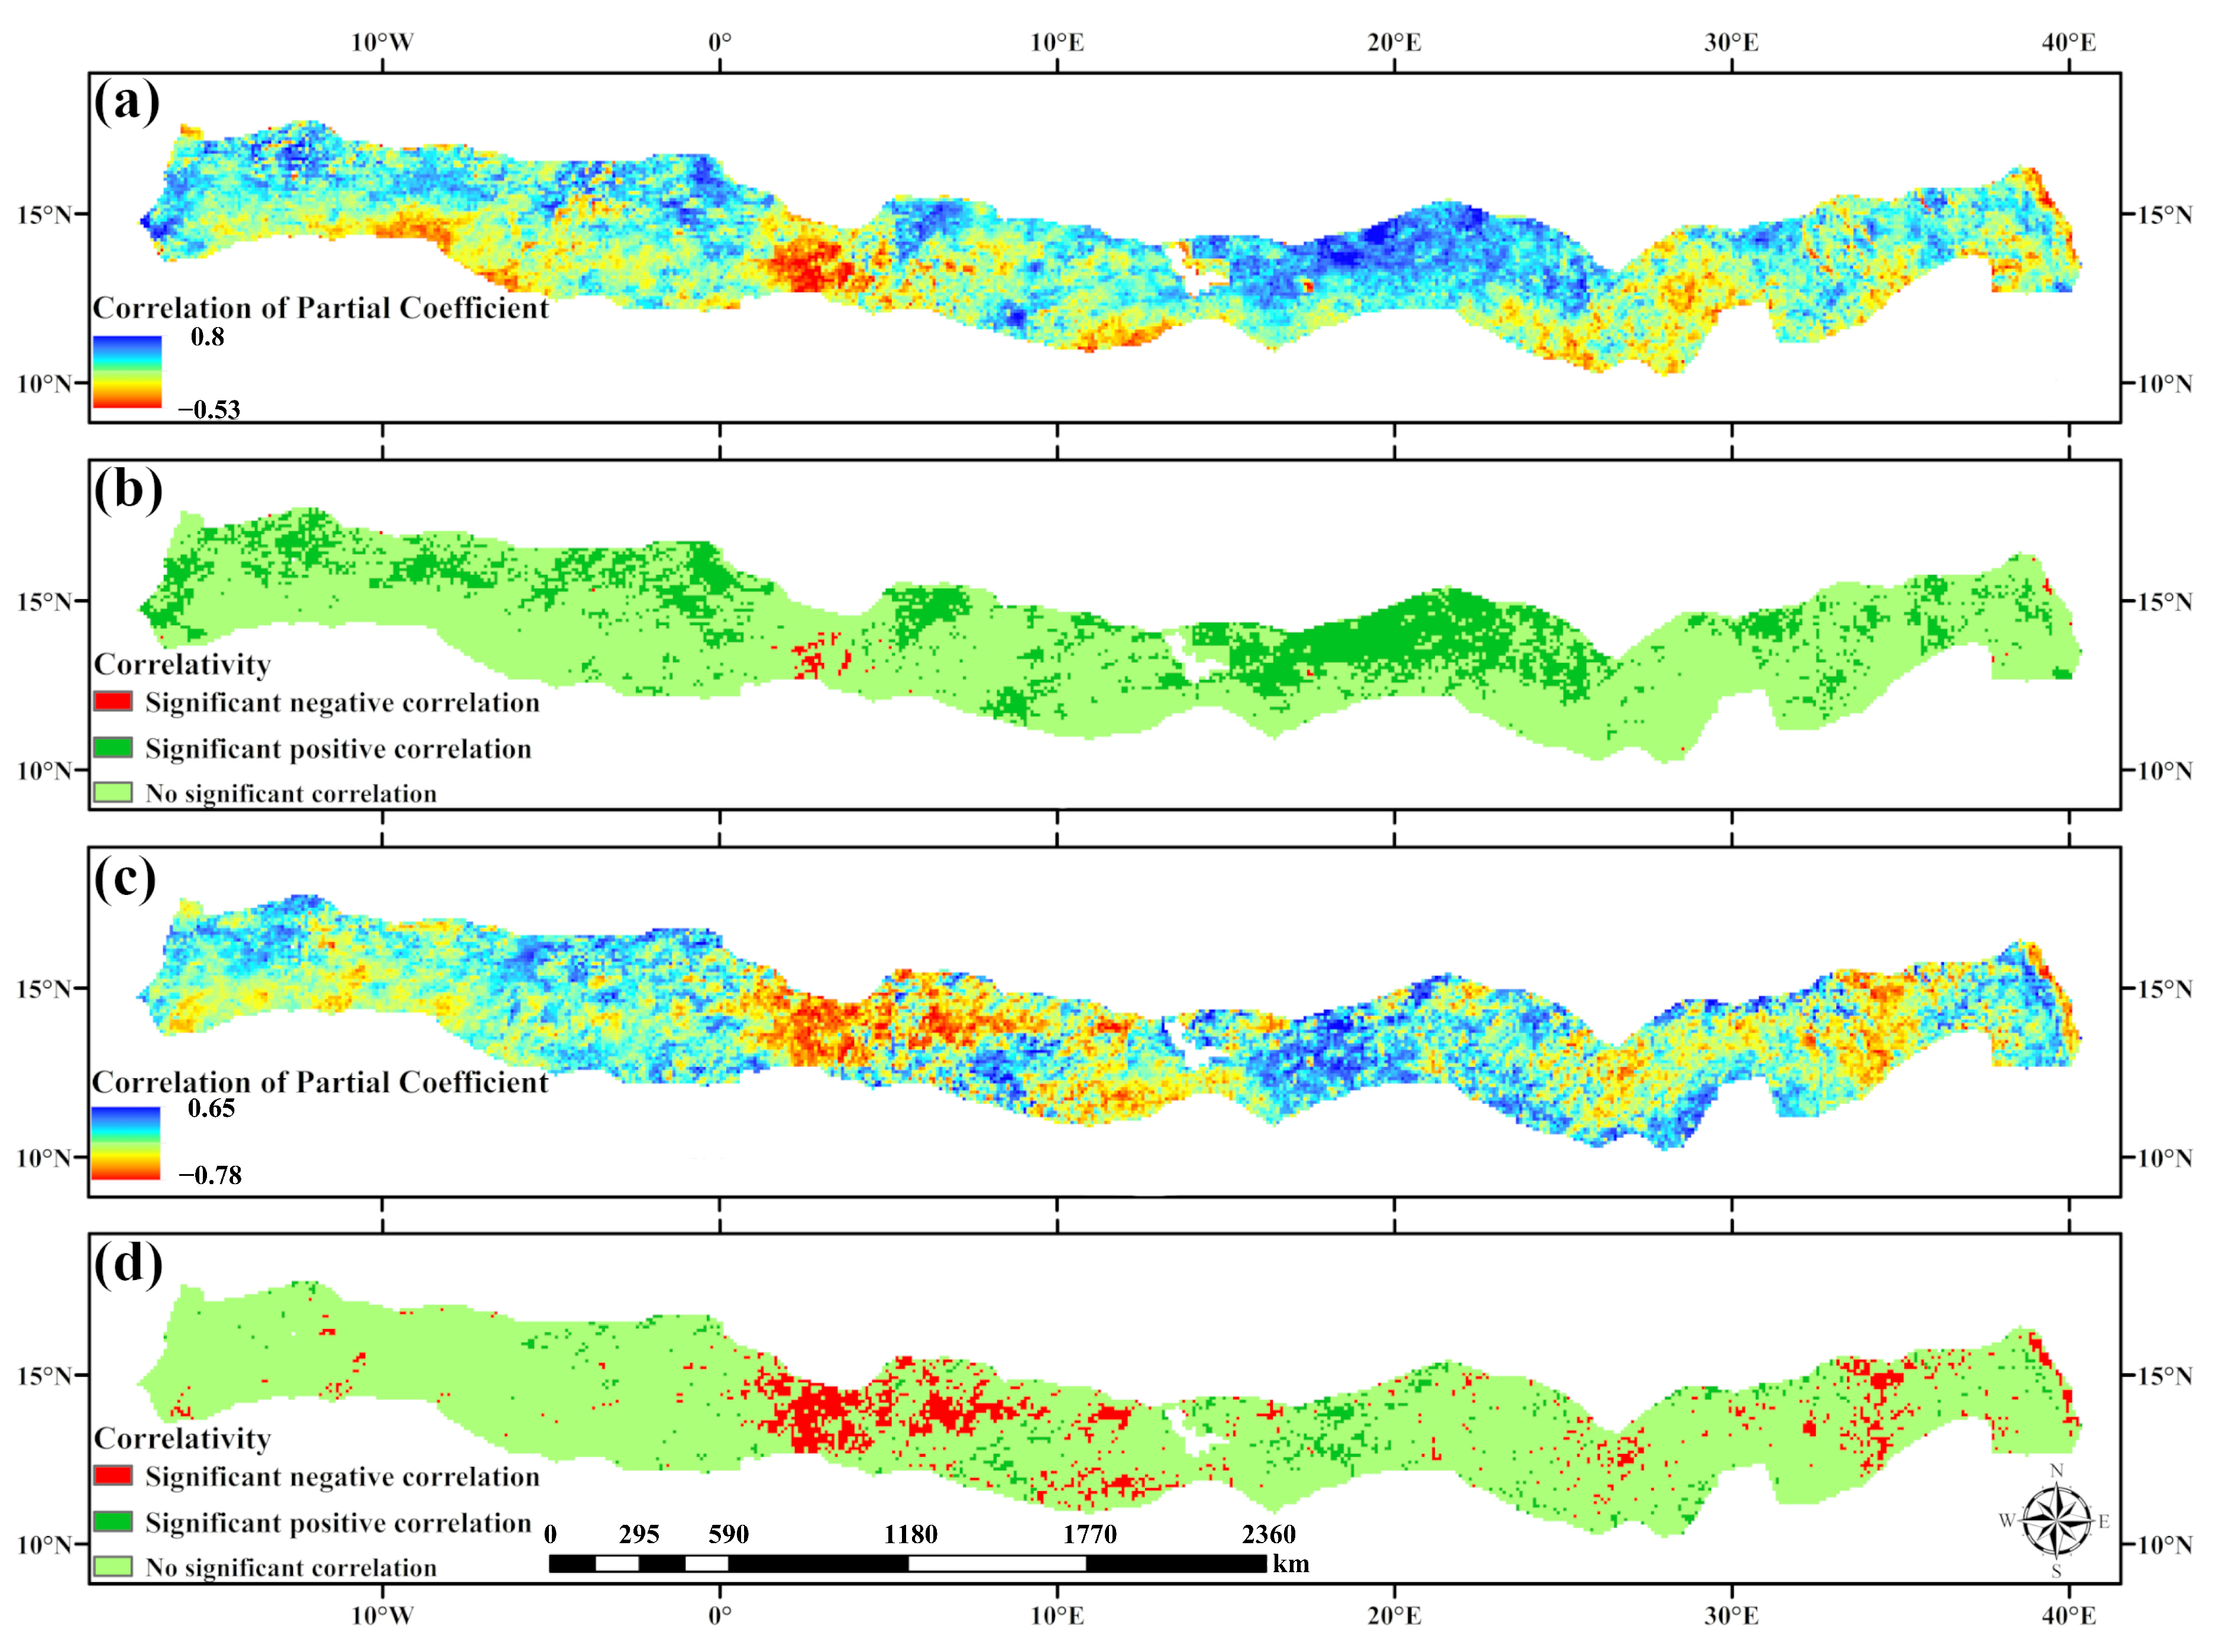
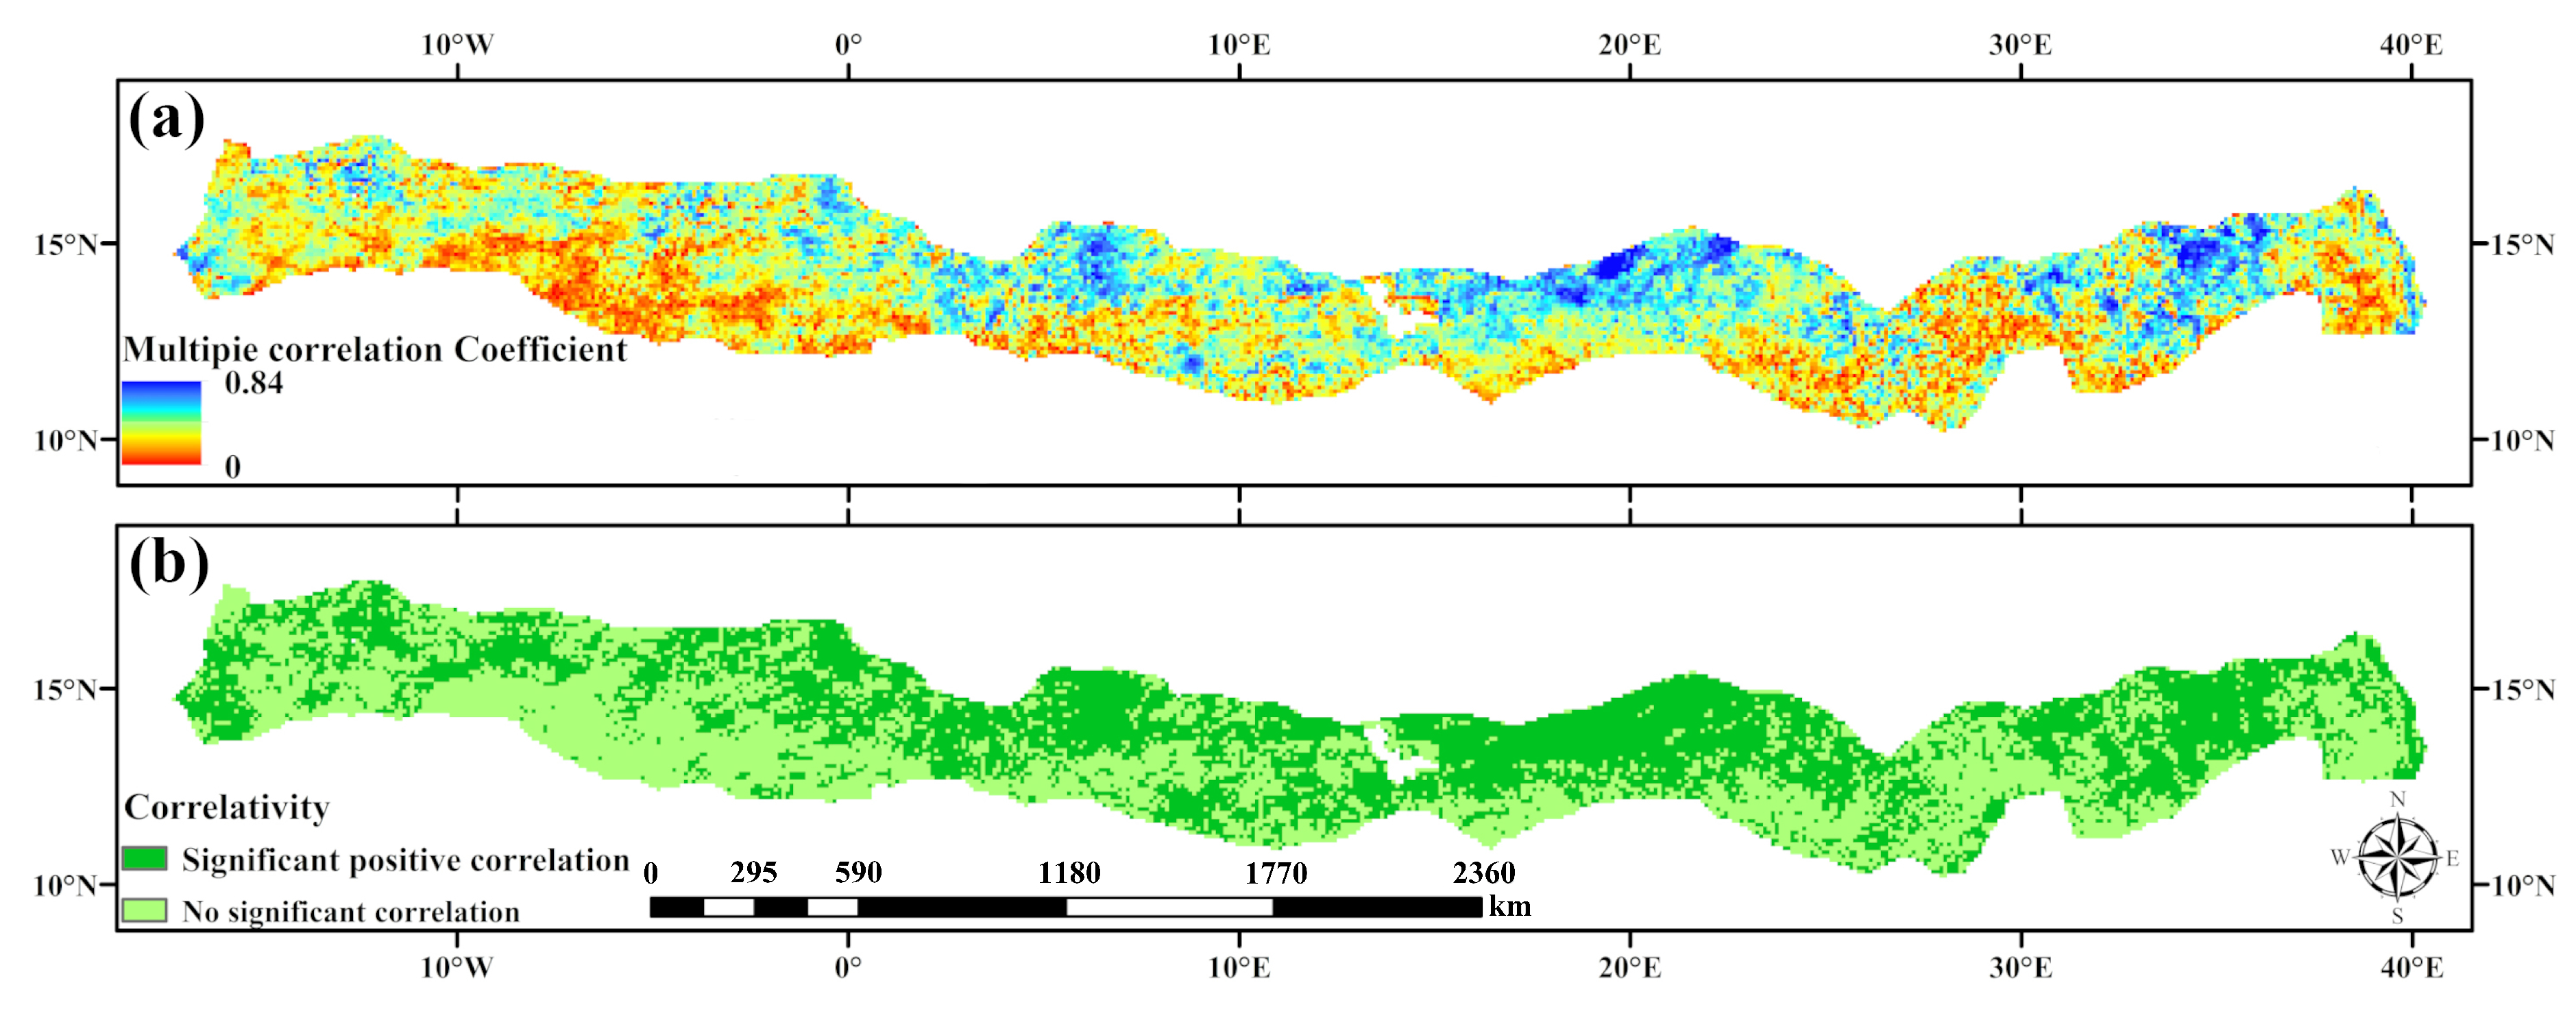
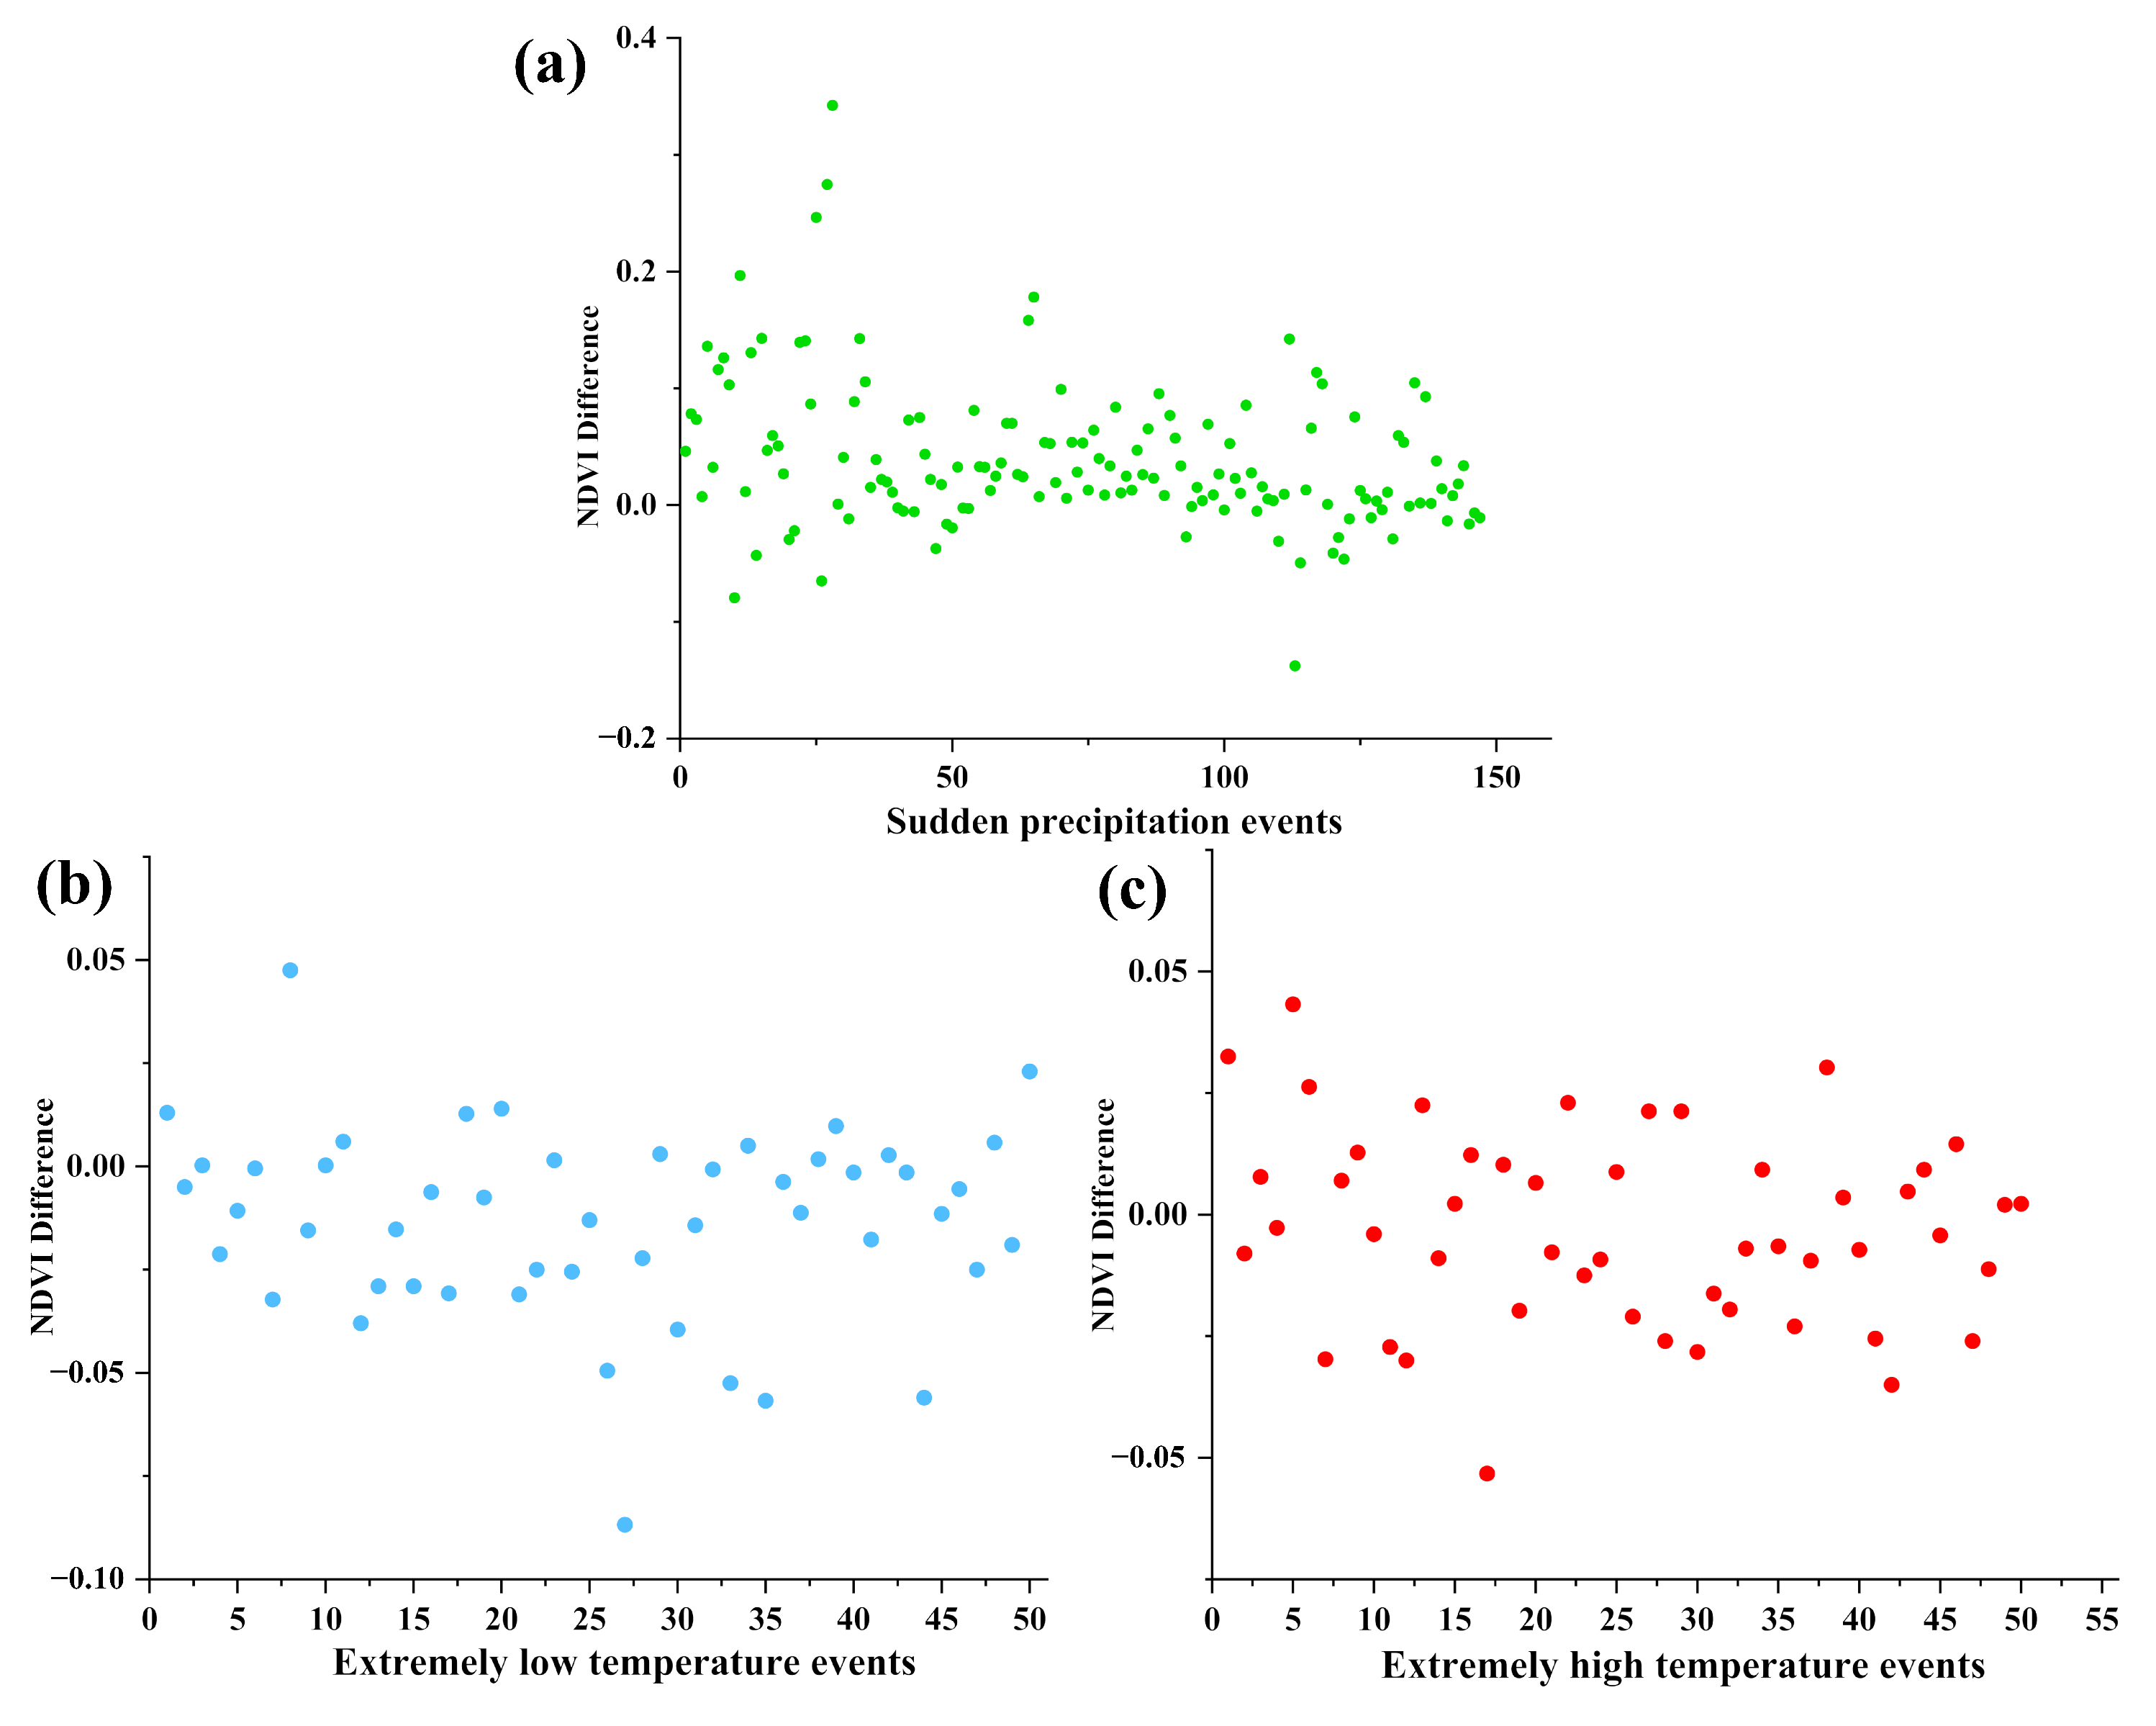
3.4. Correlation Between NDVI and Climatic Factors in the Desert/Grassland Biome Transition Zone

Climate change is one of the important influencing factors for surface vegetation change. Temperature and precipitation are two important influencing factors on NDVI [28]. During correlation analysis of climate factors and NDVI in the desert/grassland biome transition area, it is of great significance to study vegetation changes in the desert/grassland biome transition zone in response to climate factors.
As shown in Figure 10a, the correlation coefficient for NDVI and precipitation ranged from −0.55 to 0.83, and the average correlation coefficient was 0.24. The areas in which NDVI was positively correlated with precipitation accounted for 86.7% of the total area, and were distributed across most of the desert/grassland biome transition zone. Areas with negative correlations between NDVI and precipitation only accounted for 13.3% of the total area, and were only distributed in parts of the southern area of the transition zone. As shown in Figure 10c, the correlation coefficient between NDVI and temperature ranged from -0.81 to 0.65, with an average value of -0.13. Areas with positive correlations between temperature and NDVI accounted for 28.5% of the total area, and were mainly distributed in the eastern and central parts of the desert/grassland biome transition zone. Areas with negative correlations between temperature and NDVI accounted for 71.5% of the total area. Figure 10b shows that areas where the correlation coefficient between NDVI and precipitation in the desert/grassland biome transition zone passed the significance test (p < 0.05) accounted for 33.9% of the total area, areas with significant positive correlations accounted for 98.7%, and areas with significant negative correlations accounted for 1.3%. In Figure 10d, areas where the correlation coefficient between NDVI and temperature passed the significance test (p < 0.05) accounted for 21.1% of the total area, areas with significant negative correlations accounted for 91.8%, and areas with significant positive correlations accounted for 8.2%.
To verify the relationship between climate factors and NDVI in the desert/grassland biome transition zone, we used partial correlation and multiple correlation analysis methods to explore the relationship between NDVI and climate factors. Partial correlation analysis means that in a multi-factor system where the factors affect each other. To study the influence of one factor on another, the influence of other variables is controlled and the close degree of the relationship between the two elements is studied separately. For example, vegetation growth is affected by factors such as temperature and precipitation. In the application of partial correlation analysis, the interference of the third variable is excluded to allow for a more accurate description of the degree of correlation between NDVI and temperature, NDVI and precipitation. In the multi-correlation analysis, the correlation between several factors and a certain factor is studied. Here, the reference to the multi-correlation coefficient means the influence of the combined effect of temperature and precipitation on the change of NDVI is studied. As shown in Figure 11a, after controlling for temperature variables, the correlation coefficient between precipitation and NDVI ranged from −0.52 to 0.8, with an average value of 0.21. Positively correlated areas accounted for 84.9% of the total area, and negatively correlated areas accounted for 15.1% of the total area. The correlation coefficient between temperature and NDVI ranged from −0.78 to 0.65, with an average value of −0.03. Positively correlated areas accounted for 46.9% of the total area, and negatively correlated areas accounted for 53.1% of the total area. As shown in Figure 11b,d, the correlation coefficient between NDVI and precipitation in the desert/grassland biome transition zone passed the significance test (p < 0.05), accounting for 25.8% of the total area. Positively correlated areas accounted for 98% of this total area, whereas negatively correlated areas accounted for 2%. Areas where NDVI and temperature passed the significance test accounted for 12.7% of the total area, of which areas with significant positive and negative correlations accounted for 26.6% and 73.4%, respectively. Figure 12a,b show that the correlation coefficient between the comprehensive effects of climate factors (temperature and precipitation) and NDVI ranged from 0 to 0.84, with an average value of 0.34; the comprehensive effects of climate factors were all positively correlated with NDVI.
In summary, in the desert/grassland biome transition zone, as far as a single factor is concerned, precipitation was positively correlated with NDVI, temperature was negatively correlated with NDVI, and precipitation had a greater effect on NDVI than temperature. The combined effects of precipitation and temperature were the main causes of changes in the desert/grassland biome transition zone.
The desert/grassland biome transition zone is very sensitive to changes in temperature and precipitation. Moreover, rapid fluctuations in precipitation and temperature may have a considerable impact on vegetation. As shown in Figure 13a, a sudden precipitation event will change the NDVI in the desert/grassland biome transition zone. The change in NDVI before and after precipitation was mostly between −0.1 and 0.2. The average value of the change was 0.05. The average value of NDVI before precipitation occurs was 0.2. After a precipitation event, the average NDVI value was 0.24, which represents a 20% increase from the same period. The frequency of events with a larger NDVI value after a precipitation event accounted for 77.55% of the total event frequency, indicating that sudden precipitation events can effectively promote NDVI increase. Meanwhile, after analyzing each precipitation event we found that the greater the amount of precipitation and the longer the duration of precipitation, the greater the increase in NDVI can be found under normal circumstances, and vice versa. Figure 13b,c show 50 “extremely low temperature events” and 50 “extremely high temperature events”, respectively. As shown in Figure 13b, the NDVI changes before and after the extremely low temperature events were between −0.05 and 0.05, and the average value of the changes was 0.02, the average NDVI before the extremely low temperature event was 0.24, the average NDVI after the extremely low temperature event was 0.22, which represents 8.33% decrease from the same period. After the extremely low temperature event, the frequency of events that the NDVI value became smaller accounted for 70% of the total event frequency; as shown in Figure 13c, the NDVI changes before and after the extremely high temperature event was between −0.05 and 0.05, and the average value of the change was 0.02. The average NDVI value before the extremely high temperature event was 0.2, the average value of NDVI after the extremely high temperature event was 0.19, which represents a 5% decrease from the same period. The frequency of events where the NDVI value became smaller after the occurrence of extremely high temperature events accounted for 54% of the total event frequency. Therefore, it can be observed that extremely low temperature events play a certain inhibitory effect on NDVI, while extremely high temperature events have little effect on NDVI.
Many studies have qualitatively analyzed the impacts of climate change and human activities on NDVI [29,30,31]. Here, we used the multiple regression residual analysis method to analyze the driving factors of NDVI. The Jenks classification method was also used to divide the impact of climate change and human activities on the vegetation into six levels (Table 3 and Table 4).
The driving effects of climate factors and human activities on NDVI showed obvious spatial heterogeneity (Figure 14a,b). Figure 14a shows that climate factors that had a promoting effect on NDVI (lightly promote, medium promote, heavy promote) accounted for 42.4% of the total area, whereas climate factors that had a restraining effect on NDVI (lightly restrain, medium restrain, heavy restrain) accounted for 57.6% of the total area. Figure 14b shows that human activities promoting NDVI (lightly promote, medium promote, heavy promote) accounted for 90% of the total area, whereas human activities restraining NDVI (lightly restrain, medium restrain, heavy restrain) accounted for 10% of the total area.
From 1982 to 2015, the area of the desert/grassland biome transition zone that showed a linear increasing trend in NDVI for growing season accounted for 85.5% of the whole area. In order to understand the relationships between vegetation and human activities, vegetation, and climatic factors in the desert/grassland biome transition zone, we used climate factors and human activity factors to analyze the driving force of NDVI; we used the index of contribution rate to express this. The contribution index was calculated as the proportion of areas where human activities or climate factors promote the increase of NDVI to the area where NDVI increases. Figure 14c shows that the contribution rate of human activities to the increase of NDVI in the desert/grassland biome transition zone was 97.7%, the contribution rate of climate factors to the increase of NDVI was 48.1%, and the contribution rate of both human activities and climate factors to the increase of vegetation was 47.5%. The area of vegetation degradation under the action of human activities and climatic factors was relatively small. Compared with climatic factors, the impact of human activities on vegetation restoration was more obvious, indicating that afforestation along the Sahel region has promoted vegetation restoration.

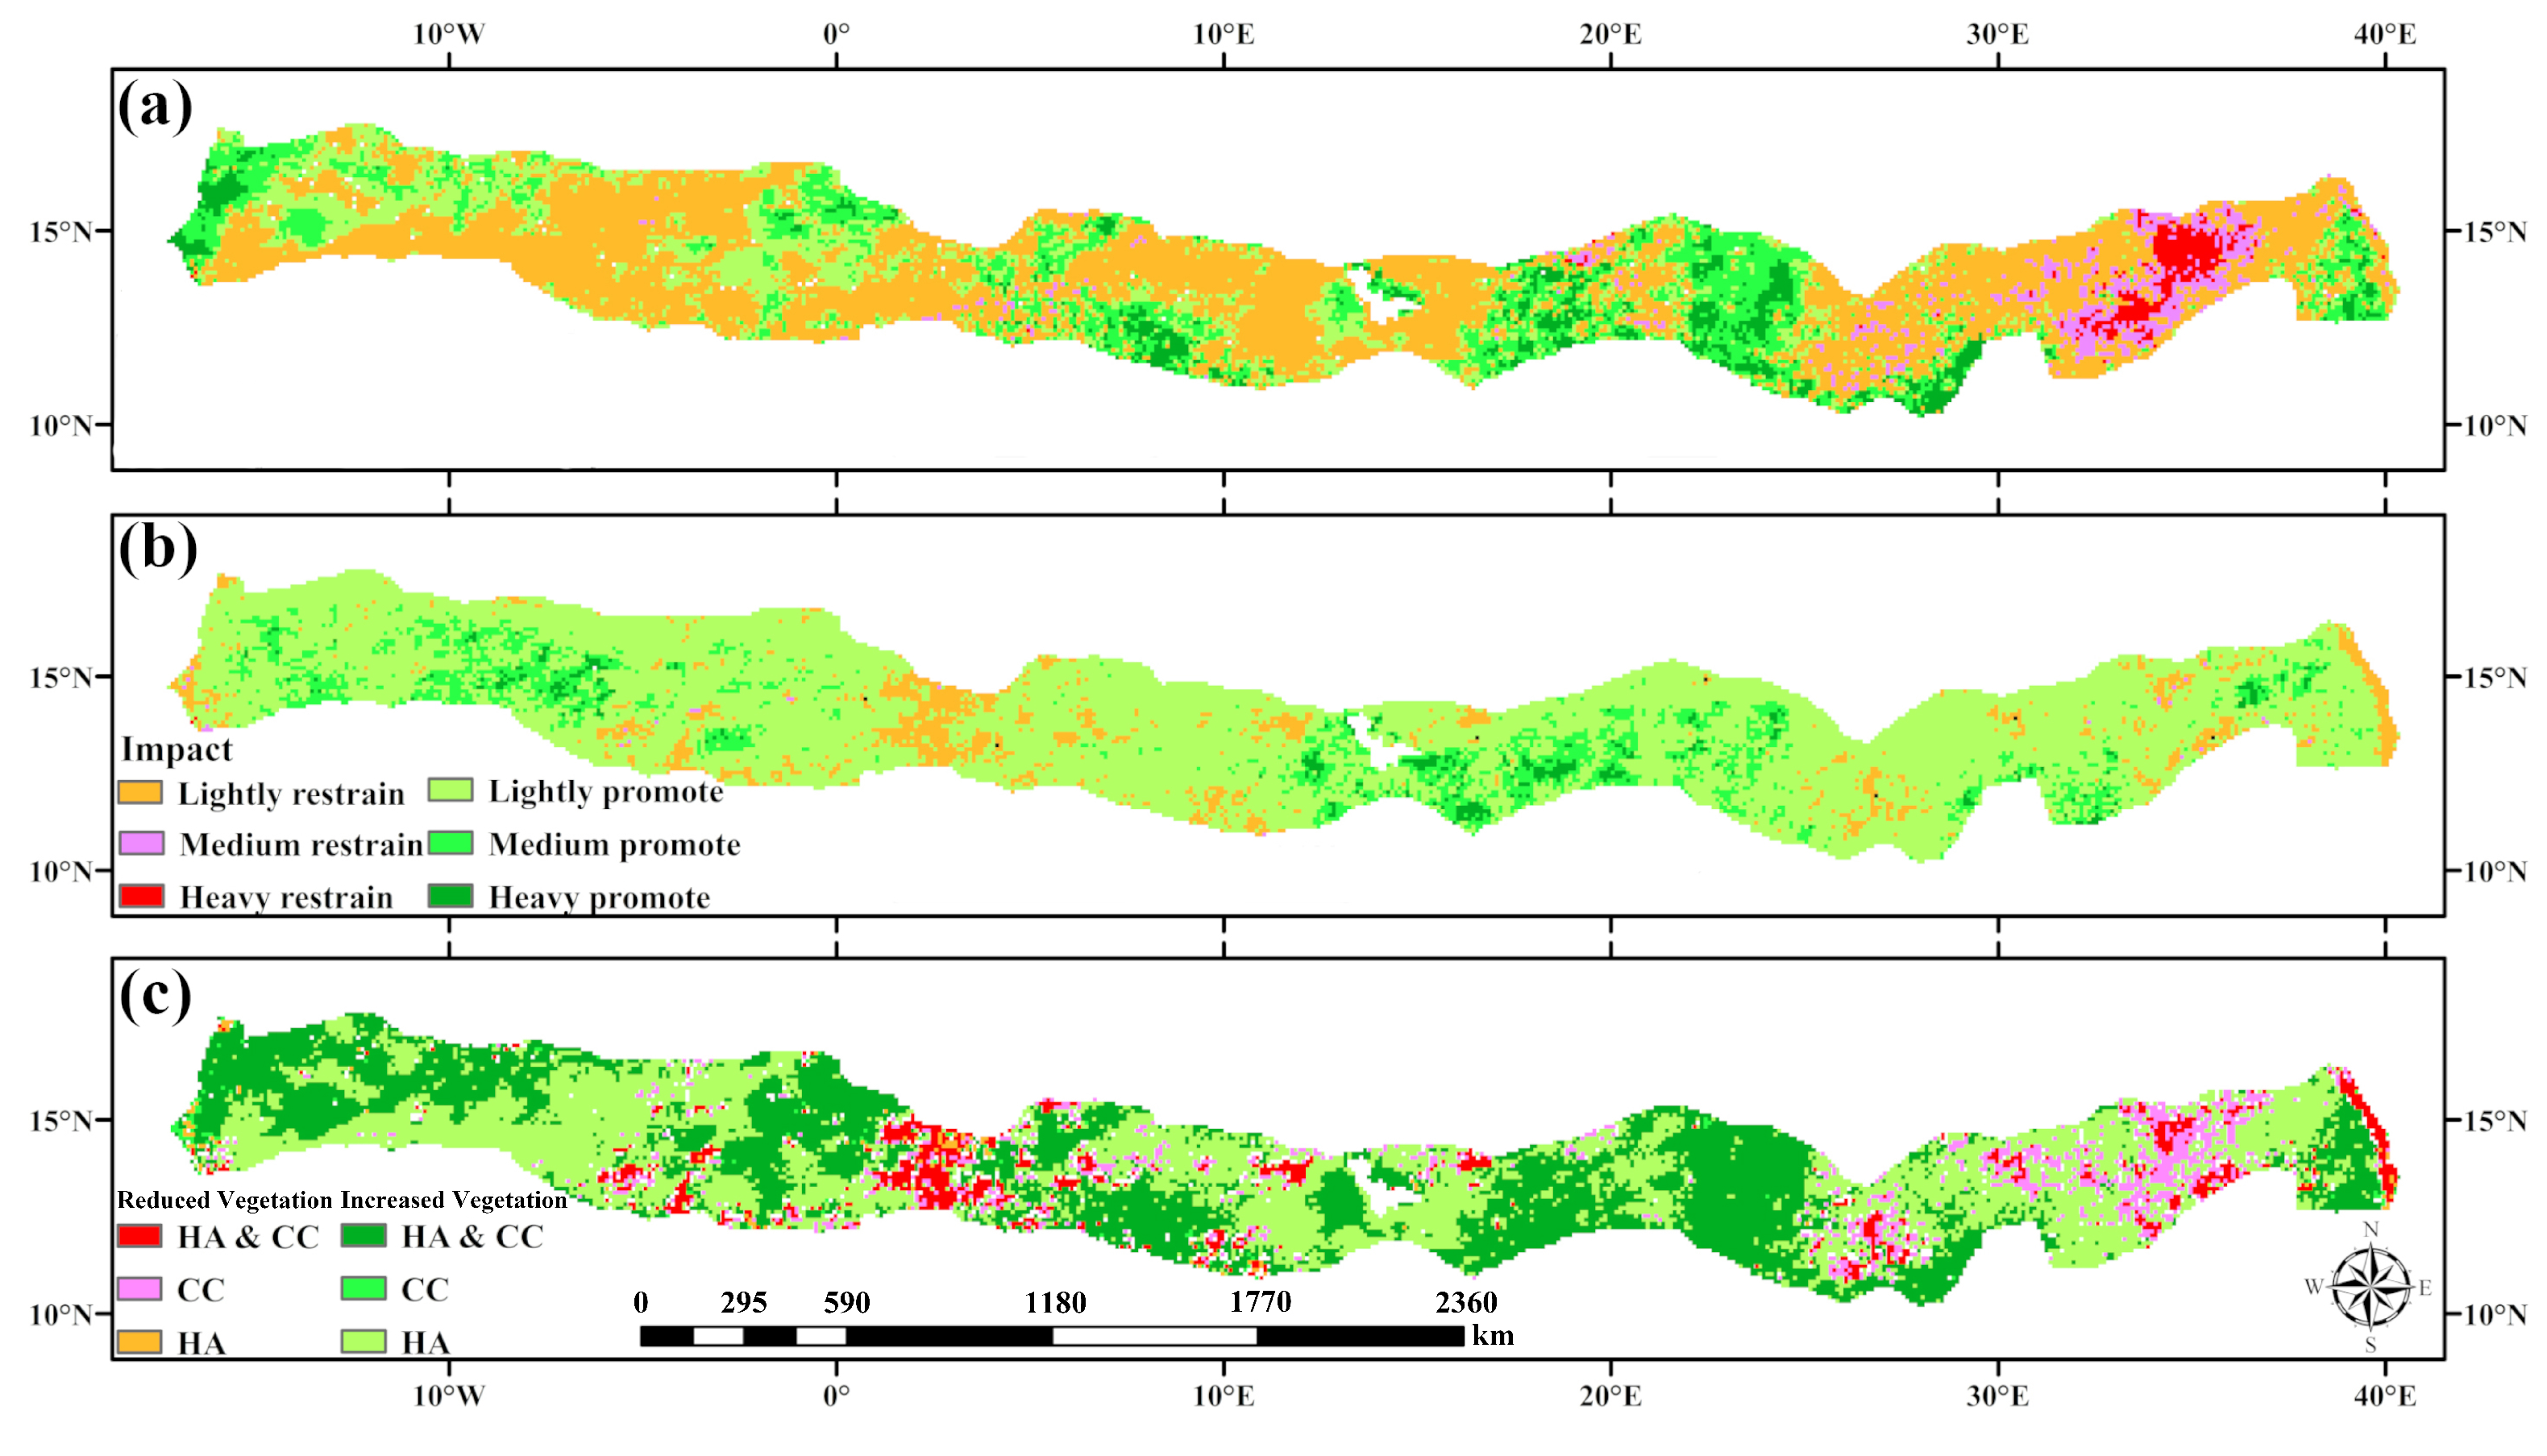
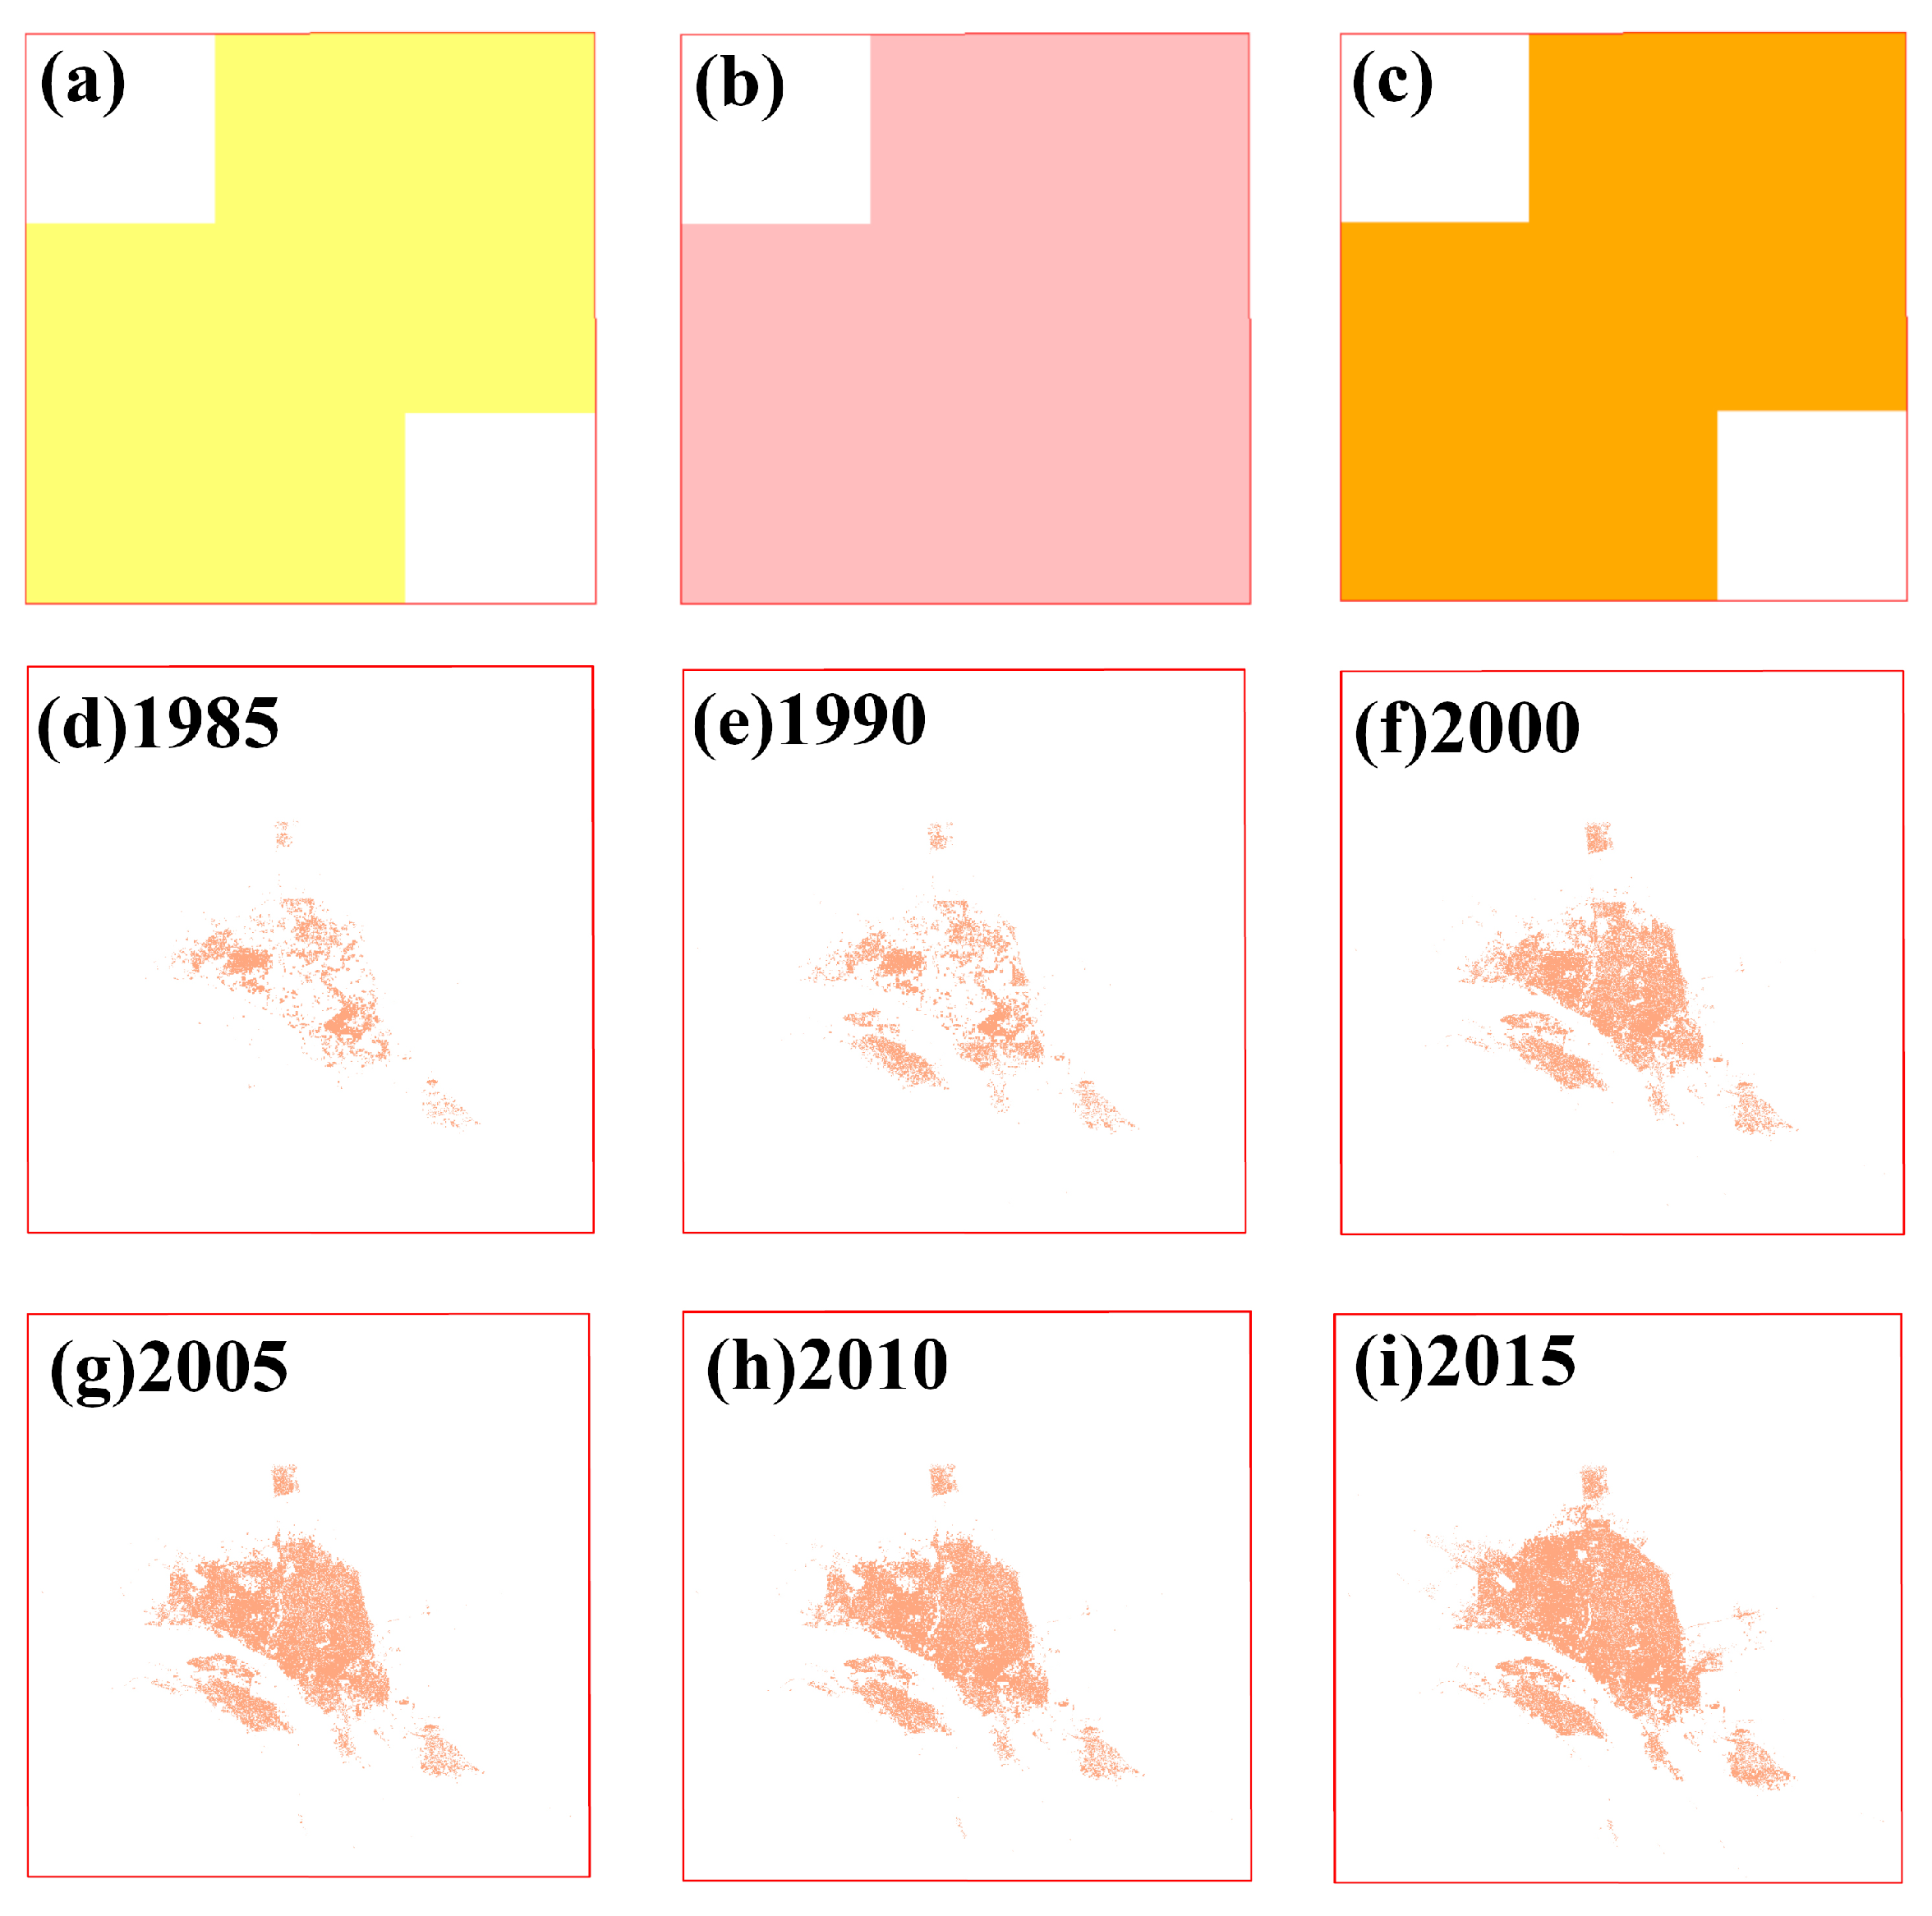
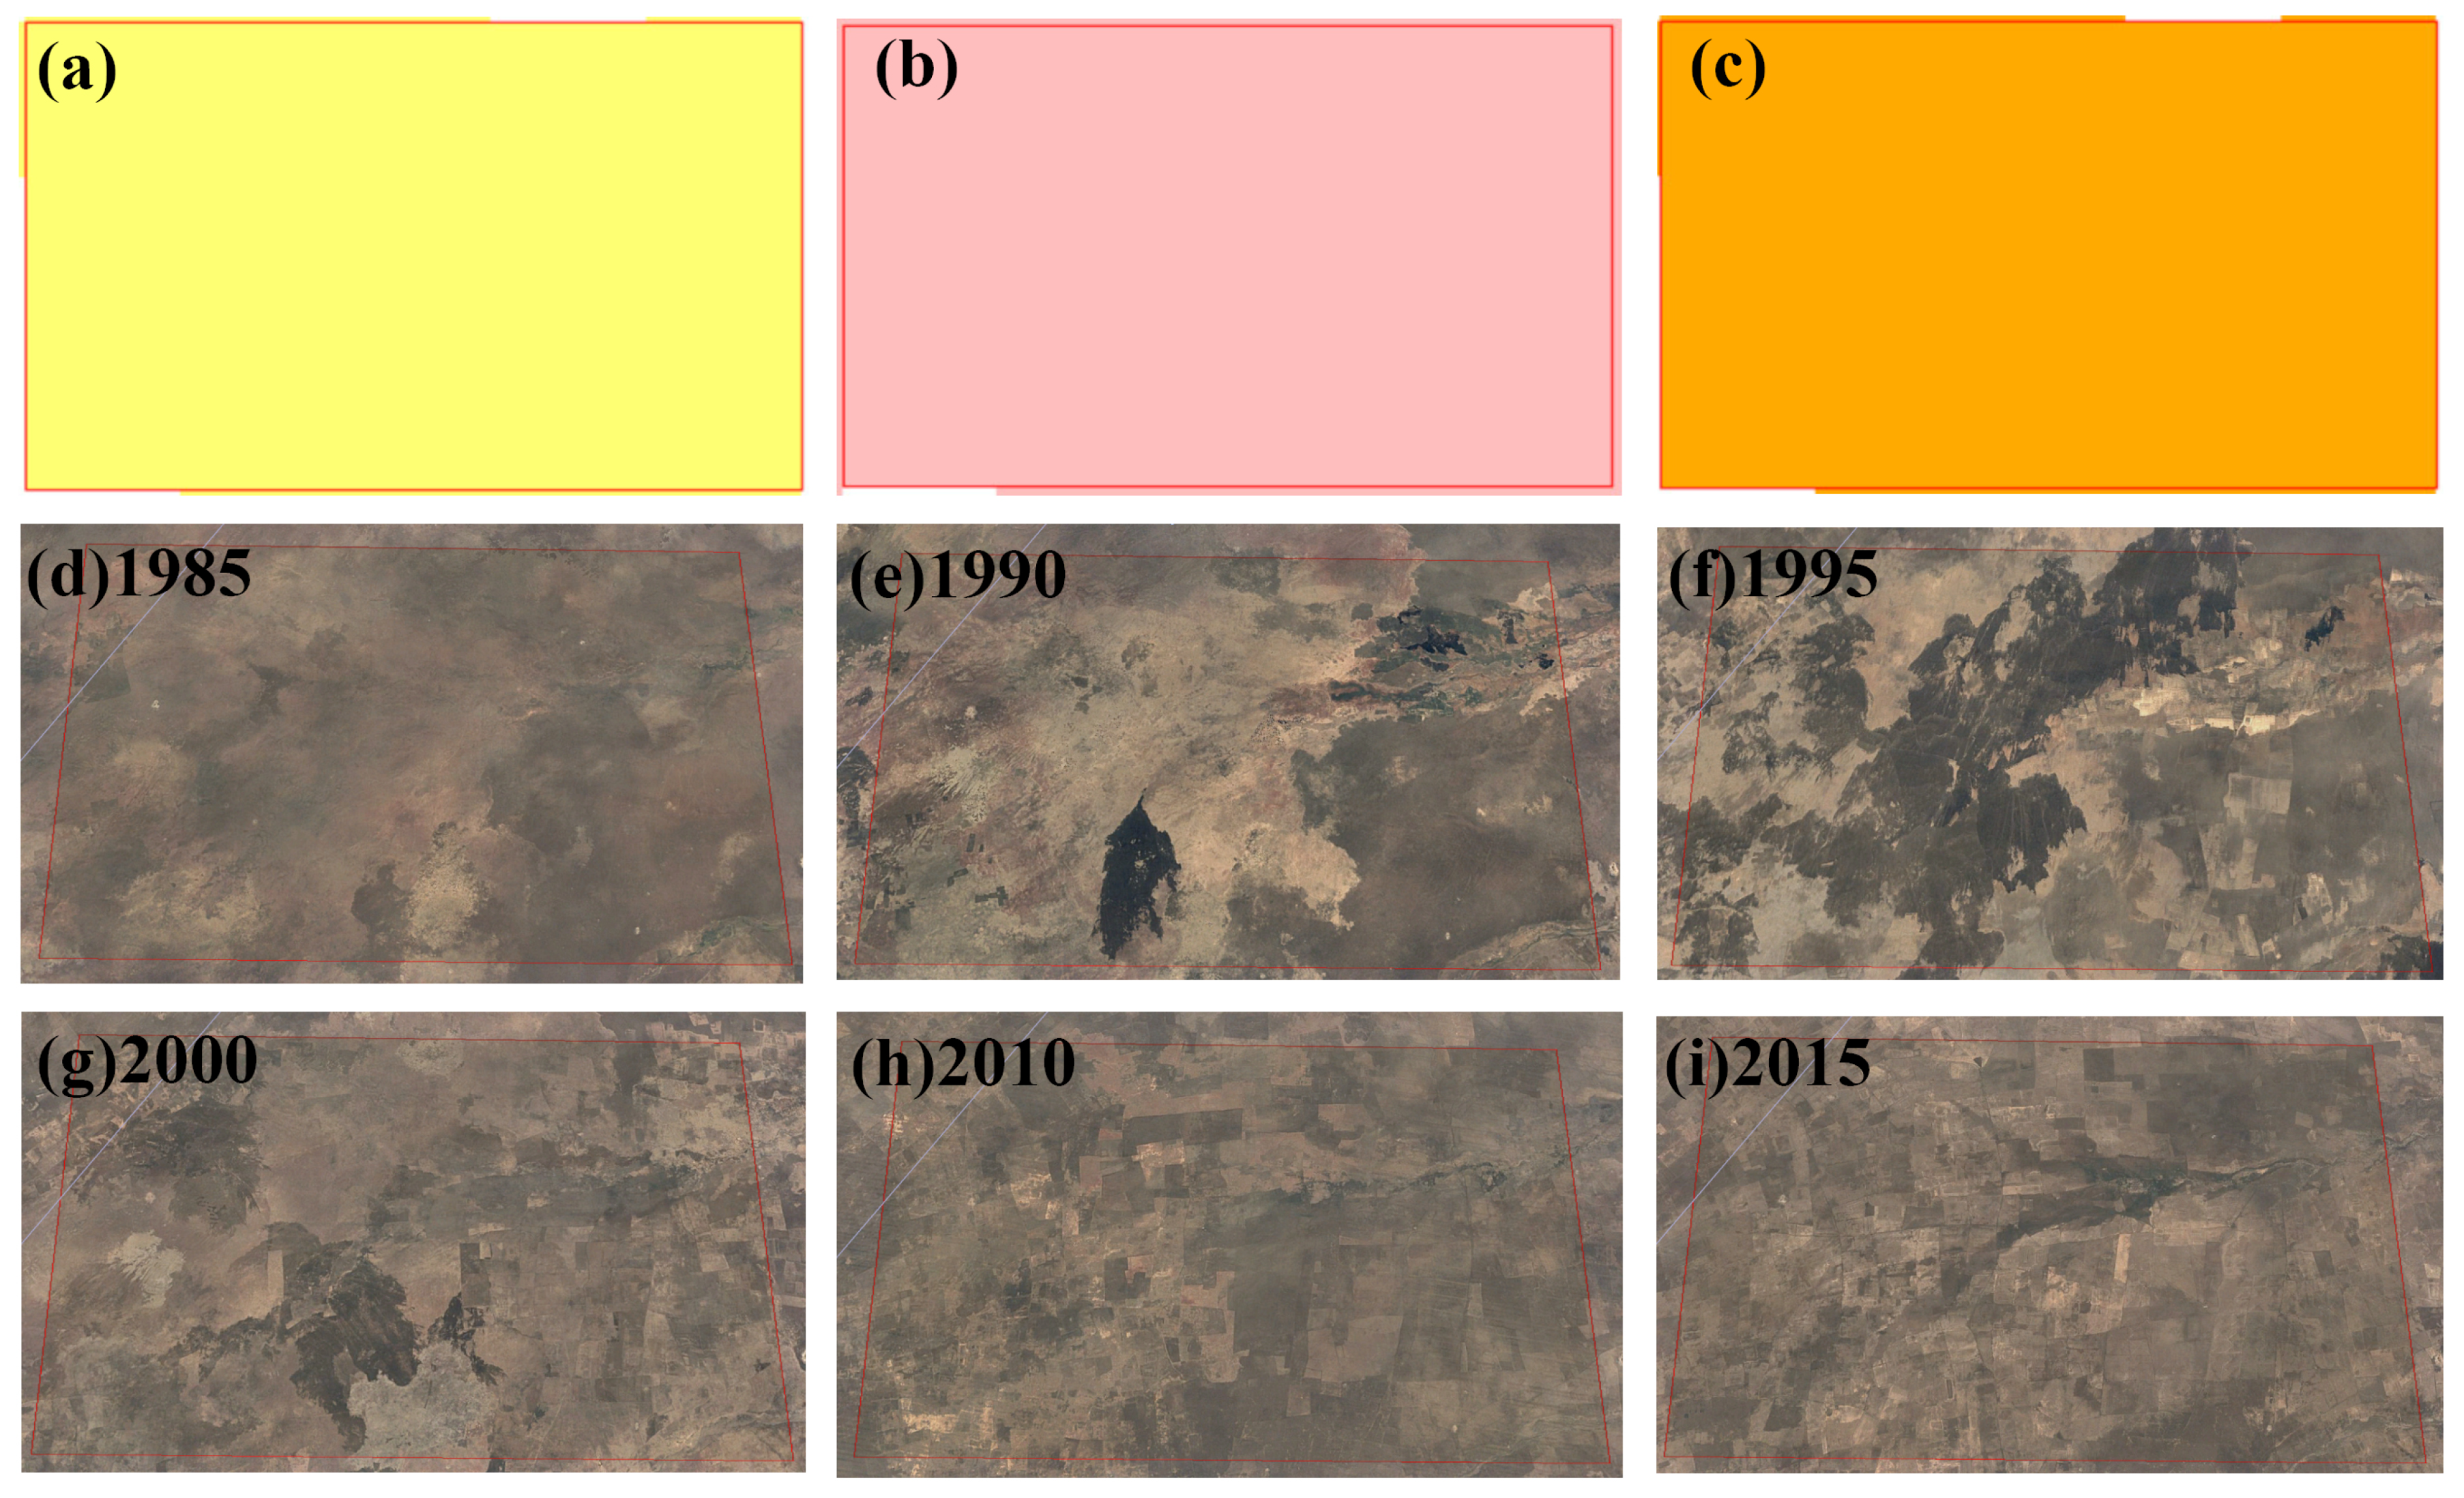
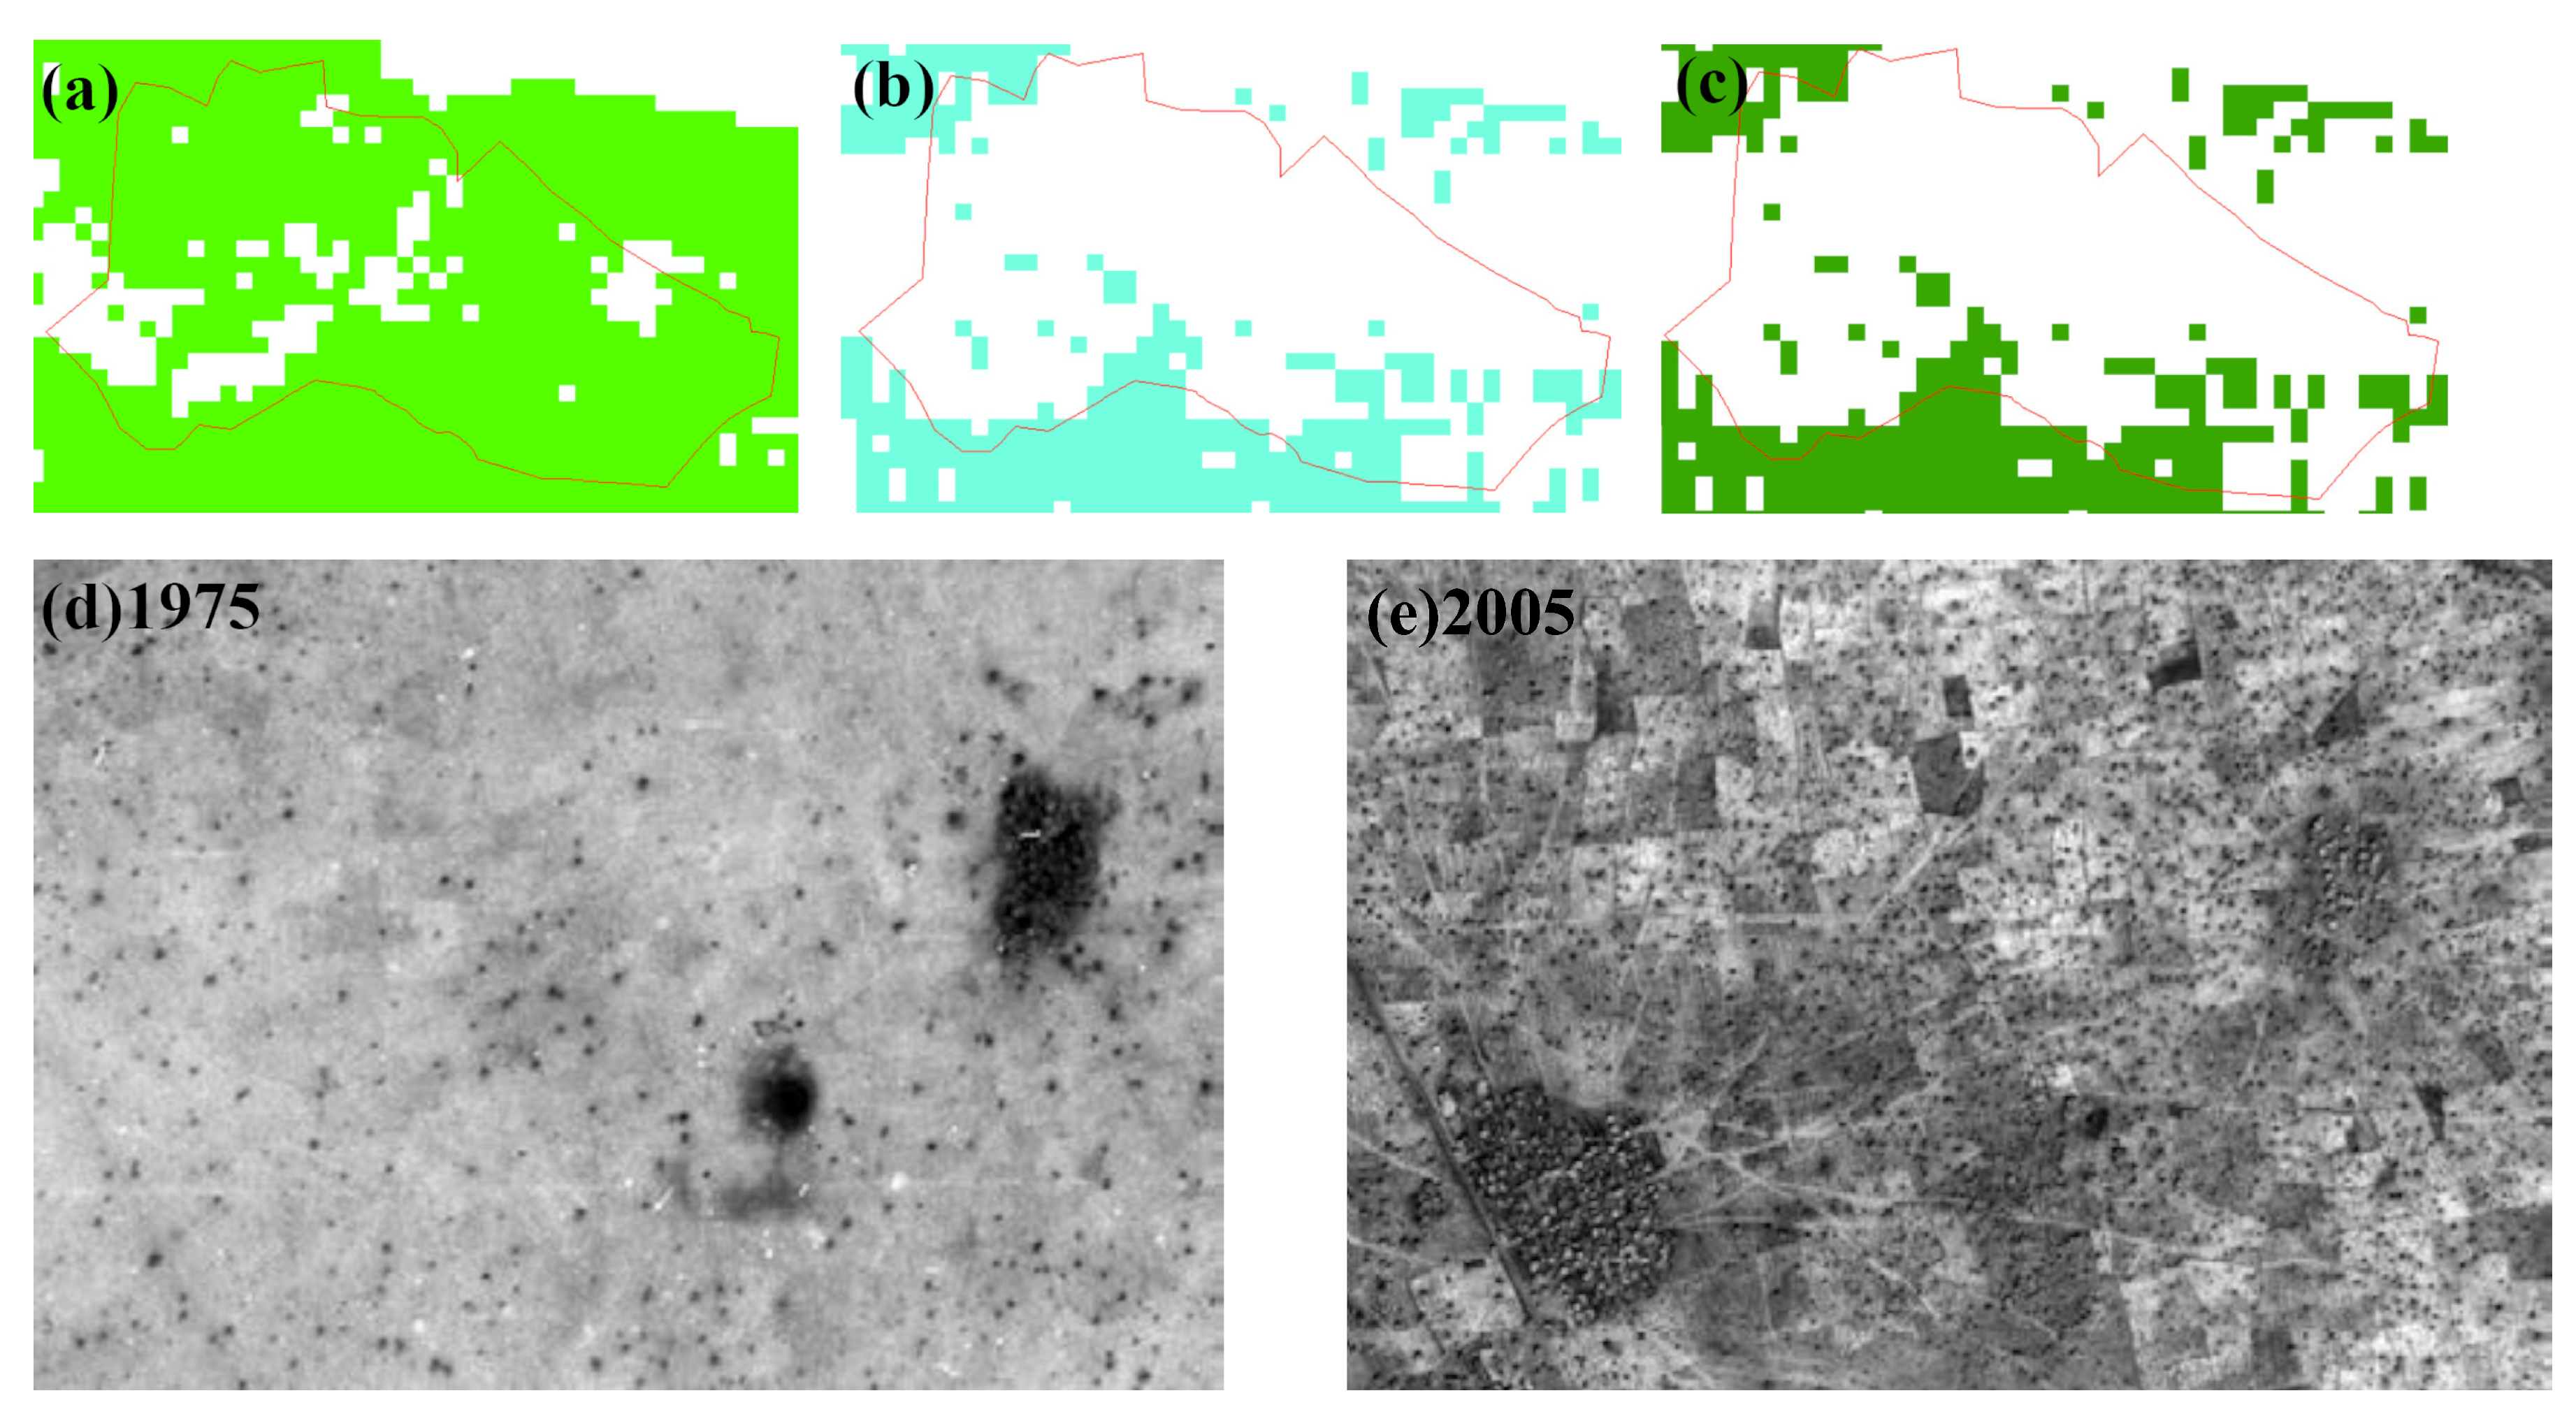
3.5. Correlation between NDVI and Human Activities in the Desert/Grassland Biome Transition Zone

To obtain a clear understanding of the relationship between human activities and NDVI in the desert/grassland biome transition zone of the Sahel region, we selected three regions, namely Niamey, Eastern Wad Madani and Southern Niger with different human activities for analysis.
(1)
Niamey
As shown in Figure 15a–c, the NDVI in the Niamey area shows a trend of degradation under climate change and human activities. In Figure 15d–i, the impervious area of Niamey increases year by year. Since 1985 to 2015, the impervious area of the entire Niamey area has increased from 14.89 km2 to 82.32 km2. Because the vegetation in the desert/grassland biome transition zone is very fragile, the rapid expansion of the urban area will inevitably damage the original vegetation around the urban area, thereby inhibiting the growth of vegetation.
(2)
Eastern Wad Madani
Figure 16a–c show that the NDVI in the Eastern Wad Madani area demonstrates a trend of degradation under climate change and human activities. As can be seen from Figure 16d–i, with the expansion of cultivated land, a lot of wilderness has been cultivated, the grassland and shrub vegetation that originally covered the land were destroyed from 1985 to 2015. At the same time, the Google Earth high-resolution images (Figure 16d–i) show that there is a large amount of abandoned farmland, which may reduce the NDVI value and cause damage to the ecological environment [32].
(3)
Southern Niger
Large-scale afforestation is also an important factor for humans in the Sahel region to promote the growth of NDVI [33]. From 1950 to 2013, the forest density in the central and southern parts of Niger has changed significantly, the forest density has shown a gradual decrease from 1950 to 1985, while the forest density has shown a gradual increase from trend 1985 to 2013 [34]. Figure 17a–c show that most of the NDVI in Southern Niger is promoted by human activities, but most of the NDVI in Southern Niger is inhibited by climate change. Figure 17d,e show that obvious changes in tree coverage can be observed from the high-resolution images of farms and villages in the southern Zinder area. During the period from 1950 to 1985, the area experienced a decrease in precipitation and faced huge drought, expansion of arable land, and human pressure. Therefore, farmers increased the number of trees on the farmland to cope with the impact of wind erosion in the area and reduce population and resource constraints [34]. This is clear evidence for the impact of human activities on vegetation restoration.
In addition, grazing, road paving, and population increase in the Sahel region also have a certain inhibitory effect on NDVI. However, because our study is based on the natural geographic region of the desert/grassland biome transition zone of Sahel region, most of the social data are difficult to apply, and are not discussed in detail herein.

3.6. Development of the Desert/Grassland Biome Transition Zone

We compared the 2019 simulation results with the 2019 classified results from GEE. Finally, we found that the accuracy of CA-Markov model simulation results compared to actual classification results was 83.1%. Therefore, it is feasible to use CA-Markov model to simulate changes in the spatial position of the desert/grassland biome transition zone. We simulated the spatial locations of the desert/grassland biome transition zone in 2028, 2037, 2046, and 2055. Figure 18 shows the spatial location of the desert/grassland biome transition zones in the Sahel region of Africa.
Under the influence of climate change and human activities, the location of the desert/grassland biome transition zone was not predicted to remain static. As a “transition zone” between desert and grassland, its steady-state structure is extremely prone to change, leading to boundary shifts. The area of the desert/grassland biome transition zone showed a slow increasing trend. From 2019 to 2055, the overall area is predicted to increase by 278,021 km2, but the inter-annual fluctuations were shown to be large. In addition, the desert/grassland biome transition zone was predicted to expand to both sides as a whole, i.e., the northern boundary will move slightly northward and the southern boundary will move slightly southward. The small cells at the boundary gradually tend to be clumped due to the self-organization of the geographic cell. As the spatial change of the desert/grassland biome transition zone was calculated based on simulations under theoretical probability mathematics scenarios, the effects of climate and human activities were excluded to a certain extent, and the simulation of the transition zone’s future spatial location may have a certain degree of distortion.

4. Discussion

Our results show that the NDVI of the desert/grassland biome transition zone exhibited spatial stratified heterogeneity, and an obvious gradient characteristic from north to south [35]. The combination of moisture and heat also showed gradient characteristics. The overall NDVI of the desert/grassland biome transition showed an increasing trend from 1982 to 2015, although a small part of the area showed a downward trend [36]. Temperature in the desert/grassland biome transition zone showed an obvious rising trend, whereas the precipitation trend fluctuated greatly. As climate factors change, NDVI changes accordingly [37,38]. In arid or semi-arid zones, sudden precipitation can change vegetation growth and extreme temperature has similar effects. We found that “sudden precipitation events” have a greater impact on NDVI than “extremely low temperature events” and “extremely high temperature events”. Then, we analyzed the changes in the NDVI value before and after sudden precipitation events and we found that a small amount of precipitation in a short time has little influence on NDVI, whereas a large amount of precipitation in a short period of time or continuous precipitation over a long period of time will greatly promote the increase of NDVI value [39]. This phenomenon can be attributed to the following: (1) each GIMMS data file contains a convenient half-month composite, and the observed values may not be sensitive to the sharp changes in NDVI in a short-term period; (2) evaporation in the desert/grassland biome transition zone is high; a small amount of precipitation evaporates rapidly within a short-term period [40], which means that the precipitation cannot be fully utilized by vegetation, resulting in little change to the NDVI value.
At present, the combination of residual analysis and the acquisition of NDVI based on remote-sensing satellites is considered as the most commonly used and effective method to identify the relative impacts of climate change and human activities [41,42,43]. The change of NDVI is not only related to climatic factors, but also closely related to human activities. We quantitatively analyzed the impact of human activities and climate change on NDVI and found that the contribution of the former to the increase in NDVI is greater than that of the latter. Meanwhile, we validated the experimental results by combining high spatial resolution images (Google Earth) and remote-sensing image products. We found that afforestation plays an important role in improving NDVI in the desert/grassland biome transition zone [44]. This finding is supported by other studies that afforestation considerably impacts the increase of NDVI in arid and semi-arid areas [45,46]. However, we found that unstable land-use methods, such as the expansion of urban built-up areas, and the abandonment and degradation of cultivated land resulted in vegetation degradation [43]. CA-Markov model has been widely used for studying land-use changes and NDVI tempo-spatial variation simulations and predictions [47,48]. Herein, we used this model to predict the spatial position of the desert/grassland biome transition zone in 2019, 2028, 2037, 2046, 2055. Based on the experimental simulation results, the area of the desert/grassland transition zone will expand in the future, with the southern boundary moving slightly to the south and the northern boundary moving slightly to the north. However, the impacts of human activities and climate change on vegetation changes were difficult to predict owing to the elasticity of the ecosystem [49]. Future efforts to conduct ecosystem simulation modeling should consider driving factors such as human activities and climate change on vegetation and the self-restoration of the ecosystem, to build a terrestrial ecosystem model that adapts to arid and semi-arid regions.
Selecting appropriate NDVI data is a prerequisite for long-term vegetation dynamic change research. The higher the quality of NDVI data, the higher the accuracy of the experimental results that can be obtained. Different satellite sensors, spectral response functions and correction methods of different remote-sensing satellites may cause a difference in the results [50]. However, it is difficult to obtain long-term NDVI data from a single sensor based on the current technical limitations of remote-sensing data. Although the temporal and spatial trends were approximately the same as the real weather situation, there were still discrepancies between the meteorological data and actual meteorological conditions in some areas and periods. Moreover, as there are few meteorological observatories in the Sahel region of Africa, we can only use atmospheric reanalysis data that are assimilated by satellite data and ground-high-altitude conventional observation data. At present, the combination of residual analysis and the acquisition of NDVI based on remote-sensing satellites is considered as the most commonly used and effective method to identify the relative impacts of climate change and human activities, but it also has limitations. For example, in this study we selected temperature and precipitation as the factors that affect NDVI. However, factors such as solar radiation and evapotranspiration can also affect the changes in NDVI [51]. Concurrently, the impact of human activities on NDVI is complex and limited by existing social data and analysis methods; hence, we were not able to include a deep analysis of this critical aspect in our study. In applying the CA-Markov model to make a prediction, the data were resampled from high spatial resolution data to low spatial-resolution data, which had an effect on the precision of the final result. Moreover, the simulation process did not thoroughly consider the impact of future climate change and human activities on the results. Future studies could consider the predictions of the spatial position change of the transition zone under future climate scenarios.

5. Conclusions

The main conclusions are as follows:
(1)
We investigated the climatic factors affecting NDVI in the desert/grassland biome transition zone of the Sahel Region of Africa. The temperature in the desert/grassland biome transition zone showed an increasing trend, with an annual growth rate of 0.263 °C/10a, whereas the fluctuations in precipitation were relatively large, showing an insignificant decreasing trend. Precipitation and temperature showed significant spatial heterogeneity.
(2)
We explored the relationships between NDVI, climate change and human activities in the desert/grassland biome transition zone. The average NDVI value in the transition zone was 0.25, with sparse vegetation cover. From 1982 to 2015, the areas in which NDVI showed an increasing trend in the desert/grassland biome transition zone accounted for 74.4% of the total area, and most of the vegetation in the transition zone showed a trend toward restoration. NDVI was positively correlated with precipitation and negatively correlated with temperature, and the combined effects of precipitation and temperature were the main causes of NDVI changes. Human activities mostly promoted NDVI, whereas climate change was found to promote and inhibit NDVI with similar proportions. The contribution rate of human activities to the increase of vegetation was 97.7%, the contribution rate of climate factors to the increase of vegetation was 48.1%, and the contribution rate of both human activities and climate factors to the increase of vegetation was 47.5%.
(3)
We predicted the spatial variation of the desert/grassland biome transition zone in the next 30 years. The desert/grassland biome transition zone was predicted to expand to the north and south under the theoretical scenario; however, its changes are uncertain owing to the disturbances caused by climate factors and human activities.

Author Contributions

The authors’ contributions to this article are as follows: conceptualization, X.G. and J.L.; methodology, S.W.; validation, X.G.; formal analysis, X.G.; investigation, X.G. and N.Z.; resources, S.W.; data curation, S.W.; writing—original draft preparation, S.W.; writing—review and editing, X.G.; visualization, S.W.; supervision, X.G. and J.L.; project administration, X.G., N.Z. and Y.W.; funding acquisition, X.G and J.L. All authors have read and agreed to the published version of the manuscript.

Funding

This study was funded by the National Natural Science Foundation of China (grant umber 41861144020) and the National Key Research and Development Program of China- Joint Research on Technology to Combat Desertification for African Countries of the “Great Green Wall” (grant umber SQ2018YFGH000229).

Conflicts of Interest

The authors declare no conflict of interest.

References

  1. Piao, S.; Wang, X.; Park, T.; Chen, C.; Lian, X.; He, Y.; Bjerke, J.W.; Chen, A.; Ciais, P.; Tømmervik, H.; et al. Characteristics, drivers and feedbacks of global greening. Nat. Rev. Earth Environ. 2020, 1, 14–27. [Google Scholar] [CrossRef]
  2. Hou, J.; Du, L.; Liu, K.; Hu, Y.; Zhu, Y. Characteristics of vegetation activity and its responses to climate change in desert/grassland biome transition zones in the last 30 years based on GIMMS3g. Theor. Appl. Clim. 2018, 136, 915–928. [Google Scholar] [CrossRef]
  3. Cui, Y.; Fang, L.; Guo, X.; Wang, X.; Wang, Y.; Li, P.; Zhang, Y.; Zhang, X. Responses of soil microbial communities to nutrient limitation in the desert-grassland ecological transition zone. Sci. Total Environ. 2018, 642, 45–55. [Google Scholar] [CrossRef] [PubMed]
  4. Qinpu, L.; Zhenshan, L. Gray analysis on responses of desert/grassland biome transition zone to global warming-A case of the desert/grassland biome transition zone in New Mexico. J. Ecol. 2005, 24, 756–762. [Google Scholar]
  5. You, Y.; Ren, H.; Zhou, N.; Wang, Y. The Pan-African Great Green Wall Initiative and Its Development of Agriculture, Animal Husbandry & Forestry. World For. Res. 2019, 32, 85–90. [Google Scholar]
  6. O’Connor, D.; Ford, J.D. Increasing the Effectiveness of the “Great Green Wall” as an Adaptation to the Effects of Climate Change and Desertification in the Sahel. Sustainability 2014, 6, 7142–7154. [Google Scholar] [CrossRef] [Green Version]
  7. Shi, Y.; Jin, N.; Ma, X.; Wu, B.; He, Q.; Yue, C.; Yu, Q. Attribution of climate and human activities to vegetation change in China using machine learning techniques. Agric. For. Meteorol. 2020, 294, 108146. [Google Scholar] [CrossRef]
  8. Wu, L.; Wang, S.; Bai, X.; Tian, Y.; Luo, G.; Wang, J.; Li, Q.; Chen, F.; Deng, Y.; Yang, Y.; et al. Climate change weakens the positive effect of human activities on karst vegetation productivity restoration in southern China. Ecol. Indic. 2020, 115, 106392. [Google Scholar] [CrossRef]
  9. Jiang, H.; Xu, X.; Guan, M.; Wang, L.; Huang, Y.; Jiang, Y. Determining the contributions of climate change and human activities to vegetation dynamics in agro-pastural transitional zone of northern China from 2000 to 2015. Sci. Total Environ. 2020, 718, 134871. [Google Scholar] [CrossRef]
  10. Huang, S.; Zheng, X.; Ma, L.; Wang, H.; Huang, Q.; Leng, G.; Meng, E.; Guo, Y. Quantitative contribution of climate change and human activities to vegetation cover variations based on GA-SVM model. J. Hydrol. 2020, 584, 124687. [Google Scholar] [CrossRef]
  11. Yan, X.; Li, J.; Shao, Y.; Hu, Z.; Yang, Z.; Yin, S.; Cui, L. Driving forces of grassland vegetation changes in Chen Barag Banner, Inner Mongolia. Gisci. Remote Sens. 2020, 57, 753–769. [Google Scholar] [CrossRef]
  12. Meng, X.; Gao, X.; Li, S.; Lei, J. Spatial and Temporal Characteristics of Vegetation NDVI Changes and the Driving Forces in Mongolia during 1982–2015. Remote Sens. 2020, 12, 603. [Google Scholar] [CrossRef] [Green Version]
  13. Zida, W.A.; Bationo, B.A.; Waaub, J.-P. Re-greening of agrosystems in the Burkina Faso Sahel: Greater drought resilience but falling woody plant diversity. Environ. Conserv. 2020, 47, 174–181. [Google Scholar] [CrossRef]
  14. Holben, B.N. Characteristics of maximum-value composite images from temporal AVHRR data. Int. J. Remote Sens. 1986, 7, 1417–1434. [Google Scholar] [CrossRef]
  15. Wu, Q. A Python package for interactive mapping with Google Earth Engine. J. Open Source Softw. 2020, 5, 2305. [Google Scholar] [CrossRef]
  16. Hersbach, H.; Bell, B.; Berrisford, P.; Hirahara, S.; Horányi, A.; Muñoz-Sabater, J.; Nicolas, J.; Peubey, C.; Radu, R.; Schepers, D.; et al. The ERA5 global reanalysis. Q. J. R. Meteorol. Soc. 2020, 146, 1999–2049. [Google Scholar] [CrossRef]
  17. Huete, A. A soil-adjusted vegetation index (SAVI). Remote Sens. Environ. 1988, 25, 295–309. [Google Scholar] [CrossRef]
  18. Mann, H.B. Nonparametric tests against trend. Econometrica 1945, 13, 245–259. [Google Scholar] [CrossRef]
  19. Forthofer, R.N.; Lehnen, R.G. Rank Correlation Methods; Springer: Berlin/Heidelberg, Germany, 1981; Volume 8. [Google Scholar] [CrossRef]
  20. Evans, J.; Geerken, R. Discrimination between climate and human-induced dryland degradation. J. Arid. Environ. 2004, 57, 535–554. [Google Scholar] [CrossRef]
  21. Wessels, K.; Prince, S.; Malherbe, J.; Small, J.; Frost, P.; Vanzyl, D. Can human-induced land degradation be distinguished from the effects of rainfall variability? A case study in South Africa. J. Arid. Environ. 2007, 68, 271–297. [Google Scholar] [CrossRef]
  22. Biasutti, M. Rainfall trends in the African Sahel: Characteristics, processes, and causes. Wiley Interdiscip. Rev. Clim. Chang. 2019, 10, 591. [Google Scholar] [CrossRef] [PubMed] [Green Version]
  23. Dirmeyer, P.A.; Shukla, J. Albedo as a modulator of climate response to tropical deforestation. J. Geophys. Res. Space Phys. 1994, 99, 20863–20877. [Google Scholar] [CrossRef] [Green Version]
  24. Noilhan, J. A Simple Parameterization of Land Surface Processes for Meteorological Models. Mon. Weather Rev. 1989, 117, 536–549. [Google Scholar] [CrossRef]
  25. Zhu, L.; Meng, J.; Zhu, L. Applying Geodetector to disentangle the contributions of natural and anthropogenic factors to NDVI variations in the middle reaches of the Heihe River Basin. Ecol. Indic. 2020, 117, 106545. [Google Scholar] [CrossRef]
  26. Coe, M.T.; Foley, J.A. Human and natural impacts on the water resources of the Lake Chad basin. J. Geophys. Res. Space Phys. 2001, 106, 3349–3356. [Google Scholar] [CrossRef]
  27. Buma, W.G.; Lee, S.-I.; Seo, J.Y. Recent Surface Water Extent of Lake Chad from Multispectral Sensors and GRACE. Sensors 2018, 18, 2082. [Google Scholar] [CrossRef] [PubMed] [Green Version]
  28. Nemani, R.R.; Keeling, C.D.; Hashimoto, H.; Jolly, W.M.; Piper, S.C.; Tucker, C.J.; Myneni, R.B.; Running, S.W. Climate-Driven Increases in Global Terrestrial Net Primary Production from 1982 to 1999. Science 2003, 300, 1560–1563. [Google Scholar] [CrossRef] [Green Version]
  29. Zheng, K.; Wei, J.-Z.; Pei, J.-Y.; Cheng, H.; Zhang, X.-L.; Huang, F.-Q.; Li, F.-M.; Ye, J. Impacts of climate change and human activities on grassland vegetation variation in the Chinese Loess Plateau. Sci. Total Environ. 2019, 660, 236–244. [Google Scholar] [CrossRef]
  30. Sun, Y.; Yang, Y.; Zhang, L.; Wang, Z. The relative roles of climate variations and human activities in vegetation change in North China. Phys. Chem. Earth Parts A/B/C 2015, 87, 67–78. [Google Scholar] [CrossRef]
  31. Liu, Y.; Li, Y.; Li, S.; Motesharrei, S. Spatial and Temporal Patterns of Global NDVI Trends: Correlations with Climate and Human Factors. Remote Sens. 2015, 7, 13233–13250. [Google Scholar] [CrossRef] [Green Version]
  32. Wang, F.; An, P.; Huang, C.; Zhang, Z.; Hao, J. Is afforestation-induced land use change the main contributor to vegetation dynamics in the semiarid region of North China? Ecol. Indic. 2018, 88, 282–291. [Google Scholar] [CrossRef]
  33. Yosef, G.; Walko, R.; Avisar, R.; Tatarinov, F.; Rotenberg, E.; Yakir, D. Large-scale semi-arid afforestation can enhance precipitation and carbon sequestration potential. Sci. Rep. 2018, 8, 996. [Google Scholar] [CrossRef] [Green Version]
  34. Reij, C.; Tappan, G.; Smale, M.; Spielman, D.J.; Pandyalorch, R. Re-Greening the Sahel: Farmer-Led Innovation in Burkina Faso And Niger; International Food Policy Research Institute: Washington, DC, USA, 2009. [Google Scholar]
  35. Eklundh, L.; Olsson, L. Vegetation index trends for the African Sahel 1982–1999. Geophys. Res. Lett. 2003, 30, 4. [Google Scholar] [CrossRef]
  36. Kusserow, H. Desertification, Resilience and Re-greening in the African Sahel—A matter of the observation period? Earth Syst. Dynam. 2017, 8, 1141–1170. [Google Scholar] [CrossRef] [Green Version]
  37. Zhang, W.; Brandt, M.; Tong, X.; Tian, Q.; Fensholt, R. Impacts of the seasonal distribution of rainfall on vegetation productivity across the Sahel. Biogeosciences 2018, 15, 319–330. [Google Scholar] [CrossRef] [Green Version]
  38. Bashir, B.; Cao, C.; Naeem, S.; Joharestani, M.Z.; Xie, B.; Afzal, H.; Jamal, K.; Mumtaz, F. Spatio-Temporal Vegetation Dynamic and Persistence under Climatic and Anthropogenic Factors. Remote Sens. 2020, 12, 2612. [Google Scholar] [CrossRef]
  39. Heisler-White, J.L.; Blair, J.M.; Kelly, E.F.; Harmoney, K.; Knapp, A.K. Contingent productivity responses to more extreme rainfall regimes across a grassland biome. Glob. Chang. Biol. 2009, 15, 2894–2904. [Google Scholar] [CrossRef]
  40. Taylor, C.M. The influence of antecedent rainfall on Sahelian surface evaporation. Hydrol. Process. 2000, 14, 1245–1259. [Google Scholar] [CrossRef]
  41. Fan, D.; Ni, L.; Jiang, X.G.; Fang, S.F.; Wu, H.; Zhang, X.P. Spatiotemporal Analysis of Vegetation Changes Along the Belt and Road Initiative Region From 1982 to 2015. IEEE Access 2020, 8, 122579–122588. [Google Scholar] [CrossRef]
  42. Hu, Y.; Dao, R.; Hu, Y. Vegetation Change and Driving Factors: Contribution Analysis in the Loess Plateau of China during 2000–2015. Sustainability 2019, 11, 1320. [Google Scholar] [CrossRef] [Green Version]
  43. Liu, Z.; Liu, Y.; Li, Y. Anthropogenic contributions dominate trends of vegetation cover change over the farming-pastoral ecotone of northern China. Ecol. Indic. 2018, 95, 370–378. [Google Scholar] [CrossRef]
  44. Elagib, N.A.; Khalifa, M.; Babker, Z.; Musa, A.A.; Fink, A.H. Demarcating the rainfed unproductive zones in the African Sahel and Great Green Wall regions. Land Degrad. Dev. 2020. [Google Scholar] [CrossRef]
  45. Zhang, Y.; Peng, C.; Li, W.; Tian, L.; Zhu, Q.; Chen, H.; Fang, X.; Zhang, G.; Liu, G.; Mu, X.; et al. Multiple afforestation programs accelerate the greenness in the ‘Three North’ region of China from 1982 to 2013. Ecol. Indic. 2016, 61, 404–412. [Google Scholar] [CrossRef]
  46. Anzhou, Z.; Anbing, Z.; Chunyan, L.; Dongli, W.; Haixin, L. Spatiotemporal Variation of Vegetation Coverage before and after Implementation of Grain for Green Project in the Loess Plateau. Ecol. Eng. 2017, 104, 13–22. [Google Scholar]
  47. Firozjaei, M.K.; Sedighi, A.; Argany, M.; Jelokhani-Niaraki, M.; Arsanjani, J.J. A geographical direction-based approach for capturing the local variation of urban expansion in the application of CA-Markov model. Cities 2019, 93, 120–135. [Google Scholar] [CrossRef]
  48. Wang, L.; Yu, D.; Liu, Z.; Yang, Y.; Zhang, J.; Han, J.; Mao, Z. Study on NDVI changes in Weihe Watershed based on CA-Markov model. Geol. J. 2018, 53, 435–441. [Google Scholar] [CrossRef]
  49. Willis, K.J.; Jeffers, E.S.; Tovar, C. What makes a terrestrial ecosystem resilient? Science 2018, 359, 988–989. [Google Scholar] [CrossRef] [PubMed]
  50. Fensholt, R.; Proud, S.R. Evaluation of Earth Observation based global long term vegetation trends—Comparing GIMMS and MODIS global NDVI time series. Remote Sens. Environ. 2012, 119, 131–147. [Google Scholar] [CrossRef]
  51. Norris, J.R.; Walker, J.J. Solar and sensor geometry, not vegetation response, drive satellite NDVI phenology in widespread ecosystems of the western United States. Remote Sens. Environ. 2020, 249, 112013. [Google Scholar] [CrossRef]
Figure 1. Geographical location of the study area, meteorological stations, three selected areas (Niamey, Eastern Wad Madani, South Niger), original Great Green Wall (GGW) path and updated GGW path.
Remotesensing 12 04119 g001
Figure 2. Extraction flow chart of the desert/grassland biome transition zone in the Sahel region of Africa, based on the Google Earth Engine (GEE) platform.
Remotesensing 12 04119 g002
Figure 3. Spatial location of the desert/grassland biome transition zone and the sampling points for the random forest method in 2001, 2010 and 2019.
Remotesensing 12 04119 g003
Figure 4. (a) Variations in temperature and precipitation in the desert/grassland biome transition zone from 1982 to 2015. (b) Mann–Kendall (M–K) trend of precipitation in the desert/grassland biome transition zone from 1982 to 2015. (c) M–K trend of temperature in the desert/grassland biome transition zone from 1982 to 2015.
Remotesensing 12 04119 g004
Figure 5. (a) Coefficient of variation (CV) of annual precipitation in the desert/grassland biome transition zone from 1982 to 2015. (b) CV of annual temperature in the desert/grassland biome transition zone from 1982 to 2015.
Remotesensing 12 04119 g005
Figure 6. Average NDVI in the desert/grassland biome transition zone in the Sahel region of Africa from 1982 to 2015.
Remotesensing 12 04119 g006
Figure 7. (a) Annual NDVI and growing season NDVI in the desert/grassland biome transition zone in 1982–2015. (b) M–K trend of growing season NDVI in the desert/grassland biome transition zone from 1982 to 2015. UF is the order statistics of the NDVI in the growing season data, UB is the reversed order statistics of the NDVI in the growing season data.
Remotesensing 12 04119 g007
Figure 8. Trend of NDVI in the desert/grassland biome transition zone from 1982 to 2015.
Remotesensing 12 04119 g008
Figure 9. Stability of NDVI in the desert/grassland biome transition zone from 1982 to 2015.
Remotesensing 12 04119 g009
Figure 10. (a) Correlation coefficient between precipitation and NDVI from 1982 to 2015. (b) Significance testing of the correlation between precipitation and NDVI from 1982 to 2015. (c) Correlation coefficient between temperature and NDVI from 1982 to 2015. (d) Significance testing of the correlation between temperature and NDVI from 1982 to 2015.
Remotesensing 12 04119 g010
Figure 11. (a) Coefficient of partial correlation between precipitation and NDVI from 1982 to 2015. (b) Significance testing of partial correlation between precipitation and NDVI from 1982 to 2015. (c) Coefficient of partial correlation between temperature and NDVI from 1982 to 2015. (d) Significance testing of the partial correlation between temperature and NDVI from 1982 to 2015.
Remotesensing 12 04119 g011
Figure 12. (a) Coefficient of multiple correlation between climate factors (temperature and precipitation) and NDVI from 1982 to 2015. (b) Significance testing of multiple correlation between climate factors (temperature and precipitation) and NDVI from 1982 to 2015.
Remotesensing 12 04119 g012
Figure 13. (a) NDVI difference before and after “sudden precipitation events”. (b) NDVI difference before and after “extremely low temperature events”. (c) NDVI difference before and after “extremely high temperature events”.
Remotesensing 12 04119 g013
Figure 14. (a) Impact of climate factors on vegetation in the desert/grassland biome transition zone from 1982 to 2015. (b) Impact of human activities on vegetation in the desert/grassland biome transition zone from 1982 to 2015. (c) Spatial distribution of driving factors for significant vegetation restoration and degradation in the desert/grassland biome transition zone from 1982 to 2015.
Remotesensing 12 04119 g014
Figure 15. Niamey. (a) The yellow area represents the inhibition of NDVI by human activities. (b) The pink area represents the inhibition of NDVI by climate change. (c) The orange represents the inhibition of NDVI by climate change and human activities. (di) The impervious areas in 1985, 1990, 2000, 2005, 2010, 2015.
Remotesensing 12 04119 g015
Figure 16. Eastern Wad Madani. (a) The yellow color area represents the inhibition of NDVI by human activities. (b) The pink area represents the inhibition of NDVI by climate change. (c) The orange area represents the inhibition of NDVI by climate change and human activities. (di) Google Earth high-resolution remote-sensing image of Eastern Wad Madani area in 1985, 1990, 2000, 2005, 2010, 2015.
Remotesensing 12 04119 g016
Figure 17. Southern Niger. (a) The light green area represents the promotion of NDVI by human activities. (b) The beryl green area represents the promotion of NDVI by climate change. (c) The leaf green represents the promotion of NDVI by climate change and human activities. (d,e) land use and vegetation in a village in southern Zinder region (Niger) in 1975, and 2005. Remote-sensing imagery courtesy of Dr. G. Tappan.
Remotesensing 12 04119 g017
Figure 18. Predicted results of spatial locations of the desert/grassland biome transition zones for (a) 2019, (b) 2028, (c) 2037, (d) 2046, and (e) 2055.
Remotesensing 12 04119 g018
Table 1. Calculation formulas of remote sensing indexes.
IndexBand Math
NDVI(NIR-R)/(NIR + R)
NDWI(Green-NIR)/(Green + NIR)
NDBI(MIR-NIR)/(MIR + NIR)
RVINIR/R
SAVI(NIR-R) × (1 + L)/(NIR + R + L)
MNDWI(Green-MIR)/(Green + MIR)
Table 2. Stability of the NDVI in the desert/grassland biome transition zone in the Sahel region of Africa.
StabilityCoefficient of VariationProportion
High stability0–0.05771724.27%
Higher stability0.057717–0.07631935.31%
Medium stability0.076319–0.09806726.33%
Lower stability0.098067–0.13340112.03%
Low stability0.133401–0.40512.05%
Table 3. Impact of climate change on NDVI.
ImpactSlope of NDVIccProportion
Heavy promote0.00063–0.00200142.4%
Medium promote0.000179–0.00063
Lightly promote0.00001–0.0000179
Lightly restrain−0.000772–−0.00000157.6%
Medium restrain−0.001394–−0.000772
Heavy restrain−0.005706–−0.001394
Table 4. Impact of human activities on NDVI.
ImpactSlope of NDVIccProportion
Heavy promote0.004108–0.00638490%
Medium promote0.002781–0.004108
Lightly promote0.000001–0.002781
Lightly restrain−0.001594–−0.00000110%
Medium restrain−0.00598–−0.001594
Heavy restrain−0.012195–−0.00598
Publisher’s Note: MDPI stays neutral with regard to jurisdictional claims in published maps and institutional affiliations.

