Technical Note

An Ensemble Modeling Framework for Distinguishing Nitrogen, Phosphorous and Potassium Deficiencies in Winter Oilseed Rape (Brassica napus L.) Using Hyperspectral Data

1
School of Resources and Environment, Huazhong Agricultural University, Wuhan 430070, China
2
Key Laboratory of Arable Land Conservation (Middle and Lower Reaches of Yangtze River), Ministry of Agriculture, Wuhan 430070, China
3
School of Geography and Information Engineering, China University of Geosciences (Wuhan), Wuhan 430078, China
*
Author to whom correspondence should be addressed.
Remote Sens. 2020, 12(24), 4060; https://doi.org/10.3390/rs12244060
Submission received: 31 October 2020 / Revised: 1 December 2020 / Accepted: 9 December 2020 / Published: 11 December 2020

Abstract

:
Nitrogen (N), phosphorous (P), and potassium (K) are important macronutrients to crops. Deficiencies of these nutrients can change the pigment content in leaves and affect photosynthesis, resulting in the similar spectral characteristics at some wavelengths. Thus, one of the most important challenges in crop nutrient stress assessment through the canopy’s spectral reflectance is the ability to discriminate different nutrient stress conditions. This study proposes a three-layer ensemble-modeling framework to analyze N, P, and K nutrient stresses utilizing canopy hyperspectral data of crops. The framework selects spectral bands that are sensitive to N, P, and K nutrient deficiency levels, using ensembles of random forest classifiers, and then the reflectance of the selected bands is transformed into the more distinguishable probability features to diagnose the N, P, and K nutrient deficiency levels. For this study, this proposed framework was applied to winter oilseed rape (Brassica napus L.) during the overwintering stage, with 915 spectra samples collected from 14 field experiments. The analysis of nutrient deficiency levels resulting from the proposed framework was compared with that of single random forest, support vector machine, and artificial neural network classifiers, using the same reflectance features selected in the first layer of the framework. The overall accuracy of the nutrient deficiency analysis achieved by the proposed framework reached 80.76%, which was 16.55%, 18.43%, and 35.74% higher than the single random forest, support vector machine, and artificial neural network classifiers, respectively. The proposed framework demonstrated competitive advantages in differentiating the medium deficiency of N and K, and the severe deficiency of K from the normal conditions, boosting the accuracy from below 25% to above 50% because the probability features enhanced the differences among nutrient deficiency levels.

Graphical Abstract

1. Introduction

Optimal management of mineral nutrients is critical for ensuring crop yield and food quality [1] and for minimizing the negative environmental impact of fertilization [2,3]. Traditional approaches to determine fertilization rely on soil composition analysis or the chemical content of leaves. These methods are time consuming, expensive, and destructive, making them difficult to apply on a large scale.
Multispectral and hyperspectral remote sensing systems (i.e., satellites and spectroradiometers) provide a non-invasive technique to assess crop nutrient status through the leaf or canopy spectra. Previous studies have mainly focused on estimating nitrogen (N) content in crops and have achieved very encouraging results [4,5,6,7,8]. The close relationship between chlorophyll (Chl) and N content in plants is the foundation of most remote sensing approaches to assess plant N status [8,9]. Leaf and canopy N content are either estimated using vegetation indices that are sensitive to Chl and N content [5,6] or with the full spectrum using multivariate regression models [7].
Despite the encouraging results achieved for N, the knowledge and experience gained regarding remote assessment of nutrient status other than N in field crops or other plants are still limited. Masoni et al. [10] studied the effects of iron (Fe), sulfur (S), magnesium (Mg), and manganese (Mn) deficiencies on the reflectance of barley, wheat, corn, and sunflower leaves. They concluded that in all species, nutrient deficiency reduced the Chl concentration, thereby increasing the reflectance at 400–1100 nm and shortening the red-edge position. Ponzoni and Goncalves [11] found that phosphorus (P) deficit in Eucalyptus saligna was strongly correlated with leaf reflectance in the green band (~550 nm). Ayala-Silva and Beyl [12] observed a significant Chl concentration reduction in wheat when grown in a greenhouse under independent P and potassium (K) deficits. Pimstein et al. [13] and Ramoelo et al. [14] estimated foliar P, K, and other nutrient concentrations using the full spectrum (400–2500 nm, with the removal of noise bands) and the partial least square regression model. Qualitative analyses of the hyperspectral reflectance signatures of lettuce and grapevine leaves in response to macronutrient deficiencies were performed by Pacumbaba and Beyl [15] and Rustioni et al. [16], respectively. Most of these studies identified wavelengths that were sensitive to a particular nutrient deficiency; however, they also revealed similarities in the canopy spectra under different nutrient stresses.
Most nutrient stresses result in a decreased Chl concentration in the leaves [15,16,17]. This apparent chlorosis causes similar spectral signatures in response to different mineral nutrient deficiencies, making it challenging to distinguish different nutrient stress conditions through the canopy spectra [18]. However, despite the common Chl concentration change in crop leaves, different nutrient deficiencies cause distinct biochemical and physiological changes in crops. Considering the macronutrients N, P, and K as examples, it was found that N deficiency generally causes a decrease in chlorophyll content in leaves and protein content in dry matter [19,20], since a large amount of N is invested in proteins within the leaf cells N [21]. P deficiency reduces plant growth from the earliest stages of development, adversely affecting cell division and expansion [22]. The older leaves turn purplish due to anthocyanin pigment accumulation under P deficiency [23]. K plays a critical role in osmoregulation of water usage; therefore, severe K deficiency is associated with a decrease in leaf water content [24]. These distinct biochemical and physiological changes associated with different nutrient stresses may cause nuances in canopy spectra. Osborne et al. [25] and Li et al. [26] discovered that in corn and winter oilseed rape, the significant spectral response in the near-infrared (NIR) region to the P stress was probably caused by the increase in the number of cells per unit of leaf area in P-stressed plants. Jorgensen et al. [27] distinguished between N, P, and K deficiencies and the non-deficient conditions in spring barley plants using hyperspectral reflectance measurements and a stepwise multiway partial least square regression model. Therefore, the key to distinguishing different nutrient stresses in crops is to compose diverse input features and maximize differences among spectral signatures under mineral nutrient stresses.
An effective alternative to enhance the input diversity and improve overall performance of the model is to generate an ensemble of several approaches [28]. The idea of the ensemble is to combine different methods to improve the robustness of the results, particularly in addressing difficult tasks, such as land cover mapping in urban systems. Multiple model ensembles have been successfully applied to estimate leaf biochemical traits [29] and improve the land-use/land-cover classification accuracy [28,30,31]. Since crops show similar spectral responses to mineral nutrient deficiencies, the objective of this study is to propose an ensemble-modeling framework to derive features that are more distinguishable based on the hyperspectral reflectance data and achieve an accurate identification of the element and the degree of crop mineral nutrient stress.
Winter oilseed rape (Brassica napus L.), which is one of the most important oilseed crops in the world, was chosen as a model crop species to evaluate the performance of the proposed framework. The Yangtze River Basin in China accounts for one-fifth of the rapeseed production and cultivation area in the world [32]. Winter oilseed rape in this area is usually grown in rotation with rice, cotton, or soybean, and as such, the soil nutrient supply is limited [33]. Among the mineral nutrients, N, P, and K are particularly important for winter oilseed rape in the Yangtze River Basin [34]. In this study, the proposed ensemble framework transforms the original reflectance features of winter oilseed rape under N, P, and K stresses into new probability features that are more distinguishable for determining the nutrient deficiency levels. To evaluate the performance of the proposed framework, we compared the accuracy of the results derived from the proposed framework with those derived from a single classifier using the reflectance features.

2. Materials and Methods

2.1. Experiment Design

From 2013–2019, 14 nutrient fertilization experiments were conducted at three study sites in the Hubei Province, located in Central China. The study sites have a humid sub-tropical monsoon climate. The annual mean air temperature measured at local weather stations during 2014–2018 was 17.27–17.86 °C and annual precipitation was 1161–1942 mm. Each experiment site was divided into multiple of plots, and randomly subjected to N, P, or K fertilization treatments with 3 to 6 replications for each treatment. Table 1 provides a summary of the location, cultivar, fertilization rates, and the number of samples used in the analysis of each experiment. Fertility status of the top soil (0–20 cm) in three study sites was provided in Table 2. N, P, or K fertilization treatments were applied omitting one nutrient at a time on the assumption that other nutrients were at sufficient and not excessive levels. Please refer to Li et al. [35], Liu et al. [36], and Lu et al. [37] for details of fertilizer applications. Commercial herbicides, insecticides, fungicides, and irrigation were applied in the fields following the local standard practices for winter oilseed rape production. No visual symptoms of diseases and water stress were observed during the growth season.

2.2. Data

Canopy reflectance measurements and ground sampling were conducted in mid-January, corresponding to the over-wintering stage of winter oilseed rape. We evaluated the proposed framework using data collected during the over-wintering stage, because topdressing fertilization was recommended at this time by experts [38]. Canopy reflectance data were collected in the 14 nutrient fertilization experiments using a PSR + 3500 field spectrometer (Spectral Evolution, Haverhill, MA, USA) and an Analytical Spectral Devices Field Spec Pro spectrometer (ASD, Boulder, CO, USA), and 3 to 5 canopy spectra were collected in each plot. Canopy radiance was measured by the fiber-optic sensor with a 25° field of view. The sensor was placed 1 m above the canopy in a nadir position. Radiance of a BaSO4 reference panel was measured as the standard before the canopy spectra measurements. Canopy reflectance was calculated automatically as a ratio of canopy radiance to standard radiance. In total, 915 spectra samples were used in this study, of which 427, 286, and 202 spectra samples were for the N, P, and K fertilization experiments, respectively.
Raw reflectance spectra were averaged to 10 nm bandwidths, in agreement with the bandwidth of the Airborne Visible/Infrared Imaging Spectrometer instrument [39]. Bands shorter than 400 nm, between 1800–2000 nm in length, and longer than 2300 nm were deleted because of their low signal-to-noise-ratio. Each spectrum was then labeled with the nutrient level (severe, medium, normal, and excessive) according to the nutrient fertilizer application rates (Table 3). This classification of the nutrient deficiency level was determined by the yield response curve (Figure A1) and the local expert suggestions. Thus, for each nutrient, there were four sub datasets of different nutrient deficiency levels. Within each nutrient deficiency level dataset, the mean and standard deviation of the spectra were computed and then each spectrum was examined to identify anomalies. If there were more than 20 bands with reflectance higher or lower than twice the standard deviation, the spectrum was eliminated from the dataset.
Seventy percent of the canopy spectra were randomly selected from each sub dataset as the training dataset, and the remaining samples were used as the independent validation dataset. The sub datasets were grouped with different combinations according to the needs of the band selection and nutrient deficiency discrimination.
In addition to canopy reflectance spectra data, leaf samples were collected and the leaf nitrogen concentration (LNC, %), leaf phosphorous concentration (LPC, %), and leaf potassium concentration (LKC, %) were measured for a few of the experiments (Table 1). All fully expanded leaves were collected from three individual plants per treatment to determine the LNC, LPC, and LKC in the lab. The detailed methods of measuring LNC, LPC, and LKC are described in Li et al. (2018) and Lu et al. (2020). Measurements of the three sampled plants were averaged as the value of each treatment.

2.3. Methodology

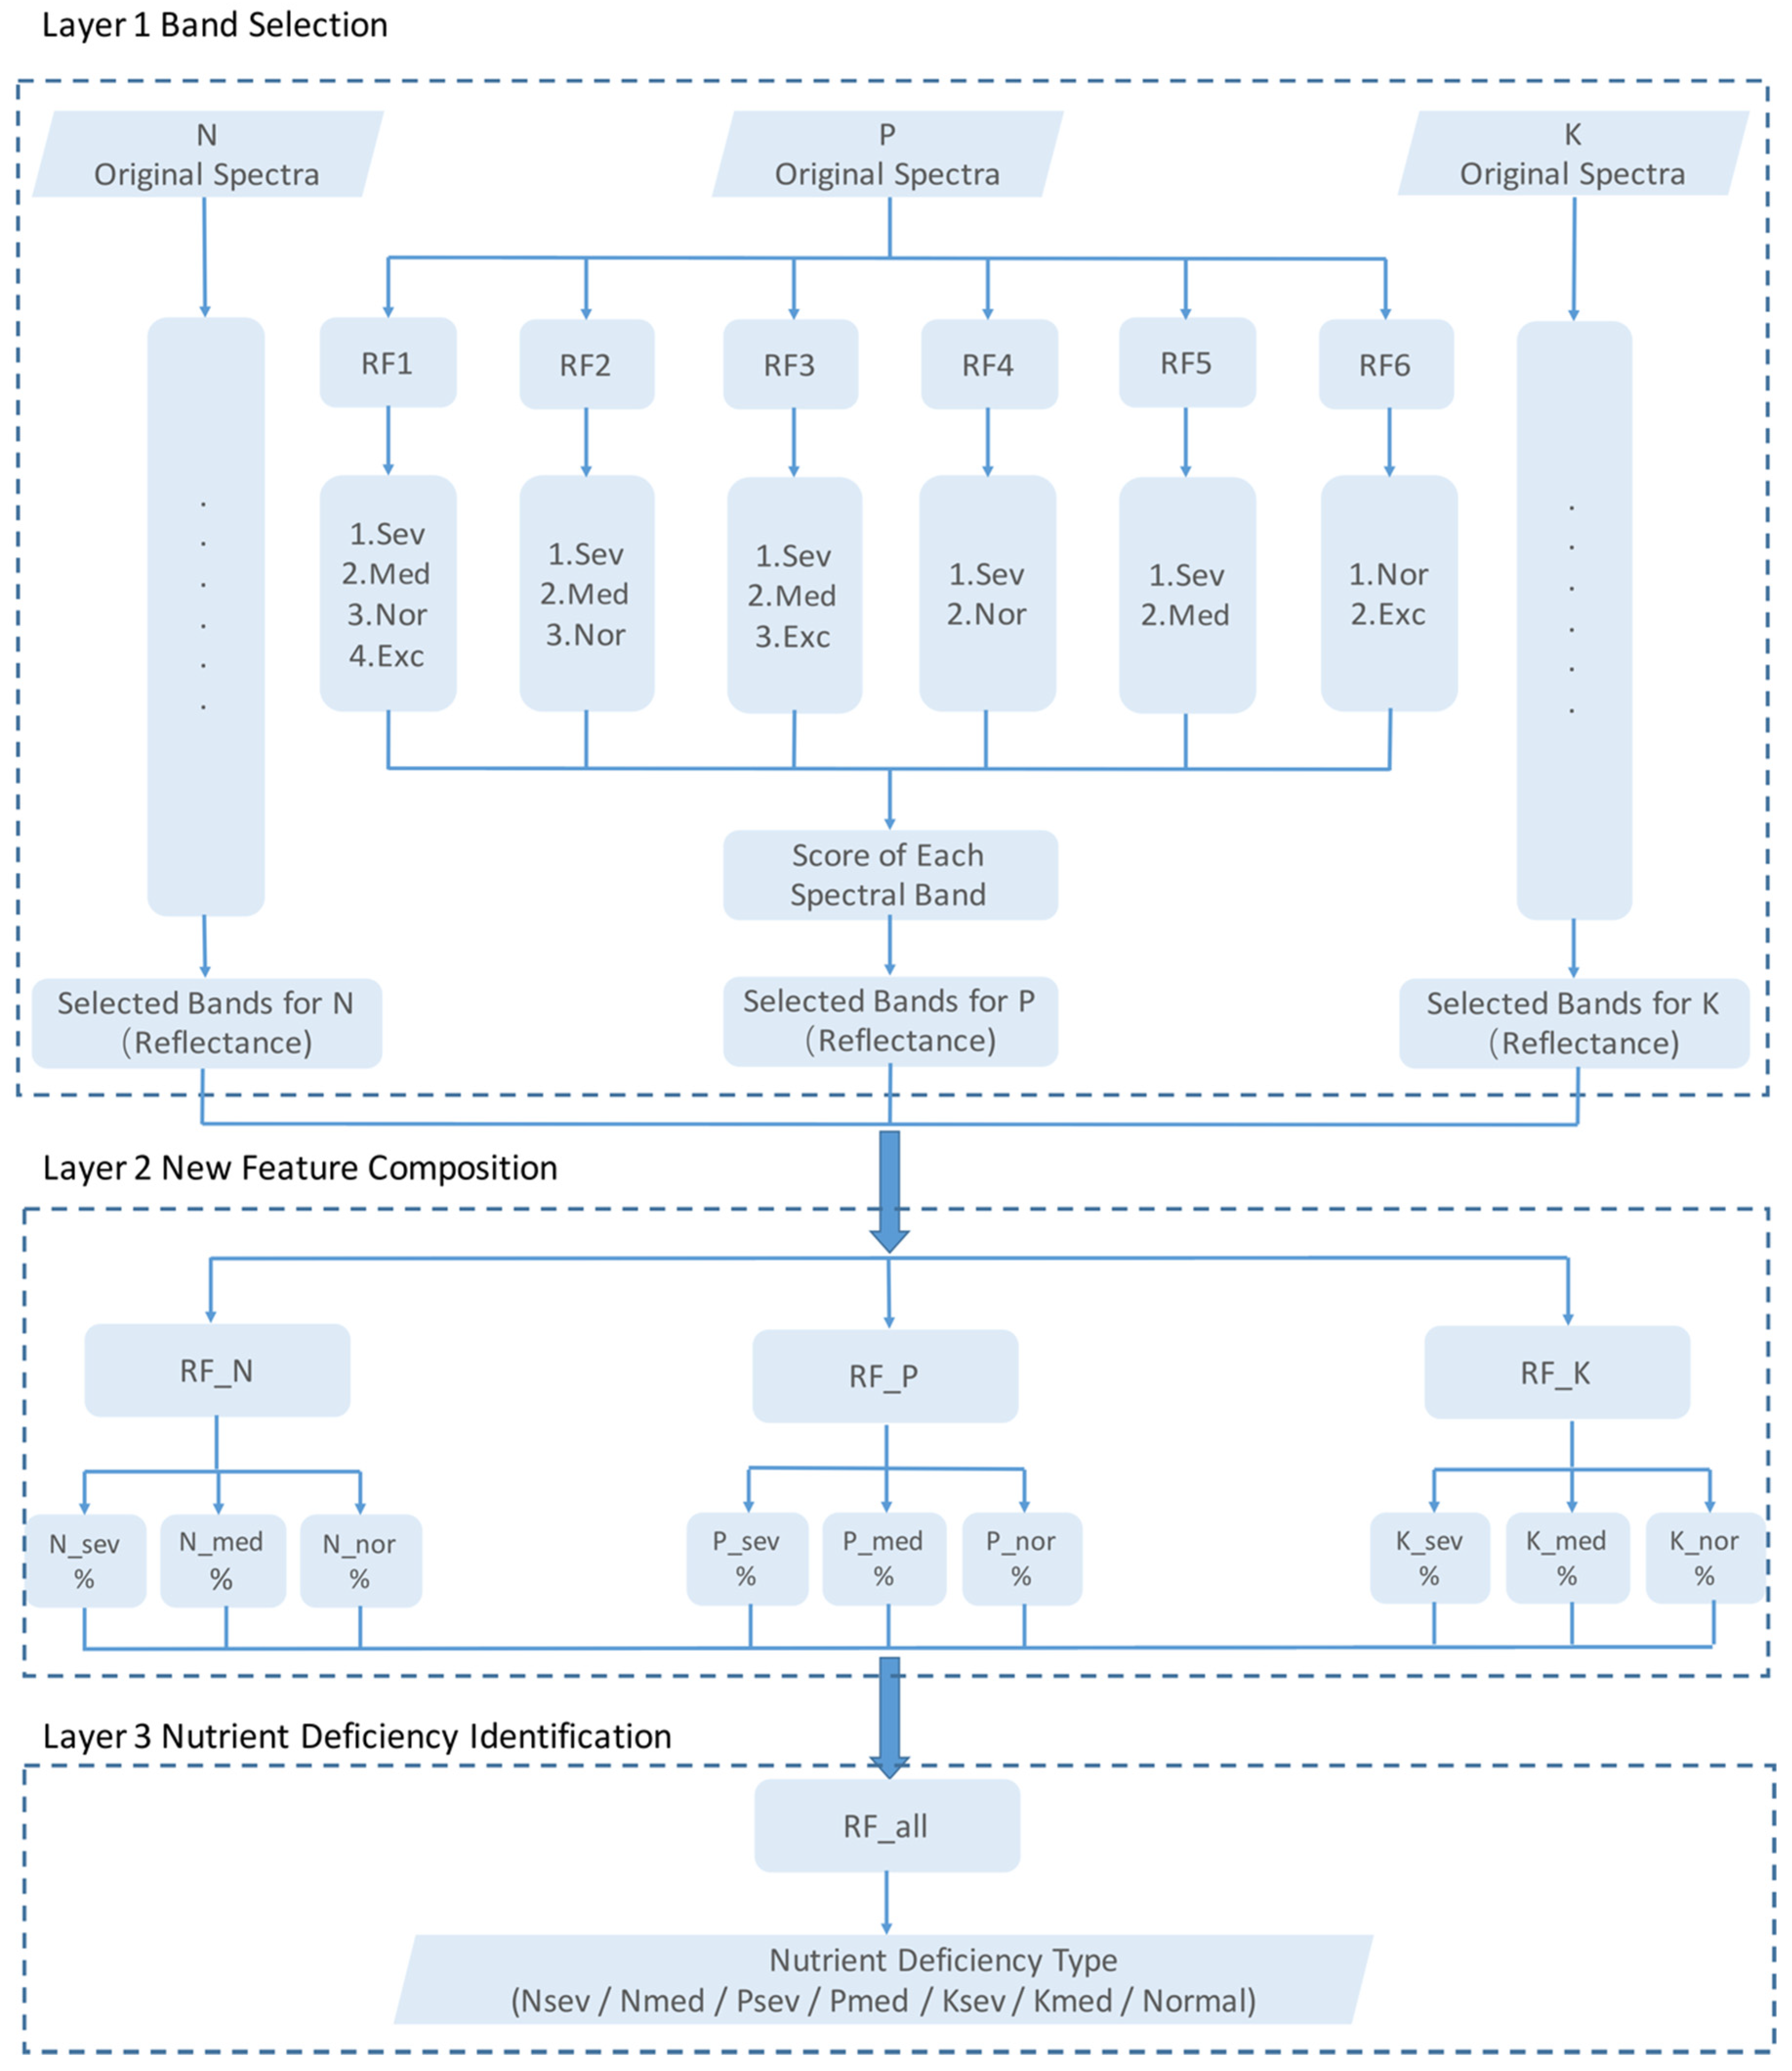
2.3.1. Framework Overview

Figure 1 shows the proposed framework workflow, which includes three layers. The first layer aims to reduce the dimension of hyperspectral data by selecting the spectral bands that are sensitive to the different degrees of N, P, and K deficiency. To achieve reliable results for each nutrient, the band selections were based on variable importance (VI) values derived from six models and used different subsets of data. In the second layer, the selected bands were used to train the N, P, and K deficiency models. Each nutrient deficiency model generated the probabilities of the three nutrient levels (severe, medium, and normal). Nine probabilities derived from the N, P, K deficiency models showing the probability of a spectrum being diagnosed as severe deficiency (denoted as N_sev%, P_sev%, and K_sev%), medium deficiency (denoted as N_med%, P_med%, and K_med%), or the normal condition (denoted as N_nor%, P_nor%, and K_nor%) of the N, P, and K nutrients, composed a new feature for the next layer. The third layer classified the spectra as a severe N (Nsev), medium N (Nmed), severe P (Psev), medium P (Pmed), severe K (Ksev), medium K (Kmed) deficiency, or a normal condition (Normal) with the new probability features.
The random forest (RF) classifier was used in this study for both band selection and nutrient deficiency analysis because RF contains a comparatively small number of model parameters required to be specified by the user, minimizes the risk of overfitting, and automatically computes a VI score that assesses the contribution of individual predictors to the model [40]. The model parameters that need to be specified to fit an RF classifier are the number of variables selected at each split (mtry) and the overall number of trees (ntree) that are grown. To determine the optimal values of these two parameters, ntree value was tested from 100 to 1000 at an interval of 100; mtry was tested from 3 to 10 in the first layer with the original hyperspectral data as inputs, and mtry was tested for 2, 3, and 4 in the second and the third layer. The ntree and mtry values were optimized by minimizing the out-of-bag error of the predictions [41]. RF classifiers were built in Python 3.5, using the library of sklearn 0.19.

2.3.2. Selecting Effective Spectral Bands

To improve the reliability and robustness of spectral band selection, the results of six classifiers that were trained with different data sources were fused. The original hyperspectral data were split into six smaller data sources with different combinations of nutrient deficiency levels. Each data source underwent a preliminary classification using a trained RF classifier and within each RF classifier, the VI of the input features was calculated using the mean decrease in Gini. VI was then normalized (VI′) using the mean (μ) and standard deviation (σ) of each classification as follows:
  VI = V I μ σ
The score of each spectral band as the weighted sum of VI′ derived from six classifiers was then calculated as follows:
s c o r e = i = 1 6 w i V I i
where wi is the accuracy of each classification.
After assessing the accuracy of 5, 10, 15, and 20 spectral bands as the model input, ten spectral bands that had the highest scores were selected for each nutrient (N, P, and K).

2.3.3. Composing New Features and Identifying Nutrient Deficiency

In the second layer of the framework, the selected spectral bands were utilized to train the RF classifier to generate the probabilities of the deficiency level for each nutrient. In total, three models were developed for N, P, and K that generated nine probabilities showing the probability of a spectrum being identified as severe deficiency (denoted as N_sev%, P_sev%, and K_sev%), medium deficiency (denoted as N_med%, P_med%, and K_med%), or normal condition (denoted as N_nor%, P_nor%, and K_nor%). These nine probabilities served as inputs for the secondary model. In the third layer, the secondary RF classifier was developed to identify the nutrient deficiency level (Nsev, Nmed, Psev, Pmed, Ksev, Kmed, or normal) with training samples.

2.3.4. Evaluating the Performance of the Framework

To evaluate the capabilities of the proposed framework in distinguishing the nutrient deficiency levels, the classification results of the single RF classifier, the support vector machine (SVM) classifier, and the artificial neural network (ANN) classifiers were used as the benchmark. The SVM was trained with a Gaussian radial basis function [42]. A feed forward back-propagation multi-layer algorithm was used in this ANN implementation, because it is widely used in remote sensing studies [43,44,45]. The two hidden layers were introduced to increase the network’s ability to model complex tasks [46]. The input layer of ANN consisted of 30 neurons corresponding to the reflectance of 30 bands selected by the first layer of the framework. The output layer of ANN consisted of 7 neurons representing seven nutrient deficiency levels. The number of neurons in the hidden layers (m) was calculated by the equation in Shibata and Ikeda [47]:
m = N i N o
where Ni is the number of input neurons and No is the number of output neurons. Dozens of the ANN architecture of were then tested by adjusting m around the value calculated by the Equation (3). ANN with 4 neurons in the first layer and 7 neurons in the second layer was used in this study because it yielded the highest overall accuracy.
For comparison, the training and validation datasets used to generate the benchmark were the same as those used in the proposed framework. The single RF, SVM, and ANN classifiers were trained separately with the reflectance of the spectral bands selected in Section 2.2, to identify the nutrient deficiency level directly. The classification accuracy was then evaluated with the same independent validation samples for both the proposed framework and the benchmark. Three indicators were calculated in a confusion matrix to evaluate the accuracy of the models, including the overall accuracy, producer’s accuracy, and user’s accuracy. The overall accuracy described the percentage of all the spectral samples that were classified correctly. The producer’s accuracy offered the percentage of the spectral samples of a certain category that was classified as such. The user’s accuracy offered the percentage of the samples classified as a certain category that was actually correct.

3. Results

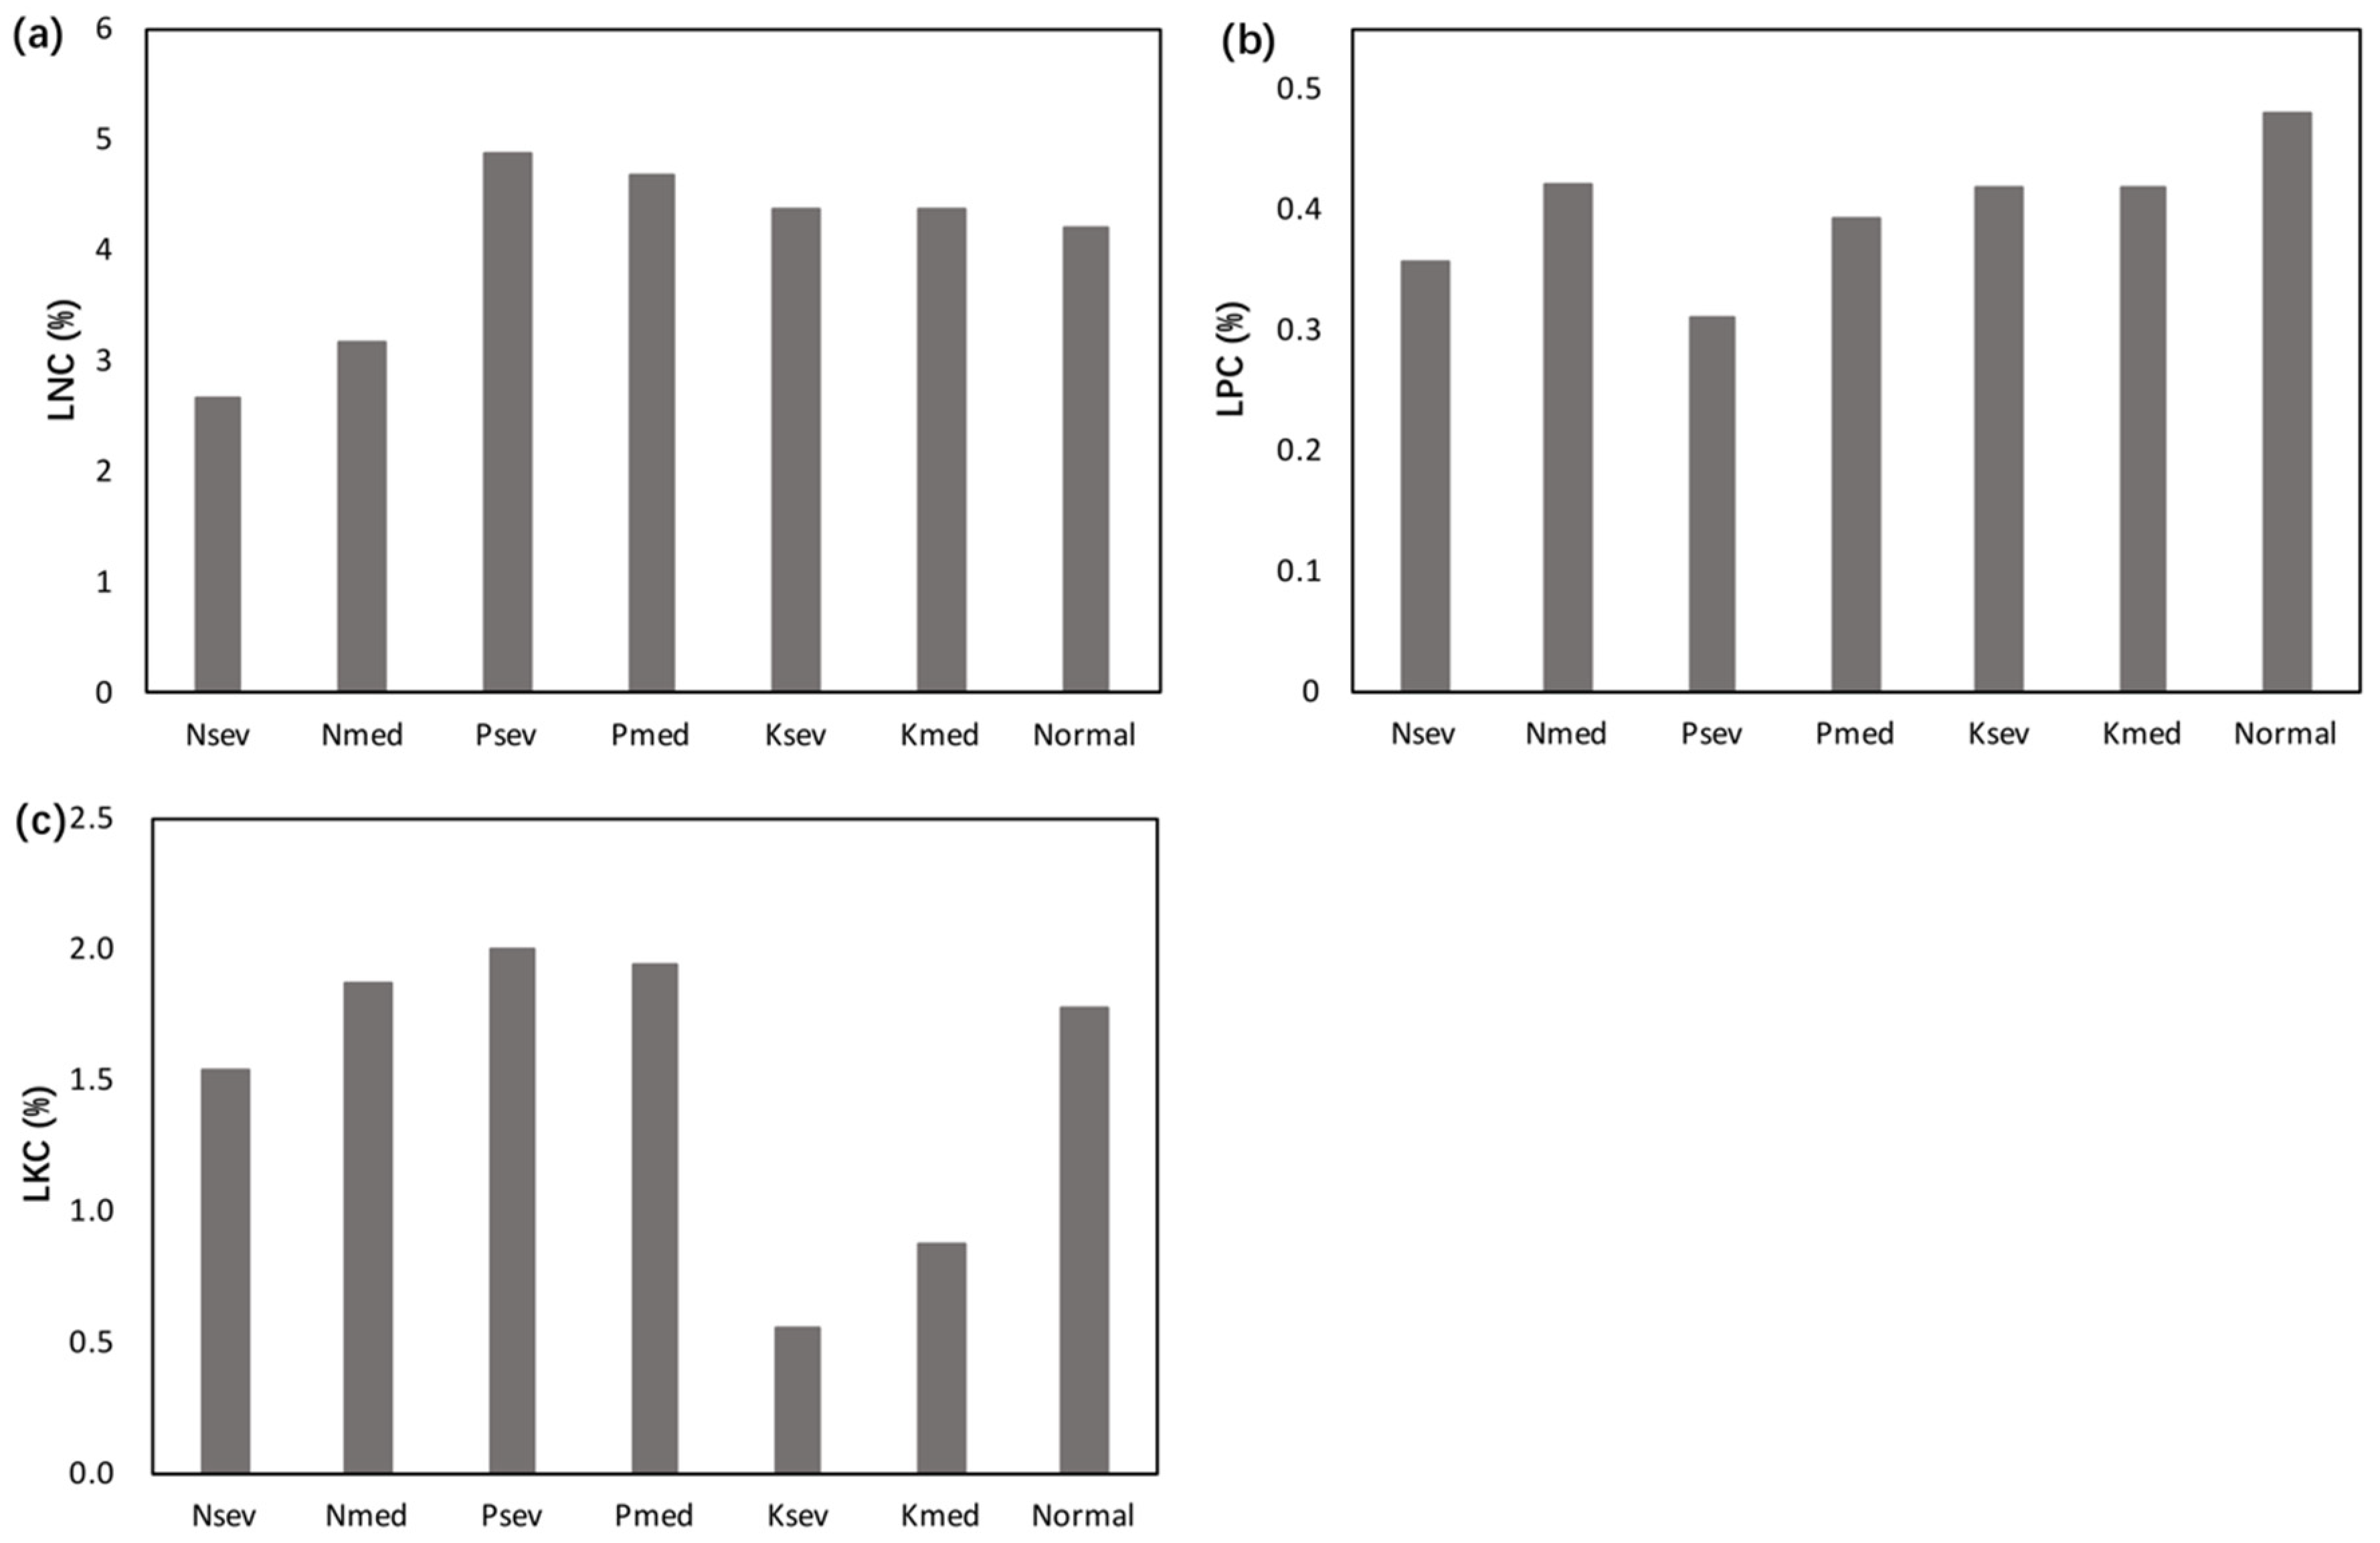
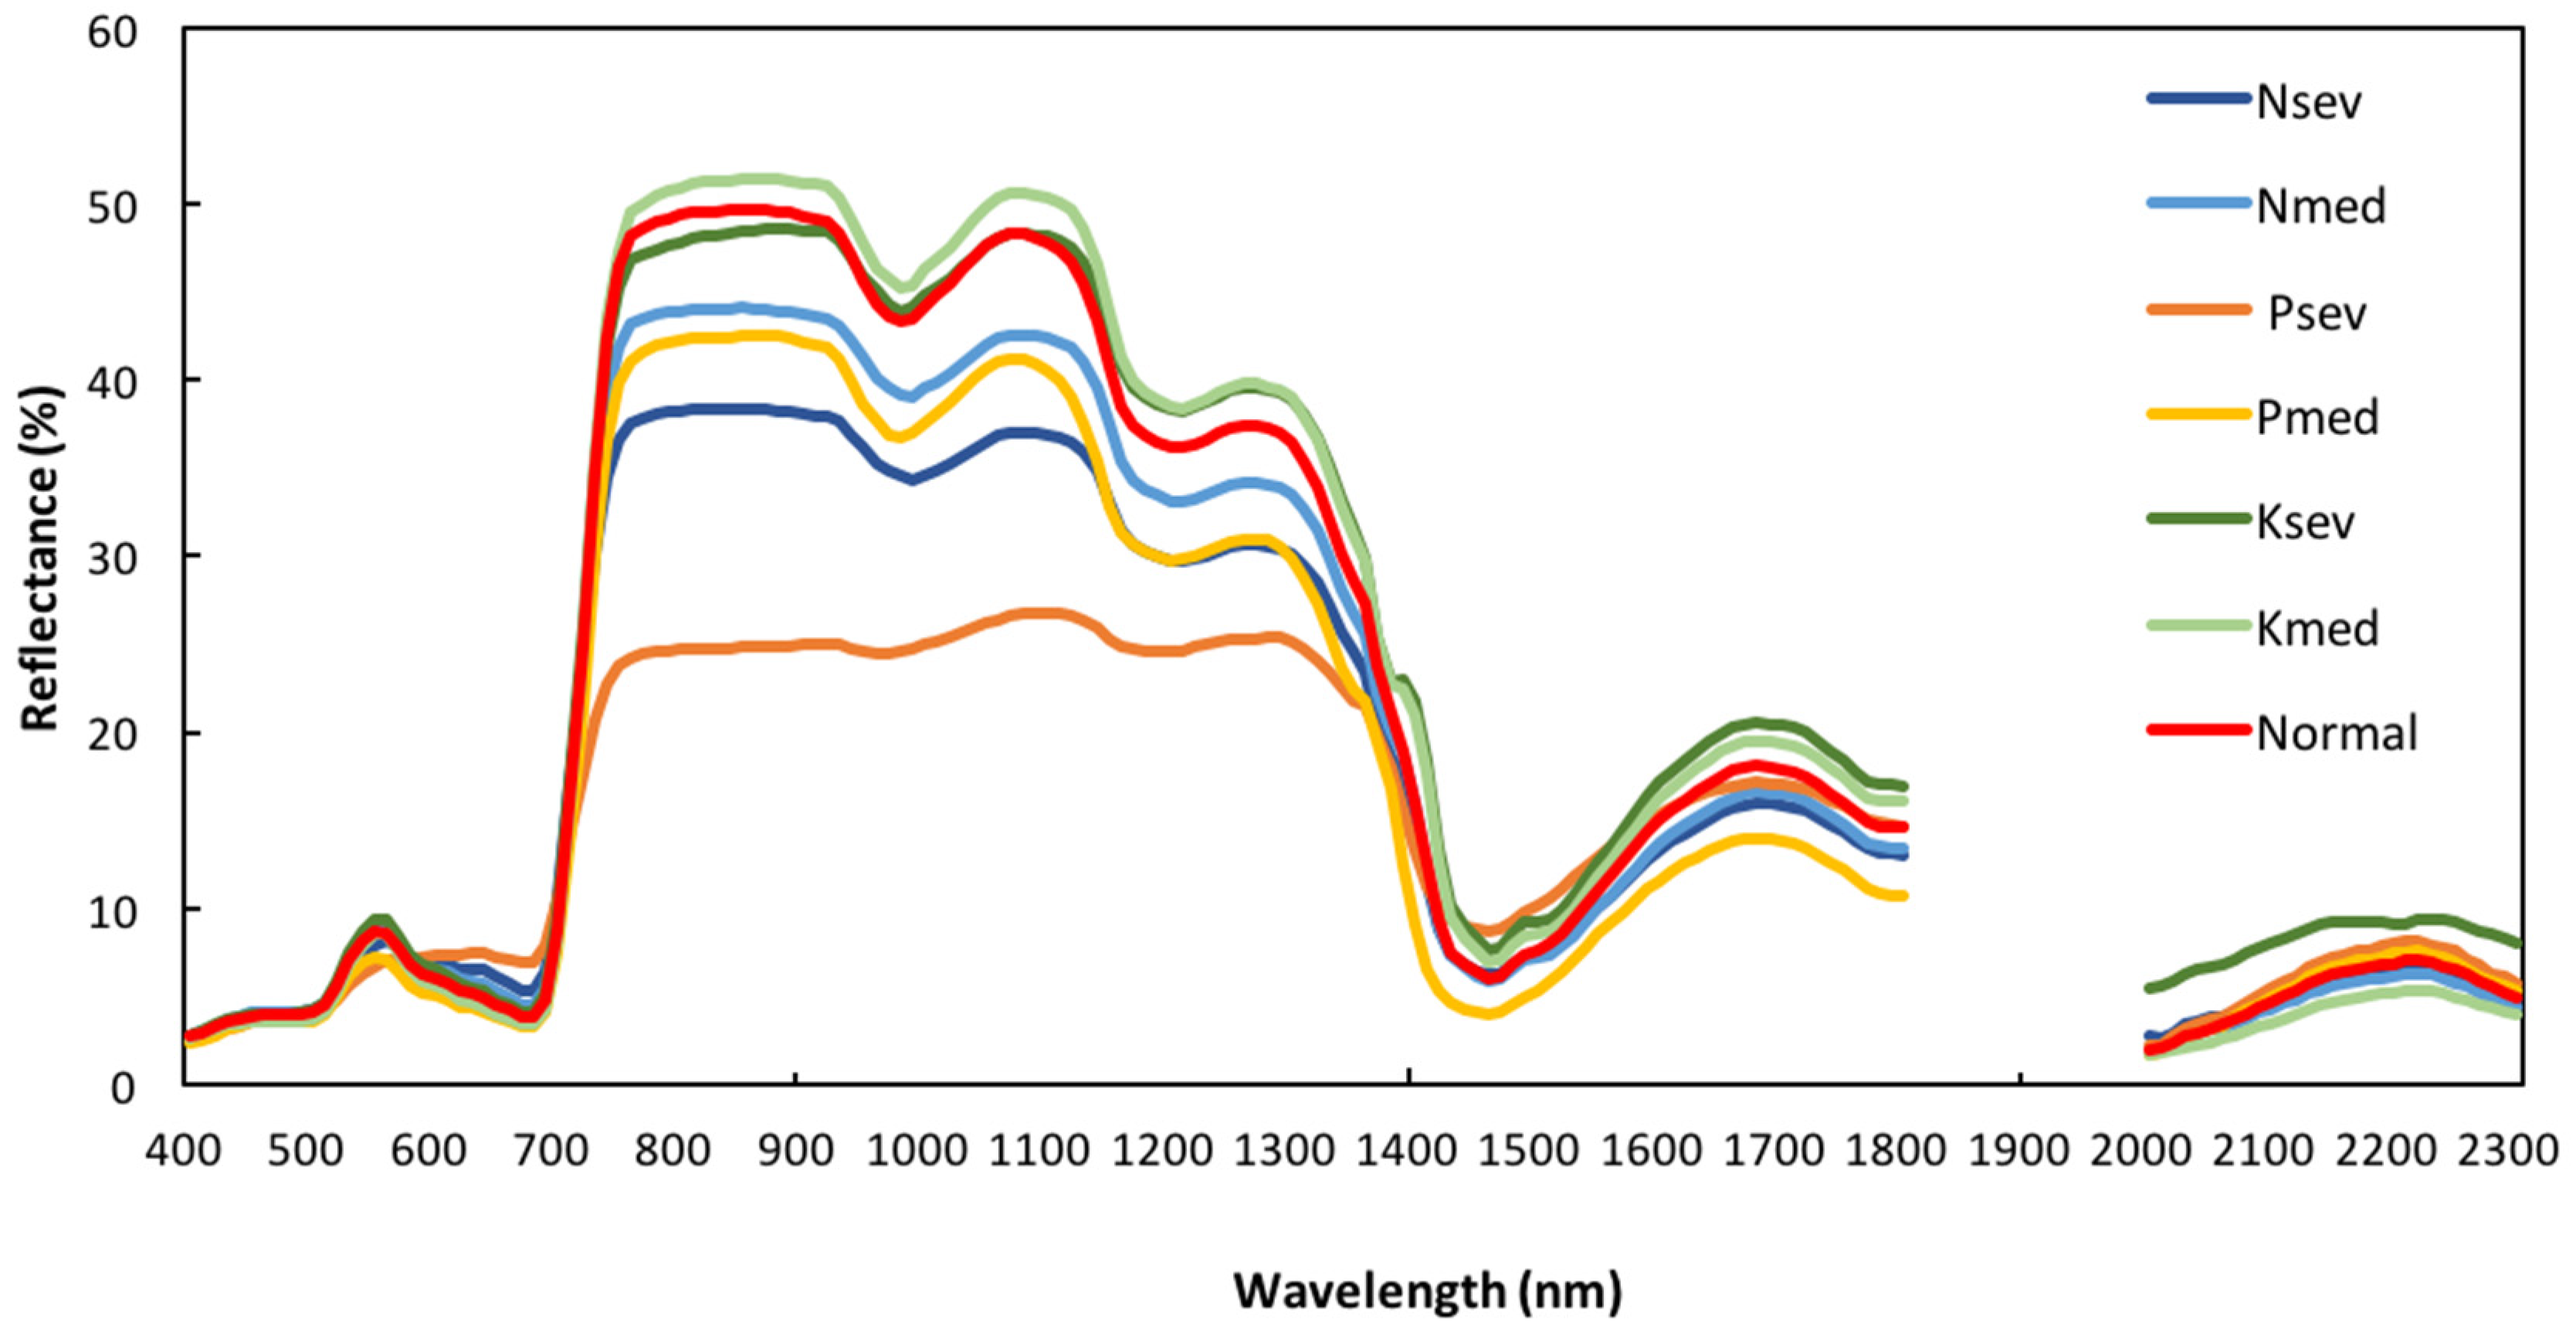
3.1. Leaf Nutrient Concentration and Canopy Spectra at Different Nutrient Fertilizer Levels

LNC, LPC, and LKC demonstrated obvious variations under different nutrient deficiency levels (Figure 2). For treatments omitting N or K fertilization, the nutrition deficiency was associated with the pronounced decrease in LNC or LKC. For treatments omitting P fertilization, the LPC was the lowest at the Psev, but for Pmed, the decrease in LPC was less obvious compared with the LNC at Nmed or the LKC at Kmed. Overall, the significant decrease in the omitted-nutrient content indicated that reflectance data grouped by fertilization levels represented spectral responses to different nutrient deficiency levels.
Figure 3 illustrates the mean canopy spectra of winter oilseed rape in response to different nutrient fertilizer levels. Reflectance differences can be found in the red region (600–700 nm), NIR region (800–1300 nm), and shortwave infrared (SWIR) region (1600–1800 nm). Generally, Kmed, Ksev, and the normal condition were brighter in the NIR and SWIR regions. Nsev and Psev had a lower reflectance in the NIR region and a higher reflectance in the red region.

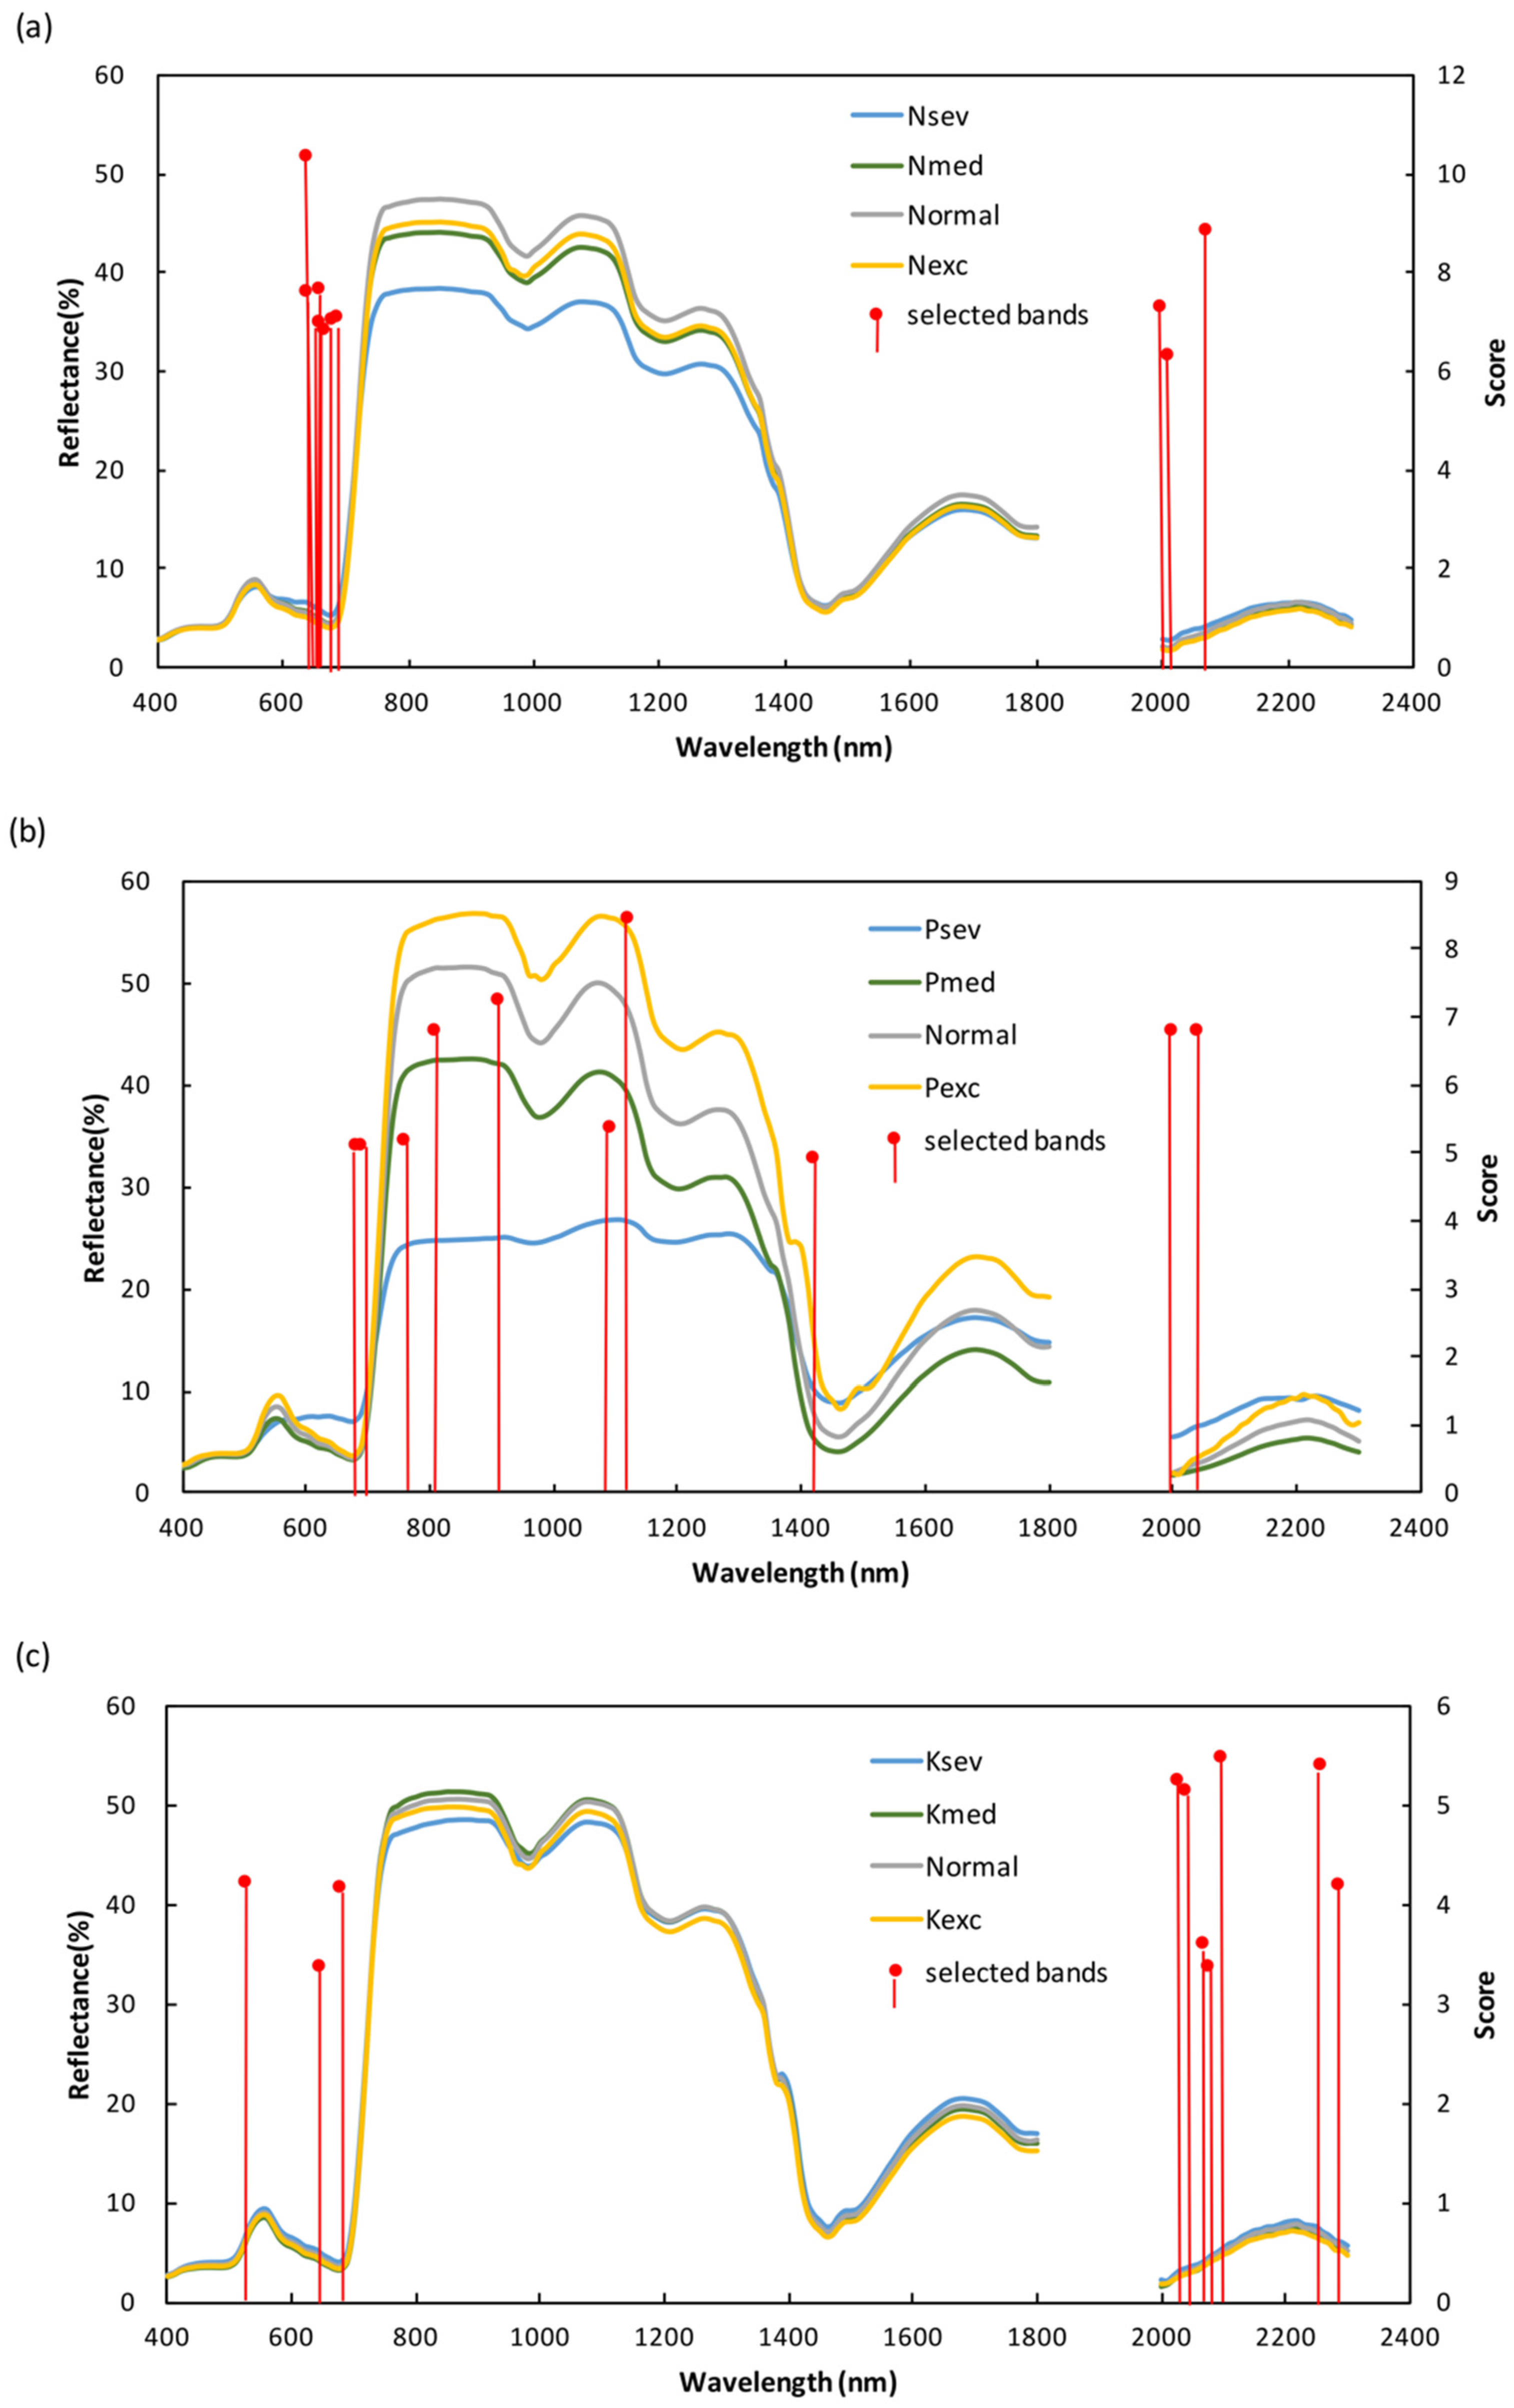
3.2. Selection of Spectral Bands

Figure 4 illustrates the 10 spectral bands that were selected for each nutrient using the proposed framework. For N, the ensemble modeling consistently selected bands within the range of 640–690 nm, with the highest score at 640 nm; however, the selection also included three bands (2000, 2010, and 2070 nm) in the SWIR region. The band selection for P was spread over the entire spectral region and the bands with the highest scores were in the NIR (e.g., 810, 910, and 1120 nm) and SWIR regions (2000 and 2040 nm). For K, the selected bands with the highest scores were all in the SWIR region, ranging from 2000 to 2300 nm. The selected bands also included two bands (650 and 680 nm) in the red region and one band (530 nm) in the green region. The selected bands were used to train the N, P, and K deficiency models in the second layer.

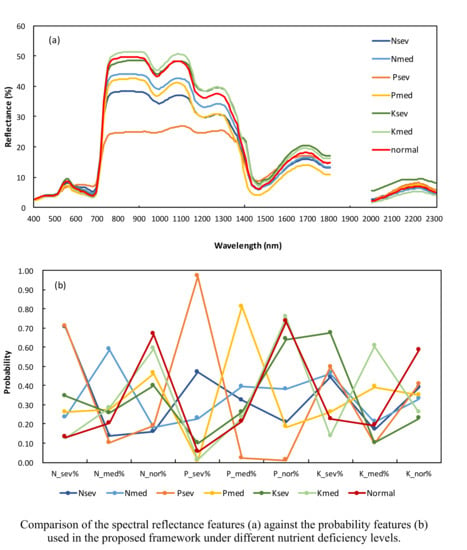
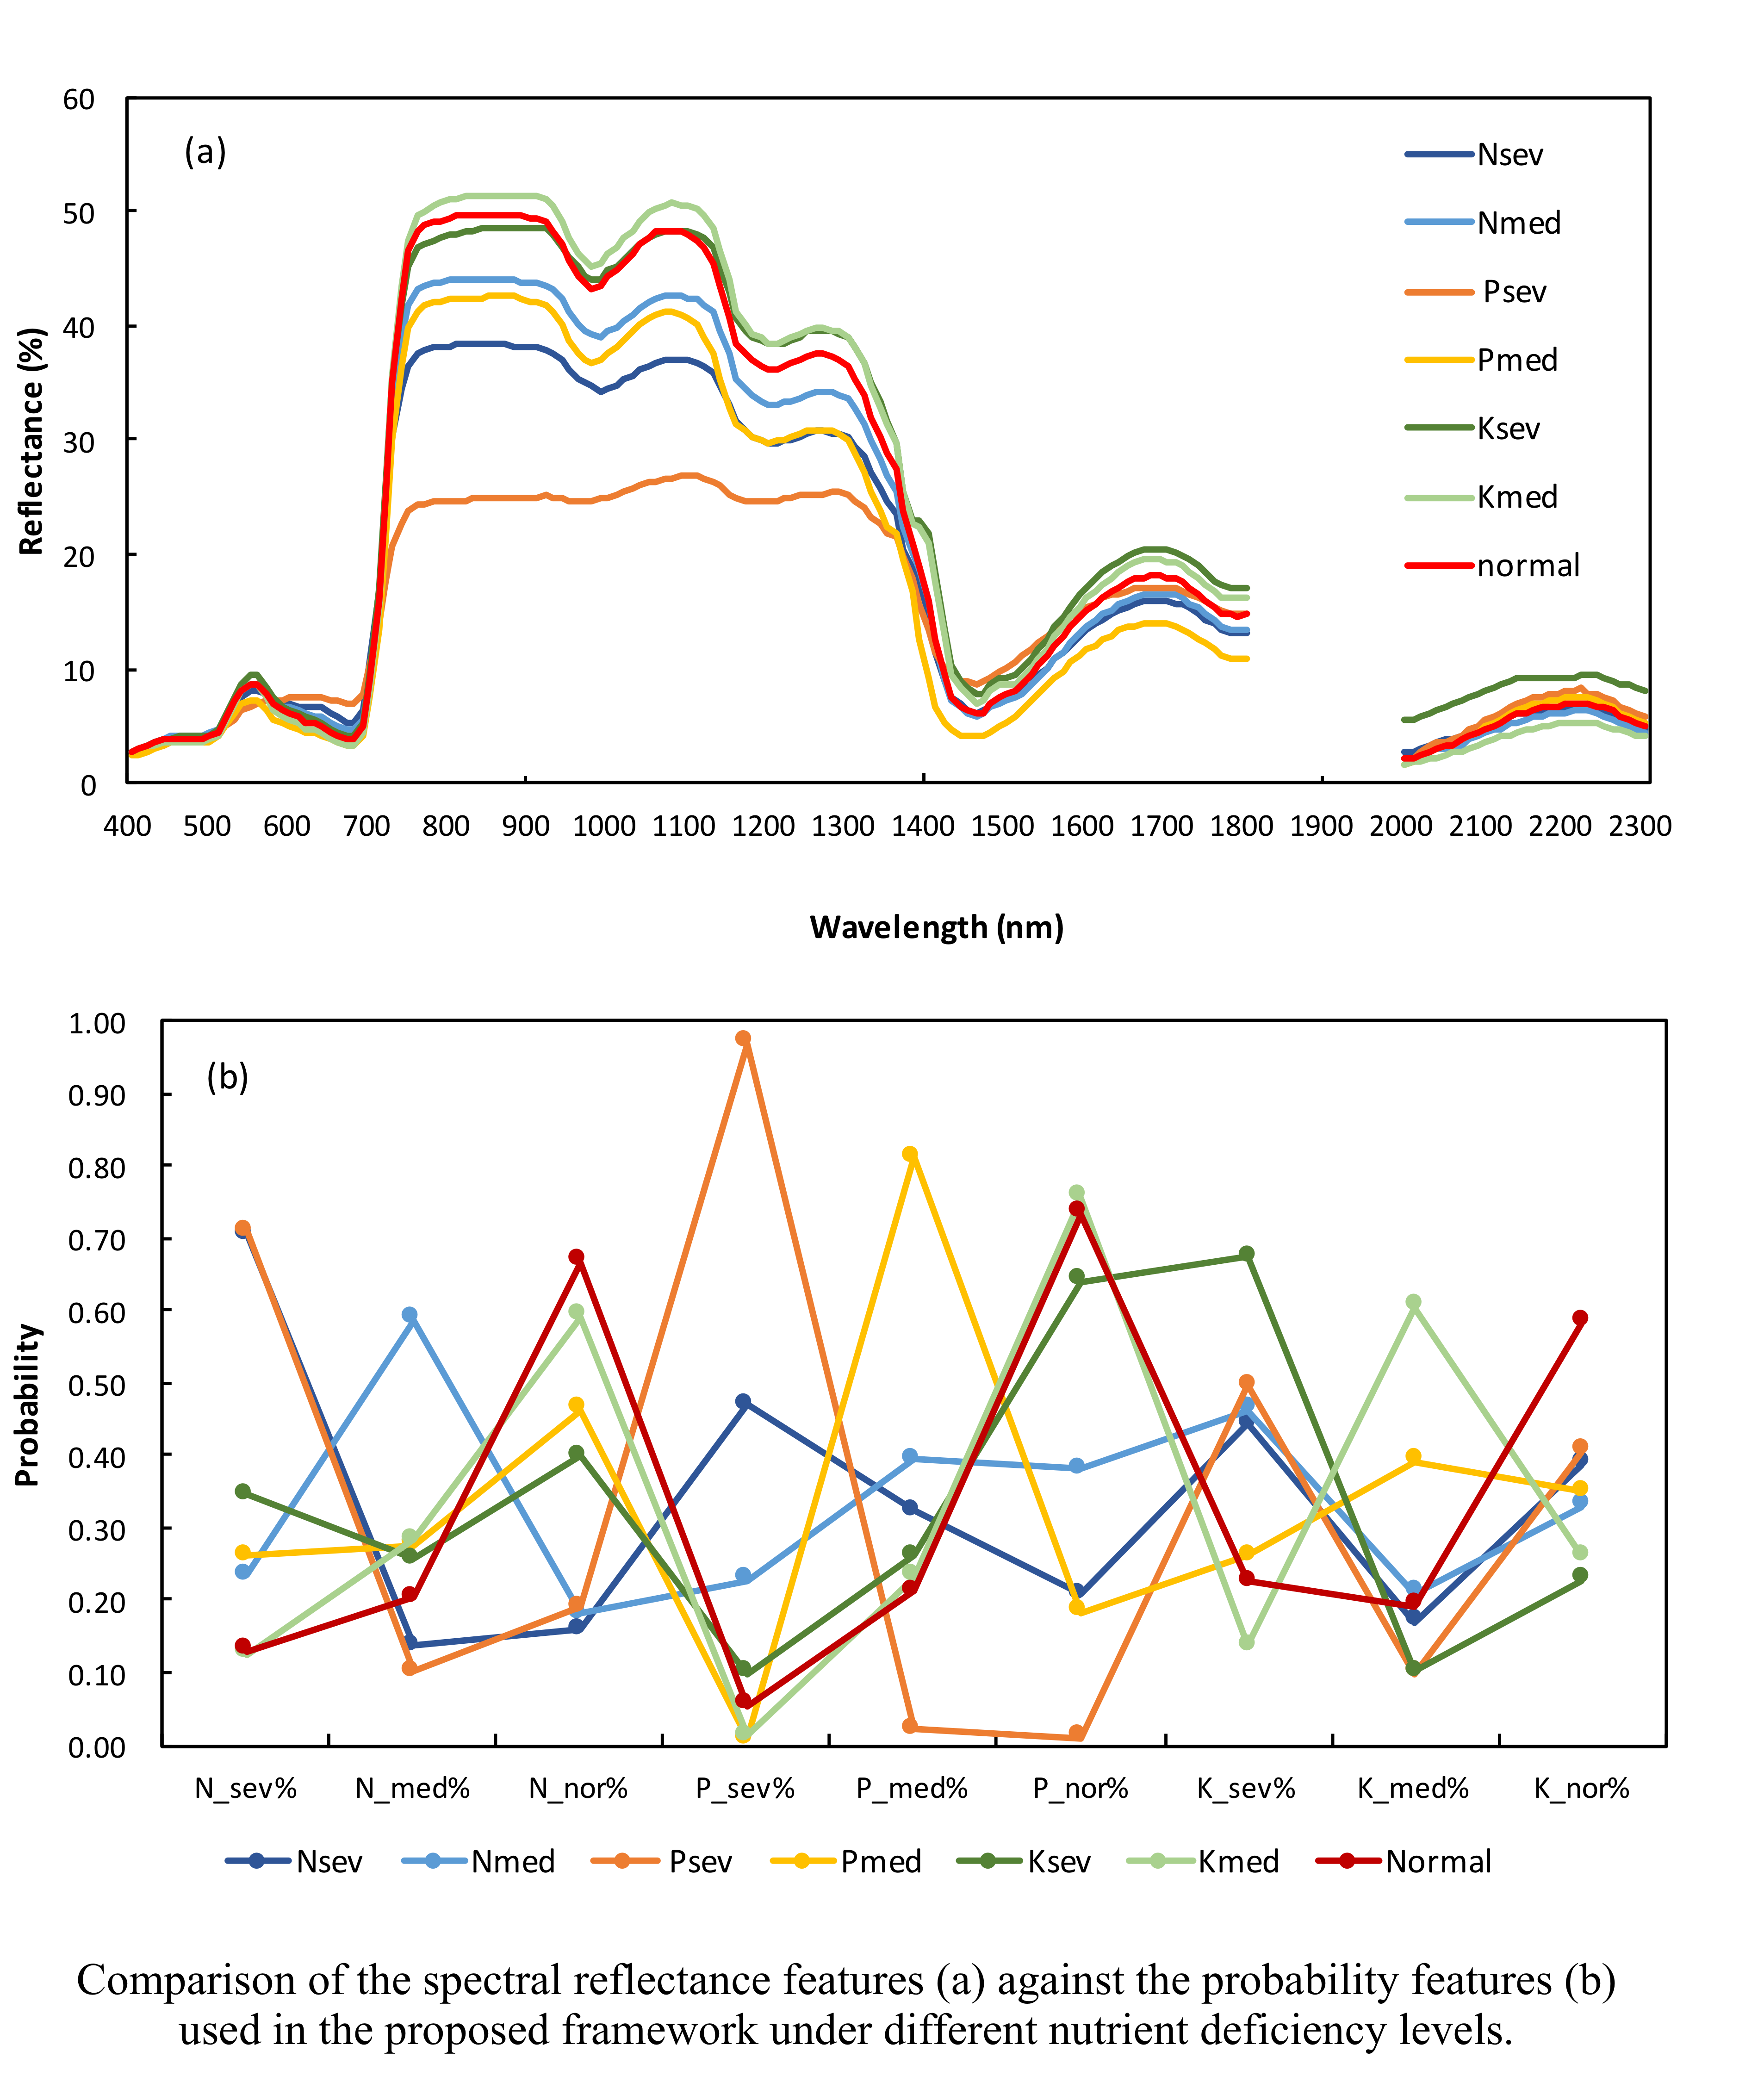
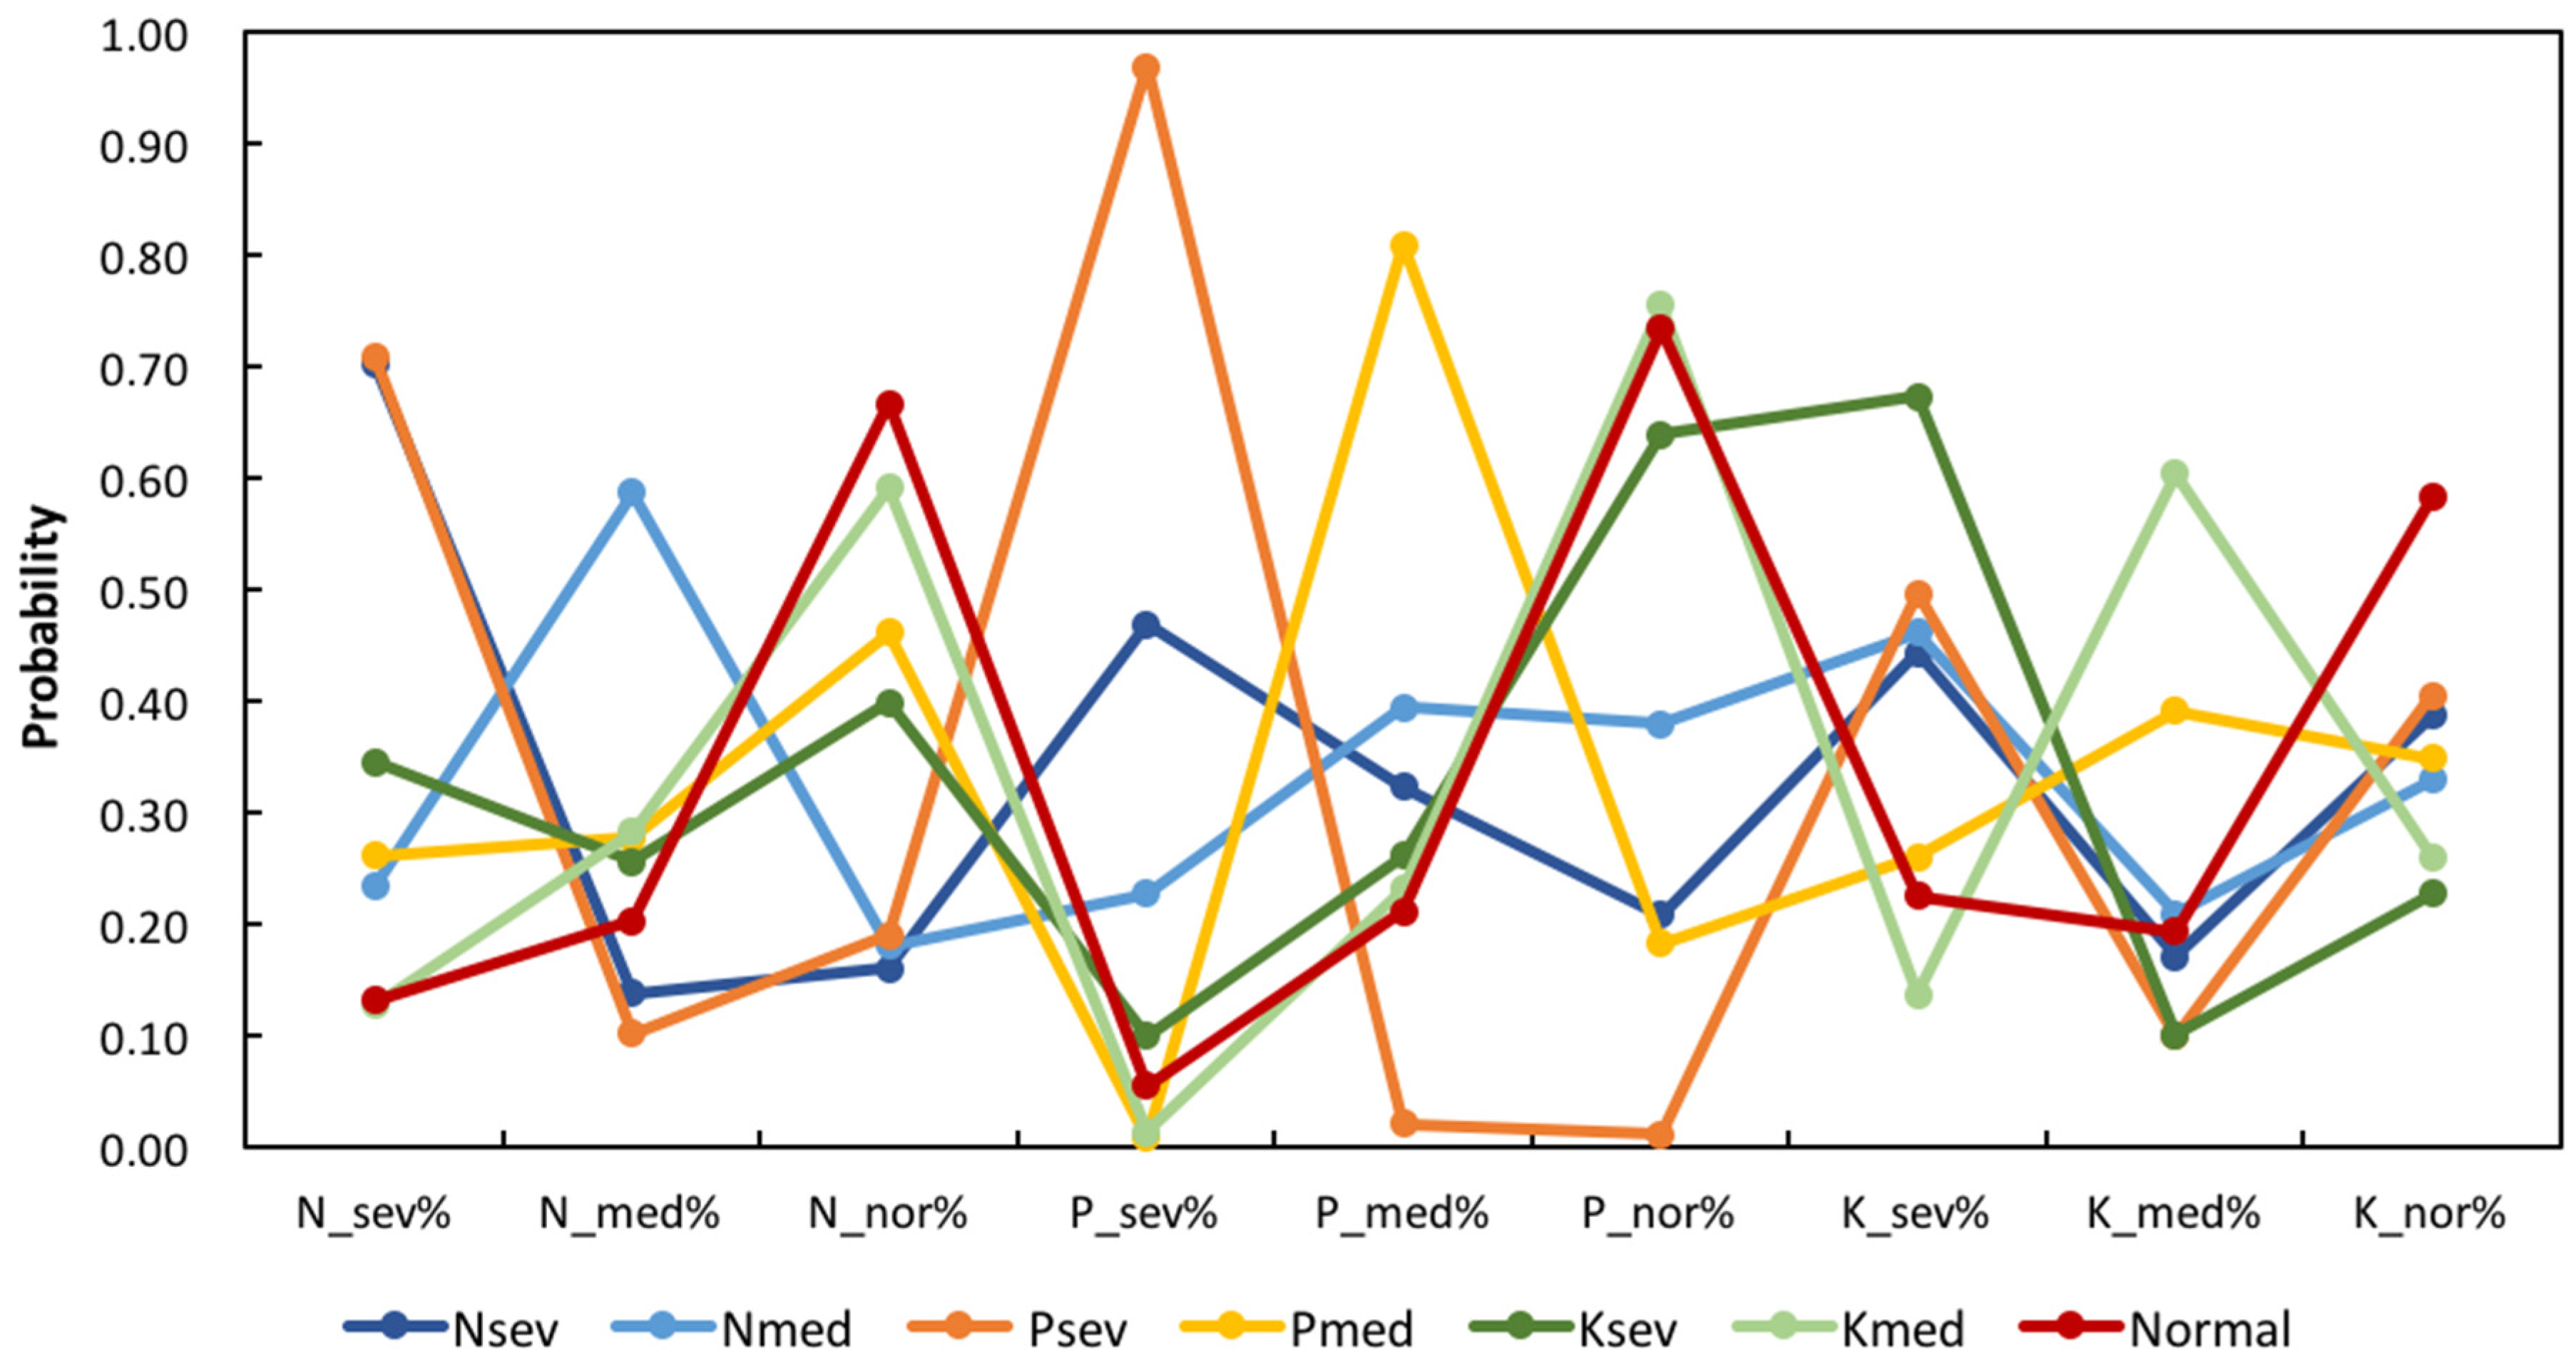
3.3. New Probability Features

Each N, P, and K deficiency model generated three probabilities, showing the likelihood of a spectrum being diagnosed as a severely or medium deficient or normal condition. These nine probabilities composed a new feature to identify the nutrient deficiency level, and they presented more obvious diversities than the spectral features (Figure 5). The mean probabilities shown in Figure 5 illustrate that Nsev, Psev, and Pmed have much higher probabilities at N_sev, P_sev, and P_med, respectively, and the normal condition has almost equally high probabilities in N_nor, P_nor, and K_nor. It is interesting to note that the probabilities were more complicated for K deficiencies. For example, Ksev had high probabilities at both P_nor and K_sev, and Kmed had high probabilities at N_nor, P_nor, and K_med.

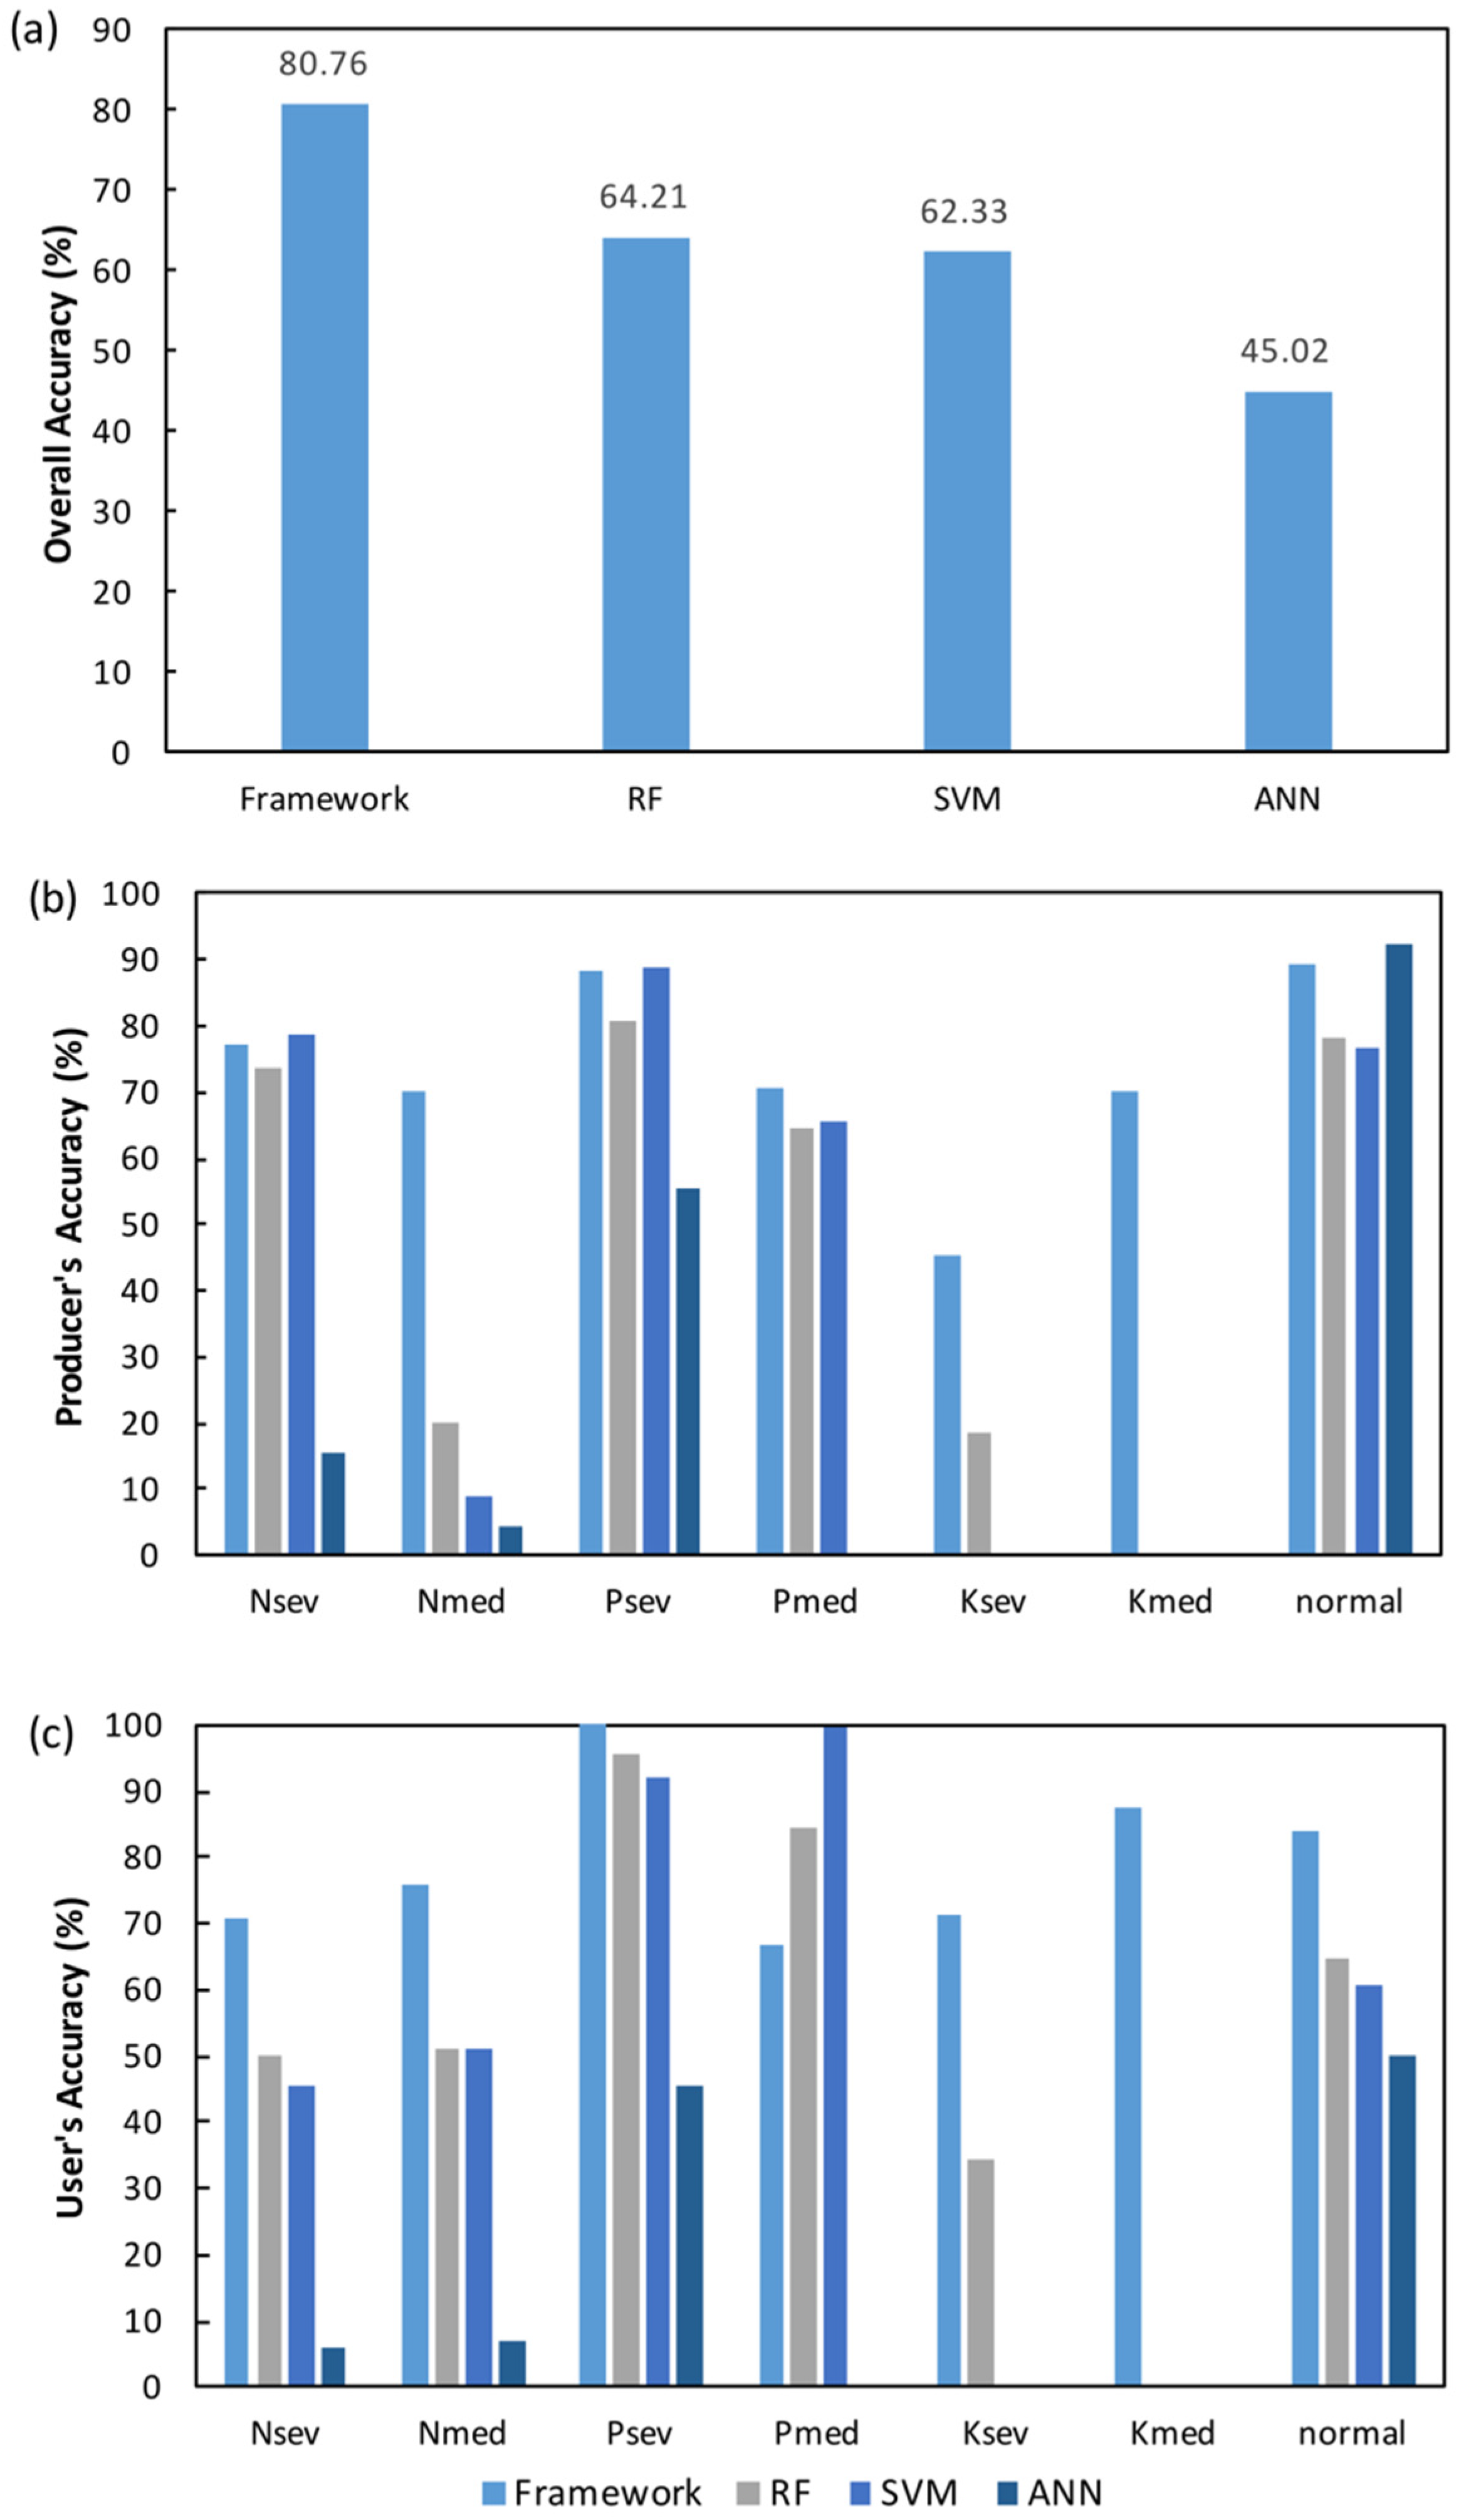
3.4. Diagnosis of Nutrient Deficiency Levels

Figure 6 compares the accuracy of the nutrient deficiencies diagnosed by the proposed framework and the regular RF, SVM, and ANN classifiers. The overall accuracy of the proposed framework reached 80.76%, which was 16.55% higher than that of the regular RF classifier, 18.43% higher than that of the SVM classifier, and 35.74% higher than that of the ANN classifier (Figure 6a). The comparison of the confusion matrixes derived for both methods demonstrated the competitive advantage of the proposed framework in distinguishing the Nmed, Ksev, and Kmed from the normal condition. The framework boosted the producer’s accuracy of Kmed yielded by the RF, SVM, and ANN classifiers from 0.00% to 70.00%, boosted the producer’s accuracy of Nmed from 20.73% to 70.07%, and increased the user’s accuracy of Kmed from 0.00% to 87.45% and Ksev to 71.40%. In addition, the proposed framework increased the user’s accuracy of Psev, Nmed, and Nsev.

4. Discussion

4.1. Agreement of Band Selection With Known Spectral Features

The objective of band selection was to minimize the information redundancy caused by continuous spectral bands while preserving the significant spectral information of the objects [48]. Spectral bands sensitive to different nutrient deficiency levels were selected with the ensembles of the RF outputs with multiple combinations of sub datasets as inputs. The selected bands were successfully applied in building the ensemble model to distinguish between different nutrient deficiency levels.

4.1.1. Nitrogen

Several studies have demonstrated a close relationship between N and Chl concentrations in green leaves [49]. In general, N deficiency leads to less Chl in the vegetation tissues, resulting in leaf yellowing [19]. In this study, the selected bands were primarily within the range of 640–690 nm, adjacent to the Chl absorption peak at 675 nm [50], which concurs with previous studies on spectroscopic estimation of plant N content. Mutanga et al. [51] found that increased N fertilization resulted in increased Chl absorption, which deepened and widened the Chl absorption feature until eventually reaching saturation. On the canopy level, nitrate availability influences both leaf Chl concentration and biomass [52]. In addition to the bands in the red region, 2000, 2010, and 2070 nm were also selected as the important bands to differentiate different N stress levels. These bands correspond to leaf dry matter content, which is often correlated with the N concentrations [53].

4.1.2. Phosphorous

P is an essential component of genetic material, and thus cell division and expansion are adversely affected by P deprivation [22]. P-deficient plants typically display weak or stunted growth. Previous studies have demonstrated a close relationship between P and reflectance in the NIR region because P plays a critical role as an energy supplier in energy-consuming processes such as photosynthesis [54]. Photosynthesis is directly related to the leaf area index and involves structural organic compounds, which contribute to the spectral features of green vegetation in the region from 700–1200 nm. Cheema et al. [55] found that the increased application of N and P fertilizers to canola led to an increase in the leaf area index and total dry mass relative to the control, and lower rates of fertilization. Osborne et al. [25] confirmed that the increase in the number of cells per unit of leaf area in P-deficient corn plants was translated into a significant spectral response in the NIR region of the spectrum. Specifically, they found that linear models that included 730 and 930 nm bands were able to predict P concentration during crop development at one specific point of time. In this study, the selection of multiple bands in the NIR region (760, 810, 910, 1090, and 1120 nm), as the sensitive bands to differentiate P deficiency levels corroborated the findings of previous studies.

4.1.3. Potassium

K deficiency symptoms were not evident. As shown in Figure 4c, deficient spectra almost overlap normal spectra, which is in agreement with the findings of Pacumbaba and Beyl’s [15] study on lettuce and those of Rustioni et al.’s on grapevine leaves [16]. The similarity in reflectance spectra between the normal and the K-deficient condition made it difficult to diagnose the K deficiency levels using spectral reflectance directly.
K is responsible for the activation and/or stimulation of a number of enzymes, which influence sugar and starch content in plants [56]. In cotton, K fertilization increases leaf protein content and decreases leaf starch [57]. K also has an outstanding role in plant water relations because K regulates stomata and affects osmotic pressure [54]. Fanaei et al. [24] found that the application of K fertilizer could ameliorate the negative effects of water stress on relative water content and stomatal conductance in two cultivars of canola. In this study, 7 out of 10 sensitive bands selected for distinguishing K deficiency levels were in the SWIR region and corresponded to the absorption features of water, starch, and proteins.
Moreover, K deficiency produces an intensification of the reddish color as a consequence of increased anthocyanin (Anth) content in the distal part of the plant [16], which explains the band selection results in the green and red regions. Gitelson et al. [58] found that when Anth was present in leaves in minute amounts, it led to an increased absorption in the green-orange range between 520 and 650 nm. Gamon and Surfus [59] suggested using the red to green reflectance ratio for the estimation of Anth content.
In summary, the selected bands were in concurrence with the known plant responses to different nutrient stresses and the corresponding absorption features in previous studies. Quantitative analysis of the relationship between the selected bands and biochemical and physiological data was not performed as part of this study, owing to the sampling data being limited. However, a comprehensive understanding of the relationship between the crop biochemical and physiological responses under different nutrient stresses and the corresponding spectral features is believed to be critical for remote analysis of crop nutrient deficiencies. Future studies are required to bridge the gap between the sensitive spectral features and the underlying biochemical and physiological processes of crops coping with different nutrient stresses.

4.2. Diagnosis of Nutrient Deficiency Using Ensemble Modeling

Diversity of the classifier outputs is a vital requirement for the success of the ensemble, demonstrated by theoretical and empirical studies [28,60]. If the classifiers are similar, it would not improve the accuracy by combining them. The core of the proposed framework was that the probabilities used for the final decision were generated by three distinct models. Each of these three models was trained to identify deficiency levels of single nutrient. Thus, each model had thoroughly ‘learned’ the spectral responses to deficiency levels of single nutrient, reducing the disturbance by the spectral responses to the other nutrients. Then samples of N, P, and K deficiencies were mixed, and reflectance data of each sample were fed to three distinct models to generate nine probabilities for the final decision. Since these nine probabilities were outputs of models trained for different nutrients, they demonstrated pronounced differences under N, P, and K deficiencies and the normal condition. The comparison between Figure 3 and Figure 5 showed that the correlation among input features was substantially reduced and the diversity was enhanced. Particularly, probabilities demonstrated competitive advantages in distinguishing the Nmed, Ksev, and Kmed from the normal conditions. The results of this study corroborated the statements from previous studies that combining multiple classifiers can boost weak learners into a strong learning algorithm to address difficult conditions [61,62]. Classifier ensemble fuses multiple classifiers with distinct advantages and often yields higher accuracies than single models by enlarging the diversity among classes. In this study, a specific classifier was trained to identify the deficiency levels of a certain nutrient, such that the distinguishing spectral responses to a certain nutrient was emphasized with less interferences from other nutrient. By fusing the outputs of three distinctly trained models, the diversity among deficiencies of three nutrients was effectively enhanced and help generate more accurate classification results. In addition to the RF model, the classifiers within the framework could be replaced with other models (e.g., SVM) based on the needs and dataset.
In this study, spectra were utilized as the input of the proposed framework instead of transformed spectra (e.g., first- or higher-order derivative spectra). Although advanced preprocessing techniques are promising tools for enhancing the sensitivity of spectral signals to the biochemical traits in plants [63,64,65], these techniques require a very high spectral resolution that is limited to only a few hyperspectral data sources. The results from this study indicate the potential of the proposed framework for diagnosing crop nutrient deficiency levels using hyperspectral and multispectral data; however, additional research is needed to test the proposed framework on a large scale using satellite data, such as Sentinel-2.

5. Conclusions

This study proposed a novel ensemble-modeling framework to transform the crop canopy reflectance data of the selected bands into more distinguishable probability features and identify the nutrient deficiency levels using the probabilities. The framework was applied to distinguishing the N, P, and K deficiency levels in winter oilseed rape based on 915 spectra samples collected in the field. The accuracy of the ensemble-modeling framework was compared with the results of the regular RF, SVM, and ANN. The overall accuracy of the nutrient deficiency analysis of the proposed framework reached 80.76%, which was 16.55%, 18.43, and 35.74% higher than the regular RF, SVM, and ANN classifiers, respectively. In particular, the proposed framework boosted the producer’s accuracy of Kmed resulting from the RF, SVM, and ANN classifiers from 0.00% to 70.00%, and boosted the producer’s accuracy of Nmed from 20.73% to 70.07%. In addition, the selected bands that were sensitive to different nutrient deficiencies fit the well-known physiological and biochemical roles of each nutrient. The results from this study provide promising evidence for the discernment of different nutrient levels in crops using hyperspectral remote sensing data and multiple model ensembles. The proposed framework had a potential of being applied to improving the practical agricultural management in different regions.

Author Contributions

Conceptualization, S.L. and J.L.; writing—original draft, S.L.; data curation, X.Y.; formal analysis, X.Y.; visualization, X.Y. and Q.G.; investigation, Q.G. and Z.L. All authors have read and agreed to the published version of the manuscript.

Funding

This research was funded by grants from the National Key Research and Development Program of China (Grant No. 2018YFD0200900) and the Earmarked Fund for China Agriculture Research System (Grant No. CARS-12).

Acknowledgments

We are grateful to Lantao Li for sharing canopy spectral data. We also thank Junyi Wang who offered suggestions on the application of the random forest classifier.

Conflicts of Interest

The authors declare no conflict of interest.

Appendix A

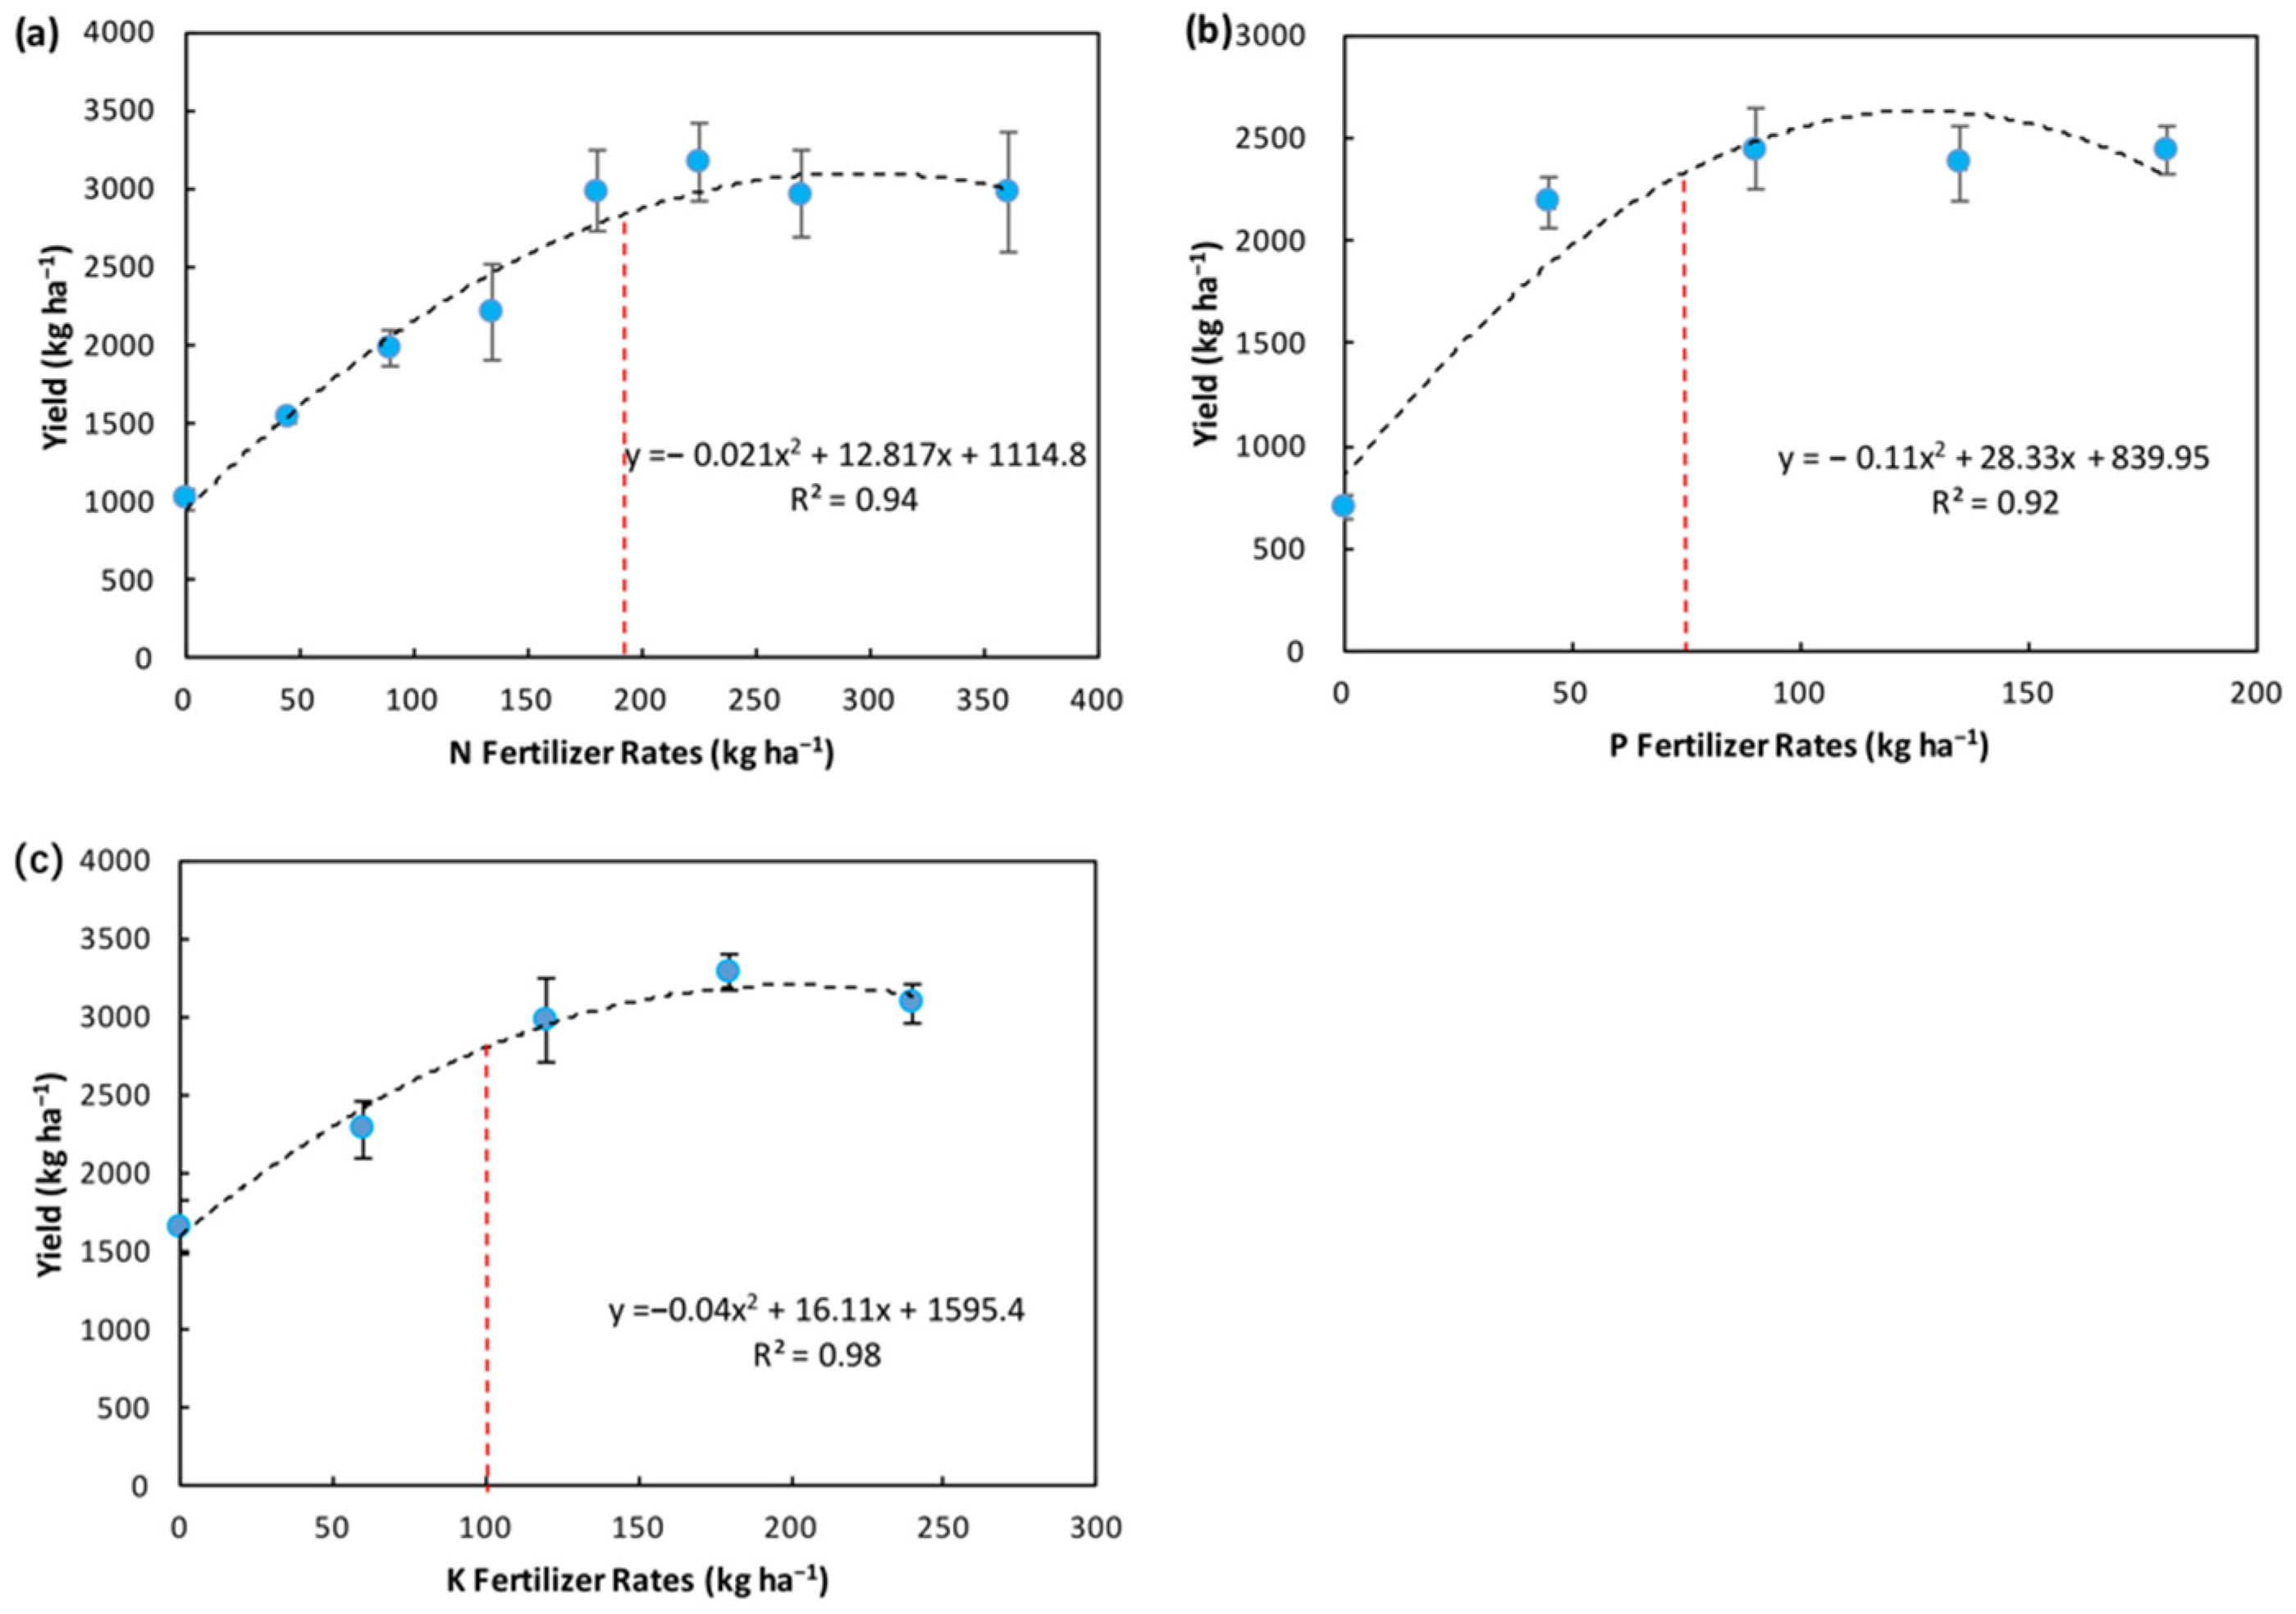
Appendix A.1. Yield Response Curve

The nutrient deficiency levels were determined by the yield response curve and the experts’ suggestions. The yield response curve describes the variations of yield in response to different fertilizer application rates. The yield response curve of N fertilization was calculated using the average rapeseed yield of Exp. 3 and 5; the yield response curve of P fertilization was calculated using the yield data of Exp. 9; and the yield response curve of K fertilization was calculated using the average yield data of Exp. 11 and 12. At harvest, plants in the half area of each plot were harvested and dried naturally for weeks. The seeds were then weighed to determine the rapeseed yield. The relationships between the rapeseed yield and N, P, and K fertilizer application rates were fit with the quadratic regression model separately.
The relative yield is an important parameter to determine the optimal fertilization rates and detect the crop N deficiency [66,67]. It is calculated as the yield for a particular fertilizer rate divided by the maximum yield with the fertilizer applied at the site. Since the nutrient deficiency is also affected by factors other than nutrient supplies, such as phenological stages and meteorological conditions [66], there is no universal criteria to classify nutrient deficiency levels. In this study, the maximum yield derived from the yield response curve was used to calculate the relative yield. The fertilizer rates corresponding to the relative yield lower than 90% was used as a requirement to detect the nutrient deficiency, but the specific nutrient deficiency levels were determined by the experts’ suggestions. What need to explain was that spectral data collected in 180 kg ha−1 N fertilization treatment were labelled as normal based on the experts’ suggestions (Table 3), although the 90% relative yield corresponded to 185 kg ha−1 N fertilizer rates (Figure A1).
Figure A1. The relationship between the rapeseed yield and the N (a), P (b), and K (c) fertilizer application rates. The relationships were fit with the quadratic regression model. The red dash line marks the fertilizer rates corresponding to the 90% relative yield.
Remotesensing 12 04060 g0a1

Appendix A.2. Soil Test

The soil pH value was measured using a pH electrode at a water/soil ratio of 2.5:1; organic matter was determined using the chromic acid titration method; the total N was determined using the Kjeldahl acid-digestion method; the Olsen-phosphorous (P) value was measured using the NaHCO3 method; the available potassium (K) was measured using a flame photometer method; and the available boron (B) was determined using the curcumin colorimetric method; soil was classified based on Keys to Soil Taxonomy [68]; the fertility status levels was provided based on the soil nutrient index system in the Yangtze River basin provided by Zou [69].

References

  1. Welch, R.M. The impact of mineral nutrients in food crops on global human health. Plant. Soil 2002, 247, 83–90. [Google Scholar] [CrossRef]
  2. Zhao, B.; Zhang, J.; Flury, M.; Zhu, A.-N.; Jiang, Q.-A.; Bi, J.-W. Groundwater contamination with NO3-N in a wheat-corn cropping system in the North China plain. Pedosphere 2007, 17, 721–731. [Google Scholar] [CrossRef]
  3. Ishijima, K.; Sugawara, S.; Kawamura, K.; Hashida, G.; Morimoto, S.; Murayama, S.; Aoki, S.; Nakazawa, T. Temporal variations of the atmospheric nitrous oxide concentration and its δ15 N and δ18 O for the latter half of the 20th century reconstructed from firn air analyses. J. Geophys. Res. Space Phys. 2007, 112, 112. [Google Scholar] [CrossRef]
  4. Chen, P.; Haboudane, D.; Tremblay, N.; Wang, J.; Vigneault, P.; Li, B. New spectral indicator assessing the efficiency of crop nitrogen treatment in corn and wheat. Remote Sens. Environ. 2010, 114, 1987–1997. [Google Scholar] [CrossRef]
  5. Clevers, J.; Gitelson, A. Remote estimation of crop and grass chlorophyll and nitrogen content using red-edge bands on Sentinel-2 and -3. Int. J. Appl. Earth Obs. Geoinf. 2013, 23, 344–351. [Google Scholar] [CrossRef]
  6. Schlemmer, M.; Gitelson, A.; Schepers, J.; Ferguson, R.; Peng, Y.; Shanahan, J.; Rundquist, D. Remote estimation of nitrogen and chlorophyll contents in maize at leaf and canopy levels. Int. J. Appl. Earth Obs. Geoinf. 2013, 25, 47–54. [Google Scholar] [CrossRef] [Green Version]
  7. Pellissier, P.A.; Ollinger, S.V.; Lepine, L.C.; Palace, M.W.; McDowell, W.H. Remote sensing of foliar nitrogen in cultivated grasslands of human dominated landscapes. Remote Sens. Environ. 2015, 167, 88–97. [Google Scholar] [CrossRef] [Green Version]
  8. Li, L.; Liu, S.; Wang, S.; Lu, J.; Li, L.; Ma, Y.; Ming, J. Assessing plant nitrogen concentration in winter oilseed rape using hyperspectral measurements. J. Appl. Remote Sens. 2016, 10, 36026. [Google Scholar] [CrossRef]
  9. Kokaly, R. Spectroscopic determination of leaf biochemistry using band-depth analysis of absorption features and stepwise multiple linear regression. Remote Sens. Environ. 1999, 67, 267–287. [Google Scholar] [CrossRef]
  10. Masoni, A.; Ercoli, L.; Mariotti, M. Spectral properties of leaves deficient in iron, sulfur, magnesium, and manganese. Agron. J. 1996, 88, 937–943. [Google Scholar] [CrossRef]
  11. Ponzoni, F.J.; De, J.L.; Gonçalves, J.L.D.M. Spectral features associated with nitrogen, phosphorus, and potassium deficiencies in Eucalyptus saligna seedling leaves. Int. J. Remote Sens. 1999, 20, 2249–2264. [Google Scholar] [CrossRef]
  12. Ayala-Silva, T.; Beyl, C.A. Changes in spectral reflectance of wheat leaves in response to specific macronutrient deficiency. Adv. Space Res. 2005, 35, 305–317. [Google Scholar] [CrossRef] [PubMed]
  13. Pimstein, A.; Karnieli, A.; Bansal, S.K.; Bonfil, D.J. Exploring remotely sensed technologies for monitoring wheat potassium and phosphorus using field spectroscopy. Field Crop. Res. 2011, 121, 125–135. [Google Scholar] [CrossRef]
  14. Ramoelo, A.; Skidmore, A.K.; Schlerf, M.; Mathieu, R.; Heitkönig, I.M. Water-removed spectra increase the retrieval accuracy when estimating savanna grass nitrogen and phosphorus concentrations. ISPRS J. Photogramm. Remote Sens. 2011, 66, 408–417. [Google Scholar] [CrossRef]
  15. Pacumbaba, R.; Beyl, C. Changes in hyperspectral reflectance signatures of lettuce leaves in response to macronutrient deficiencies. Adv. Space Res. 2011, 48, 32–42. [Google Scholar] [CrossRef]
  16. Rustioni, L.; Grossi, D.; Brancadoro, L.; Failla, O. Iron, magnesium, nitrogen and potassium deficiency symptom discrimination by reflectance spectroscopy in grapevine leaves. Sci. Hortic. 2018, 241, 152–159. [Google Scholar] [CrossRef]
  17. Carter, G.A.; Knapp, A.K. Leaf optical properties in higher plants: Linking spectral characteristics to stress and chlorophyll concentration. Am. J. Bot. 2001, 88, 677–684. [Google Scholar] [CrossRef] [Green Version]
  18. Al-Abbas, A.H.; Barr, R.; Hall, J.D.; Crane, F.L.; Baumgardner, M.F. Spectra of normal and nutrient-deficient maize leaves 1. Agron. J. 1974, 66, 16–20. [Google Scholar] [CrossRef] [Green Version]
  19. Ciompi, S.; Gentili, E.; Guidi, L.; Soldatini, G.F. The effect of nitrogen deficiency on leaf gas exchange and chlorophyll fluorescence parameters in sunflower. Plant. Sci. 1996, 118, 177–184. [Google Scholar] [CrossRef]
  20. Lamb, D.W.; Steyn-Ross, M.; Schaare, P.; Hanna, M.M.; Silvester, W. Estimating leaf nitrogen concentration in ryegrass (Lolium spp.) pasture using the chlorophyll red-edge: Theoretical modelling and experimental observations. Int. J. Remote Sens. 2002, 23, 3619–3648. [Google Scholar] [CrossRef]
  21. Berger, K.; Verrelst, J.; Féret, J.-B.; Wang, Z.; Wocher, M.; Strathmann, M.; Danner, M.; Mauser, W.; Hank, T. Crop nitrogen monitoring: Recent progress and principal developments in the context of imaging spectroscopy missions. Remote Sens. Environ. 2020, 242, 111758. [Google Scholar] [CrossRef]
  22. Li, B.; Liew, O.W.; Asundi, A. Pre-visual detection of iron and phosphorus deficiency by transformed reflectance spectra. J. Photochem. Photobiol. B Biol. 2006, 85, 131–139. [Google Scholar] [CrossRef] [PubMed]
  23. Young, J.L.M.; Kanashiro, S.; Jocys, T.; Tavares, A.R. Silver vase bromeliad: Plant growth and mineral nutrition under macronutrients omission. Sci. Hortic. 2018, 234, 318–322. [Google Scholar] [CrossRef]
  24. Fanaei, H.R.; Galavi, M.; Kafi, M.; Ghanbari Bonjar, A. Amelioration of water stress by potassium fertilizer in two oilseed species. Int. J. Plant. Prod. 2009, 3. [Google Scholar] [CrossRef]
  25. Osborne, S.L.; Schepers, J.S.; Francis, D.D.; Schlemmer, M.R. Detection of phosphorus and nitrogen deficiencies in corn using spectral radiance measurements. Agron. J. 2002, 94, 1215–1221. [Google Scholar] [CrossRef] [Green Version]
  26. Li, L.; Jákli, B.; Lu, P.; Ren, T.; Ming, J.; Liu, S.; Wang, S.; Lu, J. Assessing leaf nitrogen concentration of winter oilseed rape with canopy hyperspectral technique considering a non-uniform vertical nitrogen distribution. Ind. Crop. Prod. 2018, 116, 1–14. [Google Scholar] [CrossRef]
  27. Jørgensen, R.N.; Christensen, L.K.; Bro, R. Spectral reflectance at sub-leaf scale including the spatial distribution discriminating NPK stress characteristics in barley using multiway partial least squares regression. Int. J. Remote Sens. 2007, 28, 943–962. [Google Scholar] [CrossRef]
  28. Du, P.; Xia, J.; Zhang, W.; Tan, K.; Liu, Y.; Liu, S. Multiple classifier system for remote sensing image classification: A review. Sensors 2012, 12, 4764–4792. [Google Scholar] [CrossRef]
  29. Feilhauer, H.; Asner, G.P.; Martin, R.E. Multi-method ensemble selection of spectral bands related to leaf biochemistry. Remote Sens. Environ. 2015, 164, 57–65. [Google Scholar] [CrossRef]
  30. Waske, B.; Van Der Linden, S. Classifying multilevel imagery from SAR and optical sensors by decision fusion. IEEE Trans. Geosci. Remote Sens. 2008, 46, 1457–1466. [Google Scholar] [CrossRef]
  31. Engler, R.; Waser, L.T.; Zimmermann, N.E.; Schaub, M.; Berdos, S.; Ginzler, C.; Psomas, A. Combining ensemble modeling and remote sensing for mapping individual tree species at high spatial resolution. For. Ecol. Manag. 2013, 310, 64–73. [Google Scholar] [CrossRef]
  32. Kao, M.C.J.; Boschetti, M.; Gheri, F. FAOSTAT: A Complementary Package to the FAOSTAT Database and the Statistical Yearbook of the Food and Agricultural Organization of the United Nations; FAO: Rome, Italy, 2014. [Google Scholar]
  33. Zhang, Q.-C.; Wang, G.; Xie, W.-X. Soil organic N forms and N supply as affected by fertilization under intensive rice cropping system. Pedosphere 2006, 16, 345–353. [Google Scholar] [CrossRef]
  34. Cong, R.; Li, H.; Zhang, Z.; Ren, T.; Li, X.; Lu, J. Evaluate regional potassium fertilization strategy of winter oilseed rape under intensive cropping systems: Large-scale field experiment analysis. Field Crop. Res. 2016, 193, 34–42. [Google Scholar] [CrossRef]
  35. Li, L.; Wang, S.; Ren, T.; Wei, Q.; Ming, J.; Li, J.; Li, X.; Cong, R.; Lu, J. Ability of models with effective wavelengths to monitor nitrogen and phosphorus status of winter oilseed rape leaves using in situ canopy spectroscopy. Field Crop. Res. 2018, 215, 173–186. [Google Scholar] [CrossRef]
  36. Liu, S.; Li, L.; Fan, H.; Guo, X.; Wang, S.; Lu, J. Real-time and multi-stage recommendations for nitrogen fertilizer topdressing rates in winter oilseed rape based on canopy hyperspectral data. Ind. Crop. Prod. 2020, 154, 112699. [Google Scholar] [CrossRef]
  37. Lu, Z.; Ren, T.; Li, J.; Hu, W.; Zhang, J.; Yan, J.; Li, X.; Cong, R.; Guo, S.; Lu, J. Nutrition-mediated cell and tissue-level anatomy triggers the covariation of leaf photosynthesis and leaf mass per area. J. Exp. Bot. 2020, 71, 6524–6537. [Google Scholar] [CrossRef]
  38. Liu, Q.; Ren, T.; Zhang, Y.; Li, X.; Cong, R.; Liu, S.; Fan, X.; Lu, J. Evaluating the application of controlled release urea for oilseed rape on Brassica napus in a regional scale: The optimal usage, yield and nitrogen use efficiency responses. Ind. Crop. Prod. 2019, 140, 111560. [Google Scholar] [CrossRef]
  39. Kampe, T.U.; Asner, G.P.; Green, R.O.; Eastwood, M.; Johnson, B.R.; Kuester, M. Advances in airborne remote sensing of ecosystem processes and properties: Toward high-quality measurement on a global scale. Remote Sens. Model. Ecosyst. Sustain. VII 2010, 7809, 78090J. [Google Scholar] [CrossRef]
  40. Hutengs, C.; Vohland, M. Downscaling land surface temperatures at regional scales with random forest regression. Remote Sens. Environ. 2016, 178, 127–141. [Google Scholar] [CrossRef]
  41. Huang, J.Z. An introduction to statistical learning: With applications in R by Gareth James, Trevor Hastie, Robert Tibshirani, Daniela Witten. J. Agric. Biol. Environ. Stat. 2014, 19, 556–557. [Google Scholar] [CrossRef]
  42. Schneider, A. Monitoring land cover change in urban and peri-urban areas using dense time stacks of Landsat satellite data and a data mining approach. Remote Sens. Environ. 2012, 124, 689–704. [Google Scholar] [CrossRef]
  43. Ingram, J.C.; Dawson, T.P.; Whittaker, R.J. Mapping tropical forest structure in southeastern Madagascar using remote sensing and artificial neural networks. Remote Sens. Environ. 2005, 94, 491–507. [Google Scholar] [CrossRef]
  44. Şahin, M. Modelling of air temperature using remote sensing and artificial neural network in Turkey. Adv. Space Res. 2012, 50, 973–985. [Google Scholar] [CrossRef]
  45. Liu, X.; Zhu, X.; Zhang, Q.; Yang, T.; Pan, Y.; Sun, P. A remote sensing and artificial neural network-based integrated agricultural drought index: Index development and applications. Catena 2020, 186, 104394. [Google Scholar] [CrossRef]
  46. Chauhan, S.; Sharma, M.; Arora, M.; Gupta, N. Landslide susceptibility zonation through ratings derived from Artificial Neural Network. Int. J. Appl. Earth Obs. Geoinformation 2010, 12, 340–350. [Google Scholar] [CrossRef]
  47. Shibata, K.; Ikeda, Y. Effect of Number of Hidden Neurons on Learning in Large-Scale Layered Neural Networks; Fukuoka International Congress Center: Fukuoka, Japan, 2009; pp. 5008–5013. [Google Scholar]
  48. Sun, W.; Du, Q. Hyperspectral band selection: A review. IEEE Geosci. Remote Sens. Mag. 2019, 7, 118–139. [Google Scholar] [CrossRef]
  49. Cartelat, A.; Cerovic, Z.; Goulas, Y.; Meyer, S.; Lelarge, C.; Prioul, J.-L.; Barbottin, A.; Jeuffroy, M.-H.; Gate, P.; Agati, G.; et al. Optically assessed contents of leaf polyphenolics and chlorophyll as indicators of nitrogen deficiency in wheat (Triticum aestivum L.). Field Crop. Res. 2005, 91, 35–49. [Google Scholar] [CrossRef]
  50. Merzlyak, M.N.; Solovchenko, A.E.; Gitelson, A.A. Reflectance spectral features and non-destructive estimation of chlorophyll, carotenoid and anthocyanin content in apple fruit. Postharvest Biol. Technol. 2003, 27, 197–211. [Google Scholar] [CrossRef]
  51. Mutanga, O.; Skidmore, A.K.; Van Wieren, S. Discriminating tropical grass (Cenchrus ciliaris) canopies grown under different nitrogen treatments using spectroradiometry. ISPRS J. Photogramm. Remote Sens. 2003, 57, 263–272. [Google Scholar] [CrossRef]
  52. Zhao, D.; Reddy, K.R.; Kakani, V.G.; Reddy, V. Nitrogen deficiency effects on plant growth, leaf photosynthesis, and hyperspectral reflectance properties of sorghum. Eur. J. Agron. 2005, 22, 391–403. [Google Scholar] [CrossRef]
  53. Asner, G.P.; Martin, R.E.; Tupayachi, R.; Emerson, R.; Martínez, P.; Sinca, F.; Powell, G.V.N.; Wright, S.J.; Lugo, A.E. Taxonomy and remote sensing of leaf mass per area (LMA) in humid tropical forests. Ecol. Appl. 2011, 21, 85–98. [Google Scholar] [CrossRef] [PubMed]
  54. Marschner’s Mineral. Nutrition of Higher Plants, 3rd ed.; Marschner, H.; Marschner, P. (Eds.) Elsevier: London, UK; Academic Press: Waltham, MA, USA, 2012. [Google Scholar]
  55. Cheema, M.A.; Malik, M.A.; Hussain, A.; Shah, S.H.; Basra, S.M.A. Effects of time and rate of nitrogen and phosphorus application on the growth and the seed and oil yields of canola (Brassica napus L.). J. Agron. Crop. Sci. 2001, 186, 103–110. [Google Scholar] [CrossRef]
  56. Oosterhuis, D.M.; Loka, D.A.; Kawakami, E.M.; Pettigrew, W.T. The physiology of potassium in crop production. Adv. Agron. 2014, 126, 203–233. [Google Scholar]
  57. Akhtar, M.E.; Khan, M.Z.; Ahmad, S.; Ashraf, S.; Sardar, A. Effect of potassium on micromorphological and chemical composition of three cotton (Gossypium Hirsutum L.) genotypes. Afr. J. Biotechnol. 2009, 8, 3511–3518. [Google Scholar]
  58. Gitelson, A.A.; Merzlyak, M.N.; Chivkunova, O.B. Optical properties and nondestructive estimation of anthocyanin content in plant leaves. Photochem. Photobiol. 2007, 74, 38–45. [Google Scholar] [CrossRef]
  59. Gamon, J.A.; Surfus, J.S. Assessing leaf pigment content and activity with a reflectometer. New Phytol. 1999, 143, 105–117. [Google Scholar] [CrossRef]
  60. Chandra, A.; Yao, X. Evolving hybrid ensembles of learning machines for better generalisation. Neurocomputing 2006, 69, 686–700. [Google Scholar] [CrossRef]
  61. Rahman, A.; Fairhurst, M.C. Serial combination of multiple experts: A unified evaluation. Pattern Anal. Appl. 1999, 2, 292–311. [Google Scholar] [CrossRef]
  62. Woźniak, M.; Graña, M.; Corchado, E. A survey of multiple classifier systems as hybrid systems. Inf. Fusion 2014, 16, 3–17. [Google Scholar] [CrossRef] [Green Version]
  63. Blackburn, G.A.; Ferwerda, J.G. Retrieval of chlorophyll concentration from leaf reflectance spectra using wavelet analysis. Remote Sens. Environ. 2008, 112, 1614–1632. [Google Scholar] [CrossRef]
  64. Schlerf, M.; Atzberger, C.; Hill, J.; Buddenbaum, H.; Werner, W.; Schüler, G. Retrieval of chlorophyll and nitrogen in Norway spruce (Picea abies L. Karst.) using imaging spectroscopy. Int. J. Appl. Earth Obs. Geoinf. 2010, 12, 17–26. [Google Scholar] [CrossRef]
  65. Cheng, T.; Rivard, B.; Sánchez-Azofeifa, A.G.; Feret, J.-B.; Jacquemoud, S.; Ustin, S. Deriving leaf mass per area (LMA) from foliar reflectance across a variety of plant species using continuous wavelet analysis. ISPRS J. Photogramm. Remote Sens. 2014, 87, 28–38. [Google Scholar] [CrossRef]
  66. Padilla, F.M.; Farneselli, M.; Gianquinto, G.; Tei, F.; Thompson, R.B. Monitoring nitrogen status of vegetable crops and soils for optimal nitrogen management. Agric. Water Manag. 2020, 241, 106356. [Google Scholar] [CrossRef]
  67. Wang, W.; Lu, J.; Ren, T.; Li, X.; Su, W.; Lu, M. Evaluating regional mean optimal nitrogen rates in combination with indigenous nitrogen supply for rice production. Field Crop. Res. 2012, 137, 37–48. [Google Scholar] [CrossRef]
  68. Soil Survey Staff. Keys to Soil Taxonomy, 11th ed.; USDA-NRCS US Government Print Office: Washington, DC, USA, 2010.
  69. Zou, J. Assessment of Soil Nutrient Critical Levels and the Effects of Fertilization on Winter Oilseed Rape; Huazhong Agricultural University: Wuhan, China, 2010. [Google Scholar]
Figure 1. Workflow of the proposed ensemble modeling framework. Due to the limited space, in the first layer, the complete workflow was only presented for the band selection of phosphorous (P) nutrition. For the nitrogen (N) and potassium (K) nutrition, there are the same band selection processes as for the P.
Remotesensing 12 04060 g001
Figure 2. (a) Leaf nitrogen concentration (LNC), (b) leaf phosphorous concentration (LPC), and (c) leaf potassium concentration (LKC) in response to different N, P, and K deficiency levels. Nsev: severe N deficiency; Nmed: medium N deficiency; Psev: severe P deficiency; Pmed: medium P deficiency; Ksev: severe K deficiency; Kmed: medium K deficiency; Normal: normal condition without any stresses.
Remotesensing 12 04060 g002
Figure 3. Canopy spectral reflectance in response to different nutrient deficiency levels. Nsev: severe N deficiency; Nmed: medium N deficiency; Psev: severe P deficiency; Pmed: medium P deficiency; Ksev: severe K deficiency; Kmed: medium K deficiency; Normal: normal condition without any stresses.
Remotesensing 12 04060 g003
Figure 4. Ten selected spectral bands with scores sensitive to different (a) N, (b) P, and (c) K deficiency levels. Mean canopy spectra at different nutrient deficiency levels are plotted for reference. Nsev: severe N deficiency; Nmed: medium N deficiency; Nexc: excessive N fertilization; Psev: severe P deficiency; Pmed: medium P deficiency; Pexc: excessive P fertilization; Ksev: severe K deficiency; Kmed: medium K deficiency; Kexc: excessive K fertilization; Normal: normal condition without any stresses.
Remotesensing 12 04060 g004
Figure 5. Nine probabilities generated from three nutrient deficiency models. The probabilities show the likelihood of a spectrum being diagnosed with severe deficiency, medium deficiency, or the normal condition for N (N_sev%, N_med%, N_nor%), P (P_sev%, P_med%, P_nor%), or K (K_sev%, K_med%, K_nor%). Nsev: severe N deficiency; Nmed: medium N deficiency; Nexc: excessive N fertilization; Psev: severe P deficiency; Pmed: medium P deficiency; Pexc: excessive P fertilization; Ksev: severe K deficiency; Kmed: medium K deficiency; Kexc: excessive K fertilization; Normal: normal condition without any stresses.
Remotesensing 12 04060 g005
Figure 6. (a) Overall accuracy, (b) producer’s accuracy, and (c) user’s accuracy of the nutrient analysis produced by the proposed framework and the random forest (RF), support vector machine (SVM), and artificial neural network (ANN) classifiers using the same validation dataset. Nsev: severe N deficiency; Nmed: medium N deficiency; Nexc: excessive N fertilization; Psev: severe P deficiency; Pmed: medium P deficiency; Pexc: excessive P fertilization; Ksev: severe K deficiency; Kmed: medium K deficiency; Kexc: excessive K fertilization; Normal: normal condition without any stresses.
Remotesensing 12 04060 g006
Table 1. Growth season, site, planting patterns, cultivar, fertilizer rates, number of samples, and field experiment references.
Exp.SeasonSitePlanting PatternsCultivarN, P, or K Fertilizer Rates (kg ha−1)No. of SamplesReferences
Experiments of N Fertilization
12015–2016ShayangTransplantingHuayouza No. 90, 90, 180, 27043[35,36]
22017–2018WuhanTransplantingHuayouza No. 90, 75, 180120None
3 a2017–2018Wuxue-GuotanTransplantingHuayouza No. 90, 90, 180, 27044None
42018–2019WuhanTransplantingHuayouza No. 90, 75, 180122None
5 a2018–2019Wuxue- GuotanTransplantingHuayouza No. 90, 90, 180, 27053None
62019–2020Wuxue- GuotanTransplantingHuayouza No. 990, 180, 27045None
Experiments of P Fertilization
7 a2013–2014Wuxue-GuotanTransplantingHuayouza No. 90, 45, 909[35,36]
82014–2015WuhanDirect sowingHuayouza No. 620, 30, 90180None
9 a2017–2018Wuxue-GuotanTransplantingHuayouza No. 90, 45, 90, 135, 18062None
10 a2018–2019Wuxue-GuotanTransplantingHuayouza No. 90, 45, 90, 135, 18035None
Experiments of K Fertilization
11 a2017–2018Wuxue-GuotanTransplantingHuayouza No. 90, 60, 120, 180, 24089[37]
122017–2018Wuxue-CongzhenTransplantingHuayouza No. 90, 7518None
13 a2018–2019Wuxue-GuotanTransplantingHuayouza No. 90, 60, 120, 180, 24077None
142018–2019Wuxue-CongzhenTransplantingHuayouza No. 90, 7518None
a: Leaf nitrogen concentration (LNC), leaf phosphorous concentration (LPC), or leaf potassium concentration (LKC) measurements of samples were available.
Table 2. Fertility status of the top soil (0–20 cm) in the study sites. Methods of soil test were provided in the Appendix A.
SitepHOrganic Matter (g kg1)Total-N (g kg1)Olsen-P (mg kg−1)Available-K (mg kg1)Available-B (mg kg1)Soil TextureClassification
Shayang5.8818.020.96 a11.79 a85.97 b0.39 bSilt loamUltisols
Wuhan6.15–6.3819.08–20.271.07–1.15 b5.09–5.12 a166.8–207.74 b,c0.51–0.68 bSilt loamUltisols
Wuxue-Guotan5.73–5.9625.2–36.531.54–2.19 b4.6–11.8 a36.25–81.8 a,b0.34–0.46 bSandy loamUltisols
Wuxue-Congzhen5.05–6.221.8–31.761.75–2.18 b3.78–8.4 a25.1–58.9 a0.19–0.36 bSandy loamUltisols
a: deficiency; b: mid-range; c: abundance.
Table 3. Nutrient deficiency levels and the corresponding nutrient fertilizer application rates (kg ha1).
NutrientSevereMediumNormalExcessive
N075, 90180270
P030, 4590135, 180
K060, 75120180, 240
Publisher’s Note: MDPI stays neutral with regard to jurisdictional claims in published maps and institutional affiliations.

