Urban Riverway Extraction from High-Resolution SAR Image Based on Blocking Segmentation and Discontinuity Connection

School of Geomatics, Liaoning Technical University, Fuxin 123000, China
*
Author to whom correspondence should be addressed.
Remote Sens. 2020, 12(24), 4014; https://doi.org/10.3390/rs12244014
Submission received: 30 October 2020
/
Revised: 29 November 2020
/
Accepted: 5 December 2020
/
Published: 8 December 2020
(This article belongs to the Special Issue Urban Landscapes and Global Environmental Challenges: Monitoring and Modelling Using Remote Sensing)
Abstract
:An urban riverway extraction method is proposed for high-resolution synthetic aperture radar (SAR) images. First, the original image is partitioned into overlapping sub-image blocks, in which the sub-image blocks that do not cover riverways are regarded as background. Sub-image blocks covering riverways are then filtered using the iterative adaptive speckle reduction anisotropic diffusion (SRAD) that introduces the relative signal-to-noise ratio (RSNR). The filtered images are segmented quickly by the Sauvola algorithm, and the false riverway fragments are removed by the area and aspect ratio of the connected component in the segmentation results. Using the minimum convex hull of each riverway segment as the connection object, the seeds are automatically determined by the difference between adjacent pyramid layers, and the sub-image block riverway extraction result is used as the bottom layer. The discontinuity connection between river segments is achieved by multi-layer region growth. Finally, the processed sub-image blocks are stitched to get the riverway extraction results for the entire image. To verify the applicability and usefulness of the proposed approach, high-resolution SAR imagery obtained by the Gaofen-3 (GF-3) satellite was used in the assessment. The qualitative and quantitative evaluations of the experimental results show that the proposed method can effectively and completely extract complex urban riverways from high-resolution SAR images.
1. Introduction
As an important carrier of urban water resources, the urban riverway is a type of ground object formed by natural and anthropogenic factors and affects various important functions, including urban ecological landscapes, flood control, and the regulation of heat island effects [1]. In recent years, the use of remote sensing satellite images to extract urban riverways quickly and accurately has significantly improved the rational utilization, macro-monitoring, real-time planning, and future protection of urban water resources.
In remote sensing, the water body’s spectral feature serves as the primary indicator in the identification and extraction of the riverway [2]. In the visible waveband, the water body has less light absorption and higher reflectivity [3]. However, physical and chemical characteristics of different water body segments may cause measurement variations, thereby increasing the difficulty of water body extraction. As the wavelength increases, the reflectivity of the water body decreases; when the wavelength exceeds 0.75 μm, it almost becomes an absorber. The wavelength used for Synthetic Aperture Radar (SAR) imaging is usually at centimeter-level, which is much larger than the wavelength. As a result, the water body behaves like a region with lower overall brightness in the SAR image [4]. As an active microwave sensor, SAR has pronounced advantages over optical sensors, providing wider coverage in all weather conditions [5]. SAR images have become the main data source for water body extraction.
Few studies have been conducted on SAR image urban riverway extraction, usually part of larger research delineating water bodies [6]. SAR-based water body extraction methods based on SAR image mainly include texture analysis, data fusion, and threshold-based segmentation. The texture analysis method uses local binary patterns and a gray-level co-occurrence matrix to describe the texture features of water bodies [7,8]. This method is a classical approach for water body extraction, but many calculations and uneven texture features in water bodies reduce its accuracy and applicability. In the data fusion method, water body extraction is achieved mainly through the fusion of optical images, thematic maps, digital elevation models, and other information [9,10,11]. Due to the introduction of varying data types, this approach has large random errors and can sometimes be impractical and unfeasible due to difficulties in obtaining fusion data. For the threshold-based segmentation method, the threshold used for delineating water features is obtained through the water body’s spectral features in the SAR image. Due to its simplicity and efficiency, this approach has been widely used in water body extraction studies. For example, in [12,13,14,15,16], histograms, Otsu, maximum entropy, and clustering methods have been used to select the threshold for water body extraction. However, due to the inherent speckle noise in SAR images, the results yielded many false extractions. Some postprocessing methods are used to eliminate false extractions. However, if these false extractions are connected to real water bodies, the postprocessing methods would be invalid, seriously reducing the extraction accuracy. The most simple and effective way to solve this problem is to filter the SAR image in advance. For this purpose, filters, such as Lee, Frost, Kuan, and speckle reduction anisotropic diffusion (SRAD) in [17,18,19,20], can be used prior to the water body extraction.
Compared with lakes, reservoirs, wetlands, and other water bodies, urban riverways in high-resolution SAR images have meandering geometries and are usually accompanied by natural obstacles (such as tree shadows) and human-made infrastructure (such as bridges and dams), appearing in the image as curved riverway segments with certain discontinuities [21]. The urban riverway spans over a large image region, while the ratio of the riverway object to the background is very small, resulting in the whole image being extracted with a larger scale and more complex background. These properties of urban riverways in high-resolution SAR images make the above methods unsuitable for extraction. To quickly and effectively extract riverways from large-scale urban SAR images, an extraction method based on blocking segmentation and discontinuity connection is proposed. The method first partitions the original image into a collection of overlapping sub-image blocks and extracts riverway segments in sub-image blocks by iterative adaptive SRAD and the Sauvola local threshold algorithm. The discontinuity between the riverway segments is then automatically connected, and the extraction results of each sub-image block are stitched to obtain the final extraction result.
The main methodological improvements and contributions of this paper are as follows.
(1) The original image is partitioned into sub-image blocks with a shared boundary region. These sub-image blocks are then classified into two categories according to whether they cover the riverway. As not all sub-image blocks cover the riverway, two schemes can be implemented on the classified sub-image blocks: the sub-image blocks that do not cover the riverway can be processed as background, while the sub-image blocks that cover the riverway are the processing units to be extracted. By introducing image blocking and a classification processing mechanism, the limited computing resources can be concentrated on specific regions of interest, which can improve the efficiency of riverway extraction. This can also effectively reduce background information not relevant in riverway extraction, thereby improving accuracy. Due to the shared boundary region of adjacent sub-image blocks, the riverway segment occupying these blocks has a buffer that can be better stitched during segment extraction.
(2) For the sub-image blocks covering the riverway, the iterative adaptive SRAD that introduces RSNR is used for filtering as a preprocessing step. The riverway segments are quickly extracted by the Sauvola algorithm [22], and the false riverway fragments are removed by the area and aspect ratio of connected components. The filtering procedure can greatly reduce the effect of speckle noise in SAR images during segmentation. The introduction of the RSNR quantitative index in SRAD to control the number of filtering iterations in different sub-image blocks can reduce artificially specified errors. Using the Sauvola algorithm in segmentation, the filtered image can overcome the uneven brightness of the image. Likewise, the use of morphological features of riverways in postprocessing the segmentation results can effectively improve the extraction accuracy.
(3) For each extracted sub-image block, the minimum convex hull in each riverway segment is calculated to form the search sub-image block with a convex hull as the connection object used as the bottom stratum of the multi-layer pyramid [23]. The seeds between the riverway segments in the pyramid’s top layer are located by the search strategy. The seeds are then grown by the growth strategy, and the growth results are mapped in the next layer. The process of seed location and growth is repeated layer by layer until the bottom layer realizes the automatic connection of the discontinuities. By taking the minimum convex hull that envelops each riverway segment as the connection object, the meandering riverway can be taken as a whole to avoid a riverway being connected at the meanders. By constructing pyramids for multi-layer region growth, the discontinuity between riverway segments can be connected automatically.
2. Algorithm Description
Let I = {Ii, j, (i, j) ∈ Ω} be a SAR intensity image defined on its spatial domain Ω = {(i, j): i = 1, …, M, j = 1, …, N}, where (i, j) denotes the pixel lattice position, Ii, j ∈ {0, …, 255} is the intensity at (i, j), and M and N are the numbers of rows and columns of I, respectively.
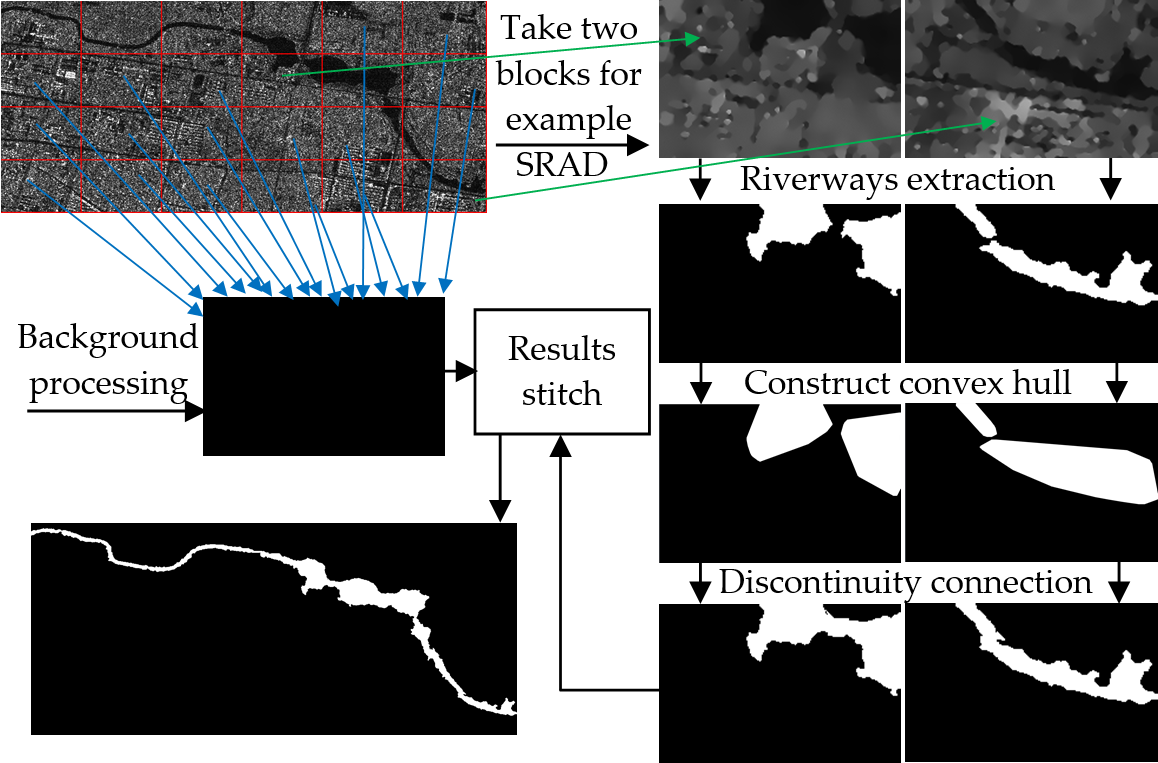
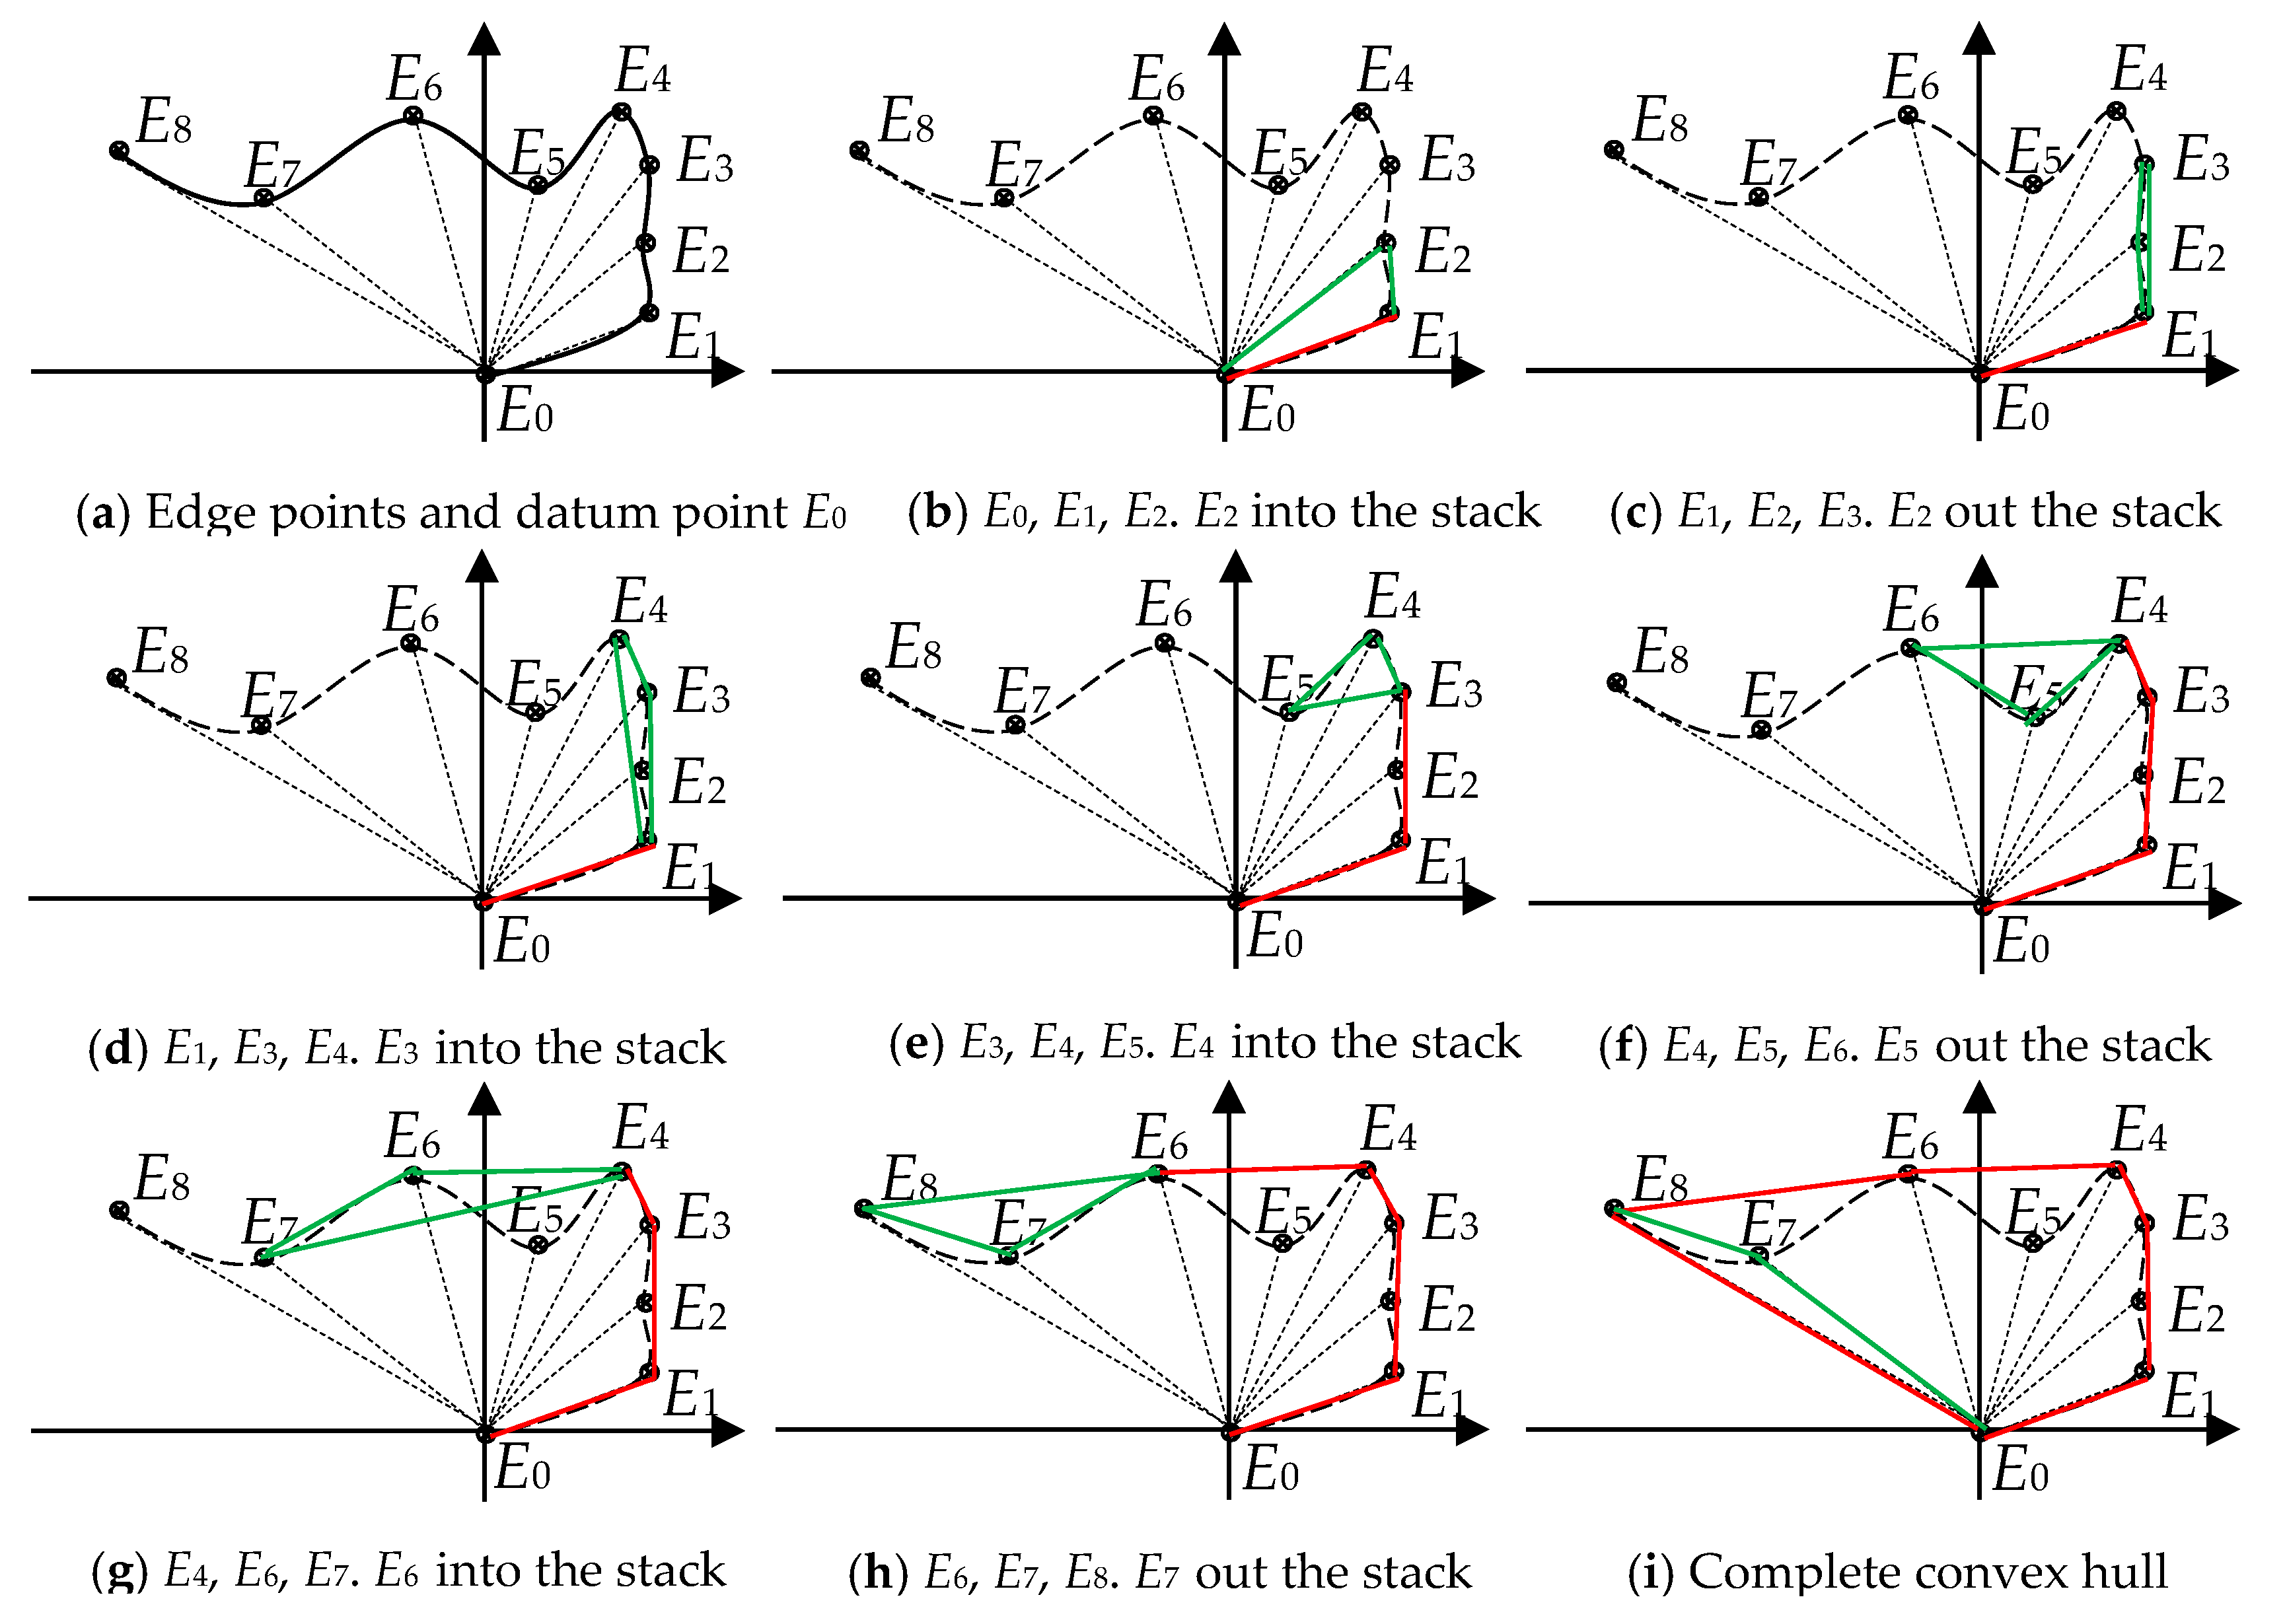
The proposed urban riverway extraction method consists of five parts: (1) image block partition and classification, (2) SRAD filtering preprocessing, (3) riverway segments extraction, (4) discontinuity connection, and (5) output of extraction result. The framework of this method is shown in Figure 1.
2.1. Overlapping Block Partition and Classification
The original image is first partitioned into a collection of non-overlapping, fully covering image blocks. The image blocks are then extended to adjacent blocks along the X- and Y-axes of the image space with overlapping degrees (v0 and h0) to obtain a set of sub-image blocks. The overlapping block partition process can be expressed as
where B = {Bl, l = 1, …, h × v} and B’ = {B’l, l = 1, …, h × v} represent the partitioned non-overlapping and overlapping image block collections, l is the index of the image block, and v and h are the number of image blocks along the X- and Y-axes.
where ⌊⋅⌋ is the down rounding operator, and V and H are the sizes of the non-overlapping block set along the X- and Y-axes.
The sub-image blocks in B’ can be classified into blocks covering riverways and blocks not covering riverways by visual interpretation. Suppose that the number of sub-image blocks B’ covering riverway and B’ not covering riverway in B’ is n1 and n2, where l1 ∈ {1, …, n1}, l2 ∈ {1, …, n2}. For B’, which is processed as background, the result is denoted as J = {Ji, j, (i, j) ∈ Ω}, where Ji, j = 0 means background, and Ω is the spatial domain corresponding to B’.
2.2. SRAD Filtering Preprocessing
For B’, the spatial domain is denoted as Ω, l1 ∈ {1, …, n1}. Taking Ii, j, (i, j) ∈ Ω, as input, SRAD uses the following update function for the iterative filtering,
where ξ and ξ are time and spatial steps, respectively. The parameter is the diffusion coefficient at (i, j) for the (t−1)-th iteration and is expressed as
where ▽ and ▽2 represent the gradient and Laplacian operator, respectively, and c(q) is defined as
where qi, j is the instantaneous diffusion coefficient, which can be calculated by the equation
The smoothing scale function, q0(ξ), can be approximated by
where ρ is the speckle reduction exponential, and 0 < q0 ≤ 1 is the initial diffusion coefficient.
In order to adaptively control the number of filtering iteration, RSNR is introduced as a termination condition, defined as
where and are the results of the t− and (t−1)-th filtering of I at (i, j), respectively.
When the filtering iteration satisfies the Equation (9), the iteration is terminated, and the corresponding filtered image F = {Fi, j, (i, j) ∈ Ω} is obtained, where Fi, j = .
where ε is the preselected threshold, which is generally adopted as ε ≥ 0.01.
2.3. Extraction of Riverway Segments
Considering the spectral features of the riverway and the uneven brightness of the filtered image, the Sauvola algorithm is used to directly binarize the filtered image. The false riverway fragments are removed to realize the extraction of riverway segments.
In the optimized Sauvola algorithm, the integral image of F is used to quickly obtain the average pixel intensity μi, j and the standard deviation σi, j in a w × w window centered on (i, j). To calculate the threshold Ti, j at (i, j), the following equation is used,
where (i, j) ∈ Ω, κ ∈ [0.2, 0.5] is the empirical adjustable parameter. To facilitate the subsequent processing, the Ti, j is used to binarize F:
where Ri, j = 0 means background, and Ri, j = 1 means riverway, R = {Ri, j, (i, j) ∈ Ω}.
The connected component search is performed on the obtained R, and the false riverway fragments are removed by setting the area and aspect ratio thresholds of the connected component:
where z is the index of the connected component and also serves as the riverway segment index, z ∈ {1, …, Z}; Z is the total number of connected components in R; Ta is the area threshold; and Tr is the aspect ratio threshold. If Equation (12) is satisfied, the z-th connected component is considered as a true riverway segment. After traversing all connected components, the number of true riverway segments is denoted as Z’, and the extraction result is R’ = {R’i, j, (i, j) ∈ Ω}, where R’i, j ∈ {0, 1}, R’i, j = 1 means riverway, R’i, j = 0 means background.
2.4. Discontinuity Connection between Riverway Segments
As other objects often overshadow the upper parts of urban riverways, a certain distance discontinuity is generated between the extracted riverway segments. In order to obtain complete riverway information, it is necessary to automatically connect the discontinuities between riverway segments.
2.4.1. Construction of the Convex Hull
To better correspond to the complex shapes of urban riverways, the minimum convex hull for each riverway segment is first calculated and regarded as the connecting object.
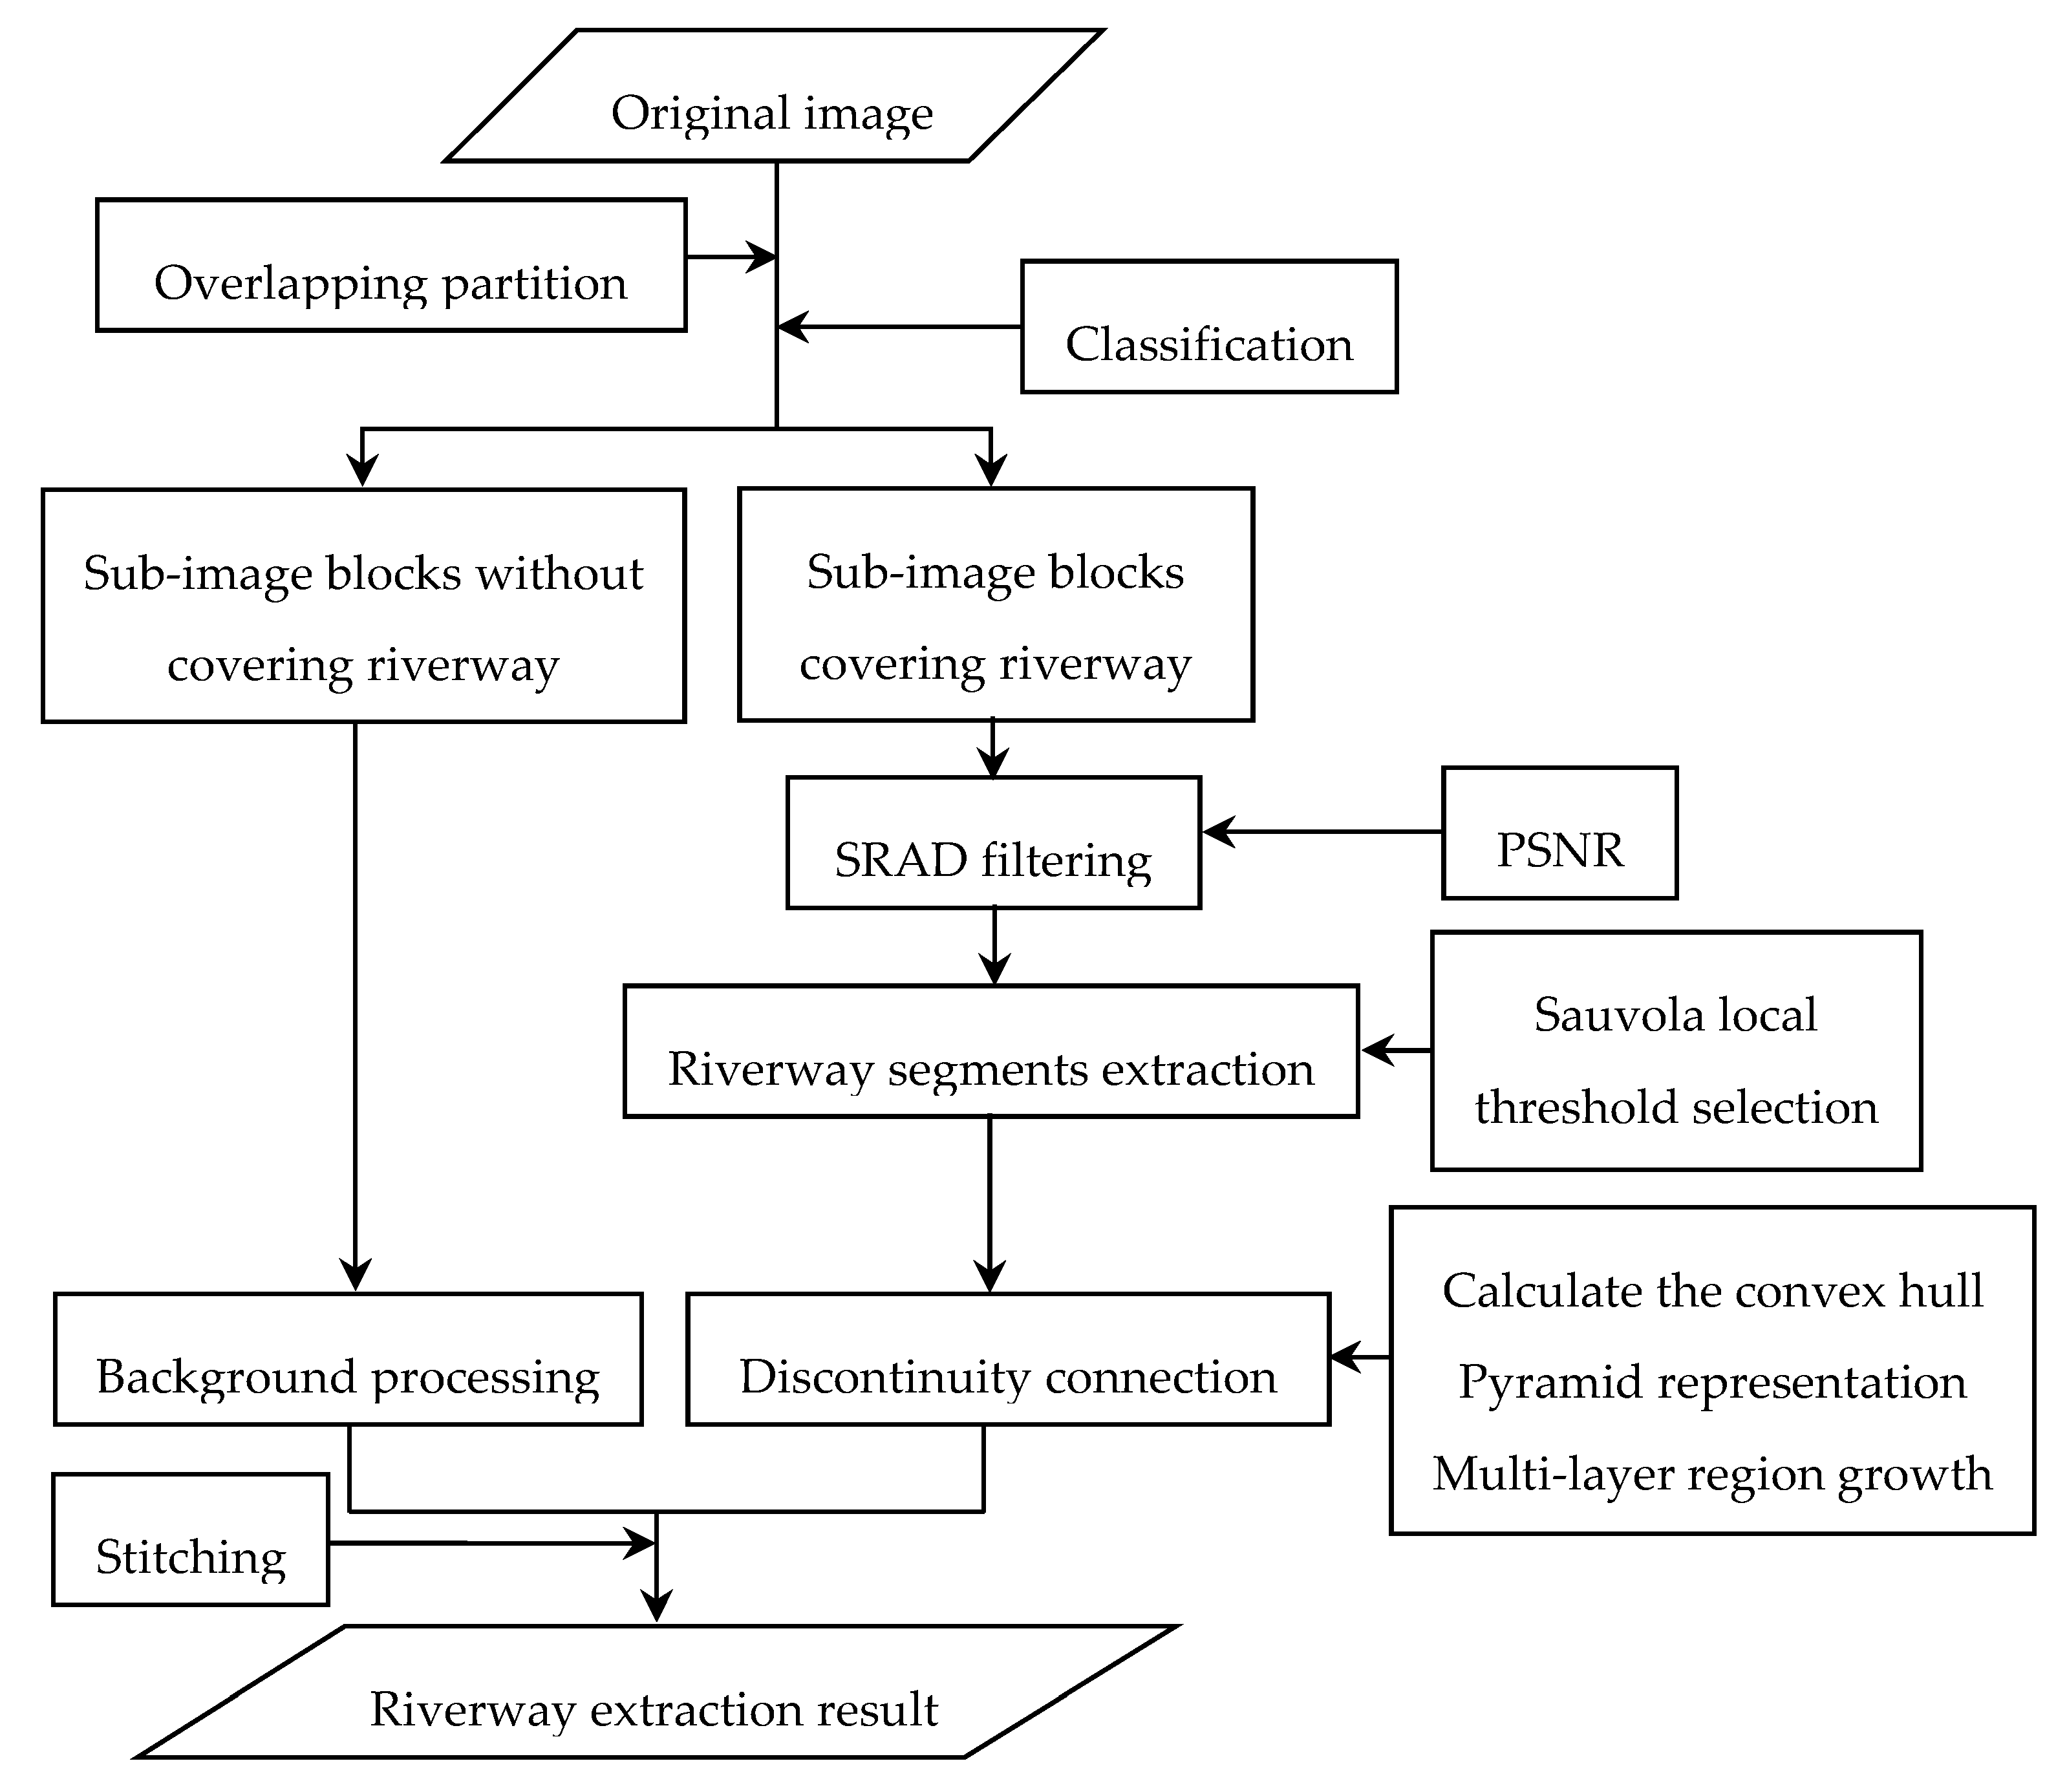
Take a riverway segment and its nine edges (E0, E1, …, E8) as example. E0, the point with the smallest Y-coordinate value, is taken as the reference point. The other points E1–E8 are connected to E0 and sorted according to their angles with the X-coordinate, as shown in Figure 2a. The coordinates of three adjacent edge points form a third-order square matrix, where the determinant can be calculated. For example, given E0(x0, y0), E1(x1, y1), and E2(x2, y2), the determinant of the square matrix formed by these points can be calculated as
where | · | is the determinant operator. If P < 0, then E1 is determined as a convex hull point. As shown in Figure 2, all the edge points are processed (the green lines indicate the intermediate process, and the red lines are determined convex hull borders) to obtain the convex hull of the riverway segment.
Using this method to process the R’, the results are denoted as P = {P(z), z = 1, …, Z’}, where l1 ∈ {1, …, n1}, P(z) is the convex hull of the z-th riverway segment in R’.
2.4.2. Pyramid Representation of Convex Hull Image
Taking P as input, a Gaussian Pyramid (GP) is constructed by Gaussian smoothing and sub-sampling P.
where Gk is the k-th layer of GP; k ∈ {1, …, K}, K is the total number of layers; Hr is the 2-D Gaussian low-pass filter for reducing resolution; ⊗ is the convolution operation; and S is the step size, such that (↓S)[·] means downsampling with step size S.
The Connection Pyramid (CP) is constructed by upsampling the Gk and superimposing it with the Gk-1, k ∈ {1, …, K}. When k = K,
When k < K,
where Ck represents the k-th layer of CP; is the extension of Ck to match the size of Gk-1, He is the 2-D Gaussian high-pass filter for resolution expansion, and (↑S)[·] means upsampling with step size S.
2.4.3. Multi-Layer Region Growth
The resolution difference of adjacent GP layers is used to automatically determine the seeds of each CP layer. The discontinuity connection is realized by combining the region growth results of seeds in each CP layer.
(a) Automatic location of seeds
For any layer Ck of CP, three kinds of pixel intensity values can be obtained based on its construction process. For Ck(i, j) = 0, Gk(i, j) = C’k+1(i, j) = 0, such that k- and (k+1)-th layers are both background at (i, j). For Ck(i, j) = 2, Gk(i, j) = C’k+1(i, j) = 1, such that k- and (k+1)-th layers are both riverway at (i, j). For Ck(i, j) = 1, Gk(i, j) = 0 and C’k+1(i, j) =1, indicating that the position (i, j) may belong to the discontinuity between riverway segments. Therefore, the search strategy for the seeds in Ck, k ∈ {1, …, K} is to select the points with Ck(i, j) = 1 as the seeds.
(b) Growth range of seeds
With the increase of k, the growth range of seeds should be gradually reduced, and the maximum growth range of the k-th layer can be expressed as
where S is the sampling step size for constructing GP.
(c) Growth strategy of seeds
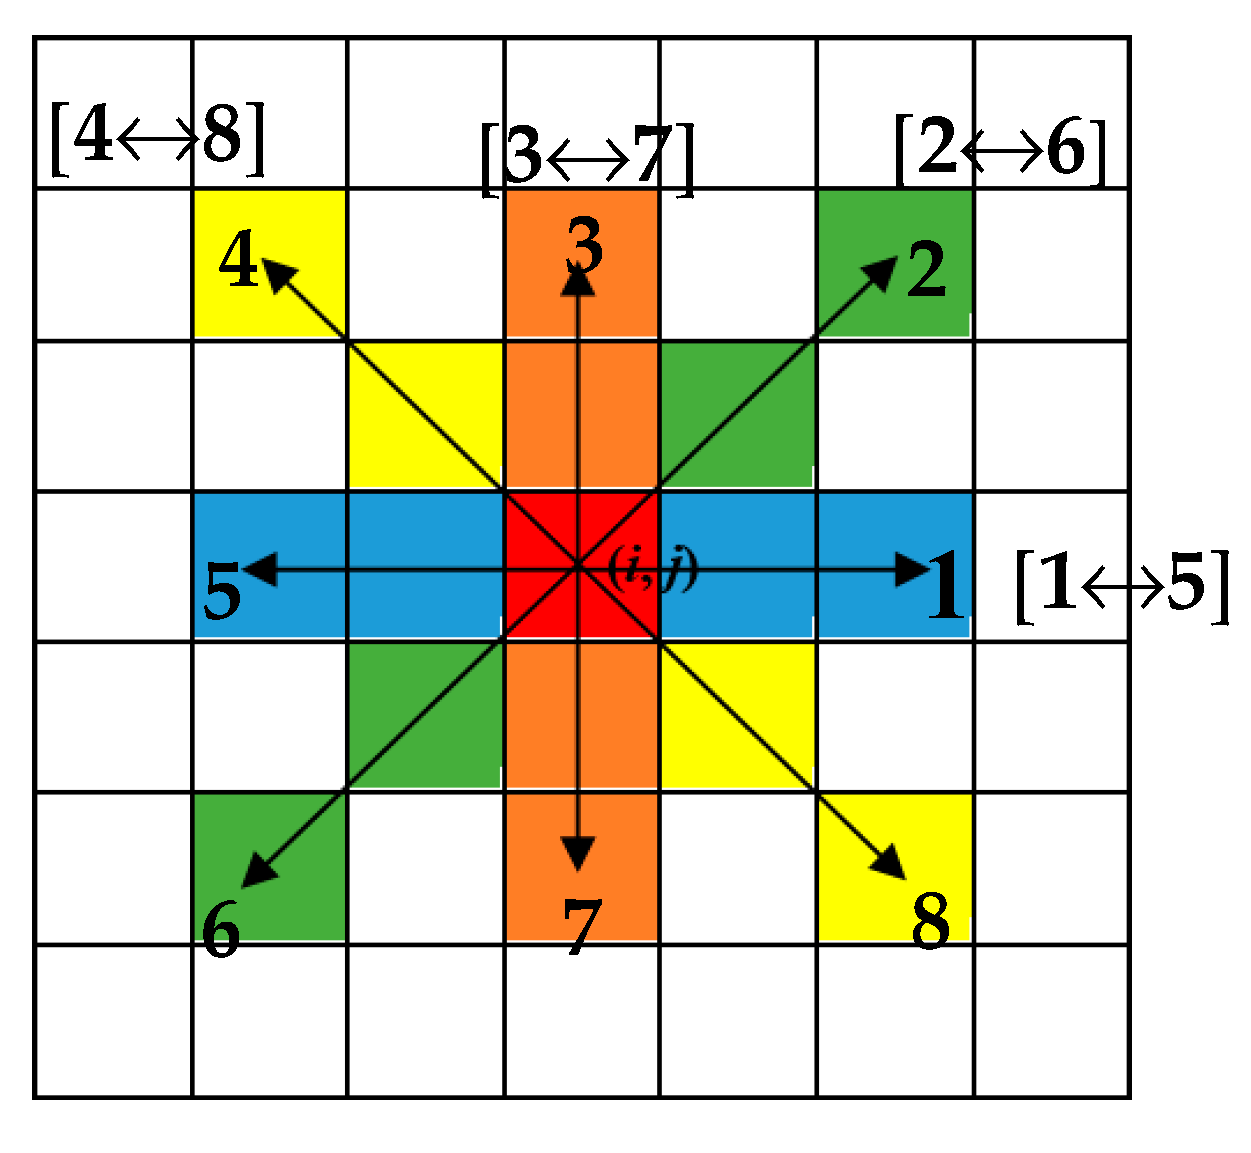
For any seed in Ck, k ∈ {1, …, K}, the seed can grow in four directions along in eight angles with its position as the center, as shown in Figure 3. The four directions are horizontal (1↔5), right diagonal (2↔6), vertical (3↔7), and left diagonal (4↔8). The seed’s growth strategy is to expand along each growth angle from seed until the pixel with intensity value 2 is found in its maximum growth range and there is no pixel with intensity 0 on the growth path. On each growth angle, the length of the growth path in pixels is denoted as , where o ∈ {1, …, 8} is the growth angle index.
(d) Riverway segment connection
If the growth results in any of the four directions meet the discontinuity condition, the seeds are connected to the riverway segment. Taking the horizontal direction as example, when the length of the growth path + ≤ Rk, the seed can be determined to belong to the discontinuity between riverway segments. The connection process is employed to change the seed into a riverway segment, such that Ck(i, j) = 1 → Ck(i, j) = 2.
(e) Termination of seed growth connection
The seeds are grown and connected according to the conditions in (b), (c), and (d). As all seeds determined in (a) are traversed, the growth connection ends.
Starting from CK, the determined seeds are used for region growth, and the growth results are passed to the next layer to connect the discontinuities, layer by layer. When k = 1, C0 is obtained, which is the connection result of P. For the final riverway extraction image J = C0 − P + R’ = {Ji, j, (i, j) ∈ Ω}, where Ji, j ∈ {0, 1}, Ji, j = 1 means riverway, and Ji, j = 0 means background. If there is a little background noise inside the riverway extracted in J, the connected component method of Section 2.3 can be used to optimize it.
2.5. Riverway Extraction Result Output
In order to obtain the output image in the riverway extraction, the resulting sub-image blocks have to be stitched. Considering the accuracy and computational efficiency, the output operation can be simply regarded as the inverse process of image-overlap partitioning.
First, for the riverway extraction results of each sub-image block, the overlapping degrees of h0 and v0 pixels are removed along the X- and Y-axes of the image space. The non-overlapping riverway extraction results are then stitched to form the output image. The process of riverway extraction can be expressed as
where Jl and J’l are the l-th overlapping and non-overlapping image blocks, respectively, and l ∈ {1, …, h × v}, J = {Ji, j, (i, j) ∈ Ω} is the final riverway extraction output image, where Ji, j ∈ {0, 1}, Ji, j = 1 means riverway and Ji, j = 0 means background.
3. Experiment and Analysis
For this study, a personal computer with Intel (R) Core (TM) CPU 32G, Windows 10 32-bit professional operating system, and MATLAB R2018b was used in the experiments. The experimental results were then evaluated quantitatively and quantitatively.
3.1. Data
The GaoFen-3 (GF-3) satellite is China’s first C-band multi-polarization SAR satellite with a 1-m resolution. It was launched on 10 August 2016 and can receive and transmit fully polarized electromagnetic waves with 12 imaging modes, such as Spotlight (SL), Fine Strip (FS), Ultra Fine Strip (UFS), and Standard Strip (SS).
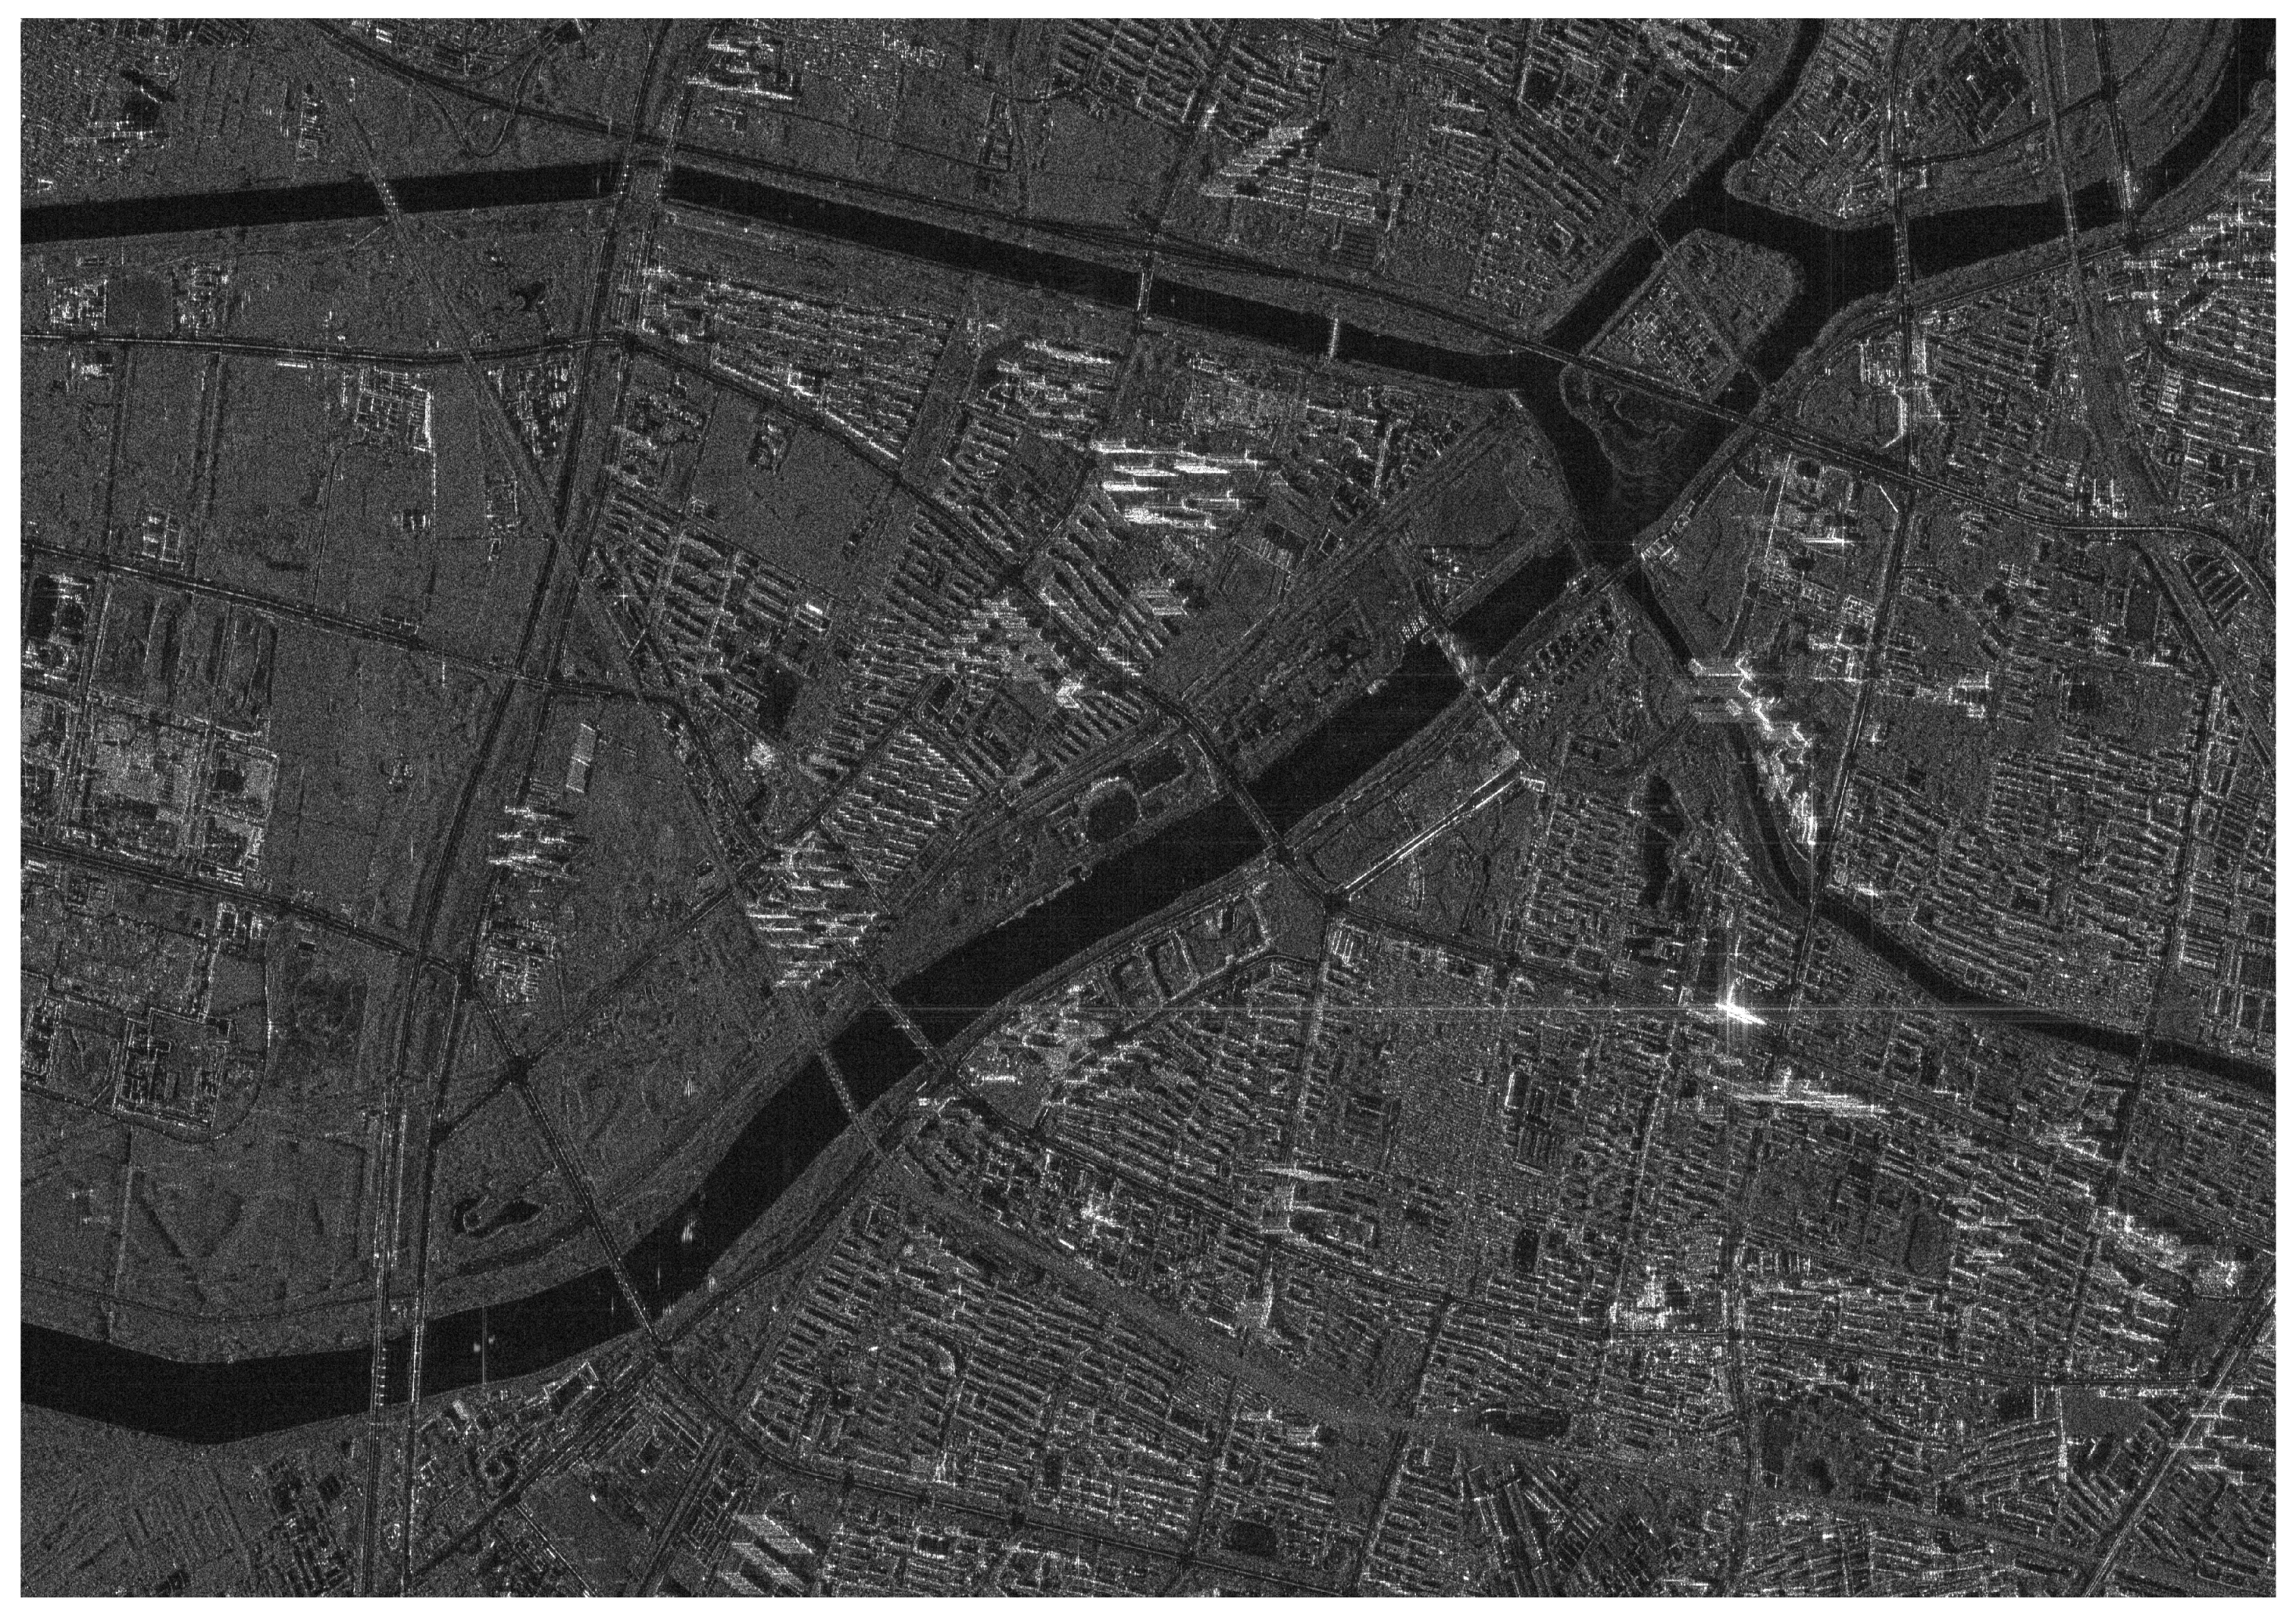
As a case study, a partial region of a GF3-UFS intensity image was selected, which was taken in Beijing, China in September 2017, with a size of 2800 × 4000 pixels and a 3-m spatial resolution. Figure 4 shows the original image of the study area, which contains objects, such as riverways, roads, buildings, and bridges that cross the riverway and connect to the road. Compared with other objects, the riverway shows a lower gray value and has a meandering shape.
3.2. Experiment and Results
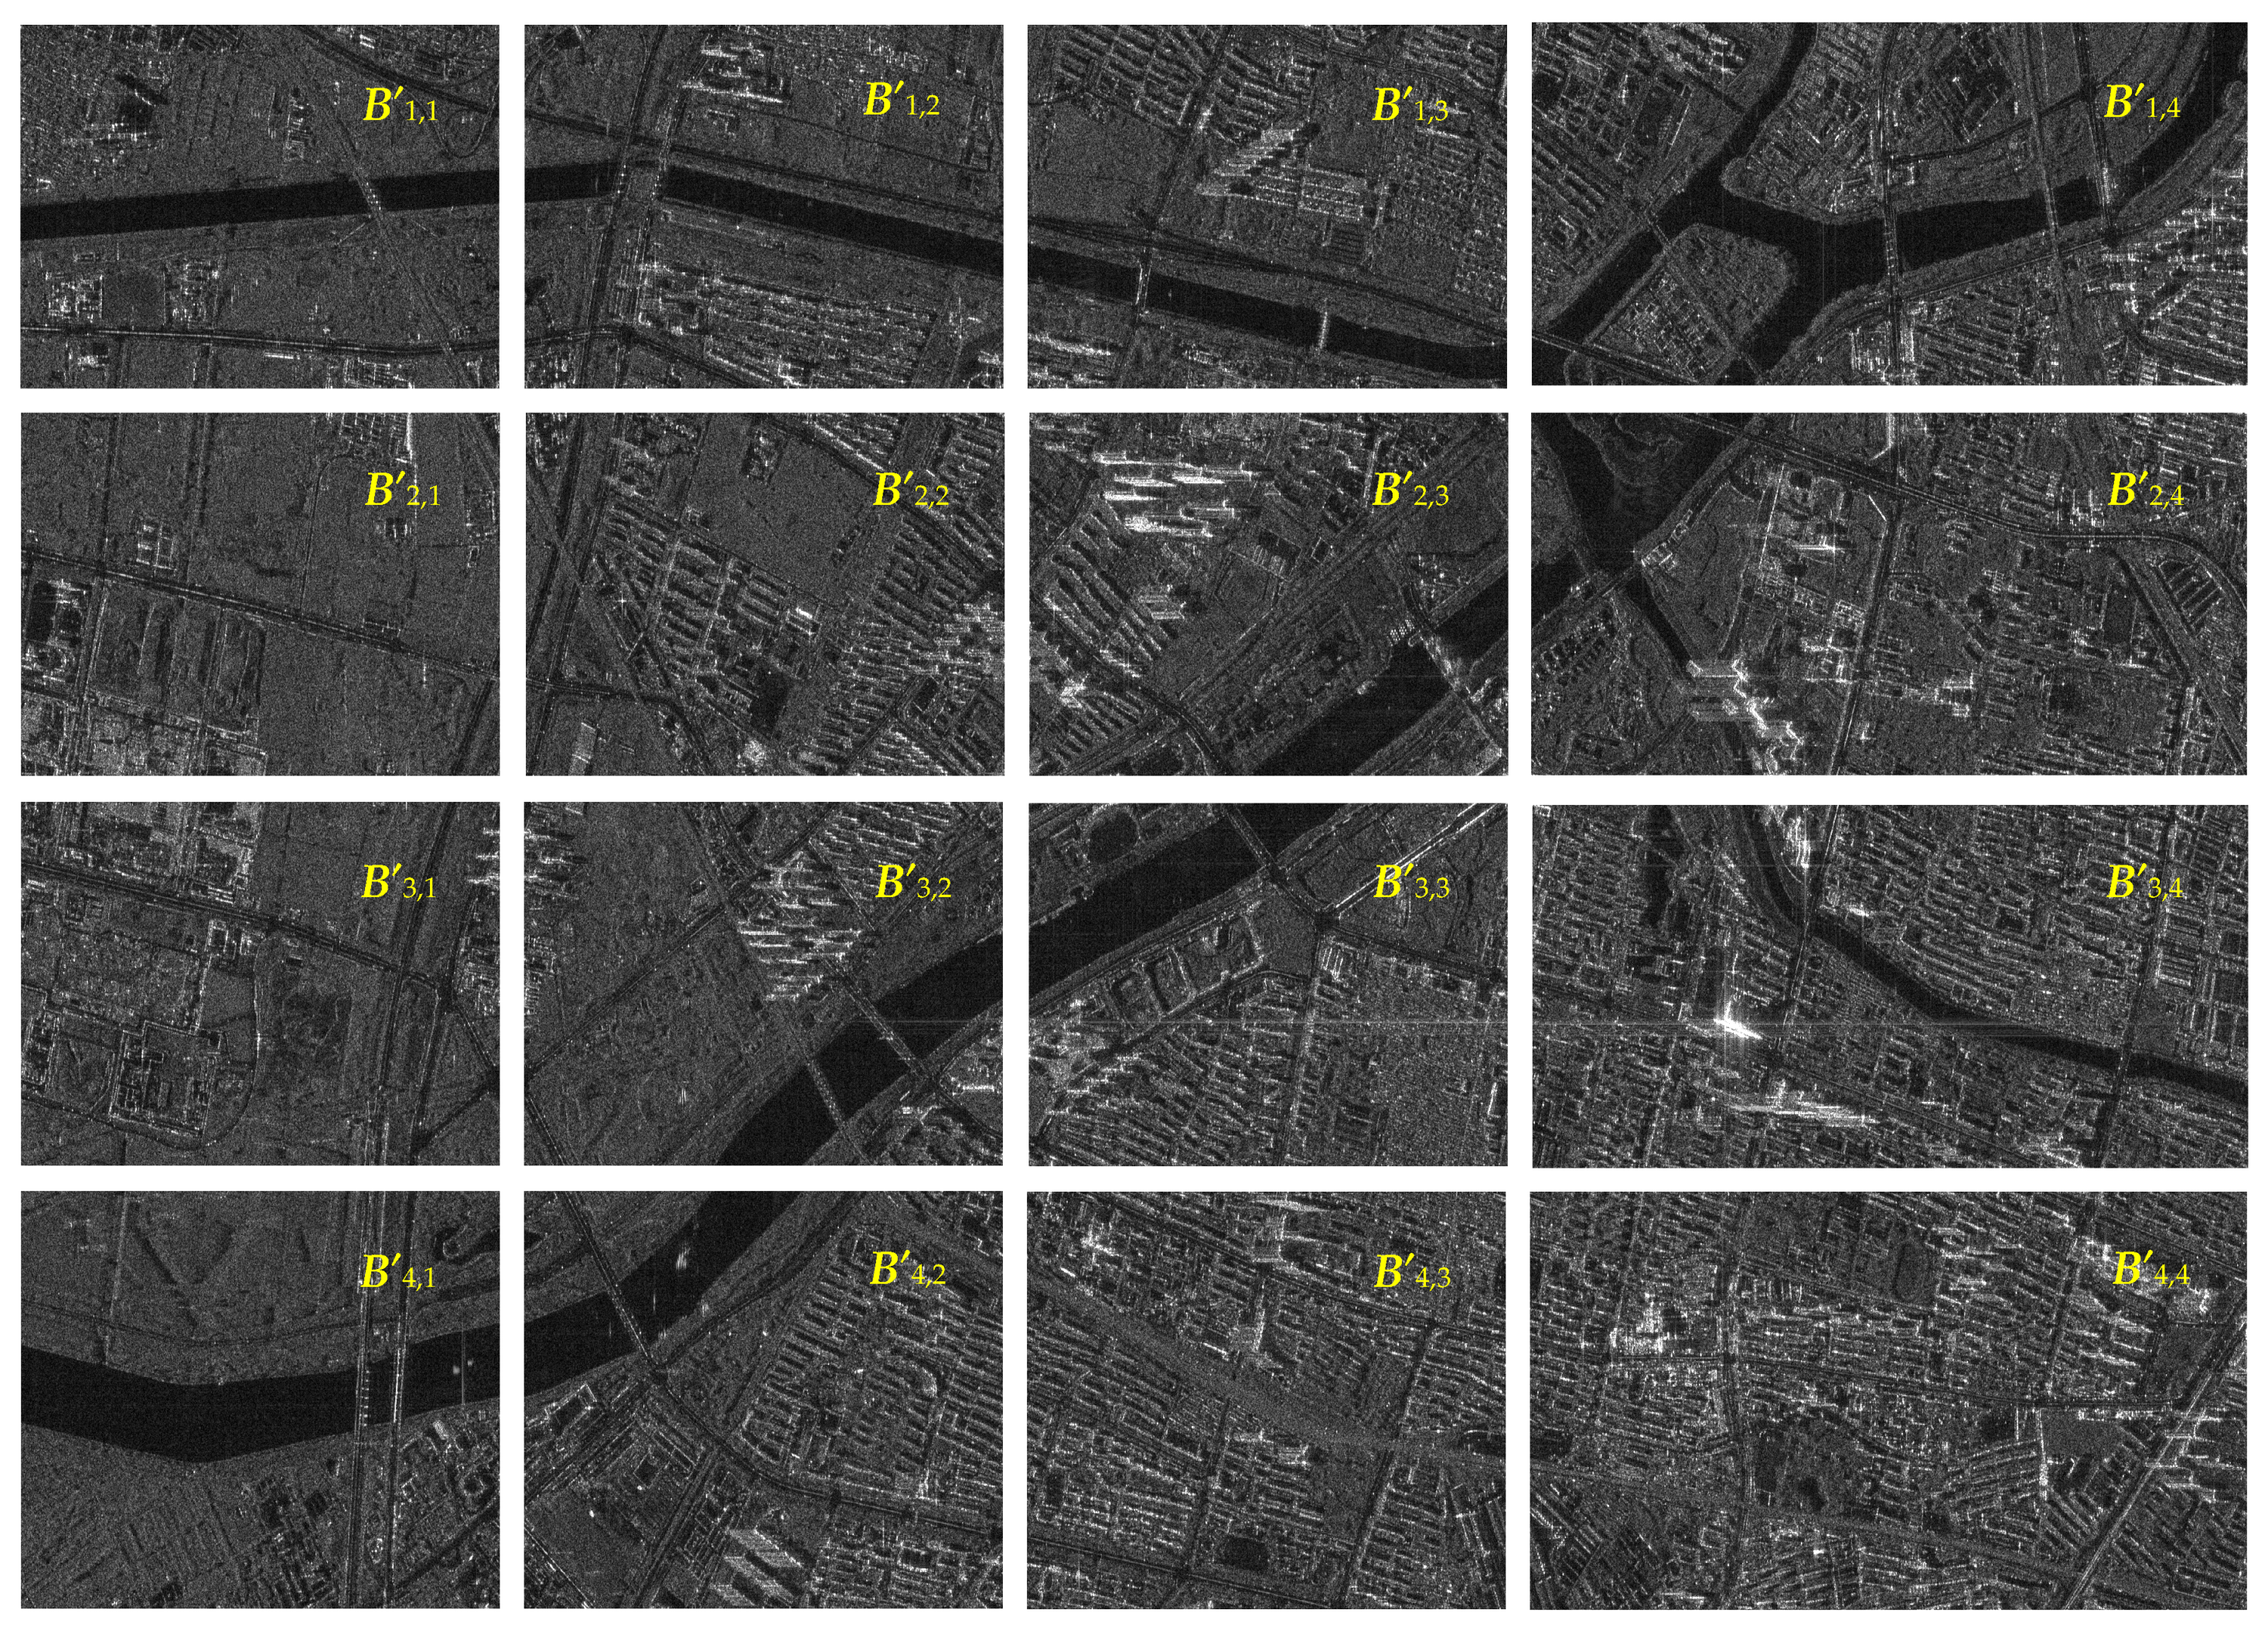
Taking the partition parameters of Figure 4 (i.e., V = 890, H = 675, v0 = h0 = 5), Figure 4 is partitioned into 16 sub-image blocks, denoted as B’1,1–B’4,4, as shown in Figure 5. According to whether there is riverway cover, the partitioned sub-image blocks can be classified as B’ = {B’1,1, B’1,2, B’1,3, B’1,4, B’2,3, B’2,4, B’3,2, B’3,3, B’3,4, B’4,1, B’4,2} and B’ = {B’2,1, B’2,2, B’3,1, B’4,3, B’4,4} by visual interpretation. As the sub-image blocks in B’ were regarded as background (i.e., blocks were converted into binary images with all pixel intensity values of 0), the results are not shown here. Three sub-image blocks—B’1,3, B’1,4, and B’3,4 in B’—with different riverway morphology were selected to display the results of each processing step.
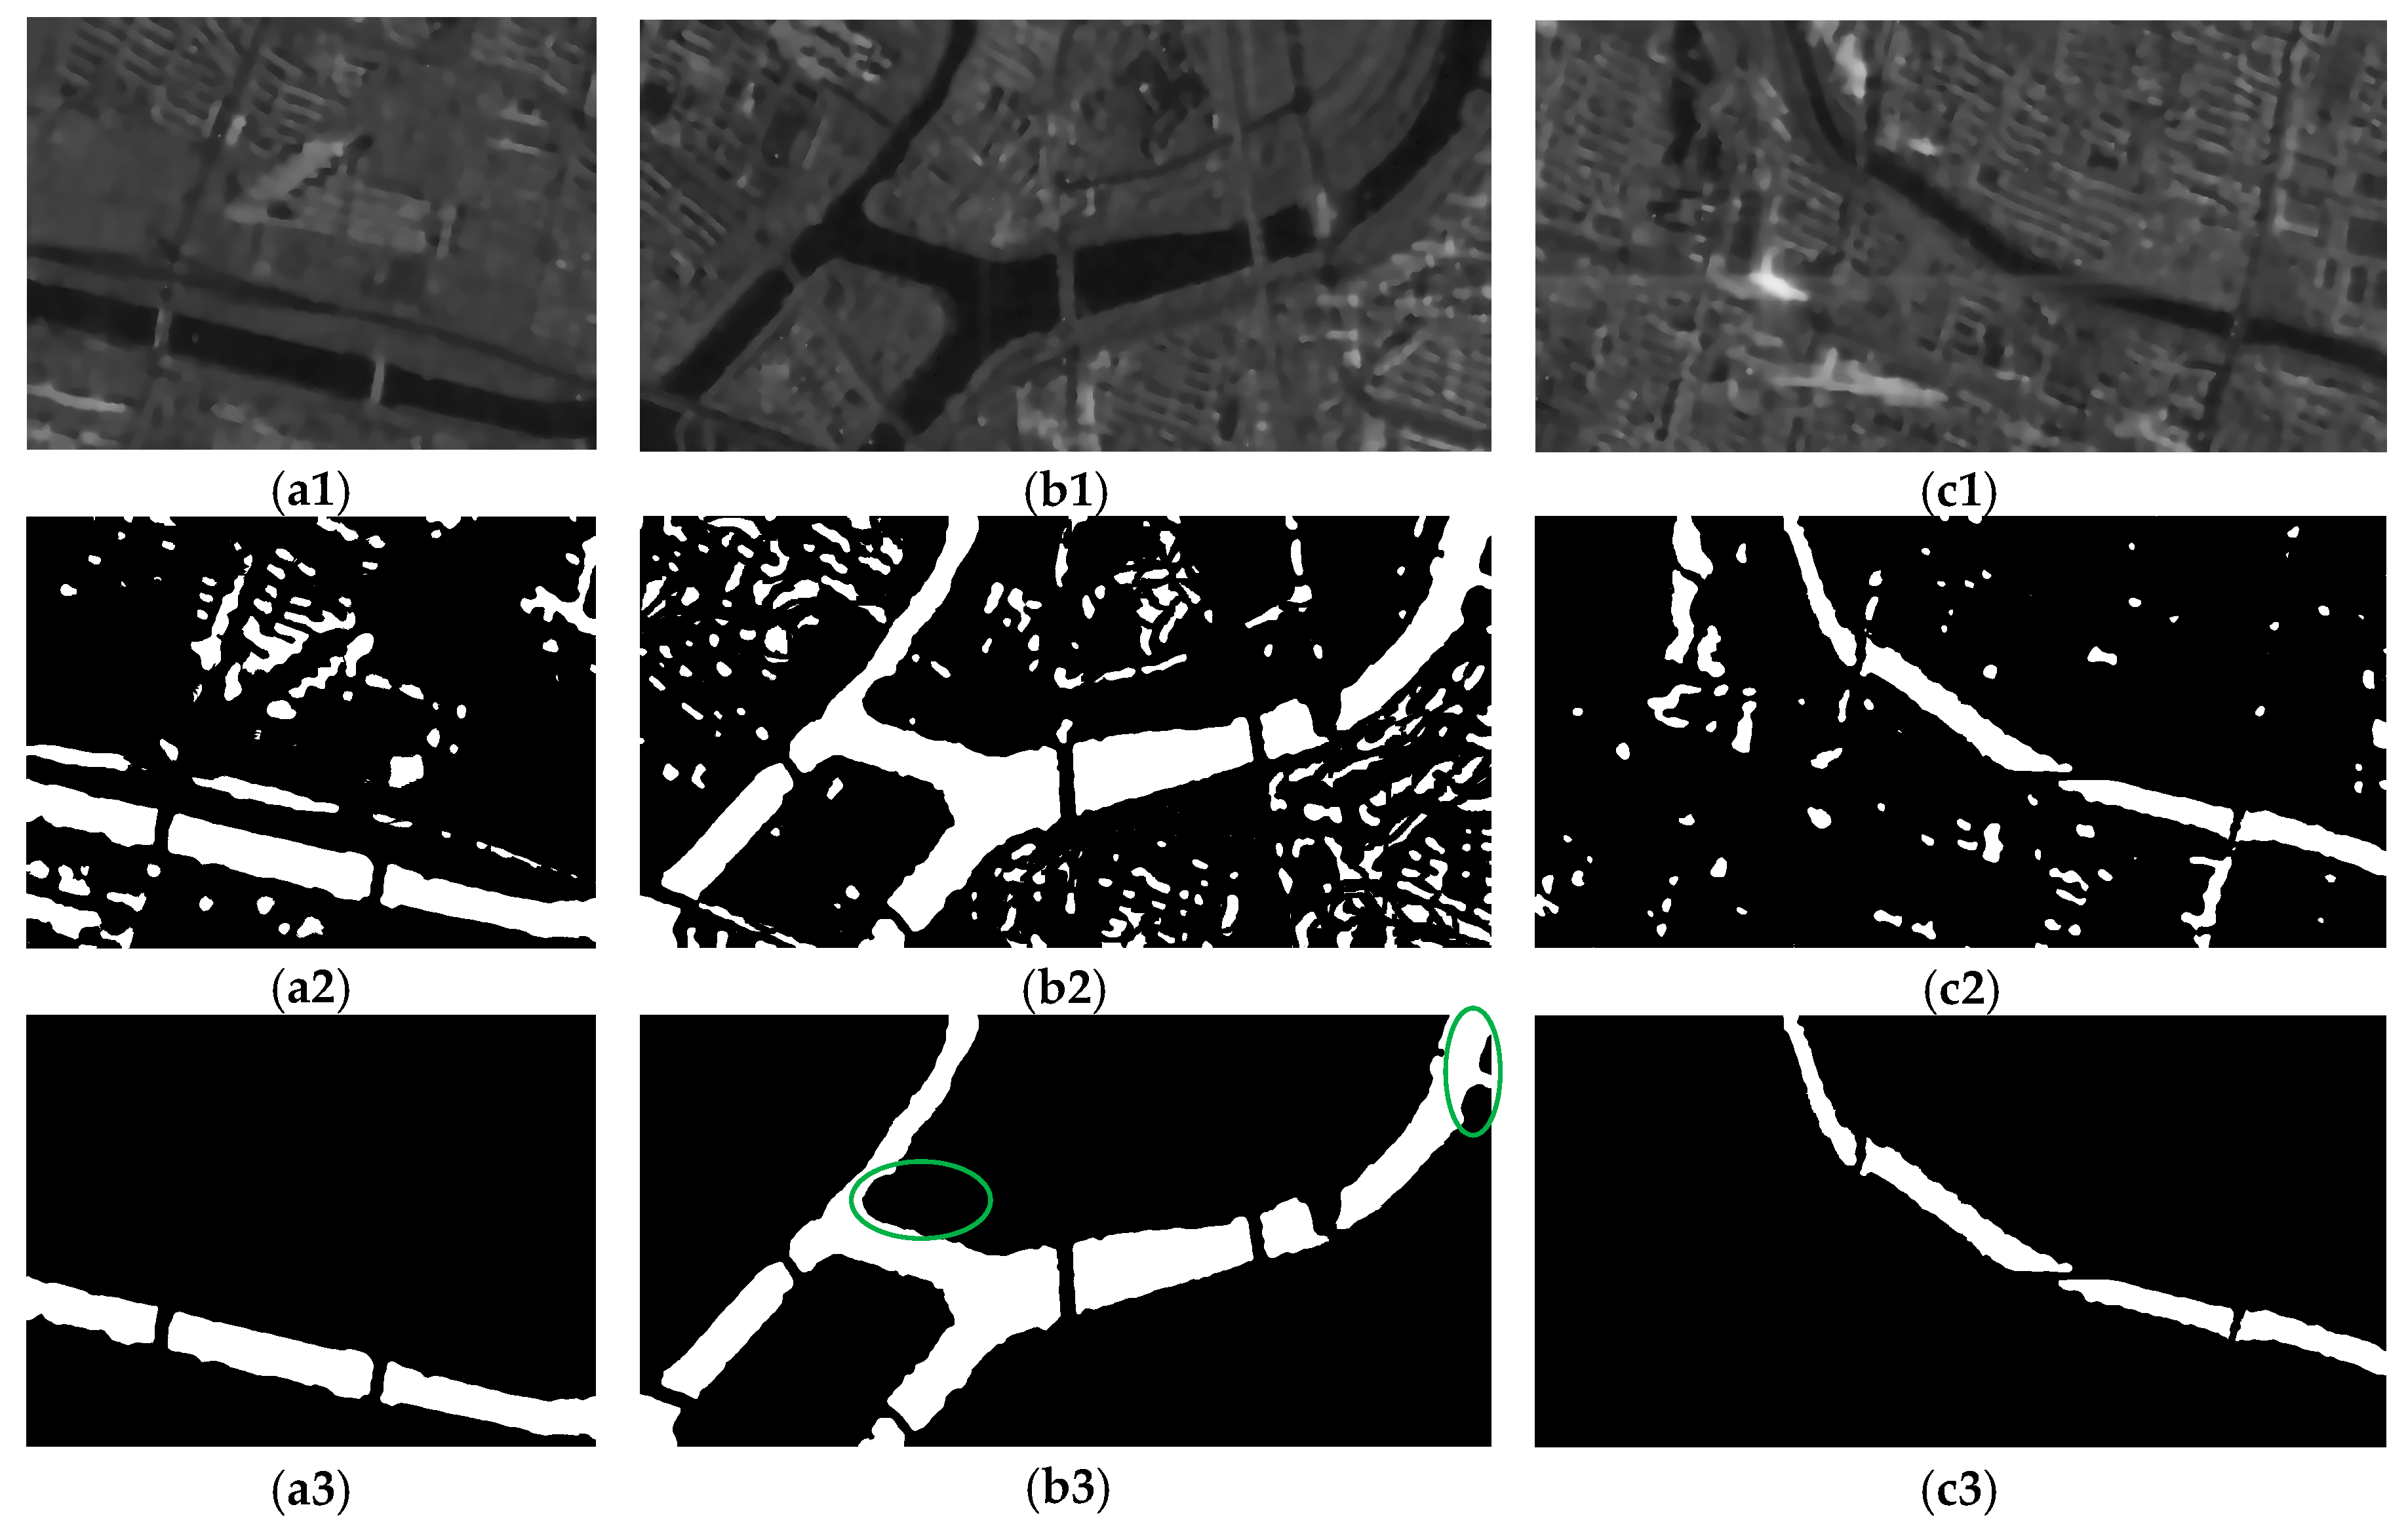
The parameters of SRAD for each sub-image block in B’ were set as ξ = 0.5, ξ = 1, ρ = 0.1, and q0 = 0.5. The filtering results of the selected three sub-image blocks are shown in Figure 6a1–c1. The speckle noise was effectively filtered out, and the water and land boundaries had been well preserved. Figure 6a2–c2 are the results of segmenting the filtered outputs using the Sauvola algorithm, where w = 50 and κ = 0.3. From the segmentation results, there were some false riverway fragments. The false riverway fragments can be removed by taking the thresholds Ta = 400 and Tr = 1.5 of the connected components to obtain the extraction results of the riverway segments, as shown in Figure 6a3–c3.
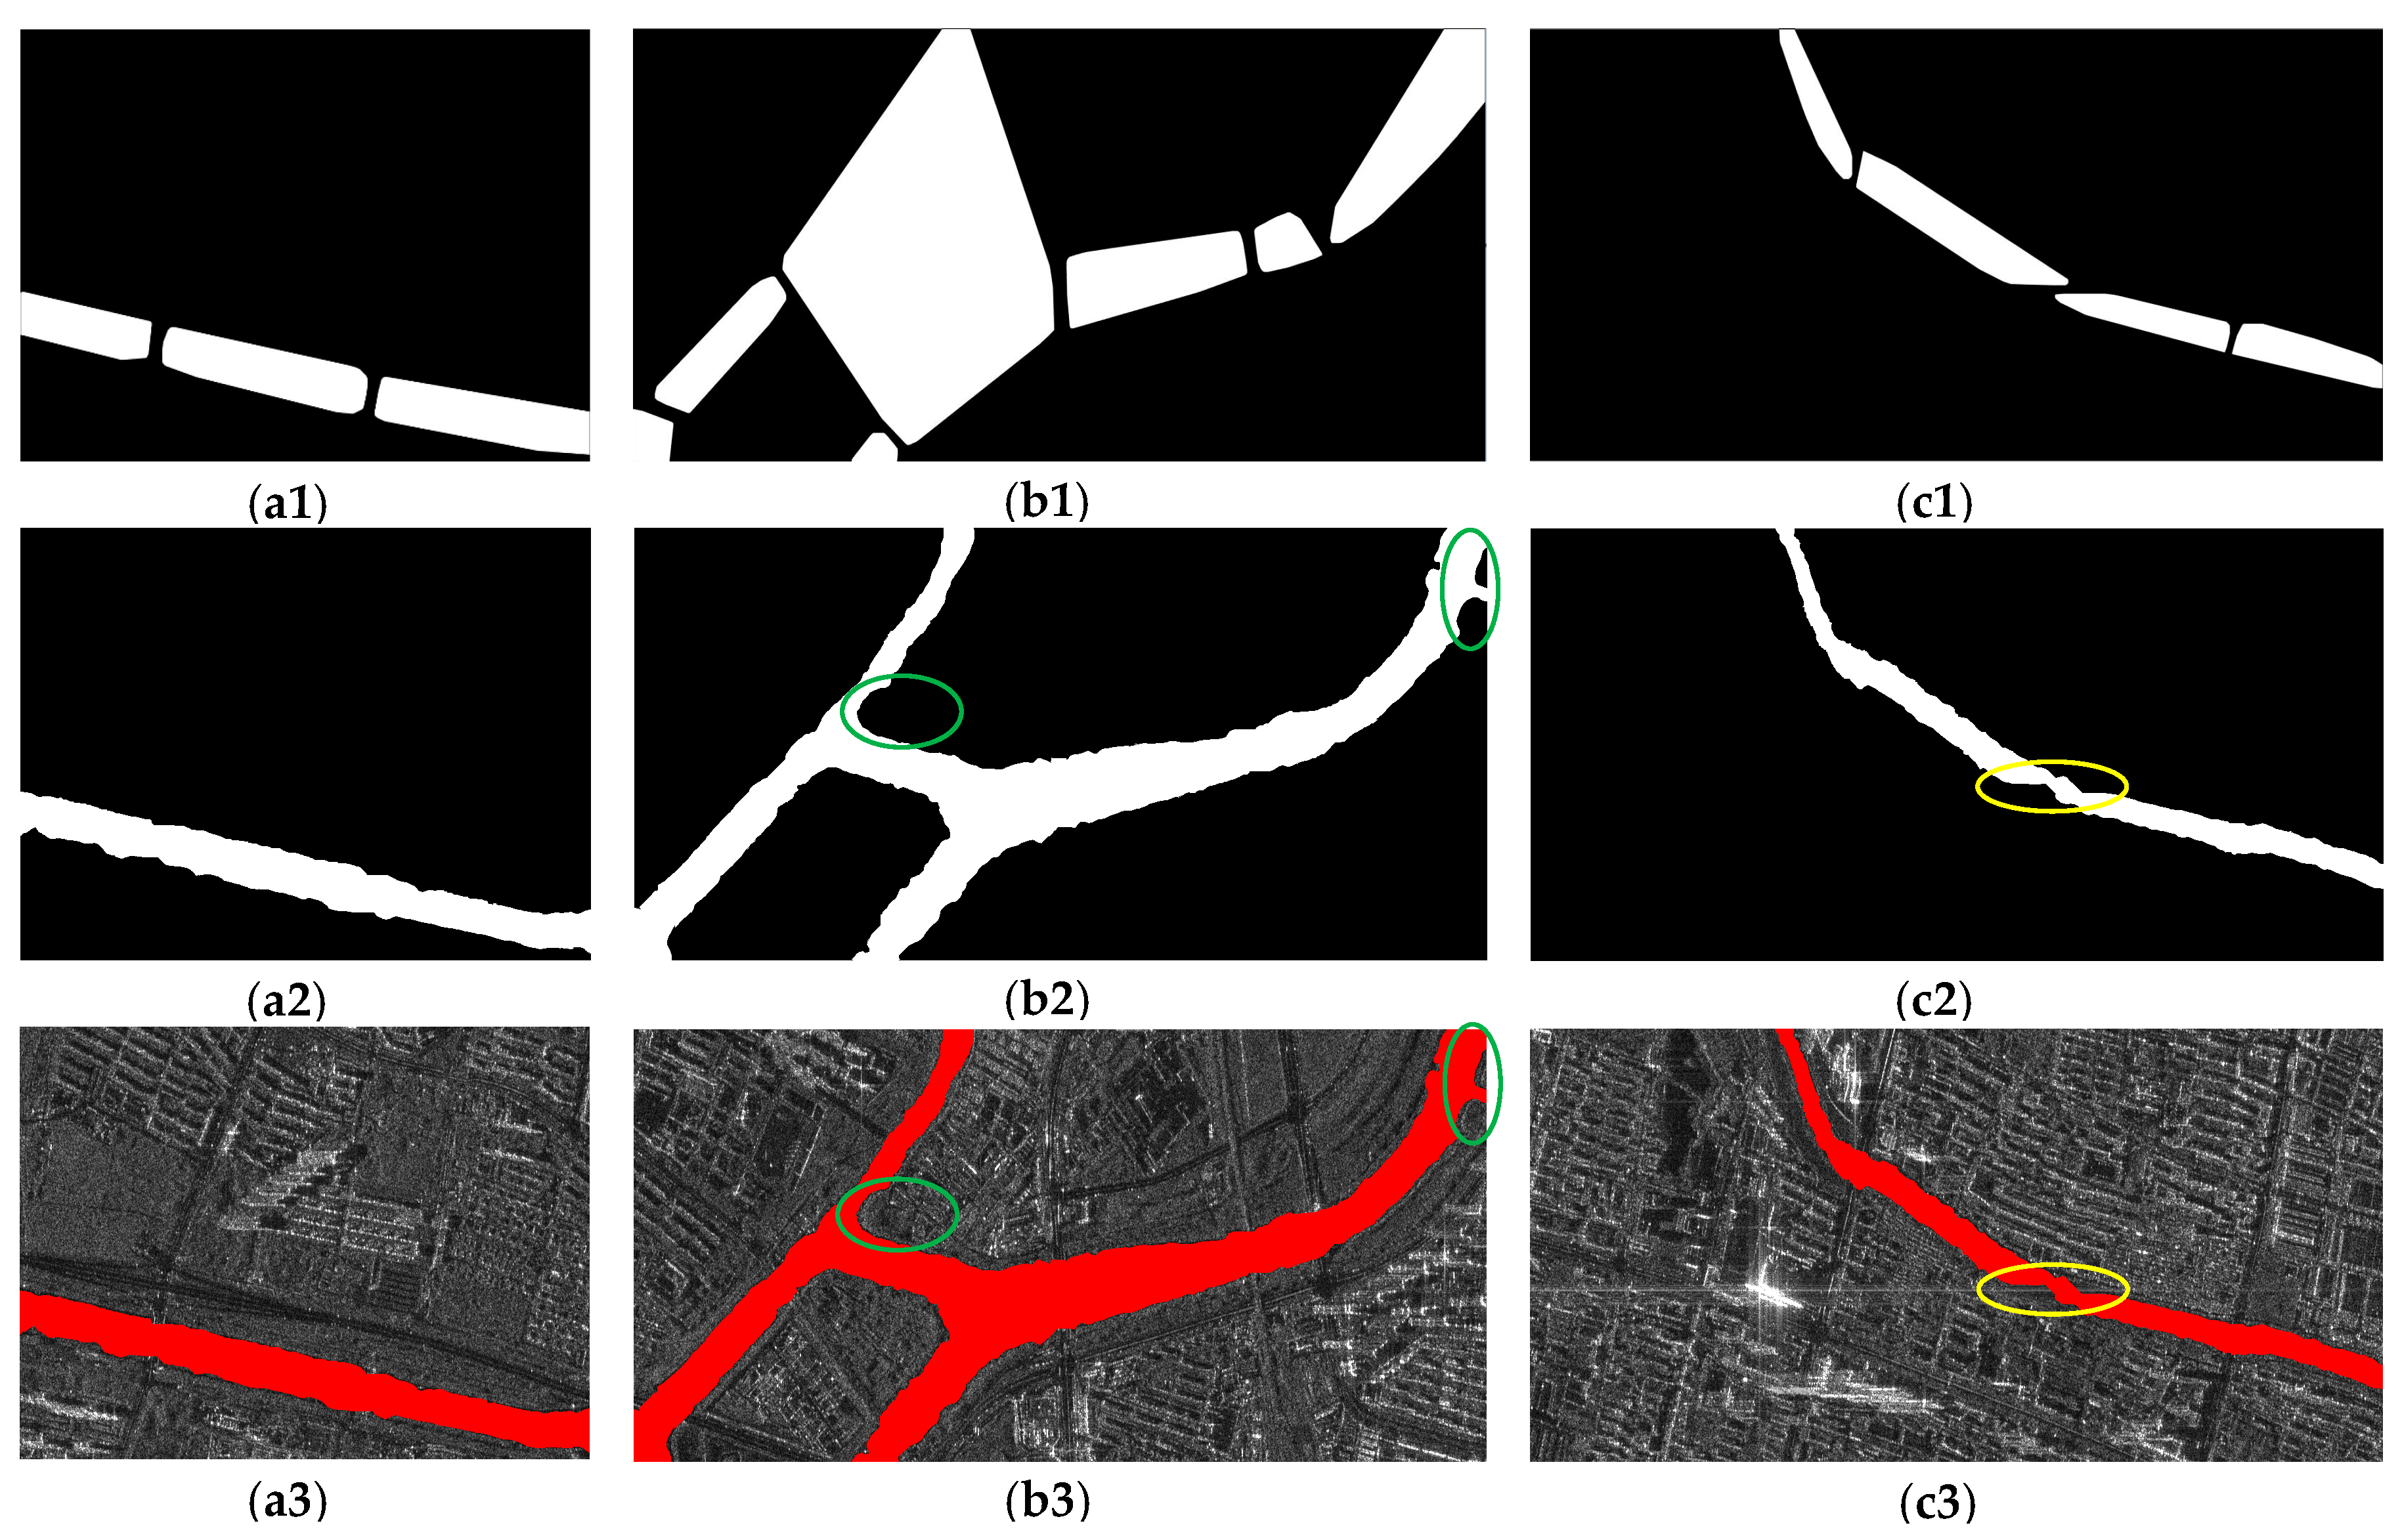
As shown by the extraction results of the riverway segments in Figure 6a3–c3, there were discontinuities between the riverway segments. Some riverway segments showed branching and annular distribution (see green ellipses in Figure 6b3), which can interfere with the connection of discontinuities. To accommodate the complex riverway morphology, each extracted riverway segment is tightly enveloped with a minimum convex hull, as shown in Figure 7a1–c1. As shown in the figures, the convex hull can effectively take the annular riverway segments as a whole.
The connection for each riverway segment was achieved by combining each layer of the growth results (S = 3, K = 5), as shown in Figure 7a2–c2.
As shown in Figure 7b2, the construction of a convex hull can avoid the internal connection of annular regions (see green ellipses). For discontinuities caused by dense scattering points near the riverway (see yellow ellipse in Figure 7c2), the number of seeds located was limited due to the linearity of the convex hull border, resulting in insufficient connection.
For the qualitative evaluation of the extraction results, the extracted riverway was represented as red and superimposed on the original image, as shown in Figure 7a3–c3. The superposition results show that the riverway was completely extracted, and the boundary of the extraction result agrees well with real riverway boundaries.
For the quantitative evaluation of the object regions, the Sorensen–Dice and Jaccard similarity metrics are used [24,25]. The Sorensen–Dice similarity evaluates the extraction quality based on all pixels inside the riverway regions, which is computed as
where Jg is the corresponding ground truth of J, | ∙ | denotes the number of elements in the set, dice(J, Jg) ∈ [0, 1], the higher the value, the better the extraction result. The Jaccard similarity has a relation with the Sorensen–Dice similarity as follows,
where jaccard(J, Jg) ∈ [0, 1]; the higher the value, the better the extraction result.
For the quantitative evaluation of the object boundaries, the assessment criteria proposed by Modava et al. [26] was used. Hand-drawn riverway boundary lines were used as standard data, and the evaluation region with a 4-pixel radius was established as the center. The cumulative percentage of the extracted riverway boundary falling into the evaluation region with different radius was calculated using the formula
where λ is the index of the evaluation region radius, bufλ is the evaluation region with radius λ, bor is the riverway boundary obtained from the experiment when λ = 0, buf is the standard riverway boundary line, and Aλ is the cumulative percentage of overlap within λ. The accuracy evaluation results are presented in Table 1.
As shown in the table, the evaluation values of each sub-image block for Sorensen–Dice and Jaccard similarity metrics are more than 90%, indicating that the proposed method has good regional accuracy. For the boundary accuracy, about 43% of the boundary lines extracted by each sub-image block are accurately located on the manually drawn boundary lines. When the radius of the evaluation region reached 2 pixels, the locational accuracy of the riverway boundaries increased to more than 90%, indicating high boundary accuracy achieved by the proposed method.
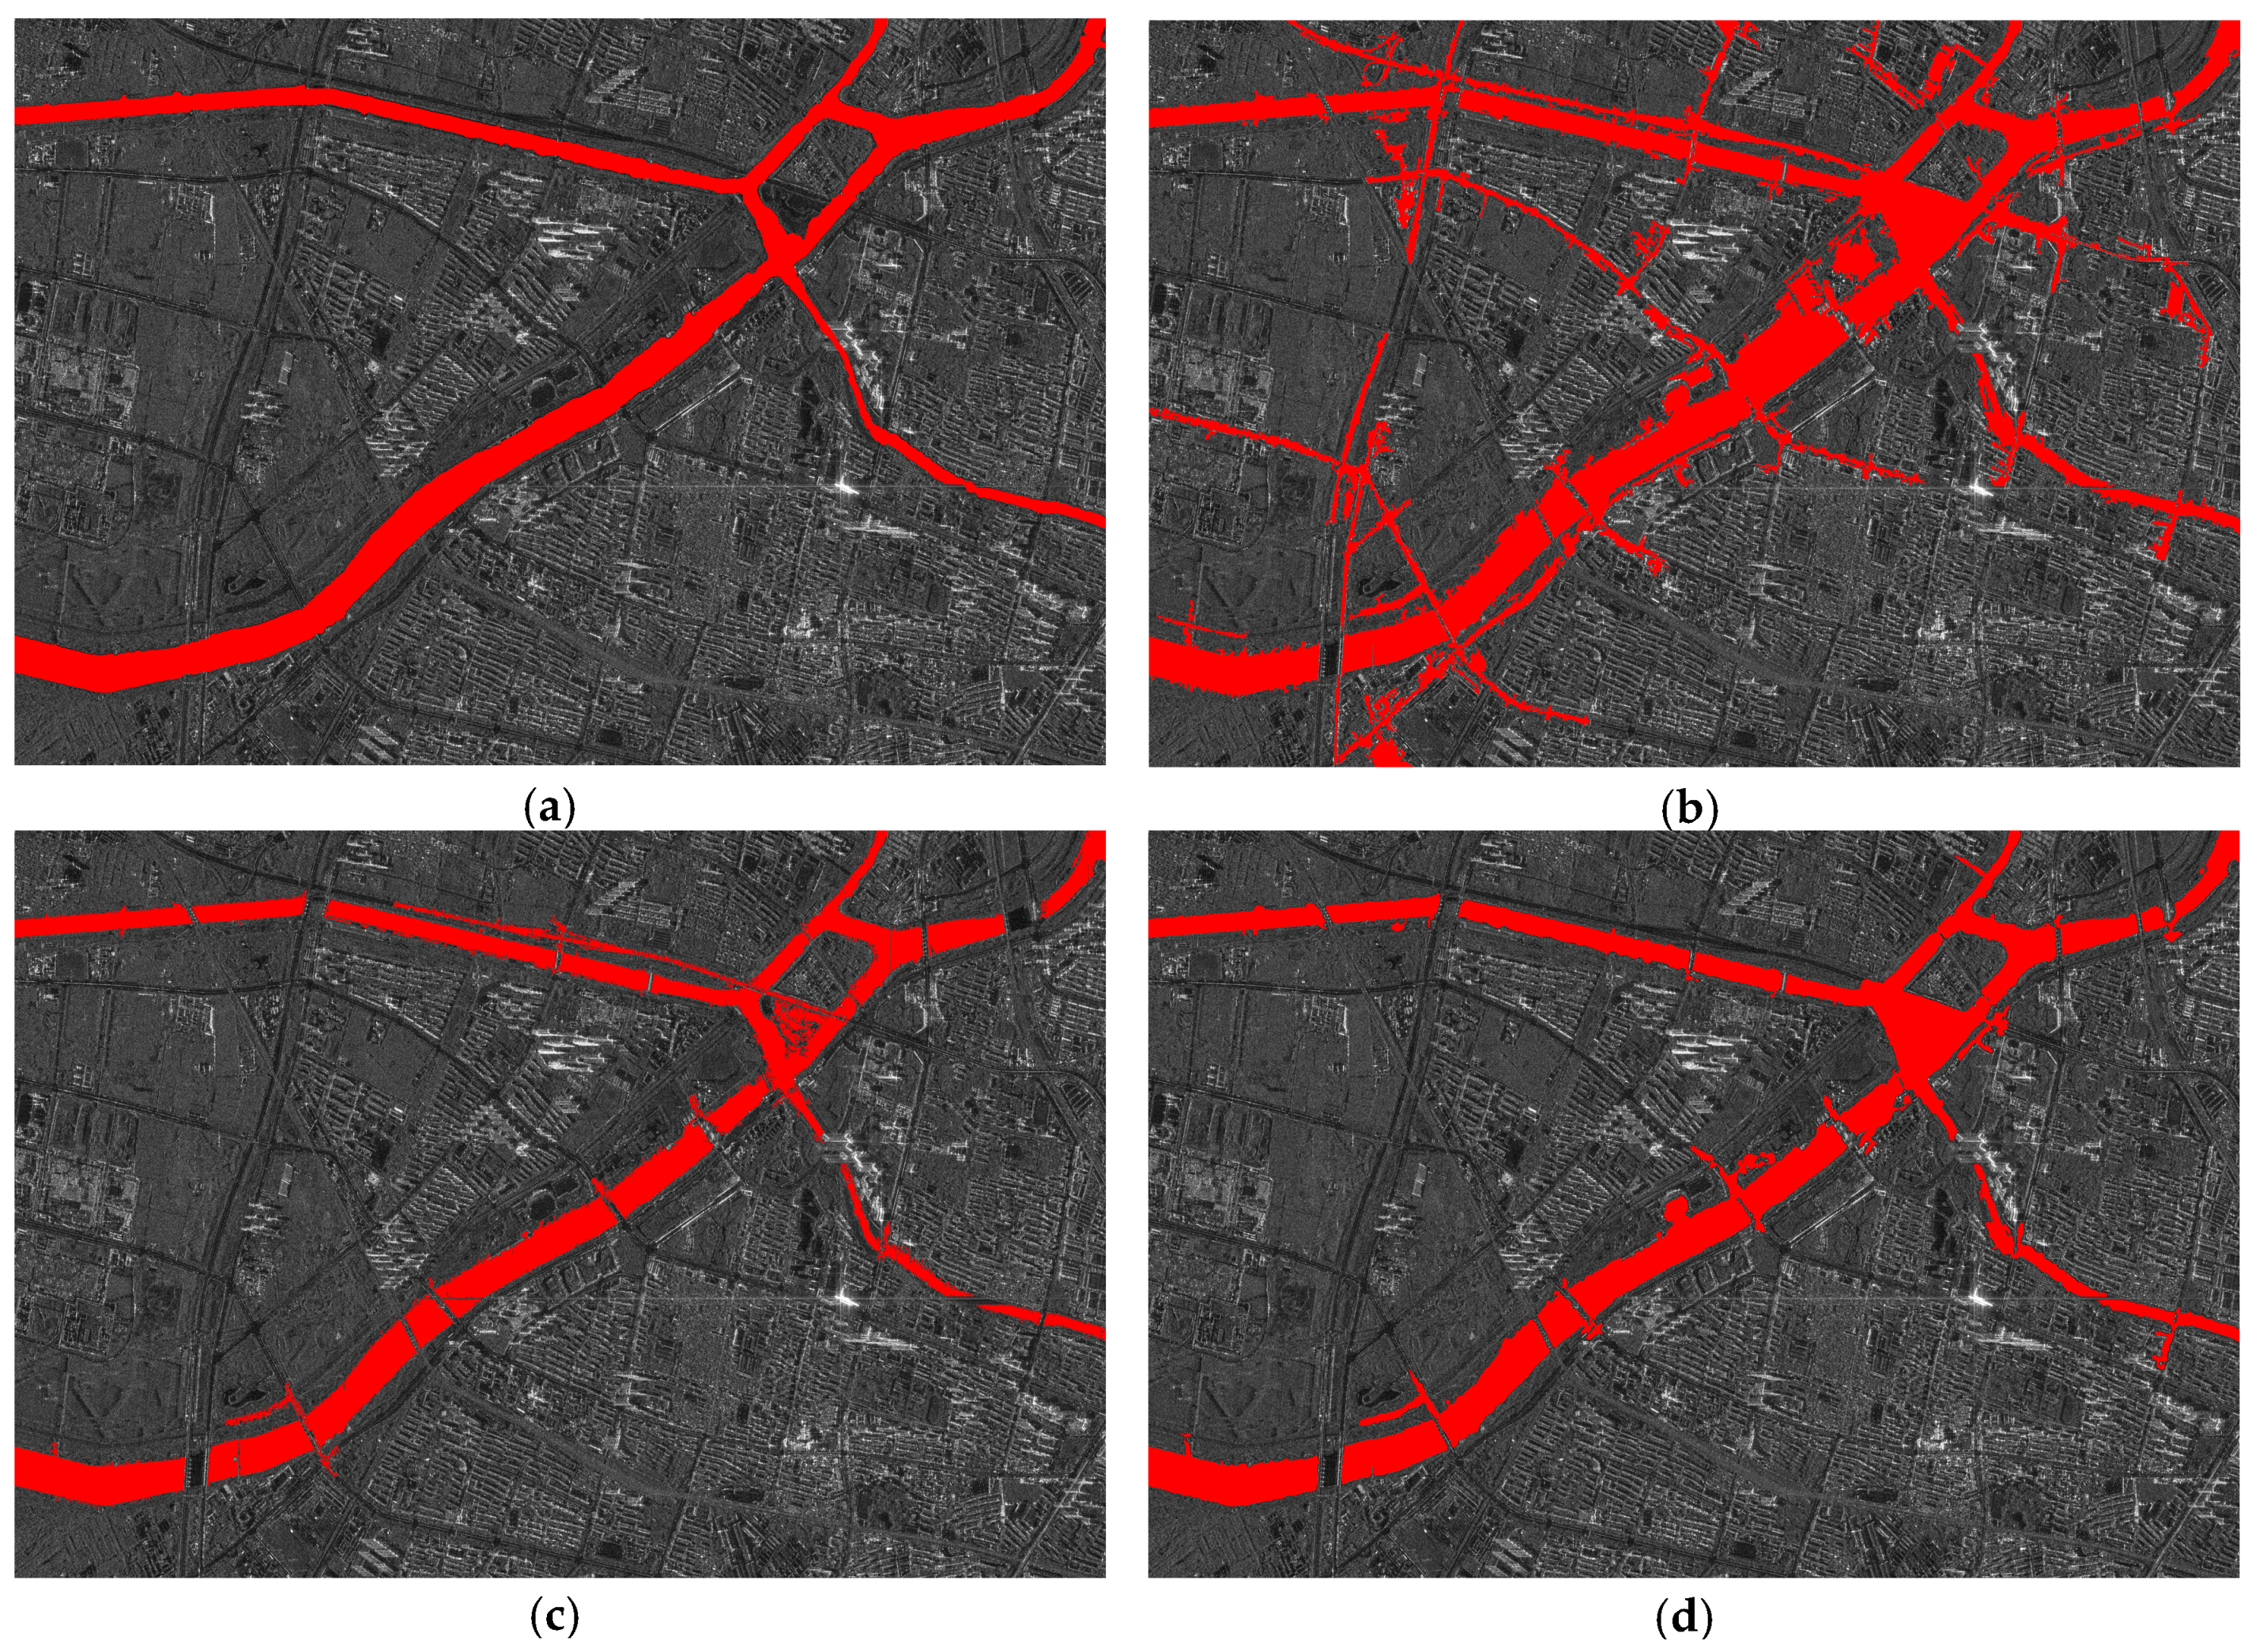
The processing results of each sub-image block are stitched according to the defined stitching line to obtain the riverway extraction result for the entire image, which is represented as red and superimposed on the original image, as shown in Figure 8a. In addition, compared with the 1-D Otsu method of the work in [12], the 2-D Otsu method of the work in [13], and the FCM method of the work in [16], the results are shown in Figure 8c–d. For objective comparison, each method uses the filtering preprocessing and connected component postprocessing measures of the proposed method.
From the superimposed images of the extraction results of each method, it can be seen that in the 1-D Otsu method of the work in [12], there are many mis-extractions connected to the real riverway. This is because Otsu is a global threshold method, and the optimal threshold determined by Otsu in large-scale images with complex background is not suitable for some local regions. The 2-D Otsu method in [13] considers the texture information of the pixel neighborhood, which improves the extraction accuracy. The FCM method in [16] considers the neighborhood information of pixels and the class fuzziness of pixels, and its extraction is better than 1-D and 2-D Otsu methods. The proposed method can make full use of the local information of the image because of the sub-image blocks processing strategy, so that there is almost no mis-extraction in the result, and because of the discontinuity connection measures, the riverway segments are connected together. This is of great significance for subsequent processing such as hydrological analysis and riverway planning.
The quantitative evaluation of each method is shown in Table 2. It can be seen from the table that the proposed method gives the highest Sorensen dice and Jaccard scores, reaching 93.97% and 88.63%, respectively, indicating that it has good regional extraction accuracy. With the increase of the evaluation radius, the boundary accuracy advantage of the proposed method is more obvious.
4. Discussion
In order to verify the feasibility and efficiency of the proposed method, the performance of image block processing strategy and sub-image block filtering was analyzed and evaluated.
4.1. Block Processing Strategy
The SRAD filter preprocessing was used as an example to determine the usefulness of the image blocking processing strategy proposed in this paper. The necessity and advantage of boundary overlap are illustrated by the stitching results of adjacent sub-image blocks. The extraction processing of all sub-image blocks is used to observe the impact of the operation of classifying sub-image blocks as covered or uncovered riverways through visual interpretation on the final river channel extraction results.
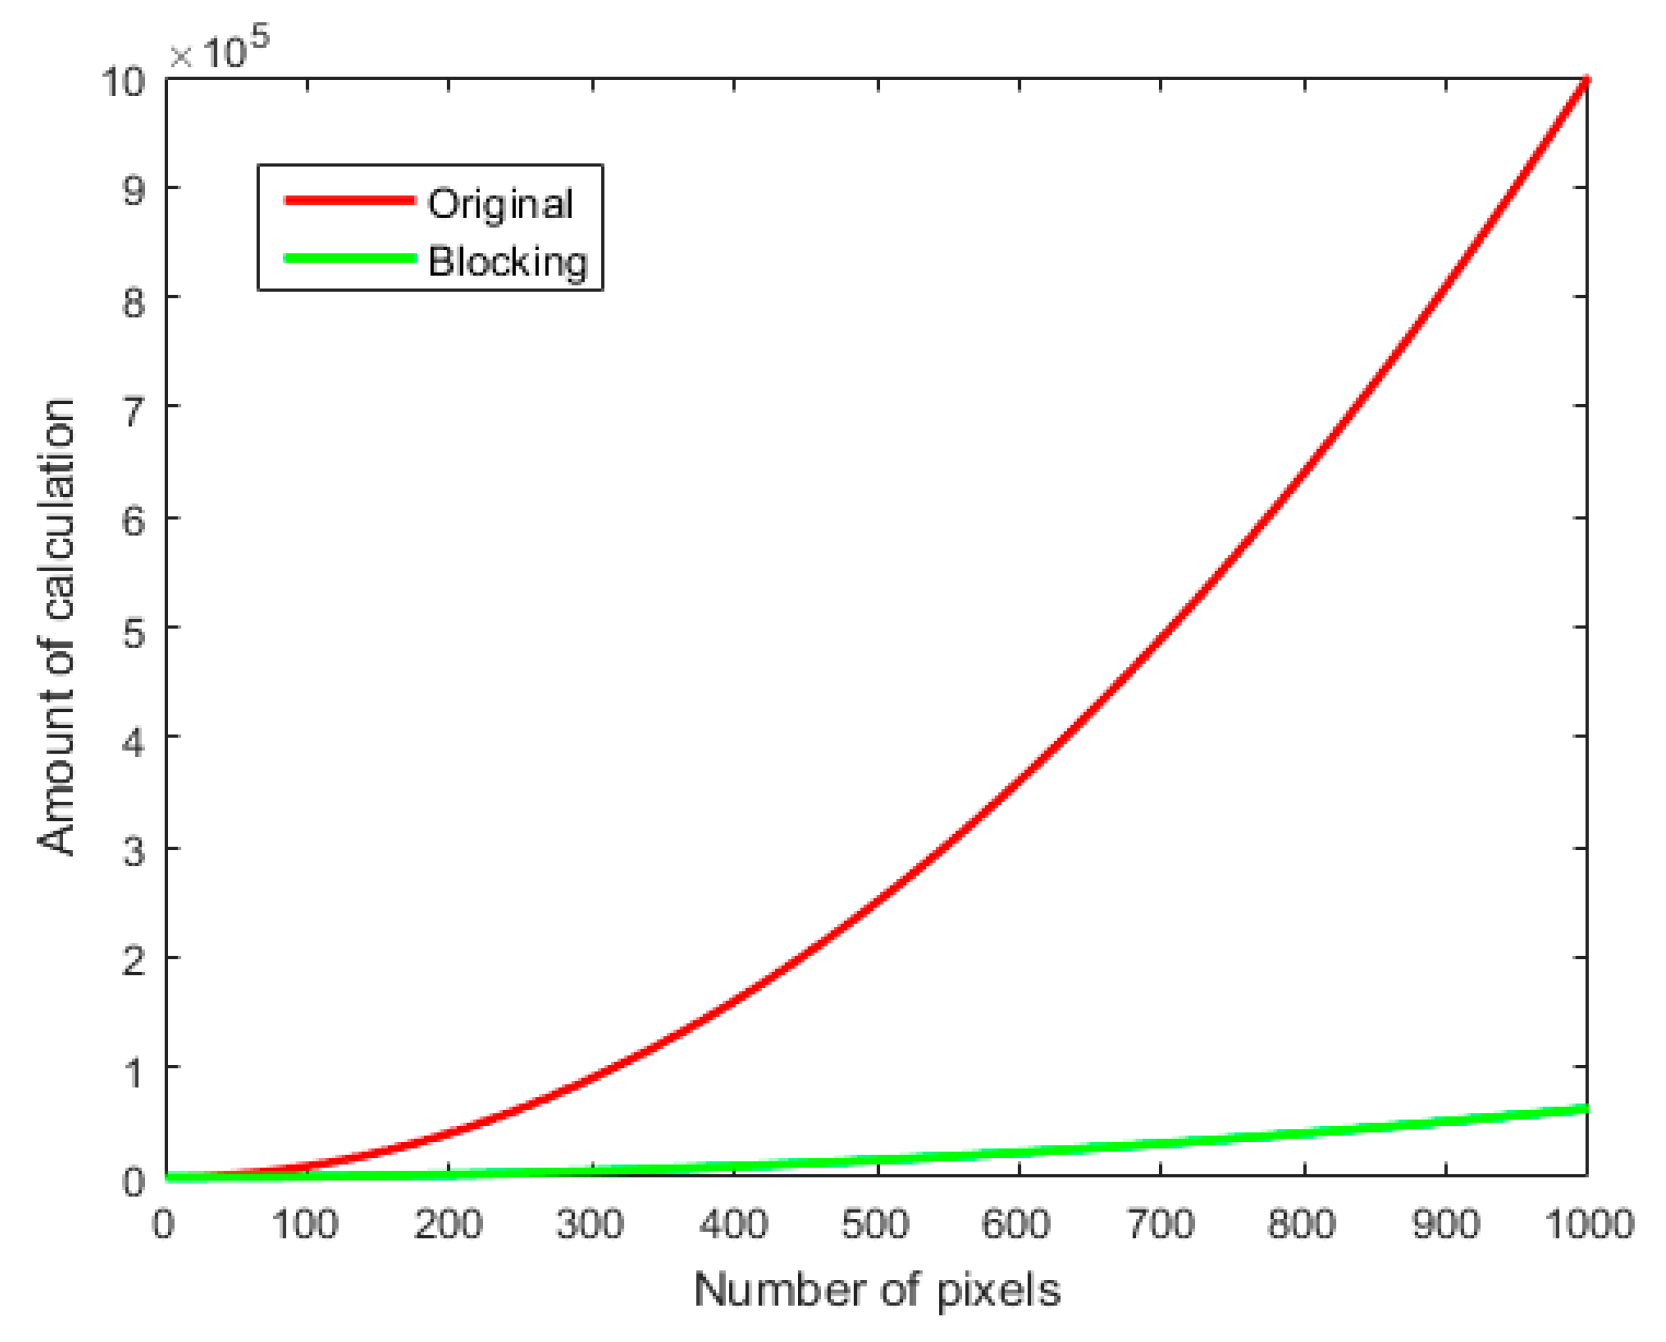
The goal of SRAD is to adjust the intensity value of any pixel using Equation (3) in order to minimize image noise. For the computational complexity of SRAD, the c(q) at (i ± 1, j ± 1) needs to be calculated when smoothing points (i, j). From Equation (4), the process involves square operation, which means that the computational complexity of SRAD filtering (Figure 4) in each iteration would not be less than (2 × M × N)2. The image was processed using the proposed blocking strategy, and the study area was partitioned into 16 sub-image blocks (see Figure 5). The computational complexity of the SRAD filter was less than 16(2 × M/4 × N/4)2, as the sub-image blocks that do not cover riverways are only used as background and not for filtering. The results were then graphed and compared using the number of pixels as abscissa and the computational complexity as ordinate. As shown in Figure 9, the number of calculations can be significantly reduced using the proposed blocking procedure.
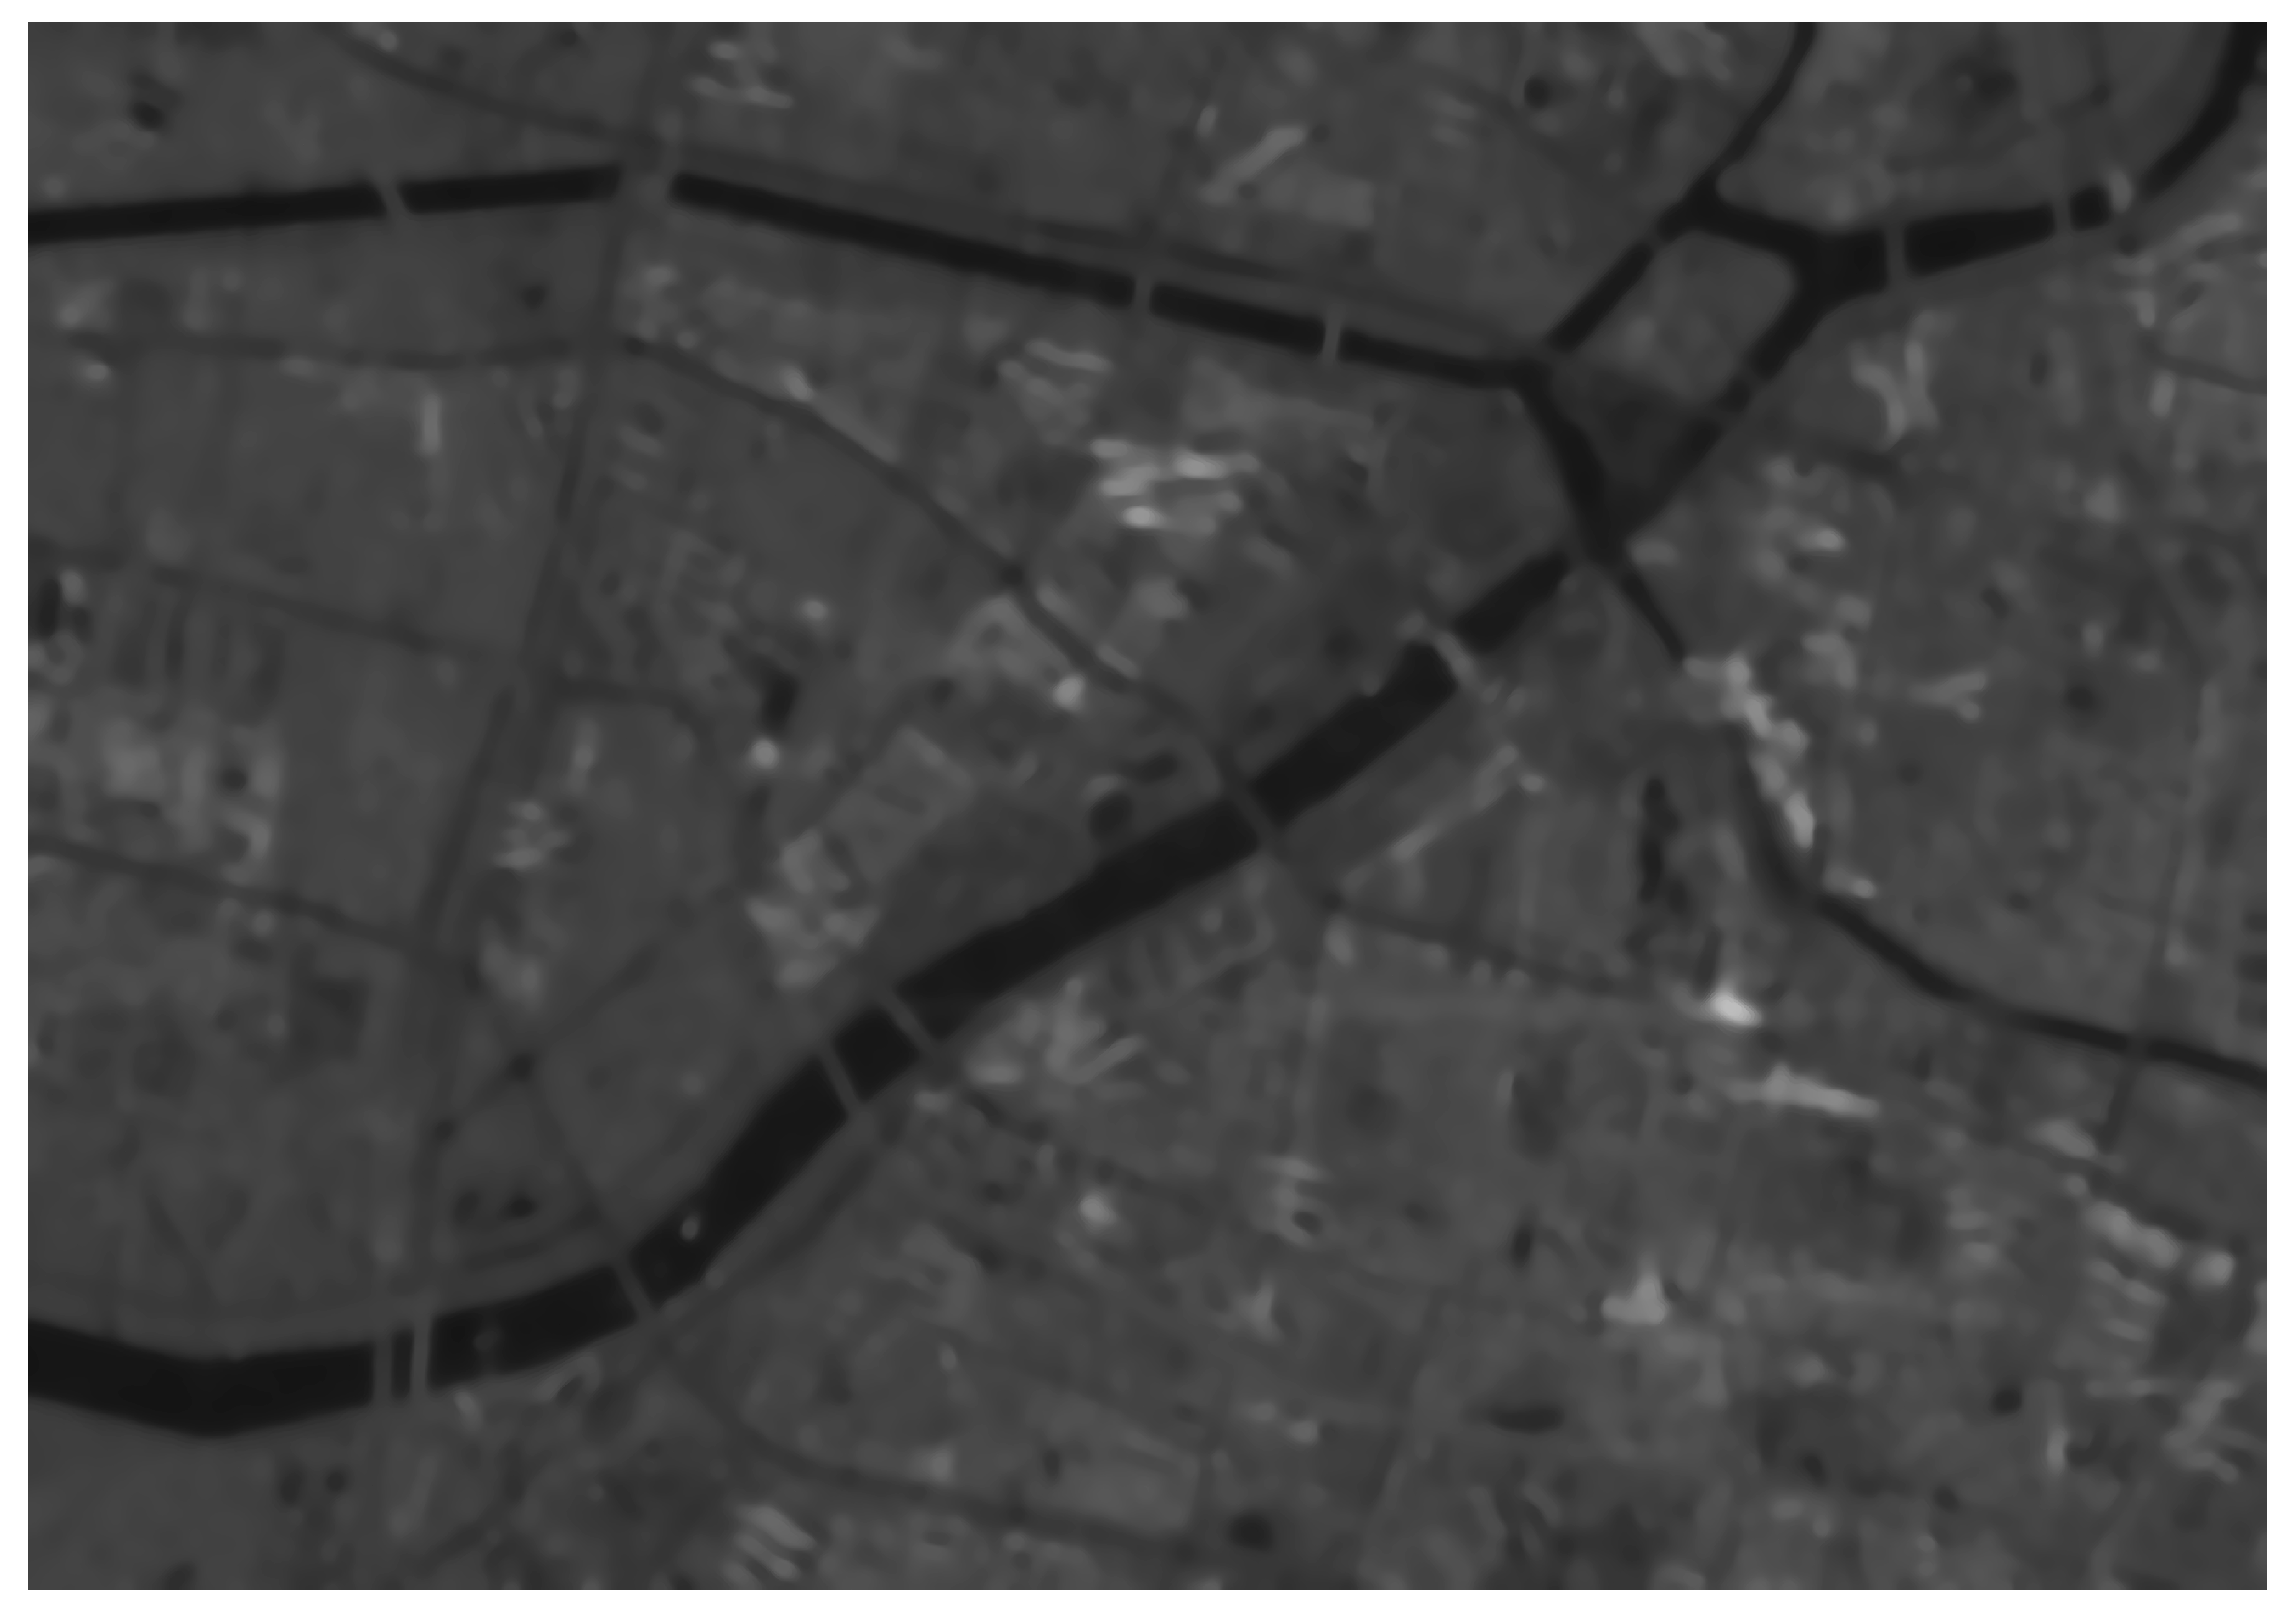
For the filtering effect, the whole image was taken as the input, and the same parameters were adopted. As shown in the filtering result in Figure 10, the speckle noise in the homogeneous region of the filtered image has been smoothed, while some riverway boundaries became blurred due to some strong speckle noises in the image. If these strong noises are filtered out during global processing, the weak noise region must be oversmoothed. When the image is partitioned, the background in each sub-image block becomes relatively simple, and the noise intensity is relatively consistent, effectively alleviating the problem.
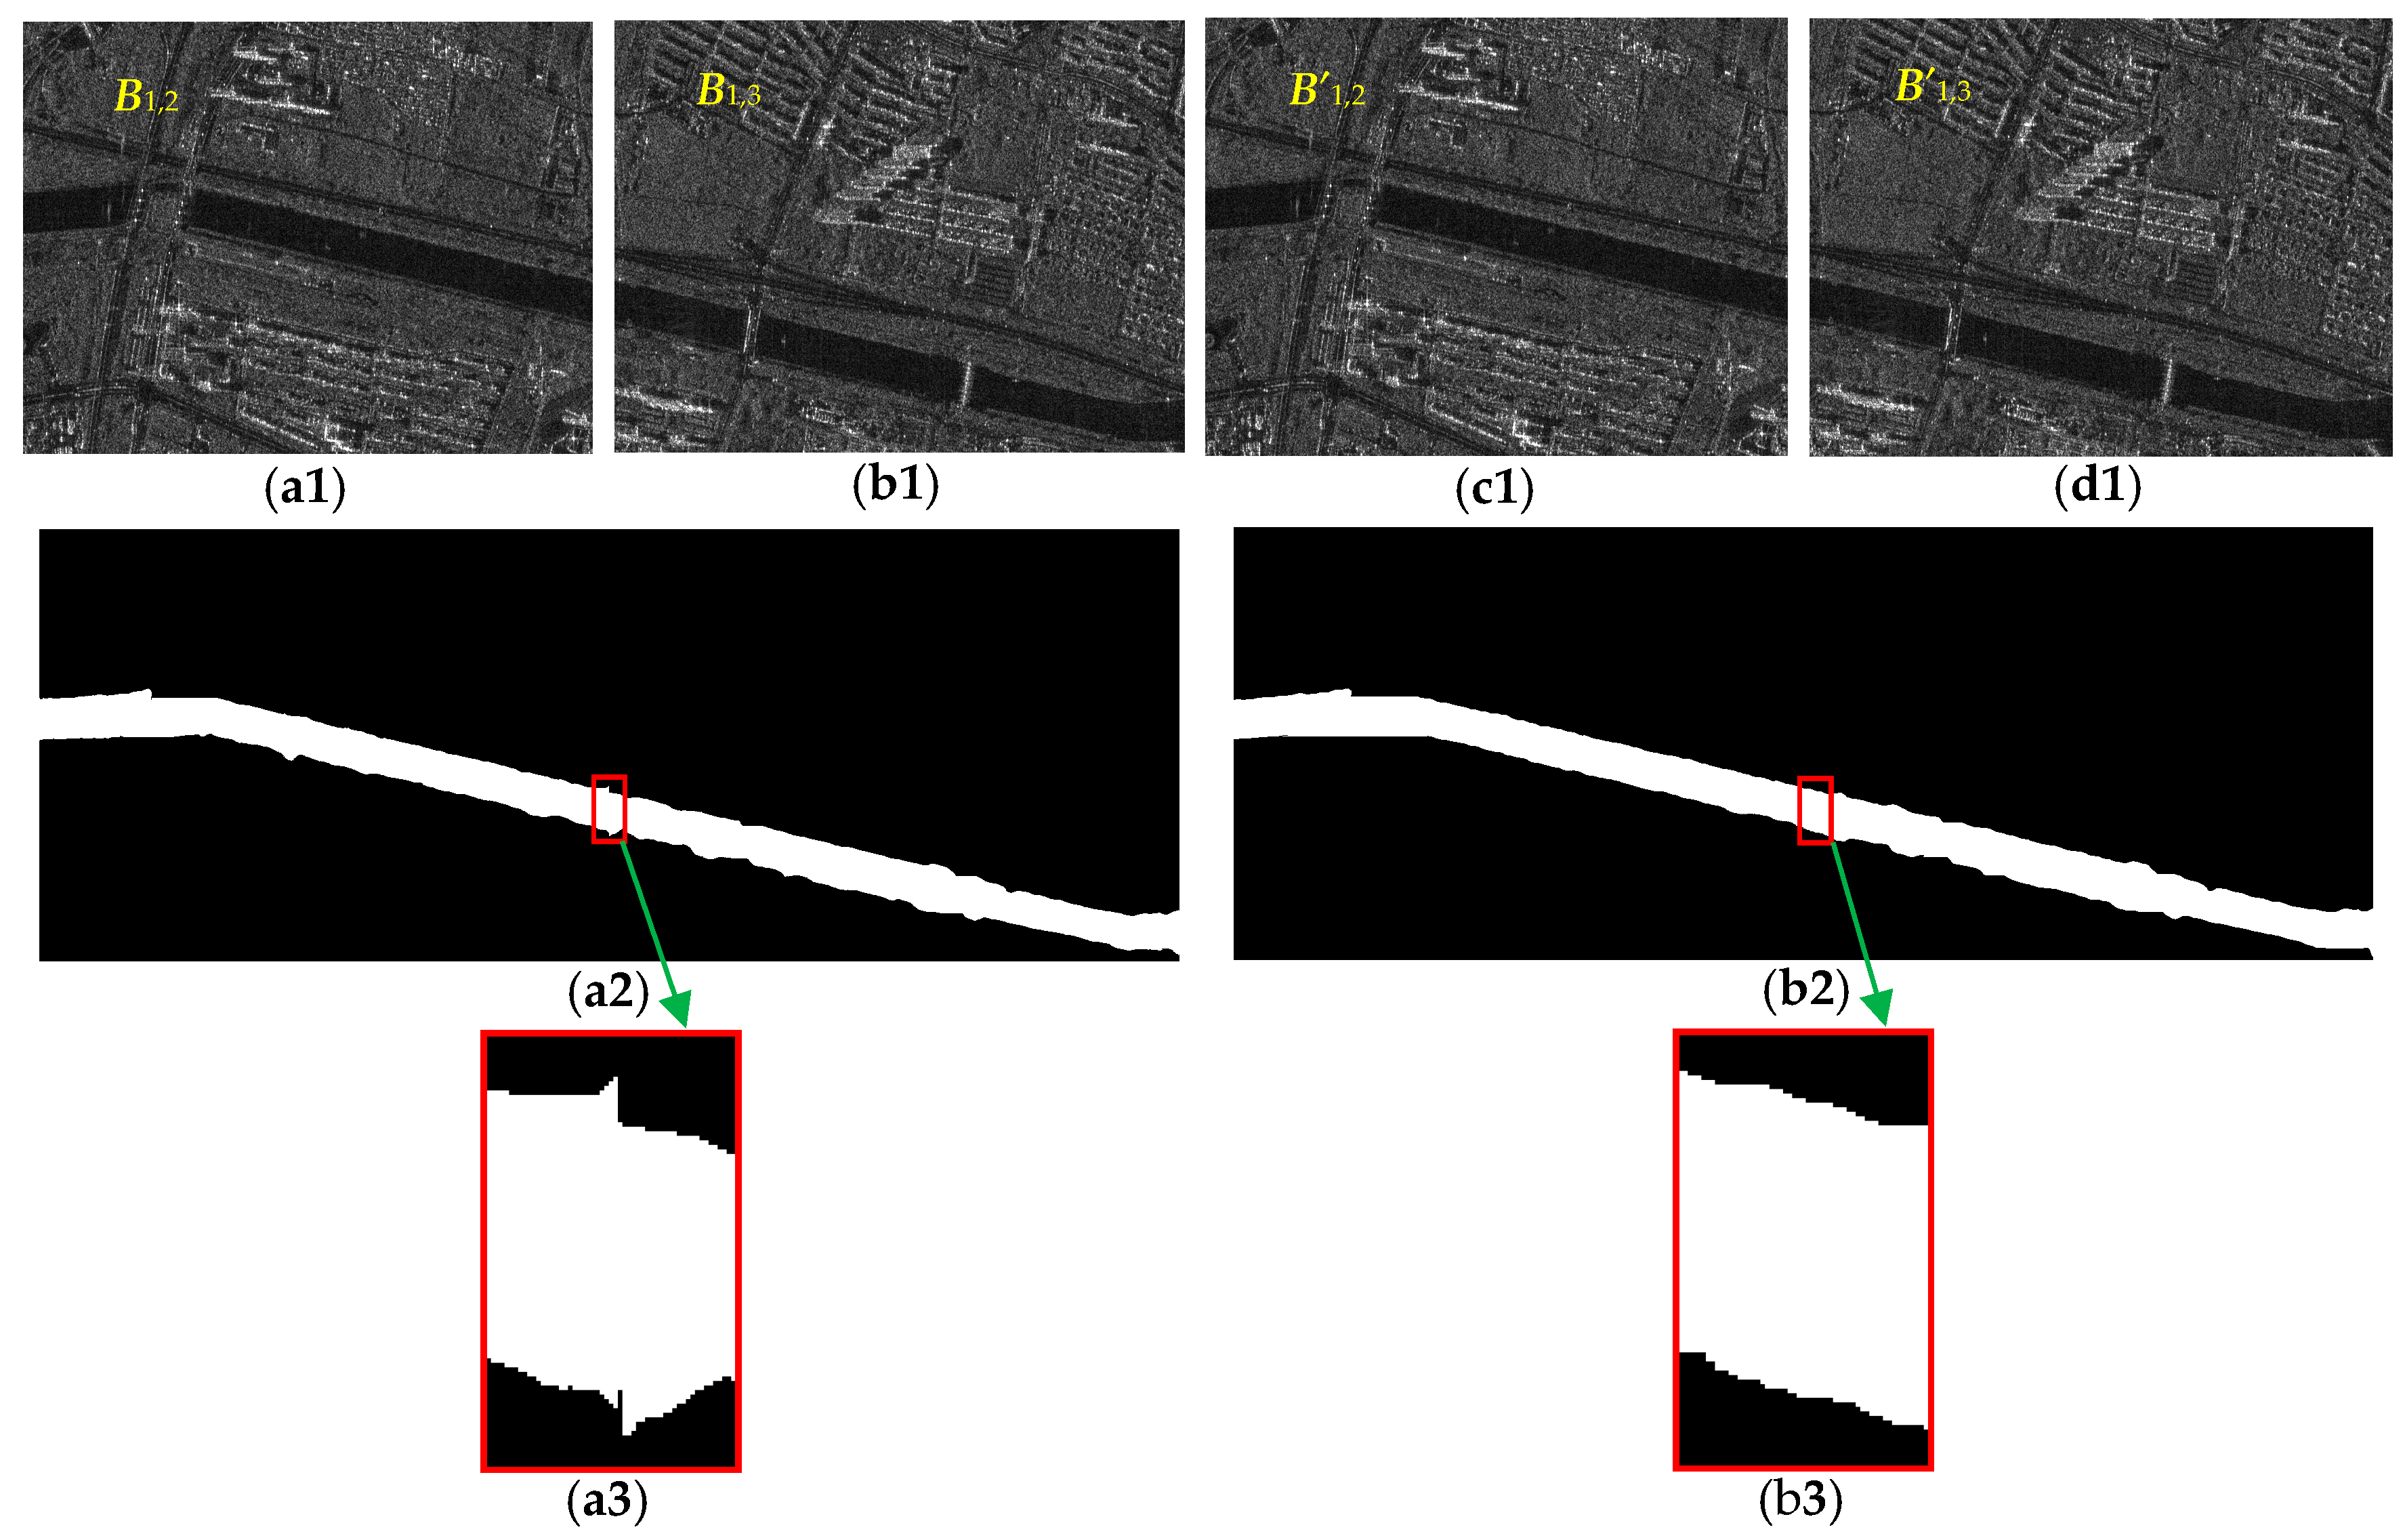
For the boundary effect of block partition, it is due to image degradation that occurs at the boundary of the block when the sub-image blocks are processed, which makes the objects occupying adjacent sub-image blocks appear dislocation or even discontinuous in the stitching result. Therefore, this paper adopts the sub-image block overlap partition strategy. The adjacent sub-image blocks (B1,2 and B1,3) in the non-overlapping partition and the adjacent sub-image blocks (B’1,2 and B’1,3) in the corresponding overlapping partition are selected as an example, as shown in Figure 11a1–d1, where B’1,2 and B’1,3 share a region of 10 pixels wide at the adjacent boundary relative to B1,2 and B1,3. After SRAD filtering, riverway segments extraction and discontinuity connection, the extraction results are stitched, as shown in Figure 11a2,b2, and the stitched boundary parts are marked by a red rectangle box. To make it clearer, enlarge the red rectangle as shown in Figure 11a3,b3.
It can be seen from the comparison that Figure 11a3 has dislocation at the stitching line and the connection is not smooth. Figure 11b3 can discard the boundary degradation part through the shared region between B’1,2 and B’1,3 during stitching, so that the object can naturally transition at the stitching line.
For the overlap degree v0 and h0, selecting a larger value can ensure smooth connection, but it will increase the amount of calculation. As the sub-image block extraction result is a binary image, it will not involve the color difference of different categories, so we select an overlap of 5 to 10 pixels that can meet the stitching requirements. The overlap degree can also be adjusted adaptively according to the size of the block, such as setting it to 5% of the block size.
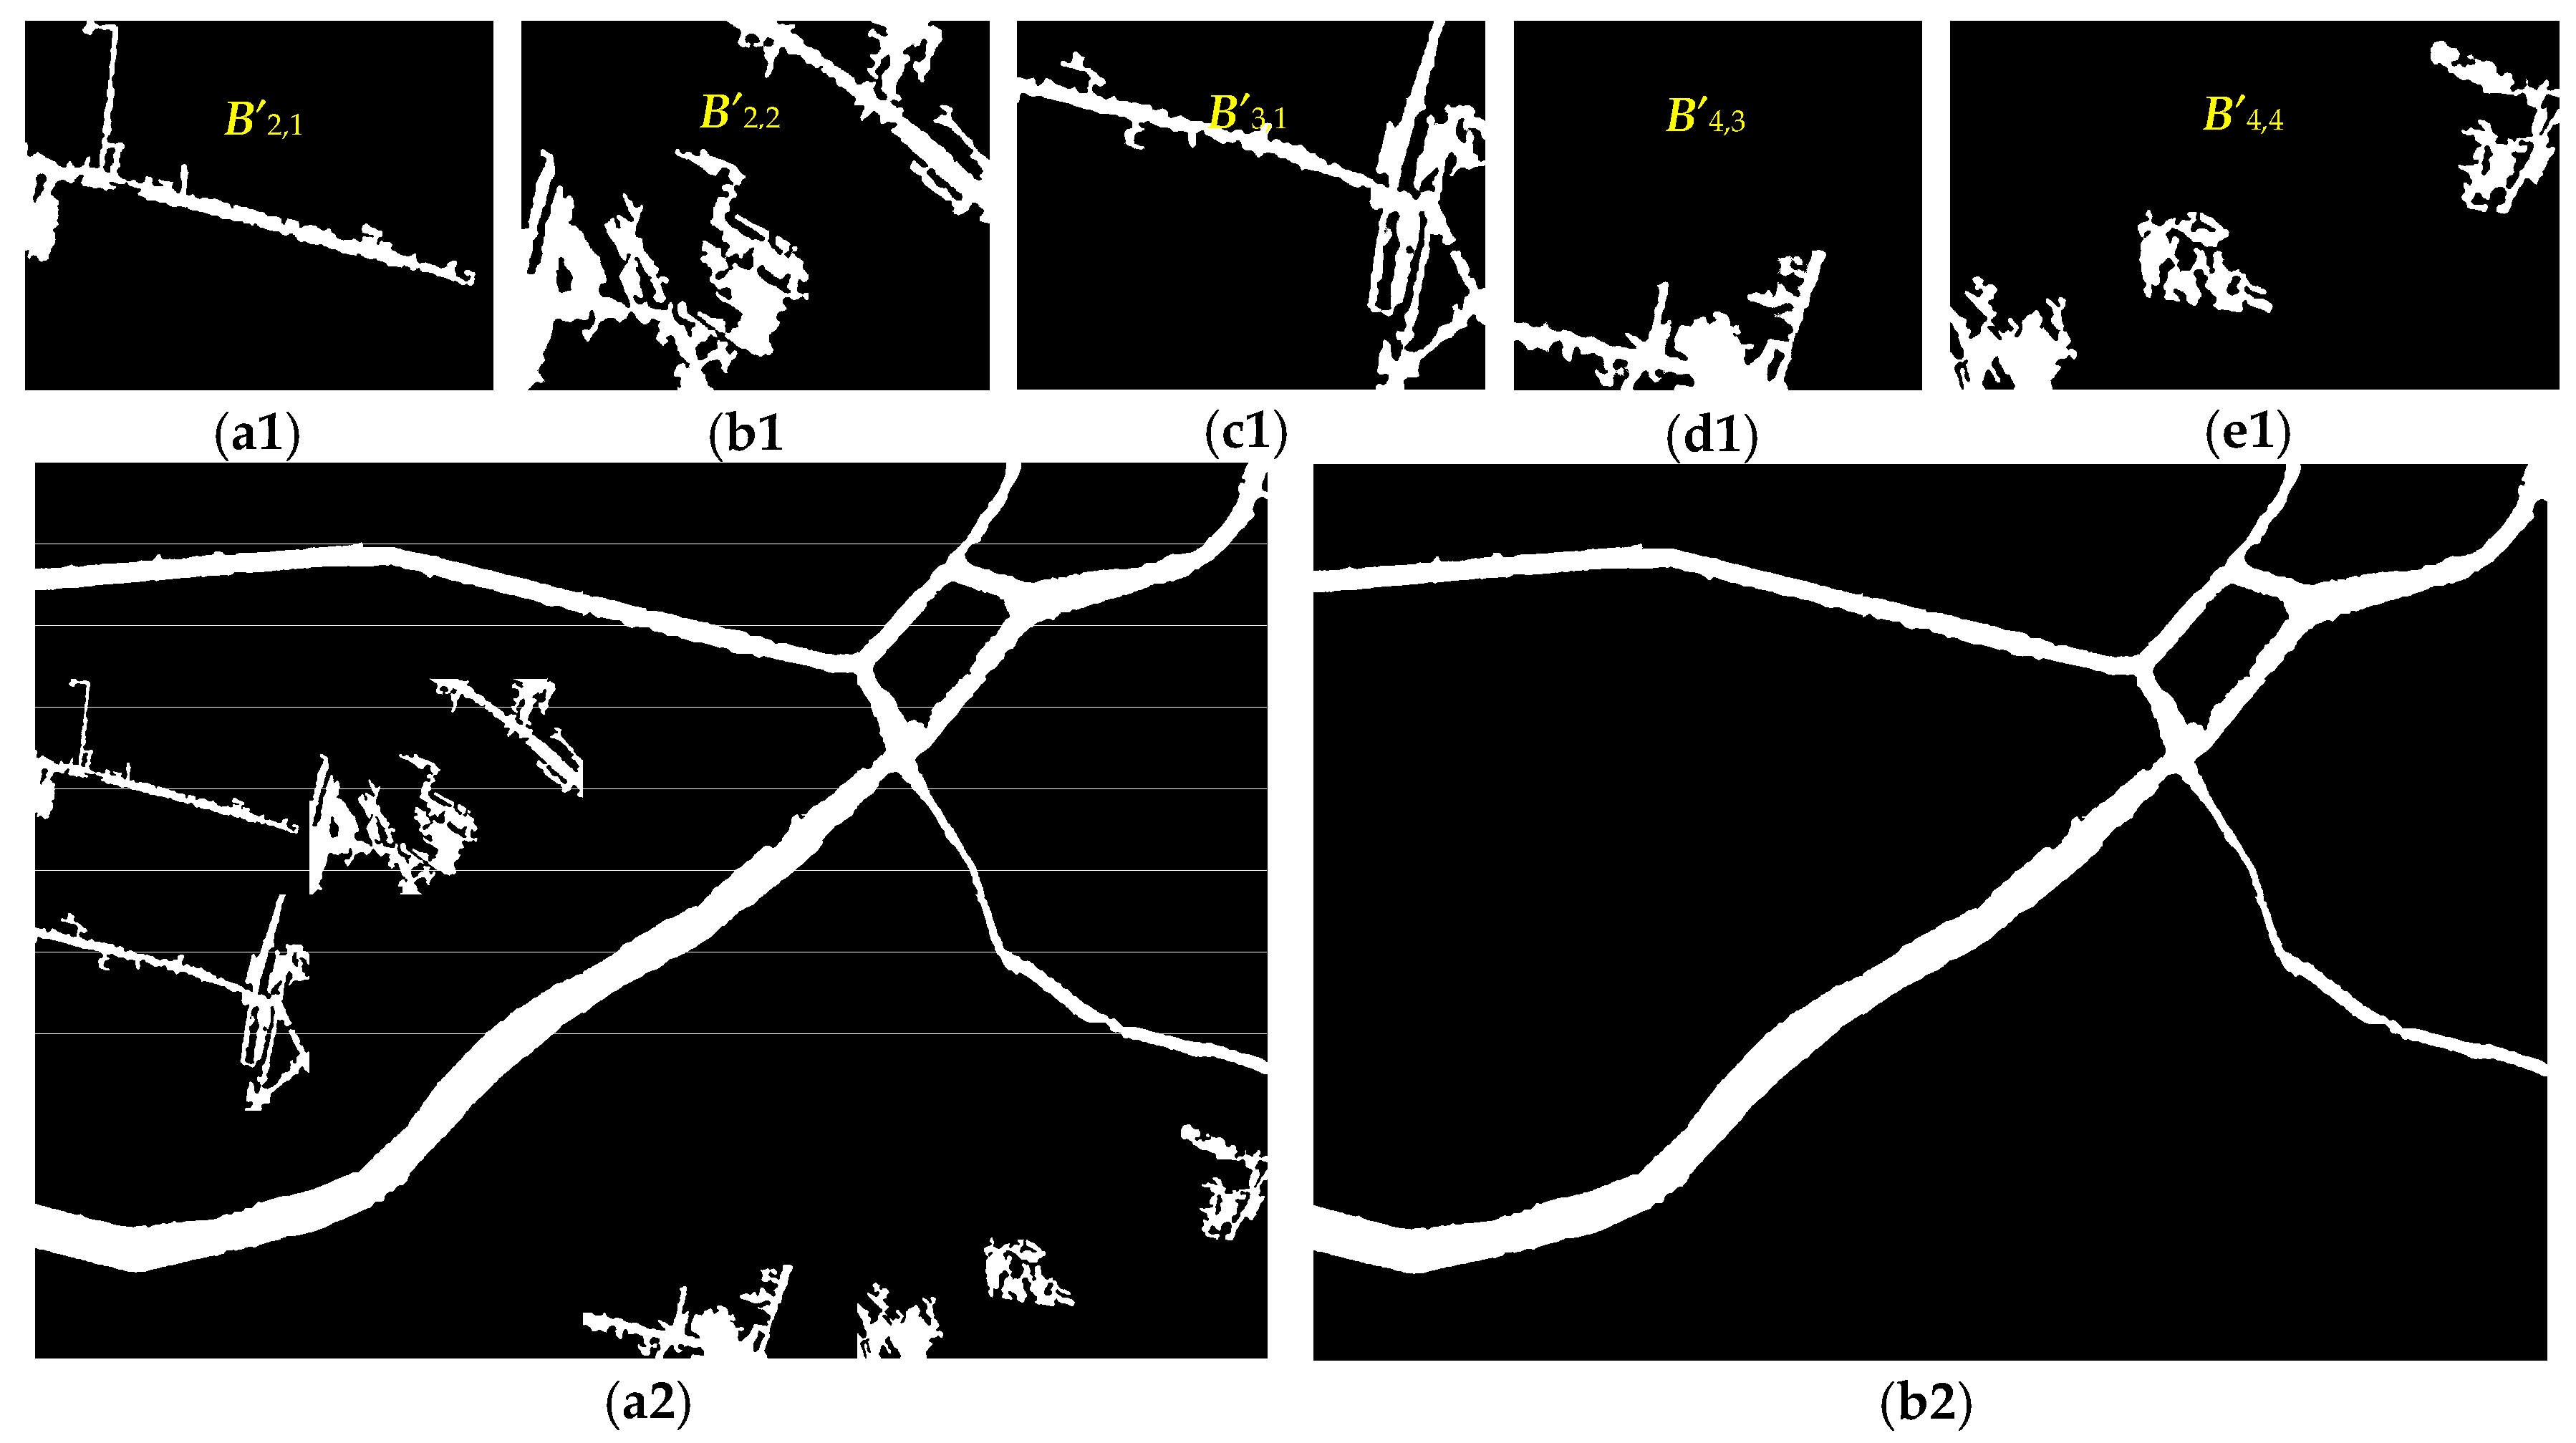
The impact of the step of classifying the sub-image blocks by visual interpretation on the final result is verified by processing all sub-image blocks. According to the previous classification, each sub-image block in the set B’ = {B’2,1, B’2,2, B’3,1, B’4,3, B’4,4} is processed by the extraction procedure of this paper, and the results are shown in Figure 12a1–e1. As can be seen from Figure 12a1–e1, there are regions identified as riverways in each sub-image block. This is because the extraction is based on the regions with low overall brightness and continuous distribution, while there are always some regions with relatively low brightness in the sub-image blocks. It can be seen from the comparison with the original image in Figure 4 that these mis-extractions are low brightness object regions in the sub-image blocks, such as asphalt road, shadow, urban artificial lake, sewage pool and so on. All the extraction results are stitched together, as shown in Figure 12a2. It can be seen from the figure that these mis-extractions are not connected to the real riverway, while those originally interrupted riverway segments are connected together after the treatment of the discontinuity connection measures proposed in this paper. In the last step of this method, the connected component processing of Figure 12a2 can remove the mis-extractions, and the result is shown in Figure 12b2.
By processing all the sub-image blocks, it can be found that classifying the sub-image blocks in advance can reduce the amount of unnecessary calculations. When human judgment is wrong, these sub-image blocks that do not cover the riverway only increase the amount of calculations, but have no effect on the accuracy of the final extraction results. This is mainly due to the natural characteristic of riverway connectivity and the operation measure of discontinuity connection proposed in this paper, so that the mis-extracted regions can be removed in the final treatment.
4.2. Sub-Image Block Filtering
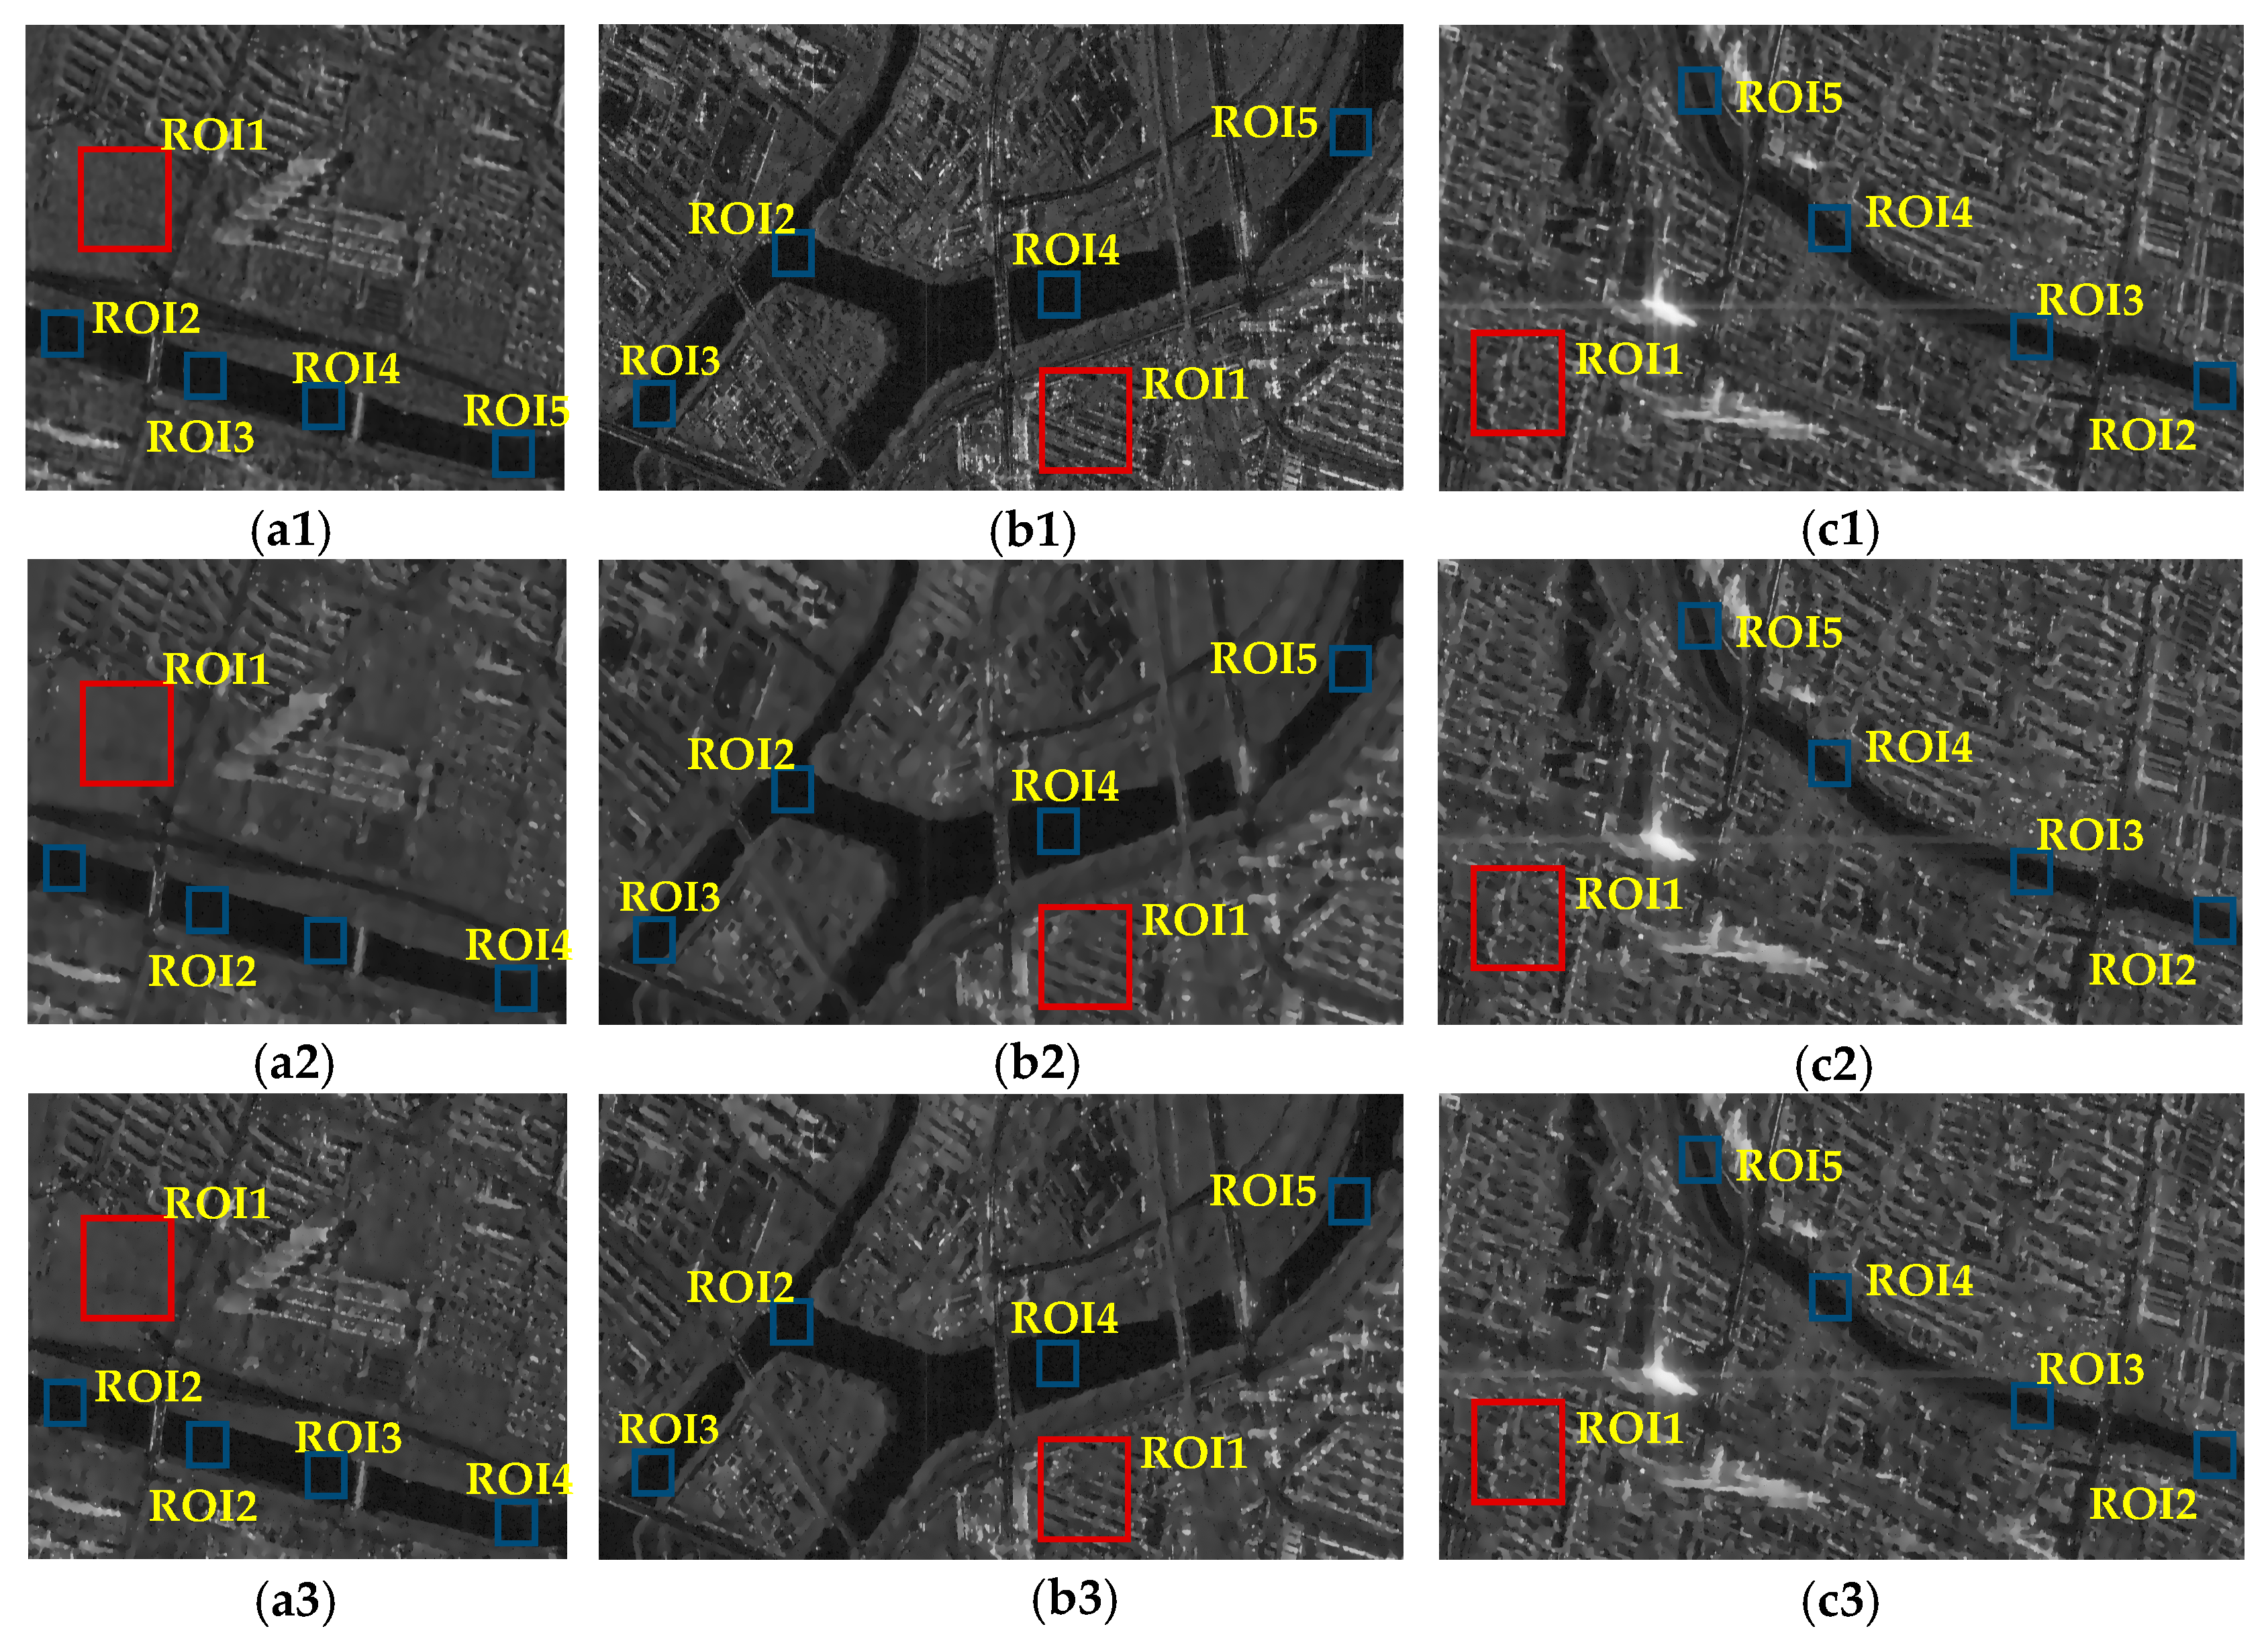
To illustrate the advantages of the proposed sub-image block filtering, Lee, Kuan, and Frost filtering methods were used as comparisons, and all methods use the iterative criteria used in this paper. The filtering results are shown in Figure 13.
Comparing Figure 13 with Figure 6a1–c1, the comparative analysis shows the Lee filtering approach yielded poor results. Lee filtering is a model-based method, where the static noise assumption does not often meet the actual situation. Compared with the Lee method, Kuan and Frost use adaptive local statistical features to consider the nonuniformity of the image. Their results show much better removal of speckle noise, but many stray points still remain. The adaptive SRAD proposed in this paper can fully smoothen the internal noise of the region and keep the edge information of the water–land junction, which yields a more accurate extraction of riverways.
For the quantitative evaluation of the filtering results, two indexes—the Equivalent Numbers of Looks (ENL) and the Contrast Noise Ratio (CNR)—were selected. ENL is an index that measures regional smoothness. A 128 × 128 pixels background region was selected as ROI1 (red rectangular in Figure 13), and four 60 × 60 pixels object regions were used as ROI2–ROI5 (blue rectangular in Figure 13) to calculate the average value of the ENL:
where μi and σi are the mean and standard deviation of the i-th ROI, respectively. Larger ENL values mean that the image is smoothed well. CNR, which measures image contrast by dividing the intensity difference between the selected object and the background regions by the sum of standard deviations, can be calculated as
The larger the value of CNR, the stronger the separability between the object and the background region, which is more conducive for riverway extraction. The summary of the evaluation results is presented in Table 3.
As shown in the table, SRAD has larger ENL and CNR values, which verifies the feasibility and advantages of selecting SRAD for filtering sub-image blocks.
4.3. Discontinuity Connection
In view of the complex shape and discontinuity of the urban riverway, the minimum convex hull and multi-layer region growth processing mechanism is designed to automatically connect the discontinuities between riverway segments. Although this mechanism can achieve good connection results, it also has limitations.
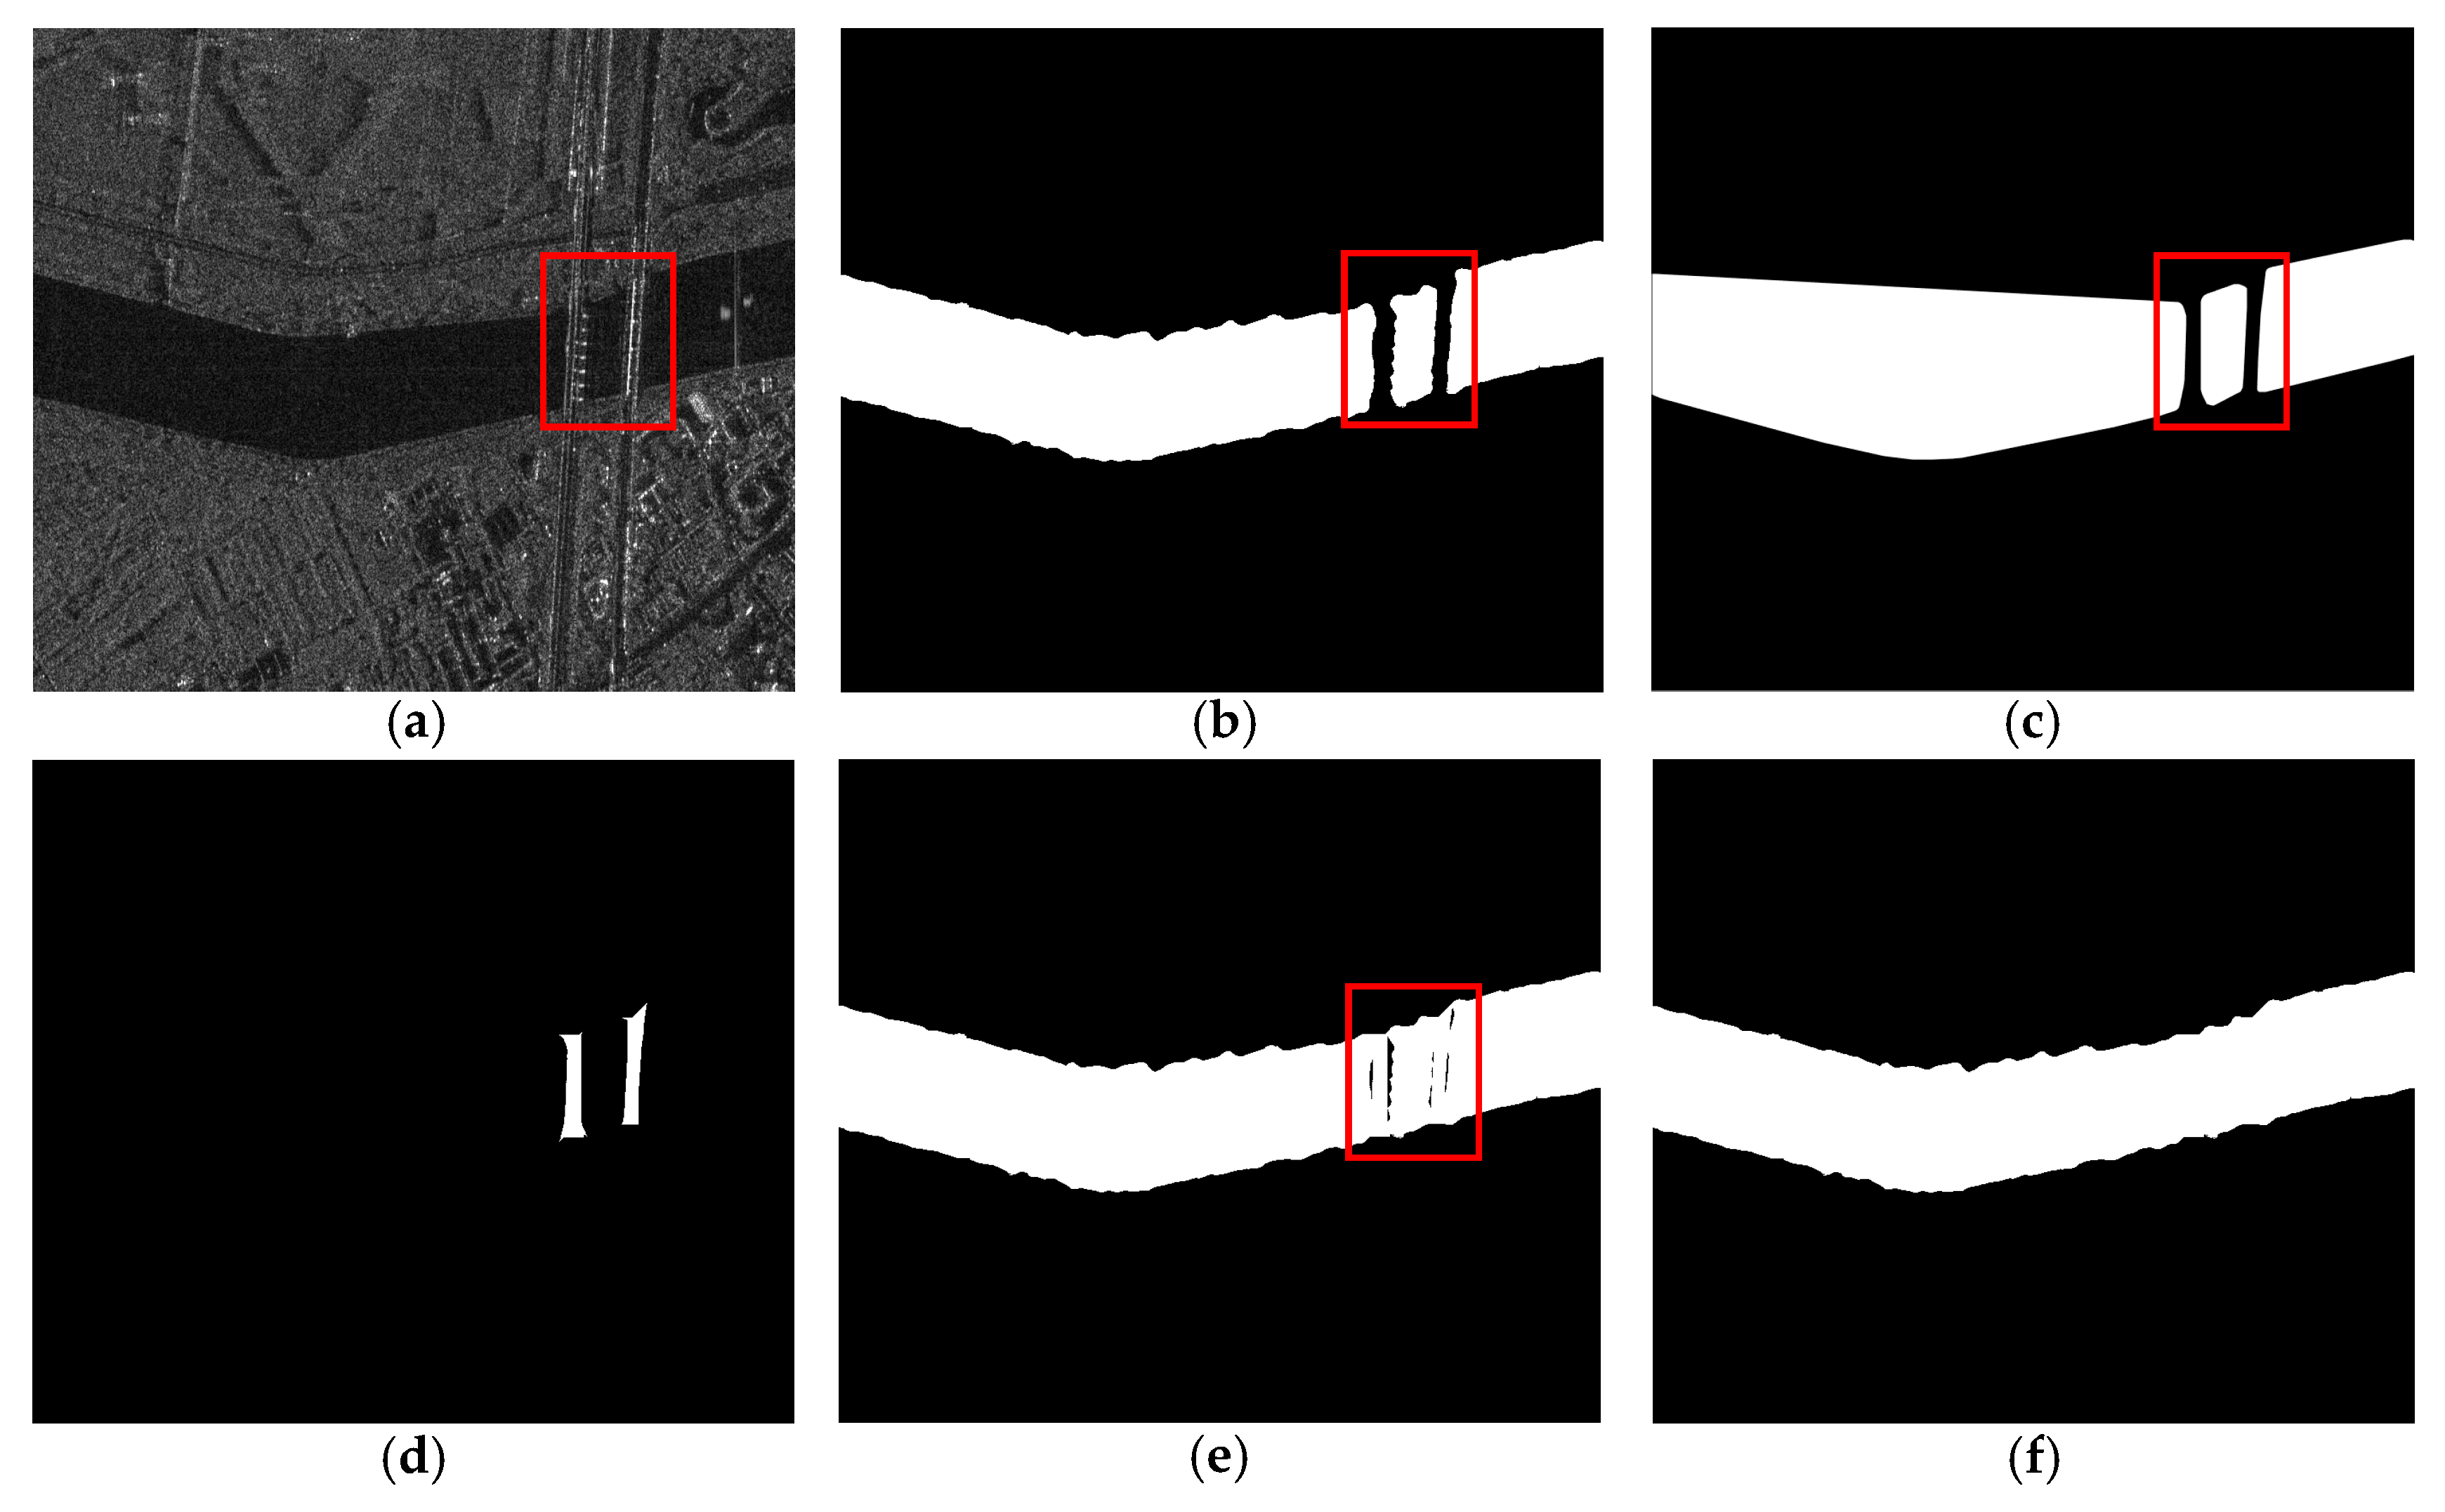
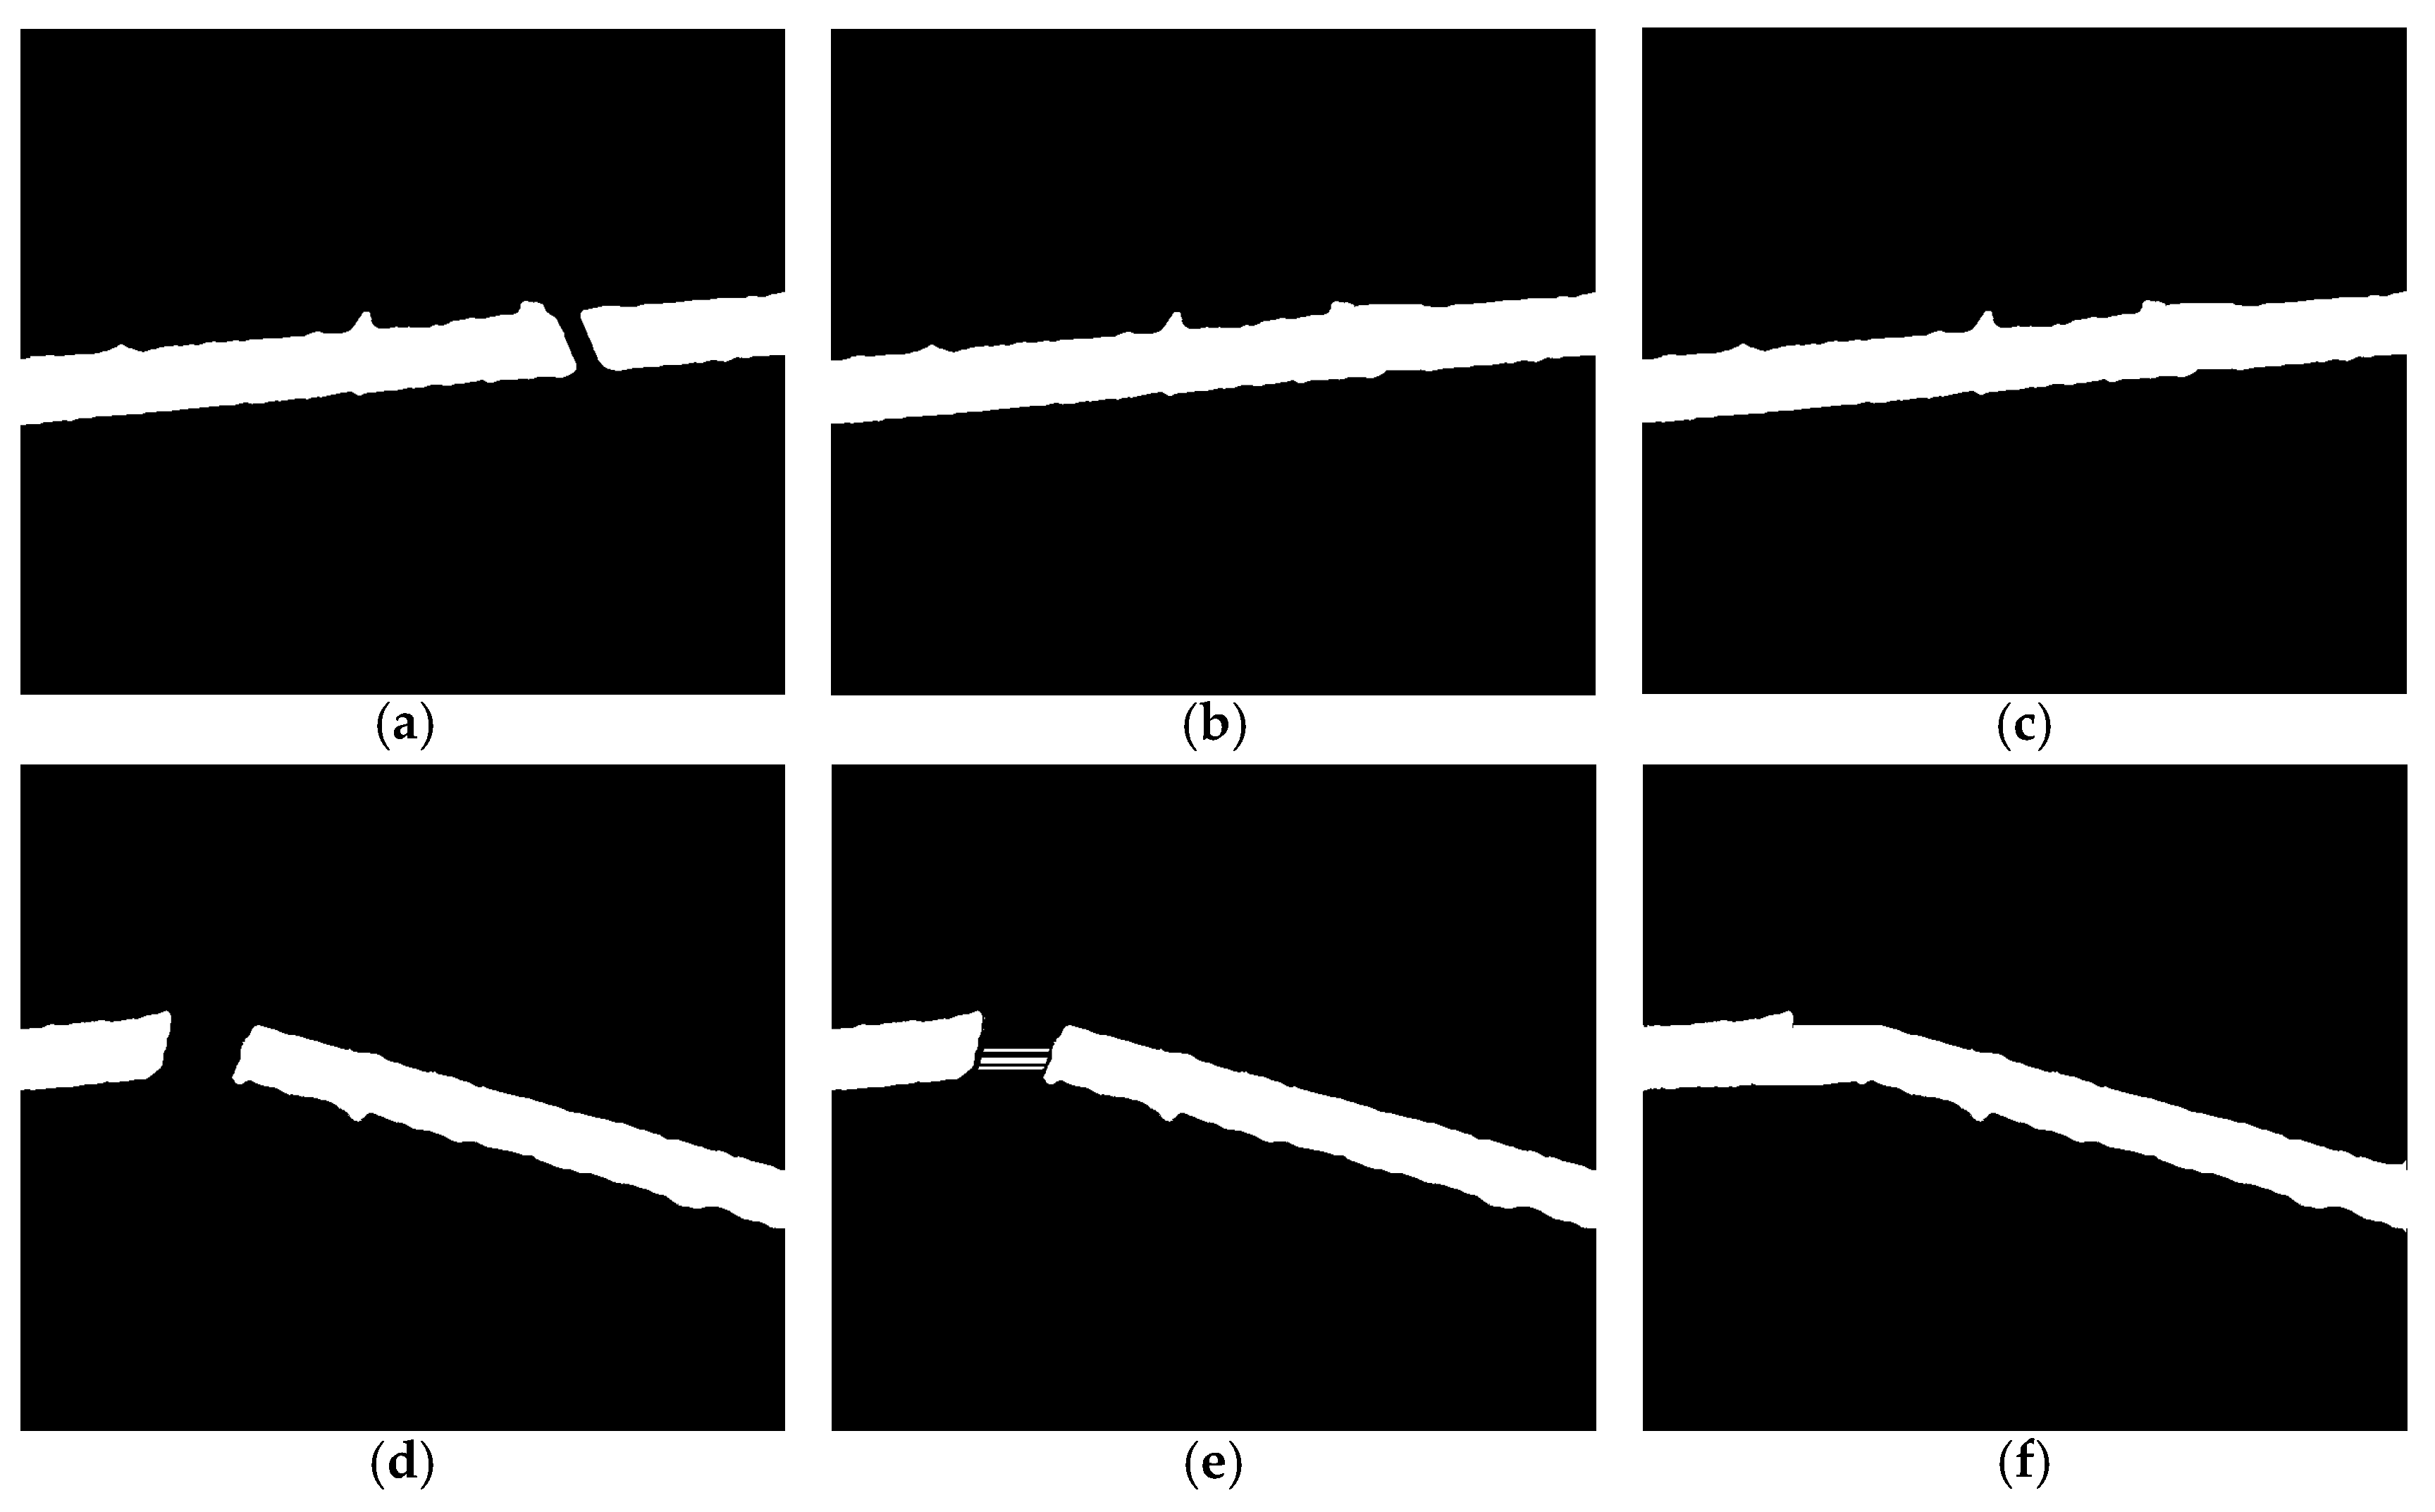
First, the minimum convex hull processing mechanism requires a postprocessing to perfect the result. For safety and beautification considerations, some bridges, dams, and other human-made infrastructures are provided with guardrails, lamp posts, drainage, etc. on the surface boundaries, causing them to appear as incompletely homogeneous regions on the image. Due to the heterogeneity of these infrastructures at the boundary, the two ends of the extracted riverway segment may not be straight. The minimum convex hull processing mechanism will fill the concave part of the cross section, resulting in these concave parts will be retained after discontinuity connection. Take B’4,1 as an example to illustrate the limitation of the convex hull processing mechanism, as shown in Figure 14.
It can be inferred from the red box in Figure 14a that the small areas with high brightness on both sides of the bridge should be guardrails and lamp posts. This makes the cross section of riverway segment extracted in Figure 14b uneven, while the convex hull in Figure 14c fills these concave parts. Figure 14d is the result region of growth using multi-layer region growth with convex hull as the connecting object. By superimposing Figure 14d over Figure 14b, as shown in Figure 14e, it can be seen that these concave parts are retained. For this reason, this paper again uses the connected component method in Section 3.2 to remove these concave parts, as shown in Figure 14f.
Second, the parameters of multi-layer region growth cannot be adjusted adaptively. Due to the difference of the distance between the river segments in each sub-image block, when the number of layers of the pyramid is small, some wider discontinuities cannot be fully connected. To reduce the debugging of the layer number setting and adapt to all sub-image blocks, a larger layer number is set in this paper. Two sub-image blocks—B’1,1 and B’1,2—with different size discontinuities are selected as an example to illustrate the limitations of parameter adjustment, as shown in Figure 15.
From the comparison in Figure 15, it can be seen that because the discontinuity width of B’1,1 is small, when the 3-layer search is set, the discontinuity connection can be completed, while the discontinuity of B’1,2 is only partially connected. B’1,2 can complete the discontinuity connection when the 5-layer search is set, while B’1,1 has stopped the connection.
In order to reduce the dependence of layer number setting, the morphological dilation and Fast-R-CNN are used to estimate the boundary of discontinuities, so as to adjust the number of layers of each sub-image block adaptively. However, at present, only the detection of similar discontinuity objects in the image is realized, and its accuracy and robustness need to be improved.
4.4. Feasibility and Robustness Analysis
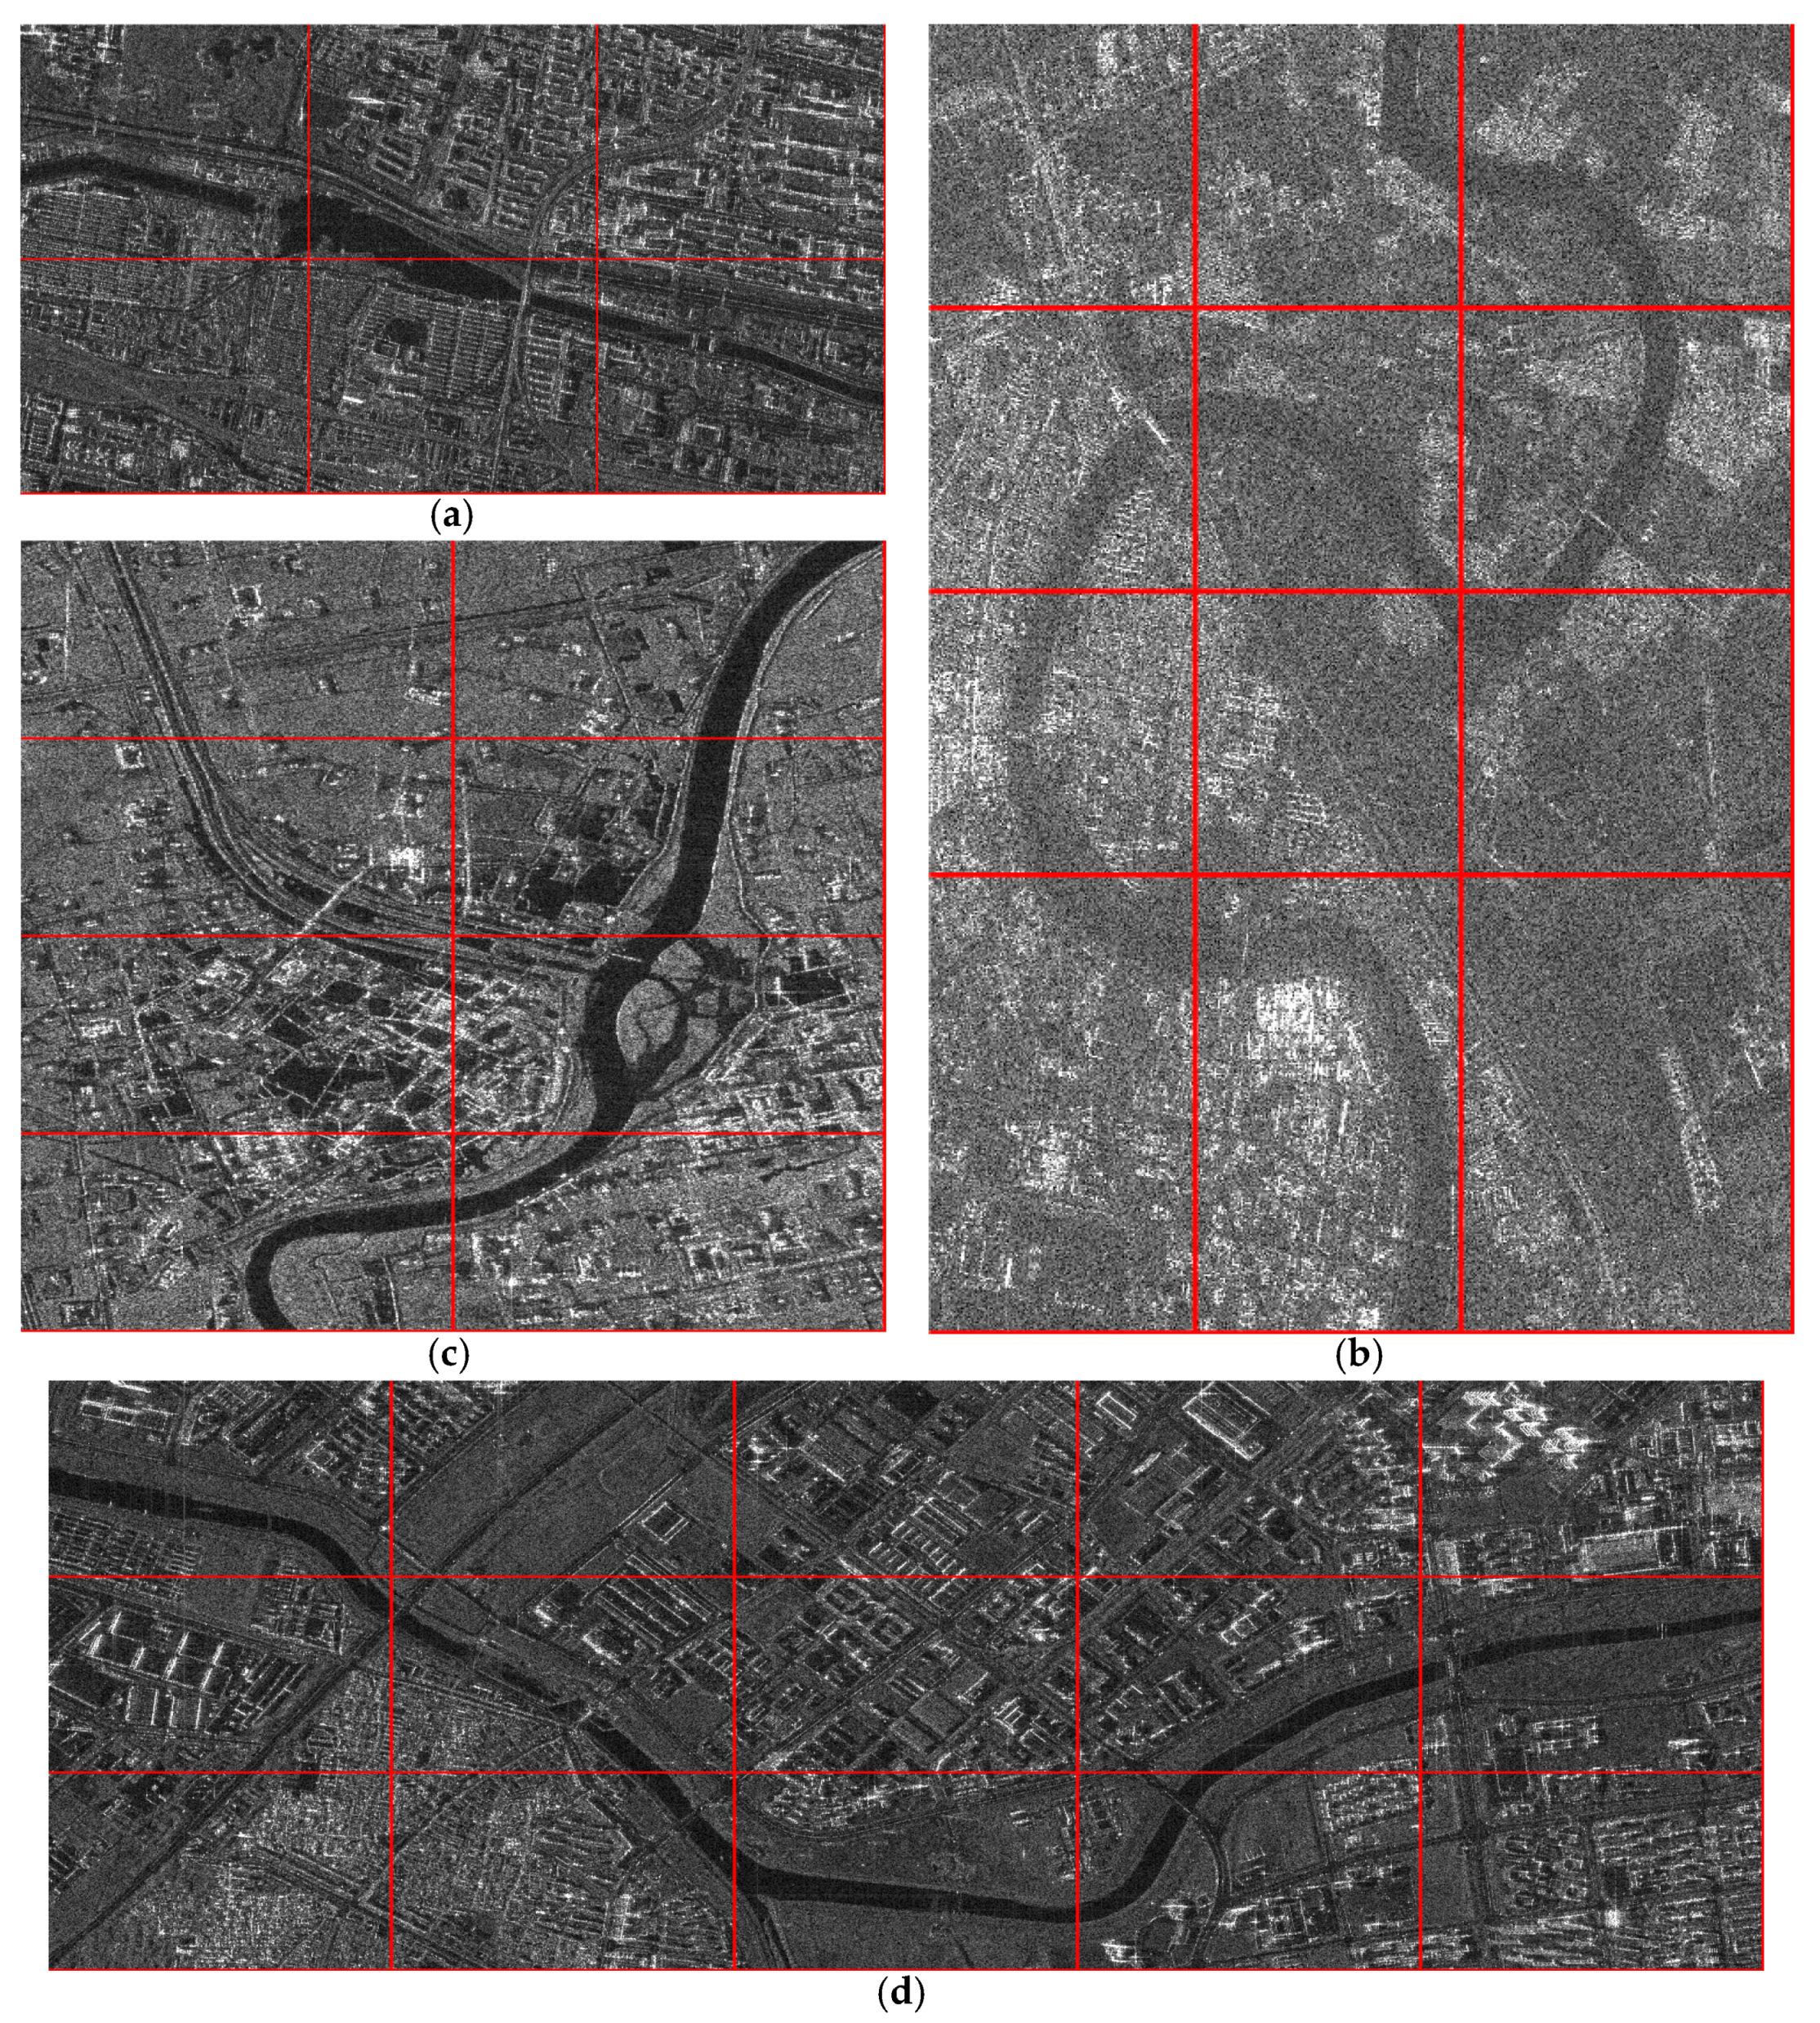
To verify the feasibility and robustness of the proposed method, about 50 SAR urban riverway images obtained from the GF-3 satellites are tested in this section. Limited by the layout of the article, four images with different types of urban riverways are selected for display and analysis. The strip imaging modes of these images are UFS, FSII, FSI, and UFS, with sizes of 1100 × 1800, 3000 × 1950, 1400 × 1000, and 1550 × 2950 pixels, respectively, as shown in Figure 16a–d.
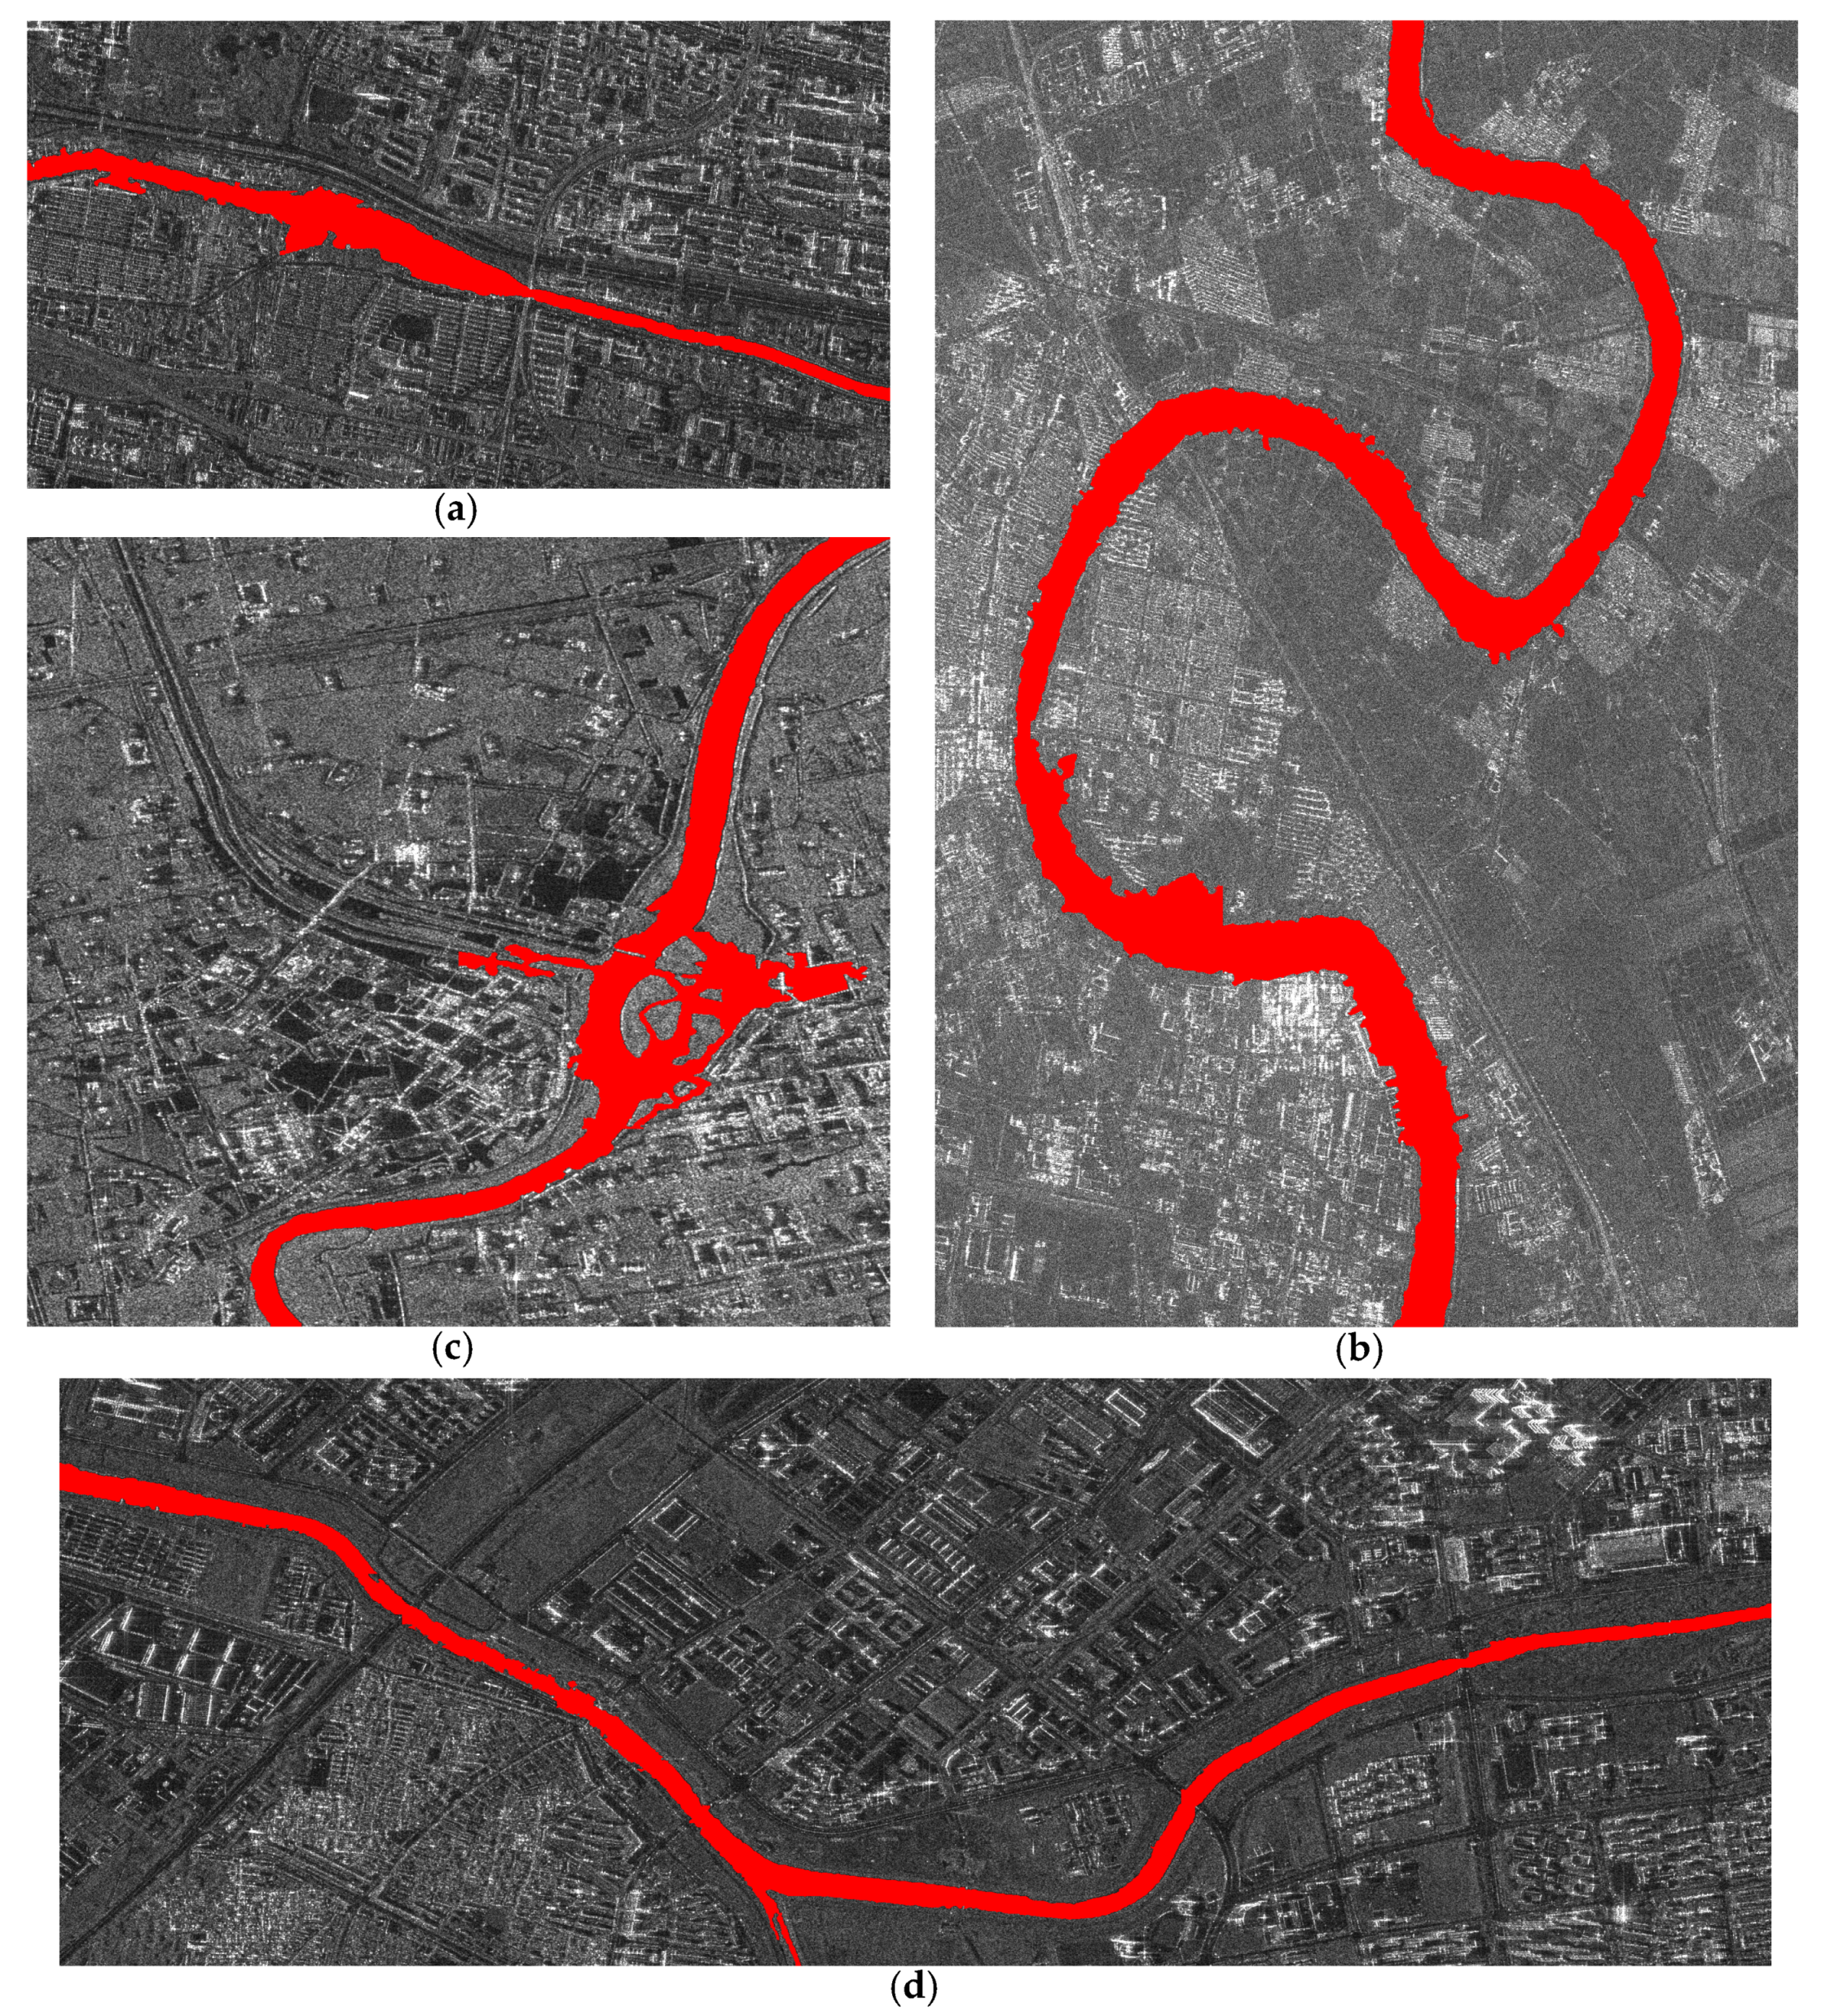
From the selected images, it can be seen that the urban riverways have complex geometric shapes such as transverse, longitudinal and crisscross, and so on due to the joint action of nature and human-made, and the span range is large, which makes the background more complex and increases the difficulty of accurate extraction of riverway. To this end, this paper partitions each image into overlapping sub-image blocks. The partitioning strategy can artificially specify the size of or the number of sub-image blocks. For example, in Figure 16a–d, the numbers of sub-image blocks are specified as 6, 12, 8, and 15, respectively; h0 = v0 = 5; and the partition results are displayed as red rectangular boxes in the figures. It can be seen from the partition that some sub-image blocks do not cover riverway and can be directly processed as the background, while the background of the sub-image blocks covering the riverway is relatively simple, which is beneficial to the extraction of the riverway. Each image is processed by the proposed method, and the riverway extraction result is represented as red and superimposed on the original image, as shown in Figure 17.
From the superposition of the results, it can be seen that the riverway extracted from each test image has good visual accuracy in terms of completeness and boundary positioning. The quantitative evaluation of each image is shown in Table 4.
As can be seen from the table, the average Sorensen–Dice and Jaccard scores of images are 93.06% and 87.05%, respectively, and the boundary accuracy has reached 85% on average when the radius is 2 pixels. Based on the qualitative and quantitative evaluation of the above extraction results, the feasibility and robustness of the proposed method are verified.
5. Conclusions
In this paper, a method of urban riverway extraction from high-resolution SAR images is proposed. According to the distribution characteristics of urban riverways, this method adopts the sub-image block extraction processing strategy. Sub-image blocks that do not cover riverways are treated as background. For those that do cover riverways, the designed extraction method first uses an iterative adaptive SRAD and optimized Sauvola local threshold algorithm to quickly obtain the riverway segments in sub-image blocks. The minimum convex hull of each riverway segment is then taken as the connection object, and the discontinuity connection is realized by multi-layer region growth.
The qualitative and quantitative evaluations of the riverway extraction results show the effectiveness of the proposed method. However, for different sub-image blocks, some operations in the extraction method would have to be adjusted and selected manually, reducing the automated nature of the extraction method. For future research, the adaptive adjustment of the extraction parameters for each sub-image block need to be studied further to achieve automatic extraction of urban riverways from large-scale high-resolution SAR images.
Author Contributions
Y.Y. proposed the frameworks and conducted the experiments; Y.L. provided suggestions and wrote the manuscript together with Y.Y.; Y.L. and Q.Z. discussed the results and revised the manuscript. All authors have read and agreed to the published version of the manuscript.
Funding
This research was funded by the National Natural Science Foundation of China (41801368, 41801233).
Conflicts of Interest
The authors declare no conflict of interest.
References
- Usher, M. Conduct of conduits: Engineering, desire and government through the enclosure and exposure of urban water. Int. J. Urban Reg. Res. 2018, 42, 315–333. [Google Scholar] [CrossRef] [Green Version]
- Boell, M.; Alves, H.R.; Volpato, M.; Ferreira, D.; Lacerda, W. Exploiting feature extraction techniques for remote sensing image classification. IEEE Lat. Am. Trans. 2019, 16, 2657–2664. [Google Scholar] [CrossRef]
- Xie, J.; Sun, D.; Cai, J.; Cai, F. Waveband selection with equivalent prediction performance for FTIR/ATR spectroscopic analysis of COD in sugar refinery waste water. Comput. Mater. Contin. 2019, 58, 687–695. [Google Scholar] [CrossRef]
- Katherine, I.; Alexander, B.; Georgia, F.; Achim, R.; Birgit, W. Assessing single-polarization and dual-polarization terrasar-x data for surface water monitoring. Remote Sens. 2018, 10, 949–965. [Google Scholar]
- Park, K.; Park, J.J.; Jang, J.C.; Lee, J.H.; Oh, S.; Lee, M. Multi-spectral ship detection using optical, hyperspectral, and microwave SAR remote sensing data in coastal regions. Sustainability 2018, 10, 4064. [Google Scholar] [CrossRef] [Green Version]
- Goumehei, E.; Tolpekin, V.; Stein, A.; Yan, W. Surface water body detection in polarimetric SAR data using contextual complex Wishart classification. Water Resour. Res. 2019, 55, 7047–7059. [Google Scholar] [CrossRef] [Green Version]
- Sghaier, M.O.; Foucher, S.; Lepage, R. River extraction from high-resolution SAR images combining a structural feature set and mathematical morphology. IEEE J. Sel. Top. Appl. Earth Obs. Remote Sens. 2017, 10, 1025–1038. [Google Scholar] [CrossRef]
- Dasgupta, A.; Grimaldi, S.; Ramsankaran, R.A.; Pauwels, V.R. Towards operational SAR-based flood mapping using neuro-fuzzy texture-based approaches. Remote Sens. Environ. 2018, 215, 313–329. [Google Scholar] [CrossRef]
- Irwin, K.; Beaulne, D.; Braun, A.; Fotopoulos, G. Fusion of SAR, optical imagery and airborne LiDAR for surface water detection. Remote Sens. 2017, 9, 890. [Google Scholar] [CrossRef] [Green Version]
- Kwang, C.; Jnr, E.M.; Amoah, A.S. Comparing of landsat 8 and sentinel 2A using water extraction indexes over volta river. J. Geogr. Geol. 2018, 10, 1–7. [Google Scholar] [CrossRef] [Green Version]
- Hong, S.; Jang, H.; Kim, N.; Sohn, H.G. Water area extraction using RADARSAT SAR imagery combined with landsat imagery and terrain information. Sensors 2015, 15, 6652–6667. [Google Scholar] [CrossRef] [PubMed]
- Zhou, S.; Kan, P.; Silbernagel, J.; Jiefeng, J. Application of image segmentation in surface water extraction of freshwater lakes using radar data. Int. J. Geo-Inf. 2020, 9, 424. [Google Scholar] [CrossRef]
- Guo, Y.; Zhang, J. A new 2d Otsu for water extraction from SAR image. ISPAr 2017, 42, 733–736. [Google Scholar] [CrossRef] [Green Version]
- Modava, M.; Akbarizadeh, G.; Soroosh, M. Integration of spectral histogram and level set for coastline detection in SAR images. IEEE Trans. Aerosp. Electron. Syst. 2018, 55, 810–819. [Google Scholar] [CrossRef]
- Han, B.; Wu, Y. SAR river image segmentation by active contour model inspired by exponential cross entropy. J. Indian Soc. Remote Sens. 2019, 47, 201–212. [Google Scholar] [CrossRef]
- Xiaoyan, L.; Long, L.; Yun, S.; Quanhua, Z.; Qingjun, Z.; Linjiang, L. Water detection in urban areas from GF-3. Sensors 2018, 18, 1299–1310. [Google Scholar]
- Chao, W.; Fengchen, H.; Xiaobin, T.; Min, T.; Lizhong, X. A river extraction algorithm for high-resolution SAR images with complex backgrounds. Remote Sens. Technol. Appl. 2012, 27, 516–522. [Google Scholar]
- Senthilnath, J.; Shenoy, H.V.; Rajendra, R.; Omkar, S.N.; Mani, V.; Diwakar, P.G. Integration of speckle de-noising and image segmentation using synthetic aperture radar image for flood extent extraction. J. Earth Syst. Sci. 2013, 122, 559–572. [Google Scholar] [CrossRef] [Green Version]
- Liu, Y.; Peng, L.; Huang, S.; Wang, X.; Wang, Y.; Peng, Z. River detection in high-resolution SAR data using the Frangi filter and shearlet features. Remote Sens. Lett. 2019, 10, 949–958. [Google Scholar] [CrossRef]
- Morandeira, N.S.; Grimson, R.; Kandus, P. Assessment of SAR speckle filters in the context of object-based image analysis. Remote Sens. Lett. 2016, 7, 150–159. [Google Scholar] [CrossRef]
- Dou, M.; Yu, L.; Jin, M.; Zhang, Y. Correlation analysis and threshold value research on the form and function indexes of an urban interconnected river system network. Water Sci. Technol. Water Supply 2016, 16, 1776–1786. [Google Scholar] [CrossRef] [Green Version]
- Mustafa, W.A.; Yazid, H.; Jaafar, M. An improved sauvola approach on document images binarization. J. Telecommun. Electron. Comput. Eng. 2018, 10, 43–50. [Google Scholar]
- Yu, H.; Wang, J.; Bai, Y.; Yang, W.; Xia, G.S. Analysis of large-scale UAV images using a multi-scale hierarchical representation. Geo-Spat. Inf. Sci. 2018, 21, 33–44. [Google Scholar] [CrossRef] [Green Version]
- Chen, L.; Hu, W.F.; Long, C.; Wang, D. Exogenous plant growth regulator alleviate the adverse effects of U and Cd stress in sunflower (Helianthus annuus L.) and improve the efficacy of U and Cd remediation. Chemosphere 2020, 262, 127809. [Google Scholar] [CrossRef] [PubMed]
- Thanh, D.N.H.; Prasath, V.B.S.; Hieu, L.M. Melanoma skin cancer detection method based on adaptive principal curvature, colour normalisation and feature extraction with the ABCD rule. J. Digit. Imaging 2020, 33, 574–585. [Google Scholar] [CrossRef] [PubMed]
- Modava, M.; Akbarizadeh, G. Coastline extraction from SAR images using spatial fuzzy clustering and the active contour method. Int. J. Remote Sens. 2017, 38, 355–370. [Google Scholar] [CrossRef]
Figure 1.
Framework of urban riverway extraction method.

Figure 2.
Schematic diagram of convex hull formation.

Figure 3.
Schematic diagram of search directions and radius for seeds with S = 2, k = 1.

Figure 4.
Original synthetic aperture radar (SAR) image.

Figure 5.
Partitioned sub-image blocks with shared boundary regions.

Figure 6.
Results of each step. (a1)–(c1) Filtering result. (a2)–(c2) Sauvola algorithm segmentation results. (a3)–(c3) Extraction results of riverway segments.
Figure 6.
Results of each step. (a1)–(c1) Filtering result. (a2)–(c2) Sauvola algorithm segmentation results. (a3)–(c3) Extraction results of riverway segments.

Figure 7.
Results and evaluation. (a1)–(c1) Constructed convex hull. (a2)–(c2) Riverway extraction results. (a3)–(c3) Qualitative evaluation.
Figure 7.
Results and evaluation. (a1)–(c1) Constructed convex hull. (a2)–(c2) Riverway extraction results. (a3)–(c3) Qualitative evaluation.

Figure 8.
Comparison of riverway extraction results. Panels (a–d) are the extraction results of the proposed method, 1-D Otsu method in [12], 2-D Otsu method in [13], and FCM method in [16].

Figure 9.
Computational complexity of speckle reduction anisotropic diffusion (SRAD) before and after blocking.
Figure 9.
Computational complexity of speckle reduction anisotropic diffusion (SRAD) before and after blocking.

Figure 10.
SRAD filtering result of the entire image.

Figure 11.
Example of stitching non-overlapping and overlapping sub-image block extraction results. (a1)–(d1) Original sub-image blocks. (a2)–(b2) Stitching of extraction results of non-overlapping and overlapping partition. (a3)–(b3) Comparison of partial enlargement near the stitching line.
Figure 11.
Example of stitching non-overlapping and overlapping sub-image block extraction results. (a1)–(d1) Original sub-image blocks. (a2)–(b2) Stitching of extraction results of non-overlapping and overlapping partition. (a3)–(b3) Comparison of partial enlargement near the stitching line.

Figure 12.
Example of riverway extraction from unclassified sub-image blocks. (a1)–(e1) Processing results of sub-image blocks without riverway cover. (a2)–(b2) Intermediate and final results of riverway extraction.
Figure 12.
Example of riverway extraction from unclassified sub-image blocks. (a1)–(e1) Processing results of sub-image blocks without riverway cover. (a2)–(b2) Intermediate and final results of riverway extraction.

Figure 13.
Comparison of filtering results (a1)–(c1). Lee (a2)–(c2). Kuan (a3)–(c3).

Figure 14.
Example of the limitation of the minimum convex hull. (a) Original image. (b) Extracted riverway segments. (c) Constructed convex hulls. (d) Regions of growth. (e) Riverway with discontinuity connection. (f) Optimization of riverway extraction.
Figure 14.
Example of the limitation of the minimum convex hull. (a) Original image. (b) Extracted riverway segments. (c) Constructed convex hulls. (d) Regions of growth. (e) Riverway with discontinuity connection. (f) Optimization of riverway extraction.

Figure 15.
Example of multi-layer region growth. Left: (a) and (d) Riverway segments extraction results of B’1,1 and B’1,2. Middle: (b) and (e) Region growth results of 3-layer search. Right: (c) and (f) Region growth results of 5-layer search.
Figure 15.
Example of multi-layer region growth. Left: (a) and (d) Riverway segments extraction results of B’1,1 and B’1,2. Middle: (b) and (e) Region growth results of 3-layer search. Right: (c) and (f) Region growth results of 5-layer search.

Figure 16.
SAR test images covering urban riverways. (a) 1100 × 1800; (b) 3000 × 1950; (c) 1400 × 1000, and (d) 1550 × 2950 pixels.
Figure 16.
SAR test images covering urban riverways. (a) 1100 × 1800; (b) 3000 × 1950; (c) 1400 × 1000, and (d) 1550 × 2950 pixels.

Figure 17.
Riverway extraction results and its qualitative evaluation. (a) 1100 × 1800; (b) 3000 × 1950; (c) 1400 × 1000, and (d) 1550 × 2950 pixels.
Figure 17.
Riverway extraction results and its qualitative evaluation. (a) 1100 × 1800; (b) 3000 × 1950; (c) 1400 × 1000, and (d) 1550 × 2950 pixels.


Table 1.
Boundary-based riverway extraction accuracy (%).
| Sub-Image Block | dice | jaccard | Radius of the Evaluation Region | ||||
|---|---|---|---|---|---|---|---|
| Overlap | 1 Pixel | 2 Pixels | 3 Pixels | 4 Pixels | |||
| B’1,3 | 96.93 | 94.04 | 45.28 | 74.26 | 94.63 | 98.37 | 99.34 |
| B’1,4 | 95.46 | 91.31 | 43.96 | 73.99 | 92.11 | 94.00 | 96.55 |
| B’3,4 | 94.86 | 90.22 | 40.51 | 71.57 | 91.06 | 93.81 | 94.72 |
Table 2.
Comparison of riverway extraction accuracy of each method (%).
| Method | dice | jaccard | Radius of the Evaluation Region | ||||
|---|---|---|---|---|---|---|---|
| Overlap | 1 Pixel | 2 Pixels | 3 Pixels | 4 Pixels | |||
| Proposed method | 93.97 | 88.63 | 44.65 | 72.07 | 94.23 | 97.82 | 98.69 |
| 1-D Otsu in [12] | 72.52 | 56.89 | 32.47 | 58.27 | 72.60 | 75.26 | 76.65 |
| 2-D Otsu in [13] | 84.47 | 73.12 | 37.51 | 63.47 | 77.78 | 81.01 | 81.89 |
| FCM in [16] | 87.08 | 77.12 | 39.85 | 65.41 | 80.13 | 83.28 | 83. 96 |
Table 3.
Comparison between Equivalent Numbers of Looks (ENL) and Contrast Noise Ratio (CNR) evaluation of different filter results.
Table 3.
Comparison between Equivalent Numbers of Looks (ENL) and Contrast Noise Ratio (CNR) evaluation of different filter results.
| Image | Index | Lee | Kuan | Frost | SRAD |
|---|---|---|---|---|---|
| B’1,3 | ENL | 9.76 | 10.45 | 11.20 | 12.51 |
| CNR | 16.94 | 17.82 | 17.35 | 18.55 | |
| B’1,4 | ENL | 5.33 | 7.07 | 8.76 | 8.89 |
| CNR | 8.91 | 11.02 | 11.27 | 11.74 | |
| B’3,4 | ENL | 7.38 | 7.95 | 7.81 | 8.41 |
| CNR | 12.79 | 13.56 | 13.87 | 15.19 |
Table 4.
Quantitative evaluation of riverway extraction results of each image (%)
| Image | dice | jaccard | Radius of the Evaluation Region | ||||
|---|---|---|---|---|---|---|---|
| Overlap | 1 Pixel | 2 Pixels | 3 Pixels | 4 Pixels | |||
| Figure 15a | 92.45 | 85.96 | 45.51 | 79.43 | 84.23 | 91.89 | 92.59 |
| Figure 15b | 93.84 | 88.39 | 45.23 | 80.74 | 86.37 | 92.74 | 93.25 |
| Figure 15c | 90.89 | 83.30 | 43.78 | 78.26 | 83.64 | 91.27 | 92.10 |
| Figure 15d | 95.04 | 90.55 | 46.03 | 82.72 | 87.46 | 94.28 | 94.89 |
| Average: | 93.06 | 87.05 | 45.14 | 80.29 | 85.42 | 92.55 | 93.21 |
Publisher’s Note: MDPI stays neutral with regard to jurisdictional claims in published maps and institutional affiliations. |
© 2020 by the authors. Licensee MDPI, Basel, Switzerland. This article is an open access article distributed under the terms and conditions of the Creative Commons Attribution (CC BY) license (http://creativecommons.org/licenses/by/4.0/).
Share and Cite
MDPI and ACS Style
Li, Y.; Yang, Y.; Zhao, Q. Urban Riverway Extraction from High-Resolution SAR Image Based on Blocking Segmentation and Discontinuity Connection. Remote Sens. 2020, 12, 4014. https://doi.org/10.3390/rs12244014
AMA Style
Li Y, Yang Y, Zhao Q. Urban Riverway Extraction from High-Resolution SAR Image Based on Blocking Segmentation and Discontinuity Connection. Remote Sensing. 2020; 12(24):4014. https://doi.org/10.3390/rs12244014
Chicago/Turabian StyleLi, Yu, Yun Yang, and Quanhua Zhao. 2020. "Urban Riverway Extraction from High-Resolution SAR Image Based on Blocking Segmentation and Discontinuity Connection" Remote Sensing 12, no. 24: 4014. https://doi.org/10.3390/rs12244014
Note that from the first issue of 2016, this journal uses article numbers instead of page numbers. See further details here.