A Study of Sonar Image Stabilization of Unmanned Surface Vehicle Based on Motion Sensor for Inspection of Underwater Infrastructure


1
Daum Engineering Co., Ltd., Seongnam-si, Gyeonggi-do 13493, Korea
2
Department of Civil & Environment Engineering, Hanyang University, Seoul 04763, Korea
*
Author to whom correspondence should be addressed.
Remote Sens. 2020, 12(21), 3481; https://doi.org/10.3390/rs12213481
Submission received: 24 August 2020
/
Revised: 6 October 2020
/
Accepted: 20 October 2020
/
Published: 23 October 2020
(This article belongs to the Special Issue Remote Sensing for Transportation Infrastructure Inspection and Monitoring)
Abstract
:In order to detect damage to underwater infrastructure for inspection, an expensive survey by a diver is generally conducted, but it carries the risk of accidents. Accordingly, the development of an effective unmanned underwater survey system is an important priority. The unmanned underwater survey system used in this study is equipped with sonar towed by an- Unmanned Surface Vehicle (USV) to conduct the survey, but the USV is more affected by the waves and swells than a common boat. As a result, distorted sonar data causes errors in the information regarding the damage of underwater infrastructure. This study proposes the method of sonar image stabilization to minimize the errors of the distortion of sonar data by using a motion sensor. The change in the amount of the roll was calculated from the motion sensor, and the sonar data was corrected in the sonar ping unit. The sonar image stabilization algorithm was verified through field tests, and the error rate before and after correction was reduced by 15%. It is expected that, in the future, the proposed approach will be used as a standard data-gathering system for securing the reliability of sonar data when performing an unmanned underwater survey.
1. Introduction
The possibility of disasters in underwater infrastructures is increasing due to the aging of the infrastructure and the increase in rainfall frequency due to abnormal weather. Collapses can be due to internal factors (design errors, construction defects, maintenance failures, material damage) and external factors (collisions, overloading, floods, earthquakes, hurricanes, etc.) of the infrastructure [1]. In general, scour and damage to underwater structures occurs suddenly during a short period of the rainy season and the hydraulic factors account for a large proportion of infrastructure collapses. Moreover, it is difficult to detect hazards to underwater infrastructure in safety inspections conducted during the dry season. Therefore, it is very important to quickly inspect and evaluate the safety of underwater structures before and after the rainy season.
In general, conventional methods, such as visual inspection and depth surveys by divers, and equipment, such as Remotely Operated Vehicle (ROV), SOund NAvigation Ranging (sonar), are mainly used for underwater inspection. There are various types of sonar, such as single/multi beam Side Scan Sonar (SSS), Multi-Beam Echo-Sounder (MBES), Synthetic Aperture Sonar (SAS), and acoustic cameras (imaging sonar), depending on the operating method, number of beams, and processing technology [2]. The SAS is normally larger and heavier than other sonars, it has the problem of having to connect to the small boat or vehicle such as ROV, Unmanned Surface Vehicles (USV). The MBES is a device typically used by hydrographic surveyors to determine the depth of water and the nature of the seabed. The imaging sonar produces a sonar shadow, and it is useful in underwater port security tasks and a positioning system on ROV. Among them, the SSS is used to efficiently create an image of large areas of the sea floor, or riverbed, moreover, it is suitable for detecting a damage in underwater infrastructures [1,3]. In the case of ROV, depending on the mission, some ROV are equipped with a sonar or laser scanner, but it is normally used with optical equipment and the imaging sonar. Generally, it is difficult to control in especially underwater condition in where the tide and turbidity is relatively high [1,4]. For this problem, it is possible to use a motor with high thrust, but the size of the ROV body and battery capacity should be considered.
Drones are often used as a solution to survey areas that are difficult for humans to reach rapidly. Drones are a type of unmanned vehicle such as unmanned aerial vehicle (UAV), unmanned underwater vehicles (UUVs), or USVs [5]. In the past, these were developed for military purposes. Lately, their use has been spread to various public, industrial, and hobbyist fields. An USV is typically equipped with sonar or optical equipment, and is mainly used for surveying underwater coastal and reservoir terrain [1,5].
Underwater inspection should consider safety and workability issues due to environmental influences, such as turbidity and tides, and it should be quick and accurate. The author continued research on the development and operation of a high-resolution side scan sonar with a resolution of 0.8 cm [1]. Moreover, the SSS developed has been applied to USV to establish an unmanned system. However, because the small USV equipped with sonar operates on the water surface, the influence of waves directly affects the sonar data. Furthermore, distorted sonar data causes errors in damage size to underwater structures. Therefore, it is necessary to correct the distortion sonar data for accurate inspection of the underwater infrastructure [6].
In this study, the SSS previously developed has been designed as light-weighted and USV has been designed in consideration of operation of SSS for an unmanned underwater inspection system. An operating method has been developed to minimize the distortion of the data collected by the side-scan sonar towed under the USV and an image correction method using a motion sensor. Through the field test, the sonar image stabilization method has been verified by comparing the actual damage with error correction values of the underwater structure.
2. Development of the USV Sonar for Surveying Underwater Structures
This section describes the characteristics and design methods of USV and SSS developed for the unmanned underwater inspection system, and the structure of sonar data for correcting distorted sonar data.
2.1. Development of an USV for the Surveying Underwater Structures
For the unmanned inspection of underwater structures, an USV equipped with the side scan sonar has been developed. Figure 1 shows the ground control system (GCS) concept of the USV for underwater structure inspection.
The boundary to be checked in the GCS can be specified based on Google Maps. When the boundary is determined, the main-waypoint is automatically set within the boundary, and the sub-waypoints are grid within the main-waypoint as grids which have a regular interval in the vertical and horizontal directions. Here, the direction of the waypoint is automatically determined as the optimal operating condition according to the generated boundary conditions. Furthermore, the spacing of the sub-waypoints is adjustable. The set waypoint is transmitted to the USV that uses the telemetry information.
The USV performs autonomous navigation using Real-Time Kinematic (RTK)/Global Positioning System (GPS), and it transmits GPS information and sonar image information to the GCS through an Access Point Controller (APC) in real time. Moreover, it is possible to control the sonar and USV in real time with GCS. As shown in Table 1, the USV’s hull is designed to weigh 15 kgf. It is designed that the maximum front thrust is 18.4 kgf, the maximum operating distance is 40 km, with a battery-powered propeller. The USV is designed with trimaran as shown in Figure 2 to reduce the rolling effects of the waves.
2.2. The Development of Side-Scan Sonar for Installation in the USV
The existing sonar system to survey the underwater structure was mounted on the boat [7]. However, the wire towing method was selected to minimize the effect of the roll and pitch caused by the USV as follows Figure 3.
The SSS developed for inspecting underwater structures by the authors in the previous study has the frequency bands of 1250 kHz and 2 MHz, which has the across-track resolutions of 3 cm and 0.8 cm respectively, as shown in Table 2 [1]. Here, the developed SSS has the beam tilt of 20° of sound wave emitted from the transducers on both sides, and it is equipped with an electric motor can be rotated 360° to control the beam angle for survey underwater structures. The sonar characteristic is that as the frequency increases, the resolution is increased and the sonar range is decreased. Equation (1) shows the relationship between frequency and across-track resolution, where is the sonar frequency and, is the velocity of acoustic, is the number of wave length.
Because the thrust of the USV developed is 18.4 kgf, the sonar body was changed from SUS 316 (Stainless Steel) to acetal resin and aluminum 6061 to reduce the weight of the sonar. Through a lightweight design, the weight of the existing sonar is 26.32 kgf and the weight of the developed sonar is 16.10 kgf, which reduced weight about 38.83% (10.22 kgf). The weight of the developed sonar in the water is 9.6 kgf.
2.3. Structure of Sonar Data
When operating the sonar, data is collected in the eXtended Triton Format (XTF) file format containing sonar, navigation, bathymetry information. The XTF file format is going to be analyzed for the development of sonar image correction methods. The XTF file is saved in the form of a ping, which is stored in a form similar to the way in which the sonar’s data is accepted over a period of time. The side scan sonar emits sound waves and receives the reflected waves that have returned, thereby obtaining underwater information. Then the data is stored in multiple linear blocks, each of which corresponds to a single ping.
Figure 4 shows the data of the ping in the XTF file structure. The ping consists of the XTF File Header, XTF Ping Header, XTF Ping Channel Header #1, Data of the #1 channel, XTF Ping Channel Header #2, Data of the #2 channel. The XTF File Header contains basic information of the suspended sonar such as the swath, the altitude, and speed of the towfish. The XTF Ping Header contains information on the slant range and depth of the ping. In addition, the data of the transducer channels on both sides of the towfish can be obtained from the XTF Channel Header. In the Channel Data section, the image data of the sonar is stored. The side-scan sonar image data can be obtained through this file format.
3. Development of a Method for Sonar Image Stabilization
In this section, the angular velocity is derived using the motion sensor embedded in the SSS, and the correction algorithm and program development of the distorted sonar are discussed in detail.
3.1. Image Stabilization Concept
The image stabilization method is a combination of a technique for detecting shake and a technique for correcting shake. In general, the primary methods used in the shake detection are an angular velocity sensing method (Electronics Image Stabilization, EIS) and a method of detecting the change in a velocity vector (Digital Image Stabilization, DIS). EIS detects the angular velocity caused by the camera’s shaking with an electric signal [8,9]. The angular velocity sensor detects this rotational angular velocity by using a Coriolis force generated in a mass when an angular velocity vector corresponding to rotational motion is added to the vibrating mass. In order to detect the angular velocity, it is divided into a roll direction component, a pitch direction component, and a yaw direction component. Then the angular velocity sensor synthesizes the three components to calculate the shaking direction and speed [9,10].
The DIS method detects certain shake using only the information of the picture obtained by the image sensor and corrects the picture through an algorithm. This method has an advantage that a sensor for detecting a shake is not required, but it is nearly impossible to detect any the shake on a still image [8,11].
In this study, the roll, pitch, and yaw direction motion components are obtained from the motion sensor, and the method of correcting the shake of the sonar data is used as a post-processing method.
3.2. An Algorithm of Sonar Image Stabilization Using Motion Sensor
In this study, OceanServer Technology’s OS-5000 motion sensor built into the side-scan sonar has been applied, and the specifications of the motion sensor are shown in the Table 3. The motion sensor consists of the STMicroelectronics three-axis acceleration sensor and Honeywell’s three-axis magnetic sensor and the motion sensor outputs both channels.
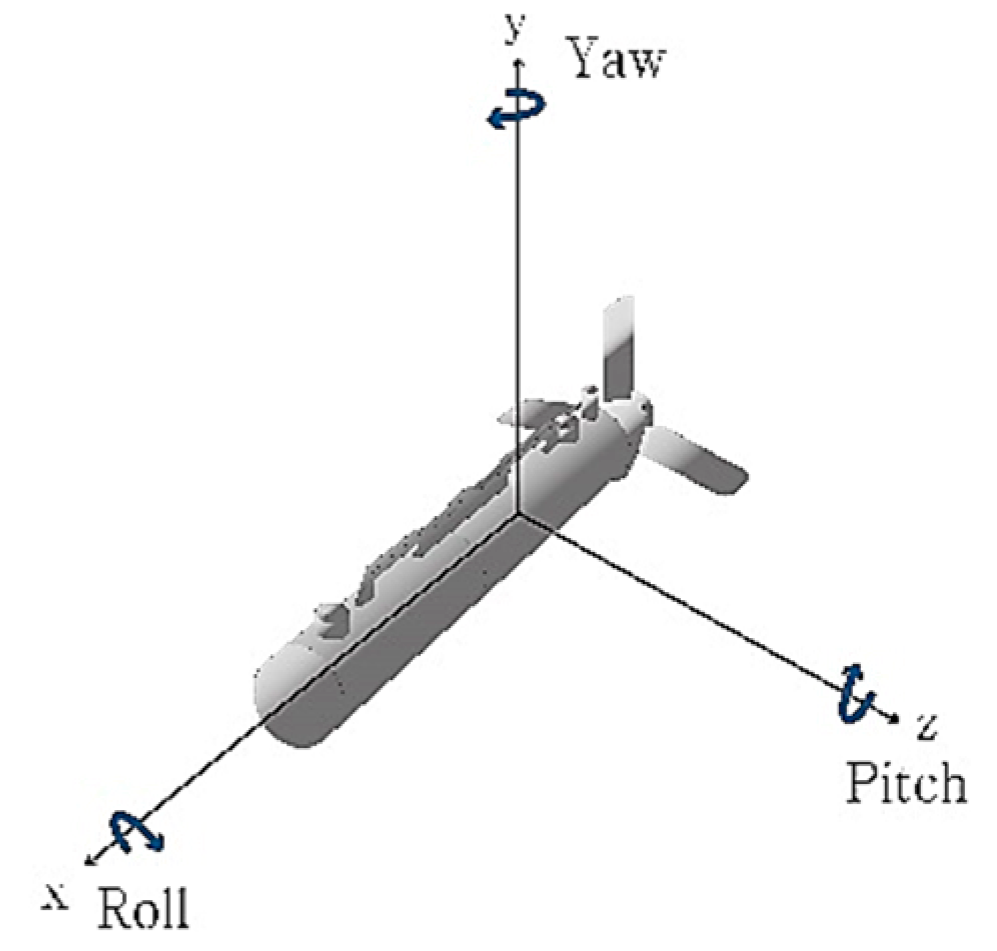
Figure 5 shows direction of roll, pitch, yaw of sonar. The method of obtaining the angle from the acceleration sensor is as follows Equation (2).
In order to find the angular velocity, the scale factor is first obtained. To find the scale factor, subtract the analog to digital converter (ADC) value () of the x-axis from the ADC average value () along the x-axis and divide it by the sensitivity of the x-axis (), as in Equation (2), where is the scale factor of the x-axis. The pitch and roll angles are obtained using the following Equations (3) and (4) after all scale factors are obtained [12]. Where, , , are the rotation angle about each x,y,z-axis.
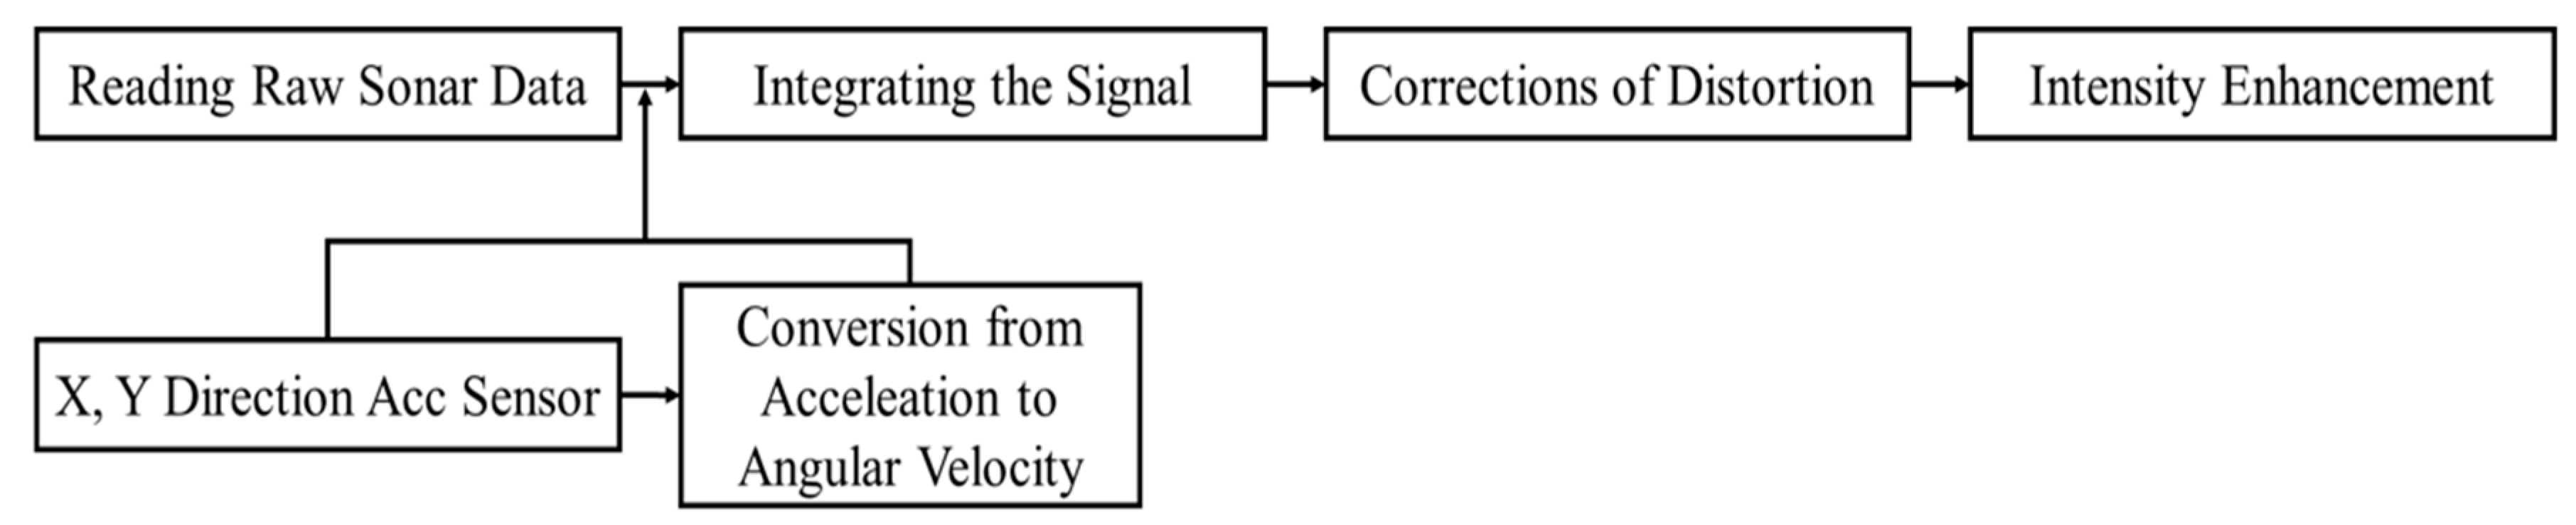
Here, pitch refers to the angle variation of z-axis, and roll refers to the angle variation of the x-axis. The calculated roll and pitch values are obtained by determining the absolute angle of the shake, which serves to correct the calculated shake amount. A block diagram of the algorithm of the sonar image stabilization in the USV is illustrated in Figure 6. For sonar image stabilization, raw sonar data stored through side-scan sonar operation is read. Likewise, it converts the data from the acceleration sensor of the motion sensor stored during operation of the sonar into angular velocity. Then, the sonar data and the converted angular velocity are integrated. The raw ping value of sonar data is compensated according to the angular velocity change. Moreover, it is saved separately after image correction, according to the change of roll.
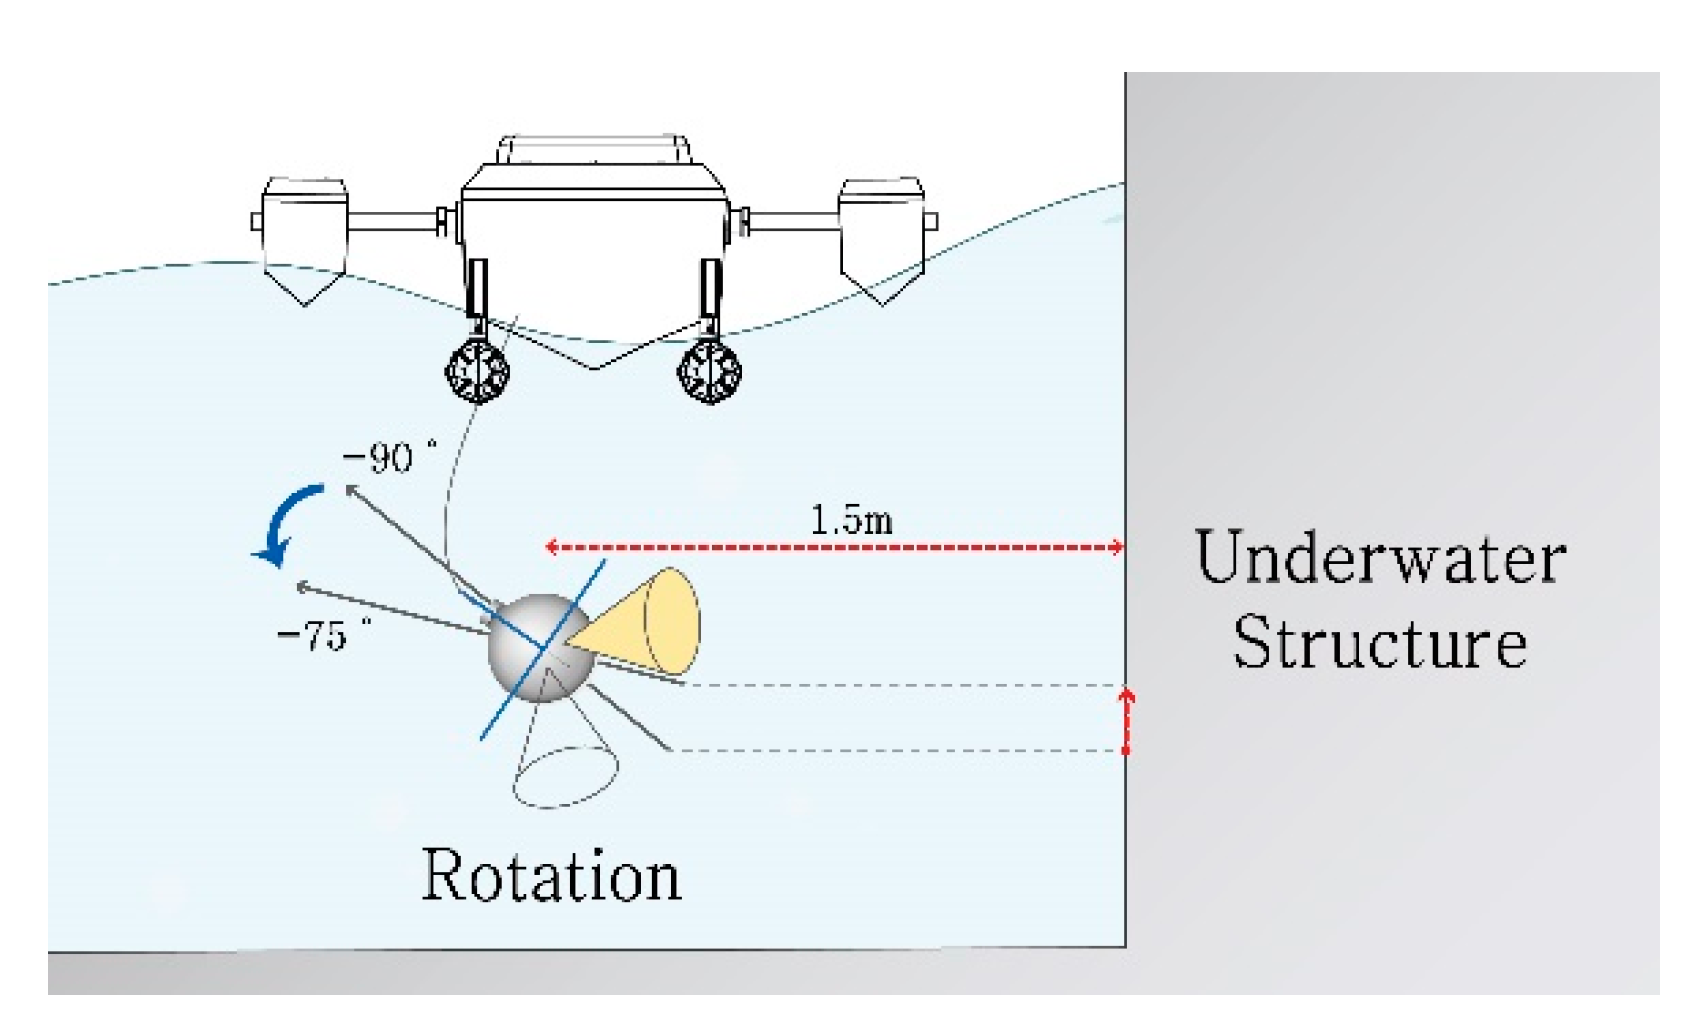
Generally, the sonar is mounted on the USV to acquire two-dimensional space (2D) images along the direction of the boat [13]. The SSS developed has two transducers in both sides. Usually only one-side transducer is used when scanning underwater structures as follow Figure 7. The developed sonar can rotate the range of the roll 360° using the electric jig (electric motor) [1]. When the roll rotation of sonar is −80° to −99.9°, +100° to +104° in the left side transducer, the USV is scanning the underwater structure.
For reference, because sonar radiation pattern is not emitted in a regular shape, there may be a difference in sonar data quality depending on the contact surface of the emitted beam [14]. Therefore, when operating the sonar mounted on the boat, the resolution of the sonar data can be varied according to the influencing factors, such as the survey angle, the distance to the structure, and the depth of the water [1]. Here, the information on the distance to the structure is indicated in the operating program by GPS information and sound wave signals of the sonar. Through the previous study, the proper distance between the structure and the sonar is about 1~2 m. Google Maps is less precise than RTK GPS. Therefore, in case of close-up investigation, it was changed to manual operation in case of an accident.
Through the sonar image stabilization algorithm, the number of samples of sonar data that can be corrected was obtained. When sonar data is acquired, the raw ping is saved in the original file. Moreover, it is saved separately after image correction according to the change of roll. If the distance is 1.5 m between the underwater structure and the sonar, the reference angle is −90° to the left, the resolution is 2 cm, and the roll is −75°. At this time, the correction distance of the roll is ±40.2 cm by ±150 × tan 15°. Since the resolution is 2 cm, the number of corrected samples of the roll is 20.1 by ±40.2 cm ÷ 2.
3.3. The Sonar Image Stabilization Program
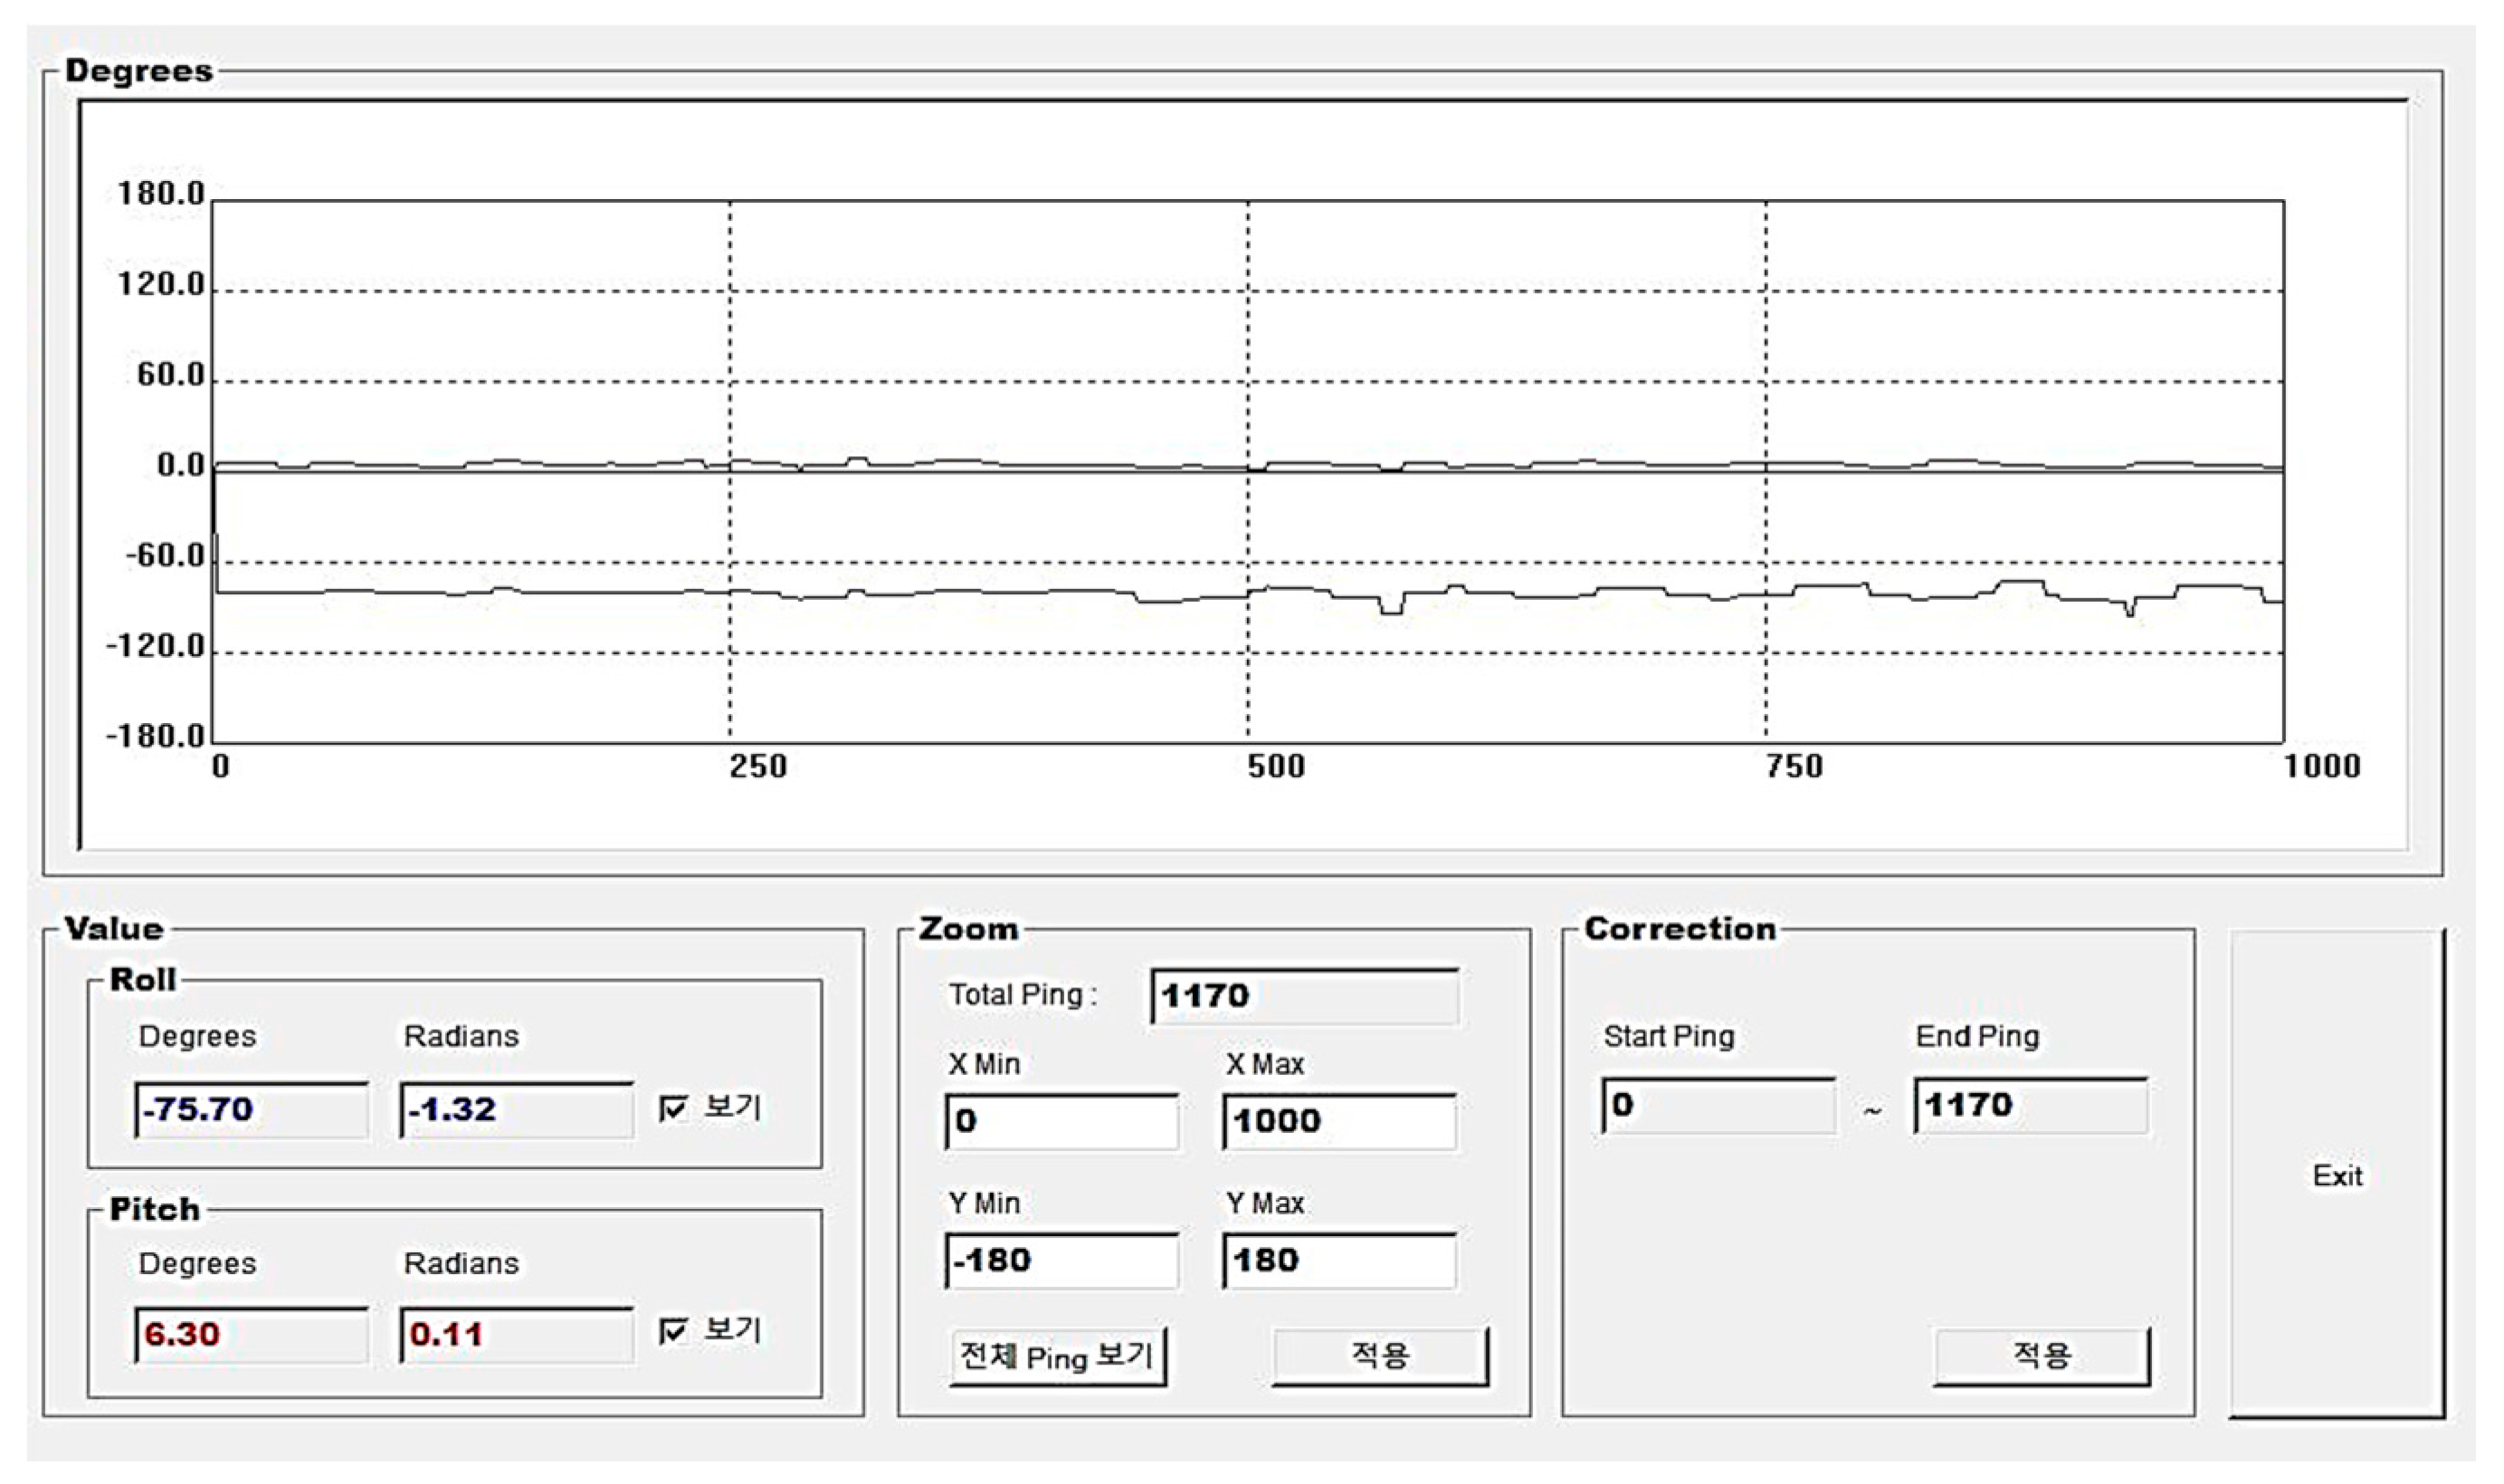
As shown in Figure 8, it is the program developed for the sonar image stabilization. The roll and pitch values calculated by the motion sensor are expressed in the sonar ping unit. In the value box, it can check the change of roll and pitch in angle and radian values. In the zoom box, it can adjust the scale of the graph in ping units. In the correction box, it can also correct the sonar image in ping units. In the graph, the blue color represents the change of the roll. Because of the characteristic of the USV, the change amount of the roll more greatly affects the distortion of the underwater structure damage than the change of the pitch, so the change of the roll is used to conduct the image stabilization.
4. Verification through Field Test
Field test was conducted on the developed sonar image stabilization method. In this section, the analysis of the field test method and results are discussed in detail.
4.1. Field Test
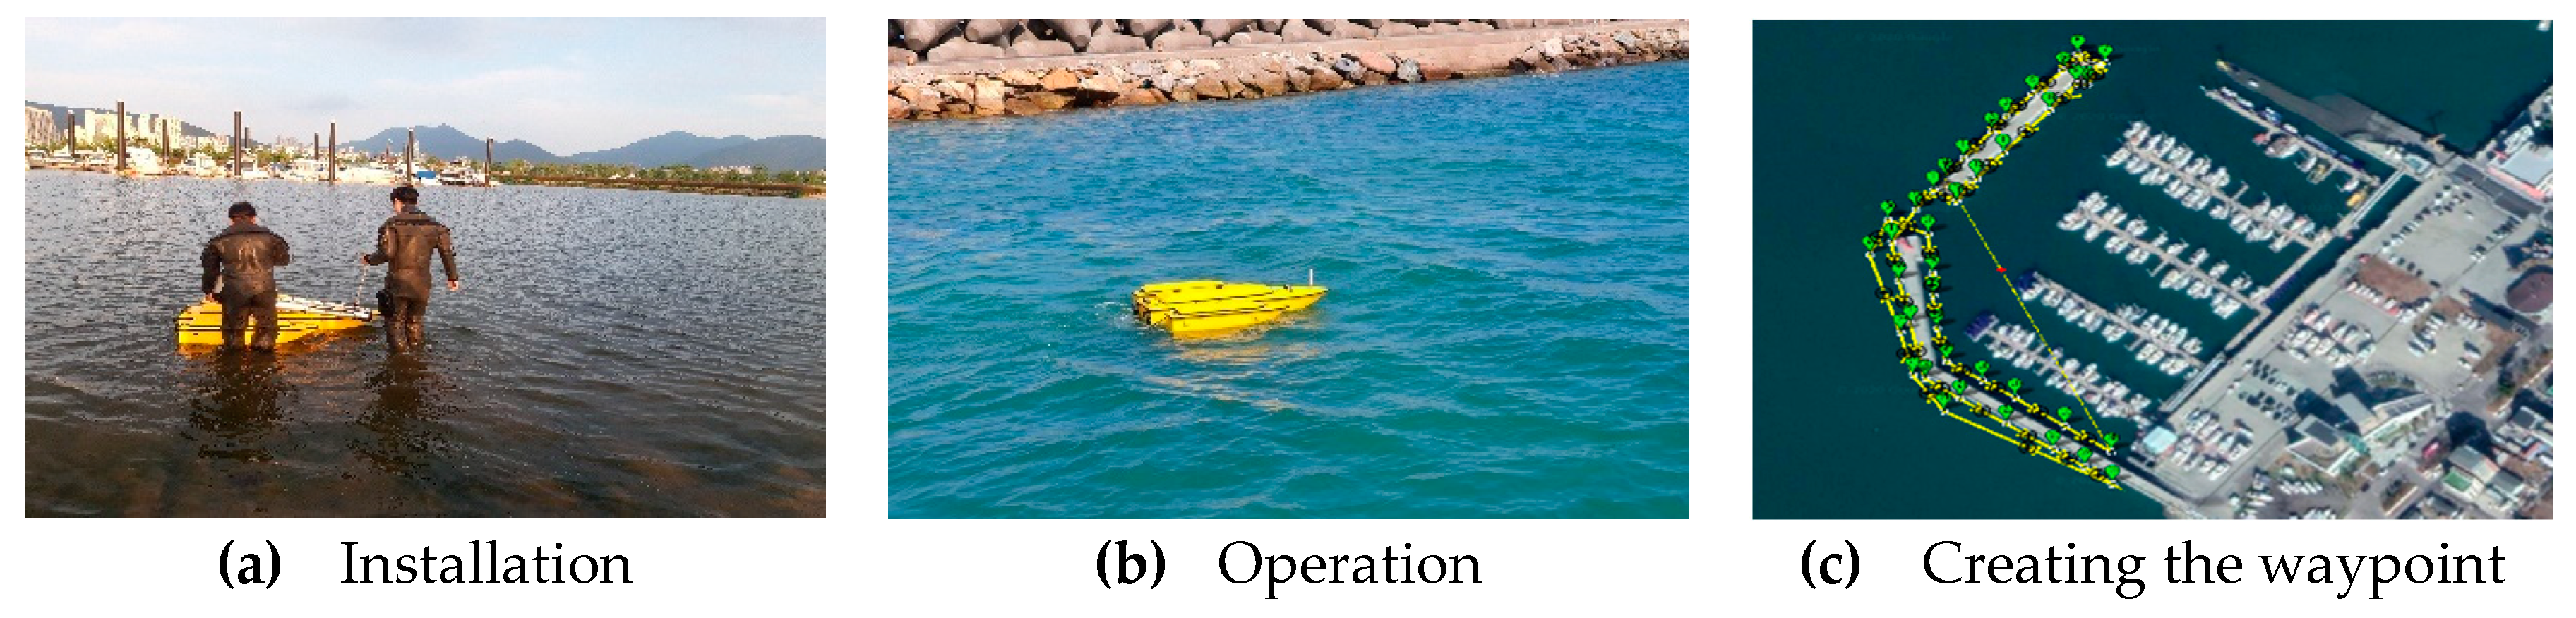
To verify the developed USV sonar for the inspection of underwater structures and the sonar image stabilization, a gravity-type quay wall was surveyed. Surveying was conducted by setting the USV afloat, connecting the sonar to the USV, setting the boundary of the structure to be investigated in GCS, creating a waypoint, setting up the velocity of USV. The execution process was controlled through GCS as automatic navigation as follows Figure 9.
The acquired sonar data was distorted by waves and swells, and the before and after sonar image stabilization results were compared with the actual damage. A total of 30 samples data of 1250 kHz and 2 MHz sonar data were acquired and analyzed and compared with the actual data measured by the diver in the underwater structure. From the acquired sonar data, the error rate of the before and after image stabilization data based on the actual data of damage measured by the diver was compared.
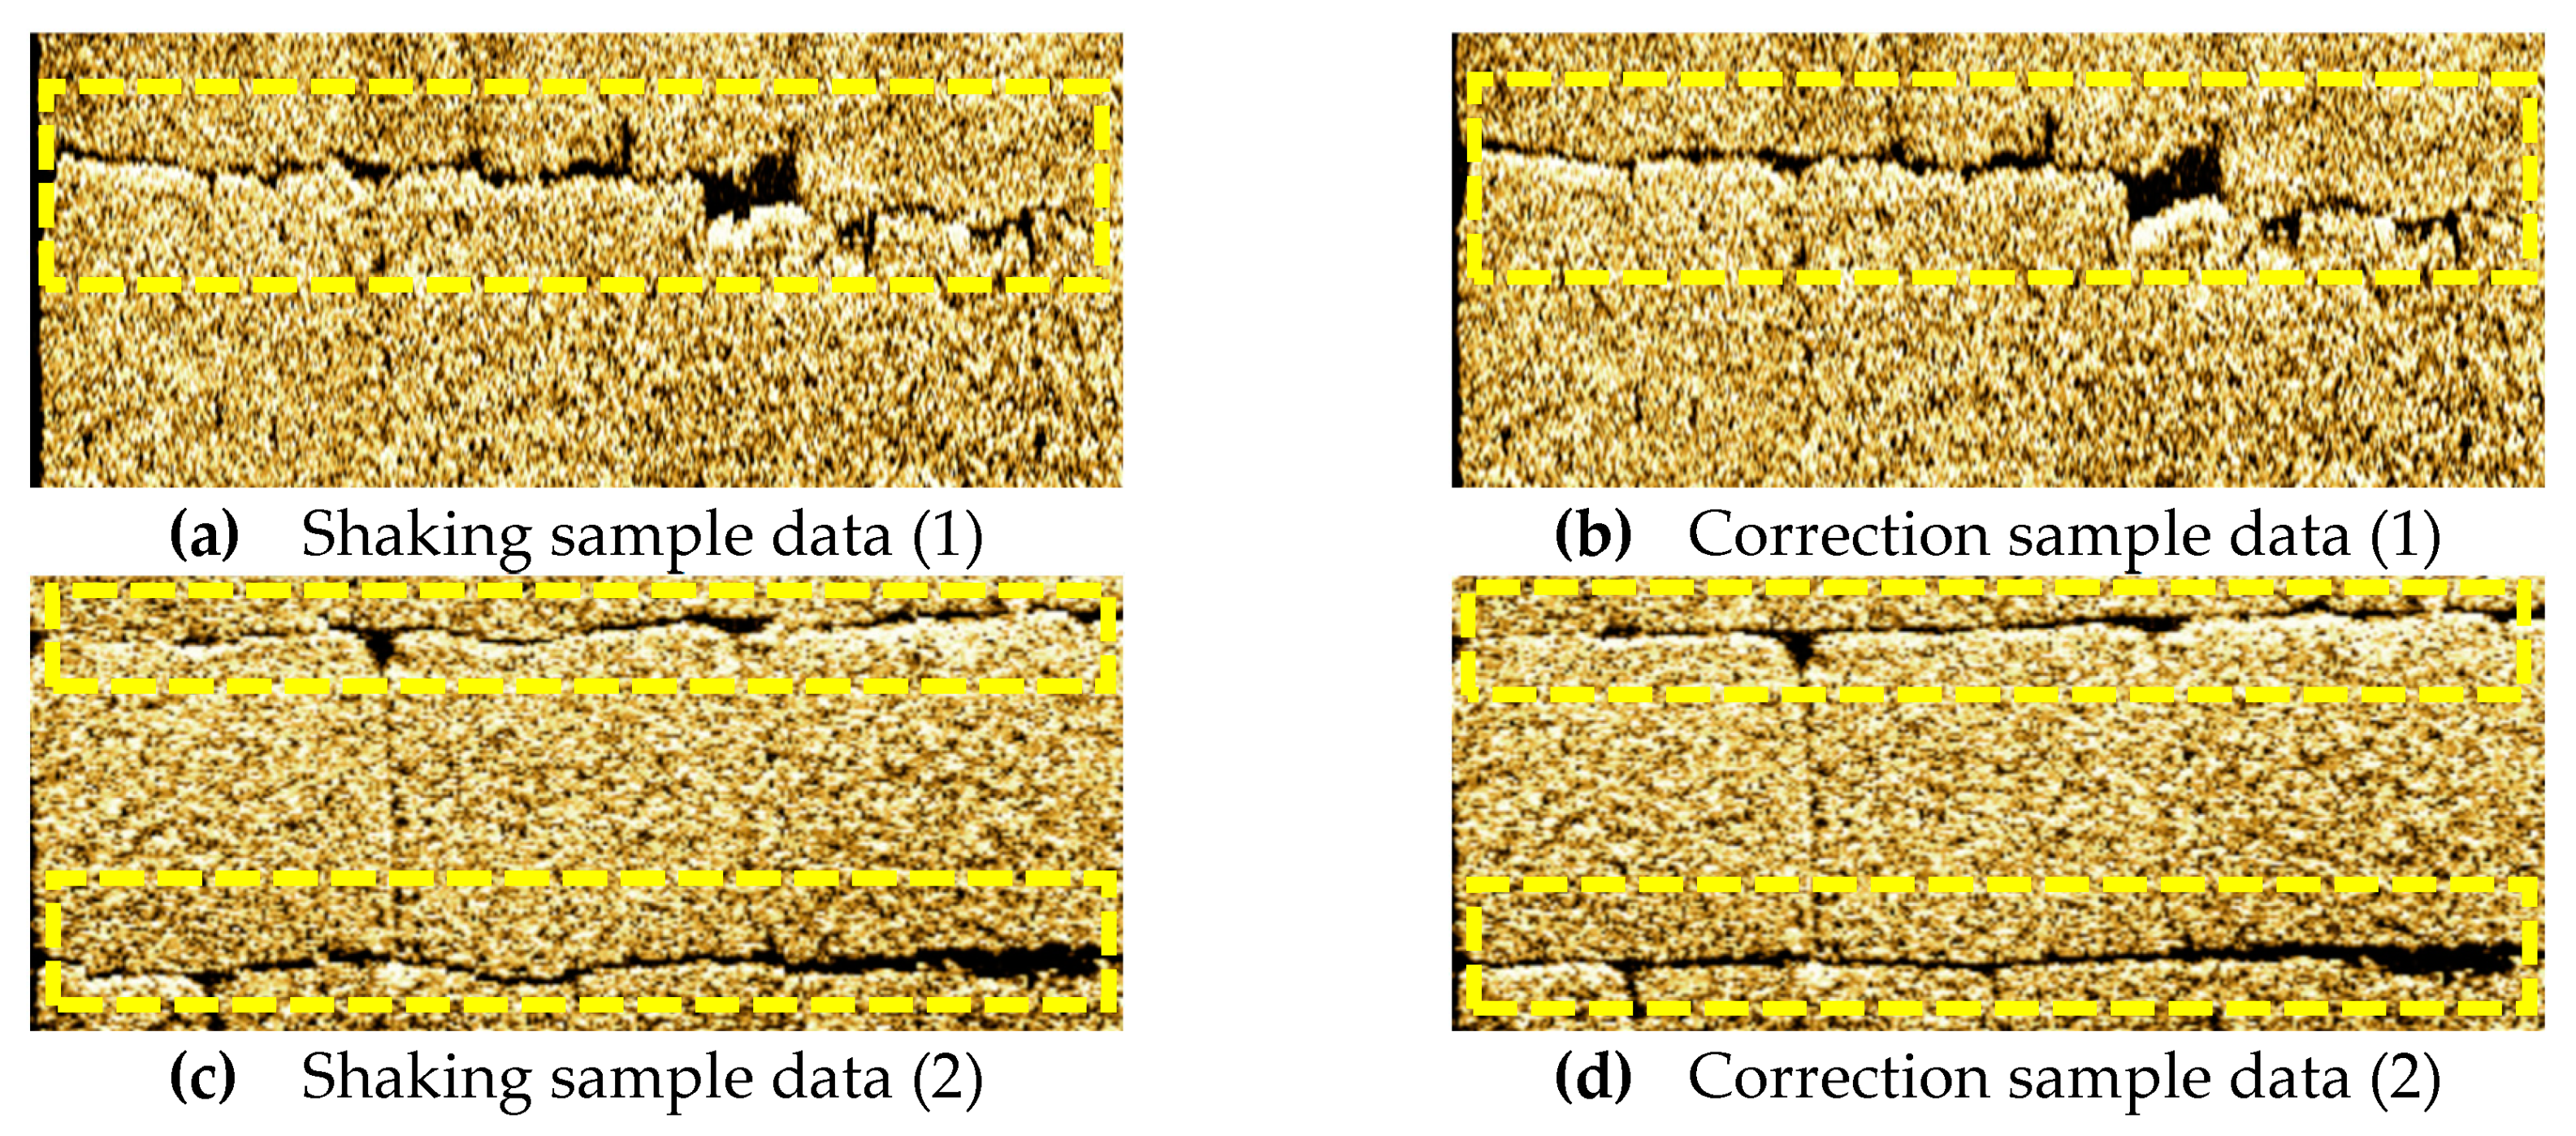
As shown in Figure 10, the shaking data obtained in the field test and the correction data using the sonar image stabilization program were compared. As in the yellow box, the block layer line is deformed by shaking in (a),(c) and the correction data can confirm that the block layer line is linearly corrected in (b),(d).
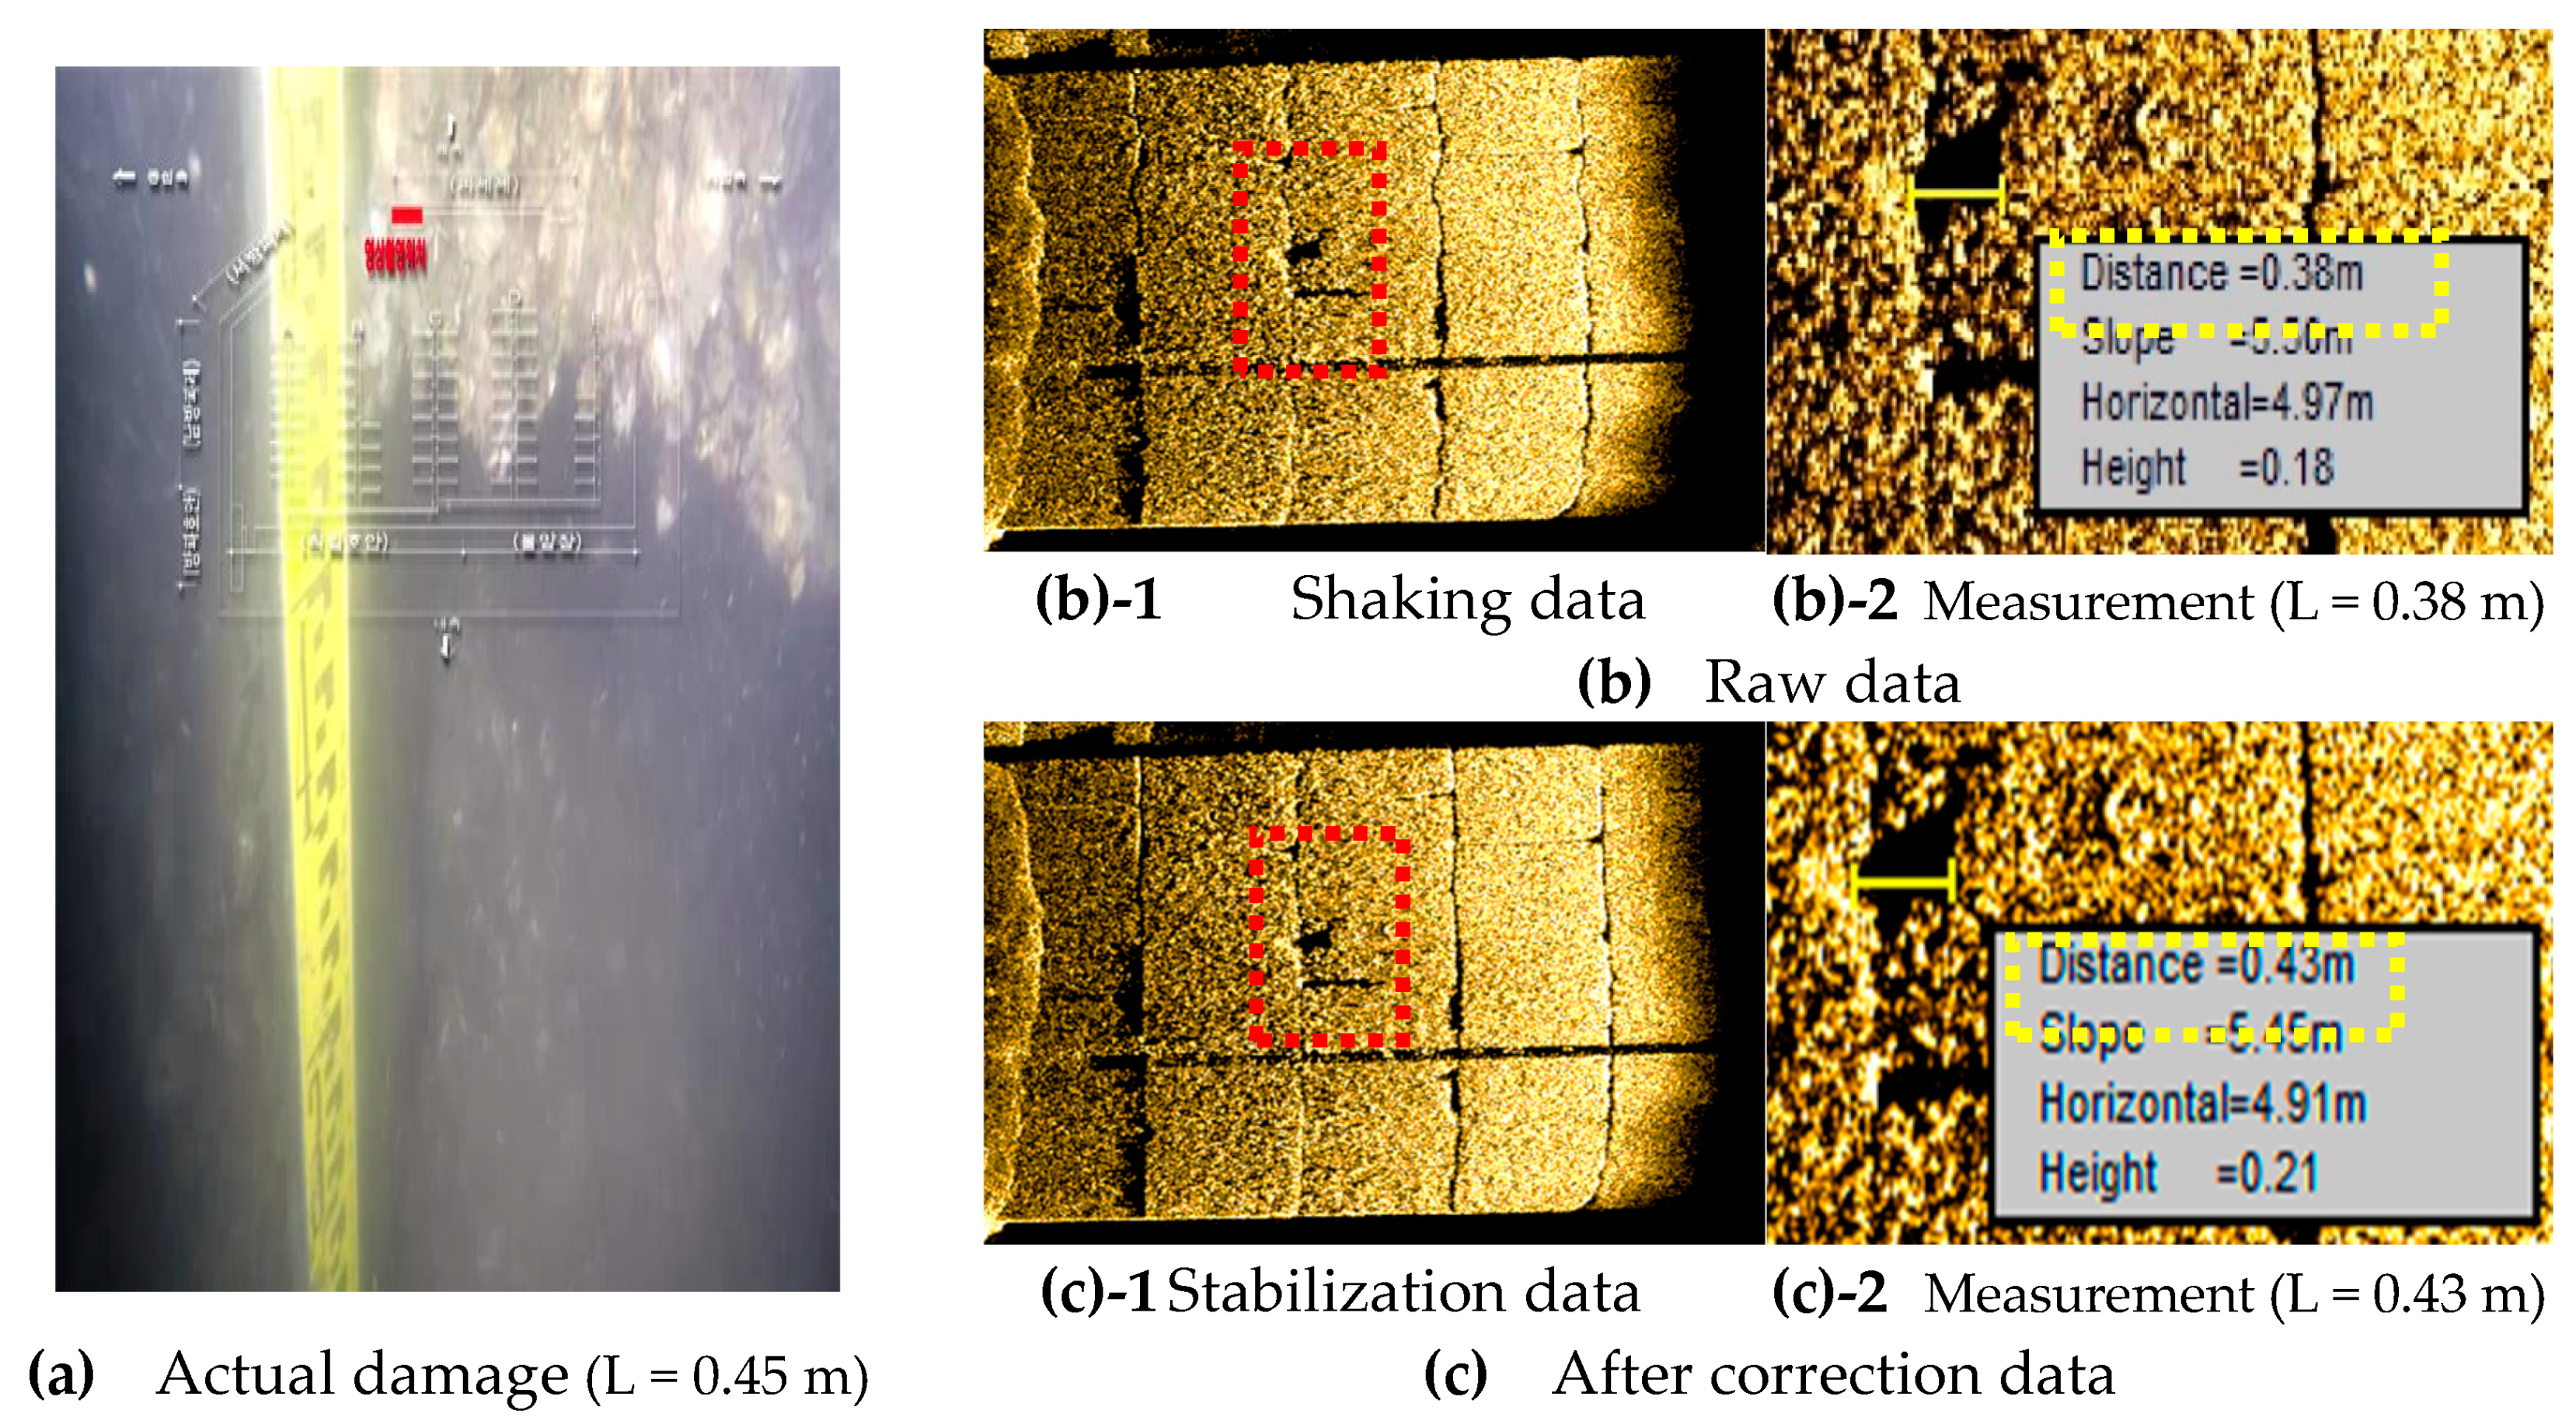
The distortion of the raw sonar data was corrected using the sonar image stabilization program as above, and the error rate was compared the actual to the sonar data of before and after correction. As shown in Figure 11, it is the comparison of 1250 kHz sonar’s raw data and after correction data. The red box shows that the block line has been stabilized, and the size of the damage has been corrected. Moreover, the yellow box means the distance measured. Here, the slope is from the towfish to final point and the horizontal is distance from the towfish, and height is the shadow length of target. When we detect and measure the damage of underwater structure, we can use “distance” as the performance measure of the sonar image stabilization.
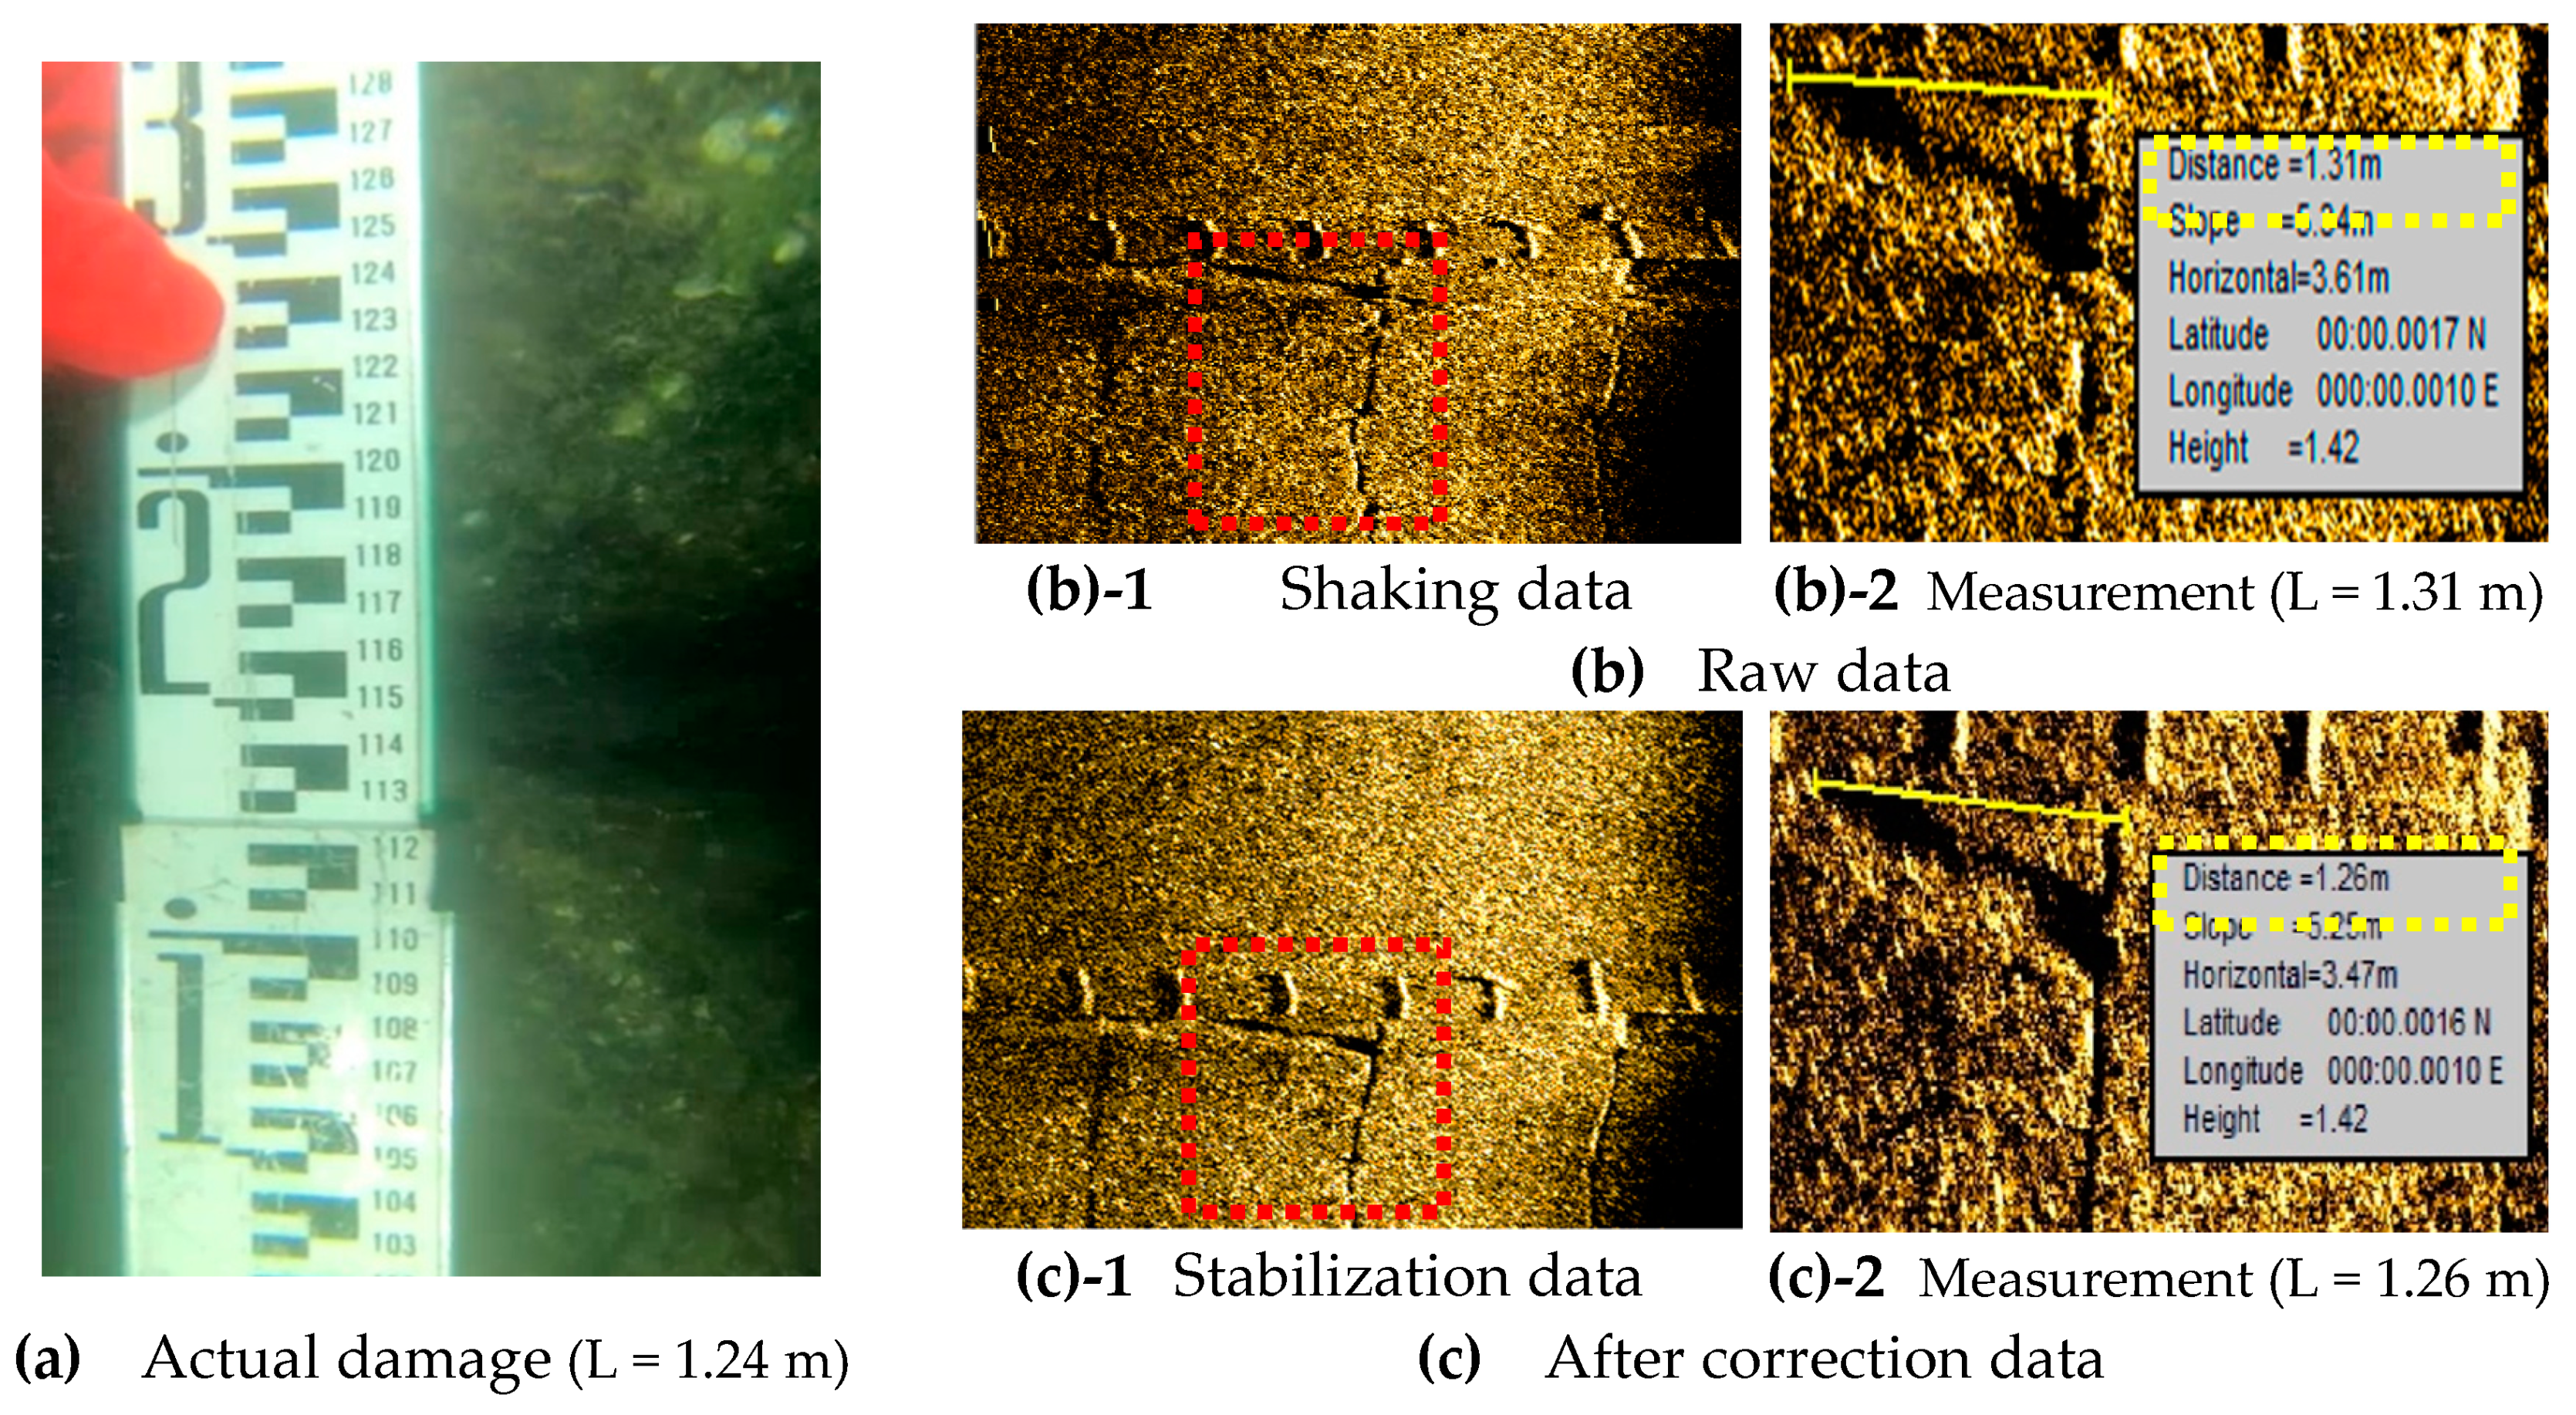
As shown in Figure 12, before and after correction for the 2 MHz sonar data was similarly compared. Moreover, 2 MHz has better resolution than 1250 kHz, but has a smaller scan range.
4.2. Results of the Field Test
The error rates of the change in amount of the roll for each sonar frequency are shown in the graphs as follows Figure 13. Here, the red circle means error rate of after-correction, the blue circle means error rate of before-correction and the gray bar means variance of roll. Each of the 30 samples of 1250 kHz and 2 MHz sonar were acquired and corrected for the changes in the roll. As a result, for the 1250 kHz band, the average absolute error rate of the data was reduced from 21.58% to 5.84% after correction for the change in the roll from −6.5° to 6.4°. For 2 MHz, the average absolute error rate of the data was reduced from 18.91% to 3.91% after correction for a change of roll in a 9.5° to 13.8° range. In the error rate, the minus (−) means that the damage size in sonar data is bigger than the actual damage size, and the average ratio of error is averaged as an absolute value.
Due to the wave properties of the sonar, the higher the frequency, the better the resolution [15]. Therefore, the raw data error rate of 2 MHz is lower, even though the change in the amount of roll in the 2 MHz band was larger than in the 1250 kHz band. However, the total reduction of error rate after correction for both bands was similarly decreased by an average of about 15%.
5. Discussion and Conclusions
A sonar image stabilization technique has been developed and applied to correct the distorted sonar image generated by the influence of the waves. This was developed by focusing on the image stabilization in camera that is generally used.
The experiment was conducted by comparing the errors, according to the frequency specification of the sonar. The resolution of the sonar data can be varied according to the influencing factors, such as the beam angle, the distance to the structure, and the depth of the water [4]. It also might need to be considered about specifying the level of precision of GPS or motion sensor and in which percentage this error could affect the measurements. Therefore, in the future, it is necessary to find an optimal operation plan by experimenting with various variables in order to improve the resolution of the USV sonar and to verify the error rate according to the specification of the GPS and motion sensor. Moreover, in this field test, to detect damage on underwater structure, we determined whether the structure is damaged or not using sonar image, and measured its size. To reduce the error, the average value is used after several measurements. Here, because manual clicking and detecting may make some errors, after building a lot of data, additional research is needed on automatic damage detection through machine learning. Moreover, the developed equipment has been tested only in one location and the gravity-type quay wall. In the future, it is necessary to verify various areas and various underwater structures. Furthermore, it is necessary to compare the applicability of image stabilization compared to other types of sonar such as MBES, imaging sonar.
This study developed the USV and sonar equipment for an unmanned underwater survey system. Because of the smaller dimensions and mass of the USV, it is more affected by waves than a common boat. Therefore, this study analyzed improvement in sonar data reliability and accuracy through the development of an image stabilization and post-processing program to correct for shaking when operating the side scan sonar towed under the USV.
We have verified the effectiveness of the developed sonar image stabilization methods confirmed the reliability of the proposed methods for the correction of the distorted sonar data through comparing the actual to the sonar data of before and after correction in the gravity-type quay wall. As a result of correcting each of the 30 samples of 1250 kHz and 2 MHz sonar, the average ratio of error has been decreased about 15%. As a result, the damage of underwater structures can be detected more precisely, and the utilization of the unmanned underwater structure inspection system can be increased.
It is expected that the underwater survey using an unmanned underwater equipment could replace the existing method such as diver survey. This overall approach is expected to be used as a basic data-gather system for future use of an unmanned underwater survey system for inspection of underwater infrastructure.
Author Contributions
Conceptualization, Y.K.; methodology, Y.K.; formal analysis, Y.K.; investigation, Y.K.; data curation, Y.K.; writing—original draft preparation, Y.K.; writing—review and editing and supervision, J.R. All authors have read and agreed to the published version of the manuscript.
Funding
This research was supported by Disaster Safety Industry Development Project through the National Disaster Management Research Institute (NDMI) funded by the Ministry of the Interior and Safety, Republic of Korea (No. 2019-MOIS32-020-01010000-2020).
Acknowledgments
The authors are thankful for the valuable suggestions given the National Disaster Management Research Institute (NDMI).
Conflicts of Interest
The authors have no conflicts of interest to declare.
References
- Park, C.; Kim, Y.; Lee, H.; Choi, S.; Jung, H. Development of a 2 MHz sonar sensor for inspection of bridge substructures. Sensors 2018, 18, 1222. [Google Scholar] [CrossRef] [PubMed] [Green Version]
- Chandran, V.; Elgar, S.; Nguyen, A. Detection of mines in acoustic images using higher order spectral features. IEEE J. Ocean. Eng. 2002, 27, 610–618. [Google Scholar] [CrossRef]
- Ollivier, F.; Cervenka, P.; Alais, P. Side scan sonar using phased arrays for high resolution imaging and wide swath bathymetry. IEE Proc. Radar Sonar Navig. 1996, 143, 163. [Google Scholar] [CrossRef]
- Kim, Y.; Lee, H.; Park, C.; Choi, S. A study for optimum survey method of underwater structure using the dual sonar sensor. J. Sens. 2017, 2017, 9206898. [Google Scholar] [CrossRef]
- Seo, J. Current status and prospects of underwater robot industry. Korea Inst. Robot Ind. Adv. 2014, 2. Available online: https://www.kiria.org/portal/reference/portalRefTrendList.do#link (accessed on 10 April 2014).
- Andziulis, A.; Lenkauskas, T.; Eglynas, T.; Voznak, M.; Jakovlev, S. Investigation of SONAR stabilization method for improved seafloor image quality. Geoinformatics Intell. Transp. 2015, 1–6. Available online: https://link.springer.com/chapter/10.1007/978-3-319-11463-7_1 (accessed on 21 October 2020).
- Klaucke, I. Sidescan Sonar. In Submarine Geomorphology; Springer International Publishing: Cham, Switzerland, 2018. [Google Scholar]
- Heo, J.H.; Kim, J.H.; Lee, D.-H.; Kim, Y.H.; Cho, J.D. Real-time digital image stabilization using motion sensors for search range reduction. Inst. Electr. Electr. Eng. 2012, 363–366. [Google Scholar] [CrossRef]
- Cheng, X.; Hao, Q.; Xie, M. A comprehensive motion estimation technique for the improvement of EIS methods based on the SURF algorithm and kalman filter. Sensors 2016, 16, 486. [Google Scholar] [CrossRef] [PubMed] [Green Version]
- Oh, J.-S.; Sim, K.-B. Digital image stabilization technique of robot using motion sensor. J. Korean Inst. Intell. Syst. 2009, 19, 317–322. [Google Scholar] [CrossRef]
- Park, H.C.; Hwang, C.S. Motion compensation by affine transform using edge information of image. J. Korean Inst. Commun. Inf. Sci. 1999, 24, 297–305. [Google Scholar]
- Fang, L.; Xiaozhen, Q. An electronic image stabilization algorithm based on efficient block matching on the bitplane. Open J. Appl. Sci. 2013, 3, 1–5. [Google Scholar] [CrossRef] [Green Version]
- Ho, H.N.; Lee, J.J.; Park, C.; Jo, B.W. An efficient image enhancement algorithm for sonar sensor data. Int. J. Latest Res. Sci. Technol. 2013, 2, 38–43. [Google Scholar]
- Yi, J.H.; Kim, Y.S.; Park, C.; Choi, S.S.; Lee, H.S. A study of data management methods through shake correction of underwater investigation using high resolution side scan SONAR. J. Korea Inst. Struct. Maint. Insp. 2017, 21, 94–100. [Google Scholar]
- Kye, J.E.; Cho, J.I.; Yoo, W.P.; Choi, S.L.; Park, J.H. Trends and applications on multi-beam side scan sonar sensor technol. Electron. Telecommun. Trends 2013, 28, 167–169. [Google Scholar]
Figure 1.
Concept of the ground control system (GCS) for the Unmanned Surface Vehicle (USV).

Figure 2.
Design and Production of the USV.

Figure 3.
Operation of the USV + sonar.

Figure 4.
Structure of the eXtended Triton Format (XTF) file.

Figure 5.
Direction of roll, pitch, yaw.

Figure 6.
The algorithm for sonar image stabilization.

Figure 7.
Sonar rotation to scan underwater structures.

Figure 8.
The sonar image stabilization program.

Figure 9.
Conditions of the field test

Figure 10.
Comparison of shaking data and after correction data.

Figure 11.
Comparison of 1250 kHz sonar’s raw data and after correction data.

Figure 12.
Comparison of 2 MHz sonar’s raw data and after correction data.

Figure 13.
The error rate of 1250 kHz and 2 MHz sonar by Image Stabilization.


Table 1.
Specification of USV.
| Material | Fiberglass Reinforced Plastic, Carbon Pipe, Aluminum Jig |
| Body Size | 1700 × 1060 × 410 (L × W × H/mm) |
| Weight | Approx. 15 kgf |
| Max Front Thrust | 18.4 kgf |
| Power | 24VDC Battery, 50 Ah |
| Motor Type | Brushless, 24VDC |
| Max Power | 980 W |
Table 2.
Specification of the sonar developed.
| Material | SUS 316, Aluminum 6061, Acetal Resin |
| Sonar Frequency | 1250 kHz, 2 MHz |
| Across- track Resolution | 1250 kHz: 3 cm, 2 MHz: 0.8 cm |
| Weight | 16.1 kgf (in the air), 9.6 kgf (in the water) |
| Beam tilt | 20° |
| Motor rotation | 360° |
| Towing Speed | 1~8 knot (0.51~4.1 m/sec) |
Table 3.
Specifications of OS-5000.
 | Azimuth accuracy | <0.5°, 0.1° resolution |
| Inclination accuracy | Typical 1° accuracy <±30° tilt | |
| Inclination range | ±80° | |
| Temperature range | Accuracy specified for 0 °C to 50 °C, −40 °C to +85 °C | |
| Shock (Operating) | 3000 G, 0.5 ms, 10,000 G 0.1 ms | |
| Data Refresh Rate | 0.01 Hz to 40Hz sentence output rate |
Publisher’s Note: MDPI stays neutral with regard to jurisdictional claims in published maps and institutional affiliations. |
© 2020 by the authors. Licensee MDPI, Basel, Switzerland. This article is an open access article distributed under the terms and conditions of the Creative Commons Attribution (CC BY) license (http://creativecommons.org/licenses/by/4.0/).
Share and Cite
MDPI and ACS Style
Kim, Y.; Ryou, J. A Study of Sonar Image Stabilization of Unmanned Surface Vehicle Based on Motion Sensor for Inspection of Underwater Infrastructure. Remote Sens. 2020, 12, 3481. https://doi.org/10.3390/rs12213481
AMA Style
Kim Y, Ryou J. A Study of Sonar Image Stabilization of Unmanned Surface Vehicle Based on Motion Sensor for Inspection of Underwater Infrastructure. Remote Sensing. 2020; 12(21):3481. https://doi.org/10.3390/rs12213481
Chicago/Turabian StyleKim, Youngseok, and Jaesuk Ryou. 2020. "A Study of Sonar Image Stabilization of Unmanned Surface Vehicle Based on Motion Sensor for Inspection of Underwater Infrastructure" Remote Sensing 12, no. 21: 3481. https://doi.org/10.3390/rs12213481
Note that from the first issue of 2016, this journal uses article numbers instead of page numbers. See further details here.