Review

A Review of Advanced Technologies and Development for Hyperspectral-Based Plant Disease Detection in the Past Three Decades

1
Key Laboratory of Quantitative Remote Sensing in Agriculture of Ministry of Agriculture, Beijing Research Center for Information Technology in Agriculture, Beijing 100097, China
2
Agricultural Information Institute, Chinese Academy of Agricultural Sciences, Beijing 100081, China
3
National Engineering Research Center for Information Technology in Agriculture, Beijing 100097, China
4
Beijing Engineering Research Center for Agriculture Internet of Things, Beijing 100097, China
5
Key Laboratory of Agri-informatic, Ministry of Agriculture, Beijing 100097, China
6
Beijing Research Center of Intelligent Equipment for Agriculture, Beijing 100097, China
7
National Research Center of Intelligent Equipment for Agriculture, Beijing 100097, China
*
Author to whom correspondence should be addressed.
Remote Sens. 2020, 12(19), 3188; https://doi.org/10.3390/rs12193188
Submission received: 28 July 2020 / Revised: 17 September 2020 / Accepted: 28 September 2020 / Published: 29 September 2020
(This article belongs to the Special Issue Remote Sensing and Decision Support for Precision Orchard Production)

Abstract

:
The detection, quantification, diagnosis, and identification of plant diseases is particularly crucial for precision agriculture. Recently, traditional visual assessment technology has not been able to meet the needs of precision agricultural informatization development, and hyperspectral technology, as a typical type of non-invasive technology, has received increasing attention. On the basis of simply describing the types of pathogens and host–pathogen interaction processes, this review expounds the great advantages of hyperspectral technologies in plant disease detection. Then, in the process of describing the hyperspectral disease analysis steps, the articles, algorithms, and methods from disease detection to qualitative and quantitative evaluation are mainly summarizing. Additionally, according to the discussion of the current major problems in plant disease detection with hyperspectral technologies, we propose that different pathogens’ identification, biotic and abiotic stresses discrimination, plant disease early warning, and satellite-based hyperspectral technology are the primary challenges and pave the way for a targeted response.

Graphical Abstract

1. Background

With the changes in world climate and the accelerated development of global trade, the distributions, host ranges, and impacts of plant diseases have expanded continuously, and many of these diseases can still spread or break out after having been under control. In Bangladesh in 2016, the outbreak of wheat blast caused total crop failure with an impact range reaching nearly 15,000 ha [1]. In addition, the report of the Food and Agriculture Organization of United Nations (FAO) shows that the occurrence of only Xylella fastidiosa could cost nearly $104 million a year in wine losses in California alone [2]. Hence, plant diseases are now among the most basic, important, and noteworthy issues in agriculture management.
Whilst the economic losses caused by plant diseases are on the one hand, on the other hand, considering population and food imbalance, it is more serious that the diseases cause food losses. FAO statistics show that to fulfill the food requirements of 9.1 billion population by 2050, a 70% steady increase in agricultural production is needed [3]. However, between 20% and 40% of global crops have been lost annually to pests and diseases in the last 45 years. Furthermore, according to Carvajal-Yepes et al. [4], the average worldwide yield losses caused by pests and diseases in wheat, rich, maize, potatoes, and soybeans are estimated to be 21.5%, 30.0%, 22.6%, 17.2%, and 21.4%, respectively. In addition, diseases spread to large areas upon infection and cause large-scale production reduction, also resulting in a decrease in the quality of agricultural products or even endangering life. Fusarium head blight (FHB) is a prominent example. From 1998 to 2000 alone, the cumulative direct and secondary economic losses from FHB in primary food crops were estimated to be $2.67 billion [5]. In addition, once a plant disease breaks out on a large scale, the damage to the environment is considerable. According to FAO statistics, the consumption of pesticides increased from 3.05 million tonnes in 2000 to 4.09 million tonnes in 2016. Plant diseases are considered as risks because they constantly contribute to significant yield, economic, and environment losses worldwide [6]. Therefore, the early and accurate detection, monitoring, and assessment of plant diseases is important and necessary for farmers, managers, and decision makers.
Artificial visible investigation, as the most basic direct method in practice, is still being used. However, this approach requires professional knowledge of the relevant plant phenotype and plant pathology. Another mainstream, direct plant disease detection technique can be called the biological molecular method [7,8,9]. Biological molecular techniques require detailed sampling and have complex processing methods. Compared with artificial investigation methods, these approaches are more professional and cyclical. These two techniques are basic, significant, efficient and always involve the use of manual plant disease monitoring and detection methods. The processes of all of these manual methods are expensive, time-consuming, and labor-intensive [10]. These shortcomings limit the development and application of artificial methods in large-scale farms. In particular, it is necessary to note that these direct plant disease detection methods are usually performed in the middle to later stages of the infection, of which visible symptoms are typically manifest [11]. In the environment of modern facility agriculture and precision agriculture, the demand for real-time and large-scale detection of plant diseases is becoming increasingly prominent. This time-lag is inevitable and not conducive to early detection.
In the last decade, a number of non-invasive techniques have been developed, which are sensitive, consistent, standard, high throughput, rapid, and cost-effective [11]. Spectroscopy-based, imaging-based, and relevant remote sensing (RS) methods provide reliable and precise technical support for real-time and large-scale plant disease detection and monitoring. There are some links among these non-invasive approaches, which exist side by side and interact. The International Standards Committee has formally accepted methods developed using spectroscopy [12]. The commonly used spectroscopy techniques in plant diseases are mainly focused on visible–near infrared (VIS–NIR), electric impedance, and fluorescence spectroscopy [12,13,14,15]. Thus, imaging-based and RS techniques have attracted considerable attention because they can provide accurate geographic information [10]. Many different imaging sensors, such as digital [16,17], fluorescence [18], thermal [19,20], and multispectral or hyperspectral sensors [21,22,23] have been studied for the detection of symptomatic and asymptomatic plant diseases [8]. The applications of these techniques have been steadily developing from sensor development, image acquisition, and system construction to image segmentation and classification algorithm analysis [24,25].
Hyperspectral technology can sometimes be considered as a part of spectroscopy. The electromagnetic spectrum ranges of hyperspectral sensors mainly concentrate on VIS–NIR (400–1000 nm) and sometimes contain a short wave infrared range (SWIR, 1000–2500 nm). These sensors could acquire spectral information from hundreds of narrow spectral bands [26]. These narrow wavebands have high sensitivity to the subtle plant changes caused by diseases and make it possible to distinguish different disease types and perform early asymptomatic detection. Among many non-invasive plant disease monitoring methods, including both hyperspectral non-imaging and imaging techniques, hyperspectral RS has developed rapidly and has outstanding effects in agriculture research [27]. Except for the common advantages of non-invasive RS techniques, hyperspectral imaging can be implemented in automated systems as an objective method, resulting in a considerably reduced workload [24,28,29]. The applications have been classified from the level of satellite images to the macroscopic or molecular level. It can be seen that hyperspectral technologies have exhibited superiority in plant disease monitoring.
According to the Web of Science statistics, there are 651 relevant papers from 1990 to 2019 when “plant disease” and “hyperspectral” are used as the key words to search for in “all databases.” After screening and statistical analysis, Figure 1 shows that the number of plant disease research articles with hyperspectral techniques has risen sharply in the last 20 years (there were no articles before 2002). However, there are only 35 reviews. Bock et al. [23] first provided a statistical overview of the common disease severity assessment error sources and traditional visual assessment methods. Then, the authors described in detail two non-invasive disease severity assessment techniques—digital imaging and hyperspectral imaging—from their history, principles, and sensors to their data analysis processes, algorithms, and application directions. Finally, the advantages and disadvantages of these techniques were summarized. All of the analyses in this review are comprehensive. Unlike the research of Bock et al. [30], the overview of Thomas et al. [28] is only aimed at hyperspectral imaging. They overviewed the advantages and limitation of hyperspectral sensors from the laboratory to field applications and discussed the possibilities and challenges of hyperspectral measurements at different scales.
According to the analysis of all 35 reviews, they mainly focus on the application and analysis of hyperspectral imaging, and only eight reviews involved non-imaging hyperspectral data analysis. In addition, most of these reviews are broadly generalized, at best focusing on foliar disease [31,32] or one specific disease [33]. Within this context, this review provides an overview of advanced hyperspectral technologies for plant disease detection. Firstly, the requirements of hyperspectral technology are discussed according to a simple introduction of plant disease pathogens and plant–pathogen interaction processes. Secondly, following the hyperspectral disease analysis steps, we mainly overview the involved articles, algorithms, and methods from disease detection to qualitative and quantitative evaluation. Finally, the challenges and trends in hyperspectral disease detection are discussed.

2. Complex Presence of Pathogens and Plant–Pathogen Interactions Make Hyperspectral Technologies Indispensable

From sowing and growing to harvesting, plants may be simultaneously affected by multiple disease-causing pathogens, reducing the yield and quality of the cultivated plants. Based on the research on plant disease detection analysis, it is evident that many diseases produce similar symptoms and signs but are caused by very different microorganisms or agents [34,35]. Therefore, it can be said that pathogens themselves and the plant–pathogen interaction processes are complex, especially for non-invasive assay methods. These make it difficult to discriminate specific pathogens using the naked eye or simple computer vision.

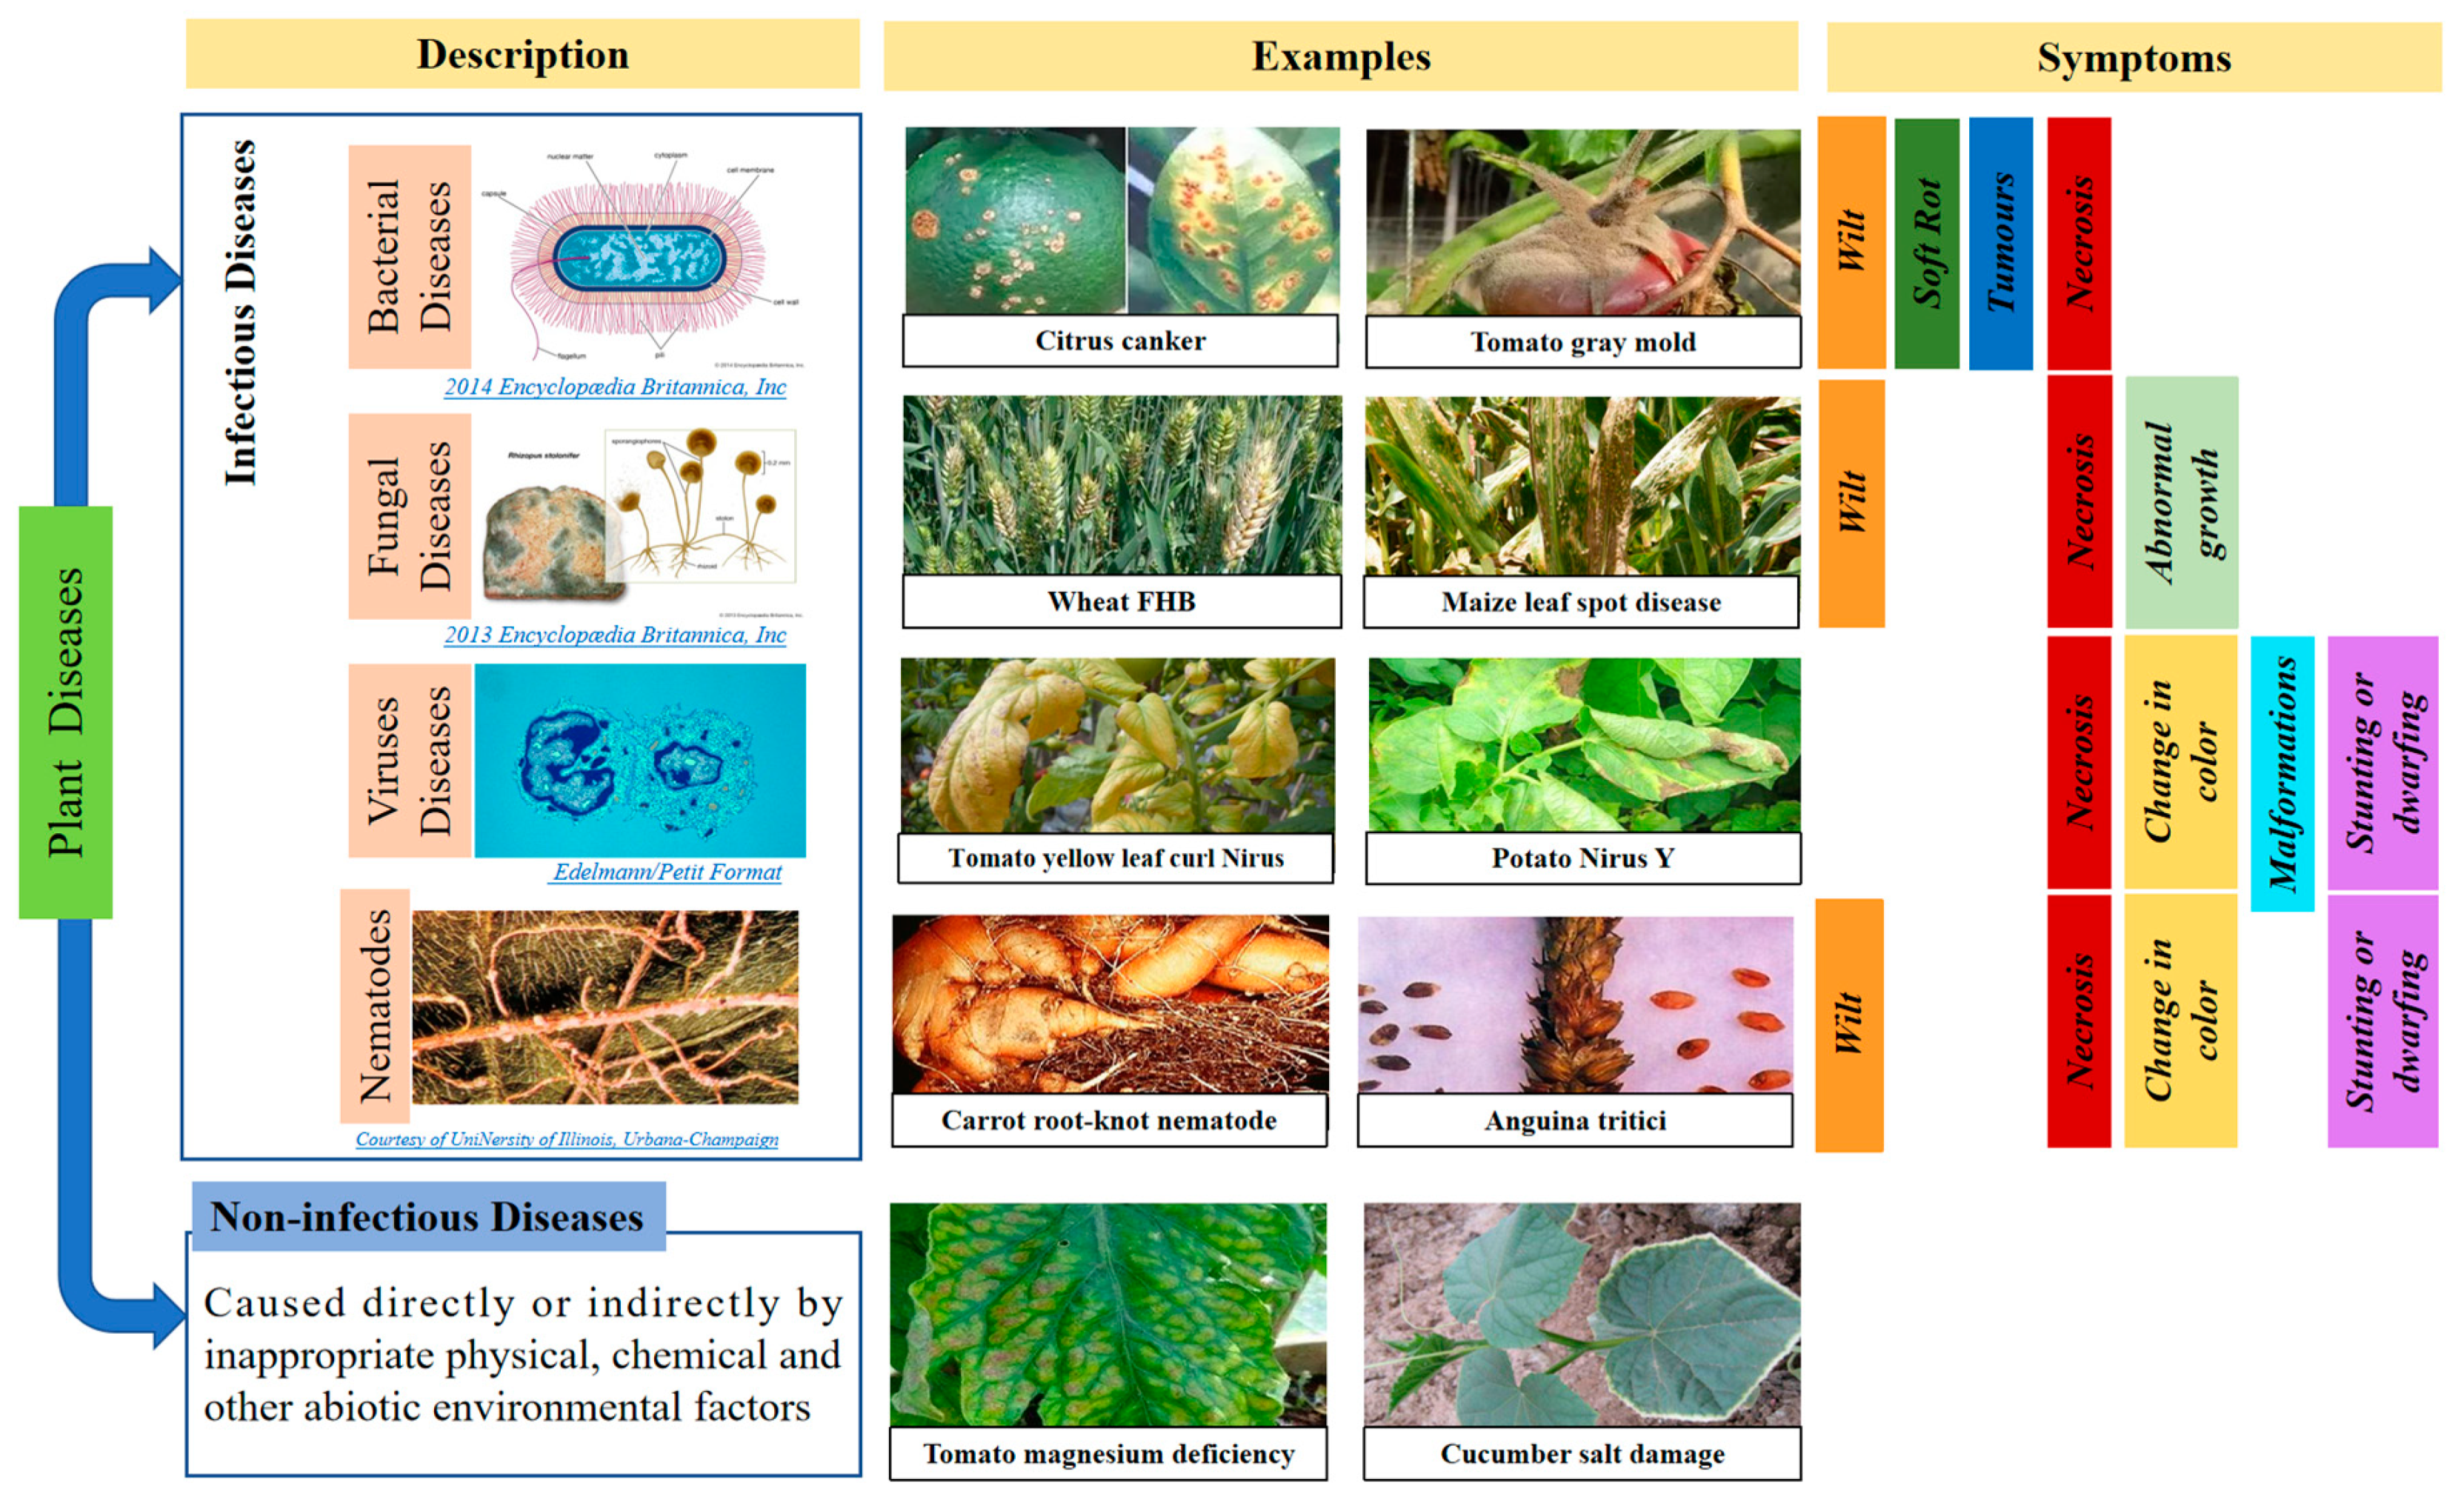
2.1. Plant Diseases May Be Caused by More Than One Causal Agent and Different Agents May Have the Same Symptoms

Based on the causal agents, the tens of thousands of plant diseases worldwide can be divided into two categories: infectious and non-infectious diseases [36]. The detailed classification system and disease examples are shown in Figure 2. Among them, non-infectious diseases are directly or indirectly caused by inappropriate physical, chemical, and other abiotic environment factors. The excess, deficiency, or improper balance of light; air circulation, water, or essential soil elements; unfavorable soil moisture–oxygen relations; high or low temperatures; pesticide injury; and many other external factors are the main disease-causing agents. The blossom-end rot of tomatoes and pepper, which is caused by wide fluctuations in soil moisture and temperature levels, is a typical and prevalent non-infectious disease.
The infectious agents are called pathogens and can be grouped as follows: viruses, bacteria, fungi, nematodes, and parasitic seed plants. Among them, the studies of parasitic seed plants are mainly focused on mistletoe, dodder, and witchweed. However, it is not the major disease of concern for non-destructive monitoring. Most studies have focused on viruses, bacteria, fungi, nematodes which have been causing infectious diseases all along. They can range in severity from mild leaf or fruit damage to death [36]. Specific pathogens affect their hosts differently, resulting in a suite of damage symptoms. Bacterial diseases can be grouped into four broad categories based on the extent of the damage to plant tissue and the symptoms that they cause, which may include vascular wilt, necrosis, soft rot, and tumors. Differently, the symptoms of viral diseases are mainly manifested in color changes, malformations, necrosis, and stunting or dwarfing. However, because of the fungal diseases accounting for 80%~90% of diseases, the symptoms of the diseases are also changeable. Generally speaking, it can be divided into three categories: necrosis, hyperplasia, and wilting. Furthermore, the common symptoms of nematode injury include stunting, loss of green color, dieback, slow general decline, wilting, and decay.
It can be seen that different plant pathogens would cause a variety of symptoms and damages, which form the basis for hyperpectral-based plant disease monitoring. It should be noted that not all plant diseases are suitable for hyperspectral-based detection as some of them lack identifiable characteristics. If only from the perspective of hyperspectral detection, the disease symptoms are mainly grouped into four categories: the reduction of biomass, decrease in leaf area index; lesions or pustules due to infection; the destruction of pigment systems and wilting [37].
As can be seen from the pathogen symptoms labeled in Figure 2, all four categories of pathogens can cause the necrosis of the host plant, which is the most conspicuous result of plant disease. Furthermore, both viruses and nematodes often cause changes in color (yellowing, loss of green, and so on), and stunting or dwarfing. Wilt is also a common symptom, and the symptoms generally focus on two main parts: vascular wilt and twigs. Correspondingly, the reasons also focus on two aspects. One is the invasion of bacteria into the vascular system of the plant and the other is that nematodes can cause a lack of response to water and fertilizer. It can be found that although the symptoms and signs of different pathogen categories are specific, they may concentrate in the same organ on the one hand, and on the other hand, they are not unique [36].
The examples and analysis above obviously show that, once one symptom occurs, it is difficult to say which pathogen is at play. Similarly, it also is not easy to judge whether the symptom is caused by only one pathogen.

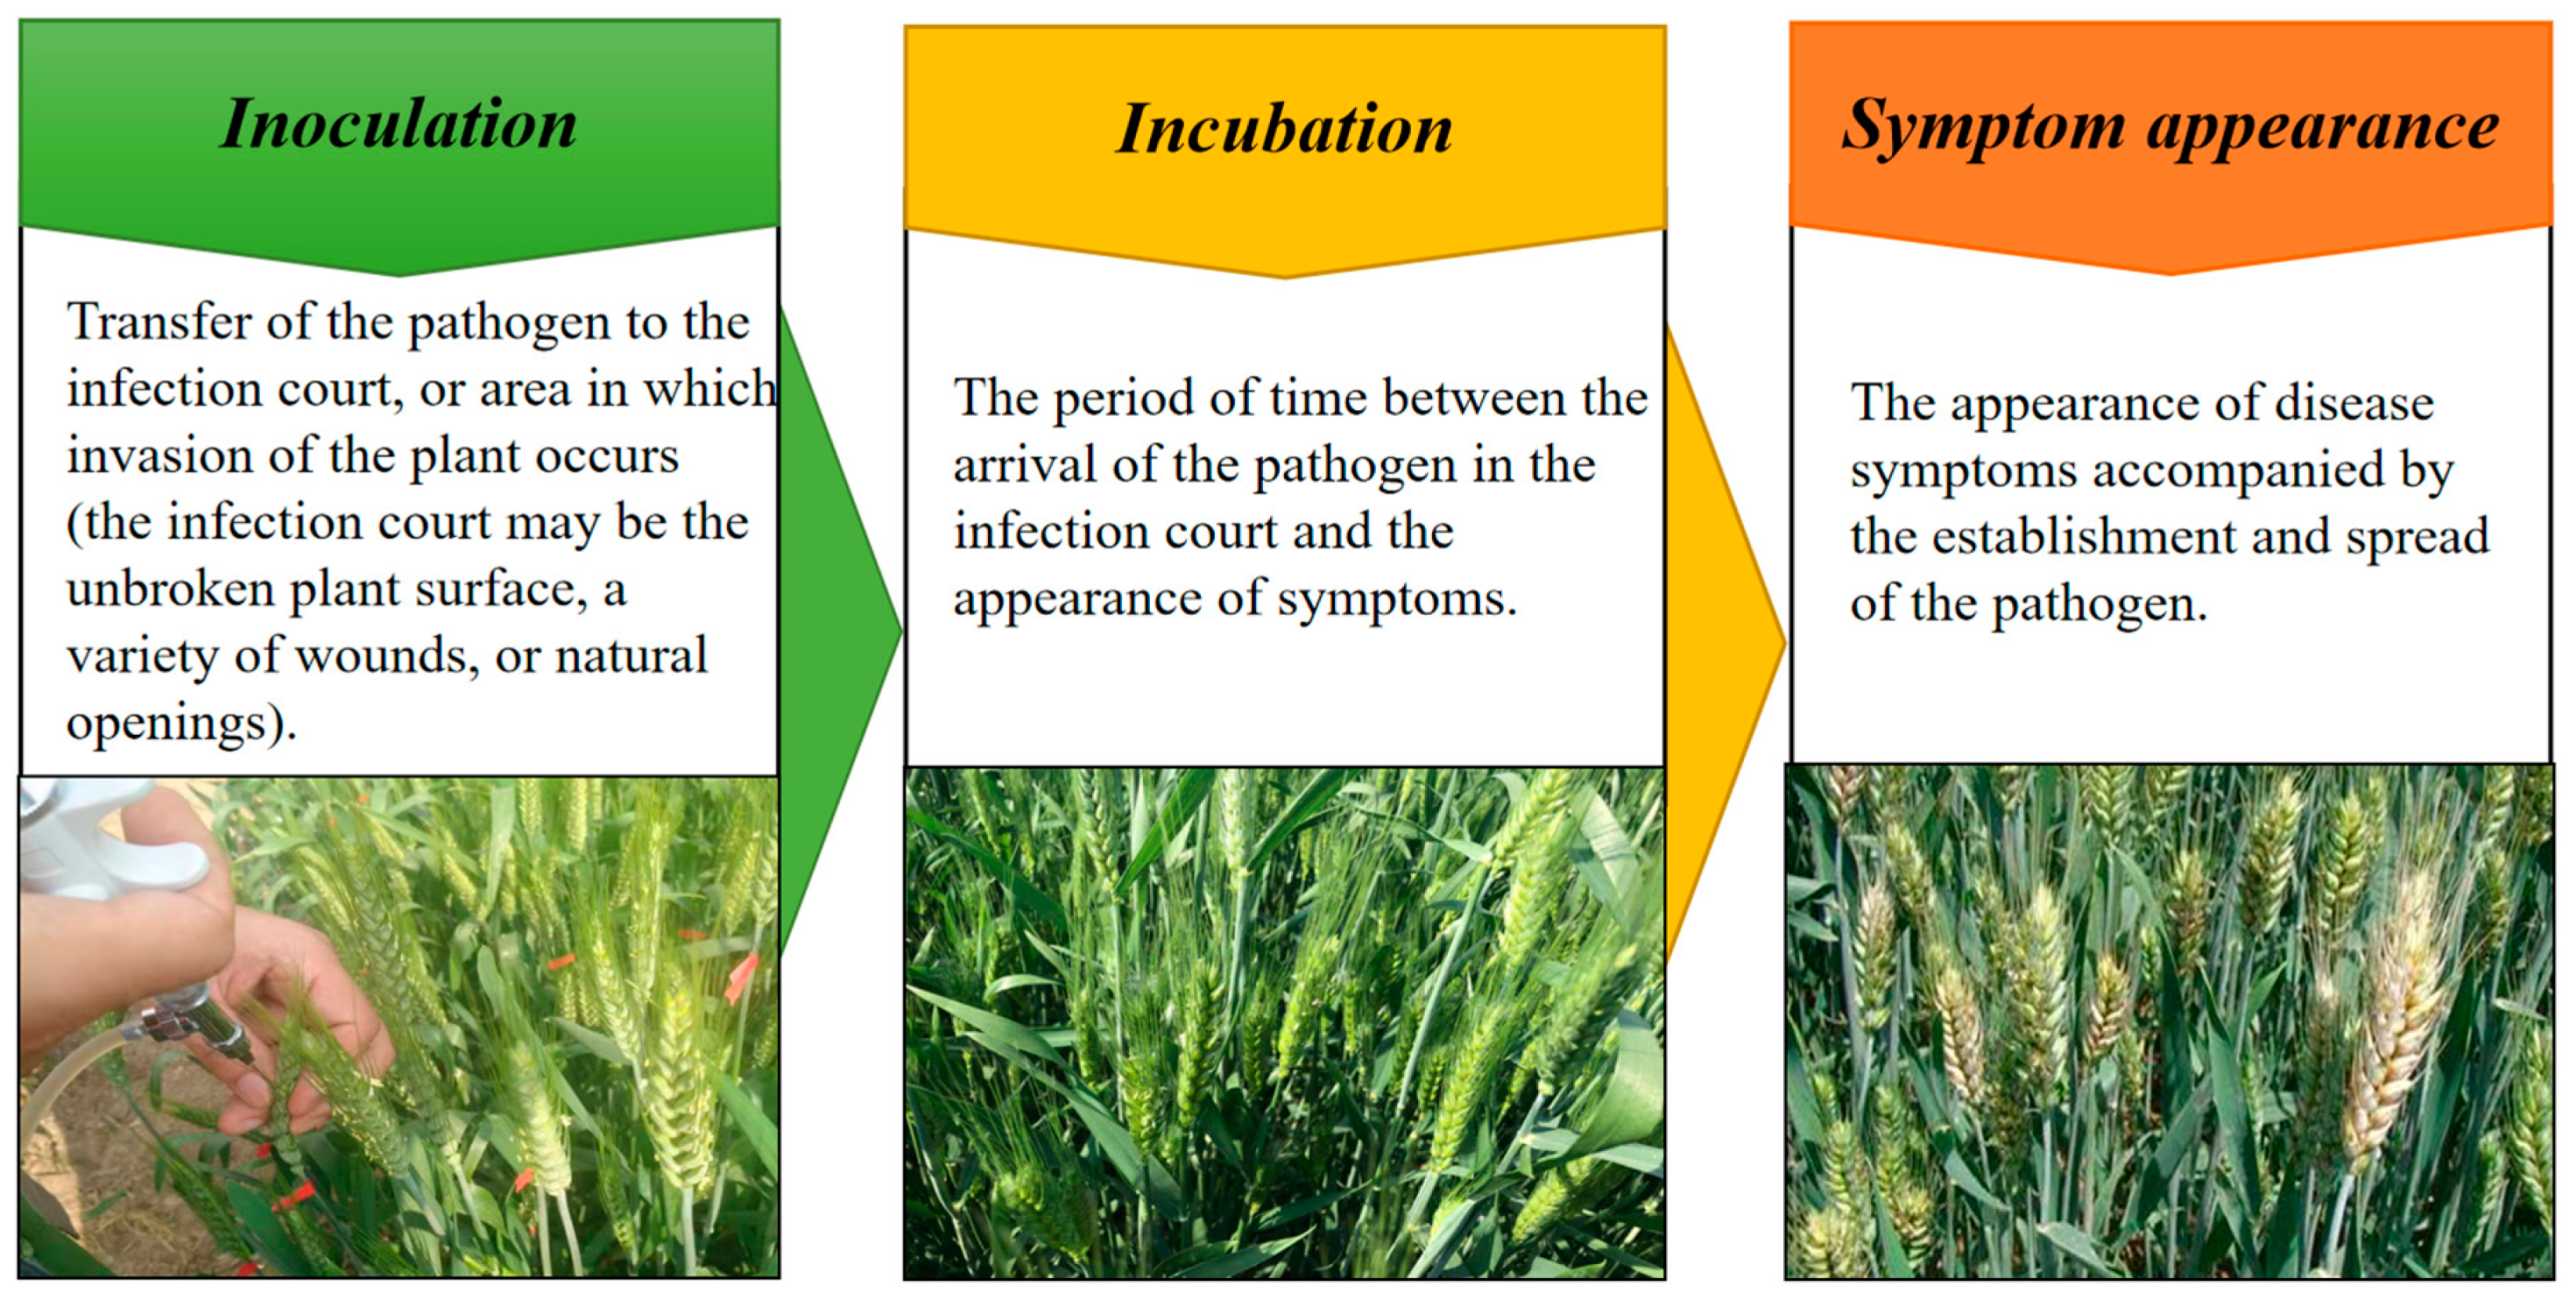
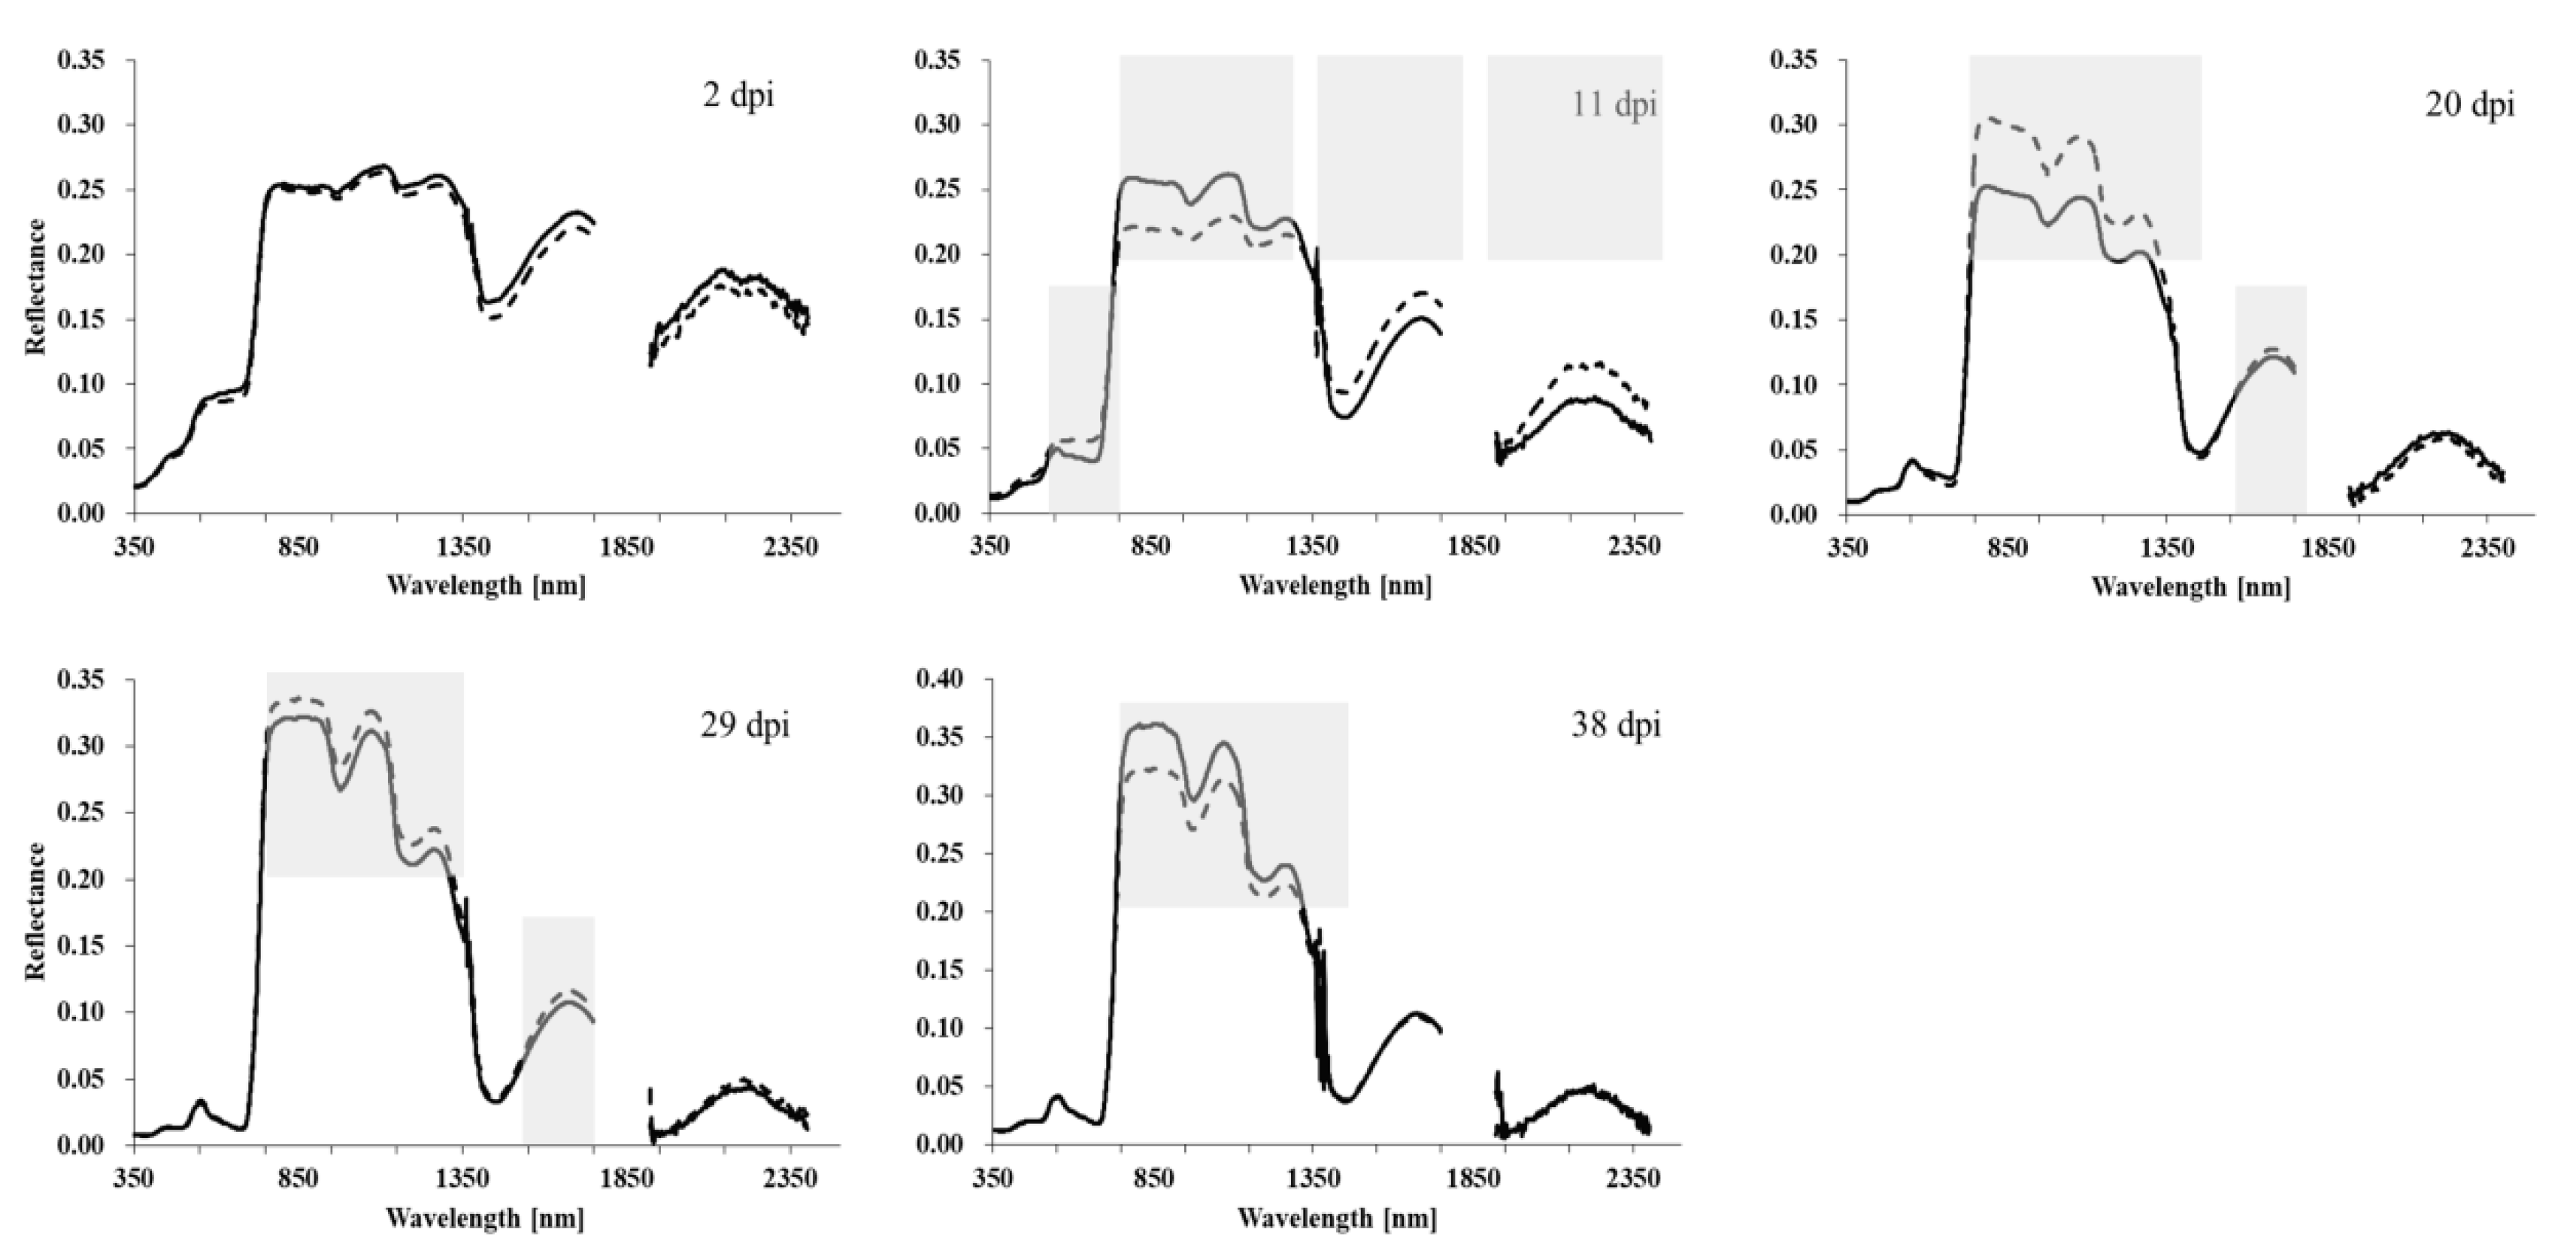
2.2. Host Plant–Pathogen Interaction Is a Complex Dynamic Process with Changes of Various Physiological and Biochemical Parameters

The infection with a pathogen is a dynamic process. Toxins, enzymes, and extracellular polysaccharides and other substances are all produced and changed in interacted process with the host plant. Except for the pathogen and plant connection stage, Figure 3 shows the three fairly distinct and significant stages of plant–pathogen interaction: inoculation (the pathogen invades the host), incubation (the latency period, in which the pathogen is parasitic in the plant), and symptom appearance (the plant shows disease symptoms and new pathogens may be produced). Each stage often leads autonomously to the next, once pathogenesis has been triggered by the pathogen [38,39]. Not only do the physiology and biochemistry of the host plant change in this dynamic process, but some pathogens change as well. Thus, the entire process is very complex.
In the terms of the host plant, in order to resist the invasion of pathogens, except for relying on the existing physical barriers, the complex immune system is also constantly functioning. Pathogen-associated molecular pattern (PAMP)-triggered immunity and effector-triggered immunity occur one after another in the active plant defense process [38,40]. In this process, the concentration of Ca2+ increases, the extracellular fluid is alkalized, the membrane potential is depolarized, and oxynitride as well as the synthesis of reactive oxygen and hormonal readiness change significantly [41].

2.3. Hyperspectral Technology Has Its Specific Necessity in Plant Disease Detection

Although manual investigation by experts is still the most commonly used method for the detection and diagnosis of plant diseases in field crops, the complex pathogen categories, disease symptoms, and plant–pathogen interaction processes make it difficult to detect the exact plant diseases in a timely and accurate manner. Most traditional invasive methods are time-consuming and error-prone. The development of digital agriculture has provided a new means of disease monitoring over the past few decades. With the development of optical remote sensing technology, from visible–shortwave infrared (VIS–SWIR), fluorescence and thermal imaging to synthetic aperture radar (SAR), light detection and ranging (LIDAR) systems, these technologies successfully expand human perception and assessment capabilities [34,42]. These provide us with the possibility of another direction in plant disease detection and monitoring. In particular, the application of hyperspectral technology in disease monitoring is exciting because it can cover a spectral range of up to 350–2500 nm and can yield a continuous spectral resolution less than 10 nm. These characteristics are not only suitable for disease differentiation based on slight differences, but also for the monitoring and analysis of dynamic disease processes, especially for detection during the latency period before symptoms are visible to the human eye.
In short, healthy green plants have low reflectance at VIS wavelengths, high reflectance at NIR wavelengths, and low reflectance in wide wavebands at SWIR wavelengths. These three characteristics correspond to photoactive pigments; cell structures; and water, respectively. Generally, this specific spectral reflectance phenomenon corresponds to the changes of the physiological and biochemical parameters in the process of disease occurrence: due to the existence of the strong absorption of chlorophyll and carotenoids, there are two absorption valleys in the blue and red spectrum, and a strong reflection peak in the green light band; between 700 and 770 nm, the reflectance curve increased sharply, showing an approximate straight line shape, and the slope of this part was related to the content of chlorophyll per unit area of vegetation; further, there are two absorption valleys near 1400 and 1900 nm of SWIR, which are mainly caused by the strong absorption of water [43].
Specifically, the changes of pathogens themselves and the plant–pathogen interaction process can be indicated by the changes in tissue color, leaf shape, transpiration rate, canopy morphology, and plant density, and this process of biochemical changes is bound to be reflected in a certain reflectance waveband. The higher the spectral resolution, the more meticulously the changes and differences it can react to. Furthermore, every individual host–pathogen interaction has specific spatial and temporal dynamics, and the specific processes influence different electromagnetic spectrum ranges. Oerke et al. [44] performed a detailed study of the spectral time-series changes of grapevine leaves infected by Plasmopara viticola. They found that as the number of days post inoculation (dpi) increased, the difference between the spectra of healthy and infected leaves increased, as did the spectral number that can be used in disease identification. It can be seen that 400, 1400 and 1900 nm can be used in early detection; red edge wavelengths can be used in disease detection after 8.5 dpi; and 500–700 nm can also be used after 9.5 dpi. This phenomenon is closely related to the activities of pathogens and host plants. Similarly, in the study of the spectral changes of winter wheat infected by yellow rust, we measured the spectra of infected and healthy winter wheat plots at the canopy scale every nine days from 2 dpi, respectively. After eliminating the abnormal interval, the spectral curves of the infected and healthy canopy were drawn and shown in Figure 4, which displays the difference in effect of the development of yellow rust on the spectral reflectance of winter wheat as the dpi increase. Thus, the spectral dynamic changes are not only obvious at the leaf scale, but also at the canopy scale.
The application of hyperspectral technologies makes it easy to assess disease information quickly, non-destructively, and accurately, including disease type identification [43], disease detection [45,46], disease mapping [47], as well as severity and loss assessment [48]. Table 1 lists a series of plant diseases affecting major crops. This statistic is based on the research articles discussing hyperspectral technologies. According to the statistics and comparison of relevant articles, fungal diseases affecting the leaves of winter wheat and sugar beets have been the primary focus in recent years. According to statistics and analysis, the sensors, platforms, and scales of studies of the same plant diseases are not the same. Thus, the data acquired and data analysis methods are not identical.

2.4. Applicable Hyperspectral Sensors and Platforms Are Different for Different Pathogens with Different Symptoms

When a pathogen interacts with the host plant, color changes and necrosis symptoms lead the reflectance in the VIS range to increase and the red edge position to shift to shorter wavelengths (“blue-shift”). However, biomass reduction linked to senescence, stunting or dwarfing, and defoliation decreases the canopy reflectance in the NIR band. For example, Wahabzada et al. [22] analyzed the relevant spectral topics and corresponding biochemical labels of three classical foliar diseases of barley (powdery mildew, net blotch, and brown rust) in the VIS and NIR range. Their research results indicated that the best wavelengths for powdery mildew pigment causing degradation are concentrated in the 500–650 nm range, while the best wavelengths for net blotch-caused chlorosis are concentrated in the 500–580 nm range, particularly at 550 nm and 700 nm. It is thus clear that different pathogens act in different ways, resulting in different host symptoms, so the suitable monitoring wavelengths are different.
Furthermore, as can be seen from Table 1, most non-imaging sensors are handheld and do not require sophisticated measurement systems. These sensors are widely used in laboratory, greenhouse, and field conditions [68,69]. However, most imaging sensors generally need to be installed on platforms to remain stable and form hyperspectral imaging systems (HSIs) for different scale applications. Laboratory-based hyperspectral imaging systems, in a manner, can provide the pure pixels of pathogens, tissues, organs, or plants because of its high spatial resolution. These pure pixels can provide the precise spectra of the corresponding observation objects. Field- and low-altitude hyperspectral imaging systems contain various mountable platforms and the flexibility of the platforms allow them to span leaf, single-plant, canopy, and even plot and regional scales in disease detection. Furthermore, airborne and satellite hyperspectral systems are more suitable for regional scales, but owing to a lack of flexibility, attention to the canopy and plot scales by airborne and satellite hyperspectral systems has declined slightly in recent years.
Different pathogens have their own unique interaction behavior with the host plant, and their stressed tissues are also different at different stages. Thus, the sensitive spectral waveband and optimal observation scales are going to be different. Applicable hyperspectral sensors and platform selection are important for different pathogens with different symptoms.

3. Main Hyperspectral Technologies for Plant Disease Analysis: Choosing Suitable Methods to Achieve Target Details

3.1. Choosing a Suitable Data Measurement System Is a Prerequisite for Obtaining Accurate Results

Preceding detailed data analysis, data acquisition is the first and important step in any hyperspectral image-based plant disease analysis. Different platforms and their combinations with different sensors can form different hyperspectral measurement systems. For the purpose of plant disease research, choosing a suitable data measurement system is a prerequisite for obtaining accurate results. Figure 5 shows platforms and their corresponding observation scales. From the cell and tissue scale to the region and landscape scale, the corresponding HSIs of each scale have many choices. Sensor performance and spatial resolution requirements need to be considered simultaneously when constructing hyperspectral measurement systems.
Generally, a laboratory-based system includes a suitable platform, a hyperspectral sensor, a computer, and light sources. Microscopes, mounting towers, and tripods are the commonly used platforms in laboratory-based systems in darkrooms, laboratories, and greenhouses. These HSIs focus on small-scale analysis, such as on the tissue and leaf scales, and the maximum scale is the single plant scale. Scanning electron microscopy (SEM, Figure 5A) and stereoscopic microscopy (Figure 5B) correspond to the smallest scale in plant disease analysis. However, SEM requires fairly strong knowledge of biology, is typically used alone, and is not common in hyperspectral analysis. Thus, disease analysis at the pathogen cell and tissue scales relies more on the stereoscopic microscope platform with hyperspectral sensors (called hyperspectral microscope imaging, HMI). Nanometer- and millimeter-level spatial resolution makes it possible to establish an accuracy relationship among the hyperspectral information, plant phenotype, physiological parameters, and even genotypes [12,70]. In darkrooms, greenhouses, and laboratory environments, mounting tower- and tripod-based platforms and other sensor mounting equipment are generally called indoor optical measurement platforms (Figure 5C). Based on such platforms, the high-resolution and high-accuracy evaluation of processes during pathogenesis can be achieved under highly controlled conditions [28]. It is worth noting that analysis at the leaf scale, individual plant scale, and even at the canopy scale can be realized using such platforms [44,71,72]. It is easier to monitor the changes of pathogens and spectra throughout the disease development process via time-series analysis. These laboratory-based system platforms are the most suitable for the basic analysis at the tissue and leaf scales. For single plant and canopy scales, high spatial resolution and controlled conditions are the greatest advantages compared with field-based platforms. Thus, these platforms are the best for basic research under laboratory conditions such as crop breeding and resistance gene analysis. However, they are low throughput and not suitable for the promotion of practical applications.
Compared with laboratory-based hyperspectral systems, field- and low-altitude-based hyperspectral systems generally contain suitable platforms, hyperspectral sensors, and computers or operating systems. Tripods, vehicles, robots, and stationary rail systems are the commonly used field-based platforms (Figure 5D) in plant disease detection [73,74,75]. Although field-based and laboratory-based hyperspectral platforms have a certain degree of overlap, each has its own advantages. The field-based platform retains high spatial resolution and improves the measurement throughput to some extent. Low-altitude platforms are miniature RS platforms with high mobility and low cost. They are less affected by weather factors and take-off site conditions and can simultaneously meet the needs of high spatial resolution and high throughput. Manned aircraft, helicopters, unmanned aerial vehicles (UAVs), and balloons have been used in agricultural RS applications. In particular, UAV-based platforms have become the most prominent because they are light, flexible, and easy to operate for plant disease detection [76,77]. Although they have both high spatial resolution and high throughput, UAVs are more suitable for canopy-scale analysis than organ-scale. Field-based and low-altitude platforms are the best for phenotyping and precision farming. The presence of mixed spectra makes them unsuitable for basic research and resistance genes analysis, but their high spatial resolution and high-throughput disease detection means that they cannot be ignored. Furthermore, various mountable platforms and the flexibility of the platforms allow them to span leaf, single-plant, canopy, and even plot and regional scales in disease detection. It can be expected that they will play key roles in field phenotyping and plant disease detection in the near future [28].
For the large-scale assessment and forecasting of plant diseases, airborne and satellite platforms have shown to be promising. The platform and sensor are relatively fixed. Airborne platforms have also often been employed at the canopy scale [67,78,79]. The airborne and satellite systems have always been used with handheld or non-imaging sensors to assist in improving the analysis accuracy [78]. Furthermore, although the spatial resolution of satellite platforms is the lowest, the single image coverage is the widest. It can be said that it is the best choice for regional scale research and predicted research based on environmental factors. Usually, considering the difficulty of data analysis and the amount of data storage, satellite platforms equipped with multi-spectral sensors are more often applied in plant disease mapping and loss assessment on regional scales [54,80].

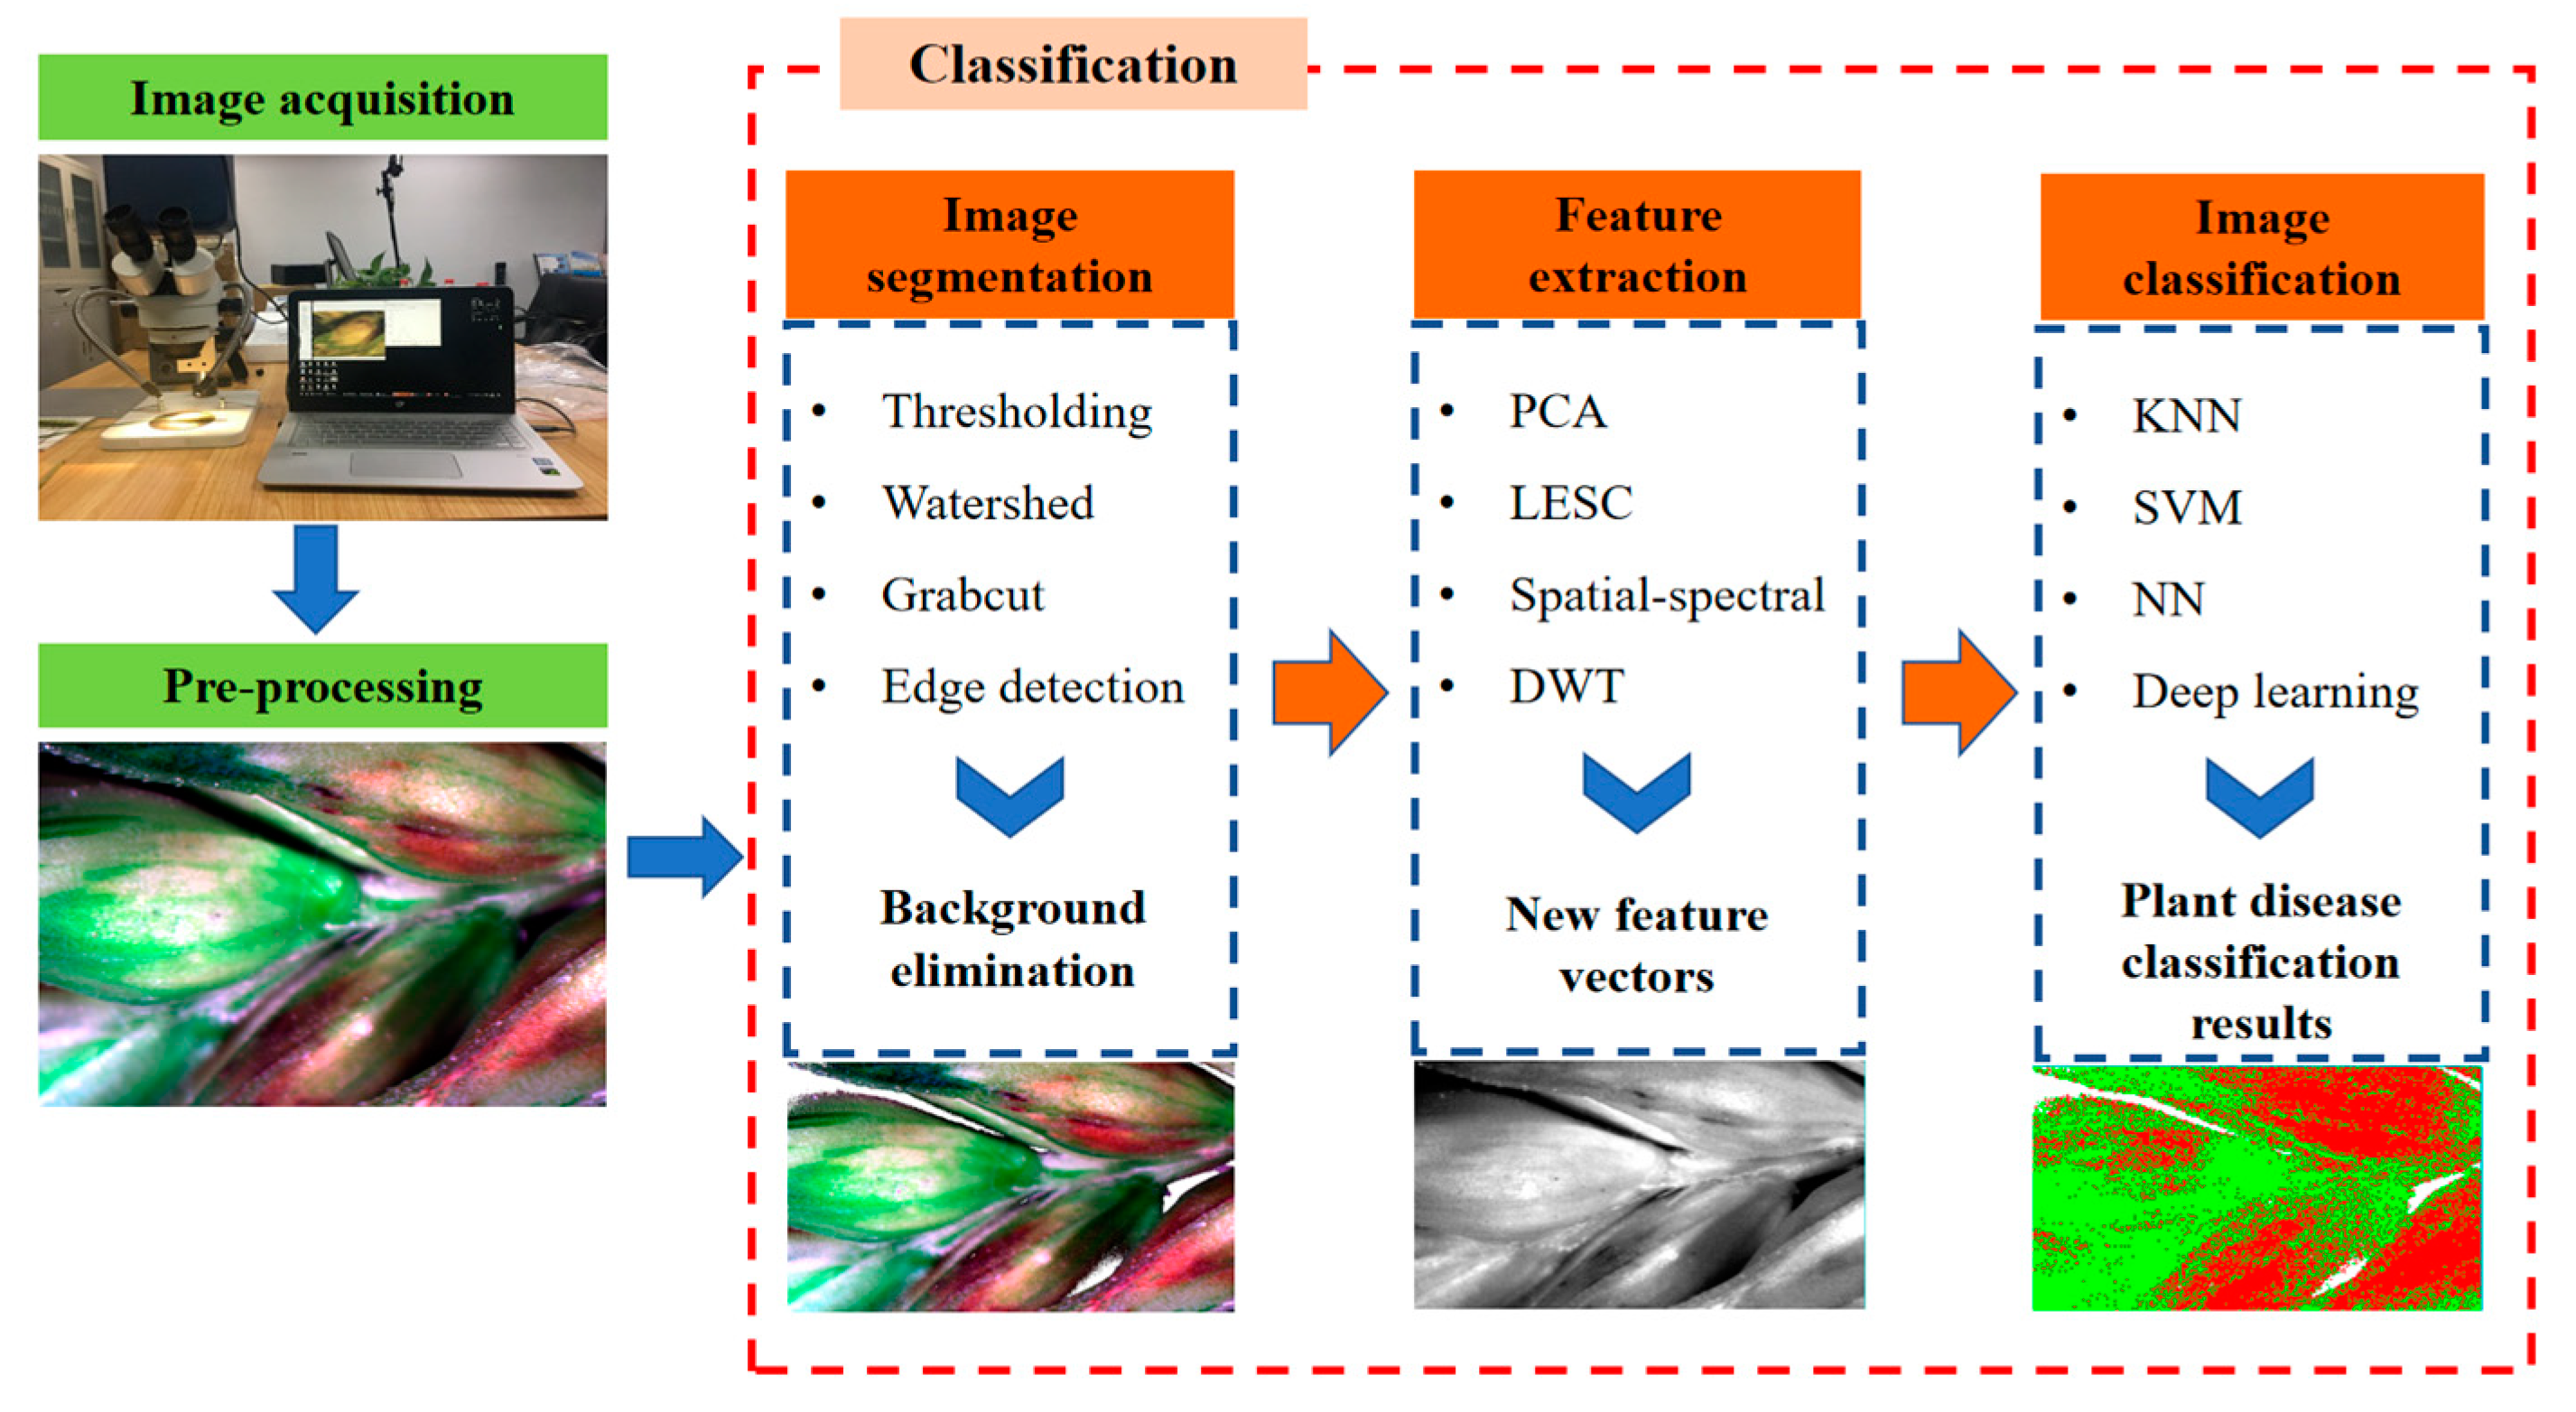
3.2. Complete and Appropriate Pre-Processing Guarantees Accurate Results

The main objectives of data pre-processing are to improve contrast and eliminate noise to reduce the difficulty of data analysis and ensure data accuracy. The sensor noise and error; stability of the platform; environmental effects; shape, size, and quantity of samples; and light source and background conditions all influence the hyperspectral data quality. Currently, the pre-processing of non-imaging hyperspectral reflectance signals is relatively simple. The method of multiple measurements and averaging is often used to eliminate human error in measurement. Many studies have utilized the method of direct deletion to eliminate abnormal wavebands. Moreover, spectral smoothing and filtering are employed in pre-processing (as will be introduced in the following section).
Regarding hyperspectral data imaging, atmospheric calibration, geometric correction, and spectral calibration are the three main aspects of hyperspectral data pre-processing. Atmospheric calibration is mainly aimed at the surface reflectivity error caused by atmospheric scattering and absorption and is applied to satellite scale data analysis; geometric correction is mainly aimed at the geometric distortion caused by terrain changes, platform tilt, etc. and is applied to field, low-altitude, airborne, and satellite-scale data analysis. These two steps are mainly used for imaging hyperspectral data, but spectral calibration is necessary in both the imaging and non-imaging cases. Spectral calibration is crucial and can involve complex algorithms [39]. Many techniques can be used, such as spectral normalization, spectral interpolation, and radiation transfer models [81,82,83]. In addition to the above three main preprocessing steps, image masking, contrast improvement, and even edge detection usually constitute the steps of image pre-processing. Image enhancement is the most important step in some cases of plant disease detection and image vision analysis. Its central objectives are to remove data noise and highlight the characteristics of the target features. To achieve these goals, various techniques such as data filtering (Gaussian filtering, linear filtering, etc.), spectral smoothing (moving average smoothing, minimum noise fraction rotation, Savitzky–Golay smoothing, etc.), and image enhancement (histogram equalization, homomorphic filtering, etc.) can be used. Zhang et al. [83] proposed one hyperspectral microscope image pre-processing framework for FHB-infected kernel extraction. The framework based on image spectral calibration and performed normalization using white and dark reference images, covering the image to grayscale, image binarization, and the application of threshold segmentation. We cannot conclude what pre-processing methods would be the most effective. The quality and type of image are fundamental in selecting a pre-processing procedure. In addition, the pre-processing method must be suitable for the actual application requirements.

3.3. Special Hyperspectral Technologies and Frameworks for Different Plant Disease Analysis Directions

Based on literature statistics, it is analyzed that the key points of plant diseases research mainly contain resistance gene analysis, plant–pathogen interaction analysis, non-destructive detection and so on. Among them, plant disease detection, disease severity assessment, and classification are three main focal points which are based on hyperspectral techniques in remote sensing. For plant disease analysis, large amounts of hyperspectral data are always gathered for monitoring plant physiological changes under biotic stresses, which are present throughout the whole growth stage [37,55,76]. This is bound to make hyperspectral-based plant disease analysis face a huge among of data. Thus, how to analyze the hyperspectral data effectively and obtain effective spectral features quickly become the recently emerging topics, which will form the most prominent characteristics of hyperspectral-based analysis framework [28,37]. Based on this framework, each different analysis point has formed its special system.

3.3.1. Detection Is One of the Earliest, Basic but Important Applications in Hyperspectral-Based Plant Disease

Plant disease detection includes identification, classification, and mapping, and is one of the main purposes of hyperspectral plant disease analysis from the cellular to regional scale. In general, there are two main situations involved in hyperspectral-based plant disease detection: (I) distinguishing infected plants from healthy ones and (II) identifying a specific disease from others. The first situation involves only one crop species and one pathogen and the second situation only focuses on one pathogen, classifying all other possibilities as areas of non-interest. For non-imaging hyperspectral data, the reflectance of healthy and infected organs must be acquired separately, and the research generally spans the leaf, plant, and field scales. However, the methods and scales of data acquisition are basically unlimited in hyperspectral imaging. Either way, the hyperspectral-based plant disease detection has a relatively simple but mature framework.
Couture et al. [68] used non-imaging hyperspectral data to detected the Potato Y-virus infected leaves. They conducted a partial least squares-discriminant analysis (PLS-DA) model to classify the infected leaves from the healthy ones based on the original full range spectral data, and the mean validation kappa was 0.73. Moshou et al. [84] developed a normalization method based on the reflectance and light intensity adjustments and constructed four vegetation indices (VIs) as the input data of multi-layer perceptron (MLP) neural network. Based on the constructed MLP, they successfully detected the yellow rust infected winter wheat plants, for which the classification accuracy reached up to 99.4%. In summary, the basic framework of hyperspectral-based plant disease detection contains two main parts: classification parameters determination and classification algorithms selection.
The above examples showed that whether using non-imaging or imaging hyperspectral data, the classification parameters selection of plant disease detection can be analyzed from two aspects: classification based on full range spectral data and classification based on subset features [74]. The full range spectrum information that is utilized in the detection or classification can be the original spectrum, the spectrum pretreated by smoothing, or the first- or second-order derivative spectrum, along with the logarithmic transformation of the reciprocal of the spectral reflectance [78]. Moreover, in the case of using subset features, feature extraction and selection are essential. Some statistical classifiers perform feature selection during operation, but additional feature selection is conducted before final classification in most cases. The features can obtain spectral vegetation indices (SVIs), special disease indices (SDIs), texture and spectral features based on feature extraction, optimal wavebands selected by dimension reduction algorithms, derivative spectra, and other transformed spectra. The detailed information will be discussed in Section 3.3.2 and Section 3.3.3.
For the classification algorithms selection, according to the previous studies on plant disease detection by imaging hyperspectral systems, the simplest and most widely employed image segmentation algorithm is threshold segmentation [85,86]. Lu et al. [65] used the Youden index (Youden index = Sensitivity + Specificity − 1) as the threshold to classify yellow leaf curl-infected and healthy tomato leaves. In total, 37 features (including the spectral reflectance, first derivative spectra, band ratio, and texture features) were extracted and calculated, and then the receiver operator characteristic curve analysis was employed to determine the sensitive features. The Youden indices of the sensitive features were calculated, and thresholding was used to complete the infected leaf detection. The authors found that when the Youden index of the mean correlation extracted from the 720/840 nm ratio image was 1.0, the detection performance was the best. Jin et al. [46] applied a deep neural network (DNN) classification algorithm to the pixels of hyperspectral image to accurately discern the FHB disease area of wheat ear. The red edge position threshold method was also used by Li et al. [67] to separate Huanglongbing (HLB) diseased and healthy samples from citrus groves based on both field and indoor ground spectral data. The accuracy of the research was 90% in this case. Furthermore, machine learning classification methods such as the maximum likelihood classifier (MLC, [87]), support vector machine (SVM, [88]), neural network (NN, [82]), and even deep learning [46] methods are commonly used to achieve the plant disease detection. In the study of detecting the phaeosphaeria leaf spot infestations in maize crop by Adam et al. [55], the guided regularized random forest (GRRF) and the traditional random forest (RF) classification algorithms were compared. Under the same training and validation datasets, the infected plants’ classification overall accuracy of GRRF reached 89.7% with six optimal wavebands, the RF only reached 81.6%. Thus, choosing the suitable classification algorithm, which depends on the specific situation, can not only decrease the data volume, but also improve the detection accuracy.

3.3.2. Diseases Classification Is the Attempt to Identify and Label the Pathogens Affecting the Plant Simultaneously

Disease classification can be seen as an extension of disease detection, but instead of trying to detect only one specific disease based on different conditions and symptoms, it is attempted to identify and label the types of pathogens affecting the plant [17]. For non-imaging hyperspectral data, plant disease classification is more concerned with sensitive wavelength selection and SDIs construction. The main points of research in using imaging hyperspectral data for plant disease classification include extracting the infected tissue and plant, analyzing the differences between pathogens, and determining the final classifiers. Figure 6 shows the basic hyperspectral image classification workflow for plant disease classification.
Image segmentation is used as a pre-processing step and is typically performed before the formal spectral analysis in order to extract the target objects from the background or form a mask for the formation of the region of interests (ROIs) for further information extraction [89]. Pandey et al. [90] used wavebands at 705 and 750 nm (I705 and I750) to produce a specific normalized different vegetation index (NDVI) as (I750 − I705)/(I750 + I705). This specific NDVI index was used to segment plants from the background by setting a universal threshold of 0.20. Then, the average spectral reflectance of the plant pixels was extracted for the PLSR model fitting for chemical property prediction. A similar process was developed to assess the disease severity of Fusarium-damaged oat kernels under a benchtop hyperspectral system [91]. It consists of the transformation of the raw signal into percent reflectance, threshold-based background segmentation, and normalized spectral transformation to remove scattering effects. The watershed algorithm is also a popular image segmentation method, which is often used for single tree crown delineation and kernel and leaf segmentation [92]. In addition, some of the methods that have been applied effectively to gray-scale, color, and multispectral images have been optimized purposefully and play key roles in hyperspectral image segmentation, such as Grabcut [93], the method of Otsu [94], and edge detection [95,96].
Overall, image segmentation algorithms can run through almost all scales from the sub-cell scale to the country scale. They can be applied based on the threshold, clustering, morphological operations, edge or contour detection, and watershed transformation. The decrease in the data volume substantially improves the data analysis efficiency. In image-based plant disease identification, detection, and mapping research, image segmentation is a basic and important image processing step for hyperspectral-based plant disease analysis.
Feature extraction constitutes one of the pillars of hyperspectral imaging-based object identification and classification [97]. Different diseases have different symptoms in different plants. Therefore, in hyperspectral image-based plant disease classification, the main basic features include not only spectral features, but also spatial features, texture features, and other effective information that can be obtained using image data. Thus, feature extraction can be considered as the most important step in hyperspectral-based classification. Its target is extracting and forming the most relevant new feature vectors for plant disease detection by combining and optimizing the spectral and spatial features, then feeding them to a set of classifiers or machine learning algorithms.
Some data dimensionality reduction algorithms involve the elimination of autocorrelation wavebands by constructing new variables, such as principal component analysis (PCA), successive projections algorithm (SPA), and so on. These algorithms are also classical in feature extraction. The minimum noise fraction algorithm (MNF), canonical correlation analysis (CCA), projection pursuit, orthogonal subspace projection (OSP), and discrete wavelet transform (DWT) are also classical hyperspectral data feature extraction algorithms. PCA is a typical example, and many extension algorithms have been proven. In the research conducted by Xie and He [98], PCA was performed to obtain the principal components (PCs) from the spectral and texture features of early blight disease-infected eggplant from hyperspectral images; then, the PCs were utilized to construct K-nearest neighbor (KNN) and AdaBoost classification models to detect the infected samples. Furthermore, many improved methods based on traditional image feature extraction methods have been proposed with the improvements in the spatial and spectral resolutions of images. Wei [99] analyzed the disadvantages of traditional manifold learning and nonnegative matrix factorization (NMF) in hyperspectral image feature extraction and proposed two improved algorithms: local embedding based on spatial coherence (LESC) feature extraction and regularized NMF feature extraction. Furthermore, considering the spectral and spatial features simultaneously, many spatial–spectral feature extraction algorithms have been developed. Knauer et al. [100] proposed a random forest-based spatial–spectral feature extraction algorithm to detect powdery mildew-infected grape bunches and compared the findings with the traditional RF classifier results. This spatial–spectral feature extraction algorithm contains linear discriminant analysis (LDA)-based spectral feature extraction and integral image-based texture feature extraction. These steps led to improved classification accuracies reaching 0.998 ± 0.003 for detached berries.
Feature extraction for hyperspectral data has been the crucial issue in hyperspectral data processing to preserve the key spectral information and to perform dimension reduction. The essence of feature extraction is to find a means of feature mapping, rather than to perform simple relevant analysis. Feature extraction can improve the classification accuracy and effectiveness; however, it has been an arduous and difficult task.
Image classification in hyperspectral image-based plant disease analysis includes techniques that classify data into a healthy category and different pathogen or disease severity categories. The aforementioned image segmentation and feature extraction methods are generally performed to improve the efficiency of data analysis, which may not always be necessary in plant disease detection. However, image classification is not a negligible step.
On the one hand, classical statistical classifiers are commonly used by building regression and sometimes are also classified by using a covariance matrix, which compares the different classes [101]. Yeh et al. [102] used stepwise discriminant analysis (SDA) to diagnosis strawberry anthracnose. The average accuracy of three-class classification (healthy, incubation, and symptomatic) was 80.7%. The authors also provided two alternative classification methods: spectral angle mapper (SAM) (machine learning using full spectral information) and simple slop measure (SSM, a statistical method using red edge information). The average accuracy of SAM and SSM reached 82.0% and 72.7%, respectively. On the other hand, SVM classification and its diffraction algorithms [42], SAM [79], LDA [23], KNN [66], and other traditional RS machine learning classification methods, are also commonly used in hyperspectral-based plant disease classification and detection. Furthermore, NNs, such as single-layer perceptron (SLP), multi-layer perceptron (MLP), probabilistic NNs, and deep learning methods are also available with a special emphasis on plant disease detection. Moshou et al. [84] used MLP architecture to successfully detect yellow rust in wheat crop. Four optimal spectral wavebands were selected by stepwise method from the hyperspectral images in wheat field. According to compare the MLP and quadratic discriminant analysis (QDA) classification results, the classification accuracy of MLP reached up to 98.9% and 99.4% for healthy and diseased plants, respectively.
In the FHB-infected wheat kernel detection research by Shahin and Symons [86], threshold image segmentation was used to separate the wheat kernels from the background and PCA was separately employed to extract nine different features to classify sound kernels from Fusarium-damaged kernels and then to classify the mildly and severely infected kernels. The overall accuracy can reach 92% by using the LDA model classifier. Abdulridha et al. [72] used 10 nm and 40 nm resolution spectral image indices (VIs) to detect the laurel wilt-affected trees. Both decision tree (DT) and MLP feature extraction were used to select the optimal parameters in classification from the full spectrum and 23 SVIs. The results obtained with MLP were better than those achieved with DT, with classification percentages ranging from 98% to 100% in all datasets. To summarize the above arguments, hyperspectral image classification is reliable in both multi-category-based plant pathogen detection and disease severity identification. However, image segmentation and feature extraction, the first two steps shown in Figure 6, are classified into data pre-processing sometimes for plant disease classification. Under this condition, the main purpose of these pre-processing steps used in plant disease detection classification is to improve the classification algorithm efficiency while ensuring accuracy. According to previous research on the use of hyperspectral images in plant disease analysis, classification algorithms tend to have a selection process based on correlation, although the classification utilizes the full spectrum, which is characteristic of the hyperspectral classification of plant diseases. Table 2 shows the major different methods of hyperspectral image classification for plant disease detection, identification, and mapping.

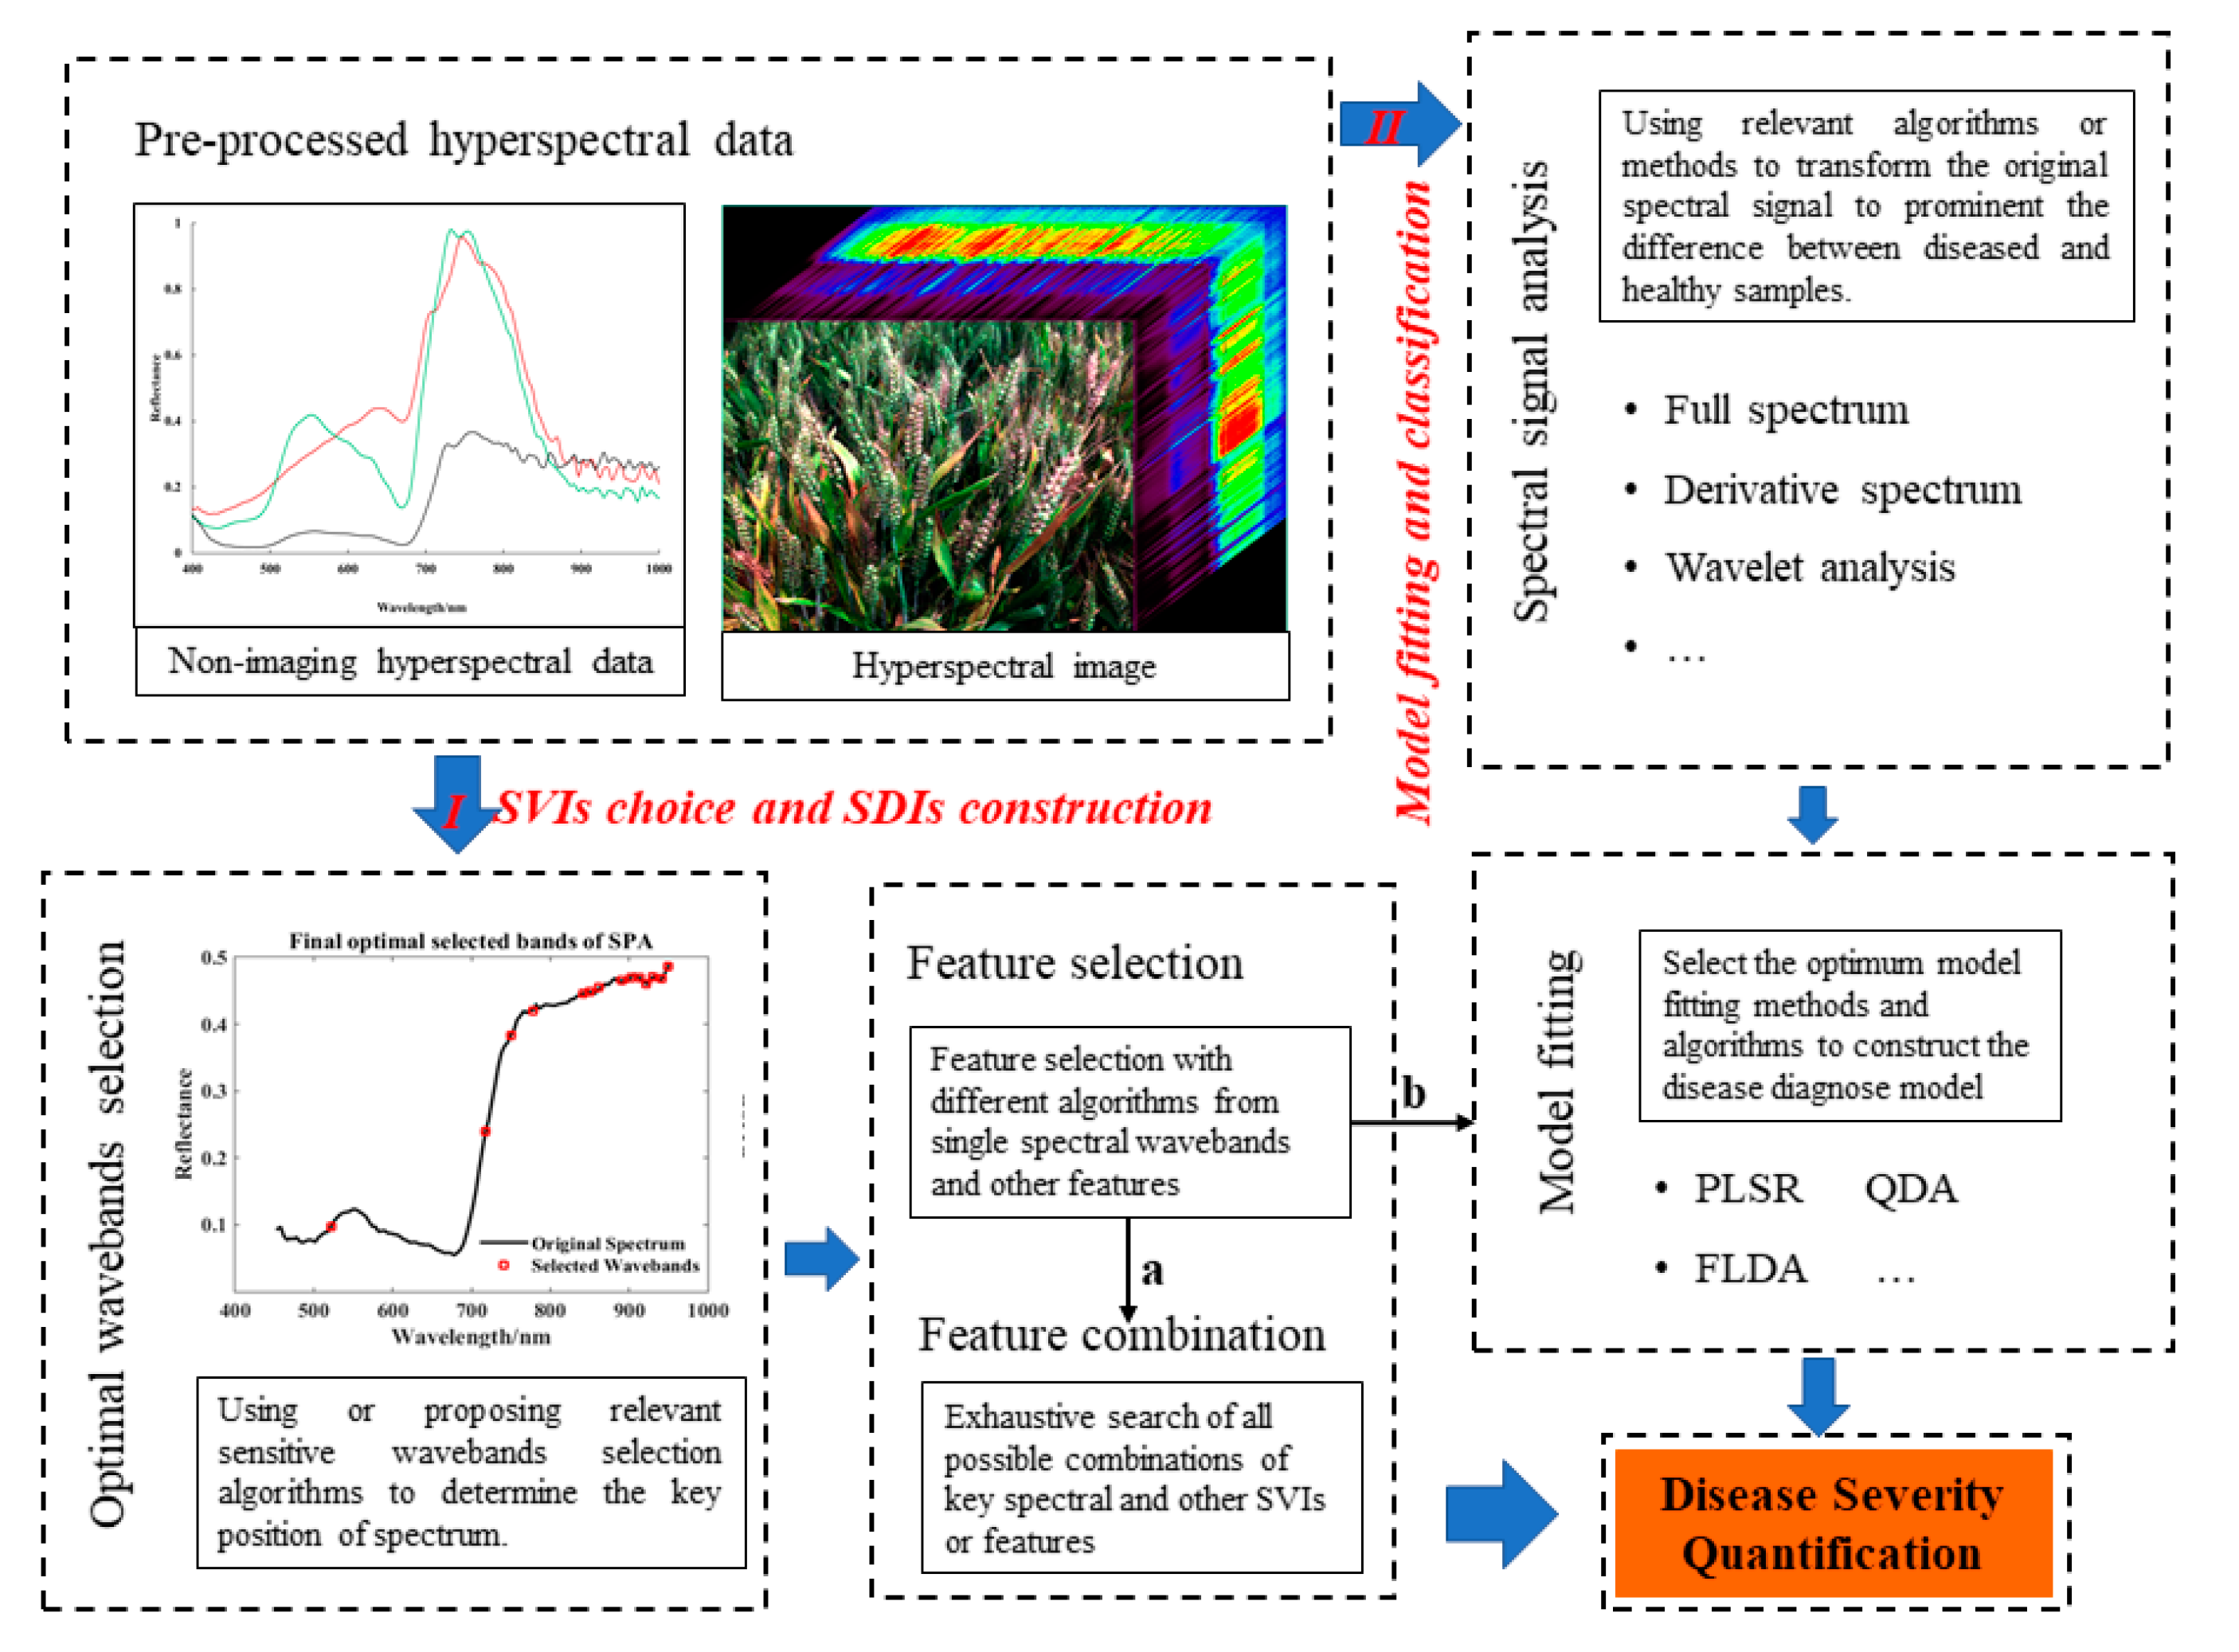
3.3.3. Quantitative Diagnosis of Plant Disease Severity is the Main Direction of Hyperspectral Disease Analysis

The evaluation criteria for plant disease severity are often the disease index (DI) and incidence, which are clearly given in national or local standards [56,75]. In addition, according to the pathogens and symptoms they caused, the pigment content, water content, and even structural parameters are often regarded as indirect evaluation criteria, especially in non-plant protection and pathology studies [104]. In summary, hyperspectral-based plant disease severity quantitative diagnosis also have two main situations: (I) according to pigment, water content and other parameters’ changes to choose effective spectral vegetation indices (SVIs) or constructing special disease indices (SDIs) and (II) using direct model fitting and classification to achieve the disease severity inversion. In either of the aforementioned situations, the detection of the organs infected with a specific pathogen is the first step. Moreover, considering the huge data volume of hyperspectral datasets, the sensible and simple method is to find only a small number of wavelengths and only consider their changes in the spectrum in the severity quantification [101]. Figure 7 shows the two main directions of disease severity quantification.
SVI usage and SDI construction are the most optimal choices in hyperspectral plant disease severity diagnosis. SVI can be used to detect the presence and relative abundance of pigments, water, nitrogen, and carbon in plants as expressed in the solar-reflected optical spectrum [105,106]. All these physiological and biochemical indicators are dynamic changes throughout the whole growth period of crops. The special growth period and special status have their special characteristics. Thus, SVIs are considered to be the indices that reflect the growth stage of plants in remote sensing. More than 150 SVIs have been reported in the scientific literature, and some have substantial biophysical bases or have been systematically tested. According to the relevant wavebands and calculations of similar properties, the SVIs can be grouped into broadband greenness VIs, narrowband greenness VIs, light use efficiency VIs, canopy nitrogen VIs, dry or senescent carbon VIs, leaf pigments VIs, and canopy water content VIs [107]. Table 3 lists some commonly used SVIs in plant remote sensing. These categories are all related to the quantitative diagnosis of plant diseases. The listed SVIs are focused on the detection of pigments, water, nitrogen, and structure changes once diseases occur. Among all SVIs, the NDVI is the most prominent. NDVI was confirmed to have good robustness in many studies [78,105,108]. However, Devadas et al. [109] reported that a single SVI has some ability to distinguish diseased plants (organs, leaves, and even plots scales) from healthy ones but is not ideal for the separation of different diseases or disease grades. Sometimes, different SVIs have been utilized together to perform the high-quality identification of different types of diseases [60,110], but this process is somewhat tedious for practical application.
In the above situation, researchers have performed the targeted analysis of disease-specific data and combined different wavelengths to constitute SDIs. In the FHB classification index (FCI) construction research of Zhang et al. [83], the HMI of winter wheat spikelets was used as the data source. The instability index (ISI) and spectral angle mapper (SAM) classifier (ISI–SAM) was used to extract four sensitive single wavelengths firstly, and the correlation analysis was performed to determine the most relevant difference in the spectral index at 668 and 417 nm. Then, an exhaustive searching method was used to determine the weight of each feature and finally to construct the FCI. This SDI construction process is almost completely consistent with the Ⅰ-a direction in Figure 7. Furthermore, Mahlein et al. [111] used this method to construct three separate SDIs to detect and monitor Cercospora leaf spot, sugar beet rust, and powdery mildew of sugar beet plant. The RELIEF-F algorithm [112] was used to select the key single spectral signatures and the normalized reflectance difference indices, and also exhaustive searching was used to finish the construction of the four SDIs (the final SDIs are shown in Table 4).
Direct model fitting and classification are the earliest and most intuitionistic approaches in quantitative diagnosis. To diagnosis the disease severity by direct model fitting and classification, statistical methods and machine learning algorithms are commonly used. Because statistical methods are simple to understand theoretically and yield visible results, they are generally used in disease severity quantification. Partial least squares regression (PLSR) is the most commonly used [43,113,114,115]. In the analysis of Zhang et al. [116] regarding Dendrolimus tabulaeformis disaster quantitative diagnosis, PLSR was used to fit the piecewise model. They used both the full wavebands and optimal selected wavebands as independent variables, respectively, and the coefficient of determination (R2) was utilized to ensure the final diagnosis model. Four disease severity grades (healthy, mild, moderate, and several) were divided based on the fitted defoliation percentage. This process is similar to Ⅱ in Figure 7. It is can be seen that in the entire process of disease severity inversion, the model parameters and inversion method are two main aspects. The full spectrum, first and second derivative spectra, spectrum after continuous wavelet analysis, red edge information (position, area, and so on), and sometimes commonly used SVIs and SDIs can be used as parameters of model fitting. Fisher’s linear discrimination analysis (FLDA), the SVM method, logistic regression, multiple linear regression, Dirichlet aggregation regression, Bayes discrimination analysis, and some other model fitting methods are also effective for hyperspectral information analysis. According to the statistical knowledge and previous papers, the regression analysis methods are mainly used in plant disease monitoring and severity assessment, like PLSR and SDA, while the discrimination analysis methods are mainly used in plant disease detection and classification-based contexts such as linear discriminant analysis (LDA) and quadratic discriminant analysis (QDA) [23,86,103,113,117].
It is not difficult to determine that no matter what the situation is, the optimal independent variables’ determination is the most important step in the whole process. Thus, dimension reduction is specific and significant for hyperspectral-based plant disease analysis. Optimal waveband selection has always been a primary concern in hyperspectral data analysis. According to previous studies, principal component analysis (PCA) is mainly used to remove information redundancy between original variables and then reduce the variable dimension as much as possible [118]. This option is not always the best but is the current standard method for this kind of application. Furthermore, the successive projections algorithm (SPA) [119,120], ant colony optimization (ACO) [121], competitive adaptive reweighted sampling (CARS) [122], uninformative variable elimination (UVE) [123], genetic algorithms [25], feature ranking [64], and many other methods have been used and validated in hyperspectral waveband selection. Wang et al. [121] used CARS, ACO, and UVE algorithms simultaneously to select key wavebands for the multi-parameter, non-destructive rapid detection of potato quality. The algorithms of hyperspectral waveband selection are generally based on two principles: (1) the selected band or band combination has the largest amount of information, and (2) the selected band or band combination can facilitate the distinction between certain objects. Thus, it is necessary to determine the best band selection method based on the two principles and algorithm operation rate. In addition, the specific application requirements are considered in the premises of all analyses. It is noteworthy that waveband selection, as the main method of hyperspectral dimensionality reduction, is used not only in SVI or SDI construction, but also in image segmentation or classification and even in regression and model fitting.

4. Discussion and Prospect

4.1. Identification of Different Pathogens and Discrimination of Biotic and Abiotic Stresses Are Always the Primary Challenges in the Disease Research Field

As is well known, once a plant is in a diseased condition, it reacts with protection mechanisms. This process leads to suboptimal growth, which can manifest as changes in variables such as leaf area index, pigmentation, water content, surface visibility, and temperature. All the changes produce more or less important effects on the plants’ (or canopy, leaves) spectral signature. However, as introduced in Section 2, many pathogens and host plant–pathogen interaction processes can cause similar symptoms, which may cause the problem of similar spectral signatures, appearing as the phenomenon of “different bodies with the same spectrum”. Furthermore, the changes in spectral signature are not simply caused by the aforementioned factors; rather, the effects of the measurement environment (solar condition, light source, air humidity, etc.), the observation scales of the targets (canopies, leaves, tissues, etc.), the carrying platform selection (satellite, airborne, laboratory, etc.), and the sensors differences also cannot be ignored. Among many indirect factors, abiotic stresses can be seen as the greatest challenge, because they have the same outbreak conditions as some pathogens and have a high probability of causing non-infectious diseases. Under this condition, it is very difficult to identify the main factors influencing the spectral signature changes if only using non-destructive methods.
The accurate identification of different pathogens and the discrimination of biotic and abiotic stresses are always difficult and cause great challenges in disease research all the time. Even though manual interpretation has been used until now and is often seen as the ground truth in various studies, it is also difficult to obtain accurate results without incorporating biochemical analysis. Compared with other non-destructive methods (RGB imaging, multi-spectral imaging, thermal imaging, fluorescence imaging, etc.), there are more opportunities and possibilities to achieve pathogen identification and abiotic discrimination using hyperspectral data because of the narrow bands. Susič et al. [115] used hyperspectral imaging to detect root-knot nematodes (biotic stress) and the water deficiency (abiotic) stress of tomato plants, respectively. The classification accuracy of machine learning classification method can achieve up to 90%. The modern hyperspectral technologies that can meet these challenges are focused in two main directions:
  • Extension to smaller scales and higher spatial resolutions for pathogen identification. Nowadays, the spectral resolution of hyperspectral technologies can reach 1 nm or higher, which makes hyperspectral data more sensitive to the subtle differences caused by different pathogens. However, the mixed pixel problems of lower spatial resolution data are more complex with improved spectral resolution. The effects of the atmosphere, light source, background, etc. are also relatively complex under lower spatial resolution. Thus, increasingly, many researchers have extended the spatial resolution to the sub-cell level by microscopy. In the smallest scale case, the characteristics of the spectral signature of each pathogen are exactly matched, which makes it easy to accurately determine the spectral difference between pathogens on the same plant. Furthermore, the development of UAV and other aviation facilities effectively improves the flexibility of data acquisition. From another perspective, it is possible to rely upon the pathogen changes in the plant–pathogen interaction process and the bioecological characteristics of different pathogens to acquire hyperspectral data at different times to achieve effective pathogen division.
  • Accounting for auxiliary data to realize discrimination of biotic and abiotic stresses. Almost all infectious plant diseases (biotic stresses) only appear on individual plants in the early stage, and they usually present point distributions before large-scale outbreaks. However, abiotic stresses, including both nutrient stresses and meteorological disasters, occur across wide ranges, and there is no extension process. Biotic stresses show the inhomogeneity of spectral characteristics, correlation indices, and features in hyperspectral images, while abiotic stresses have relatively even distributions. Thus, biotic and abiotic stresses can be discriminated based on their symptom distributions. Nevertheless, the combination with meteorological, soil, and field management data in the early stage and at the field or relatively large scales is necessary for the implementation of discrimination. Once an infectious disease breaks out, it is necessary to coordinate changes in meteorological data in the process of disease development with spatial distribution analysis.
Based on the above analysis, although the identification of different pathogens and the discrimination of biotic and abiotic stresses are always the primary challenges, the development and improvement of RS and the effective adjustment of spectral, spatial, and time resolutions provide opportunities to achieve these objectives.

4.2. Plant Disease Early Warning Is the Key Point of Applying RS Technologies to Field Work

Limited by various national policies and agricultural development situations, the application of RS remains at the level of scientific and governmental research. Farmers have little knowledge of RS technology, especially for the application for plant disease detection. In addition, RS applications are mainly focused on disease loss assessment for management and have had relatively broad trends in agricultural insurance in recent years. Generally, farmers apply pesticides before diseases occur to prevent the occurrence of conventional diseases without considering the area or dosage. Once a special disease occurs in the process of crop growth, the same wide-range pesticide application is selected. However, the large-area and high-dose usage of pesticides and chemical reagents has effects on both the environment and humans. Therefore, it can be seen that the early warning of plant disease, especially image information-based forecasting, is particularly important. Although there have been some studies about plant diseases’ early detection for a long time, especially based on hyperspectral technologies, but it has not been implemented [138,139]. Similarly, there are two main prospective directions for plant disease early warning research according to the research scale:
  • Early-stage detection of plant diseases with multi-source data at the field scale. In recent years, many websites and mobile applications related to agricultural consultation and assistance have increasingly provided crop disease detection and pesticide application guidance. The detection and identification of each pathogen are mainly based on image information recognition by big data analysis; thus, these analyses are always performed after the symptoms have appeared. However, starting from the actual situation of agricultural production, the most important and useful detection should be in the incubation or sporadic occurrence period. Various RS systems are available that could potentially be applied to detect and monitor plant diseases such as VIS-SWIR spectral systems, fluorescence and thermal systems, synthetic aperture radar (SAR), light detection and ranging (LIDAR) systems, and even gamma rays, X-rays, and ultraviolet rays. Each system has its advantages and disadvantages in plant disease detection. Zhang et al. [37] reviewed the characteristics and potential of each system in plant disease detection. The VIS-SWIR system has stable performance with respect to pigment changes and is always used after symptom occurrence but performs poorly in early stage detection. Fluorescence and thermal systems have considerable potential to capture pre-symptom physiological changes but are not suitable for large-scale analysis. The SAR and LIDAR systems are more suitable for structural change analysis. It is not difficult to find that if these different RS systems can be used together, they can achieve complementary advantages, then achieve a plant disease incubation period detection at the field scale.
  • Early warning of plant diseases on the regional or larger scale. The research conducted by the National Center for Atmospheric Research (NCAR) of America has shown that the land surface temperature exhibits a rising trend because of the increase in greenhouse gas emissions and destruction of the ozone sphere, and this rising trend has intensified since the 1970s [140]. Globalization and human activities promote the rapid spread and distribution of plant pathogens, and the globalization climate changes indirectly influence disease occurrence and plant distributions. However, although there has been some research on plant disease warning under climate changes, most studies are focused on niche simulations based on independent time points at small scales [141,142]. For instance, the Intergovernmental Panel on Climate Change provides regular scientific assessments on climate change, implications, and potential future risks for policymakers, as well as putting forward adaptation and mitigation options; hence, plant disease early warning should also be developed in this direction. Therefore, long time-series climate changes and plant disease parameters cannot be ignored. On this premise, the occurrence and development regularities of each disease can be summarized and founded in more detailed and accurate. With large-scale RS image data, expert or prognosis systems based on regional weather data and epidemiological parameters of plant diseases can be utilized to forecast the temporal and spatial spread of diseases in specific growing regions.

4.3. Spaceborne Hyperspectral Technology Requires Synchronous Development of Basic Research and Joint Spaceborne–Airborne–Ground Applications

According to the above analysis, most hyperspectral-based plant disease detection is focused on the laboratory, greenhouse, and field scales. Currently, the application of RS technologies in plant disease analysis on regional, national, or larger scales is mainly based on multispectral data (airborne- or satellite-based images). The main reasons why hyperspectral RS cannot be expanded to large scales are the lack of satellite hyperspectral sensors and the imperfection of big data analysis algorithms and abilities. However, regardless of the identification of different pathogens, discrimination of biotic and abiotic stresses, and larger-scale plant disease early warning, large-scale hyperspectral data are necessary.
  • Joint application of existing mature technologies. The first airborne-based hyperspectral imaging sensor AIS was developed in 1983 by JPL/NASA. Since then, numerous airborne hyperspectral imaging technologies have been developed successively, including AVIRIS (JPL), the Fluorescence Line Imager (Moniteq Ltd. and Itres Research Ltd. for Canadian Department of Fisheries and Oceans), the Compact Airborne Spectrographic Imager (Itres Research Ltd. of Calgary, Alberta, Canada), the Hyperspectral Mapper (Australian Integrated Spectronics Ltd.), and many others. After the success of airborne hyperspectral technologies, satellite-based hyperspectral technology was continuously developed in the late 1990s. Although the first HSI on the Lewis satellite of NASA failed to work properly after it was put into orbit on 23 August 1997, it has also become the beginning of satellite-based hyperspectral technology. Since then, the Fourier Transform Hyperspectral Imager on MightiSat Ⅱ, Hyperion on EO-1, HJ-1A/HSI on HJ-1A, and AHSI on GF-5 have succeeded. All of these types of airborne and spaceborne hyperspectral images have been widely but separately applied in plant RS monitoring, but they are rare in crop disease detection. Nowadays, ground- and UAV-based hyperspectral images form the relevant perfect systems for plant disease detection on small scales. However, these must be combined with airborne or spaceborne hyperspectral technologies to extend the application range and scale. Ground-based hyperspectral images have the advantages of unmixed pixels, flexible and high spatial resolution. Thus, it greatly improves the accuracy of hyperspectral analysis of specific diseases. These characteristics are complementary to those of airborne and spaceborne data, which have lower spatial and time resolutions but higher widths. Thus, the joint application of ground-, airborne-, and spaceborne-based hyperspectral technologies in plant disease analysis is the development trend of hyperspectral technology practices.
  • Establishment of a comprehensive spectrum library of plant diseases. Through the above analysis of different pathogens, advantages and limitations of different scales, and hyperspectral technologies for different plant disease analyses, it can easily be seen that the most significant aspect of plant disease detection by RS is the accuracy of the hyperspectral signature of each pathogen. JPL/NASA has established abundant spectrum datasets for plants, minerals, snow, ice, and other objects. These spectrum libraries contain three sub-libraries: laboratory spectrum library, ground spectrum library, and the hyperspectral remote sensing spectrum library. However, there is no unified standard spectral library for crop diseases. Considering the actual application requirements, the establishment of a comprehensive spectrum library of the global main crop disease is anticipated. To meet the needs of integrated spaceborne–airborne–ground analysis, the spectrum library should include at least three scales: ground, airborne, and spaceborne. Perfect spectrum libraries can provide significant references in practical applications and provide the basis for new and targeted hyperspectral technology.
  • Implementation of targeted spaceborne hyperspectral missions and expansion of its scope of commercialization. Although there are some existing spaceborne hyperspectral sensors, and most of them can be used to monitoring vegetation changes, fewer are clearly focused on vegetation. The HyperSpectral Imager on the IMS-1 satellite of India, which operates in the VNIR spectral range from 450 to 950 nm with a total of 64 spectral bands at a spectral resolution of 8 nm, is specific to the vegetation type measurement and resource characterization. Meanwhile, the HSI of HJ-1A in China is focused on environment and disaster monitoring with 115 bands from 450 to 950 nm. Even so, most spaceborne hyperspectral sensors are non-commercial, significantly limiting their large-scale industrial applications. In recent years, facing the frequent global climate change and disasters, increasingly more countries and organizations have proposed the special hyperspectral RS missions and speed up these trends. The 5 m optical service satellite (ZY-1 02D) equipped with one hyperspectral sensor and one multispectral sensor was put into the predetermined orbit in 2019 and can effectively obtain nine-band multispectral data of 115 km width and 166-band hyperspectral data of 60 km width. This is the first civil hyperspectral service satellite in China and could provide services for precision agriculture in the future. Furthermore, the European Space Agency selected the Fluorescence EXplorer mission proposed for the global monitoring of steady-state chlorophyll fluorescence in terrestrial vegetation, which will operate in a three-instrument array for measurement of the interrelated features of fluorescence, hyperspectral reflectance, and canopy temperature. The HyspIRI mission, which is being developed by JPL/NASA, USA, is planned to be launched in 2021. The equipped VIR-SWIR and thermal infrared sensors will be utilized to study ecosystems worldwide; provide critical information on natural disasters such as volcanoes, wildfires, and drought; and may be useful for plant disease early warning. Furthermore, the successful launch of the Environmental Mapping and Analysis Program (EnMAP) in Germany, Hyperspectral Imager Suite (HISUI) in Japan, and Hyperspectral Precursor and Application Mission (PRISMA) of the Italian Space Agency can be used for vegetation status detection, product development for agricultural areas, and the management and monitoring of natural and induced hazards in the future.

5. Conclusions

Plant diseases contribute to significant economic and post-harvest losses in the agricultural production sector worldwide, especially under the influences of the climate changes in recent years. In the continuous research, many effective methods for plant disease detection, monitoring and assessment have been accumulated. Professional visual interpretation, biochemical analysis, and pathological analysis have been well developed. Non-invasive technologies have been paid more attention in recent years, and hyperspectral technology is particularly prominent. This review has summarized the principle, sensors, advanced technologies, challenges, and development trends associated with the hyperspectral-based plant disease detection framework. The contents may be summarized as follows:
  • Hyperspectral technology-based plant disease detection is drawing increasing attention. As shown in Figure 1, hyperspectral-based plant disease analysis technology emerged in 2002 and has been developing rapidly in the following 10 years. It has been developing continuously with the maturity of related technologies in the past 10 years. These developments provide many methods and ideas for future research and analysis, as well as reliable support for plant protection.
  • The mainstream technologies are focused on small scales, and satellite payloads require further development and attention. In the past three decades, almost 86% of hyperspectral imaging research has been focused on field and laboratory environments and more concern has been placed on the leaf and canopy scales. However, large-scale accurate analysis is necessary for practical applications. Thus, scale transformation methods for both the spatial and spectral scales require more attention. Although the algorithms for hyperspectral data analysis on small scales can provide technical support for regional or larger scales, it is difficult to achieve large-scale monitoring without the assistance of satellite payload.
  • Close attention should be paid to the information integration analysis of satellite scales. After the implementation of targeted hyperspectral satellite missions, big data collection, pre-processing, and analysis will be the priorities. The real-time dynamic monitoring of plant disease at the regional, national, and global scales can be realized only if large-scale data integration analysis is achieved. With the development of multi-source RS data, the fusion of multi-source data may be a development trend in the future.

Author Contributions

N.Z. and G.Y. defined the scope of the manuscript, and N.Z. wrote the manuscript, Y.P., X.Y., L.C. and C.Z. corrected the manuscript. All authors have read and agreed to the published version of the manuscript.

Funding

This work was supported by: National Key Research and Development Program of China (2017YFE0122500), National Natural Science Foundation of China (31901240), and China Postdoctoral Science Foundation Funded Project (2018M640092).

Conflicts of Interest

The funders had no role in the design of the study; in the collection, analyses, or interpretation of data; in the writing of the manuscript, or in the decision to publish the results.

References

  1. Moshou, D.; Pantazi, X.E.; Kateris, D.; Gravalos, I. Water stress detection based on optical multisensor fusion with a least squares support vector machine classifier. Biosyst. Eng. 2014, 117, 15–22. [Google Scholar] [CrossRef]
  2. FAO. New Standards to Curb the Global Spread of Plant Pests and Diseases. Available online: http://www.fao.org/news/story/en/item/1187738/icode/ (accessed on 3 April 2019).
  3. FAO. Declaration of the World Summit on Food Security; Food and Agriculture Organization: Rome, Italy, 2009. [Google Scholar]
  4. Carvajal-Yepes, M.; Cardwell, K.; Nelson, A.; Garrett, K.A.; Giovani, B.; Saunders, D.G.O.; Kamoun, S.; Legg, J.P.; Verdier, V.; Lessel, J.; et al. A global surveillance system for crop diseases. Science 2019, 364, 1237–1239. [Google Scholar] [CrossRef] [Green Version]
  5. Nganje, W.E.; Bangsund, D.A.; Leistritz, F.L.; Wilson, W.W.; Tiapo, N.M. Regional economic impacts of Fusarium head blight in wheat and barley. Rev. Agric. Econ. 2004, 26, 332–347. [Google Scholar] [CrossRef]
  6. Barbedo, J.G.A. A review on the main challenges in automatic plant disease identification based on visible range images. Biosyst. Eng. 2016, 144, 52–60. [Google Scholar] [CrossRef]
  7. Ruiz-Ruiz, S.; Ambrós, S.; Vives, M.D.C.; Navarro, L.; Moreno, P.; Guerri, J. Detection and quantitation of Citrus leaf blotch virus by TaqMan real-time RT-PCR. J. Virol. Methods 2009, 160, 57–62. [Google Scholar] [CrossRef] [PubMed]
  8. Sankaran, S.; Mishra, A.; Ehsani, R.; Davis, C. A review of advanced techniques for detecting plant diseases. Comput. Electron. Agric. 2010, 72, 1–12. [Google Scholar] [CrossRef]
  9. Yvon, M.; Thébaud, G.; Alary, R.; Labonne, G. Specific detection and quantification of the phytopathogenic agent ‘Candidatus Phytoplasma prunorum’. Mol. Cell. Probes 2009, 23, 227–234. [Google Scholar] [CrossRef]
  10. Ali, M.M.; Bachik, N.A.; Muhadi, N.A.; Yusof, T.N.T.; Gomes, C. Non-destructive techniques of detecting plant diseases: A review. Physiol. Mol. Plant Pathol. 2019, 108, 101426–101437. [Google Scholar] [CrossRef]
  11. Golhani, K.; Balasundram, S.K.; Vadamalai, G.; Pradhan, B. A review of neural networks in plant disease detection using hyperspectral data. Inf. Process. Agric. 2018, 5, 354–371. [Google Scholar] [CrossRef]
  12. Purcell, D.E.; O’Shea, M.G.; Johnson, R.A.; Kokot, S. Near-infrared spectroscopy for the prediction of disease ratings for Fiji leaf gall in sugarcane clones. Appl. Spectrosc. 2009, 63, 450–457. [Google Scholar] [CrossRef]
  13. Shrestha, S.; Deleuran, L.C.; Gislum, R. Classification of different tomato seed cultivars by multispectral visible-near infrared spectroscopy and chemometrics. J. Spectr. Imaging 2016, 5, 1–8. [Google Scholar] [CrossRef]
  14. Borges, E.; Matos, A.P.; Cardoso, J.M.; Correia, C.; Vasconcelos, T.; Gomes, N. Early detection and monitoring of plant diseases by Bioelectric Impedance Spectroscopy. In Proceedings of the 2012 IEEE 2nd Portuguese Meeting in Bioengineering (ENBENG), Coimbra, Portugal, 23–25 February 2012; pp. 1–4. [Google Scholar]
  15. Belasque, J., Jr.; Gasparoto, M.C.G.; Marcassa, L.G. Detection of mechanical and disease stresses in citrus plants by fluorescence spectroscopy. Appl. Opt. 2008, 47, 1922–1926. [Google Scholar] [CrossRef] [PubMed]
  16. Dhingra, G.; Kumar, V.; Joshi, H.D. Study of digital image processing techniques for leaf disease detection and classification. Multimed. Tools Appl. 2017, 77, 19951–20000. [Google Scholar] [CrossRef]
  17. Barbedo, J.G.A. Digital image processing techniques for detecting, quantifying and classifying plant diseases. Springerplus 2013, 2, 660–671. [Google Scholar] [CrossRef] [Green Version]
  18. Cen, H.; Weng, H.; Yao, J.; He, M.; Lv, J.; Hua, S.; Li, H.; He, Y. Chlorophyll fluorescence imaging uncovers photosynthetic fingerprint of citrus Huanglongbing. Front. Plant Sci. 2017, 8, 1509–1519. [Google Scholar] [CrossRef] [Green Version]
  19. Raza, S.-e.-A.; Prince, G.; Clarkson, J.P.; Rajpoot, N.M. Automatic detection of diseased tomato plants using thermal and stereo visible light images. PLoS ONE 2015, 10, e0123262–e0123281. [Google Scholar] [CrossRef]
  20. Sankaran, S.; Maja, J.M.; Buchanon, S.; Ehsani, R. Huanglongbing (citrus greening) detection using visible, near infrared and thermal imaging techniques. Sensors 2013, 13, 2117–2130. [Google Scholar] [CrossRef] [Green Version]
  21. Söderström, M.; Börjesson, T.; Roland, B.; Stadig, H. Modelling within-field variations in deoxynivalenol (DON) content in oats using proximal and remote sensing. Precis. Agric. 2014, 16, 1–14. [Google Scholar] [CrossRef]
  22. Wahabzada, M.; Mahlein, A.-K.; Bauckhage, C.; Steiner, U.; Oerke, E.-C.; Kersting, K. Plant phenotyping using probabilistic topic models: Uncovering the hyperspectral language of plants. Sci. Rep. 2016, 6, 22482–22492. [Google Scholar] [CrossRef] [Green Version]
  23. López-López, M.; Calderón, R.; González-Dugo, V.; Zarco-Tejada, P.; Fereres, E. Early detection and quantification of almond red leaf blotch using high-resolution hyperspectral and thermal imagery. Remote Sens. 2016, 8, 276. [Google Scholar] [CrossRef] [Green Version]
  24. Mahlein, A.-K.; Hammersley, S.; Oerke, E.-C.; Dehne, H.-W.; Goldbach, H.; Grieve, B. Supplemental blue LED lighting array to improve the signal quality in hyperspectral imaging of plants. Sensors 2015, 15, 12834–12840. [Google Scholar] [CrossRef]
  25. Al-Saddik, H.; Simon, J.-C.; Cointault, F. Development of spectral disease indices for ‘Flavescence Doree’ grapevine disease identification. Sensors 2017, 17, 2772. [Google Scholar] [CrossRef] [PubMed] [Green Version]
  26. Ghamisi, P.; Plaza, J.; Chen, Y.; Li, J.; Plaza, A. Advanced Supervised Spectral Classifiers for Hyperspectral Images A review. IEEE Geosci. Remote Sens. Mag. 2017, 5, 8–32. [Google Scholar] [CrossRef] [Green Version]
  27. Zhou, W.; Zhang, J.; Zou, M.; Liu, X.; Du, X.; Wang, Q.; Liu, Y.; Liu, Y.; Li, J. Prediction of cadmium concentration in brown rice before harvest by hyperspectral remote sensing. Environ. Sci. Pollut. Res. Int. 2019, 26, 1848–1856. [Google Scholar] [CrossRef] [PubMed]
  28. Thomas, S.; Kuska, M.T.; Bohnenkamp, D.; Brugger, A.; Alisaac, E.; Wahabzada, M.; Behmann, J.; Mahlein, A.-K. Benefits of hyperspectral imaging for plant disease detection and plant protection: A technical perspective. J. Plant Dis. Prot. 2017, 125, 5–20. [Google Scholar] [CrossRef]
  29. Virlet, N.; Sabermanesh, K.; Sadeghi-Tehran, P.; Hawkesford, M.J. Field Scanalyzer: An automated robotic field phenotyping platform for detailed crop monitoring. Funct. Plant Biol. 2017, 44, 143–153. [Google Scholar] [CrossRef] [PubMed] [Green Version]
  30. Bock, C.H.; Poole, G.H.; Parker, P.E.; Gottwald, T.R. Plant disease severity estimated visually, by digital photography and image analysis, and by hyperspectral imaging. Crit. Rev. Plant Sci. 2010, 29, 59–107. [Google Scholar] [CrossRef]
  31. Lee, W.S.; Alchanatis, V.; Yang, C.; Hirafuji, M.; Moshou, D.; Li, C. Sensing technologies for precision specialty crop production. Comput. Electron. Agric. 2010, 74, 2–33. [Google Scholar] [CrossRef]
  32. West, J.S.; Bravo, C.; Oberti, R.; Lemaire, D.; Moshou, D.; McCartney, H.A. The potential of optical canopy measurement for targeted control of field crop diseases. Annu. Rev. Phytopathol. 2003, 41, 593–614. [Google Scholar] [CrossRef] [Green Version]
  33. Bauriegel, E.; Herppich, W. Hyperspectral and chlorophyll fluorescence imaging for early detection of plant diseases, with special reference to Fusarium spec. infections on wheat. Agriculture 2014, 4, 32–57. [Google Scholar] [CrossRef] [Green Version]
  34. Baranowski, P.; Jedryczka, M.; Mazurek, W.; Babula-Skowronska, D.; Siedliska, A.; Kaczmarek, J. Hyperspectral and thermal imaging of oilseed rape (Brassica napus) response to fungal species of the genus Alternaria. PLoS ONE 2015, 10, e0012313–e0122913. [Google Scholar] [CrossRef] [PubMed] [Green Version]
  35. Graeff, S.; Link, J.; Claupein, W. Identification of powdery mildew (Erysiphe graminis sp. tritici) and take-all disease (Gaeumannomyces graminis sp. tritici) in wheat (Triticum aestivum L.) by means of leaf reflectance measurements. Open Life Sci. 2006. [Google Scholar] [CrossRef]
  36. Shurtleff, M.C.; Pelczar, M.J.; Kelman, A.; Pelczar, R.M. Plant disease. In Plant Pathology; Encyclopedia Britannica: Chicago, IL, USA, 2020; Available online: https://www.britannica.com/science/plant-disease (accessed on 1 April 2020).
  37. Zhang, J.; Huang, Y.; Pu, R.; Gonzalez-Moreno, P.; Yuan, L.; Wu, K.; Huang, W. Monitoring plant diseases and pests through remote sensing technology: A review. Comput. Electron. Agric. 2019, 165, 104943–104956. [Google Scholar] [CrossRef]
  38. Boyd, L.A.; Christopher, R.; O’Sullivan, D.M.; Leach, J.E.; Hei, L. Plant-pathogen interactions: Disease resistance in modern agriculture. Trends Genet. 2013, 29, 233–240. [Google Scholar] [CrossRef] [PubMed]
  39. Mahlein, A.-K.; Kuska, M.T.; Behmann, J.; Polder, G.; Walter, A. Hyperspectral sensors and imaging technologies in phytopathology: State of the art. Annu. Rev. Phytopathol. 2018, 56, 535–558. [Google Scholar] [CrossRef]
  40. Pinzón, A.; Barreto, E.; Bernal, A.; Achenie, L.; González Barrios, A.F.; Isea, R.; Restrepo, S. Computational models in plant-pathogen interactions: The case of Phytophthora infestans. Theor. Biol. Med. Model. 2009, 6, 24–34. [Google Scholar] [CrossRef] [Green Version]
  41. Jiang, Z. Large-Scale Transcriptional Data Analyses of Plant Immune Responses. Ph.D. Thesis, China Agricultural University, Beijing, China, 2017. [Google Scholar]
  42. Mahlein, A.-K.; Alisaac, E.; Masri, A.A.; Behmann, J.; Dehne, H.-W.; Oerke, E.-C. Comparison and combination of thermal, fluorescence and hyperspectral imaging for monitoring Fusarium head blight of wheat on spikelet scale. Sensors 2019, 19, 2281. [Google Scholar] [CrossRef] [Green Version]
  43. Yuan, L.; Huang, Y.; Loraamm, R.W.; Nie, C.; Wang, J.; Zhang, J. Spectral analysis of winter wheat leaves for detection and differentiation of diseases and insects. Field Crop. Res. 2014, 156, 199–207. [Google Scholar] [CrossRef] [Green Version]
  44. Oerke, E.-C.; Herzog, K.; Toepfer, R. Hyperspectral phenotyping of the reaction of grapevine genotypes to Plasmopara viticola. J. Exp. Bot. 2016, 67, 5529–5543. [Google Scholar] [CrossRef] [Green Version]
  45. Polder, G.; Blok, P.M.; de Villiers, H.A.C.; van der Wolf, J.M.; Kamp, J. Potato virus Y detection in seed potatoes using deep learning on hyperspectral images. Front. Plant Sci. 2019, 10, 209–221. [Google Scholar] [CrossRef] [Green Version]
  46. Jin, X.; Jie, L.; Wang, S.; Qi, H.; Li, S. Classifying wheat hyperspectral pixels of healthy heads and Fusarium head blight disease using a deep neural network in the wild field. Remote Sens. 2018, 10, 395. [Google Scholar] [CrossRef] [Green Version]
  47. Chen, D.; Shi, Y.; Huang, W.; Zhang, J.; Wu, K. Mapping wheat rust based on high spatial resolution satellite imagery. Comput. Electron. Agric. 2018, 152, 109–116. [Google Scholar] [CrossRef]
  48. Alisaac, E.; Behmann, J.; Kuska, M.T.; Dehne, H.-W.; Mahlein, A.-K. Hyperspectral quantification of wheat resistance to Fusarium head blight: Comparison of two Fusarium species. Eur. J. Plant Pathol. 2018, 152, 869–884. [Google Scholar] [CrossRef]
  49. Ashourloo, D.; Aghighi, H.; Matkan, A.A.; Mobasheri, M.R.; Rad, A.M. An Investigation Into Machine Learning Regression Techniques for the Leaf Rust Disease Detection Using Hyperspectral Measurement. IEEE J. Sel. Top. Appl. Earth Obs. Remote Sens. 2016, 9, 4344–4351. [Google Scholar] [CrossRef]
  50. Ashourloo, D.; Mobasheri, M.; Huete, A. Developing Two Spectral Disease Indices for Detection of Wheat Leaf Rust (Pucciniatriticina). Remote Sens. 2014, 6, 4723–4740. [Google Scholar] [CrossRef] [Green Version]
  51. Huang, W.; Lu, J.; Ye, H.; Kong, W.; Mortimer, A.H.; Shi, Y. Quantitative identification of crop disease and nitrogen-water stress in winter wheat using continuous wavelet analysis. Int. J. Agric. Biol. Eng. 2018, 11, 145–152. [Google Scholar] [CrossRef] [Green Version]
  52. Zhu, M.; Yang, H.; Li, Z. Early Detection and Identification of Rice Sheath Blight Disease Based on Hyperspectral Image and Chlorophyll Content. Spectrosc Spectr. Anal. 2019, 39, 1898–1904. [Google Scholar] [CrossRef]
  53. Huang, S.; Qi, L.; Ma, X.; Xue, K.; Wang, W.; Zhu, X. Hyperspectral image analysis based on BoSW model for rice panicle blast grading. Comput. Electron. Agric. 2015, 118, 167–178. [Google Scholar] [CrossRef]
  54. Dhau, I.; Adam, E.; Mutanga, O.; Ayisi, K.; Abdel-Rahman, E.M.; Odindi, J.; Masocha, M. Testing the capability of spectral resolution of the new multispectral sensors on detecting the severity of grey leaf spot disease in maize crop. Geocarto Int. 2017, 33, 1223–1236. [Google Scholar] [CrossRef]
  55. Adam, E.; Deng, H.; Odindi, J.; Abdel-Rahman, E.M.; Mutanga, O. Detecting the early stage of Phaeosphaeria leaf spot infestations in maize crop using in situ hyperspectral data and guided regularized random forest algorithm. J. Spectrosc. 2017, 2017, 1–8. [Google Scholar] [CrossRef]
  56. Williams, P.J.; Bezuidenhout, C.; Rose, L.J. Differentiation of maize ear rot pathogens, on growth media, with near infrared hyperspectral imaging. Food Anal. Methods 2019, 12, 1556–1570. [Google Scholar] [CrossRef]
  57. Nagasubramanian, K.; Jones, S.; Sarkar, S.; Singh, A.K.; Singh, A.; Ganapathysubramanian, B. Hyperspectral band selection using genetic algorithm and support vector machines for early identification of charcoal rot disease in soybean stems. Plant Methods 2018, 14, 86–92. [Google Scholar] [CrossRef] [PubMed]
  58. Gazala, I.F.S.; Sahoo, R.N.; Pandey, R.; Mandal, B.; Gupta, V.K.; Singh, R.; Sinha, P. Spectral reflectance pattern in soybean for assessing yellow mosaic disease. Indian J. Virol. 2013, 24, 242–249. [Google Scholar] [CrossRef] [PubMed] [Green Version]
  59. Franceschini, M.H.D.; Bartholomeus, H.; van Apeldoorn, D.F.; Suomalainen, J.; Kooistra, L. Feasibility of unmanned aerial vehicle optical imagery for early detection and severity assessment of late blight in potato. Remote Sens. 2019, 11, 224. [Google Scholar] [CrossRef] [Green Version]
  60. Mahlein, A.-K.; Steiner, U.; Dehne, H.-W.; Oerke, E.-C. Spectral signatures of sugar beet leaves for the detection and differentiation of diseases. Precis. Agric. 2010, 11, 413–431. [Google Scholar] [CrossRef]
  61. Mahlein, A.-K.; Steiner, U.; Hillnhutter, C.; Dehne, H.-W.; Oerke, E.-C. Hyperspectral imaging for small-scale analysis of symptoms caused by different sugar beet diseases. Plant Methods 2012, 8, 3–15. [Google Scholar] [CrossRef] [Green Version]
  62. Rumpf, T.; Mahlein, A.-K.; Steiner, U.; Oerke, E.-C.; Dehne, H.W.; Plümer, L. Early detection and classification of plant diseases with Support Vector Machines based on hyperspectral reflectance. Comput. Electron. Agric. 2010, 74, 91–99. [Google Scholar] [CrossRef]
  63. Reynolds, G.J.; Windels, C.E.; MacRae, I.V.; Laguette, S. Remote sensing for assessing Rhizoctonia crown and root rot severity in sugar beet. Plant Dis. 2012, 96, 497–505. [Google Scholar] [CrossRef]
  64. Xie, C.; Yang, C.; He, Y. Hyperspectral imaging for classification of healthy and gray mold diseased tomato leaves with different infection severities. Comput. Electron. Agric. 2017, 135, 154–162. [Google Scholar] [CrossRef]
  65. Lu, J.; Zhou, M.; Gao, Y.; Jiang, H. Using hyperspectral imaging to discriminate yellow leaf curl disease in tomato leaves. Precis. Agric. 2017, 19, 379–394. [Google Scholar] [CrossRef]
  66. Abdulridha, J.; Batuman, O.; Ampatzidis, Y. UAV-based remote sensing technique to detect citrus canker disease utilizing hyperspectral imaging and machine learning. Remote Sens. 2019, 11, 1373. [Google Scholar] [CrossRef] [Green Version]
  67. Li, X.; Lee, W.S.; Li, M.; Ehsani, R.; Mishra, A.R.; Yang, C.; Mangan, R.L. Spectral difference analysis and airborne imaging classification for citrus greening infected trees. Comput. Electron. Agric. 2012, 83, 32–46. [Google Scholar] [CrossRef]
  68. Couture, J.J.; Singh, A.; Charkowski, A.O.; Groves, R.L.; Gray, S.M.; Bethke, P.C.; Townsend, P.A. Integrating spectroscopy with potato disease management. Plant Dis. 2018, 102, 2233–2240. [Google Scholar] [CrossRef] [Green Version]
  69. Zhang, J.; Wang, N.; Yuan, L.; Chen, F.; Wu, K. Discrimination of winter wheat disease and insect stresses using continuous wavelet features extracted from foliar spectral measurements. Biosyst. Eng. 2017, 162, 20–29. [Google Scholar] [CrossRef]
  70. Kuska, M.T.; Wahabzada, M.; Leucker, M.; Dehne, H.-W.; Kersting, K.; Oerke, E.-C.; Steiner, U.; Mahlein, A.-K. Hyperspectral phenotyping on the microscopic scale: Towards automated characterization of plant-pathogen interactions. Plant Methods 2015, 11, 28–41. [Google Scholar] [CrossRef] [PubMed] [Green Version]
  71. Qin, J.; Burks, T.F.; Ritenour, M.A.; Bonn, W.G. Detection of citrus canker using hyperspectral reflectance imaging with spectral information divergence. J. Food Eng. 2009, 93, 183–191. [Google Scholar] [CrossRef]
  72. Abdulridha, J.; Ampatzidis, Y.; Ehsani, R.; de Castro, A.I. Evaluating the performance of spectral features and multivariate analysis tools to detect laurel wilt disease and nutritional deficiency in avocado. Comput. Electron. Agric. 2018, 155, 203–211. [Google Scholar] [CrossRef]
  73. Shi, Y.; Huang, W.; González-Moreno, P.; Luke, B.; Dong, Y.; Zheng, Q.; Ma, H.; Liu, L. Wavelet-based rust spectral feature set (WRSFs): A novel spectral feature set based on continuous wavelet transformation for tracking progressive host–pathogen interaction of yellow rust on wheat. Remote Sens. 2018, 10, 525. [Google Scholar] [CrossRef] [Green Version]
  74. Pinto, F.; Damm, A.; Schickling, A.; Panigada, C.; Cogliati, S.; Muller-Linow, M.; Balvora, A.; Rascher, U. Sun-induced chlorophyll fluorescence from high-resolution imaging spectroscopy data to quantify spatio-temporal patterns of photosynthetic function in crop canopies. Plant Cell Environ. 2016, 39, 1500–1512. [Google Scholar] [CrossRef] [Green Version]
  75. Bravo, C.; Moshou, D.; West, J.; McCartney, A.; Ramon, H. Early disease detection in wheat fields using spectral reflectance. Biosyst. Eng. 2003, 84, 137–145. [Google Scholar] [CrossRef]
  76. Huang, L.; Zhao, J.; Zhang, D.; Yuan, L.; Dong, Y.; Zhang, J. Identifying and mapping stripe rust in winter wheat using multi-temporal airborne hyperspectral images. Int. J. Agric. Biol. 2012, 14, 697–704. [Google Scholar]
  77. Vanegas, F.; Bratanov, D.; Powell, K.; Weiss, J.; Gonzalez, F. A novel methodology for improving plant pest surveillance in vineyards and crops using UAV-based hyperspectral and spatial data. Sensors 2018, 18, 260. [Google Scholar] [CrossRef] [PubMed] [Green Version]
  78. Hillnhütter, C.; Mahlein, A.-K.; Sikora, R.A.; Oerke, E.-C. Remote sensing to detect plant stress induced by Heterodera schachtii and Rhizoctonia solani in sugar beet fields. Field Crop. Res. 2011, 122, 70–77. [Google Scholar] [CrossRef]
  79. Zhang, M.; Qin, Z.; Liu, X.; Ustin, S.L. Detection of stress in tomatoes induced by late blight disease in California, USA, using hyperspectral remote sensing. Int. J. Appl. Earth Obs. Geoinf. 2003, 4, 295–310. [Google Scholar] [CrossRef]
  80. Mirik, M.; Ansley, R.J.; Price, J.A.; Workneh, F.; Rush, C.M. Remote monitoring of wheat streak mosaic progression using sub-pixel classification of Landsat 5 TM imagery for site specific disease management in winter wheat. Adv. Remote Sens. 2013, 2, 16–28. [Google Scholar] [CrossRef] [Green Version]
  81. Suomalainen, J.; Anders, N.; Iqbal, S.; Roerink, G.; Franke, J.; Wenting, P.; Hünniger, D.; Bartholomeus, H.; Becker, R.; Kooistra, L. A Lightweight hyperspectral mapping system and photogrammetric processing chain for unmanned aerial vehicles. Remote Sens. 2014, 6, 11013–11030. [Google Scholar] [CrossRef] [Green Version]
  82. Jay, S.; Bendoula, R.; Hadoux, X.; Féret, J.-B.; Gorretta, N. A physically-based model for retrieving foliar biochemistry and leaf orientation using close-range imaging spectroscopy. Remote Sens. Environ. 2016, 177, 220–236. [Google Scholar] [CrossRef] [Green Version]
  83. Zhang, N.; Pan, Y.; Feng, H.; Zhao, X.; Yang, X.; Ding, C.; Yang, G. Development of Fusarium head blight classification index using hyperspectral microscopy images of winter wheat spikelets. Biosyst. Eng. 2019, 186, 83–99. [Google Scholar] [CrossRef]
  84. Moshou, D.; Bravo, C.; West, J.; Wahlen, S.; McCartney, A.; Ramon, H. Automatic detection of ‘yellow rust’ in wheat using reflectance measurements and neural networks. Comput. Electron. Agric. 2004, 44, 173–188. [Google Scholar] [CrossRef]
  85. Singh, C.B.; Jayas, D.S.; Paliwal, J.; White, N.D.G. Detection of midge-damaged wheat kernels using short-wave near-infrared hyperspectral and digital colour imaging. Biosyst. Eng. 2010, 105, 380–387. [Google Scholar] [CrossRef]
  86. Shahin, M.A.; Symons, S.J. Detection of Fusarium damaged kernels in Canada Western Red Spring wheat using visible/near-infrared hyperspectral imaging and principal component analysis. Comput. Electron. Agric. 2011, 75, 107–112. [Google Scholar] [CrossRef]
  87. Mirik, M.; Jones, D.C.; Price, J.A.; Workneh, F.; Ansley, R.J.; Rush, C.M. Satellite remote sensing of wheat infected by wheat streak mosaic virus. Plant Dis. 2011, 95, 4–12. [Google Scholar] [CrossRef] [Green Version]
  88. Nagasubramanian, K.; Jones, S.; Singh, A.K.; Singh, A.; Ganapathysubramanian, B.; Sarkar, S. Explaining hyperspectral imaging based plant disease identification: 3D CNN and saliency maps. In Proceedings of the 31st Conference on Neural Information Processing Systems (NIPS 2017), Long Beach, CA, USA, 4–9 December 2017. [Google Scholar]
  89. Mishra, P.; Asaari, M.S.M.; Herrero-Langreo, A.; Lohumi, S.; Diezma, B.; Scheunders, P. Close range hyperspectral imaging of plants: A review. Biosyst. Eng. 2017, 164, 49–67. [Google Scholar] [CrossRef]
  90. Pandey, P.; Ge, Y.; Stoerger, V.; Schnable, J.C. High throughput In vivo analysis of plant leaf chemical properties using hyperspectral imaging. Front. Plant Sci. 2017, 8, 1348–1359. [Google Scholar] [CrossRef] [Green Version]
  91. Tekle, S.; Mage, I.; Segtnan, V.H.; Bjørnstad, A. Near-infrared hyperspectral imaging of Fusarium-damaged oats (Avena sativa L.). Cereal Chem. 2015, 92, 73–80. [Google Scholar] [CrossRef] [Green Version]
  92. Li, J.; Zhang, R.; Li, J.; Wang, Z.; Zhang, H.; Zhan, B.; Jiang, Y. Detection of early decayed oranges based on multispectral principal component image combining both bi-dimensional empirical mode decomposition and watershed segmentation method. Postharvest Biol. Technol. 2019, 158, 110986–110996. [Google Scholar] [CrossRef]
  93. Liu, J.; Chiang, C.; Chen, S. Image-based plant recognition by fusion of multimodal information. In Proceedings of the 10th International Conference on Innovative Mobile and Internet Services in Ubiquitous Computing (IMIS), Fukuoka, Japan, 6–8 July 2016; pp. 5–11. [Google Scholar]
  94. Liu, J.; Lin, T. Location and image-based plant recognition and recording system. J. Inf. Hiding Multimed. Signal Process. 2015, 6, 898–910. [Google Scholar]
  95. Williams, D.; Britten, A.; McCallum, S.; Jones, H.; Aitkenhead, M.; Karley, A.; Loades, K.; Prashar, A.; Graham, J. A method for automatic segmentation and splitting of hyperspectral images of raspberry plants collected in field conditions. Plant Methods 2017, 13, 74–85. [Google Scholar] [CrossRef] [Green Version]
  96. Sun, G.; Zhang, A.; Ren, J.; Ma, J.; Wang, P.; Zhang, Y.; Jia, X. Gravitation-based edge detection in hyperspectral images. Remote Sens. 2017, 9, 592. [Google Scholar] [CrossRef] [Green Version]
  97. Perez-Sanz, F.; Navarro, P.J.; Egea-Cortines, M. Plant phenomics: An overview of image acquisition technologies and image data analysis algorithms. Gigascience 2017, 6, 1–18. [Google Scholar] [CrossRef] [Green Version]
  98. Xie, C.; He, Y. Spectrum and image texture features analysis for early blight disease detection on eggplant leaves. Sensors 2016, 16, 676. [Google Scholar] [CrossRef] [PubMed] [Green Version]
  99. Wei, F. Research on Feature Extraction and Feature Selection for Hyperspectral Remote Sensing Data; Northwestern Polytechnical University: Xi’an, China, 2015. [Google Scholar]
  100. Knauer, U.; Matros, A.; Petrovic, T.; Zanker, T.; Scott, E.S.; Seiffert, U. Improved classification accuracy of powdery mildew infection levels of wine grapes by spatial-spectral analysis of hyperspectral images. Plant Methods 2017, 13, 31–47. [Google Scholar] [CrossRef] [PubMed]
  101. Lowe, A.; Harrison, N.; French, A.P. Hyperspectral image analysis techniques for the detection and classification of the early onset of plant disease and stress. Plant Methods 2017, 13, 80–91. [Google Scholar] [CrossRef] [PubMed]
  102. Yeh, Y.F.; Chung, W.; Liao, J.; Chung, C.; Kuo, Y.; Lin, T. A Comparison of Machine Learning Methods on Hyperspectral Plant Disease Assessments. IFAC Proc. Vol. 2013, 46, 361–365. [Google Scholar] [CrossRef] [Green Version]
  103. Moshou, D.; Bravo, C.; Oberti, R.; West, J.; Bodria, L.; McCartney, A.; Ramon, H. Plant disease detection based on data fusion of hyper-spectral and multi-spectral fluorescence imaging using Kohonen maps. Real-Time Imaging 2005, 11, 75–83. [Google Scholar] [CrossRef]
  104. Golhani, K.; Balasundram, S.K.; Vadamalai, G.; Pradhan, B. Estimating chlorophyll content at leaf scale in viroid-inoculated oil palm seedlings (Elaeis guineensis Jacq.) using reflectance spectra (400 nm–1050 nm). Int. J. Remote Sens. 2019, 40, 7647–7662. [Google Scholar] [CrossRef]
  105. Joalland, S.; Screpanti, C.; Liebisch, F.; Varella, H.V.; Gaume, A.; Walter, A. Comparison of visible imaging, thermography and spectrometry methods to evaluate the effect of Heterodera schachtii inoculation on sugar beets. Plant Methods 2017, 13, 73–86. [Google Scholar] [CrossRef]
  106. Prabhakar, M.; Prasad, Y.G.; Thirupathi, M.; Sreedevi, G.; Dharajothi, B.; Venkateswarlu, B. Use of ground based hyperspectral remote sensing for detection of stress in cotton caused by leafhopper (Hemiptera: Cicadellidae). Comput. Electron. Agric. 2011, 79, 189–198. [Google Scholar] [CrossRef]
  107. Geospatial, L.H. EO-1 Hyperion Vegetation Indices Tutorial. Available online: http://www.harrisgeospatial.com/docs/narrowbandgreenness.html (accessed on 3 April 2019).
  108. Calderón, R.; Navas-Cortés, J.A.; Lucena, C.; Zarco-Tejada, P.J. High-resolution airborne hyperspectral and thermal imagery for early detection of Verticillium wilt of olive using fluorescence, temperature and narrow-band spectral indices. Remote Sens. Environ. 2013, 139, 231–245. [Google Scholar] [CrossRef]
  109. Devadas, R.; Lamb, D.W.; Simpfendorfer, S.; Backhouse, D. Evaluating ten spectral vegetation indices for identifying rust infection in individual wheat leaves. Precis. Agric. 2008, 10, 459–470. [Google Scholar] [CrossRef]
  110. Berdugo, C.A.; Zito, R.; Paulus, S.; Mahlein, A.-K. Fusion of sensor data for the detection and differentiation of plant diseases in cucumber. Plant Pathol. 2014, 63, 1344–1356. [Google Scholar] [CrossRef]
  111. Mahlein, A.-K.; Rumpf, T.; Welke, P.; Oerke, E.-C.; Plümer, L.; Steiner, U.; Oerke, E.-C. Development of spectral indices for detecting and identifying plant diseases. Remote Sens. Environ. 2013, 128, 21–30. [Google Scholar] [CrossRef]
  112. Kononenko, I. Analysis and extensions of relief. In Proceedings of the European Conference on Machine Learning; Springer: Secaucus, NJ, USA; pp. 171–182.
  113. Cao, X.; Luo, Y.; Zhou, Y.; Fan, J.; Xu, X.; West, J.S.; Duan, X.; Cheng, D. Detection of powdery mildew in two winter wheat plant densities and prediction of grain yield using canopy hyperspectral reflectance. PLoS ONE 2015, 10, e0121462–e0121479. [Google Scholar] [CrossRef] [PubMed] [Green Version]
  114. Wang, H.; Qin, F.; Ruan, L.I.; Wang, R.; Liu, Q.; Ma, Z.; Li, X.; Cheng, P.; Wang, H. Identification and severity determination of wheat stripe rust and wheat leaf rust based on hyperspectral data acquired using a black-paper-based measuring method. PLoS ONE 2016, 11, e0154648–e0154674. [Google Scholar] [CrossRef] [PubMed]
  115. Susič, N.; Žibrat, U.; Širca, S.; Strajnar, P.; Razinger, J.; Knapič, M.; Vončina, A.; Urek, G.; Gerič Stare, B. Discrimination between abiotic and biotic drought stress in tomatoes using hyperspectral imaging. Sens. Actuators B Chem. 2018, 273, 842–852. [Google Scholar] [CrossRef] [Green Version]
  116. Zhang, N.; Zhang, X.; Yang, G.; Zhu, C.; Huo, L.; Feng, H. Assessment of defoliation during the Dendrolimus tabulaeformis Tsai et Liu disaster outbreak using UAV-based hyperspectral images. Remote Sens. Environ. 2018, 217, 323–339. [Google Scholar] [CrossRef]
  117. Menesatti, P.; Antonucci, F.; Pallottino, F.; Giorgi, S.; Matere, A.; Nocente, F.; Pasquini, M.; D’Egidio, M.G.; Costa, C. Laboratory vs. in-field spectral proximal sensing for early detection of Fusarium head blight infection in durum wheat. Biosyst. Eng. 2013, 114, 289–293. [Google Scholar] [CrossRef]
  118. Cheng, T.; Rivard, B.; Sánchez-Azofeifa, G.A.; Feng, J.; Calvo-Polanco, M. Continuous wavelet analysis for the detection of green attack damage due to mountain pine beetle infestation. Remote Sens. Environ. 2010, 114, 899–910. [Google Scholar] [CrossRef]
  119. Li, G.; Wang, C.; Feng, M.; Yang, W.; Li, F.; Feng, R. Hyperspectral prediction of leaf area index of winter wheat in irrigated and rainfed fields. PLoS ONE 2017, 12, e0183338–e0183352. [Google Scholar] [CrossRef] [Green Version]
  120. Zhang, J.; Rivard, B.; Rogge, D.M. The successive projection algorithm (SPA), an algorithm with a spatial constraint for the automatic search of endmembers in hyperspectral data. Sensors 2008, 8, 1321–1342. [Google Scholar] [CrossRef] [Green Version]
  121. Wang, F.; Li, Y.; Peng, Y.; Yang, B.; Li, L.; Liu, Y. Multi-Parameter Potato Quality Non-Destructive Rapid Detection by Visible/Near-Infrared Spectra. Spectrosc Spect. Anal. 2018, 38, 3736–3742. [Google Scholar] [CrossRef]
  122. Li, H.; Liang, Y.; Xu, Q.; Cao, D. Key wavelengths screening using competitive adaptive reweighted sampling method for multivariate calibration. Anal. Chim. Acta 2009, 648, 77–84. [Google Scholar] [CrossRef] [PubMed]
  123. Ye, S.; Wang, D.; Min, S. Successive projections algorithm combined with uninformative variable elimination for spectral variable selection. Chemom. Intell. Lab. Syst. 2008, 91, 194–199. [Google Scholar] [CrossRef]
  124. Rouse, J.W.; Haas, R.H.; Schell, J.A.; Deering, D.W. Monitoring vegetation systems in the great plains with ERTS. NASA Spec. Publ. 1973, 351, 309–317. [Google Scholar]
  125. Gitelson, A.A.; Gritz, Y.; Merzlyak, M.N. Relationships between leaf chlorophyll content and spectral reflectance and algorithms for non-destructive chlorophyll assessment in higher plant leaves. J. Plant Physiol. 2003, 160, 271–282. [Google Scholar] [CrossRef]
  126. Haboudane, D.; Miller, J.R.; Pattey, E.; Zarco-Tejada, P.J.; Strachan, I.B. Hyperspectral vegetation indices and novel algorithms for predicting green LAI of crop canopies: Modeling and validation in the context of precision agriculture. Remote Sens. Environ. 2004, 90, 337–352. [Google Scholar] [CrossRef]
  127. Gamon, J.A.; Serrano, L.; Surfus, J.S. The photochemical reflectance index: An optical indicator of photosynthetic radiation use efficiency across species, functional types, and nutrient levels. Oecologia 1997, 112, 492–501. [Google Scholar] [CrossRef]
  128. Penuelas, J.; Baret, F.; Filella, I. Semi-empirical indices to assess carotenoids/chlorophyll-a ratio from leaf spectral reflectance. Photosynth. Res. 1995, 43, 67–74. [Google Scholar]
  129. Gamon, J.A.; Surfus, J.S. Assessing leaf pigment content and activity with a reflectometer. New Phytol. 1999, 143, 105–117. [Google Scholar] [CrossRef]
  130. Gitelson, A.A.; Merzlyak, M.N.; Chivkunova, O.B. Optical properties and nondestructive estimation of anthocyanin content in plant leaves. Photochem. Photobiol. 2010, 74, 38–45. [Google Scholar] [CrossRef]
  131. Gitelson, A.; Zur, Y.; Chivkunova, O.B.; Merzlyak, M.N. Assessing carotenoid content in plant leaves with reflectance spectroscopy. Photochem. Photobiol. 2010, 75, 272–281. [Google Scholar] [CrossRef]
  132. Gitelson, A.; Merzlyak, M.N. Spectral reflectance changes associated with autumn senescence of Aesculus Hippocastanum L. and Acer Platanoides L. Leaves. Spectral features and relation to chlorophyII estimation. J. Plant Physiol. 1994, 143, 286–292. [Google Scholar] [CrossRef]
  133. Chen, J.M. Evaluation of Vegetation Indices and a Modified Simple Ratio for Boreal Applications. Can. J. Remote Sens. 1996, 22, 229–242. [Google Scholar] [CrossRef]
  134. Ceccatoa, P.; Flasseb, S.P.; Tarantolac, S.; Jacquemoudd, S.P.; Gre’goirea, J.-M. Detecting vegetation leaf water content using reflectance in the optical domain. Remote Sens. Environ. 2001, 77, 22–33. [Google Scholar] [CrossRef]
  135. Hardisky, M.; Klemas, V.; Smart, R.M. The influences of soil salinity, growth form, and leaf moisture on the spectral reflectance of spartina alterniflora canopies. Photogramm. Eng. Remote Sens. 1983, 49, 77–83. [Google Scholar]
  136. Serrano, L.; Penuelas, J.; Ustin, S.L. Remote sensing of nitrogen and lignin in Mediterranean vegetation from AVIRIS data: Decomposing biochemical from structural signals. Remote Sens. Environ. 2002, 81, 355–364. [Google Scholar] [CrossRef]
  137. Heim, R.H.J.; Wright, I.J.; Allen, A.P.; Geedicke, I.; Oldeland, J. Developing a spectral disease index for myrtle rust (Austropuccinia psidii). Plant Pathol. 2019, 68, 738–745. [Google Scholar] [CrossRef]
  138. Jones, C.D.; Jones, J.B.; Lee, W.S. Diagnosis of bacterial spot of tomato using spectral signatures. Comput. Electron. Agric. 2010, 74, 329–335. [Google Scholar] [CrossRef]
  139. Muir, A.Y.; Porteous, R.L.; Wastie, R.L. Experiments in the detection of incipient diseases in potato tubers by optical methods. J. Agric. Eng. Res. 1982, 27, 131–138. [Google Scholar] [CrossRef]
  140. IPCC. 2019 Refinement to the 2006 IPCC Guidelines for National Greenhouse Gas Inventorie; Task Force on National Greenhouse Gas Inventories (TFI): Kyoto, Japan, 2019. [Google Scholar]
  141. Rizzetto, S.; Belyazid, S.; Gegout, J.C.; Nicolas, M.; Alard, D.; Corcket, E.; Gaudio, N.; Sverdrup, H.; Probst, A. Modelling the impact of climate change and atmospheric N deposition on French forests biodiversity. Environ. Pollut. 2016, 213, 1016–1027. [Google Scholar] [CrossRef] [Green Version]
  142. Ma, H.; Jing, Y.; Huang, W.; Shi, Y.; Dong, Y.; Zhang, J.; Liu, L. Integrating early growth information to monitor winter wheat powdery mildew using multi-temporal landsat-8 imagery. Sensors 2018, 18, 3290. [Google Scholar] [CrossRef] [PubMed] [Green Version]
Figure 1. Number of published articles by year on plant disease with hyperspectral data (Data source from Web of Science).
Remotesensing 12 03188 g001
Figure 2. Plant disease classification by causal agent. Examples and symptoms are listed in each category. Some of these photos were obtained from https://www.baidu.com, and some were taken during our own experiments.
Remotesensing 12 03188 g002
Figure 3. Three fairly distinct stages of plant disease infection, taking wheat Fusarium head blight (FHB) as an example, from inoculation to outbreak.
Remotesensing 12 03188 g003
Figure 4. Effect of the yellow rust development on the spectral reflectance of winter wheat as days post inoculation (dpi) increase. Gray areas in the reflectance images (lower) indicate significantly different spectral ranges between the inoculated (dotted black line) and non-inoculated (solid black line) leaves.
Remotesensing 12 03188 g004
Figure 5. Commonly used platforms and scales in plant disease research by hyperspectral techniques. Wheat FHB is cited as the example. (AC) are the examples of indoor measurement platform at different scales. They are scanning electron microscope, stereo microscope platform, and a typical indoor measurement platform, (D) is a field vehicle platform of hyperspectral imaging, (E) is a unmanned aerial vehicle platform, (F) is a photo of satellite platform; (ag) are FHB-infected winter wheat hyperspectral images at different scales. They indicated the disease mycelium, infected spikelets, ears, plants, canopy, plots and region hyperspectral images, respectively.
Remotesensing 12 03188 g005
Figure 6. Basic workflow in hyperspectral imaging-based plant disease classification. PCA: principal component analysis; LESC: local embedding based on spatial coherence algorithm; DWT: discrete wavelet transform; KNN: K-nearest neighbor; SVM: support vector machine; NN: neural networks.
Remotesensing 12 03188 g006
Figure 7. Two basic workflows of disease severity quantification. a and b indicate that after optimal waveband and feature selection, there are two methods of constructing the final SDIs, one based on feature combination and the other involving model fitting by statistical analysis methods. SVIs: spectral vegetation indices; SDIs: special disease indices; PLSR: partial least squares regression; QDA: quadratic discriminant analysis; FLDA: fisher’s linear discrimination analysis.
Remotesensing 12 03188 g007
Table 1. Summary of crops and the corresponding plant diseases detected by spectroscopy or hyperspectral techniques.
Crop TypesCrop NamesDisease NamesDisease TypesMain Infected SitesSensors/Platforms/ScalesAnalysis ApproachReferences
Cereal CropsWheatWheat stripe rustFungal diseasesLeaves *Analytical spectral device (ASD)/handheld/leaves and canopyPartial least squares discriminant analysis (PLSR), support vector regression (SVR), and Gaussian process regression (GPR)[49]
Wheat leaf rustFungal diseasesLeaves *ASD and digital camera/handheld/leavesLinear spectral mixture analysis, Fisher function[50]
Wheat powdery mildewFungal diseasesLeaves *ASD/handheld/canopyContinuous wavelet analysis, Fisher’s linear discrimination analysis (FLDA) and support vector machine (SVM)[51]
Fusarium head blightFungal diseasesEars * and stalksImSpector V10E and ImSpector N25E/indoor measurement platform/spikeletsLinear model fitting, spectral vegetation indices (SVIs)[42]
RiceRice sheath blightFungal diseasesLeaves *ImSpector V10E/indoor measurement platform/single plantLinear discriminant analysis (LDA) and SVM[52]
Rice blastFungal diseasesLeaves *, stems and earsORCA-05G/darkroom/panicle“Bag of spectra words” (BoSW) model and chi-square support vector machine (chi-SVM)[53]
MaizeGrey leaf spot diseaseFungal diseasesLeaves *ASD and three multi-spectral satellite Resampled/handheld/satellite/leaves and canopyRandom forest algorithm (RF)[54]
Leaf spot diseaseFungal diseasesLeaves * and bracksASD/handheld/leavesGuided regularized random forest (GRRF) and RF[55]
Ear rotFungal diseasesEars and kernels *SisuChema/HgCdTe detector/fungal isolatesPrincipal component analysis (PCA) and PLSR[56]
Legume CropsSoybeanSoybean anthracnoseFungal diseasesStems *, pods and leaves *Pika XC/mounting tower/stemsGenetic algorithm as an optimizer and SVM as a classifier[57]
Yellow mosaic virusViral diseaseLeaves *ASD/handheld/leavesSpectral derivative and red edge analysis[58]
Tuber CropsPotatoLate blight diseaseFungal diseasesLeaves * and fruitsRikola/unmanned aerial vehicle (UAV)/plotsSimplex volume maximization (SiVM) and pixel-wise log-likelihood ratio (LLR) calculation[59]
Potato virus YViral diseaseLeaves *Specim FX10/tractor/canopyDeep learning, fully convolutional neural network[45]
Sugar CropsSugar BeetCercospora leaf spotFungal diseasesLeaves *ASD/handheld/leavesSpectral signature analysis and vegetation indices[60]
Beet rustFungal diseasesLeaves *ImSpector V10E/
microscope/tissue
Spectral angle mapper (SAM)[61]
Beet powdery mildewFungal diseasesLeaves *ASD/leaf clip/leavesSVIs and SVM[62]
Root rotFungal diseasesRoots (leaves) 1ASD/handheld/canopySVIs and nonlinear regressions[63]
VegetablesTomatoGray moldBacterial diseasesFruits, leaves * and stemsImSpector V10E/indoor measurement platform/leavesK-nearest neighbor (KNN), C5.0 models and feature rank[64]
Tomato yellow leaf curl virusViral diseaseLeaves *Imspector V10E-QE/indoor measurement platform/leavesGrey level co-occurrence matrix (GLCM)[65]
FruitsCitrusCitrus cankerBacterial diseasesFruits * and leaves *Pika L 2.4/mounting tower and UAV/leaves, fruits and single plantRadial basis function (RBF) and KNN[66]
Huanglongbing (Citrus greening)Bacterial diseasesFruits *, leaves * and rootsAISA Eagle/airborne/canopySVM[67]
* indicates the main organs that hyperspectral-based studies focus on; 1 indicates sugar beet root rot which mainly infects the roots but the main organ that hyperspectral-based studies focus on is leaves.
Table 2. List of major contributions according to different methods of hyperspectral image classification for plant disease detection, identification and mapping.
Plant and DiseasesTargets *ScalesMethods and AlgorithmsClassification Accuracy Reference
Sugar beet and Cercospora leaf spot/powdery mildew/sugar beet rustDisease identificationLeafSpectral angle mapper (SAM)98.9% for Cercospora leaf spot at 8 dai;
97.23% for powdery mildew at 14 dai;
61.70% for sugar beet rust at 20 dai.
[61]
Wheat and Fusarium head blightDisease identificationSpikeSupport Vector Machine (SVM) with reflectance and spectral vegetation indices (SVIs)95.0% and 99.0% for two classes classification using SVIs and reflectance;
76.0% and 77.0% for multiclass classification using SVIs and reflectance;
[48]
Wheat and yellow rust (Puccinia striiformis)Disease detectionLeafQuadratic discriminant analysis (QDA)/self-organizing map (SOM) NN94.5% by using QDA;
Around 99% by using SOM NN
[103]
Citrus and citrus bacterial cankerDisease severity classification (asymptomatic, early, and late symptoms)Leaf/fruit/plantNeural network radial basis function (RBF); KNN with SVIs.94%, 96%, and 100% by RBF and 94%, 95%, and 96% by KNN for three levels at leaf scale; 92% canker detection at fruit scale and 100% and plant scale[66]
Soybean and charcoal rotDisease identificationStemThree dimensional convolutional neural network (3D CNN)95.73%[88]
Wheat and stripe rustDisease identification and mappingCanopy/plotLinear regression model——[76]
* The targets of classification are divided into disease detection, disease identification, disease severity classification and disease mapping; —— The authors used SVIs fitting the linear regression model and then mapped disease severity at the plot scale by model inversion, so there was one classification accuracy.
Table 3. Some commonly used SVIs which relate to the changes in parameters (pigment, water, structure etc.) in plant disease diagnosis.
IndexFormulaDefinition and DescriptionPossible SymptomsPossible DiseasesReferences
Normalized Difference Vegetation Index (NDVI) N D V I = ( N I R Re d ) ( N I R + Re d ) Used to analyze healthy and green vegetation. It is robust over a wide range of conditions.AllAlmost all of green plants’ disease *[124]
Green Chlorophyll Index (GCI) G C I = N I R G r e e n 1 Used to estimate the leaf chlorophyll content of a plant.PigmentMyrtle rust
Powdery mildew
Stripe rust
Flavescence Dorée
Leaf spot
[125]
Transformed Chlorophyll Absorption Reflectance Index (TCARI) T C A R I = 3 [ ( ρ 700 ρ 670 ) 0.2 ( ρ 700 ρ 550 ) ( ρ 700 ρ 670 ) ] Indicates the relative abundance of chlorophyll.[126]
Photochemical Reflectance Index (PRI) P R I = ( ρ 531 ρ 570 ) ( ρ 531 + ρ 570 ) Sensitive to the changes in carotenoid pigments (particularly xanthophyll pigments).[127]
Structure Insensitive Pigment Index (SIPI) S I P I = ( ρ 800 ρ 445 ) ( ρ 800 + ρ 680 ) Maximizes the sensitivity of the index to the ratio of bulk carotenoids to chlorophyll.[128]
Red Green Ratio Index (RGRI) R G R I = i = 600 699 ρ i j = 500 599 ρ j It is an indicator of leaf production and stress, used to estimate the course of foliage development in canopies.[129]
Anthocyanin Reflectance Index 1 (ARI1) A R I 1 = 1 ρ 550 1 ρ 700 Weakening vegetation contains higher concentrations of anthocyanins, so this index is one measure of stressed vegetation.[130]
Carotenoid Reflectance Index 1 (CRI1) C R I 1 = 1 ρ 510 1 ρ 550 Weakening vegetation contains higher concentrations of carotenoids, so this index is one measure of stressed vegetation.[131]
Red Edge Normalized Difference Vegetation Index (RENDVI) R E N D V I = ( ρ 750 ρ 705 ) ( ρ 750 + ρ 705 ) Modification of the NDVI, using red edge instead of the absorption and reflectance peaks to enhance the sensitivity to small changes in canopy foliage content, gap fraction, and senescence.Structure
Pigment
Apple scab[132]
Modified Simple Ratio (MSR) M S R = ( N I R Re d ) 1 ( N I R Re d ) + 1 Used to increase the sensitivity of vegetation biophysical parameters.[133]
Moisture Stress Index (MSI) M S I = ρ 1599 ρ 819 A reflectance measurement that is sensitive to increasing leaf water content.WaterRoot rot[134]
Normalized Difference Infrared Index (NDII) N D I I = ( ρ 819 ρ 1649 ) ( ρ 819 + ρ 1649 ) A reflectance measurement that is sensitive to changes in the water content of plant canopies.[135]
Normalized Difference Nitrogen Index (NDNI) N D N I = log ( 1 ρ 1510 ) log ( 1 ρ 1680 ) log ( 1 ρ 1510 ) + log ( 1 ρ 1680 ) Estimates the relative amounts of nitrogen contained in vegetation canopies. NutrientYellow mosaic disease[136]
ρ i indicate the reflectance at i nm; *: NDVI could be used for most diseases, but mostly concentrated on large-scale multispectral analysis.
Table 4. Some special SDIs which were constructed based on hyperspectral data.
Plant and DiseaseFormula *SensorsScalesMethods and AlgorithmsReference
Grapevine and Flavescence Dorée S D I = 0.5 × ρ 1770 + ( ρ 2208 + ρ 2019 ) ( ρ 2208 ρ 2019 ) FieldSpec 3 ASDLeafD.A.: Genetic algorithm (GA) for feature selection[25]
Lemon Myrtle and Myrtle Rust L M M R = ( ρ 545 ρ 555 ) 5 3 × ( ρ 1505 ρ 2195 ) Spectral Evolution PSR+ 3500LeafD.A.: Random-forest-based for feature selection[137]
Sugar Beet and Cercospora Leaf Spot C L S = ( ρ 698 ρ 570 ) ( ρ 698 + ρ 570 ) ρ 734 ImSpector V10ELeafD.A.: RELIEF-F for feature selection[111]
Sugar Beet and Sugar Beet Rust S B R I = ( ρ 570 ρ 513 ) ( ρ 570 + ρ 513 ) + 0.5 × ρ 704 ImSpector V10ELeafD.A.: RELIEF-F for feature selection[111]
Sugar Beet and Powdery Mildew P M I = ( ρ 520 ρ 584 ) ( ρ 520 + ρ 584 ) + ρ 724 ImSpector V10ELeafD.A.: RELIEF-F for feature selection[111]
Winter Wheat and Fusarium Head Blight] F C I = 0.25 × [ 2 × ( ρ 668 - ρ 417 ) - ρ 539 ] UHD 185KernelD.A.: Instability index-spectral angle mapper (ISI-SAM) for feature selection[83]
Chinese Pine and Dendrolimus tabulaeformis Tsai et Liu P = { 43.8403 31.8932 × ρ 522 + 29.8588 × ρ 710 28.5645 × ρ 738 271.0435 583.3388 × ρ 522 + 163.2454 × ρ 710 824.7452 ρ 738 UHD 185Plant D.A. and D.B.: Instability index between classes-successive projection algorithm (ISIC-SPA) for feature selection and PLSR for model fitting[116]
ρ i indicate the reflectance at i nm; D.A. and D.B. indicate two SDIs’ construction methods shown in Figure 6 (direction A and B); * The names of SDIs are listed as the references showed, and we used ‘SDI’ instead of when there is no specific name in the reflectance.

