Article

Evaluation the Performance of Several Gridded Precipitation Products over the Highland Region of Yemen for Water Resources Management

by
Ali Hamoud AL-Falahi
1,*,
Naeem Saddique
1,
Uwe Spank
1,
Solomon H. Gebrechorkos
2 and
Christian Bernhofer
1
1
Institute of Hydrology and Meteorology, Technische Universität Dresden, Pienner Str. 23, D-01737 Tharandt, Germany
2
School of Geography and Environmental Science, University of Southampton, Southampton SO17 1BJ, UK
*
Author to whom correspondence should be addressed.
Remote Sens. 2020, 12(18), 2984; https://doi.org/10.3390/rs12182984
Submission received: 11 July 2020 / Revised: 10 September 2020 / Accepted: 11 September 2020 / Published: 14 September 2020

Abstract

:
Management of water resources under climate change is one of the most challenging tasks in many arid and semiarid regions. A major challenge in countries, such as Yemen, is the lack of sufficient and long-term climate data required to drive hydrological models for better management of water resources. In this study, we evaluated the accuracy of accessible satellite and reanalysis-based precipitation products against observed data from Al Mahwit governorate (highland region, Yemen) during 1998–2007. Here, we evaluated the accuracy of the Climate Hazards Group Infrared Precipitation with Station (CHIRPS) data, National Centers for Environmental Prediction (NCEP) Climate Forecast System Reanalysis (CFSR), Precipitation Estimation from Remotely Sensed Information Using Artificial Neural Networks-Climate Data Record (PERSIANN-CDR), Tropical Rainfall Measuring Mission (TRMM 3B42), Unified Gauge-Based Analysis of Global Daily Precipitation (CPC), and European Atmospheric Reanalysis (ERA-5). The evaluation was performed on daily, monthly, and annual time steps by directly comparing the data from each single station with the data from the nearest grid box for each product. At a daily timescale, CHIRPS captures the daily rainfall characteristics best, such as the number of wet days, with average deviation from wet durations around 11.53%. TRMM 3B42 is the second-best performing product for a daily estimate with an average deviation of around 34.7%. However, CFSR (85.3%) and PERSIANN-CDR (103%) and ERA-5 (−81.13%) show an overestimation and underestimation of wet days and do not reflect rainfall variability of the study area. Moreover, CHIRPS is the most accurate gridded product on a monthly basis with high correlation and lower bias. The average monthly correlation between the observed and CHIRPS, TRMM 3B42, PERSIANN-CDR, CPC, ERA-5, and CFSR is 0.78, 0.56, 0.53, 0.15, 0.20, and 0.51, respectively. The average monthly bias is −2.9, −5.25, 7.35, −25.29, −24.96, and 16.68 mm for CHIRPS, TRMM 3B42, PERSIANN-CDR, CPC, ERA-5, and CFSR, respectively. CHIRPS displays the spatial distribution of annual rainfall pattern well with percent bias (Pbias) of around −8.68% at the five validation points, whereas TRMM 3B42, PERSIANN-CDR, and CFSR show a deviation of greater than 15.30, 22.90, and 66.21%, respectively. CPC and ERA-5 show Pbias of about −88.6% from observed data. Overall, in absence of better data, CHIRPS data can be used for hydrological and climate change studies on the highland region of Yemen where precipitation is often episodical and measurement records are spatially and temporally limited.

Graphical Abstract

1. Introduction

Yemen is a semiarid to arid tropical climate country with significant variation due to topographical differences [1]. The country can be characterized by five major ecological systems: hot-humid coastal plain, temperate highland, Yemen high plateaus, and Hadramout-Mahrah uplands, the desert interior, and the islands archipelago [2]. In general, temperature in Yemen is high, with an annual average of 21 °C. The temperatures vary widely by location and season. For instance, coastal regions and the southern areas are hot, dry, and characterized by limited rainfall (50 mm per year). Wadi Hadhramout and northern regions are hot and dry throughout the year. While, the highlands region has more seasonal variety: winter is cold, with temperatures below 0 °C, while the summers are considered temperate and rainy [3]. Rainfall in the central highlands varies from 400 mm to 800 mm per year. Precipitation in Yemen takes place in spring and summer and determined by two main mechanisms: the Red Sea Convergence and the Inter-Tropical Convergence Zone [4].
Yemen is extremely vulnerable to climate change and its impacts [2,5], such as flood, drought, pests, disease outbreaks, rainfall patterns change, frequent rainfall and sand storms, and rise of sea level. Climate change is a serious concern for Yemen as the economy mainly depends on rural resources. More than 75% of the population is a rural community engaged in farming and pastoralism, and more than half of agricultural lands are rainfed [6]. However, projection of climate change is uncertain on Yemen due to dependency on global GHG emission scenarios, which tend to be uncertain, too. Climate change predictions and forecasting at local levels are still weak in Yemen due to the absence of capacity in climate analysis, interpretation, and downscaling [7]. According to the United Nations Development Program (UNDP, 2016), there is insufficient daily precipitation data available to determine trends in heavy rainfall events. Similar to many other countries within the semiarid region, long-term climate records are scarce in Yemen [8,9]. Although monthly data are available for Aden since the 1880s, daily records typically began in the 1970s or later, and many are tied to short-term projects or limited by quality concerns. Moreover, high temporal and spatial resolution climate data, even if collected by the Yemeni civil aviation and meteorological authority, are often not available due to data sharing policy. Therefore, studying the future change of climate and its potential effects on water resources is a complicated task due to the limited availability of meteorological data with high temporal and special resolution, which are required by hydroclimate models and climate change studies.
Further, agriculture in Yemen is considered traditional and a very ancient regime. The sector primarily depends on old farming techniques and wadi flows, which makes it vulnerable to extreme climate changes such as drought and flood. In addition, the agriculture sector in Yemen faces several challenges, but the most critical one is water scarcity [10,11]. The National Water Resources Authority (NWRA 2005) estimates that a sustainable rate of water use in Yemen is about 2500 million m3/year. Still, water is extracted at a high rate, about 3400 million m3/year, leaving an annual water deficit at around 900 million m3. Water resources of Yemen depend on rainfall, which is almost all lost to evapotranspiration (ET). The rapid increase in water abstraction and use for agriculture and other sectors have affected the water balance. The rate of groundwater extraction is currently double the recharge rate and overuse of this source means that water reserve depletion and underlying socioeconomic consequences are rapidly growing [12].
To overcome the data limitation, several precipitation products from different sources (climate model, remote sensing, and reanalysis) have been developed during the last decades. These products can fill the data gap, particularly for regions with sparse availability of climatic data [13], and be used for hydrological applications and water resources planning purposes. The precipitation products include the Climate Hazards Group Infrared Precipitation with Station (CHIRPS) data, National Centers for Environmental Prediction Climate Forecast System Reanalysis (CFSR), Precipitation Estimation from Remotely Sensed Information using Artificial Neural Networks-Climate Data Record (PERSIANN-CDR), Tropical Rainfall Measuring Mission (TRMM 3B42), Unified Gauge-Based Analysis of Global Daily Precipitation (CPC), and the European Atmospheric Reanalysis (ERA-5). These precipitation products have been evaluated for their performance (e.g., correlation) against gauge observations in different regions and on different terrain topographies. CHIRPS, for example, has shown high correlation with lower bias in East Africa, Egypt, and Iran [13,14,15]. The TRMM 3B42 dataset was evaluated by several studies, such as in China [16,17], and is recommended for hydrological modeling in the upper Indus basin of Pakistan [18]. The performance of PERSIANN-CDR in eastern China was significant [19], and shows good correlation in West Africa [20]. CFSR precipitation data exhibited very good performance in three basins in Turkey [21], but shows some deviation from observations, as in the case study of the Logone catchment, Chad [22]. ERA-5 displayed good performance over North America [23], while CPC was evaluated over the mountainous region of Africa [24] and proved to be in relatively good agreement with in situ data, but with variation across the Nile basin area [25].
These products, however, have not been evaluated in Yemen and cannot be directly used in hydro climate studies until their accuracy is assessed. Hence, the current study, for the first time in Yemen, assesses and evaluates the accuracy of several daily precipitation products against the available observations from the highland region of Yemen (Al Mahwit governorate), employing the most widely and accepted statistical methods at different timescales. Findings of the study are expected to overcome the data limitation and identify the most accurate gridded product for hydrological and regional and local-scale climate modeling, such as the Statistical Downscaling Model (SDSM) [26], allowing for assessment of future impacts of climate change on water availability and development of adaptation measures in Yemen.

2. Study Area and Climate Data

2.1. Region of Interest

This study focuses on the evaluation of several precipitation products on a daily, monthly, and annual time step over the Al Mahwit governorate in Yemen (Figure 1). Al Mahwit occupies an area of around 2800 km2 and is located within the highland region of Yemen, the most fertile part of the Arabian Peninsula [27]. It is one of the most extensively terraced areas in the world, and the major producer of the country’s food crops [28,29]. Rainfall in Al Mahwit is influenced by two main mechanisms: the Red Sea Convergence Zone (RSCZ) and the monsoonal Intertropical Convergence Zone (ITCZ) [30]. The RSCZ is most visible in the western part of the country and active through March to May, and to some extent during autumn season. The ITCZ reaches Yemen in July–September, moving north and then south again so that its influence lasts longer in the south [31]. Both the RSCZ and the ITCZ generate rainfall in convectional storms of high intensity and limited duration and scope, but the ITCZ storms have a larger areal extent than those of the RSCZ [32]. Environmental factors such as complex topography and the heterogeneity of land surface affect the climate of the area for temperature and precipitation [33], while land use and runoff are in turn tied to climate and morphology.

2.2. Datasets

In Al Mahwit governorate, ten stations from high and low altitude areas provided by the National Water Resources Authority (NWRA) in Yemen were used to perform this evaluation (Table 1). Five stations with ≥10 years of daily data (Kokaban, Al Rojom, Al Mahwit city, Al Khamees, and Al Khabt) are the main employed stations to compare the six precipitation products with observations. Kokaban, Al Rojom, and Al Mahwit city stations are located in the high complex mountainous areas, while Al Khamees and Al Khabt provide rainfall rates present in the low areas (Figure 1). Selection of these stations is based on the availability of the best and most complete observations at a daily timescale with the longest time period through the period 1998–2007. The other five stations with complete monthly records <10 years were used to verify the highest correlated product with ground observations. In this study, we used all of the available stations and it was impossible to find other stations with long-term and complete data suitable for evaluation.
On the other hand, the rainfall datasets used in this evaluation are the latest updated gridded products with high temporal and spatial resolution. Criteria to select the precipitation datasets are based on the availability of the product at a daily timescale, special coverage of the highland region of Yemen, and their application and previous use in neighboring regions with similar topography, such as Ethiopia, Iran, and southern Saudi Arabia [34,35,36]. In this research, we considered three types of products to be compared against ground stations: satellite-based, reanalysis, and ground-based data.

2.2.1. Satellite-Based Product

Tropical Rainfall Measuring Mission (TRMM 3B42)
The Tropical Rainfall Measuring Mission (TRMM) is a joint space mission between NASA and Japan’s National Space Development Agency, designed to monitor and study tropical and subtropical precipitation and the associated release of energy [37]. Five instruments are used by the mission: TRMM Microwave Imager (TMI), Visible Infrared Scanner (VIRS), Precipitation Radar (PR), Lightning Imaging Sensor (LSI), and Clouds and Earth’s Radiant Energy System (CERES) [38]. The PR and TMI are the instruments mainly used for precipitation. These instruments are used in an algorithm that composes the TRMM combined instrument (TCI), calibration dataset (TRMM 2B31) for the TRMM Multi-Satellite Precipitation Analysis (TMPA), whose TMPA 3B43 monthly rainfall rates and TMPA 3B42 daily and sub daily (3 h) averages are very likely the most appropriate TRMM-related products for climate research. TRMM 3B42 and TRMM 3B43 are available in 0.25° spatial resolution and cover 50°N to 50°S for 1998–present [39]. The TRMM 3B43 dataset contains the output of the TRMM Algorithm 3B42, which is used to generate Tropical Rainfall Measuring Mission (TRMM) that comprises blended high quality (HQ)/infrared (IR) precipitation and root-mean-square (RMS) precipitation error estimates. The combined instrument rain calibration algorithm (3B-42) uses an optimal combination of 2B-31, 2A-12, SSMI, AMSR, and AMSU precipitation estimates (referred to as HQ) to adjust IR estimates from geostationary IR observations. Near-global estimates are made by calibrating the IR brightness temperatures to the HQ estimates. The estimates of TRMM 3B42 are scaled to resemble the rain gauge monthly analyses used in TRMM 3B43. The output is daily rainfall for 0.25 × 0.25 degree grid boxes [40]. TRMM precipitation data are widely used in studies covering tropical region countries.
Precipitation Estimation from Remotely Sensed Information using Artificial Neural Networks-Climate Data Record (PERSIANN-CDR)
Estimates of precipitation are produced using the PERSIANN algorithm on GridSat B1 infrared satellite data, and the National Centers for Environmental Prediction (NCEP) stage IV hourly precipitation data are used for training the artificial neural network [19,41]. The adjustment of PERSIANN-CDR is done using the Global Precipitation Climatology Project (GPCP) monthly product version 2.2 (GPCPv2.2). Therefore, the PERSIANN-CDR monthly means degraded to 2.5-degree resolution correspond to GPCPv2.2. PERSIANN CDR is defined by the National Research Council (NRC) as a time series of measurements with sufficient duration, consistency, and continuity to determine climate variation and change. The key points of PERSIANN-CDR are its persistent, a long-term dataset of more than 30 years of records, quarterly updates, and its use of many different data sources, which makes PERSIANN-CDR more reliable with its high resolution (0.25) monthly precipitation information that is consistent with GPCP monthly estimates. However, PERSIANN-CDR heavily relies on infrared data, which means conversion from IR to precipitation rate needs a complex algorithm. Also, this product has daily temporal resolution, does not resolve the diurnal cycle, and may not record some short-lived, intense events [42].

2.2.2. Reanalysis Data

National Centers for Environmental Prediction (NCEP) Climate Forecast System Reanalysis (CFSR)
The NCEP Climate Forecast System Reanalysis (CFSR) is a complete dataset for the 31 year period from 1979 to 2009. The CFSR was built as a global, high resolution, coupled atmosphere–ocean–land-surface–sea-ice system to provide the best estimate of the state of these coupled domains over this 31-year period [43,44]. The CFSR has also been extended as an operational, real-time product into the future. The new features of the CFSR include: (1) coupling of atmosphere and ocean during production of the 6-h guess field, (2) sea ice as an interactive model, and (3) satellite radiances assimilation by the Grid-Point Statistical Interpolation (GSI) scheme over the entire period [45]. The resolution of the CFSR global atmosphere is approximately 38 km (T382) with 64 levels extending from the surface to 0.26 hPa. The latitude spacing of the global ocean is 0.25 deg at the Equator, extending to a global 0.5 deg beyond the tropics, with 40 levels to a depth of 4737 m. The CFSR atmospheric model has observed changes of carbon dioxide (CO2) over the 1979–2009 period, together with variations in aerosols and other trace gases and solar variations. Most available in situ and satellite observation data were included in the CFSR. Bias of satellite-based radiance observations in CFSR were corrected with spin-up runs at full resolution, considering variable CO2 concentrations [46]. The CFSR output products are available at daily and an hourly time resolution at a 0.5 × 0.5 deg latitude and longitude resolution.
ERA-5 Atmospheric Reanalysis
ERA-5 is the fifth-generation reanalysis from the European Centre for Medium-Range Weather Forecasts (ECMWF), and the latest climate reanalysis produced by ECMWF [47], providing hourly data on many atmospheric, land-surface, and sea-state parameters together with estimates of uncertainty [48,49]. It provides special advancements compared to ERA-Interim, which was replaced by ERA-5 on 31 August 2019. The analysis by ERA-5 is produced at a one-hour time step using a significantly more advanced 4Dvar integration scheme. The horizontal resolution of ERA-5 is approximately 30 km, and it computes atmospheric variables at 139 pressure levels [50]. ERA-5 data are available in the Climate Data Store on regular latitude–longitude grids at 0.25° × 0.25° resolution, with atmospheric parameters on 37 pressure levels. For this work, we used ERA-5 hourly data on single levels from 1979 to present. Total precipitation data were downloaded from the hourly timescale and aggregated to the daily time step. However, the total precipitation is available in equivalent m units, where conversion into mm is needed to compare data with ground observations.

2.2.3. Gauge-Based Data

CPC Unified Gauge-Based Analysis of Global Daily Precipitation
A gauge-based analysis of daily precipitation has been built over the global land areas. Gauge reports from around 30,000 stations were collected from several sources including COOP, GTS, and other national and international agencies [51,52]. Quality control was performed through comparison with historical records and separate information from measurements at near stations, concurrent radar/satellite observations, and from numerical model forecasts. Reports from quality controlled stations are then interpolated to generate analyzed fields of daily precipitation with consideration of orographic effects [53]. The daily analysis is constructed on a 0.125 degree lat/long grid over the entire global land areas, and released on a 0.5 degree lat/long grid over the global domain for a period from 1979 to the present. This dataset has two elements: (a) the “retrospective version”, which uses 30K stations and spans 1979–2005, and (b) the “real-time version” which uses 17K stations and spans 2006–present. The real-time data will be reprocessed in the future to be consistent with the retrospective analysis [54]. In this study, comparison between CPC precipitation estimates and observations is performed on a monthly basis due to the unavailability of daily data by this dataset in the study area.
Climate Hazards Center Infrared Precipitation with Station (CHIRPS) data
Climate Hazards Center Infrared Precipitation with Station (CHIRPS) data is a 30-year quasi-global rainfall dataset. Spanning 50°S–50°N (and all longitudes), starting in 1981 to near-present, CHIRPS embeds 0.05° resolution satellite images with on-site station data to produce gridded rainfall time series for trend analysis and seasonal drought monitoring [55]. Station data are used to produce a preliminary 2-day rainfall product by blending data from sparsely located GTS. Gauges with rainfall estimates retrieved from the cold cloud duration (CCD) at every pentad [56]. The product provides improved daily, pentanal, decadal, and monthly data at a 0.05 spatial resolution. Due to the high quality of the products, it has been used from several hydroclimate studies worldwide [56,57,58,59]. General properties of employed and examined datasets are shown in Table 2.

3. Materials and Methods

3.1. Quality of Ground Stations

In Yemen, not only are the meteorological stations limited, but also accessibility to climate data is very restricted and only provided by a few national agencies that mostly ask for high fees to make data available for research and public use. In addition, quality of climate data is not ensured, and there are often gaps in the data. For this study, it was only possible to get daily precipitation data with a reasonable temporal and special coverage from stations belonging to the National Water Resources Authority (NWRA) of Yemen. However, more than 27 stations from different governorates in the highland region of Yemen including Sana’a, Thamar, Amran, Hajjah, and Taiz governorate were intensively checked, but most stations were excluded because of missing data; only 19 stations were found suitable for comparison with precipitation products. Quality check of ground observation involved using methods such as double mass curve [60] and by checking the percentage of daily missing data. Generally, we used stations with complete daily records (no missing values) to compare the performance of the precipitation products during the period 1998–2007. Stations with, at least, five years of complete monthly records from Al Mahwit and nearby governorates were used to evaluate the performance of the highest correlated product (CHIRPS) in some other areas within the highland region of Yemen.

3.2. Comparing Ground Observations with Precipitation Products

For comparison between observations and the different precipitation products (satellite, reanalysis, gauge-based data), we directly compared data of a point (station) to the nearest pixel estimate by the product, and by taking area grid cell average to station average over the study area. However, when comparing daily rainfall estimates, it was challenging to find a strong agreement between products and observations. Therefore, it was more practical to evaluate the products on their ability to produce an accurate wet duration and rainfall intensity during the period 1998–2007. Point to nearest pixel estimate is a direct comparison between station data with the nearest estimate of product within the same grid cell area. Grid cell average to station average is the average precipitation estimate by the product to overall average of stations. At a daily timescale, statistical analysis such as standard deviation, mean, skewness, and daily maximum rainfall rate for each product were calculated. In addition, the Probability of Detection (POD) and False Alarm Ratio (FAR) were also used to assess the ability of the products to accurately detect daily rainfall events. In monthly and annual evaluation, the most commonly used statistical methods, such as correlation coefficient (r), bias (BIAS), root-mean-square error (RMSE), deviation, and percentage deviation between products and observations, were applied to examine the agreement of individual product (P) to station data (O).
The correlation coefficient, denoted by r, represents a measure of the strength of the linear relationship between two variables [61]. The correlation coefficient (r) (Equation (1)) is used to evaluate the agreement of individual products (P) to station data (O). A value of r close to 1 shows a perfect confident fit between the products and station data. However, the correlation coefficient is sometimes referred as CC.
r = i = 1 N ( P i P ¯ ) ( O i O ¯ ) i = 1 N ( P i P ¯ ) 2 i = 1 N ( O i O ¯ ) 2
Bias (Equations (2) and (3)) refers to the direction of a measurement process to over or underestimate the value of a population parameter [62]. Bias can be negative (underestimation) or positive (overestimation) based on accuracy of each product (P).
B i a s   =   Σ i = 1 N   ( P i O i ) N
P b i a s = Σ i = 1 N   ( P i O i ) Σ i = 1 N (   O i ) × 100
RMSE (Equation (4)) is a quadratic rating rule that measures the average magnitude of the error. It is the square root of the average of squared differences between prediction and real observation [63].
R M S E = Σ i = 1 N   ( O i P i   ) 2 N
Percent Error (Equation (5)) is applied to compare the experimental quantity, which is referred to as the precipitation product, P, with the theoretical quantity, the observation, O, which is considered the “correct” value. The percent error is the absolute value of the difference divided by the “correct” value, times 100.
%   Error =   ( P O ) O × 100
P O D = H i t s H i t s + M i s s e s
F A R = F a l s e   A l a r m s H i t s + F a l s e   A l a r m s
The POD (Equation (6)) ranges from 0 to 1, where 1 is the perfect and the optimal score. FAR (Equation (7)) lies between 0 and 1, where 0 is the desired result. These measures (Table 3) are widely used [64,65,66] and described in detail by Wilks [67]. A threshold of 0.5 mm was used to distinguish between rainfall and no rainfall events. This was based on the rainfall pattern of the study area, which occurs in flash intensive rain; any value less than this threshold might be considered as a noise.
In addition, Taylor diagrams (Taylor, 2001) were used to briefly summarize the statistical relationship between ground observations and products. Taylor diagrams provide a method of graphically overviewing how closely a pattern (or a set of patterns) agrees with observations. The agreement between two patterns is quantified in terms of their correlation, their centered root-mean-square difference, and the magnitude of their variations (represented by their standard deviations). The diagram is useful in evaluating multiple aspects of complex models or in gauging the relative skill of many different models [68].

4. Results

4.1. Examination of Rainfall Daily Estimates

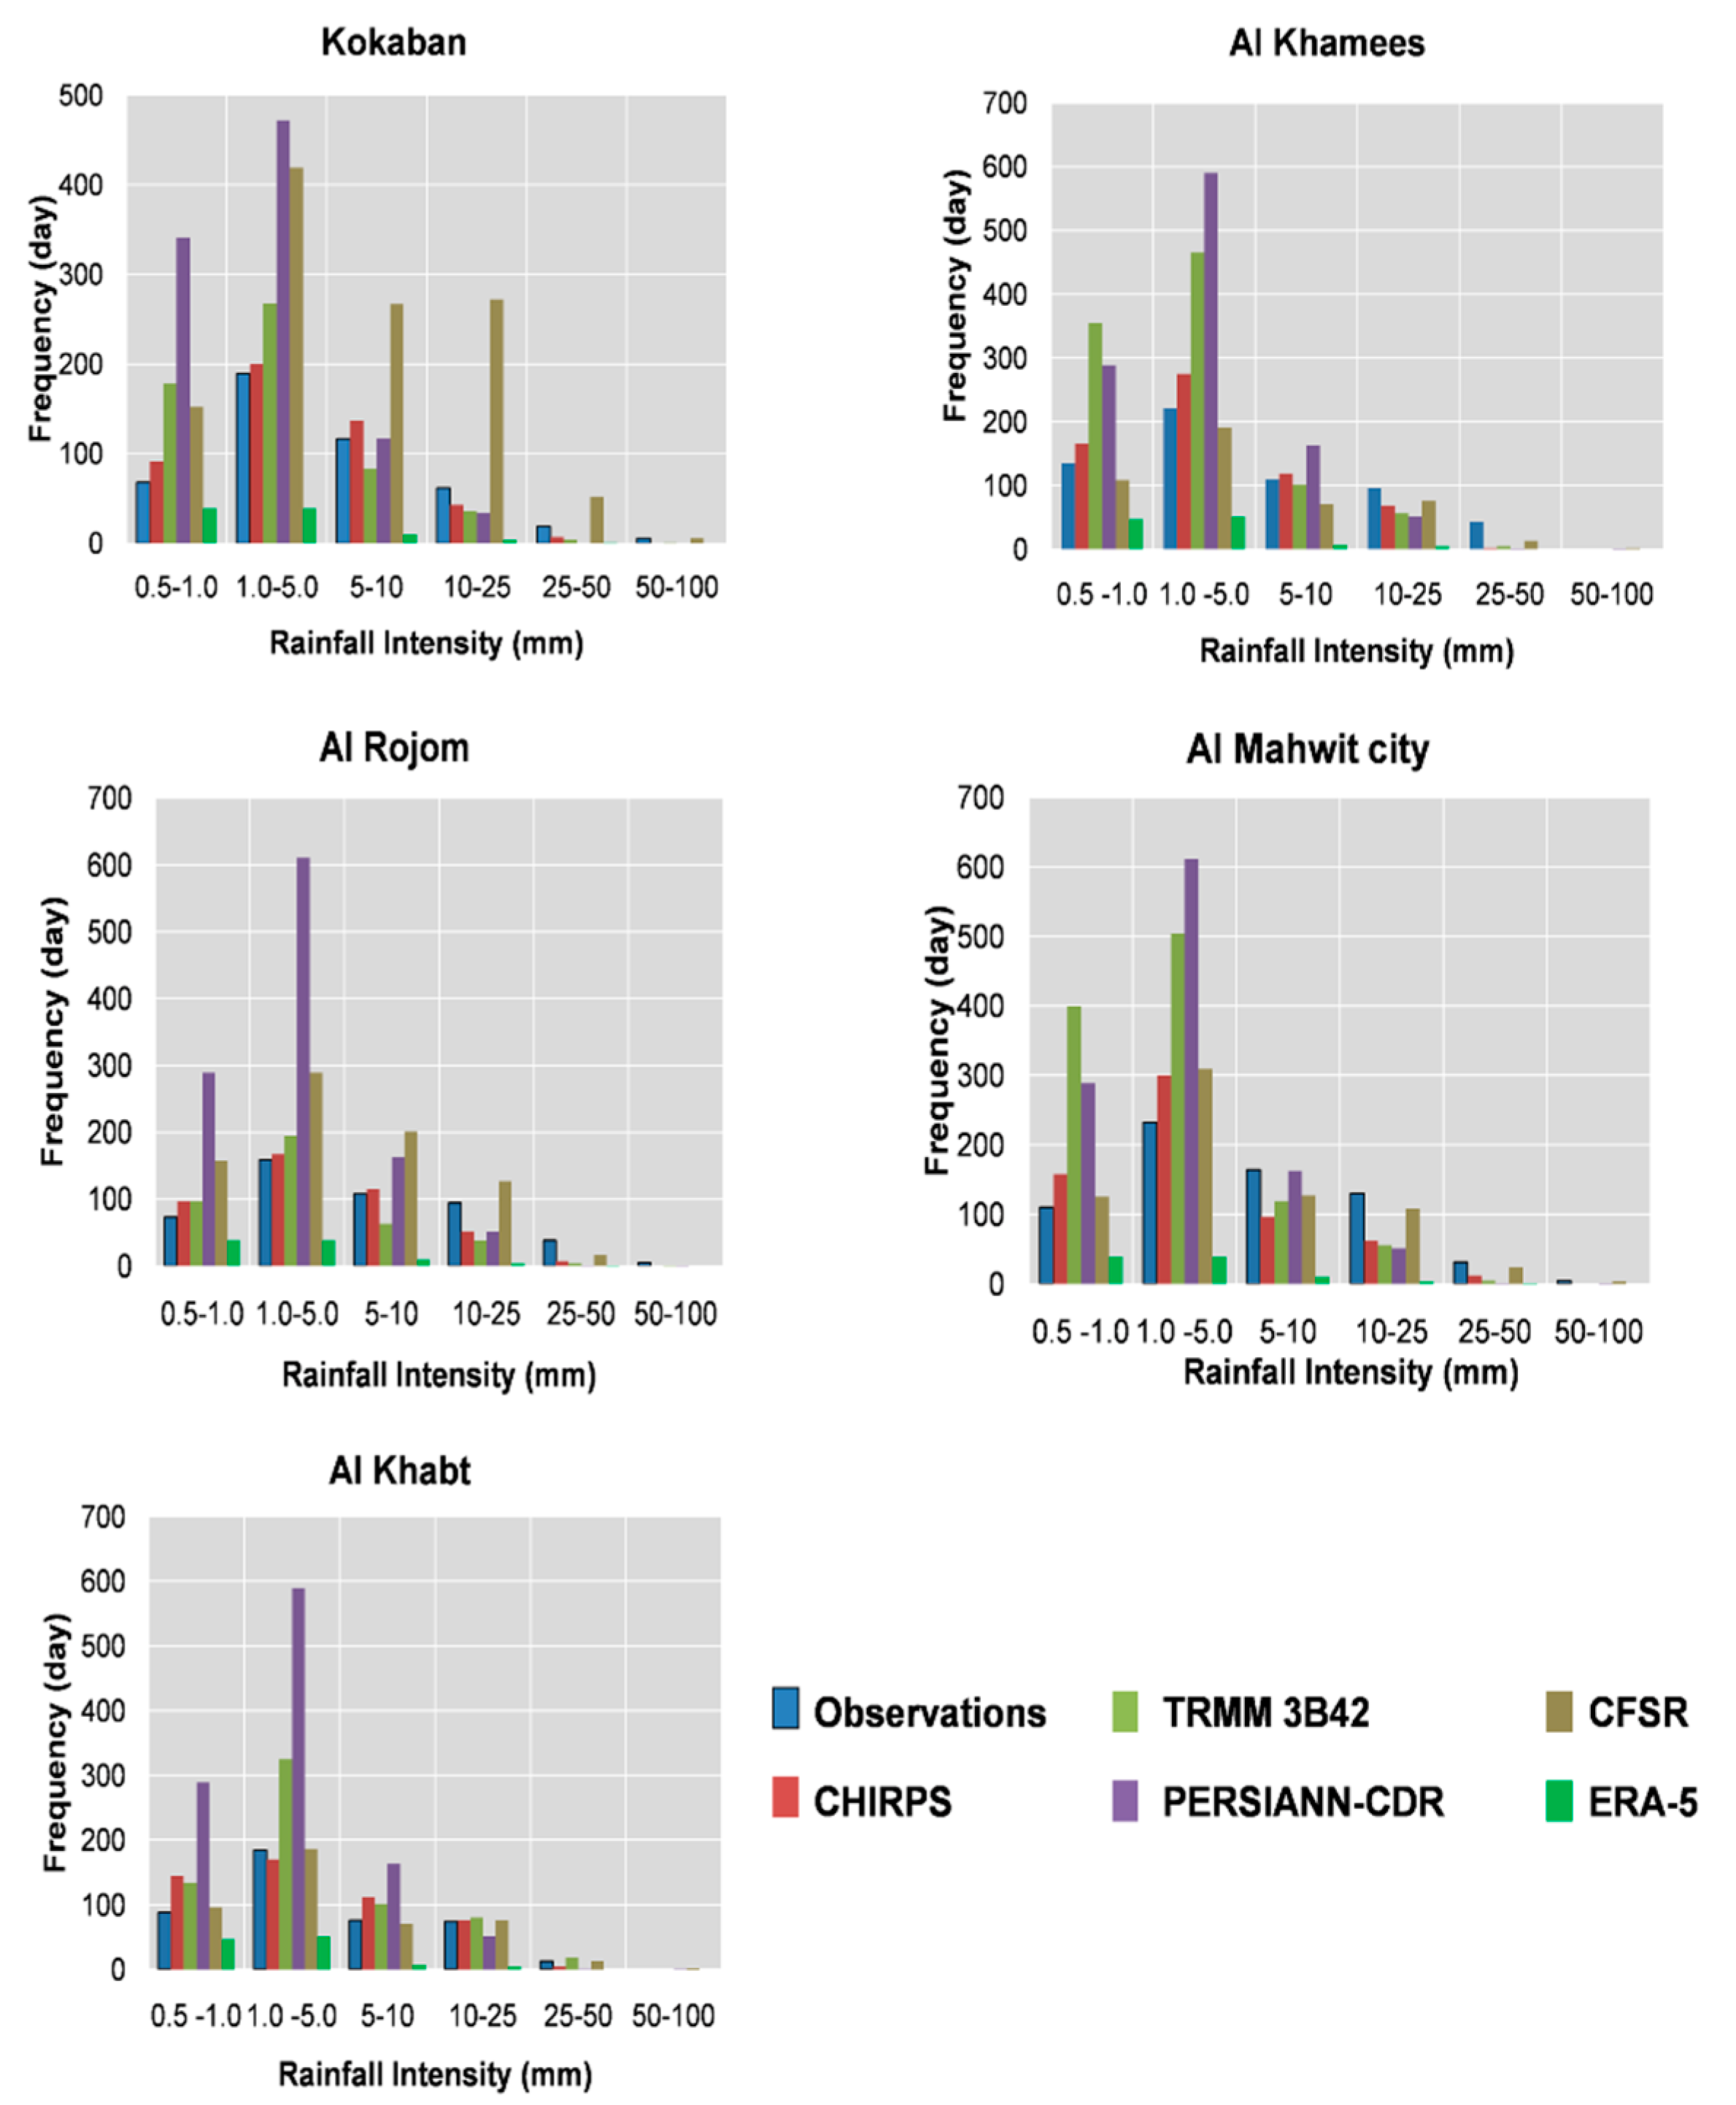
Several histograms are constructed to exhibit the number of wet days and the intensity of rainfall by the different precipitation products over the period 1998–2007. Based on ground stations, the highest rainfall rate at a daily scale is 100 mm, and the lowest is 0.5 mm day−1. Therefore, the histograms plots are built within this limit to compare between gridded products and ground observations with a threshold of 0.5 mm day−1. Days lower than 0.5 mm were excluded from this comparison. Starting with 0.5 mm threshold, the precipitation products are examined from an equal basis point and discrepancy and variance between precipitation products is reduced, especially with the existence and repetition of small rainfall events between 0–0.5 mm, in all precipitation products.
For the Kokaban station, which is located in the high altitude area within Al Mahwit (2650 m above sea level), CFSR and PERSIANN-CDR produce a higher number of wet days compared to observations. According to CFSR and PERSIANN-CDR, the total number of wet days are 1168 and 964, respectively, while observations only showed 471 days in the study area. Therefore, both products (PERSIANN-CDR and CFSR) overestimate wet events, particularly the light rainfall (<5 mm), which occurred more frequently. In addition, high estimation of wet events are also found for the Al Rojom, and Al Mahwit city stations, which are located in the high complex mountainous territories within Al Mahwit. In low areas of Al Mahwit (Al Khamees and Al Khabt stations), performance of CFSR is better in reproducing wet days than in the high complex areas. The deviation of wet days between CFSR and ground stations in Al Khamees and Al Khabt is −18.4 and −4.7%, respectively. This may reveal the good performance of CFSR reanalysis in low areas rather than in high and complex mountainous areas. On the other hand, the average deviation between TRMM 3B42 and observations is around 14% in the high areas (Kokaban, Al Mahwit city, Al Rojom) compared to 45% in the low areas (Al Khamees, and Al Khabt). TRMM 3B42 might be better to produce good estimates of wet durations in high complex mountainous areas rather than in low areas. ERA-5 reanalysis product demonstrates a lower number of wet days in all stations with average deviation from observation around −81.13%. The closest product to reproduce the exact and close wet durations is CHIRPS. In the complex high areas (Kokaban, Al Rojom, Mahwit city), CHIRPS’ average difference of wet days from ground stations is around 6.7%, while in Al Khamees and Al Khabt the deviation is 9.2 and 11.5%. Figure 2 shows the occurrence of wet days by the different precipitation products.
In addition to counting wet days, quantitative statistical analysis such as skewness, standard deviation, mean, and variance between the precipitation products and ground observations are performed. Higher mean and standard deviation are observed on the ground observations, almost in all stations, while examined products skewed towards low precipitation and lower standard deviation (Table 4). However, CFSR shows higher standard deviation. The average of maximum daily rainfall produced by the ground observations is around 61 mm day−1. This rate of rainfall is underestimated by the precipitation products, except CFSR which, in fact, overestimated precipitation rates in all stations.
Categorical statistics of the daily precipitation data are shown in Table 5. The value of Probability of Detection (POD), which is close to 1, proves high accuracy, while False Alarm Ratio (FAR) values are better if they are close to 0. As seen in Table 5, CHIRPS has higher average of POD with value around 0.77, while the FAR is 0.36. The average value of POD and FAR by PERSIANN-CDR is 0.71 and 0.68. POD average value by TRMM 3B42 is 0.52, while its average value of FAR is 0.71. Average values of POD and FAR by CFSR and ERA-5 are 0.48, 0.77 and 0.09, 0.76, respectively. However, we found that the ability of the different products to reflect POD is not influenced by elevation. This result is consistent with findings on different topographic conditions in Mexico [69], but does not agree with the same study in terms of FAR, which shows no tendency to decrease in low elevation areas.
Overall, none of the investigated products (satellite, reanalysis, gauge-based) fully reflects variability of rainfall rates in the study area. Heavy rainfall events are underestimated or totally missed, and rainfall events >25 mm day−1 are rarely captured by the precipitation products. Furthermore, the number of low rainfall events is repeated and frequently reported by the products. Therefore, no attempts were made to investigate extreme events, especially under the short period of observation that constrains visibility of extremes in the study area.

4.2. Monthly Evaluation

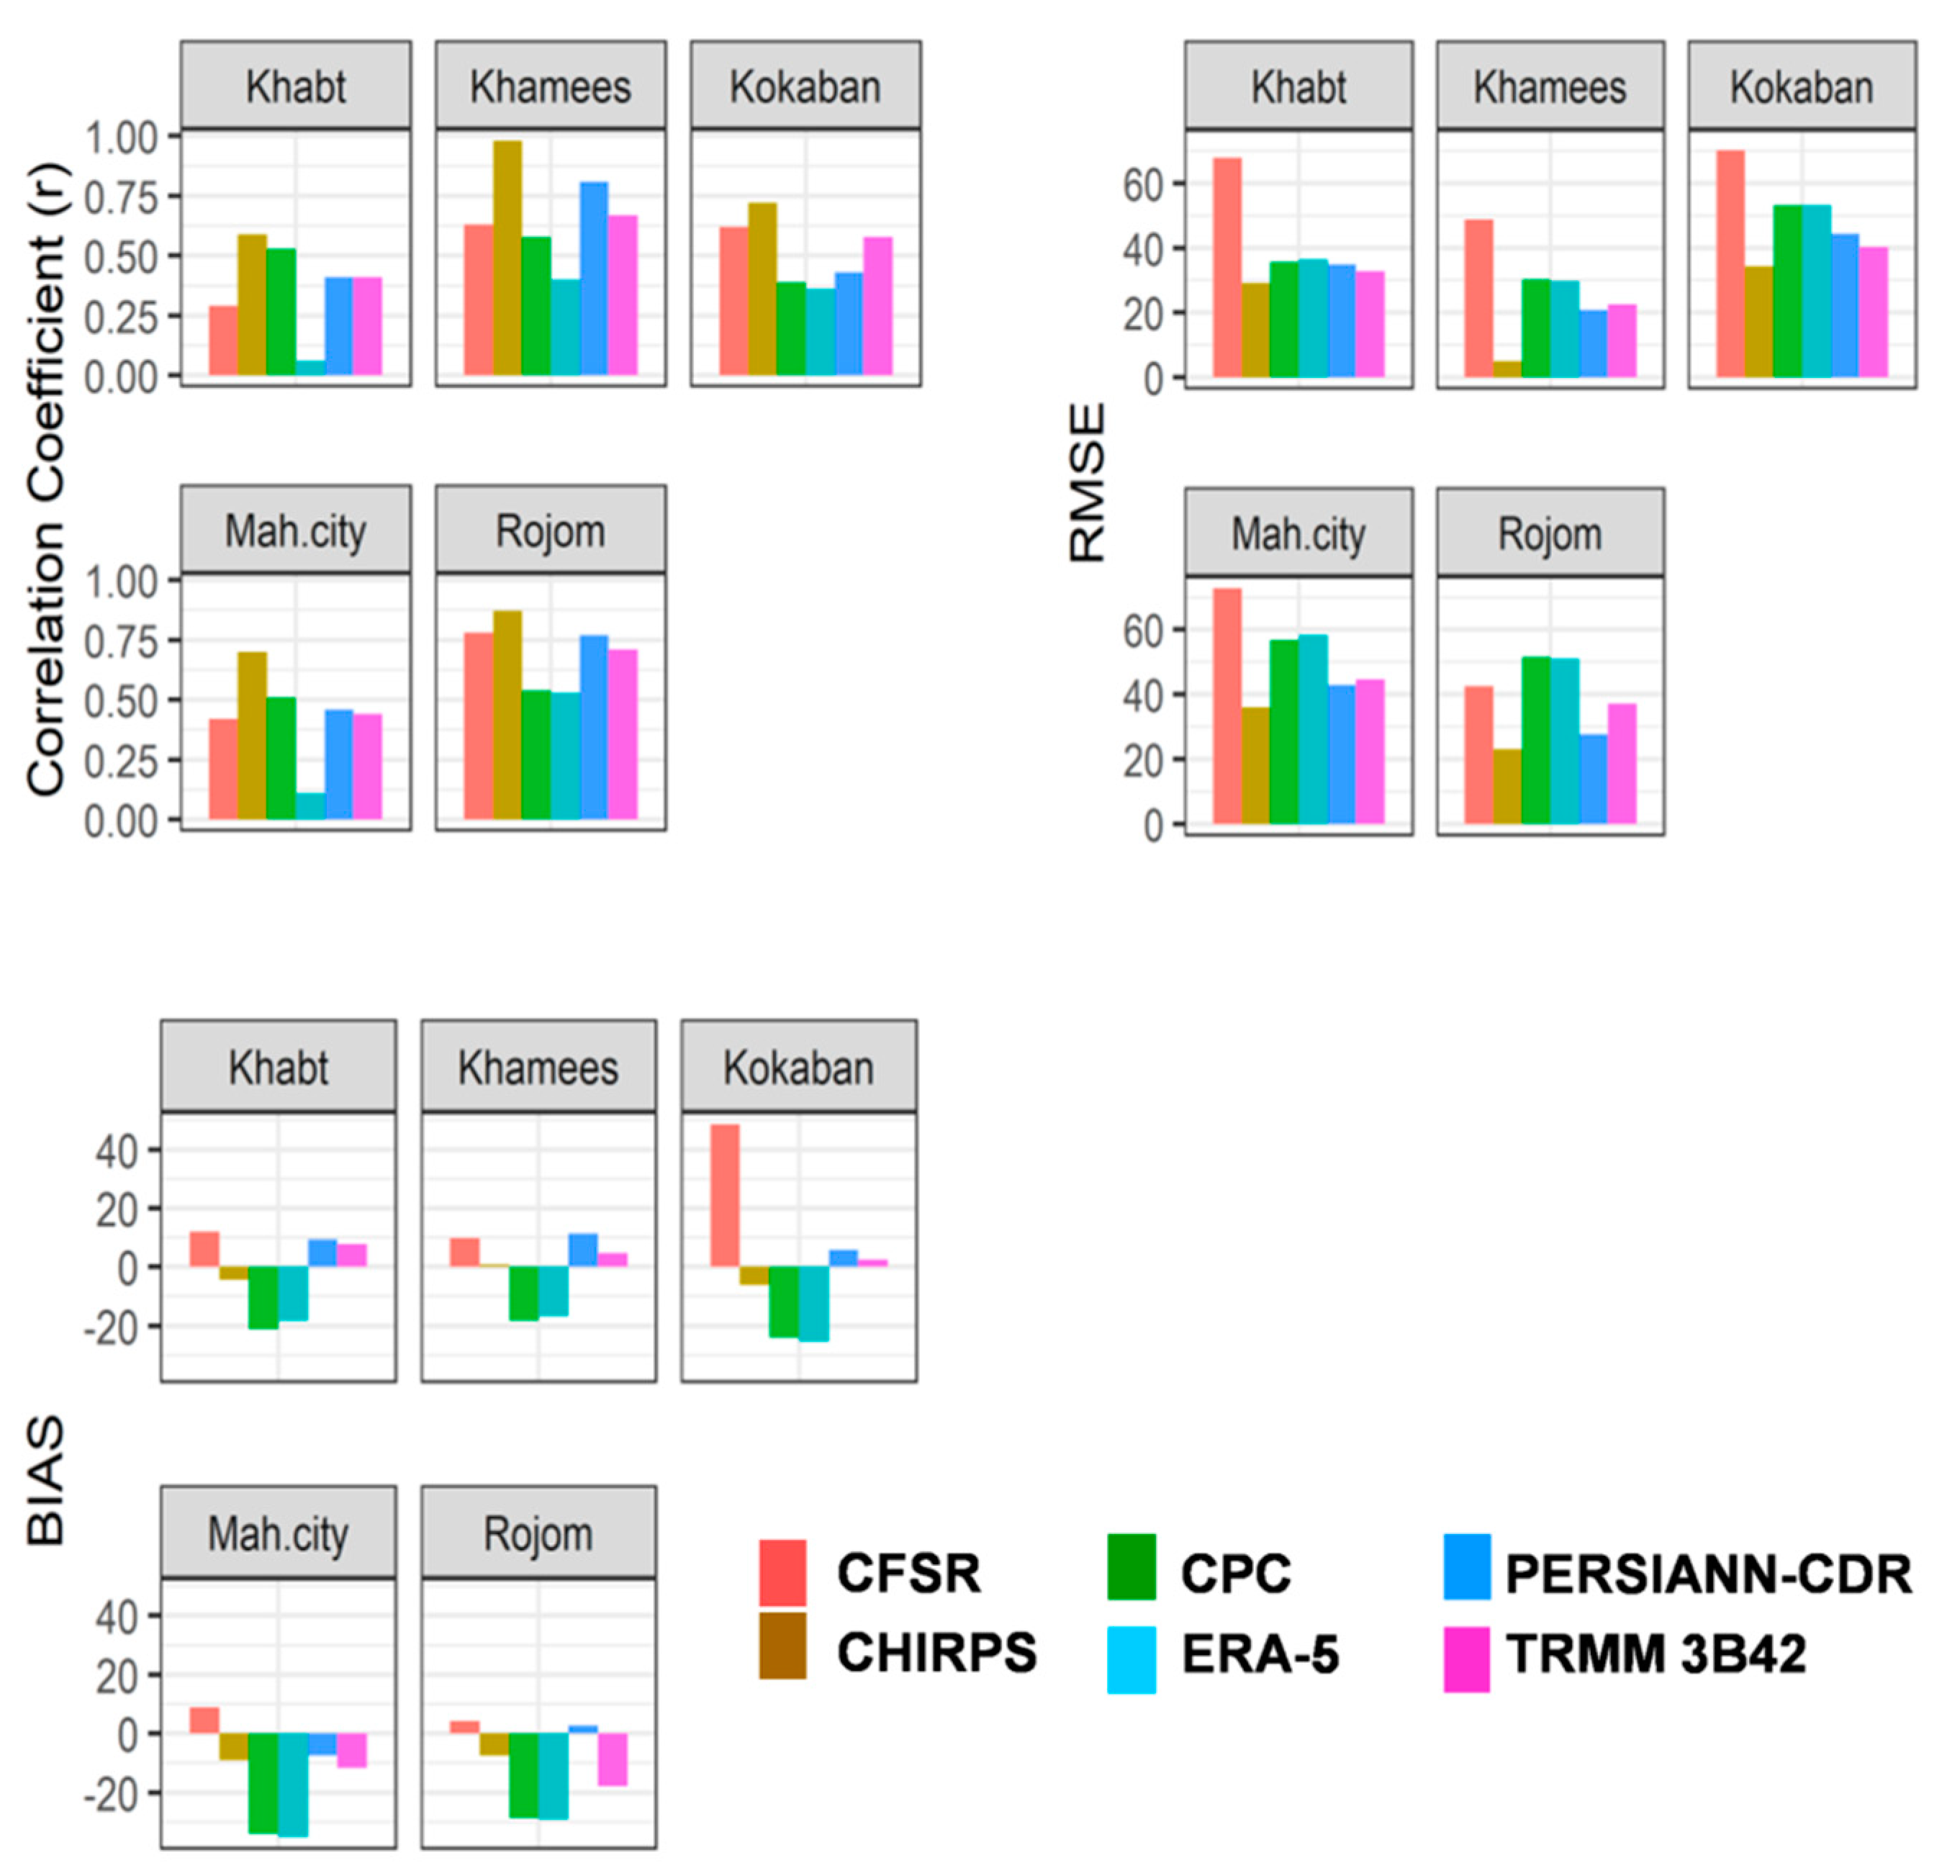
The agreement between the different rainfall products and observations is examined using a set of commonly used statistical estimators, including correlation coefficient (r), bias (BIAS) and root-mean-square error (RMSE) (method details are discussed in 
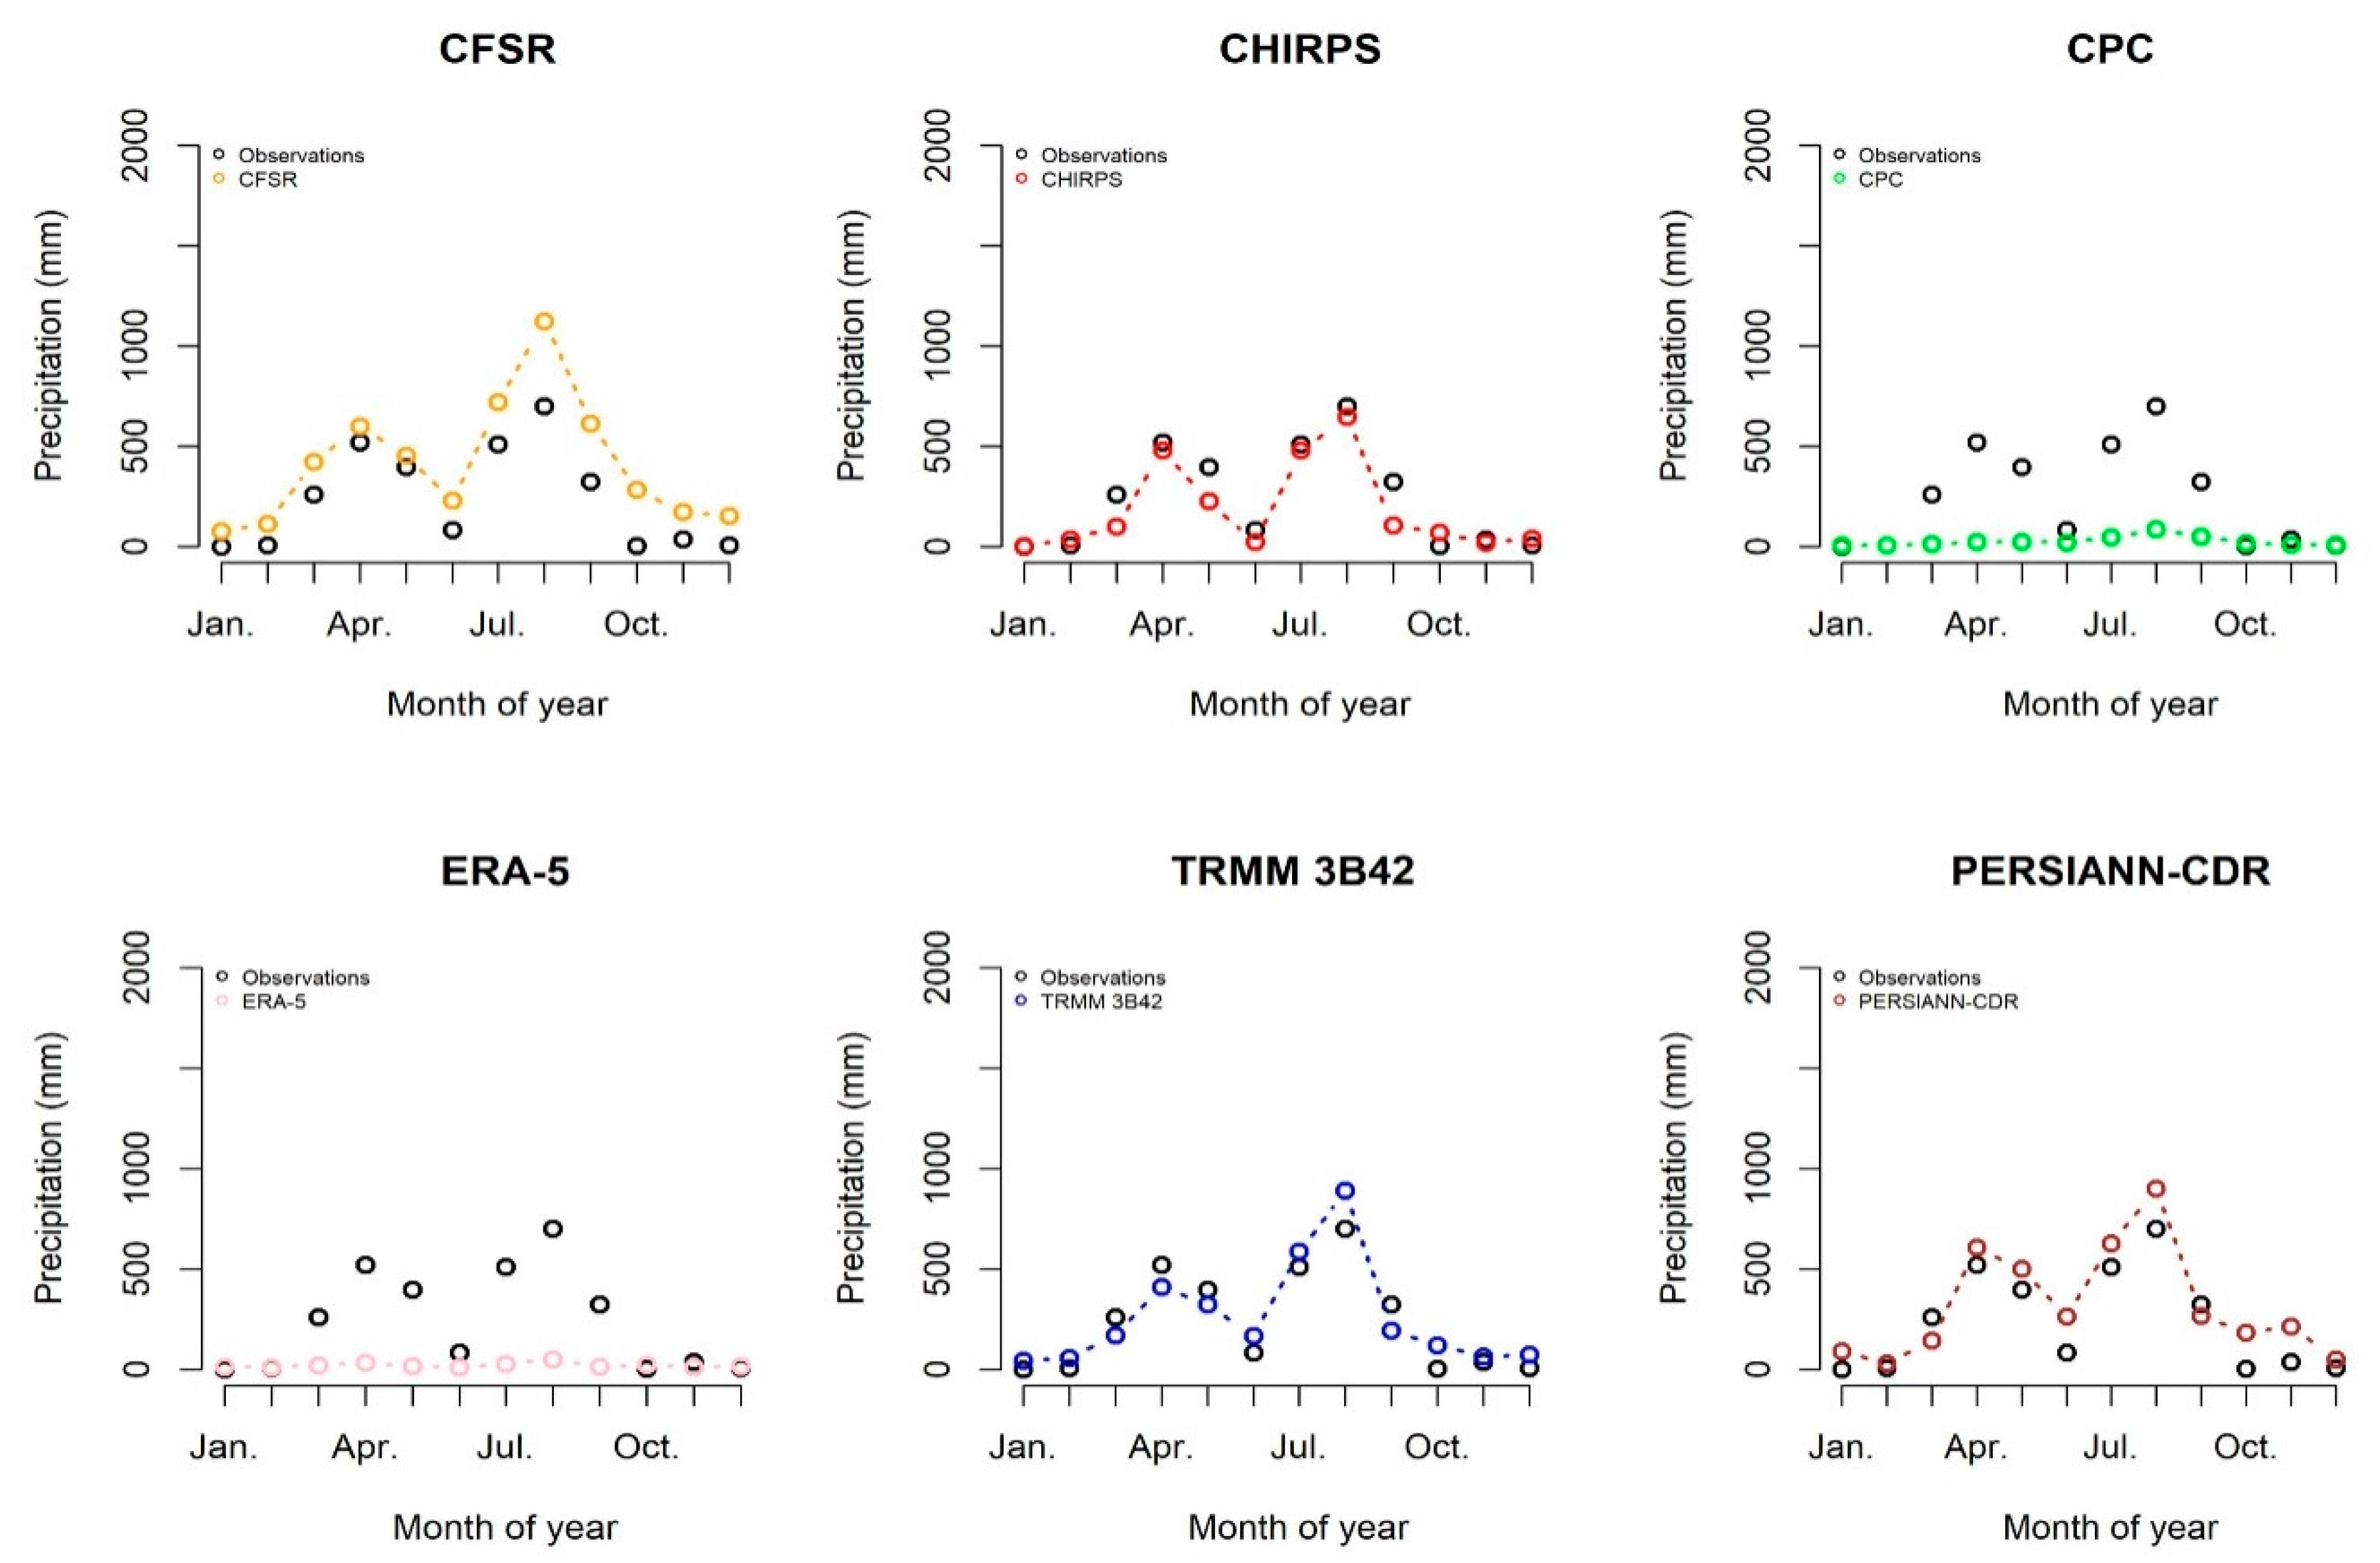
Section 3.2). Monthly total rainfall by each product is compared to observations in each individual ground station over the period 1998–2007. The result shows that CHIRPS is the most accurate rainfall product with high correlation and low bias and error. TRMM 3B42 is the second-best product. CFSR, ERA-5 reanalysis, PERSIANN-CDR, and CPC show lower correlation with higher error and bias. The highest correlation of CHIRPS with station data is found in Al Khamees district (r = 0.98) followed by Rojom (r = 0.87). In Kokaban, Mahwit city, and Khabt stations, CHIRPS shows correlation 0.75, 0.74, and 0.65, respectively.
In the high altitude areas, TRMM 3B42 shows an average correlation of around 0.58, while in the low land areas (Al Khamees, and Al Khabt), the average correlation between TRMM 3B42 and ground data is 0.54. In high mountainous areas, CFSR, PERSIANN-CDR, ERA-5, and CPC show an average correlation of 0.46, 0.55, 0.23, and 0.28, respectively, while in the low areas, the correlation of CFSR with observation increased to around 0.61. However, CPC and ERA-5 show a low correlation with observed data.
Among examined datasets, CFSR shows the highest root-mean-square error (RMSE), especially in Kokaban with value around 70.0 mm, and Mahwit city at 73.0 mm. PERSIANN-CDR, ERA-5, and CPC are the second products showing high RMSE, with values around 44.0, 53.0 and 52.0 mm, respectively. In the mountainous areas, specifically in Kokaban, CFSR and PERSIANN-CDR tend to produce more estimates of rain than real observations, while ERA-5 and CPC underestimate real precipitation events. The highest bias between precipitation products and observations is found with CFSR, followed by CPC and ERA-5 (Figure 3). CFSR shows the highest bias in Kokaban, with value around 49.0 mm. However, the average bias of CFSR over the study area is 16.68 mm, while ERA-5 and CPC showed a monthly average bias of −24.96 and −25.29 mm, respectively. Moreover, the average bias of PERSIANN-CDR, TRMM 3B42, and CHIRPS is around 7.35, −2.9, and −5.24 mm, respectively.
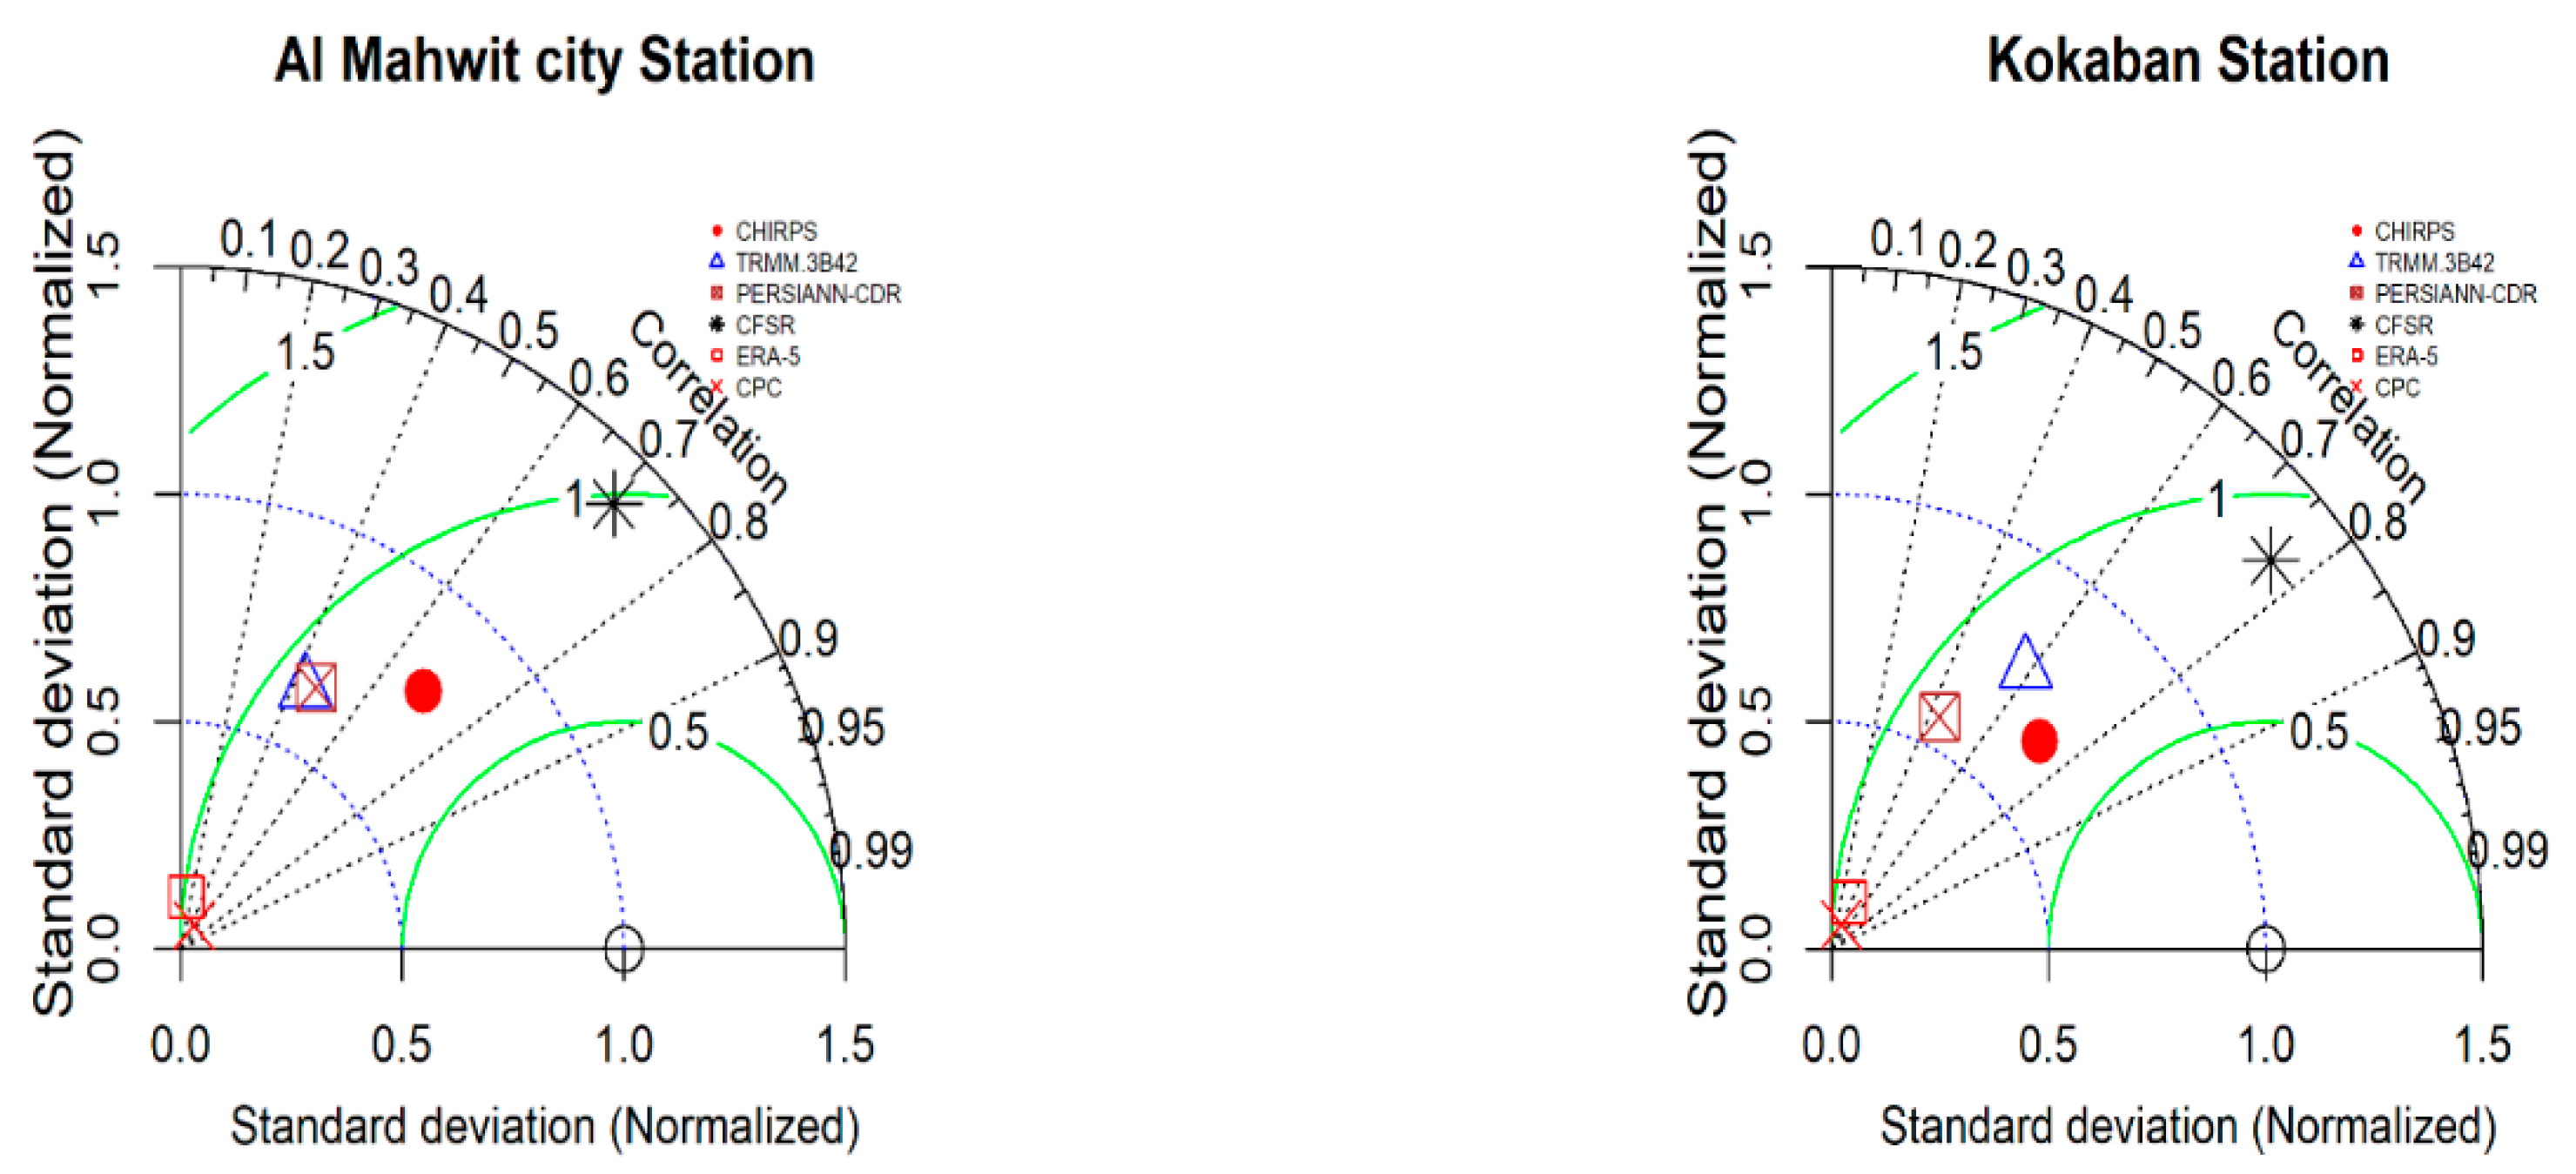
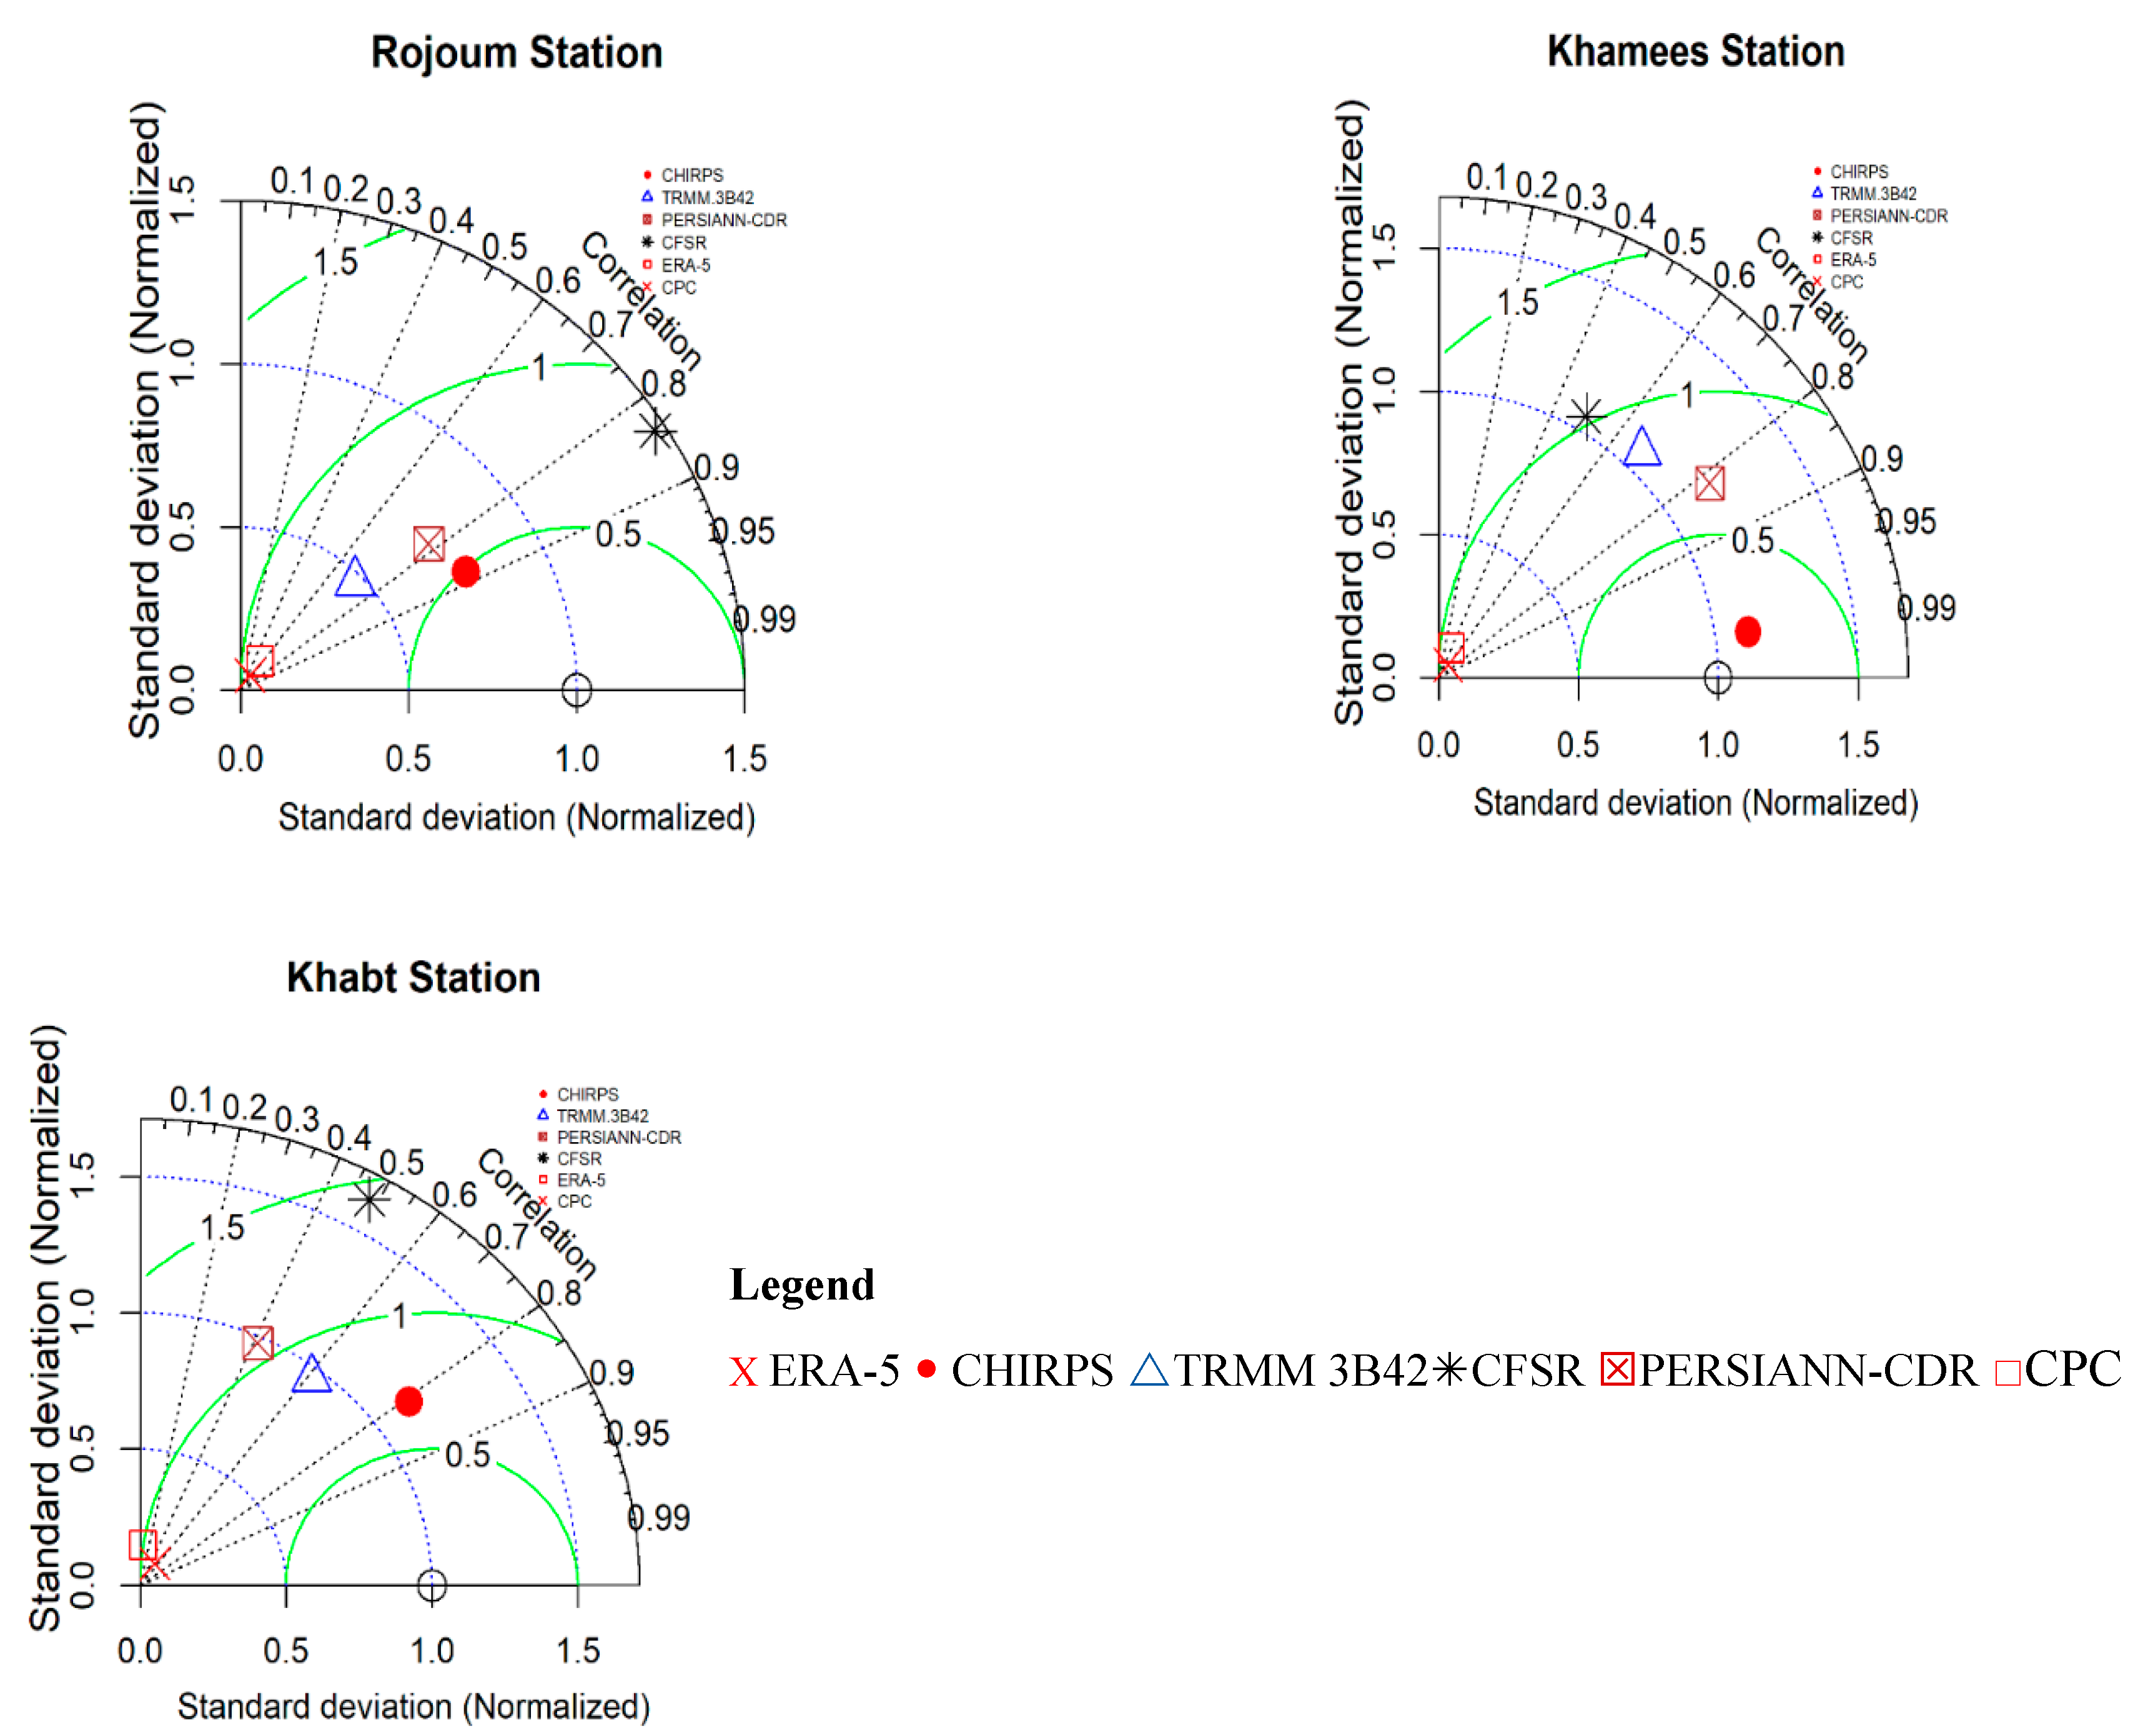
Moreover, the monthly values are plotted in a Taylor diagram (Figure 4). In general, CHIRPS correlates well in all stations with lower standard deviation in high mountainous areas and a slightly higher standard deviation in the low areas (Al Khamees and Al Khabt). For the Kokaban station, CHIRPS correlation is around 0.75 with a standard deviation of about 0.25, which is lower than the normalized standard deviation. In Al Rojom and Mahwit city, CHIRPS shows a high correlation of 0.87 and 0.72, respectively. The standard deviation of CHIRPS in Al Rojom and Al Mahwit city is lower than the observed. This may due to misrepresentation of heavy rain events by CHIRPS, which affects the standard deviation. In the low areas (Al Khamees and Al Khabt stations), the standard deviation of CHIRPS is higher than the normalized standard deviation by around 0.15. Overall, the average correlation of CHIRPS over the study area is around 0.78.
TRMM 3B42 shows good correlation with observations and seen to be the second-best product after CHIRPS. The correlation coefficient of TRMM 3B42 is around 0.57 in the highland areas and around 0.54 in the low areas, while its standard deviation tends to decrease in the high areas compared to low areas. Again, this is due to underestimation and its capability for capturing high rainfall events compared to ground observations. PERSIANN-CDR shows rather good correlation with the ground dataset of Al Rojom and Al Khamees stations with 0.75 and 0.81, respectively.
However, in the other three stations (Kokaban, Mahwit city, and Al Khabt); PERSIANN-CDR demonstrates low correlation owing to the higher estimation of total monthly precipitation rates by this product in the study area. CFSR shows high standard deviation. CFSR, on the other hand, overestimates monthly rainfall rates in all stations, with many more estimates for the Kokaban station. Over the study area, the monthly correlation average of CFSR is about 0.51. CPC and ERA-5 show a weak correlation and very low standard deviation when compared to the observed data (Figure 4). This is due to the low estimates of precipitation rates in this area by both products.
The average correlation of TRMM 3B42 in the five stations is around 0.56. PERSIANN-CDR, CFSR, ERA-5, and CPC show an average correlation 0.53, 0.51, 0.20, 0.15, respectively. The root-mean-square error average (RMSE) is found to be higher by CFSR especially for the Kokaban station, with values around 69.6 mm and bias of 50.2 mm. In Kokaban, CFSR is producing high estimates of rainfall compared to real observations. In general, the average RMSE in all stations by CHIRPS, TRMM 3B42, PERSIANN-CDR, CFSR, ERA-5, and CPC is found to be 25.5, 35.5, 34.2, 60.4, 45.7, and 45.5 mm, respectively. (Table 6)
The average of monthly total rainfall rates of the precipitation products over the study area is used to calculate the percentage difference between each product and the observations. The results show that the percentage difference between PERSIANN-CDR and CFSR from observations is 46.5 and 81.25%, respectively. Similarly, ERA-5 and CPC show a difference of around −158.2 and −148.2% from observation, whereas the difference between CHIRPS and TRMM 3B42 with observed data is −24.07 and 32.32%, respectively (Figure 5).
Further, to make the study as comprehensive as possible, additional monthly rainfall data from 14 stations around the study area are used. The additional data are particularly used to verify the performance of the highest correlated products (i.e., CHIRPS). As this additional dataset is temporally limited, compared to daily stations used in this study, the comparison was only done with CHIRPS. Similar to the daily comparison, the result shows a high correlation and low bias of CHIRPS (Table 7) for all 14 stations. On average, the correlation coefficient (CC), Bias, and RMSE are 0.88, 2.905 mm, and 40.1 mm, respectively. Overall, the findings are similar to the daily evaluation, which shows a high correlation to CHIRPS.

4.3. Annual Timescale Evaluation

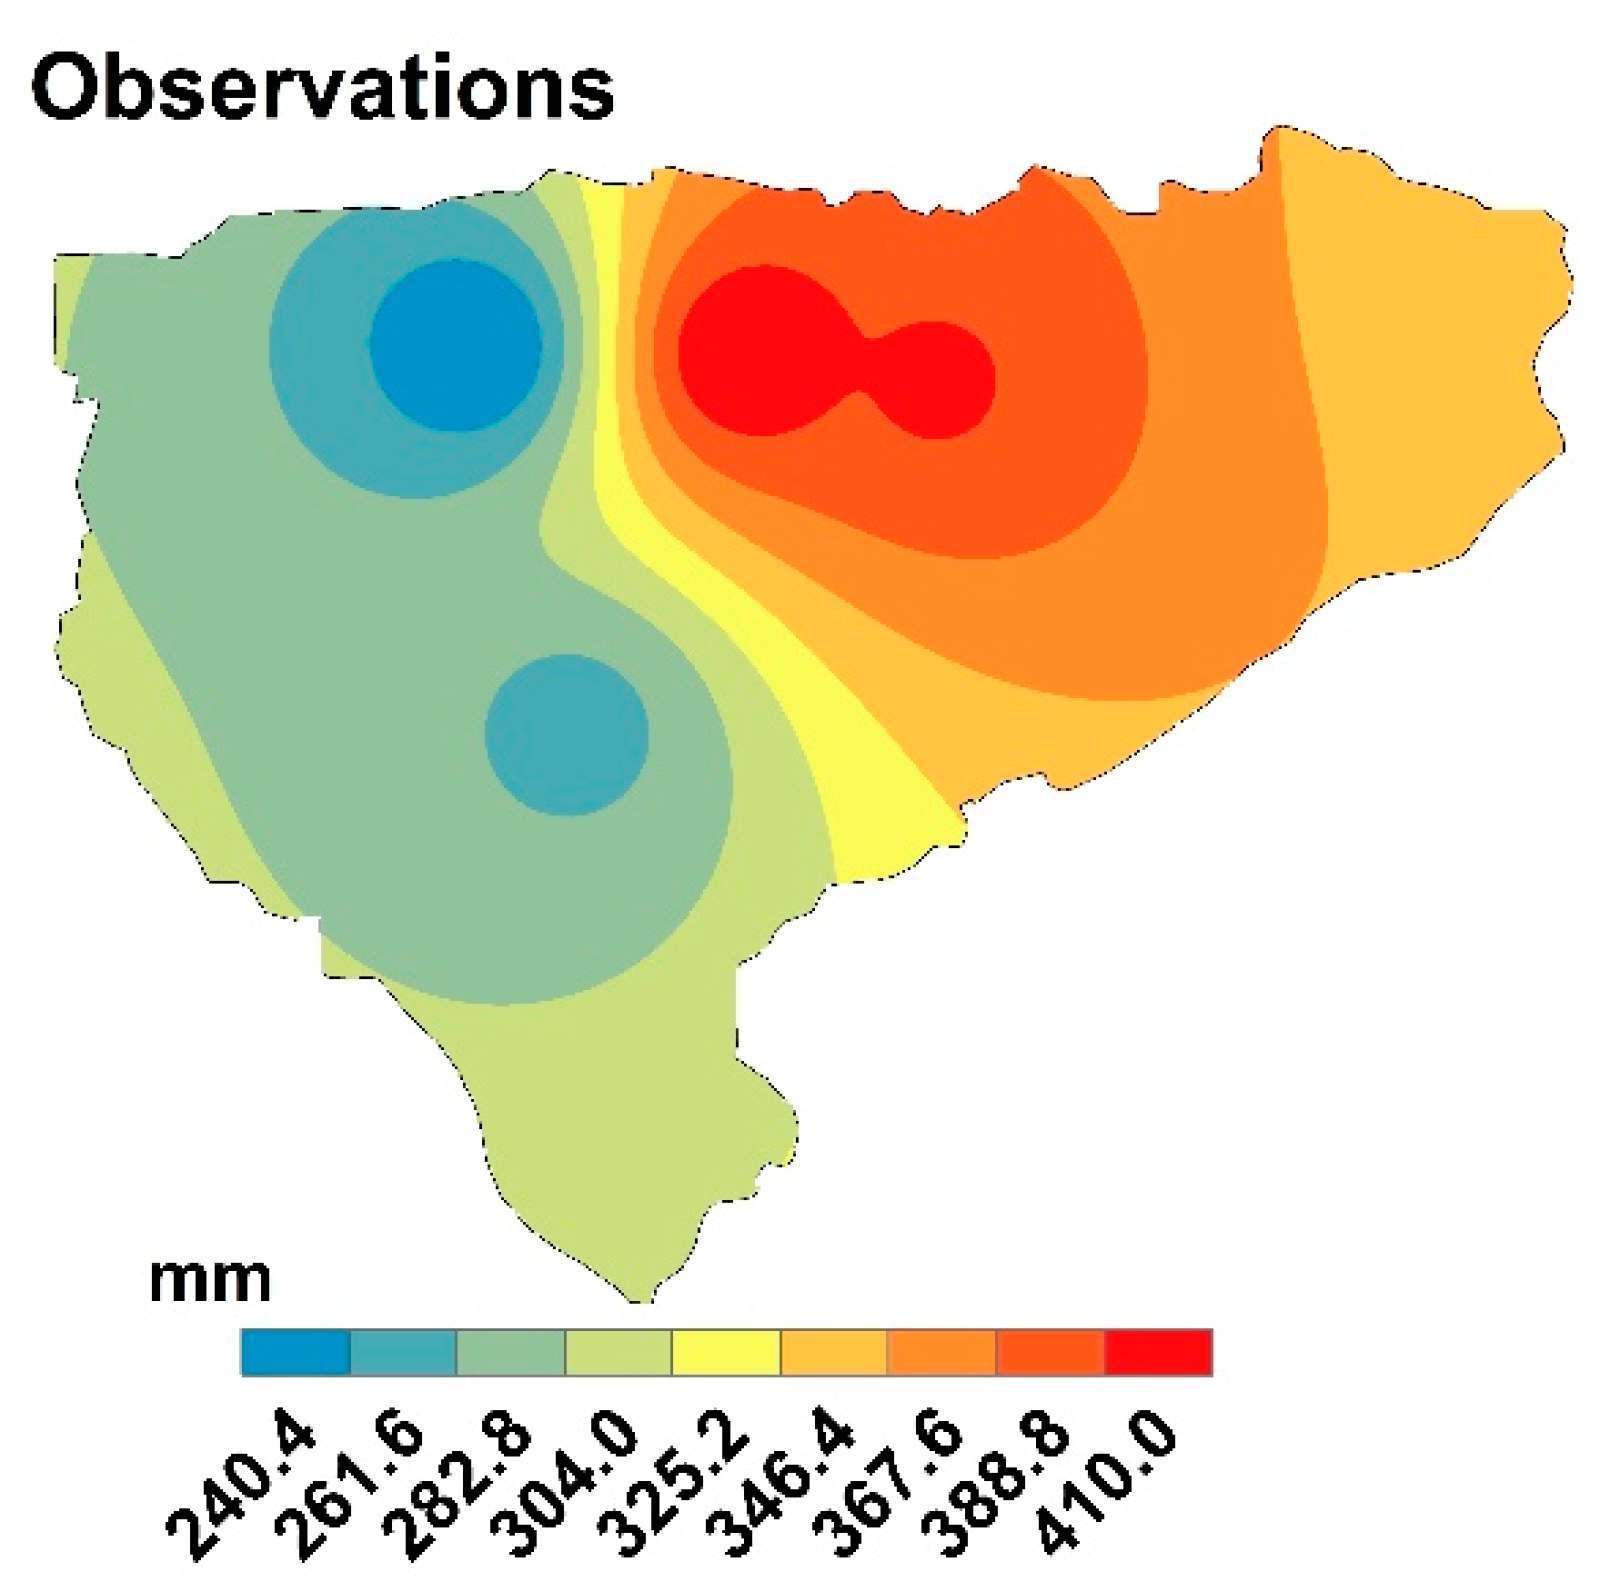
Rainfall maps are constructed to display the variability of annual total precipitation presented by the different products. Maps cover the entire study area with the annual total rainfall rates during the period 1998–2007. Based on ground observations (Figure 6), the highest rainfall rates are found in Al Mahwit city and Al Rojom stations with annual total precipitation around 410 mm year−1 at both stations. Northeast of Al Mahwit (Kokaban station), the rainfall annual rates are 346.4 mm year−1. Kokaban station represents the rainfall rates in the highest part of the region (altitude around 2600 m above sea level). The lowest rainfall rates are observed in the low areas within Al Mahwit in the Al Khamees and Al Khabt districts, with an altitude around 400 m above sea level. Around 263.6 mm year−1 is the average annual precipitation at the Al Khamees and Al Khabt stations.
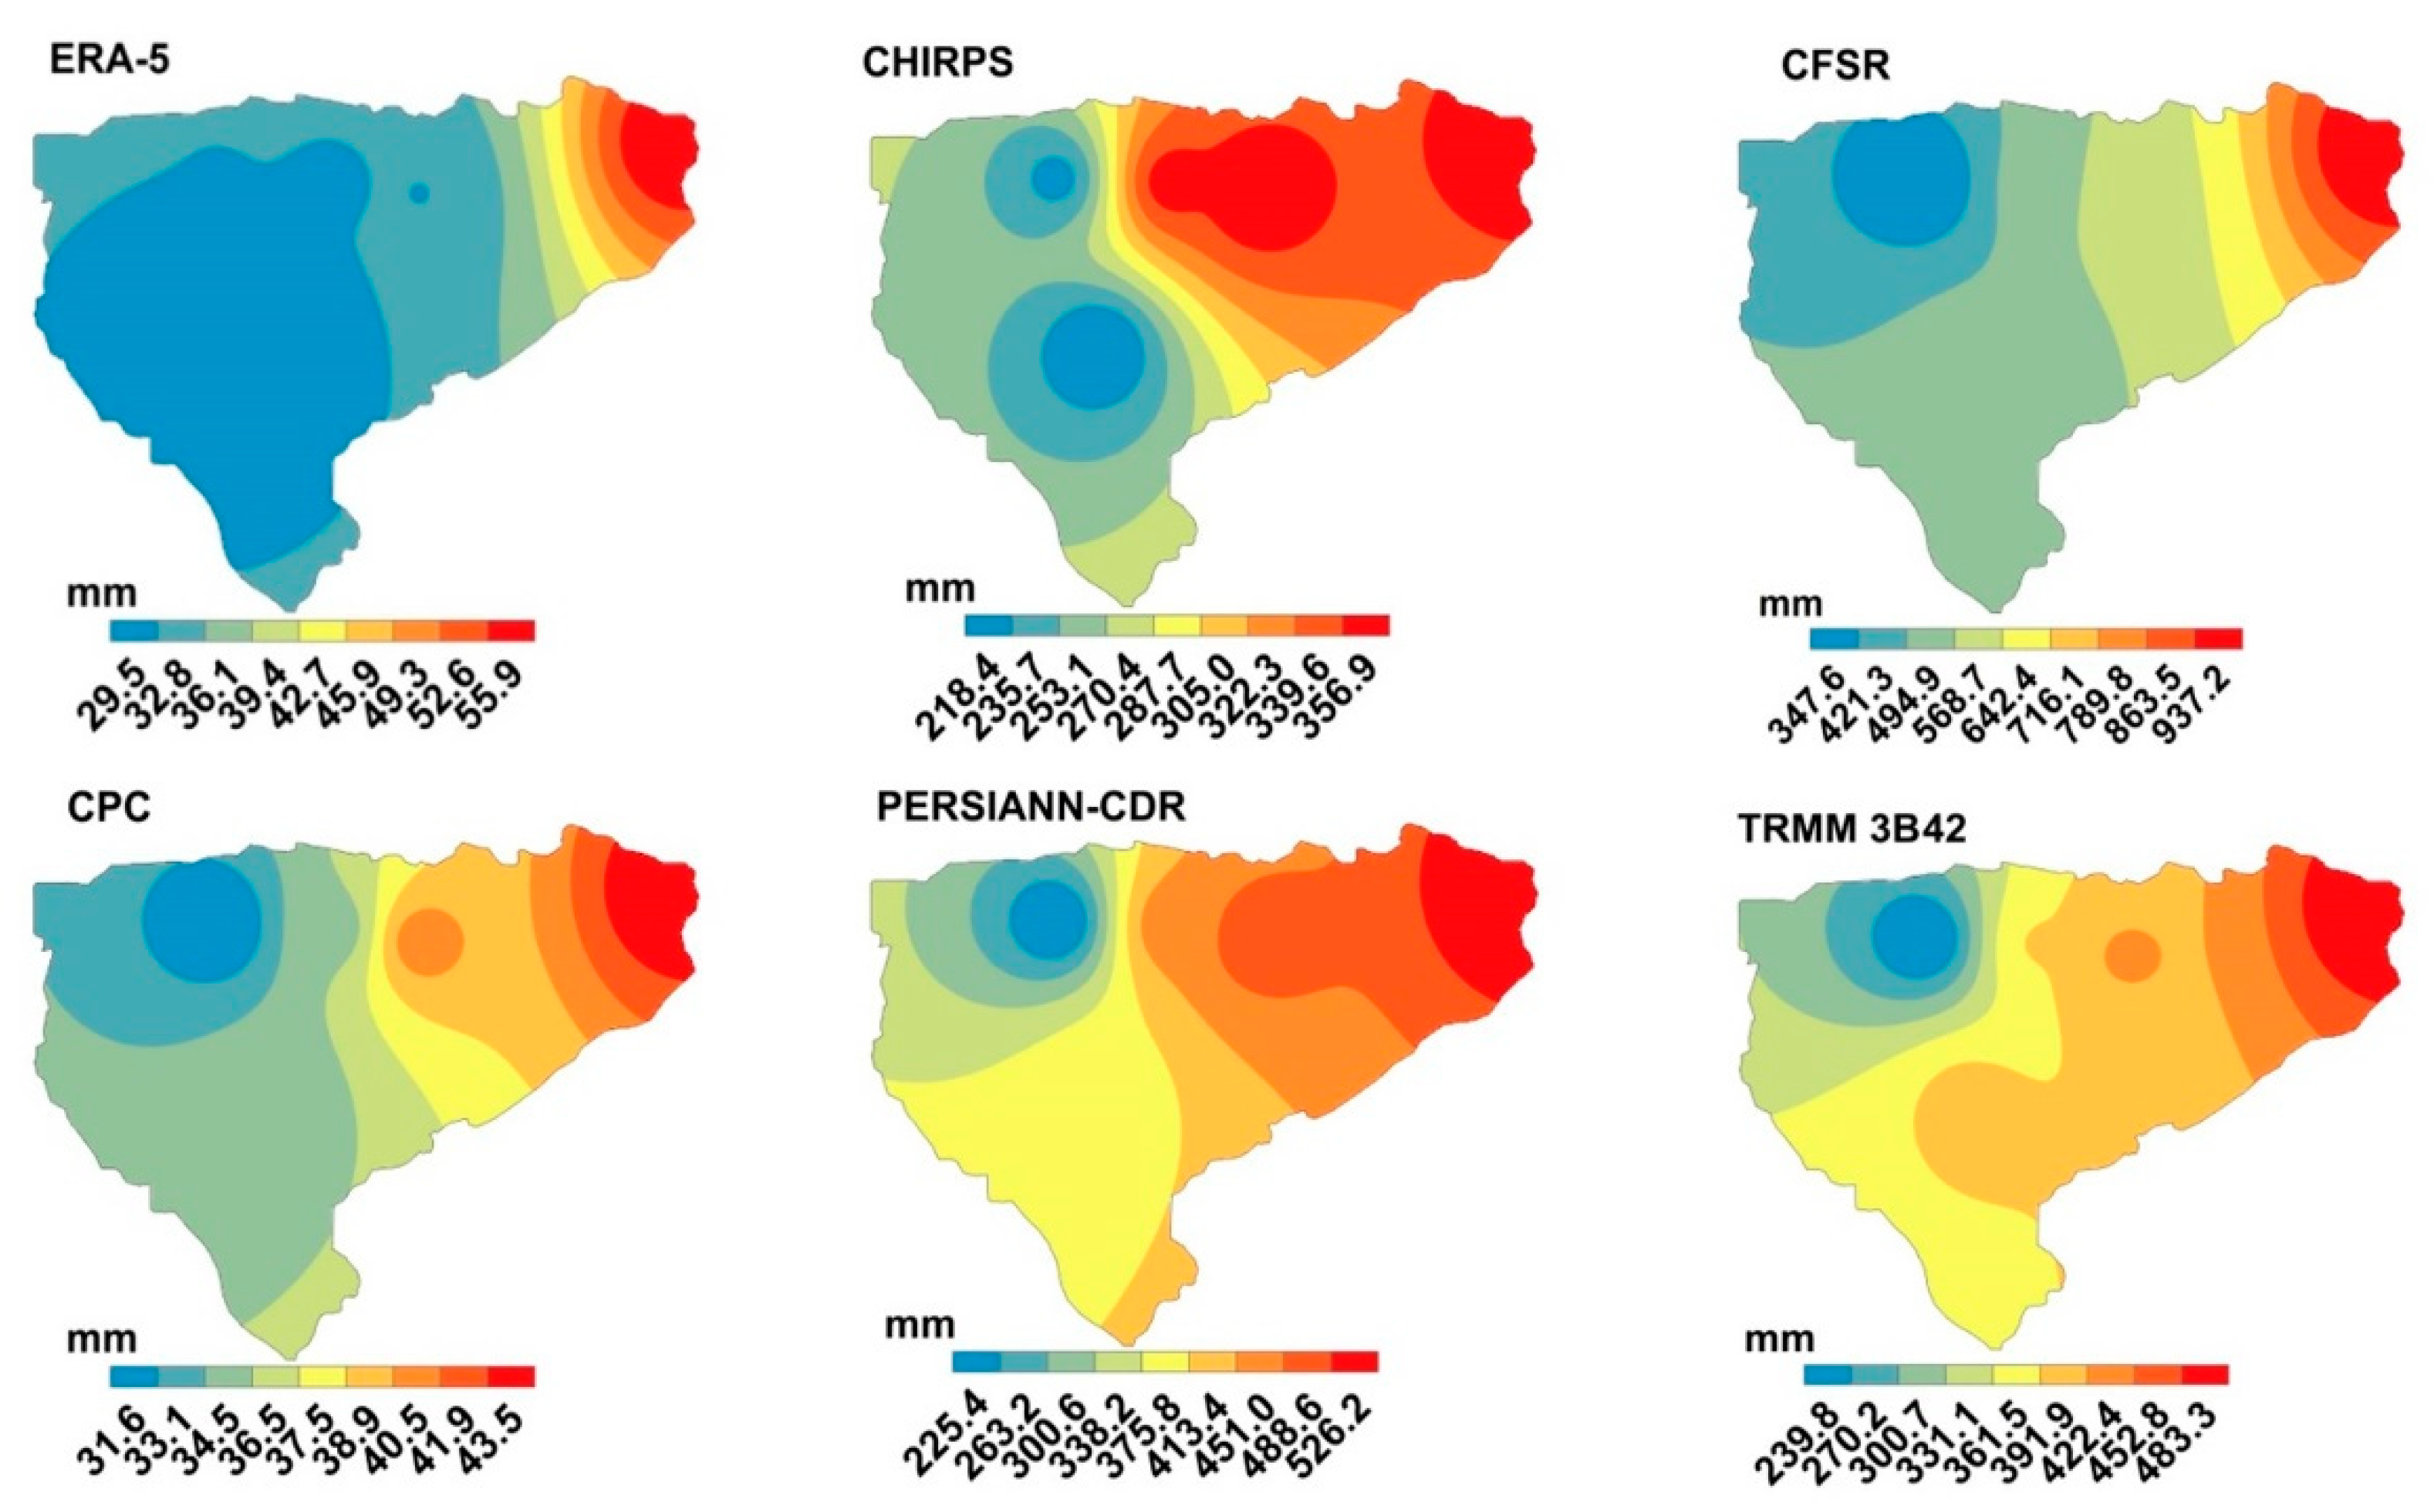
Annual precipitation estimates on the study area differ from one product to other. However, the tested products (Figure 7) show similar tendency to produce high rainfall estimates northeast of Al Mahwit (high areas) and lower rates in the west and the southwest of the area (low areas). This pattern of rainfall is apparently influenced by the topography of the region. The total estimates of the annual rainfall rates are captured well by CHIRPS, followed by TRMM 3B42. CHIRPS is more accurate and shows the exact pattern of rainfall in the entire area. Parallel to the observations (Figure 6), CHIRPS produces high precipitation rates in Al Mahwit city and Al Rojom, but provides the best estimate for Kokaban station. TRMM 3B42 shows good relative estimates for several stations (Al Rojom and Al Khamees) but fails to produce the rainfall patterns of the study area. The average annual rainfall estimates by CHIRPS in the high complex mountainous territories (Kokaban, Al Rojom, Al Mahwit city) is 351.7 mm year−1. In the low area stations (Al Khamees and Al Khabt), the CHIRPS rainfall estimate is around 207.1 mm year−1. However, CHIRPS appears to slightly underestimate rainfall rates of the study area. Taking the average annual rainfall, the Pbias of CHIRPS in all stations is −8.68%. TRMM 3B42, on the other hand, overestimates the annual rainfall rates in Kokaban, Al Khabt, and Al Rojom, and underestimates for Al Mahwit city and Al Khamees. CFSR and PERSIANN-CDR show the highest estimate of rainfall rates for all stations. In Kokaban, CFSR shows the highest rainfall estimate, with average rates around 937.2 mm year−1, while for Al Rojom, Mahwit city, Al Khamees, and Al Khabt stations, the rainfall average estimation by CFSR is 431.2 mm year−1. The percent bias (Pbias) between CFSR and observation is 66.21%. PERSIANN-CDR is the second product showing a high estimate of rainfall rates. In the high mountainous areas (Kokaban, Al Rojom, and Mahwit city), the average of annual rainfall estimates by PERSIANN-CDR is around 481.5 mm year−1 and around 275.0 mm year−1 in the low areas (Al Khamees and Al Khabt); the Pbias is 22.9%.
CPC and ERA-5 underestimate the annual precipitation rates of the study area. Around 39 and 38.2 mm year−1 is the average of annual rainfall estimate in the high areas by CPC and ERA-5, respectively, while in the low land areas (Al Khamees and Al Khabt) this value drops to 31.8 and 27.9 mm year−1. The Pbias of average annual precipitation of CPC and ERA-5 and ground stations is −88.35 and −88.97%, respectively. However, due to the large variation of rainfall estimates between the products, it was not practical to show the maps at the same rainfall scale, as some rainfall estimates will only produce one color scale map (Figure 7). The observed average annual rainfall from ground stations and precipitation products are shown in Table 8.

5. Discussion

Finding a gridded precipitation product that generates the same rainfall estimate as ground observations, particularly at daily timescale, is challenging in the highland region of Yemen due to complex topography, low number of ground stations, and rainfall pattern that is typified by heavy and short rainfall events [30,70,71], which are often missed by gridded precipitation products such as remote sensing products [72]. Therefore, the agreement between the products and station data on a daily timescale is rather weak and improved when temporal resolution is decreased to monthly and yearly. This result agrees with other studies [73,74,75]. However, comparison between precipitation products with ground records at a monthly and annual timescale is recommended by several studies [51,76] since field-based stations (as point measurements) cannot be considered as reference data for the assessment of area-based rainfall estimates, if not compared at a monthly or annual time step.
Based on our results, CHIRPS captures the daily wet durations well with an average deviation around 11.53% from ground observations, correlates well at monthly timescale with value of 0.78, captures the annual rainfall rates with Pbias around −8.68%, and reproduces the rainfall patterns of the study area. TRMM 3B42, as the second-best performing product, shows a deviation of around 43.7% for wet days and demonstrates a relatively high monthly correlation 0.56, with annual Pbias of around 15.30%. Compared to CHIRPS, however, TRMM 3B42 shows lower skills in providing the rainfall patterns of the study area. Also, TRMM 3B42 tends to overestimate daily rainfall rates over the study area, whereas CHIRPS slightly underestimates the daily rainfall estimates. Other products such as CFSR and PERSIANN-CDR demonstrate overestimation of daily precipitation rates in all stations with higher biases and errors compared to CHIRPS and TRMM 3B42. The lowest precipitation estimate is found by CPC and ERA-5 products on all timescales and in all validation areas. Table 9 shows the result of all applied statistics used to investigate the performance of the precipitation products at different timescales.
Although investigation of the specific reasons for the difference between rainfall products and observations are beyond the scope of this study, over- and underestimation of rainfall estimates may relate to factors such as large special resolution, low number of ground stations in the study area, errors related to data source and merging and blending process, model parameterization applied specifically for reanalysis products, and the satellite sensor used to differentiate between rain and rainless clouds [77,78].
For instance, the high estimation of rainfall rates by TRMM 3B42 is consistent with other studies on neighboring regions such as Ethiopia [79], which indicated overestimation of rainfall rates on the highland region of Ethiopia. High rainfall rates produced by PERSIANN-CDR, particularly the low rainfall events, is consistent with other studies from Iran highlands and high region of China [41,80]. A large degree of variability of reanalysis dataset, mainly CFSR, agrees with the result presented by Qiaohong Sun and C. Maio 2017 [81], which covers around 30 global precipitation datasets and mentions the large difference in precipitation estimates, especially in complex mountain areas and high latitude regions. A large variability has been found in complex mountainous terrain in Ethiopian highlands [43] and the Ecuador Andes [82]. The CPS product, which underestimates rainfall rates in our study area, has been shown to underestimate monthly rainfall rates in other semiarid regions [83,84] and misses local heavy precipitation events. In Yemen, limited ground stations and the nature of the study area may affect the performance of products like CPC and ERA-5 to predict the rainfall rates correctly. However, the reanalysis precipitation products are considered to have more uncertainty than the analyzed state fields [13,85,86].
In general, the high performance of CHIRPS in the highland region of Yemen (Al Mahwit) may be attributed to its high resolution (0.05°) and low latency to blind station data within two days and produce a final product with an average latency of about 3 weeks [55,85]. High performance of CHIRPS has been proven in areas where station data are not included [13,86]. In addition, the product has been used in many evaluation studies [87,88] and recommended to support hydrological forecasts and trends analysis, for instance, as proved in an Ethiopian case study [89,90] and other studies that use CHIRPS as input in hydro climate modeling [58,90]. Table 10 below shows the results of CHIRPS performance in several previous studies. The studies [13,14,15,90,91] were performed within semiarid regions that are generally similar to topographical conditions of Yemen’s highland region, and influenced by the nearly the same climate and rainfall patterns.

6. Summary and Conclusions

Ground observations are essential for studying the impact of climate change, as well for hydrological studies at regional and local level. In many countries, such as Yemen, long-term observations are very short, and in most cases there is a large gap in ground data due to discontinuous collection of data and poor documentation by local agencies. However, we note some administration factors affecting data collection in Yemen, such as the replacement of the chairman at the top of the authority, and the low budget allocated for maintenance and operation of meteorological stations. Furthermore, data collected in Yemen are not available for public use due to data sharing policy and fees imposed by local agencies like the meteorological service and National Water Resources Authority (NWRA).
This study presents the first attempt to evaluate rainfall estimates by different precipitation products against the available station data on the highland region of Yemen. Comparison between the products and observations was performed at daily, monthly, and annual timescales by commonly used statistical and categorical analysis, such as correlation coefficient, root-mean-square error, bias, deviation, probability of detection, false alarm ratio, and frequent occurrence of wet days. At a daily timescale, CHIRPS, followed by TRMM 3B42, provides a better agreement with the occurrence of wet days compared to CFSR, PERSIANN-CDR, and ERA-5. CFSR and PERSIANN-CDR showed a larger overestimation of wet events, while ERA-5 gave a lower estimation of daily rainfall events. Compared to CHIRPS and TRMM 3B42, CFSR, PERSIANN-CDR, ERA-5, and CPC showed lower correlation at monthly scale with higher bias and errors. In addition, maps presenting annual rainfall show the high performance of CHIRPS in producing and matching rainfall patterns over the study area.
Overall, CHIRPS, with its high spatial resolution (0.05), shows the highest performance with observations at all timescales and in all stations. Since CHIRPS is available at a daily timescale and for longer periods, and shows lower bias and error, this product can be used for climate studies such as regional downscaling and as input for hydrological models in regions with sparse ground stations and limited data, such as the highlands of Yemen.

Author Contributions

A.H.A.-F., C.B., and U.S. developed the concept of this work, the methodology, and the overall analysis, with the support of S.H.G. and N.S., A.H.A.-F. drafted the manuscript with further assistance from C.B., U.S., S.H.G., and N.S. All authors have read and agreed to the published version of the manuscript.

Funding

This research received no external funding.

Acknowledgments

The authors would like to thank the following organizations: NASA, University of California, NOAA, and ECMWF for providing access to precipitation products utilized by this research. Thanks to the National Water Resources Authority (NWRA) in Yemen for providing the ground data. The author (Ali Hamoud AL-Falahi) acknowledges all scientific supports from the Institute of Hydrology and Meteorology, Chair of Meteorology, Professor Christian Bernhofer, at the Technische Universität Dresden, Germany, and the German Academic Exchange Service (DAAD) for providing the financial support for the PhD study.

Conflicts of Interest

The authors declare no conflict of interests.

References

  1. Ward, A.; Ismail, W.R. Precipitation Analysis and Water Resource of Wadi Siham Basin, Yemen. Geografi 2020, 7, 36–63. [Google Scholar]
  2. Mohamed, H.; Elayah, M.; Schuplen, L. Yemen between the Impact of the Climate Change and the Ongoing Saudi-Yemen War: A Real Tragedy; An Analytical Report; Centre For Governance and Peace-building-Yemen: Sanaa, Yemen; Centre for International Development Issues: Nijmegen, The Netherlands, 2017. [Google Scholar]
  3. Wilby, R.; Yu, D. Mapping Climate Change Impacts on Smallholder Agriculture in Yemen Using GIS Modeling Approaches; Technical Report; International Fund for Agricultural Development (IFAD): Rome, Italy, 2013. [Google Scholar]
  4. Al-Hawshabi, O.; El-Naggar, S. Vegetation patterns and floristic composition of Yemen. Curr. Life Sci. 2015, 1, 103–111. [Google Scholar]
  5. Haidera, M.; Alhakimi, S.A.; Noaman, A.; Al Kebsi, A.; Noaman, A.; Fencl, A.; Dougherty, B.; Swartz, C. Water scarcity and climate change adaptation for Yemen’s vulnerable communities. Local Environ. 2011, 16, 473–488. [Google Scholar] [CrossRef]
  6. Bush, R. Family Farming in the Near East and North Africa; Working Paper; University of Leeds: Leeds, UK, 2016; p. 32. ISSN 1812-108x. [Google Scholar]
  7. Wilby, R.L.; Troni, J.; Biot, Y.; Tedd, L.; Hewitson, B.; Smith, D.M.; Sutton, R. A review of climate risk information for adaptation and development planning. Int. J. Clim. 2009, 29, 1193–1215. [Google Scholar] [CrossRef]
  8. El Kenawy, A.M.; McCabe, M.F. A multi-decadal assessment of the performance of gauge- and model-based rainfall products over Saudi Arabia: Climatology, anomalies and trends. Int. J. Clim. 2015, 36, 656–674. [Google Scholar] [CrossRef] [Green Version]
  9. Wilby, R.L.; Yu, D. Rainfall and temperature estimation for a data sparse region. Hydrol. Earth Syst. Sci. 2013, 17, 3937–3955. [Google Scholar] [CrossRef] [Green Version]
  10. Ajl, M. Yemen’s Agricultural World: Crisis and Prospects. In Crisis and Conflict in Agriculture; CABI: Wallingford, UK, 2018; pp. 131–142. ISBN 978-1-78639-364-7. [Google Scholar]
  11. Muharram, I.; Alsharjabi, K. Sustainable Agriculture, Food Security and the Role of Agricultural Research and Technology Transfer in Yemen. Syr. J. Agric. Res. 2019, 6, 441–462. [Google Scholar]
  12. Fayyad, M.; Sandri, S.; Weiter, M.; Zikos, D. Social Water Studies in the Arab Region; State of the Art and Perspectives; Fayyad, M., Sandri, S., Weiter, M., Zikos, D., Eds.; Humboldt-Universität zu Berlin: Berlin, Germany, 2015; ISBN 3-936602-74-3. [Google Scholar]
  13. Gebrechorkos, S.H.; Hülsmann, S.; Bernhofer, C. Evaluation of multiple climate data sources for managing environmental resources in East Africa. Hydrol. Earth Syst. Sci. 2018, 22, 4547–4564. [Google Scholar] [CrossRef] [Green Version]
  14. Nashwan, M.S.; Shahid, S.; Wang, X. Assessment of Satellite-Based Precipitation Measurement Products over the Hot Desert Climate of Egypt. Remote. Sens. 2019, 11, 555. [Google Scholar] [CrossRef] [Green Version]
  15. Saeidizand, R.; Sabetghadam, S.; Tarnavsky, E.; Pierleoni, A. Evaluation of CHIRPS rainfall estimates over Iran. Q. J. R. Meteorol. Soc. 2018, 144, 282–291. [Google Scholar] [CrossRef] [Green Version]
  16. Li, D.; Christakos, G.; Ding, X.; Wu, J. Adequacy of TRMM satellite rainfall data in driving the SWAT modeling of Tiaoxi catchment (Taihu lake basin, China). J. Hydrol. 2018, 556, 1139–1152. [Google Scholar] [CrossRef]
  17. Fang, J.; Yang, W.; Luan, Y.; Du, J.; Lin, A.; Zhao, L. Evaluation of the TRMM 3B42 and GPM IMERG products for extreme precipitation analysis over China. Atmos. Res. 2019, 223, 24–38. [Google Scholar] [CrossRef]
  18. Khan, A.J.; Koch, M.; Chinchilla, K.M. Evaluation of Gridded Multi-Satellite Precipitation Estimation (TRMM-3B42-V7) Performance in the Upper Indus Basin (UIB). Climate 2018, 6, 76. [Google Scholar] [CrossRef] [Green Version]
  19. Ashouri, H.; Hsu, K.L.; Sorooshian, S.; Braithwaite, D.K.; Knapp, K.R.; Cecil, L.D.; Nelson, B.; Prat, O.P. PERSIANN-CDR: Daily Precipitation Climate Data Record from Multisatellite Observations for Hydrological and Climate Studies. Bull. Am. Meteorol. Soc. 2015, 96, 69–83. [Google Scholar] [CrossRef] [Green Version]
  20. Bâ, K.M.; Balcázar, L.; Diaz, V.; Ortiz, F.; Gómez-Albores, M.A.; Díaz-Delgado, C. Hydrological Evaluation of PERSIANN-CDR Rainfall over Upper Senegal River and Bani River Basins. Remote. Sens. 2018, 10, 1884. [Google Scholar] [CrossRef] [Green Version]
  21. Irvem, A.; Ozbuldu, M. Evaluation of Satellite and Reanalysis Precipitation Products Using GIS for All Basins in Turkey. Adv. Meteorol. 2019, 2019, 1–11. [Google Scholar] [CrossRef] [Green Version]
  22. Nkiaka, E.; Nawaz, N.R.; Lovett, J.C. Evaluating global reanalysis precipitation datasets with rain gauge measurements in the Sudano-Sahel region: Case study of the Logone catchment, Lake Chad Basin. Meteorol. Appl. 2016, 24, 9–18. [Google Scholar] [CrossRef]
  23. Tarek, M.; Brissette, F.P.; Arsenault, R. Evaluation of the ERA5 reanalysis as a potential reference dataset for hydrological modelling over North America. Hydrol. Earth Syst. Sci. 2020, 24, 2527–2544. [Google Scholar] [CrossRef]
  24. Dinku, T.; Connor, S.J.; Ceccato, P.; Ropelewski, C.F. Comparison of global gridded precipitation products over a mountainous region of Africa. Int. J. Clim. 2008, 28, 1627–1638. [Google Scholar] [CrossRef]
  25. Haile, A.T.; Rientjes, T.H.; Habib, E. Evaluation of the climate prediction center (CPC) morphing technique (CMORPH) rainfall product on hourly time scales over the source of the Blue Nile River. Hydrol. Process. 2012, 27, 1829–1839. [Google Scholar] [CrossRef]
  26. Wilby, R.L.; Dawson, C.; Barrow, E. SDSM—A decision support tool for the assessment of regional climate change impacts. Environ. Model. Softw. 2002, 17, 145–157. [Google Scholar] [CrossRef]
  27. Almas, A.A.M.; Scholz, M. Agriculture and Water Resources Crisis in Yemen: Need for Sustainable Agriculture. J. Sustain. Agric. 2006, 28, 55–75. [Google Scholar] [CrossRef]
  28. Moustafa, A.T.; Mukred, A.W. Protected Agriculture Earns More Income from less water for terrace farmers in Yemen. Caravan, 16 June 2002. [Google Scholar]
  29. Varisco, D.M. The future of terrace farming in Yemen: A development dilemma. Agric. Hum. Values 1991, 8, 166–172. [Google Scholar] [CrossRef]
  30. Farquharson, F.A.K.; Plinston, D.T.; Sutcliffe, J.V. Rainfall and runoff in Yemen. Hydrol. Sci. J. 1996, 41, 797–811. [Google Scholar] [CrossRef]
  31. Almhab, A. Validationof estimated TRMM Rainfall data by rain gauges in Yemen; Conference paper. In Proceedings of the 31st Asian Conference on Remote Sensing (ACRS), Hanoi, Vietnam, 1–5 November 2010; pp. 1–16. [Google Scholar]
  32. Van der Gun, J.; Ahmed, A.A. Average annual rainfall Yemen 1985–1991. In The Water Resources of Yemen: A Summary and Digest of Available Information; Technical Report; Ministry of Oil and Mineral Resources: Sanaa, Yemen, 1995. [Google Scholar]
  33. Rappold, G.D. Precipitation analysis and agricultural water availability in the Southern Highlands of Yemen. Hydrol. Process. 2005, 19, 2437–2449. [Google Scholar] [CrossRef]
  34. Gella, G.W. Statistical evaluation of High Resolution satellite precipitation products in arid and semi-arid parts of Ethiopia: A note for hydro-meteorological applications. Water Environ. J. 2018, 33, 86–97. [Google Scholar] [CrossRef]
  35. Moazami, S.; Abdollahipour, A.; Zakeri Niri, M.; Ashrafi, S.M. Hydrological assessment of daily satellite precipitation products over a basin in Iran. J. Hydraul. Struct. 2016, 2, 35–45. [Google Scholar] [CrossRef]
  36. Almazroui, M.; Islam, M.N.; Jones, P.D.; Athar, H.; Rahman, M.A. Recent climate change in the Arabian Peninsula: Seasonal rainfall and temperature climatology of Saudi Arabia for 1979–2009. Atmospheric Res. 2012, 111, 29–45. [Google Scholar] [CrossRef]
  37. Skofronick-Jackson, G.; Petersen, W.A.; Berg, W.; Kidd, C.; Stocker, E.F.; Kirschbaum, D.; Kakar, R.; Braun, S.A.; Huffman, G.J.; Iguchi, T.; et al. The Global Precipitation Measurement (GPM) Mission for Science and Society. Bull. Am. Meteorol. Soc. 2017, 98, 1679–1695. [Google Scholar] [CrossRef]
  38. Kummerow, C.; Barnes, W.; Kozu, T.; Shiue, J.; Simpson, J. The Tropical Rainfall Measuring Mission (TRMM) sensor package. J. Atmos. Ocean. Technol. 1998, 15, 809–817. [Google Scholar] [CrossRef]
  39. Huffman, G.J.; Bolvin, D.T.; Nelkin, E.J.; Wolff, D.B.; Adler, R.F.; Gu, G.; Hong, Y.; Bowman, K.P.; Stocker, E.F. The TRMM Multisatellite Precipitation Analysis (TMPA): Quasi-Global, Multiyear, Combined-Sensor Precipitation Estimates at Fine Scales. J. Hydrometeorol. 2007, 8, 38–55. [Google Scholar] [CrossRef]
  40. Bajracharya, S.R.; Palash, W.; Shrestha, M.S.; Khadgi, V.R.; Duo, C.; Das, P.J.; Dorji, C. Systematic Evaluation of Satellite-Based Rainfall Products over the Brahmaputra Basin for Hydrological Applications. Adv. Meteorol. 2015, 2015, 1–17. [Google Scholar] [CrossRef]
  41. Sun, S.; Zhou, S.; Shen, H.; Chai, R.; Chen, H.S.; Liu, Y.; Shi, W.; Wang, J.; Wang, G.; Zhou, Y.; et al. Dissecting Performances of PERSIANN-CDR Precipitation Product over Huai River Basin, China. Remote. Sens. 2019, 11, 1805. [Google Scholar] [CrossRef] [Green Version]
  42. Chen, M.; Shi, W.; Xie, P.; Silva, V.B.S.; Kousky, V.E.; Higgins, R.W.; Janowiak, J.E. Assessing objective techniques for gauge-based analyses of global daily precipitation. J. Geophys. Res. Space Phys. 2008, 113, 4110. [Google Scholar] [CrossRef]
  43. Roth, V.; Lemann, T. Comparing CFSR and conventional weather data for discharge and soil loss modelling with SWAT in small catchments in the Ethiopian Highlands. Hydrol. Earth Syst. Sci. 2016, 20, 921–934. [Google Scholar] [CrossRef] [Green Version]
  44. Saha, S.; Moorthi, S.; Pan, H.L.; Wu, X.; Wang, J.; Nadiga, S.; Tripp, P.; Kistler, R.; Woollen, J.; Behringer, D.; et al. The NCEP Climate Forecast System Reanalysis. Bull. Am. Meteorol. Soc. 2010, 91, 1015–1058. [Google Scholar] [CrossRef]
  45. Kistler, R. The NCEP Climate Forecast System Reanalysis (Invited). In Proceedings of the AGU Fall Meeting, San Francisco, CA, USA, 13–17 December 2010. [Google Scholar]
  46. Lindsay, R.; Wensnahan, M.; Schweiger, A.; Zhang, J. Evaluation of Seven Different Atmospheric Reanalysis Products in the Arctic. J. Clim. 2014, 27, 2588–2606. [Google Scholar] [CrossRef] [Green Version]
  47. Albergel, C.; Dutra, E.; Munier, S.; Calvet, J.C.; Muñoz Sabater, J.; Rosnay, P.; Balsamo, G. ERA-5 and ERA-Interim driven ISBA land surface model simulations: Which one performs better? Hydrol. Earth Sys. Sci. 2018. [Google Scholar] [CrossRef] [Green Version]
  48. Martens, B.; Schumacher, D.L.; Wouters, H.; Muñoz-Sabater, J.; Verhoest, N.E.C.; Miralles, D.G. Evaluating the surface energy partitioning in ERA5. Geosci. Model Dev. 2020. [Google Scholar] [CrossRef]
  49. Olauson, J. ERA5: The new champion of wind power modelling? Renew. Energy 2018, 126, 322–331. [Google Scholar] [CrossRef] [Green Version]
  50. Decker, M.; Brunke, M.A.; Wang, Z.; Sakaguchi, K.; Zeng, X.; Bosilovich, M.G. Evaluation of the Reanalysis Products from GSFC, NCEP, and ECMWF Using Flux Tower Observations. J. Clim. 2012, 25, 1916–1944. [Google Scholar] [CrossRef]
  51. Wang, G.; Zhang, P.; Liang, L.; Zhang, S. Evaluation of precipitation from CMORPH, GPCP-2, TRMM 3B43, GPCC, and ITPCAS with ground-based measurements in the Qinling-Daba Mountains, China. PLoS ONE 2017, 12, e0185147. [Google Scholar] [CrossRef] [PubMed] [Green Version]
  52. Yin, X.; Gruber, A.; Arkin, P.A. Comparison of the GPCP and CMAP Merged Gauge–Satellite Monthly Precipitation Products for the Period 1979–2001. J. Hydrometeorol. 2004, 5, 1207–1222. [Google Scholar] [CrossRef]
  53. Xie, P.; Chen, M.; Yang, S.; Yatagai, A.; Hayasaka, T.; Fukushima, Y.; Liu, C. A Gauge-Based Analysis of Daily Precipitation over East Asia. J. Hydrometeorol. 2007, 8, 607–626. [Google Scholar] [CrossRef]
  54. Huffman, G.; Adler, R.; Arkin, P.; Chang, A.; Ferraro, R.; Gruber, A.; Janowiak, J.; McNab, A.; Rudolf, B.; Schneider, U. The Global Precipitation Climatology Project (GPCP) Combined Precipitation Dataset. Bull. Am. Meteorol. Soc. 1997, 78. [Google Scholar] [CrossRef]
  55. Funk, C.; Peterson, P.; Landsfeld, M.; Pedreros, D.; Verdin, J.; Shukla, S.; Husak, G.; Rowland, J.; Harrison, L.; Hoell, A.; et al. The climate hazards infrared precipitation with stations—A new environmental record for monitoring extremes. Sci. Data 2015, 2, 150066. [Google Scholar] [CrossRef] [Green Version]
  56. Dinku, T.; Funk, C.; Peterson, P.; Maidment, R.; Tadesse, T.; Gadain, H.; Ceccato, P. Validation of the CHIRPS satellite rainfall estimates over eastern Africa. Q. J. R. Meteorol. Soc. 2018, 144, 292–312. [Google Scholar] [CrossRef] [Green Version]
  57. Shrestha, N.K.; Qamer, F.M.; Pedreros, D.; Murthy, M.S.R.; Wahid, S.M.; Shrestha, M. Evaluating the accuracy of Climate Hazard Group (CHG) satellite rainfall estimates for precipitation based drought monitoring in Koshi basin, Nepal. J. Hydrol. Reg. Stud. 2017, 13, 138–151. [Google Scholar] [CrossRef]
  58. Cattani, E.; Merino, A.; Guijarro, J.A.; Levizzani, V. East Africa Rainfall Trends and Variability 1983–2015 using Three Long-Term Satellite Products. Remote. Sens. 2018, 10, 931. [Google Scholar] [CrossRef] [Green Version]
  59. Mu, X.; Zhang, X.Q.; Peng, G.; Wang, F. Theory of double mass curves and its applications in hydrology and meteorology. J. China Hydrol. 2010, 30, 47–51. [Google Scholar]
  60. Schober, P.; Boer, C.; Schwarte, L.A. Correlation Coefficients. Anesthesia Analg. 2018, 126, 1763–1768. [Google Scholar] [CrossRef]
  61. Manikandan, S. Measures of central tendency: The mean. J. Pharmacol. Pharmacother. 2011, 2, 140–142. [Google Scholar] [CrossRef] [Green Version]
  62. Chen, Z.; Yang, Y. Assessing Forecast Accuracy Measures; Department of Statistics & Statistical Laboratory, Iowa State University: Ames, IA, USA, 2004. [Google Scholar]
  63. Bharti, V.; Singh, C. Evaluation of error in TRMM 3B42V7 precipitation estimates over the Himalayan region. J. Geophys. Res. Atmos. 2015, 120, 12458–12473. [Google Scholar] [CrossRef]
  64. Sharifi, E.; Steinacker, R.; Saghafian, B. Assessment of GPM-IMERG and Other Precipitation Products against Gauge Data under Different Topographic and Climatic Conditions in Iran: Preliminary Results. Remote. Sens. 2016, 8, 135. [Google Scholar] [CrossRef] [Green Version]
  65. Paredes-Trejo, F.J.; Barbosa, H.; Spatafora, L.R. Assessment of SM2RAIN-Derived and State-of-the-Art Satellite Rainfall Products over Northeastern Brazil. Remote. Sens. 2018, 10, 1093. [Google Scholar] [CrossRef] [Green Version]
  66. Wilks, D.S. Statistical Methods in the Atmospheric Sciences, 3rd ed.; International Geophysics Series; Elsevier: Amsterdam, The Netherlands, 2011. [Google Scholar]
  67. Hu, Z.; Chen, X.; Zhou, Q.; Chen, D.; Li, J. DISO: A rethink of Taylor diagram. Int. J. Clim. 2019, 39, 2825–2832. [Google Scholar] [CrossRef]
  68. Mayor, Y.G.; Tereshchenko, I.; Fonseca-HernandeziD, M.; Pantoja, D.A.; Montes, J.M. Evaluation of Error in IMERG Precipitation Estimates under Different Topographic Conditions and Temporal Scales over Mexico. Remote. Sens. 2017, 9, 503. [Google Scholar] [CrossRef] [Green Version]
  69. Breisinger, C.; Ecker, O.; Al-Riffai, P.; Robertson, R.; Thiele, R. Climate Change, Agricultural Production and Food Security: Evidence from Yemen; Working paper; Kiel Institute for the World Economy: Washington, DC, USA, 2011; Volume 1747. [Google Scholar]
  70. Bucchignani, E.; Mercogliano, P.; Panitz, H.J.; Montesarchio, M. Climate change projections for the Middle East–North Africa domain with COSMO-CLM at different spatial resolutions. Adv. Clim. Chang. Res. 2018, 9, 66–80. [Google Scholar] [CrossRef]
  71. Stampoulis, D.; Anagnostou, E.N.; Nikolopoulos, E. Assessment of High-Resolution Satellite-Based Rainfall Estimates over the Mediterranean during Heavy Precipitation Events. J. Hydrometeorol. 2013, 14, 1500–1514. [Google Scholar] [CrossRef]
  72. Gampe, D.; Ludwig, R. Evaluation of Gridded Precipitation Data Products for Hydrological Applications in Complex Topography. Hydrology 2017, 4, 53. [Google Scholar] [CrossRef] [Green Version]
  73. Kimani, M.; Hoedjes, J.; Su, Z. An Assessment of Satellite-Derived Rainfall Products Relative to Ground Observations over East Africa. Remote. Sens. 2017, 9, 430. [Google Scholar] [CrossRef] [Green Version]
  74. Sharifi, E.; Eitzinger, J.; Dorigo, W. Performance of the State-Of-The-Art Gridded Precipitation Products over Mountainous Terrain: A Regional Study over Austria. Remote. Sens. 2019, 11, 2018. [Google Scholar] [CrossRef] [Green Version]
  75. Vernimmen, R.; Hooijer, A.; Aldrian, E.; Van Dijk, A.I.J.M. Mamenun Evaluation and bias correction of satellite rainfall data for drought monitoring in Indonesia. Hydrol. Earth Syst. Sci. 2012, 16, 133–146. [Google Scholar] [CrossRef] [Green Version]
  76. Almazroui, M.; Tayeb, O.; Mashat, A.S.; Yousef, A.; Al-Turki, Y.A.; Abid, M.A.; Bafail, A.O.; Ehsan, M.A.; Zahed, A.; Rahman, M.A.; et al. Saudi-KAU Coupled Global Climate Model: Description and Performance. Earth Syst. Environ. 2017, 1, 7. [Google Scholar] [CrossRef] [Green Version]
  77. Blacutt, L.; Herdies, D.L.; De Goncalves, L.G.G.; Vila, D.A.; Andrade, M. Precipitation comparison for the CFSR, MERRA, TRMM3B42 and Combined Scheme datasets in Bolivia. Atmospheric Res. 2015, 163, 117–131. [Google Scholar] [CrossRef] [Green Version]
  78. Katiraie-Boroujerdy, P.-S.; Ashouri, H.; Hsu, K.-L.; Sorooshian, S. Trends of precipitation extreme indices over a subtropical semi-arid area using PERSIANN-CDR. Theor. Appl. Clim. 2016, 130, 249–260. [Google Scholar] [CrossRef] [Green Version]
  79. Sun, Q.; Miao, C.; Duan, Q.; Ashouri, H.; Sorooshian, S.; Hsu, K.-L. A Review of Global Precipitation Data Sets: Data Sources, Estimation, and Intercomparisons. Rev. Geophys. 2018, 56, 79–107. [Google Scholar] [CrossRef] [Green Version]
  80. Ward, E.; Buytaert, W.; Peaver, L.; Wheater, H. Evaluation of precipitation products over complex mountainous terrain: A water resources perspective. Adv. Water Resour. 2011, 34, 1222–1231. [Google Scholar] [CrossRef]
  81. Shen, Y.; Xiong, A. Validation and comparison of a new gauge-based precipitation analysis over mainland China. Int. J. Clim. 2015, 36, 252–265. [Google Scholar] [CrossRef]
  82. Bosilovich, M.G.; Chen, J.; Robertson, F.R.; Adler, R.F. Evaluation of Global Precipitation in Reanalyses. J. Appl. Meteorol. Clim. 2008, 47, 2279–2299. [Google Scholar] [CrossRef]
  83. Hu, Z.; Zhou, Q.; Chen, X.; Li, J.; Li, Q.; Chen, D.; Liu, W.; Yin, G. Evaluation of three global gridded precipitation data sets in central Asia based on rain gauge observations. Int. J. Clim. 2018, 38, 3475–3493. [Google Scholar] [CrossRef]
  84. Li, W.; Sun, W.; He, X.; Scaioni, M.; Yao, D.; Chen, Y.; Gao, J.; Li, X.; Cheng, G. Improving CHIRPS Daily Satellite-Precipitation Products Using Coarser Ground Observations. IEEE Geosci. Remote. Sens. Lett. 2019, 16, 1678–1682. [Google Scholar] [CrossRef]
  85. Pricope, N.G.; Husak, G.; Lopez-Carr, D.; Funk, C.; Michaelsen, J. The climate-population nexus in the East African Horn: Emerging degradation trends in rangeland and pastoral livelihood zones. Glob. Environ. Chang. 2013, 23, 1525–1541. [Google Scholar] [CrossRef]
  86. Gebrechorkos, S.H.; Hülsmann, S.; Bernhofer, C. Long-term trends in rainfall and temperature using high-resolution climate datasets in East Africa. Sci. Rep. 2019, 9, 11376. [Google Scholar] [CrossRef] [Green Version]
  87. Gebrechorkos, S.H.; Hülsmann, S.; Bernhofer, C. Regional climate projections for impact assessment studies in East Africa. Environ. Res. Lett. 2019, 14, 044031. [Google Scholar] [CrossRef]
  88. Gebrechorkos, S.H.; Hülsmann, S.; Bernhofer, C. Statistically downscaled climate dataset for East Africa. Sci. Data 2019, 6, 31. [Google Scholar] [CrossRef] [Green Version]
  89. Gebrechorkos, S.H.; Bernhofer, C.; Hülsmann, S. Climate change impact assessment on the hydrology of a large river basin in Ethiopia using a local-scale climate modelling approach. Sci. Total. Environ. 2020, 742, 140504. [Google Scholar] [CrossRef]
  90. Ayehu, G.; Tadesse, T.; Gessesse, B.; Dinku, T. Validation of new satellite rainfall products over the Upper Blue Nile Basin, Ethiopia. Atmos. Meas. Tech. 2018, 11, 1921–1936. [Google Scholar] [CrossRef] [Green Version]
  91. Rivera, J.A.; Hinrichs, S.; Marianetti, G. Using CHIRPS Dataset to Assess Wet and Dry Conditions along the Semiarid Central-Western Argentina. Adv. Meteorol. 2019, 2019, 1–18. [Google Scholar] [CrossRef] [Green Version]
Figure 1. Location of the study area (Al Mahwit) in the Yemeni map displaying topography and the meteorological stations.
Remotesensing 12 02984 g001
Figure 2. Histogram of wet days in Al Mahwit over the period 1998–2007 by the gridded precipitation products and observations. Each histogram represents one location: Kokaban, Mahwit city, Al Rojom, Al Khamees, and Al Khabt area.
Remotesensing 12 02984 g002
Figure 3. Summary of monthly correlation coefficient (r), root-mean-square error (RMSE, mm), and bias (BIAS, mm) of the precipitation products compared to observations in the five areas from Al Mahwit governorate: Khabt, Khamees, Kokaban, Mahwit city, and Rojom.
Remotesensing 12 02984 g003
Figure 4. Taylor diagram showing the agreement between ground monthly observations and precipitation products over the five stations covering the period of 1998–2007.
Remotesensing 12 02984 g004aRemotesensing 12 02984 g004b
Figure 5. Monthly peak rainfall events captured by the gridded products and observations for the period 1998–2007.
Remotesensing 12 02984 g005
Figure 6. Rainfall map of the study area based on ground station data showing the average annual rates during the period 1998–2007.
Remotesensing 12 02984 g006
Figure 7. Maps displaying the average annual rainfall during 1998–2007 by the different precipitation products. The legend was not homogenized to improve the presentation of the different products, given that some datasets show very low estimates compared to ground observations.
Remotesensing 12 02984 g007
Table 1. A list of meteorological stations used for comparison with precipitation products.
StationLat. (deg.)Lon. (deg.)Elevation (m)Av. Annual Rainfall (mm)Available Period and Timescale
Kokaban15.50 N43.89 E2562335.11998–2007 (Daily)
Al Rojom15.45 N43.63 E1943392.21998–2007 (Daily)
Mahwit city15.47 N43.54 E22124101998–2007 (Daily)
Al Khamees15.26 N43.51 E3632191998–2007 (Daily)
Al Khabt15.46 N43.40 E4822541998–2007 (Daily)
Khamula15.42 N43.64 E12804181998–2002 (Monthly)
Shamat15.41 N43.57 E396354.11998–2002 (Monthly)
Zuhaf15.11 N43.49 E3202531998–2002 (Monthly)
Adiat15.25 N43.41 E700317.51998–2002 (Monthly)
Ghamr15.36 N43.34 E2802201998–2002 (Monthly)
Table 2. General characteristics of the precipitation products.
ProductGrid SizeTime ResolutionTime PeriodTypeSource
ObservationsPoint basedDaily1998–2007GaugeNational Water Resources Authority–NWRA
TRMM 3B420.25° × 0.25°Daily1998–presentSatelliteNASA–giovanni.gsfc.nasa.gov (EARTH DATA)
PERSIANN-CDR0.25° × 0.25°Daily1983–presentSatelliteUniversity of California, Irvine
CFSR0.25° × 0.25°Daily1979–2010ReanalysisNational Centers for Environmental Prediction NCEP
ERA-50.25 × 0.25° Hourly/Daily1979–presentReanalysisEuropean Centre for Medium-Range Weather Forecasts (ECMWF)
CPC0.5° × 0.5° Monthly1979–presentGauge basedClimate prediction center
CHIRPS0.05° × 0.05°Daily1981–presentGauge and satellite basedUniversity of California
Table 3. Contingency table of rainfall possible events.
Observed ≥ Threshold Observed < Threshold
YesNo
Product ≥ threshold HitsFalse alarms
Product < thresholdMissesCorrect negatives
Table 4. Summary of daily average results of the precipitation products in the study area.
ObservationsCHIRPSTRMM 3B42PERSIANN-CDRCFSRERA-5
Mean7.744.63.823.026.792.74
Std. deviation9.465.25.13.527.893.9
Skewness2.92.74.04.142.543.42
Max. (mm)61.736.0841.454762.825.93
Number of wet days (day)529590713107498099.8
Deviation from wet days (%) 11.5334.710385.3−81.13
The highest correlated results are shown in bold.
Table 5. Summary of categorical statistics of the Al Mahwit stations.
CHIRPSCFSRTRMM 3B42PERSIANN-CDRERA-5
StationPODFARPODFARPODFARPODFARPODFAR
Al Rojom0.780.210.390.690.670.810.880.70.150.67
Al Khabt0.680.310.430.770.490.710.710.750.010.78
Kokaban0.840.550.710.920.710.890.850.910.20.88
Mahwit city0.710.510.390.70.240.670.650.720.110.66
Al Khamees0.820.210.490.770.510.460.480.310.020.81
Average0.770.360.480.770.520.710.710.680.090.76
Table 6. Summary of statistical monthly average result over the study area.
Statistical EstimatorsCHIRPSTRMM 3B42PERSIANN-CDRCFSRERA-5CPC
Correlation Coefficient (CC)0.780.560.530.510.200.15
RMSE (mm)25.5435.4934.1860.4245.7445.53
Bias (mm)−2.9−5.257.3516.68−24.96−25.29
Table 7. Performance of CHIRPS with observed monthly rainfall rates from 14 stations over the highland region of Al Mahwit and Sana’a governorate.
StationsLongitude (E)Latitude (N)AltitudeStatistical Estimators
CCBias (mm)RMSE (mm)
Al Haimah43.9015.081600 m0.970.856.08
Assalf43.9315.222920 m0.93−10.5722.02
Mayan43.89515.4562250 m0.894.9621.29
Qadam43.62215.118924 m0.88−10.0549.33
Manakah43.74115.0712280 m0.82−12.626.96
Astan44.32015.7692350 m0.79−14.4632.46
Dayan43.71115.269880 m0.92−20.0232.58
BirBasl44.47515.6412090 m0.81−14.8832.32
Al Amir43.7015.032200 m0.66−62.2993.92
Adiat43.29315.428700 m0.70−36.5383.21
Shamat43.55115.348396 m0.88−11.3428.53
Zuhaf43.41115.301320 m0.69−45.9060.10
Ghamr43.49615.140280 m0.65−14.1530.71
Khamula43.71015.3471280 m0.94−26.8842.10
Average0.822.90540.11
Table 8. Summary of the annual average of rainfall rates (mm) by the different products.
StationObservationsCHIRPSTRMM 3B42PERSIANN-CDRCFSRERA-5CPC
Mahwit city410349.3363.8441.9448.529.333.8
Al Rojom392.2356.9396.8476.3559.629.539.8
Kokaban335.1348.8483.3526.2937.255.843.4
Al Khamees219.2213209.3187.8273.829.530.1
Al Khabt 254201373.1362.2442.926.333.5
Total16101469182619942662170.4180.6
Average322.1293.8365.3398.9532.434.136.12
Pbias (%) −8.6815.3022.9066.21−88.97−88.35
Table 9. Overall summary of the statistical result of the precipitation products.
Statistical EstimatorsObservationsCHIRPSTRMM 3B42PERSIANN-CDRCFSRERA-5CPC
Number of wet events (day)529590713107498099.8-
Deviation from wet events (%)-11.5334.710385.3−81.13-
POD (day)-0.740.360.590.360.046-
FAR (day)-0.350.670.620.770.81-
CC (monthly) -0.780.560.530.510.200.15
RMSE (mm/month)-25.5435.4934.1860.4245.7445.53
Bias (mm/month)-−2.9−5.257.3516.68−24.96−25.3
Annual average rates (mm)322.1293.8365.3398.9532.434.136.12
Pbias of annual rainfall (%)-−8.6815.3022.9066.21−88.97−88.4
Table 10. Summary of previous studies findings on CHIRPS performance in areas similar to Yemen’s condition.
Statistical IndicesEast AfricaIranEthiopiaEgyptArgentina
CC (monthly)0.70.550.810.590.8
RMSE (mm/month)3.080.7628.450.190.55
Bias (mm/month)− 0.590.80.960.620.4
Pbias (%)− 12.0
Deviation from wet days (%)− 0.17
POD (day)0.990.22
FAR (day)0.220.120.88

