Initial User-Centered Design of a Virtual Reality Heritage System: Applications for Digital Tourism


1
Department of Geography, Faculty of Sciences, Geomatics Unit University of Liège, 4000 Liège, Belgium
2
Visual Computing Institute, RWTH Aachen University, 52062 Aachen, Germany
*
Author to whom correspondence should be addressed.
Remote Sens. 2020, 12(16), 2583; https://doi.org/10.3390/rs12162583
Submission received: 3 July 2020
/
Revised: 30 July 2020
/
Accepted: 6 August 2020
/
Published: 11 August 2020
(This article belongs to the Special Issue 3D Virtual Reconstruction for Cultural Heritage)
Abstract
:Reality capture allows for the reconstruction, with a high accuracy, of the physical reality of cultural heritage sites. Obtained 3D models are often used for various applications such as promotional content creation, virtual tours, and immersive experiences. In this paper, we study new ways to interact with these high-quality 3D reconstructions in a real-world scenario. We propose a user-centric product design to create a virtual reality (VR) application specifically intended for multi-modal purposes. It is applied to the castle of Jehay (Belgium), which is under renovation, to permit multi-user digital immersive experiences. The article proposes a high-level view of multi-disciplinary processes, from a needs analysis to the 3D reality capture workflow and the creation of a VR environment incorporated into an immersive application. We provide several relevant VR parameters for the scene optimization, the locomotion system, and the multi-user environment definition that were tested in a heritage tourism context.
1. Introduction
Reality capture allows for the preservation of cultural heritage information through 3D models, studies, analysis, and visualizations. However, the potential of these digital assets is often not fully realized if they are not used to interactively communicate their significance to experts and non-specialists alike. Virtual reality (VR) interfaces spatial data such as 3D point clouds or 3D models, and allows users to experience VR in an immersive way. It favors interaction and helps make culture potentially more accessible to users with different perspectives. This highlights a flexibility requirement for any VR heritage system to adapt cultural proposals and information about objects based on different types of user categories.
Creating a digital replica for such a multi-modal usage demands to first survey in high detail the location while gathering relevant contextual information to create realistic experiences. This is primarily achieved using various 3D capture technologies combined with state-of-the-art mapping algorithms that depict physical environments through a large variety of 3D digital assets (e.g., [1,2,3] for tourism purposes). These are then reworked to populate various immersive experiences, such as virtual reality and augmented reality (AR) experiments [4,5]. However, AR and VR taken as “one-shot” products are often non-integrated realizations meeting limited objectives. Moreover, different worlds with different perspectives (e.g., geoinformation vs. cultural heritage vs. computer graphics) diminish the flexibility of a system if no balanced approach is mapped to the development of the immersive application. The main problem in such scenarios is linked to the sustainability of the solution. This is due to a lack of adaptability to changing needs and technological developments.
As the number of projects using reality capture technologies and immersive technologies grows, clear guidelines and use case insights for conducting applied research projects are valuable. This is why our study proposes modular and high-level concepts that can be extended to undertake similar projects. We have been working in this area for some time, leading to the Terra Mosana Interreg EMR project,+ to merge perspectives and work on transversal solutions to these challenges.
In this article, we present a user-centric application design to create a sustainable virtual heritage system (V-HS) built upon a modular information system. It is fed by several data sources globally meeting the needs of the organization for which the system is implemented. The approach focuses on the strategy of adaptation to evolutions in terms of data acquisition on the one hand, and in terms of visualization and interactions on the other hand. It integrates several concepts dealing with 3D acquisition, data processing, data integration, immersive development as well as considerations for handling massive reality-based datasets. The work is guided by user needs and illustrates its proficiency in a use case that highlights the design choices for the creation of a virtual reality application.
Setting up a multi-modal immersive application is constrained due to several big data specificities of which the volume (up to terabytes), the velocity (streams of data), and the variety (several geometric and semantic modalities) majorly influence the representativity of the scene. This is not a straightforward process and raises major data considerations to find an optimal working balance between scene fidelity and user experience. Moreover, the interaction with the environment and the semantic sources of information—initially available on-site or via audio guide—adds extra complications for their correct integration.
The remainder of the paper is structured as follows. Section 2 deals with the current state of the art constitution of heritage information systems and VR applications for tourism. It also includes existing 3D data capture workflows that provide the geometric base for the environment design.
Section 3 gives the reader the context of the study, which takes place on the castle of Jehay, in Belgium.
Section 4 proposes a consistent methodology to design and develop a V-HS based on reality capture data and user needs. It aggregates the considerations explicitly from the previous chapters and provides a replicable framework for the constitution of a VR application from 3D reality capture data.
To illustrate the considerations, we provide in Section 5 a concrete return of experience over a use case, highlighting the immersive functionalities that can add value to visitors during the 9-year planned renovations.
Finally, we extract key insights and transpose them in Section 6.
2. Related Works
2.1. Heritage Information System
As mention by M. Santana in [6], heritage information should provide relevant and timely data linked to different work/analysis phases. The inclusion of all the required information (geometry, temporality, semantics, sound, etc.) coupled with the management of its heterogeneity, its complexity, and the multiplicity of actors leads to significant challenges of information integration [7]. The heritage research community has quickly understood the need to develop systems for structuring information through data models that can manage heterogenic and complex heritage information. The creation of a heritage information system often deals with a first complication when linking semantic information to low-level and heterogeneous geometric information, such as 3D meshes [8] and point clouds [9,10]. Several existing projects propose a heritage information system in which an information system is related to a three-dimensional representation of a heritage site or building. Among those approaches, we wish to point out some relevant applications: the BIMLegacy project [11], the PHYT project [12], and the 3DHOP plan [13].
The BIMLegacy project [11] is an online platform aimed at unifying and synchronizing heritage architecture information. The contribution of the work is to propose a platform where stakeholders can synchronize heritage information. The platform has been developed following the design science research methodological approach. This method of development relies on a prototype definition that is enriched and corrected in several iterations. The paper proposes a building information model (BIM) legacy workflow, which means that the acquired data (point clouds) must first be modeled through a scan-to-BIM approach. While this has the benefit of producing light-weighted 3D models for a smooth and reliable 3D representation, modeling the data is time-consuming and technological evolutions outside the BIM framework are additional challenges.
The PHYT project [12] is a comprehensive project that merges several partners such as parietal artists, archaeologists, and 3D information experts. Within the framework of the project, a 3D environment has been developed to store and localize information from heterogeneous sources of every specialist studying caves. The semantic information is attached to a 3D point that serves as an identifier to retrieve data in the database. The 3D cave environment is represented as a 3D mesh. Based on the semantic representation in the 3D environment, a bi-directional communication has been set up from the 3D model to the database (selection from the 3D model) and from the database to the 3D environment (visualization of queries in the 3D environment) which is an interesting direction, and extensible with more interactivity for non-experts.
The 3D Online Presenter (3DHOP) [13] is an open-source project for the creation of interactive web presentations of high-resolution 3D models. The environment is oriented to use cases in cultural heritage. The strength of this system resides in the variety of stakeholders that it is addressed to. The system is not intended to be a working platform but only a visualization tool of already implemented semantic information, unfortunately not VR-ready.
The analysis of an existing shared data environment dedicated to cultural heritage information shows that there are very few working environments that can permit the linkage of flexible information systems with multi-modal usage through immersive technologies. We believe that providing a unified scheme for different user’s categories is the most efficient solution since each interpretation of heritage objects or artifacts is dependent on past experience and a context of interpretation. Most analyzed systems prefer to stream parametric or 3D meshes because of their relative lightness to be streamed on the Web, but none studied their compatibility with VR frameworks. For all these reasons, we aim to develop an immersive system that is a working environment with a two-way link between 3D geometry and semantic information through immersive interfaces.
2.2. Virtual Reality for Tourism
The interest in virtual reality for tourism purposes started with early speculations on the impact of this technology in the mid-1990s related to the articles [14,15,16,17]. R. Cheong [14] envisioned the possibility to theoretically complete travel experiences in a safe and controlled environment using a VR headset for more on-site accessibility. The author relates the potential of artificial tourism as a competitor to disrupt this industry. In 1995, P. Williams and J.S Perry Hobson [17] state that VR needs adequate hardware to reach “human” realism and comfort standards regarding motion sickness [18]. Furthermore, the authors’ conjecture the impact of virtual reality on accessibility: “for sensitive tourist areas of the world where it is necessary to restrict access of tourists, VR could allow unlimited access”. This conjecture is highlighted by works such as the digitization of the Chauvet Cave in France [19]. Discovered in 1994, this site was closed the same year to prevent further degradation of the cave, but by using a VR application, anyone now has access to the place virtually. It also holds a digital copy of the natural cave even if degradations occur on-site.
Nowadays, pushed by the evolution of modern technology and hardware capabilities, VR advances deliver devices with better visual, audio, haptic, tracking, input, and smell experiences [20,21,22]. The initial concerns are now mostly resolved, and VR is categorized as a mature technology, according to Gartner’s 2017 Hype Cycle for Emerging Technology [23]. This applies to applied sciences and projects where many cultural sites have now adopted VR to enhance their user experience and attract more tourists [24].
Virtual reality’s impact in the sector of tourism has been studied through six primary areas of application [25]: education, accessibility, marketing, planning and management, heritage preservation, and entertainment. Educators have recognized the teaching potential of VR, and shown that the feeling of presence in a learning environment embedded with information helps the learning process [26,27]. Moreover, the ability to interact in VR is recognized as an essential learning factor in [28]. The impact of virtual reality takes place in more unexpected areas. For instance, it allows for the collection of data on the behavior of the user [29], with a direct application to cultural sites to test the popularity of a new exhibit [25]. VR has also shown interest in the promotion of cultural sites as related in [30,31]. Since marketing tourism relies heavily on the Internet [32], VR is a potential tool for supplying information to tourists, as expressed by the authors in [25]. In entertainment, VR can be a single product for “fun” and to attract tourists, as seen in various theme parks [33].
While the impact of VR on the tourism industry is acknowledged, challenges arise in the development and design of VR applications for cultural tourism. For instance, the authors in [24] and [34] show that investigations are often necessary to enhance the learning experience in a unique cultural tourism context, where user interaction needs to be designed to encourage the engagement of a learner. Furthermore, in [24] the author emphasizes the objectives of such implementation in cultural tourism where “technological challenges such as inconsistent interaction are not only challenges for user interaction, but detrimental for the tourist experience”.
2.3. Data Capture for Cultural Site
The observations in Section 2.2. bring into attention to the developer-specific challenges that a VR application for cultural tourism faces. A first concern found in the early stage of the application is the data modalities that the rest of the development relies on. The data gathered from reality vary in forms and utility scope. Three-dimensional point clouds and 3D mesh are the most common geospatial data types within VR applications, with examples in [24,35,36].
Point clouds are a remarkably simple yet efficient way of representing spatial data while keeping a direct link to the raw sensory data. However, despite the ease of capturing point clouds, processing them becomes a challenging task. First, problems such as a misadjusted density, clutter, occlusion, random and systematic errors, surface properties, or misalignment are the main data-driven obstacles to a wider dissemination. It often related to their data-structure or capture-related environment specificities as highlighted by F. Poux [37]. Secondly, structure-related problems usually emerge due to a lack of connectivity within point ensembles, which can make the surface information ambiguous [38]. Then, the compression and structuration of such datasets are heavy constraints that limit the integration of point clouds directly in VR scenarios [39]. Some work, such as [35,36,40], permit the integration of massive point clouds data, but an effective visualization and interaction are still limited. Three-dimensional mesh representation is more commonly found within the industry workflows, first propelled by the history of obtaining 3D information without reality capture devices. Mesh representation often addresses the challenges mentioned above. On top, meshes present usually a smaller number of connected vertices and encode an explicit topology [41].
Moreover, we can bind a texture through mapping for storing additional information. Mesh representation from 3D surveyed data is most often derived from the point cloud data. As such, it includes several pre-processing steps to filter noise and outliers and to obtain a geometrical fit as clean as possible. On top, the balance between fit and complexity is often to be decided. In the end, orienting the underlying geometry for further processes is often linked with the vision one has, in terms of whether they want to work on original raw data or interpreted shapes with manual intervention in the tuning/optimization of the meshing parameters.
The heritage documentation encompasses a wide range of activities, including the recording and documentation of reality through geometric and semantic data collection. To collect the geometric information, several acquisition procedures can be set up. Nowadays, terrestrial laser scanning (TLS) and computer-vision photogrammetry through structure from motion (Sfm) [42] and dense image matching (DIM) [43] are the two major techniques used in a digital documentation context [44,45]. Many examples of heritage site documentation can be retrieved where these two techniques are used to collect geometrical information related to the objects [46,47]. For most of the applications, some heritage information is collected over archaeological sites or heritage buildings. Based on the gathered information, a 3D reconstruction of the current state of the artifact is proposed. Then, a semantic enrichment takes place to add contextual information to the model and make it usable in a heritage context.
Finally, a representation is proposed to communicate through a medium such as a web environment, a 3D simulation software, or, more basically, by producing 2D documents such as maps and plans. Some in-depth information can be found in [48,49]. A dichotomy still exists in the documentation that the virtual environment can use to reproduce the cultural heritage sites [50]. Documentations are found mostly either in 2D or 3D. The 2D technique suits well for small projects with a limited cost. Still, it lacks cohesive information when recreating the whole structure in 3D, which is often the case to model the virtual reality environment [50,51]. This rich information then serves numerous industries (e.g., surveying and engineering; buildings and architecture; public safety and environmental issues) and supports tourism and the promotion of cultural heritage sites. Their utility is found at many levels and seeing the number of in-use applications gives a good idea of the potential they hold, as stated by F. Poux in [52]. To digitally replicate a model of the physical world, one can leverage a set of tools and techniques that will each have specificities, which makes choosing the right approach difficult. Interestingly, photogrammetry is the most often used technique as it obtains a coherent 3D mesh with lower efforts than TLS, and obtains a realistic texture when the lightning condition is addressed [53]. It is accessible thanks to a lower price, as well as a higher model and texture registration accuracy.
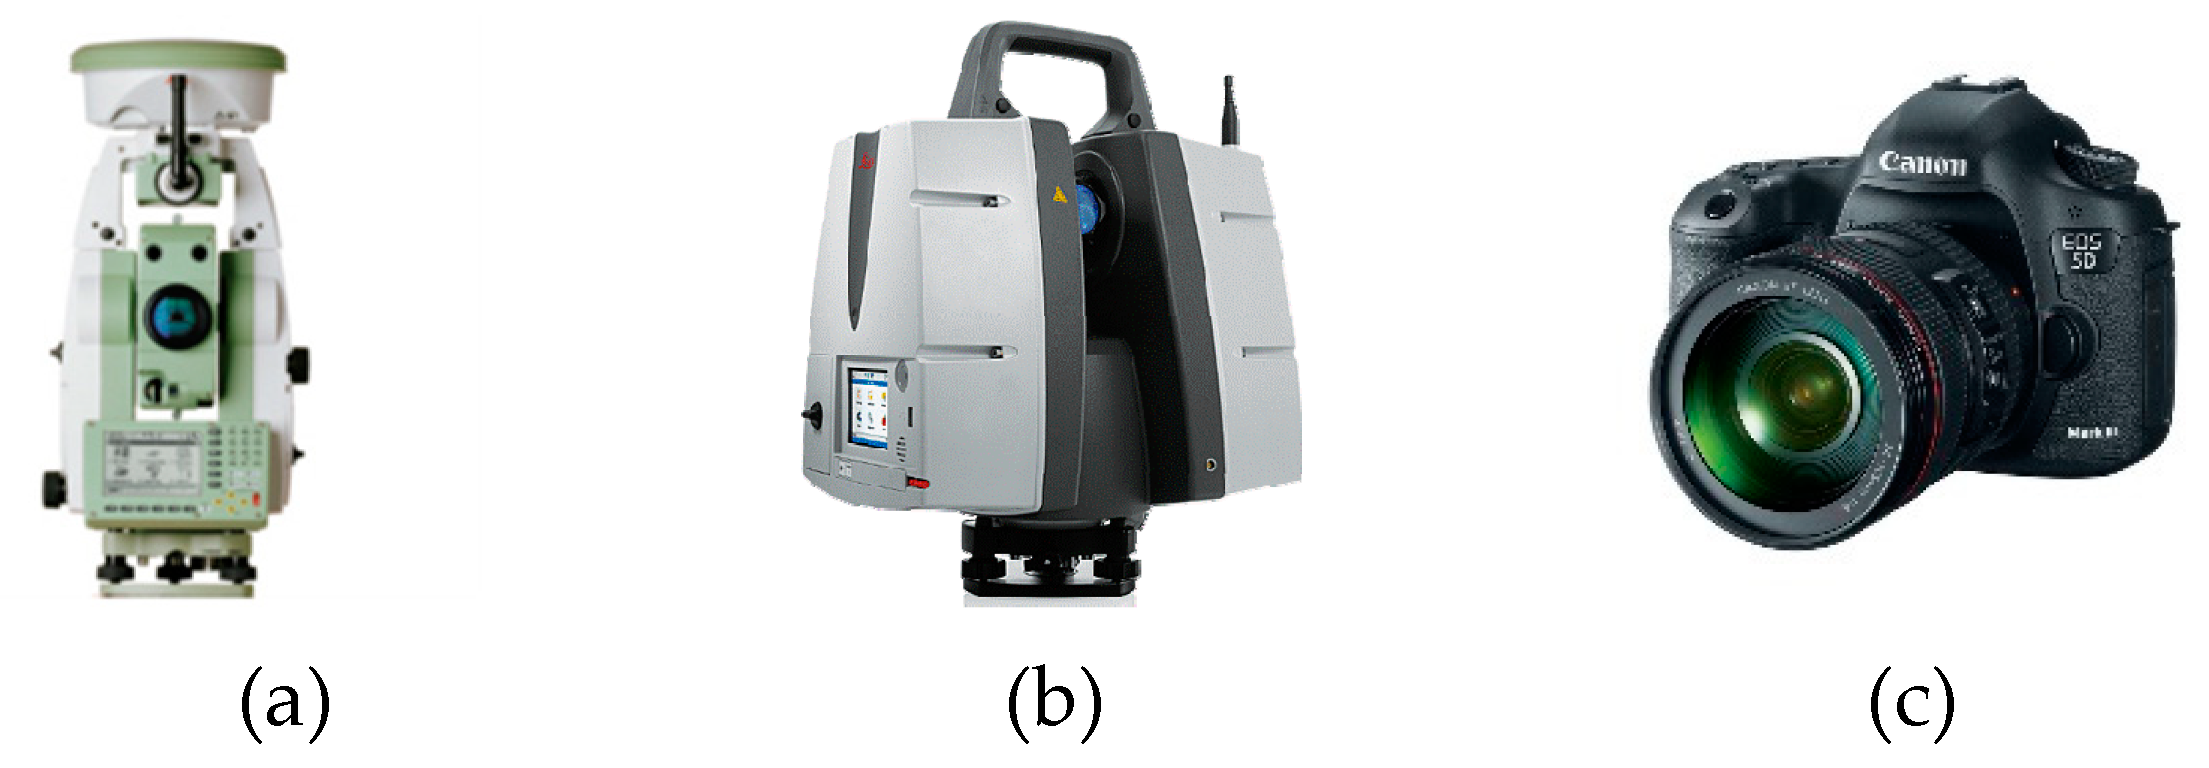
Total stations (TS, Figure 1) are instruments capable of pointing and gathering the coordinates of points of interest with a very high accuracy (typically in the range of millimeters). They are the favored instrument of surveyors and have been in use for decades for various surveys due to their high precision and the possibility to attach some semantic information on-site (geocoding). In cultural heritage and archaeological applications, they are most often used as the reference measurement method, often a base for quality analysis (QA) and quality control (QC) [54,55], but their usage can be extended for 3D modeling frameworks. Secondly, terrestrial laser scanners (TLS, Figure 1) can be seen as an automated total station with an angular resolution limiting the number of gathered points. Contrarily to TS, a TLS is operated almost fully automatically, and records a full 360° panorama constituted of visible points (in the realm of one million points per second). They have been actively used since 2000 (e.g., [56,57,58]), and recently the same LiDAR technology benefits new platforms enabling dynamic capture or aerial surveys [59,60]. Finally, terrestrial photogrammetry (Figure 1) [61] aims essentially to extract a 3D position from a set of 2D images [62]. On the industry side, new software based on structure from motion [42] and multi-view stereo with bundle adjustment and SIFT, SURF, ORB, M-SURF, BinBoost descriptors [63,64] allow a wide range of professionals and less-specialized users to recreate 3D content from 2D poses [65,66,67,68,69,70,71,72,73,74]. Use cases range from object-scale reconstruction to city-scale reconstruction, making this technique a promising way to get 3D point clouds. However, while the reconstruction precision for middle- to large-scale applications is getting increasingly better [75], remote sensing via active sensors is still favored in several infrastructure-related industries.
Consequently, data acquisition in parallel to the design of the virtual environment is not an obvious task. It needs additional research to develop a methodological basis for cultural tourism VR development. Independently from the recording technique that is used on an archaeological or heritage site, it is worth mentioning that the acquisition allows only the gathering of information related to the heritage object at the time of the analysis. All other information related to the past state of the site must be reconstructed based on historical knowledge. The inclusion of all the required information dimensions (temporality, semantic, management of heterogeneity, the complexity, the multiplicity of actors) leads to a major information integration challenge [7]. It motivates the framework described in this article aimed at creating a virtual reality environment for cultural tourism based on reality capture.
2.4. User-Centered Approaches
A user-centered design is a suite of methods emphasizing understanding people rather than technology. According to [76], a user-centered design can be seen as a philosophy of product development, where the product is not an end in itself but rather a means toward providing a good experience for users. It is conducted as an iterative process in which designers focus on the users and their needs for each phase of the design [77]. Applying this concept to the creation of a multi-modal VR environment for cultural heritage adds another layer of complexity due to the different categories of users. Some attempts and realizations [78,79,80] are focused on some parts of the various challenges and integrate initial insights. The article by M. Reunanen et al. [78] illustrates a holistic user-centered approach to immersive digital cultural heritage installations on the case study of Vrouw Maria, a Dutch merchant ship that sank near the Finnish coast in 1771. The paper is interesting and describes the constitution of a prototype highlighting some 3D user interface issues as perspectives. The author emphasizes the importance of such a process on projects with a tight schedule, especially when considering the value of the methods used. In the use case, concept mapping, scenarios creation, and iterative prototyping produced useful lightweight results quickly and were economically sound. Finally, the author states that the concepts, needs, and requirements are essentially about users, not technology, which makes it possible to tackle different design tasks using the same initial approach, which is interesting for sustainable approaches. Similarly, L. Barbieri et al., in [79], propose a user-centered design of a digital exhibit for archaeological museums that results in a fixed non-immersive screen accessible for visitors. This approach has been carried out for the development of a virtual exhibit hosted at the “Museum of the Bruttians and the Sea” (Italy). The paper gives some technical advice and suggestions which can be adopted to overcome several typical and recurrent problems related to the development of digital exhibits, especially when low-budgets and space constraints are among the design requirements. The results of user testing and the opinions gathered by the participants to the study demonstrated that the adoption of a user-centered-design approach can efficiently improve the design of digital exhibits and improve the user-friendly experience for the users. While the title encompasses the terminology virtual reality, it does not relate to any head mounted device or true first-person point of view experience with complex interactions and hand gesture recognition. Finally, a conceptual framework for designing a virtual heritage environment for cultural learning is given in [80], which provides useful high-level insights into the key elements that a user-centered-design approach provides for virtual heritage. Specifically, the paper approaches information design, information presentation, some navigation mechanisms and environmental setting, with traditional 3D rendering as a basis (e.g., navigation aids, minimaps, teleports, quality of graphics, contextual settings, etc.). While the paper lays down interesting concepts, the prototype is tailored for casual users only. The authors in [81] deliver additional concepts by looking at the simplicity, originality, and universality of a digital solution for heritage tourism. In the article, guidelines are presented to foster ecology and cultural heritage in natural and/or rural areas.
A user evaluation conducted in [82] on a VR experiment in Cyprus is an additional resource that highlights some outcomes of a user-centered design. For example, the remote viewing of cultural heritage spaces without having to visit the physical space is interesting thanks to interactive capabilities, such as the ability to manipulate some of the objects for more information or to move closer or view them from different angles. Additionally, capabilities that are not available during traditional physical museum visits and the 3D reconstruction of artifacts prove to be much more engaging to users.
These references are very pertinent and propose interesting solutions, where the studies address case studies with a specific emphasis on the philosophy of the user-centered design process. However, to the best of our knowledge, studies that investigate the combination of information systems, virtual reality, and 3D reality capture to facilitate a sustainable heritage information system design have not been outlined. Additionally, features suggested by information design and presentation [80] are mostly applied on multimedia devices without clearly highlighting technological evolutions such as VR applicability. Finally, it is necessary to study the generalization of the approach to different user categories.
3. Context and Problematics
The “Province de Liège”, i.e., the managers of the castle of Jehay, had a triple concern that led to the 3D capture of the heritage site in Figure 2.
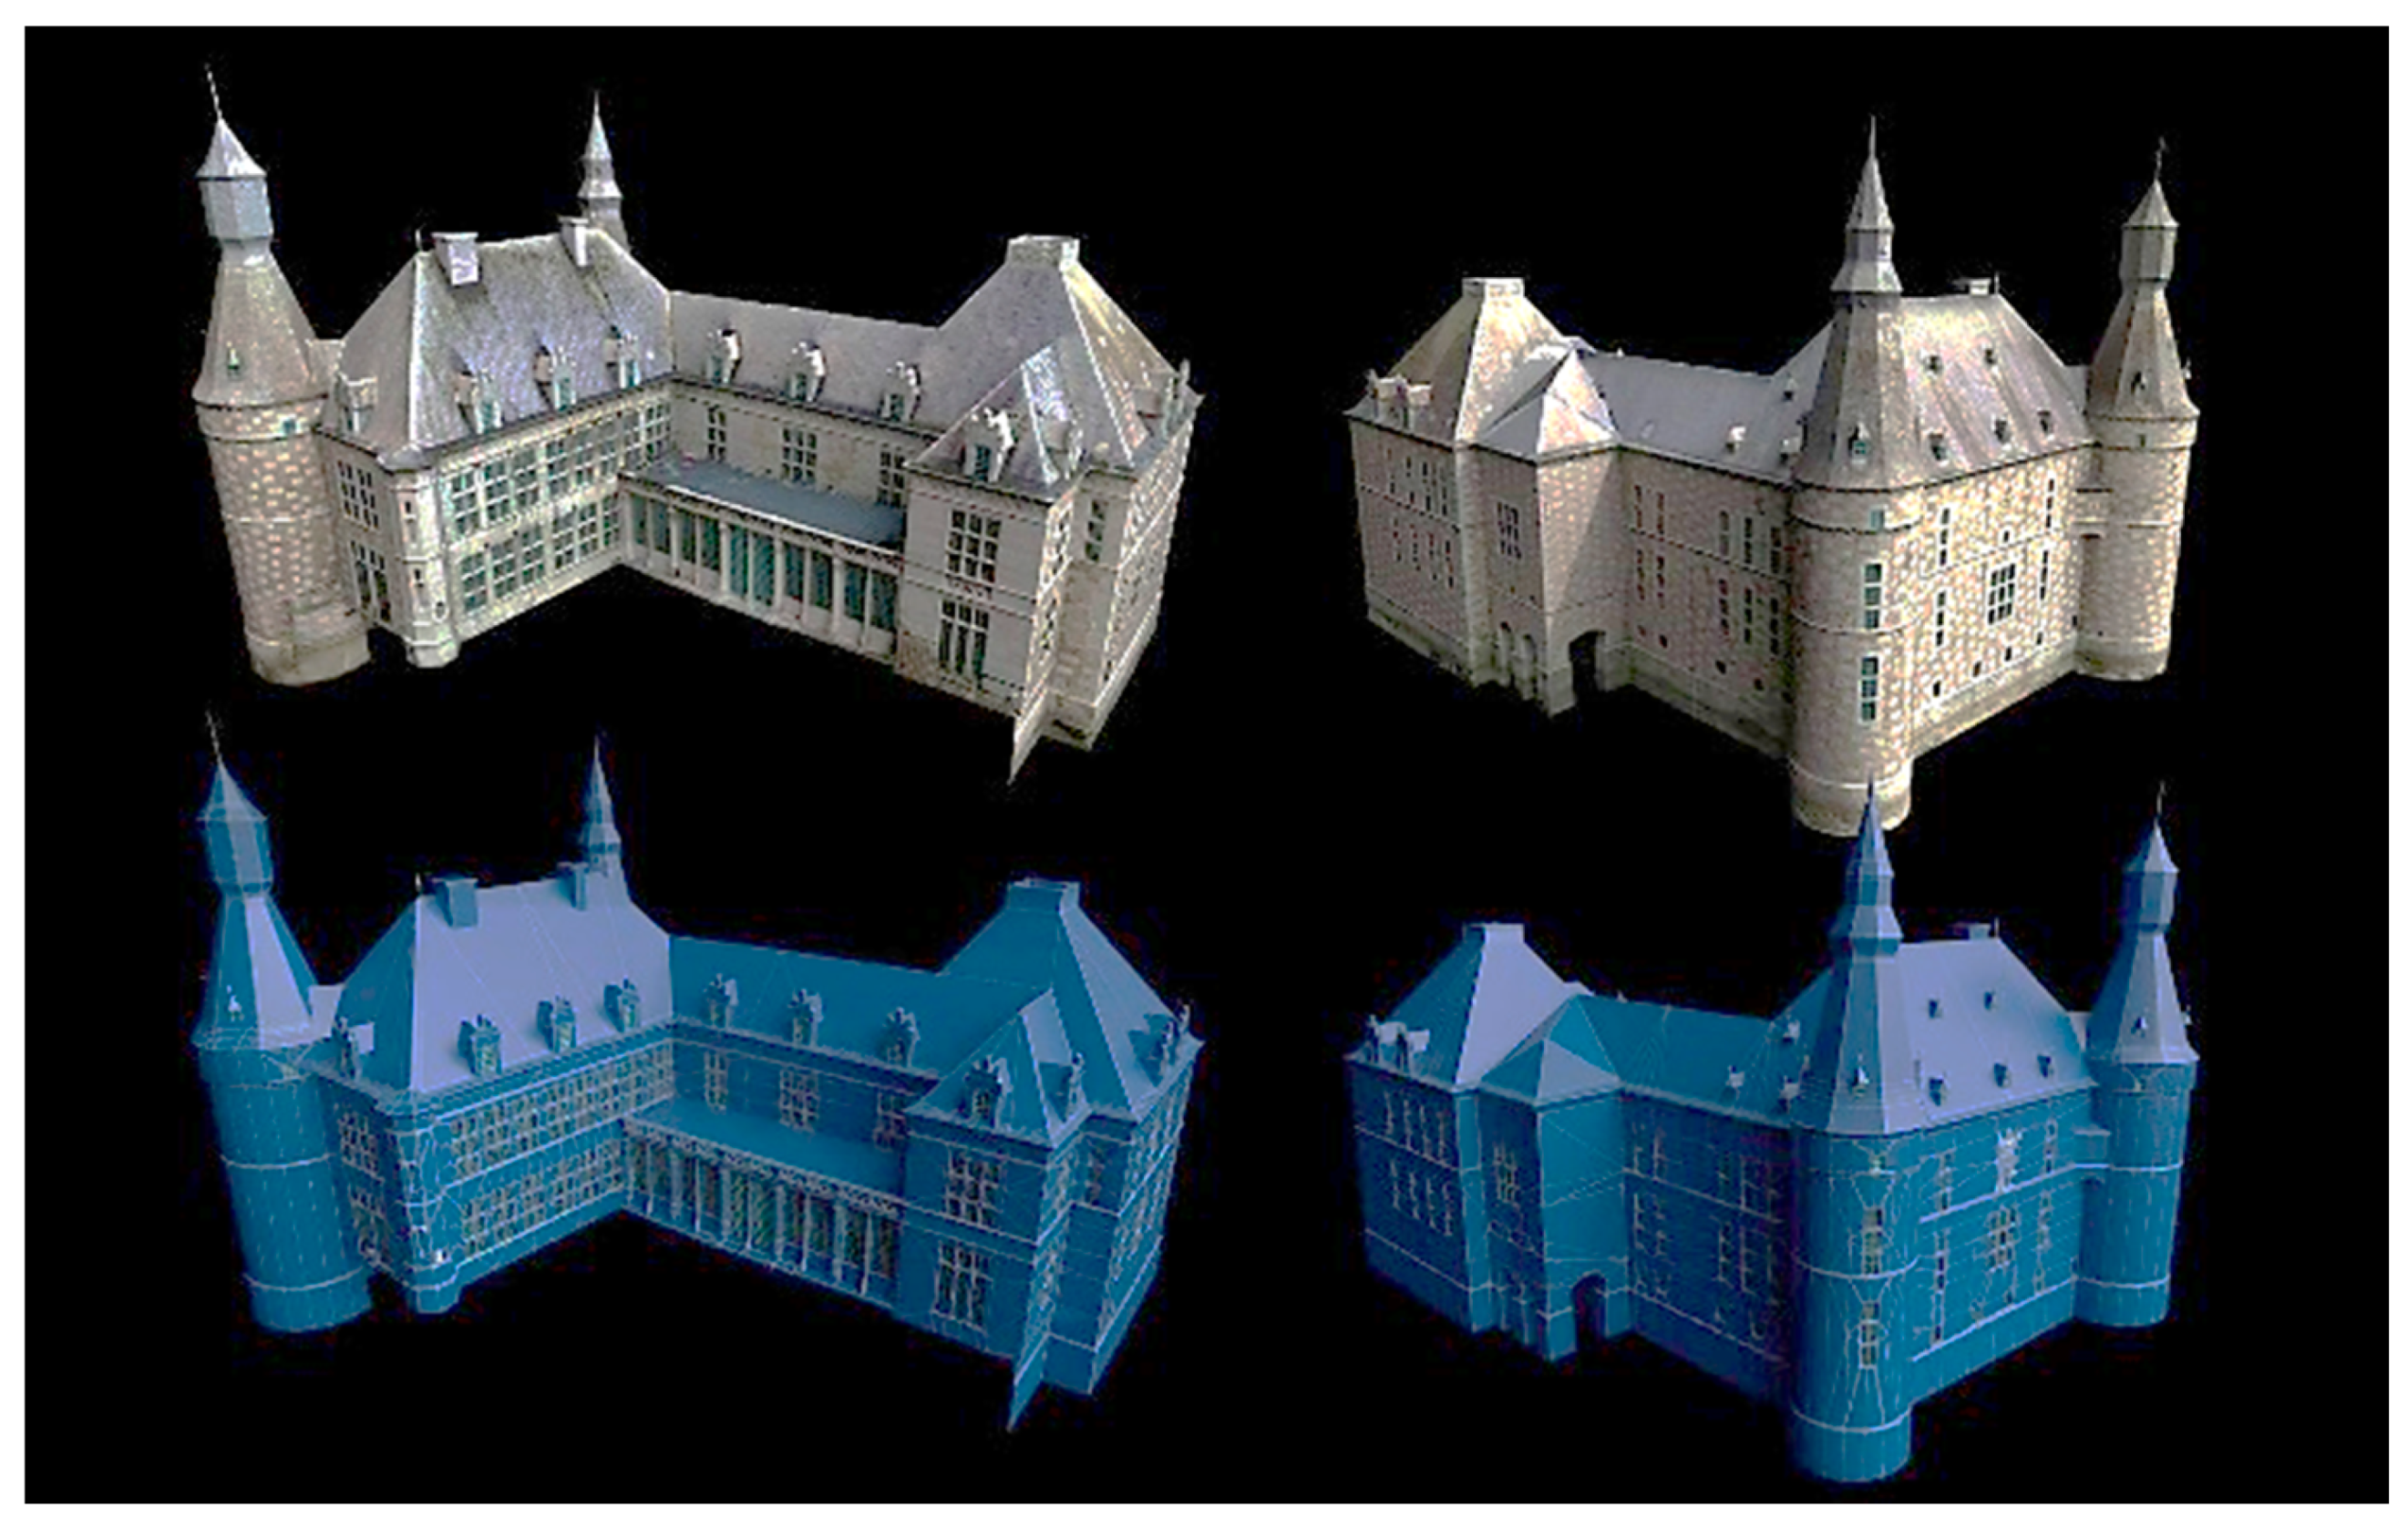
Because of planned renovations, the province first wanted to keep an accurate documented state for archive purposes, digital documentation, and to better execute renovations accessorily (see outdoor changes in Figure 3). Indeed, some parts of the castle are now sealed and inaccessible to visitors. On top, some overhaul archaeological parts and decorative elements (indoor ceilings) are not preserved during the renovation.
Secondly, due to the regular income from tourism, decision-makers wanted to have an exhibition that allows visitors to still experience the site while giving new innovative insights.
Finally, contractors want to better manage the heritage site through various inventories, the quality control of work in progress, deformation analysis and to get a detailed capture at different time intervals for insurance and archive purposes. These goals are naturally highly guiding underlying approaches which may be able to provide a solution that can subsist the test of time by being integrated around a more centralized conceptualization. The sustainability of such a system demands ways of managing the addition of new data while adapting to new demands using the latest technology. Rather than highlighting the techniques implemented, we detail in the following sections key concepts to manage the integration of technological evolutions into a modular system. Our proposition to move away from the current trend of separating achievements (preservation vs. visit for non-specialists) and the most sustainable approach is to set up a flexible evolving system. It comes at a cost: we are moving away from the “one-shot” logic and site managers must, therefore, acquire new skills to be able to support the development and maintenance of the system while using and enriching it optimally.
4. Methodology
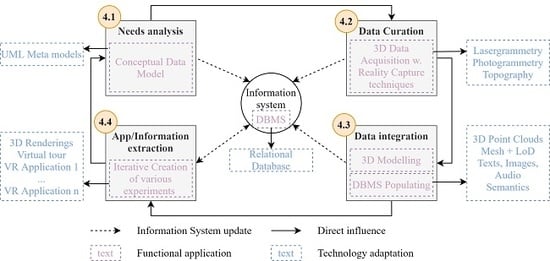
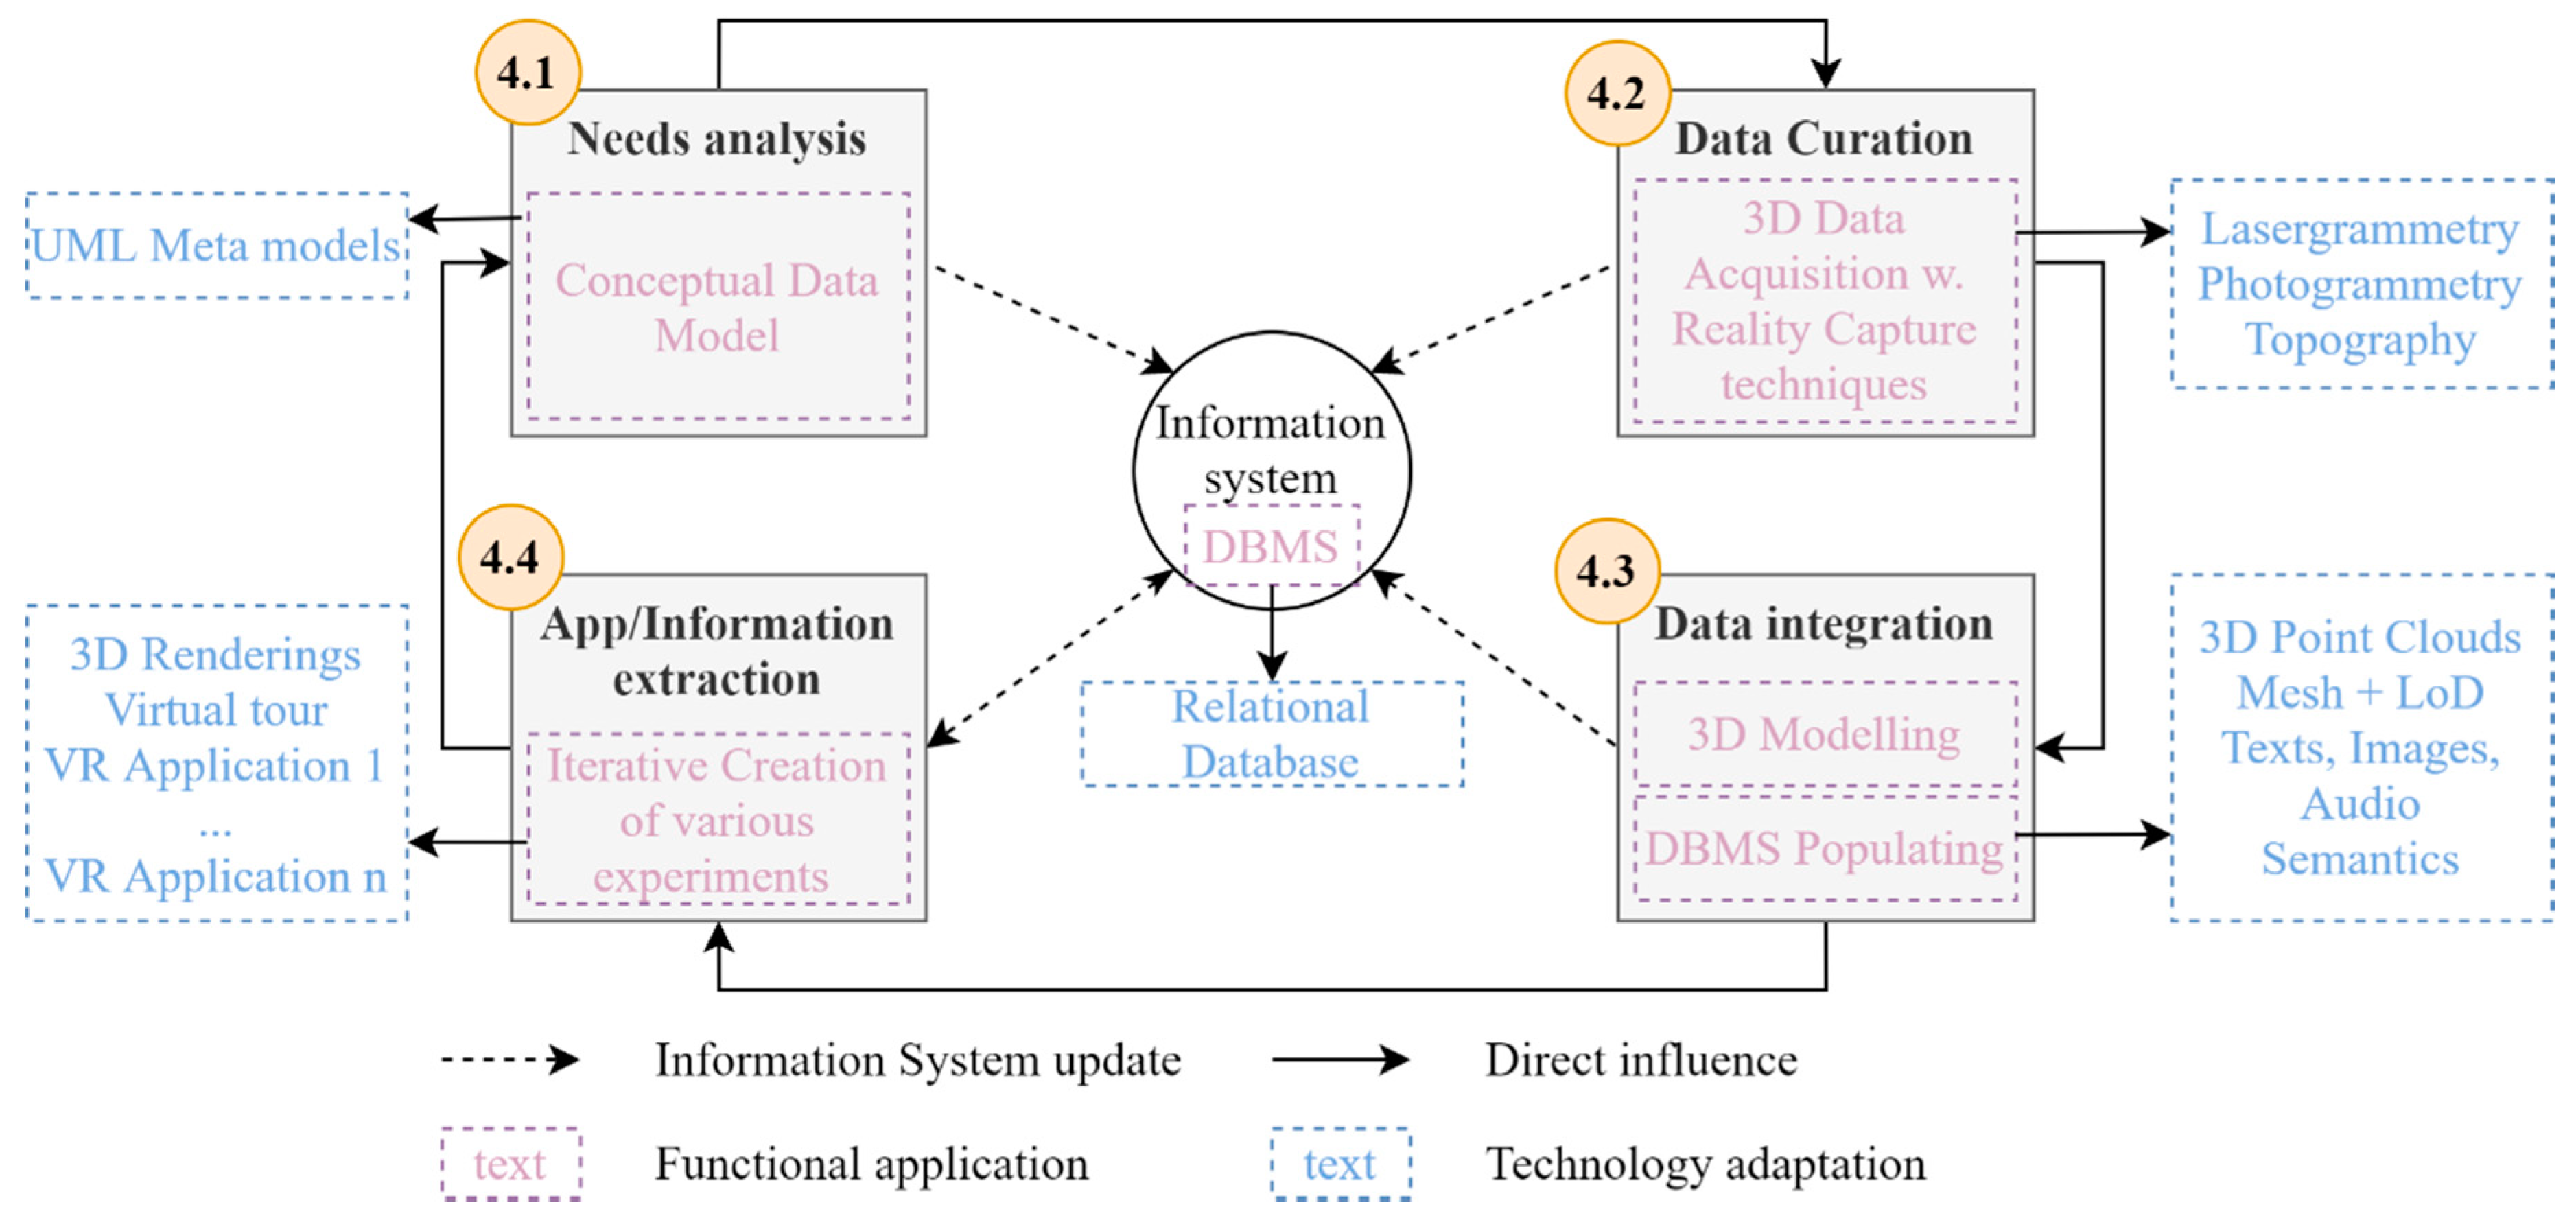
In this project, we were inspired by the design methods used in geographic information science which are themselves derived from the methods developed in information science. The approach followed was a user-centered prototyping. This choice was primarily dictated by the tight deadlines and agile/iterative deployment constraints which such a design alleviates through a fast production of a working solution as illustrated in [83] or [84]. Users were put at the center of the process and we assumed that an information system must meet the needs of an organization or a set of users. It is quite common that these needs are not clearly identified, or in any case, not sufficiently formalized. The prototyping approach implies that new stages start with feedback on the previous stages. This section covers only the first pass as presented in Figure 4, which is then iteratively reproduced to obtain various outputs detailed in Section 5 and Section 6. We started with a needs analysis phase (Section 4.1.) with an iterative co-construction between the development team and the users. This phase relates to the definition of the specifications, the development of the conceptual model and the development of interfaces. Then, a double cascade development phase was initiated, which concerns data curation through multi-resolution 3D mapping (Section 4.2), followed by the optimization for the various usages of the data and knowledge integration (Section 4.3), which were usable through various outputs export of which several VR prototypes (Section 4.4). The operational systems included database management systems populated with 3D data and were searchable through VR interfaces.
Figure 4 shows the proposed framework and its functional application to our use case detailed in Section 5, as well as its technology adaptation for VR heritage tourism. In the next sub-sections, we will describe each main block and provide a meta-model that participates in a sustainable reflection to set up a sustainable system.
4.1. Needs Analysis
The needs analysis aimed to identify the requirements of the project and to take note of the expected elements. It is about contextualizing the project and analyzing the expectations to give a framework to the project. A needs analysis usually gathers insights from several meetings at different points in time. This allows the different decision-makers involved in the process to describe enough parameters for constructive conceptual modeling. The contributions of a needs analysis permit the project to be based on real needs, oriented the project toward satisfying these needs, and better construct the project.
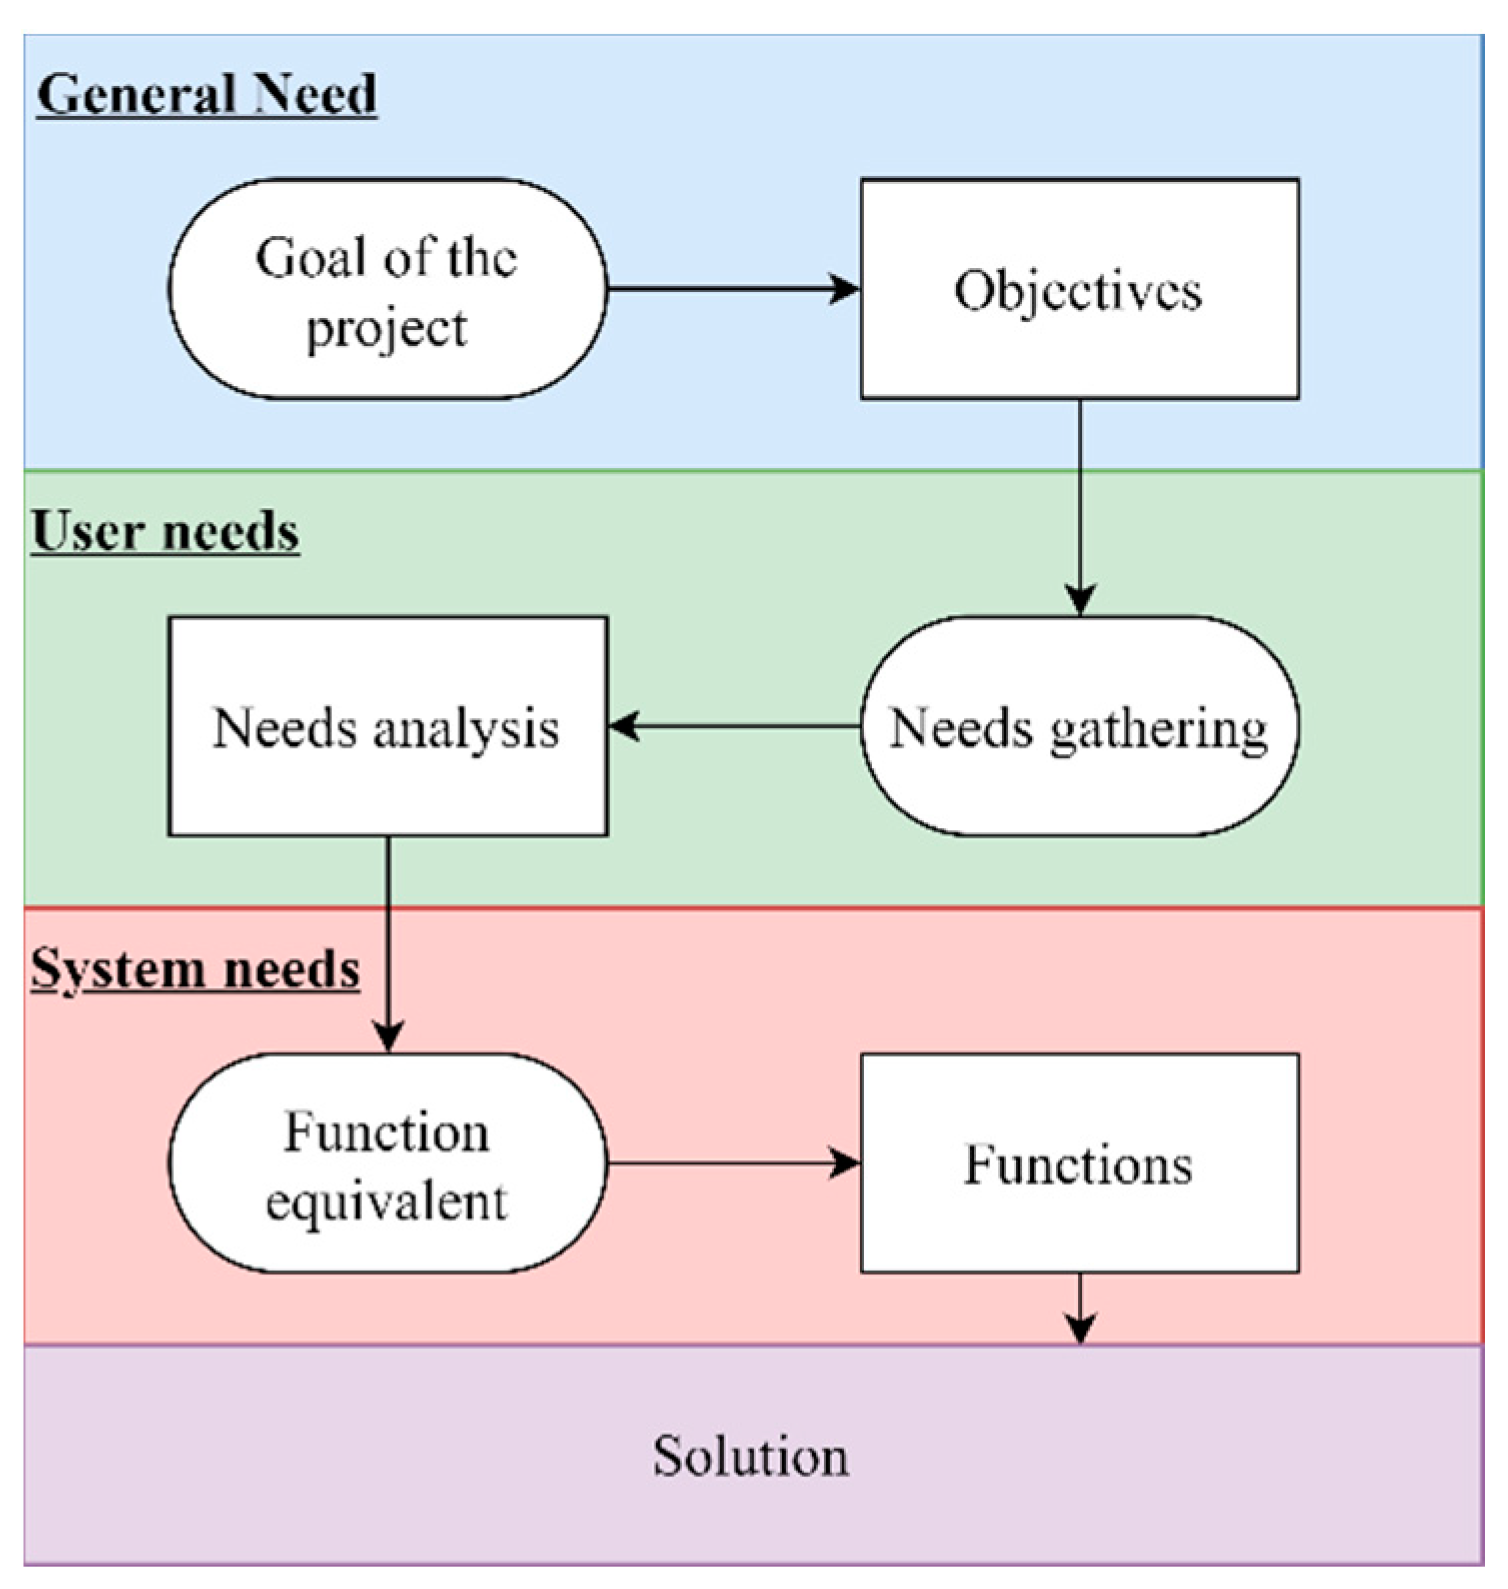
After the framing phase, the process was usually oriented toward the user need requirements and collecting the technical requirements, to finally list the functional operations and prioritize them to answer to the best of the constraints (Figure 5).
It is the sensitivity of the project teams and the involved persons that determine the attributes of the requirements gathering process, and whether it is focused on the technical or user dimension. In absolute terms, a comprehensive need gathering phase considers all dimensions and determines the project requirements from a holistic perspective (overall vision, cross-functional, and multi-disciplinary approach). The collection of needs was formalized in a framework note and is a powerful tool for building a coherent project, meeting user expectations in each context. Our approach then based its decision on a Bayesian bandits decision-making algorithm. Our choice was motivated by the fact that a user-centric design has many iterations, and we wanted to use the one that maximizes positive outcomes. To gather the needs one seeks, among other things, to:
- Contextualize the project: main facts, target, positioning.
- Characterize the objectives of the project.
- Carry out the work of expressing the needs.
- Conducting the work of collecting user requirements.
- Establish the list of content needs.
- Draw up the list of functional requirements.
- Define, clarify and explain the functionalities that meet each need.
- Order and prioritize functionalities in order of importance.
- Create a synoptic table of content functions and their impact on the product.
- Identify the resources to be activated for production.
In all cases, the purpose of collecting the requirements was to facilitate exchanges between all the profiles throughout the project. The results of this approach are listed in Section 5.1. The high-level conceptual models of the different aspects of a heritage tourist VR application were initially built from Figure 6 expressed from the initial need’s analysis design.
This graph was cross-validated following a Bayesian bandits strategy with the needs analysis and was constrained to obtain several conceptual models of the functionalities to develop, and the entry points to keep for further processes if the need arises. Additionally, we highlighted the specificities of the VR such as:
- ▪ VR needs to have a use: the value that AR and VR are promising in terms of providing needs to be clearly understood and relevant in the tourist context [24].
- ▪ Quality environment: by offering a high-quality of resolution or sound, more authentic VR and AR environments in which tourists can be fully immersed should be provided [85].
- ▪ No distraction: avoid distractions for the users, bugs, irrelevant information [31].
- ▪ Consumer-centric: one should carefully consider how this object creates meaning for the visitor, how it connects to his/her values, and enables the visitor to create his/her version of the experience [24].
4.2. Reality Capture Methodology for 3D Data Acquisition
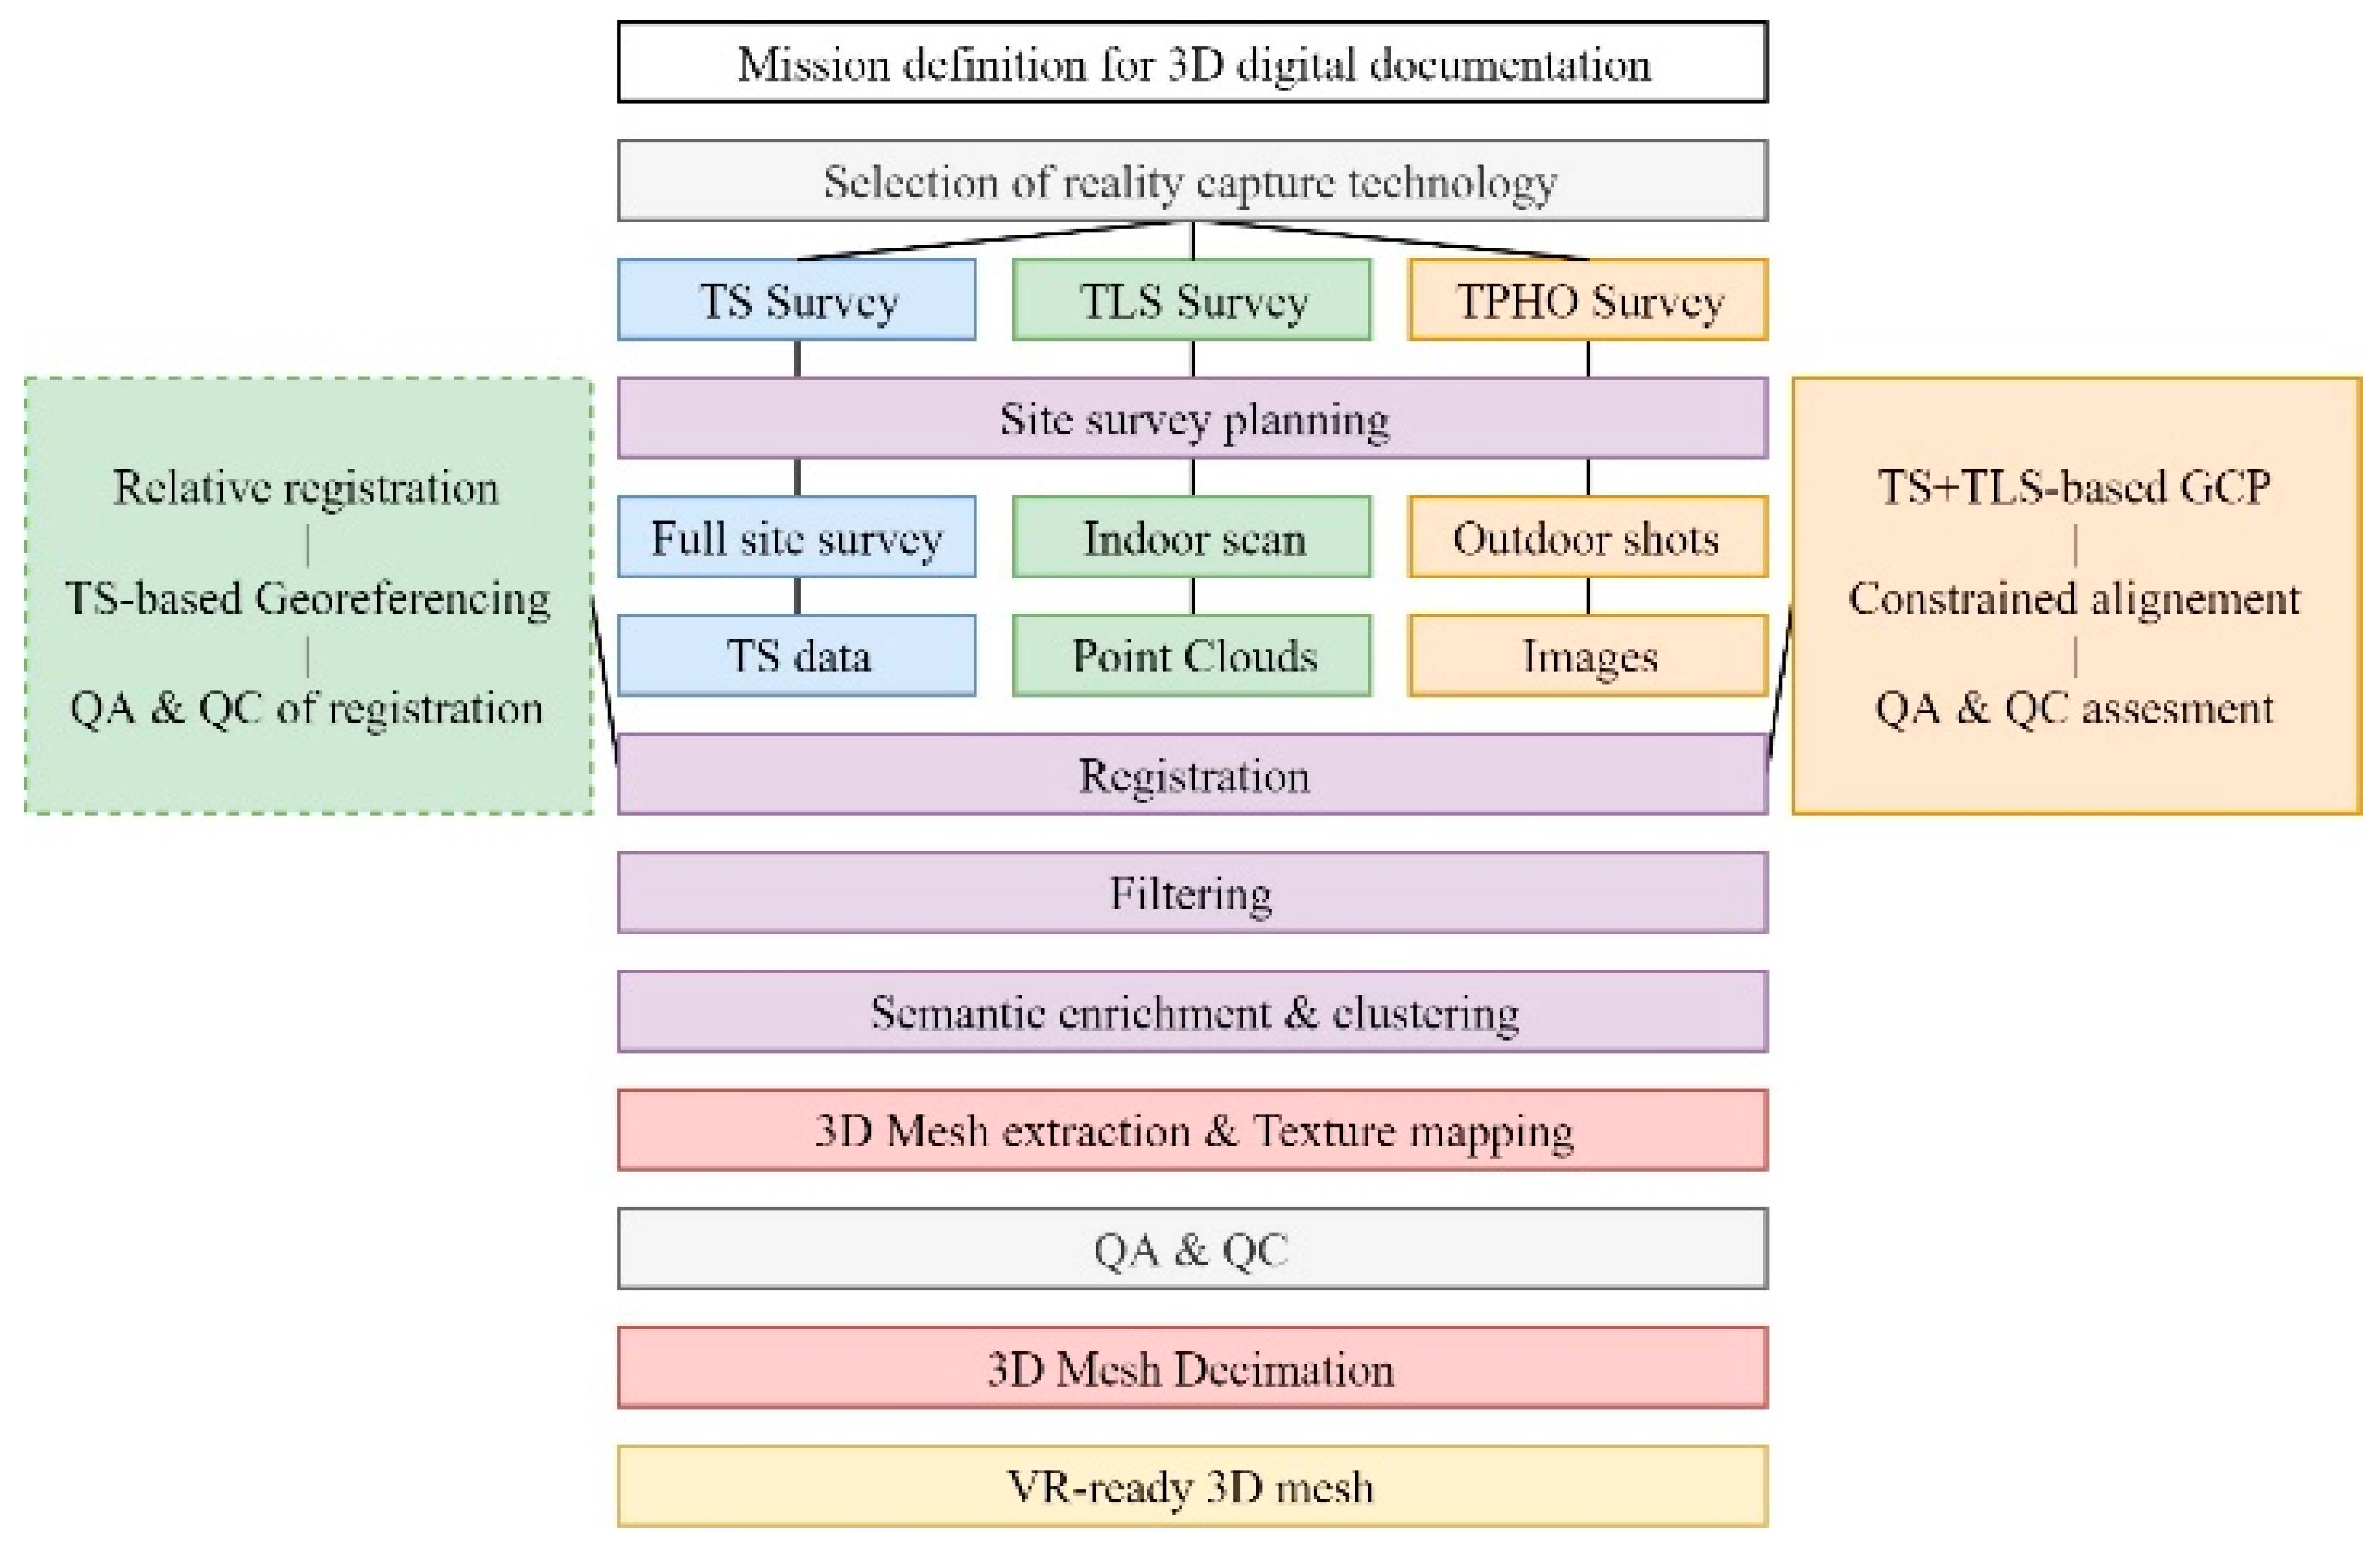
The mission first initiated the use of a terrestrial laser scanner (Leica P30—resolution set to 1.6 mm @ 10 m) for the full survey of the site. It was initially mounted with an external camera to obtain a colorization of the point cloud. Later, several photogrammetric campaigns took place indoors and outdoors. All this data was redundant from a full topographic survey of the site via the total station (Leica TCRP 1200à), including the precise control point distributed along strategic points (we used a GNSS receiver Trimble R10 in RTK mode on 15 established points measured for 5 min each; each point was also stationed with the total station to establish the main polygonal; the mean error was 1 mm in XY, and 2 mm in Z overall points after a Helmert transform). Thus, the three methods were employed and combined for synergies. The workflow was designed to maximize the strengths of each technique as proposed in Figure 7.
The focus was on maximizing the automation and geometric accuracy while keeping a minimal timeframe from acquisition to VR integration. Therefore, the survey included a full photogrammetric reconstruction of outdoor elements and statues, a full laser scanning survey for indoor spaces, and the registration and quality control were done using the dense total station topographic network. The control over the quality of the reconstruction is important to impose constraints on the 3D dense-matching reconstruction through the laser scanning and total station. Yet, to propose a fully non-hybrid workflow, the sole usage of a consumer-grade camera is possible (see Section 6 for more insights).
4.3. Populating the Prototype
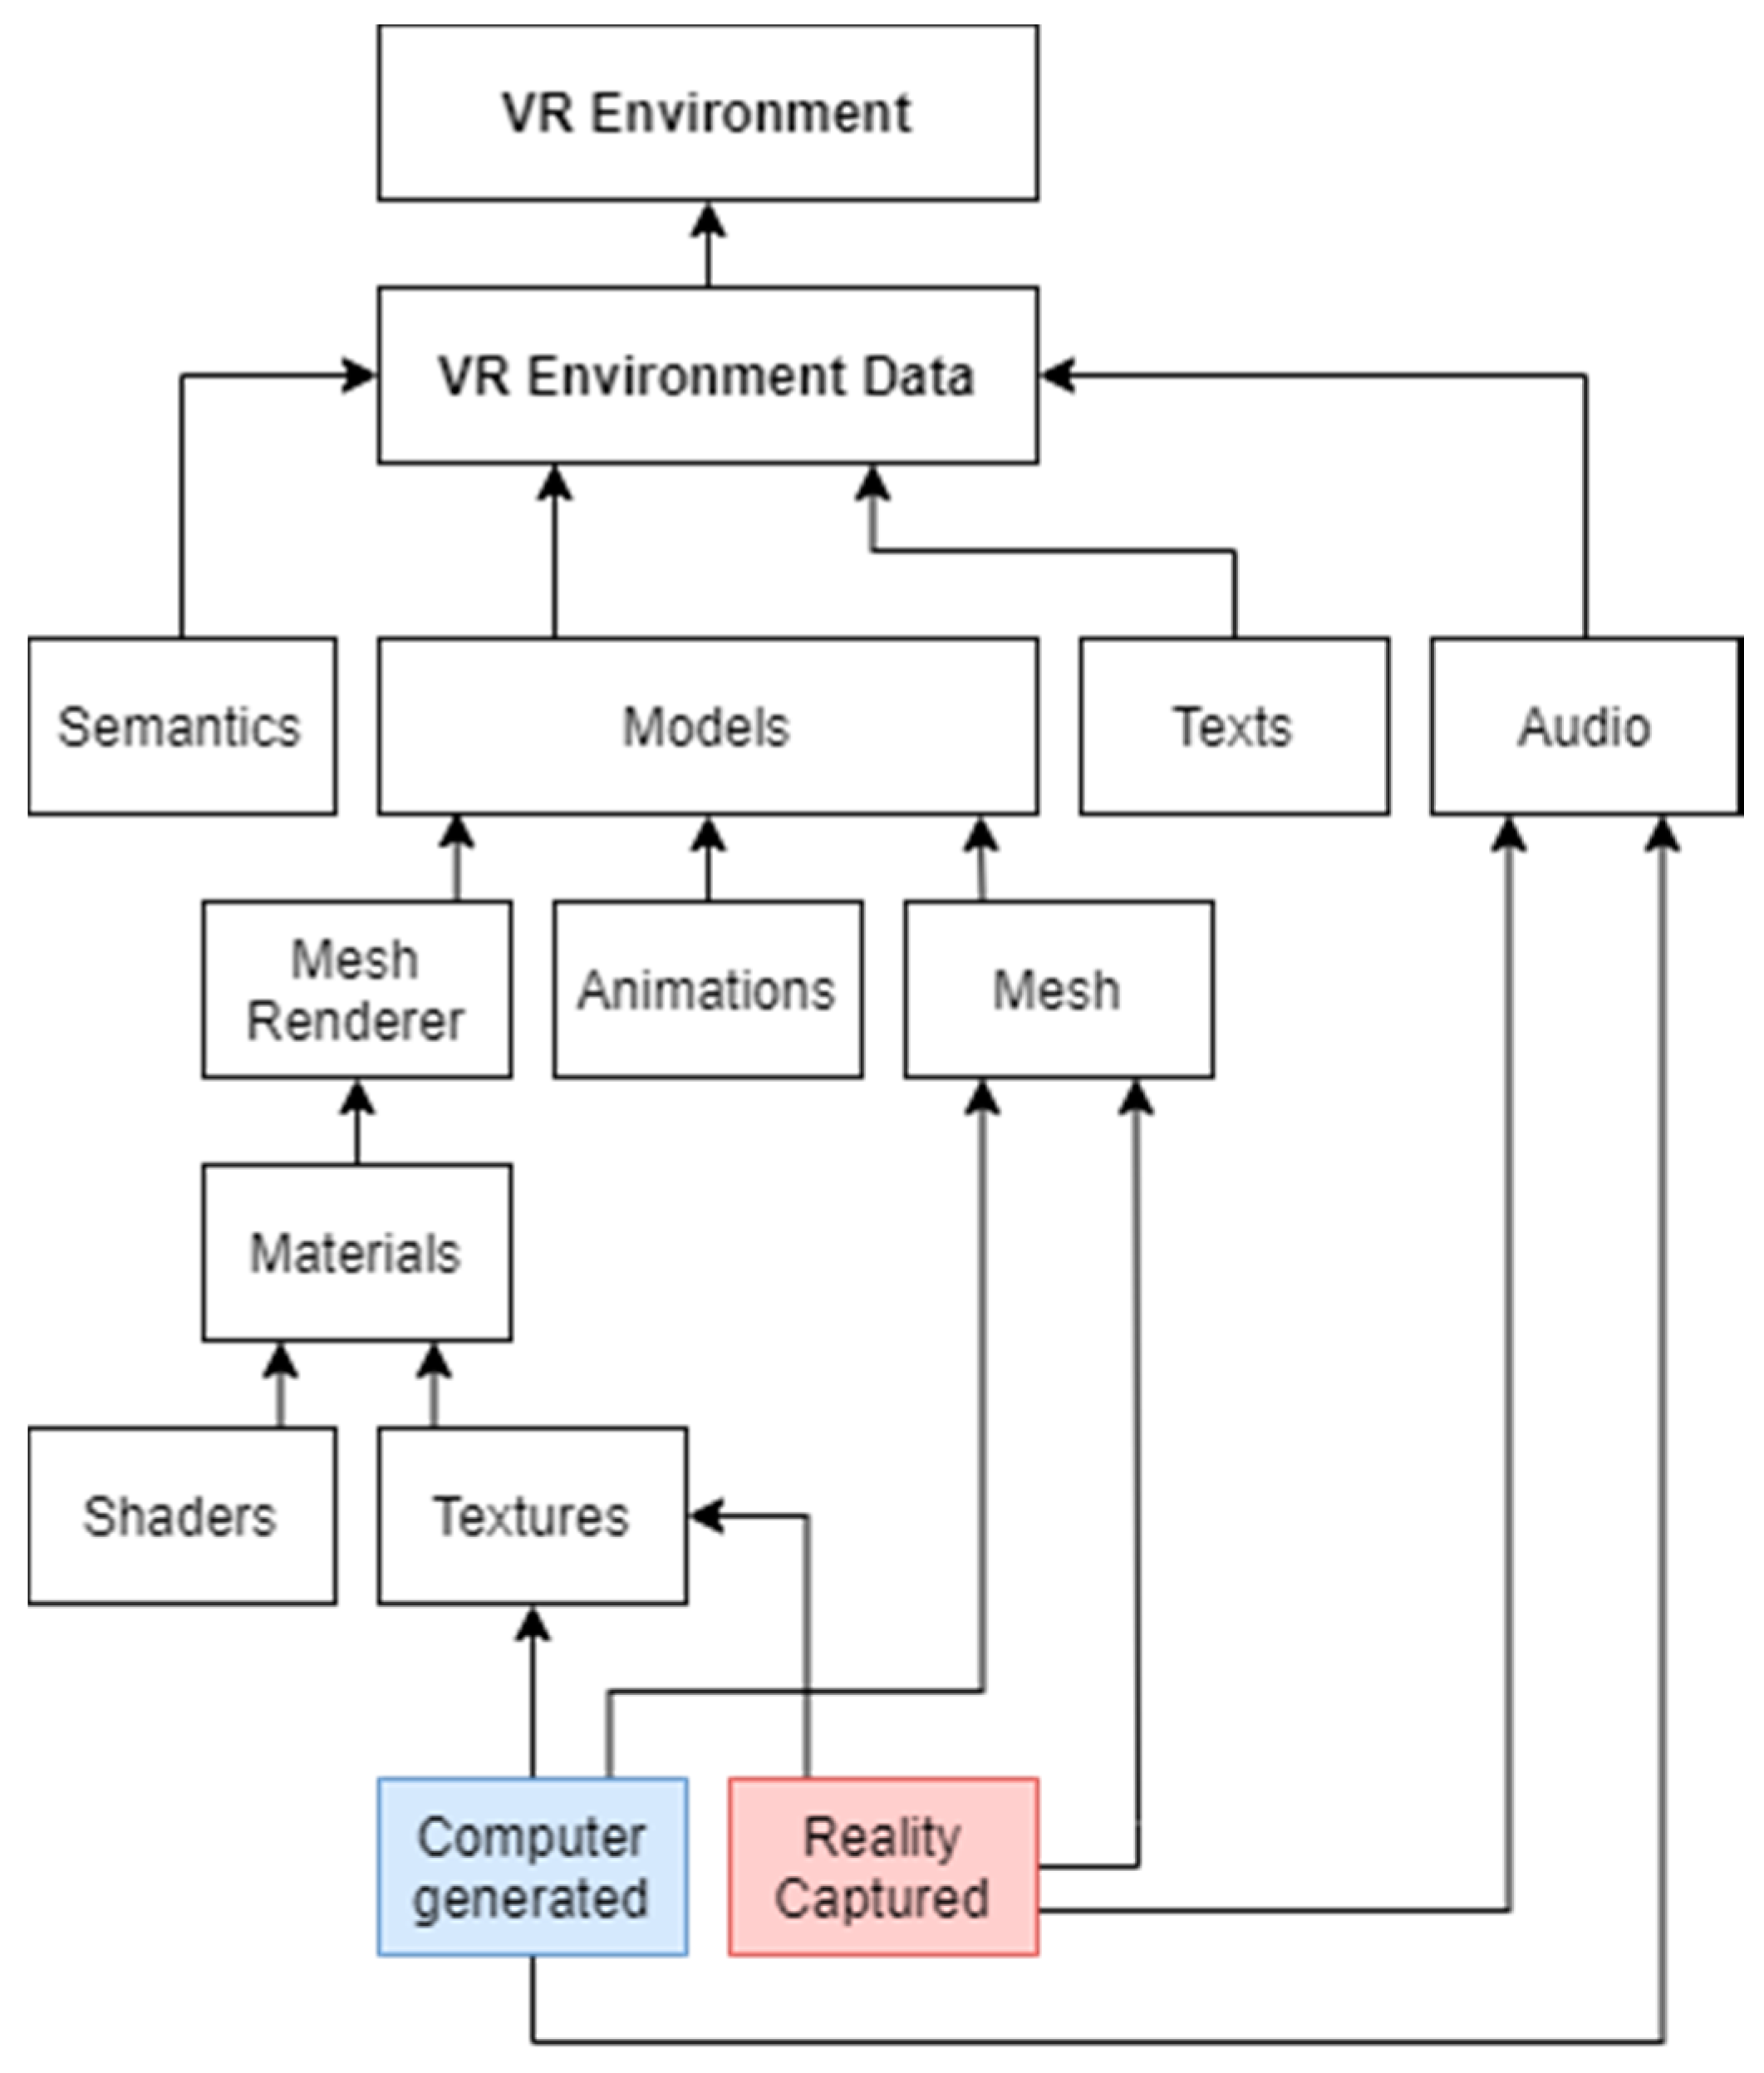
Complementary to the VR-ready mesh acquired, several resources were used to populate all the environment data together which the VR environment is built upon. Four types of data were used: 3D models, texts, audio, and semantics. To supplement the main 3D captured elements that were either missing or inadequate, some models were curated or designed. This aimed to increase the authenticity and realism of the environment regarding an immersive experience for the user [85]. Additional models can be generated by computer graphics software or by similar capture as described in the previous section.
The data populating the prototype is represented in Figure 8 that reads from top to bottom. We link each level to its subpart and highlight the influence of reality capture against computer-generation in the collection of these datasets.
We note that textures, meshes, and audio can be the product of both computer generation techniques as well as reality capture. These are then combined and extended through other elements (e.g., semantics) to create VR-ready environment data.
4.4. Virtual Reality Application Design
The development of a virtual reality application for cultural heritage tourism is not a trivial task. From the acquisition of data to the interaction the user has upon the virtual environment, there is an intricate relationship between the development phases that plays an important role in the user experience.
We recall from the needs analysis that a certain authenticity and quality is expected for the tourism environment [85]. Even more, user-centric designs relate to a meaningful gameplay for the user [24], and distractions such as bugs must be avoided [31]. Three main subjects result from these needs: the VR environment, the user interaction, and the optimization.
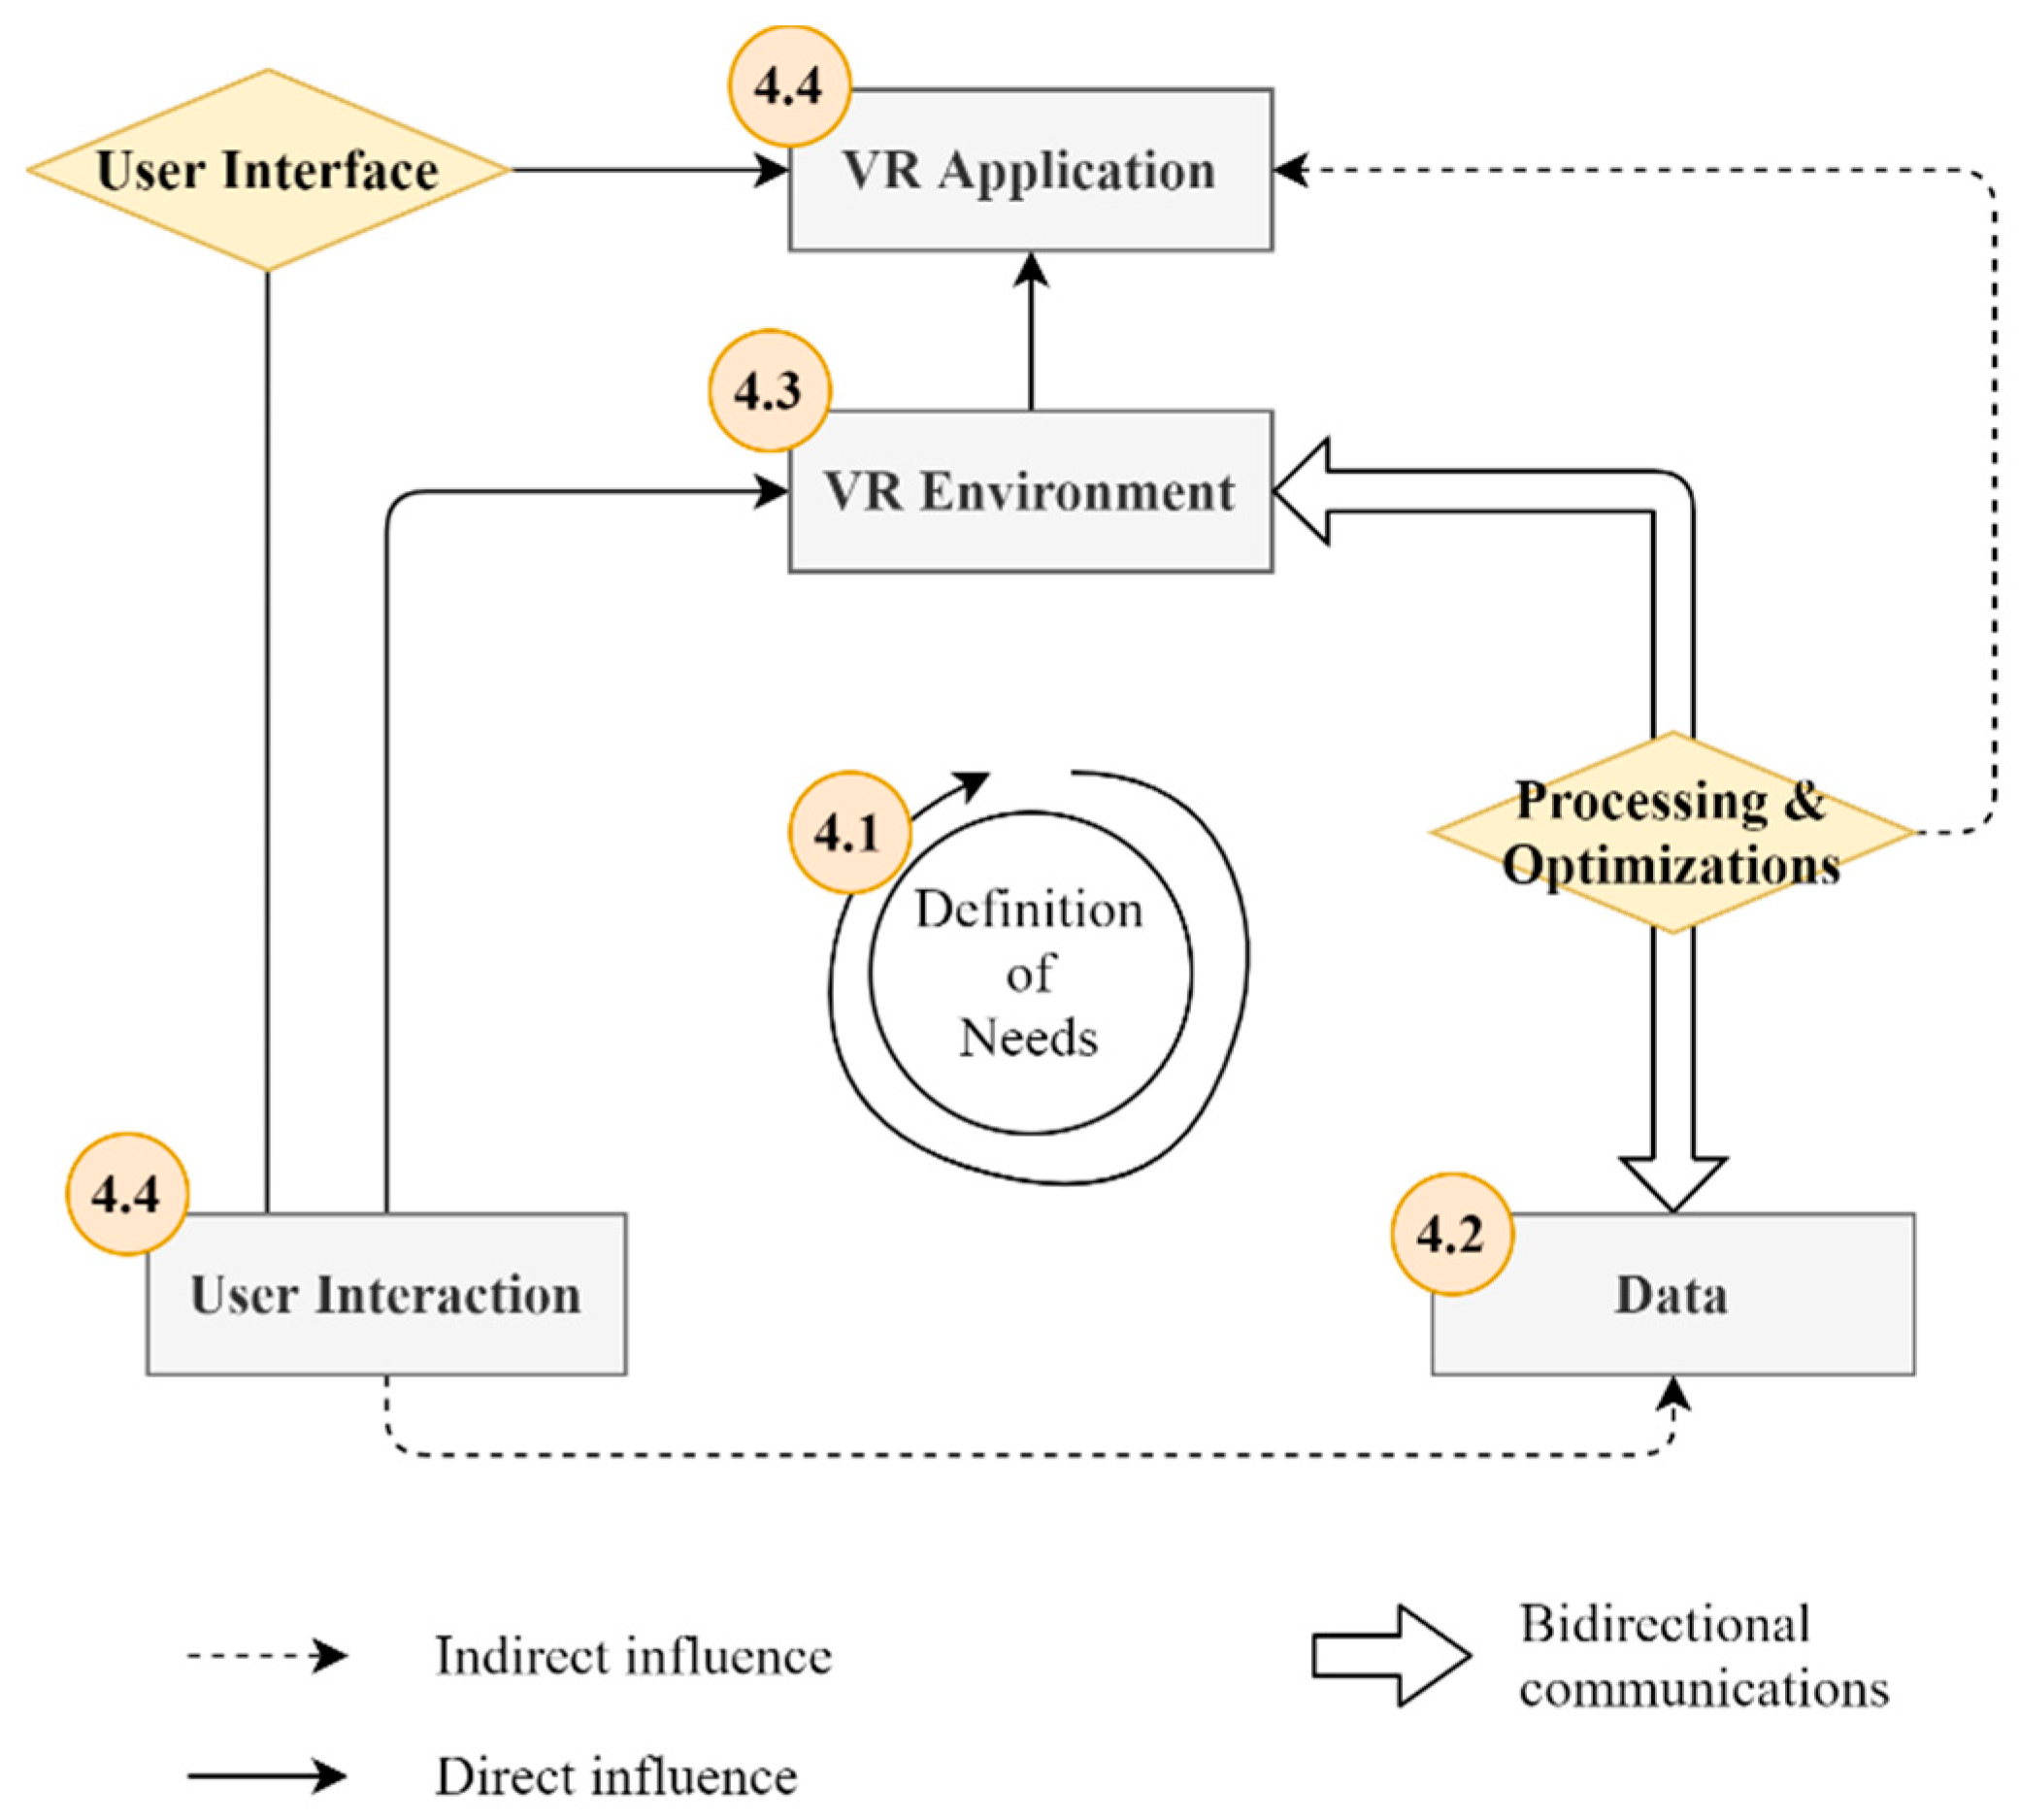
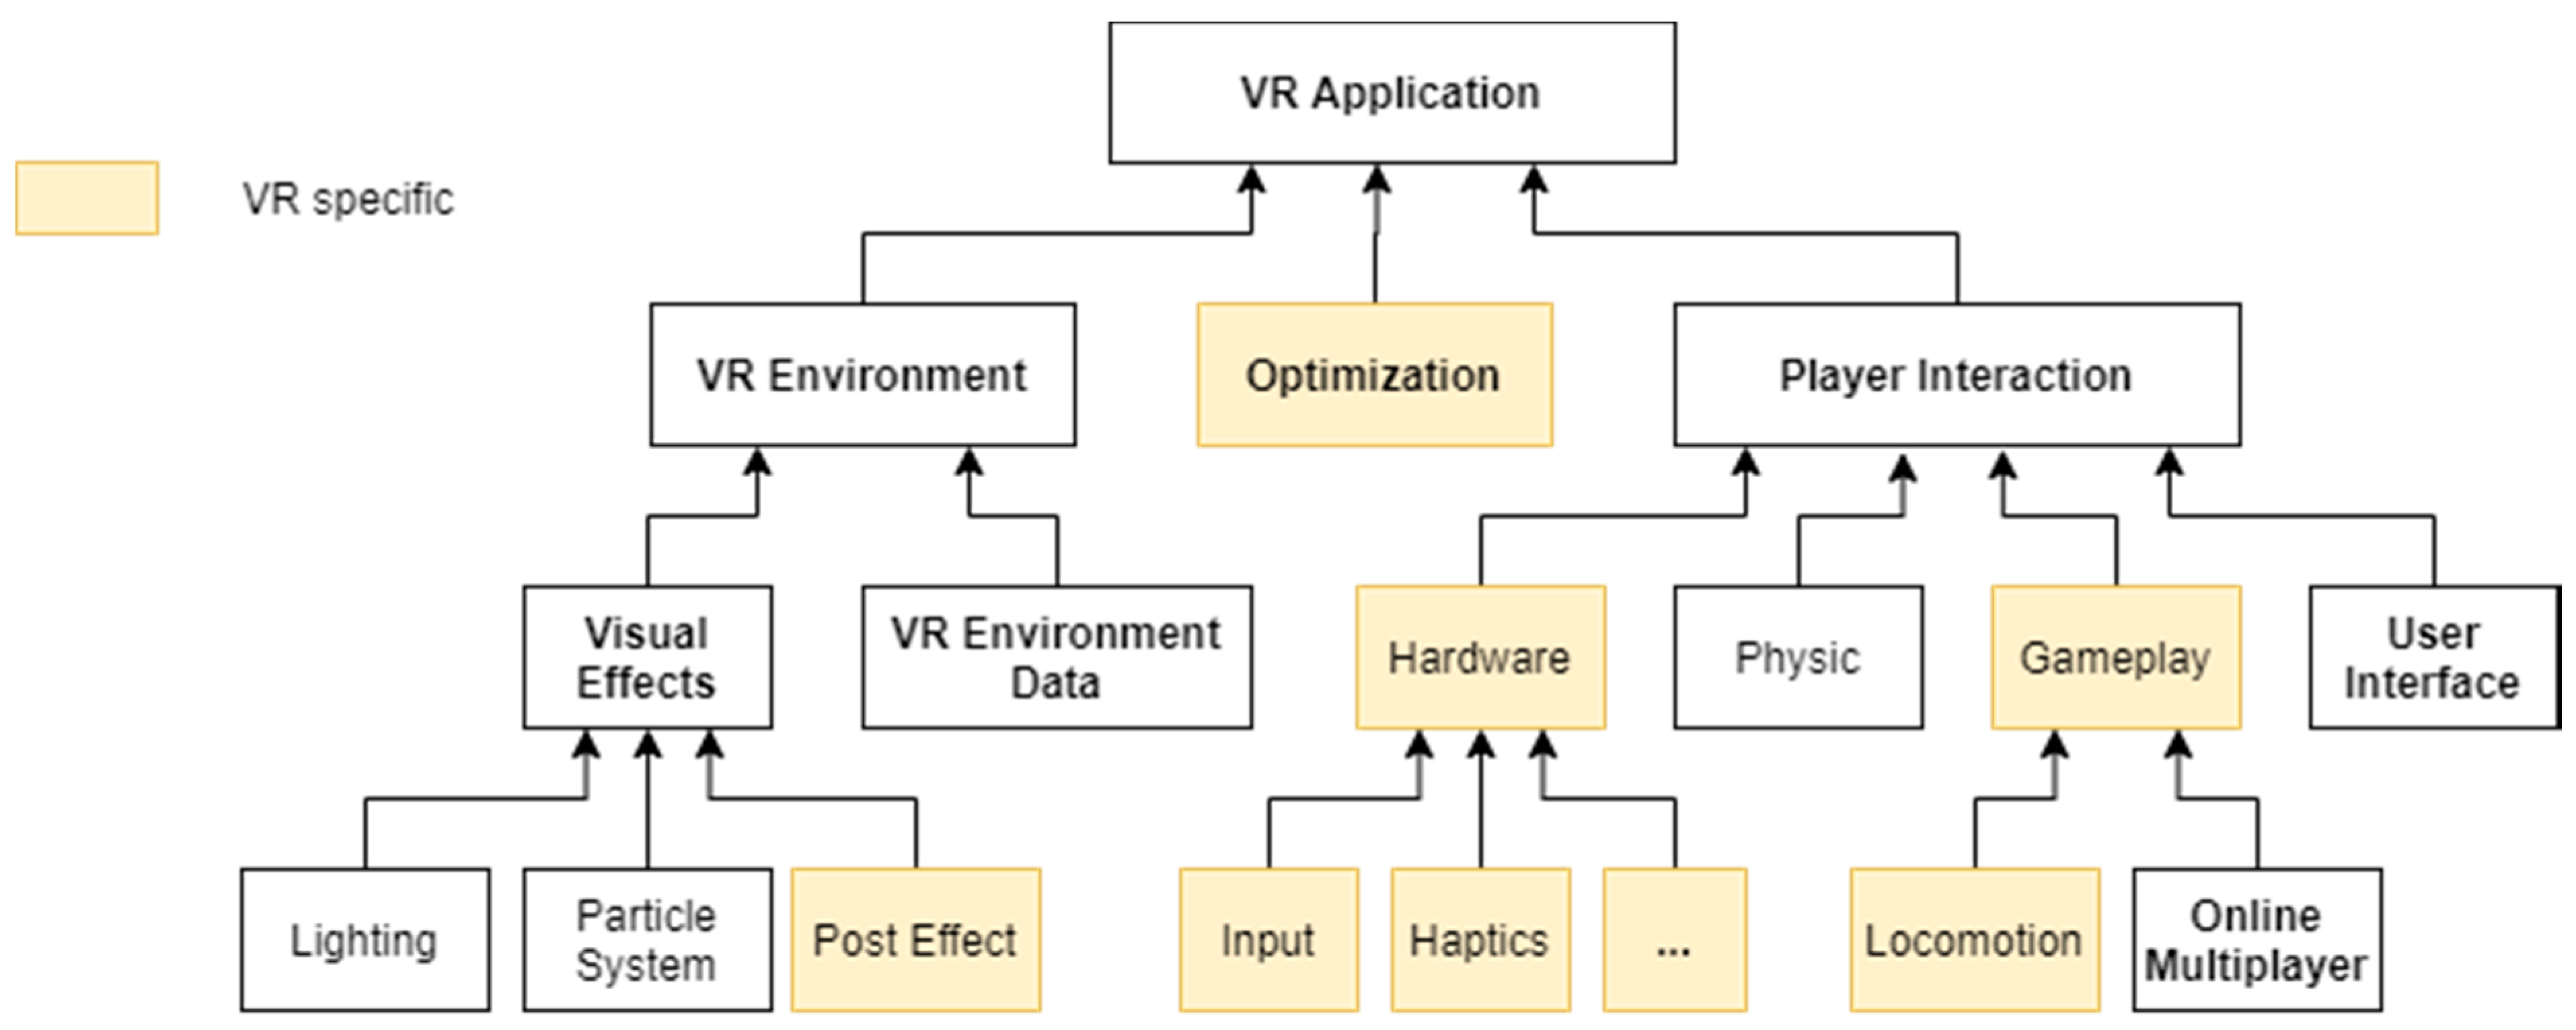
Based on the needs analysis, we propose the methodology illustrated in Figure 9 for a VR application design. It extends the VR environment data diagram (Figure 8) and integrates it into the design of the VR application. The centric aspect is highlighted in the user interaction subpart.
It is noteworthy that the suggested methodology is also relevant for a regular (non-VR) 3D application. Therefore, the VR specific elements present in the design of the application are highlighted in the diagram.
The VR environment is composed of the VR environment data described in Figure 8 and the “Visual Effects” component. Visual effects encompasses a set of techniques meant to increase the visual fidelity of the scene such as the realistic shadow, particle system, color correction, and other types of post-processing effects.
Concerning the user interaction, VR specific elements are mainly concerned with how the user can trigger an input with its respective hardware such as the VR headset. Simple inputs can be perceived from a particular user’s behavior, such as their gaze. However, modern headsets are now endowed with controllers that are tracked in space to simulates the presence of the hand in the virtual environment. It can be used to trigger an input with the controller’s buttons. It is the “gameplay” that will define what the game response is from the user’s input. For example, grabbing an object if the user is pressing on the grip button while his hand is near that object.
5. Experiments and Results
We remind the readers that we follow the proposed methodology in Section 4, which is condensed in Figure 10. As such, we present in the following sub-sections a direct use case illustrating the methodology steps by step.
5.1. Expressed Needs
After a synthetic approach, we propose the decomposition of the arising needs expressed by the castle of Jehay representatives in two parts, “keep a track” and “keep-alive”. Indeed, while the first aspect is related to the functionalities of the information system, the second concerns the needs regarding the way a visitor could interact with the captured data. Here is an extract of gathered needs, related to the work of M. Treffer [86], through multiple exchanges.
Keep a track:
- The different parts of the castle must be distinguishable. One must be able to identify the different rooms and walls, as well as smaller elements such as windows, doors, and chimneys.
- Materials and their origins must be recognized for all surfaces of the castle.
- The period must be identified for each part of the castle.
- Embedded information is required for the building construction as well as for the building block.
- The information system must be expendable to supplement with other parts of the domain such as the castle’s garden.
Keep-alive:
- One must be able to explore a 3D digital reconstruction.
- The solution should allow visitors to experience an immersive reality at a given point in time.
- The different stages of renovation of the castle can be displayed, and one can observe the evolution of the site as well as the construction of some specific elements.
- It is possible to interact with several objects such as doors.
- Visitors should be guided through an intuitive path definition depending on their level of experience.
- The level of realism and texture is important for tourists.
- The solution should allow multiple visitors at once in a common scene.
These are combined and serve as a basis to establish a 3D survey regarding the proposed framework in Section 4, applied the following sub-section.
5.2. The 3D Acquisition
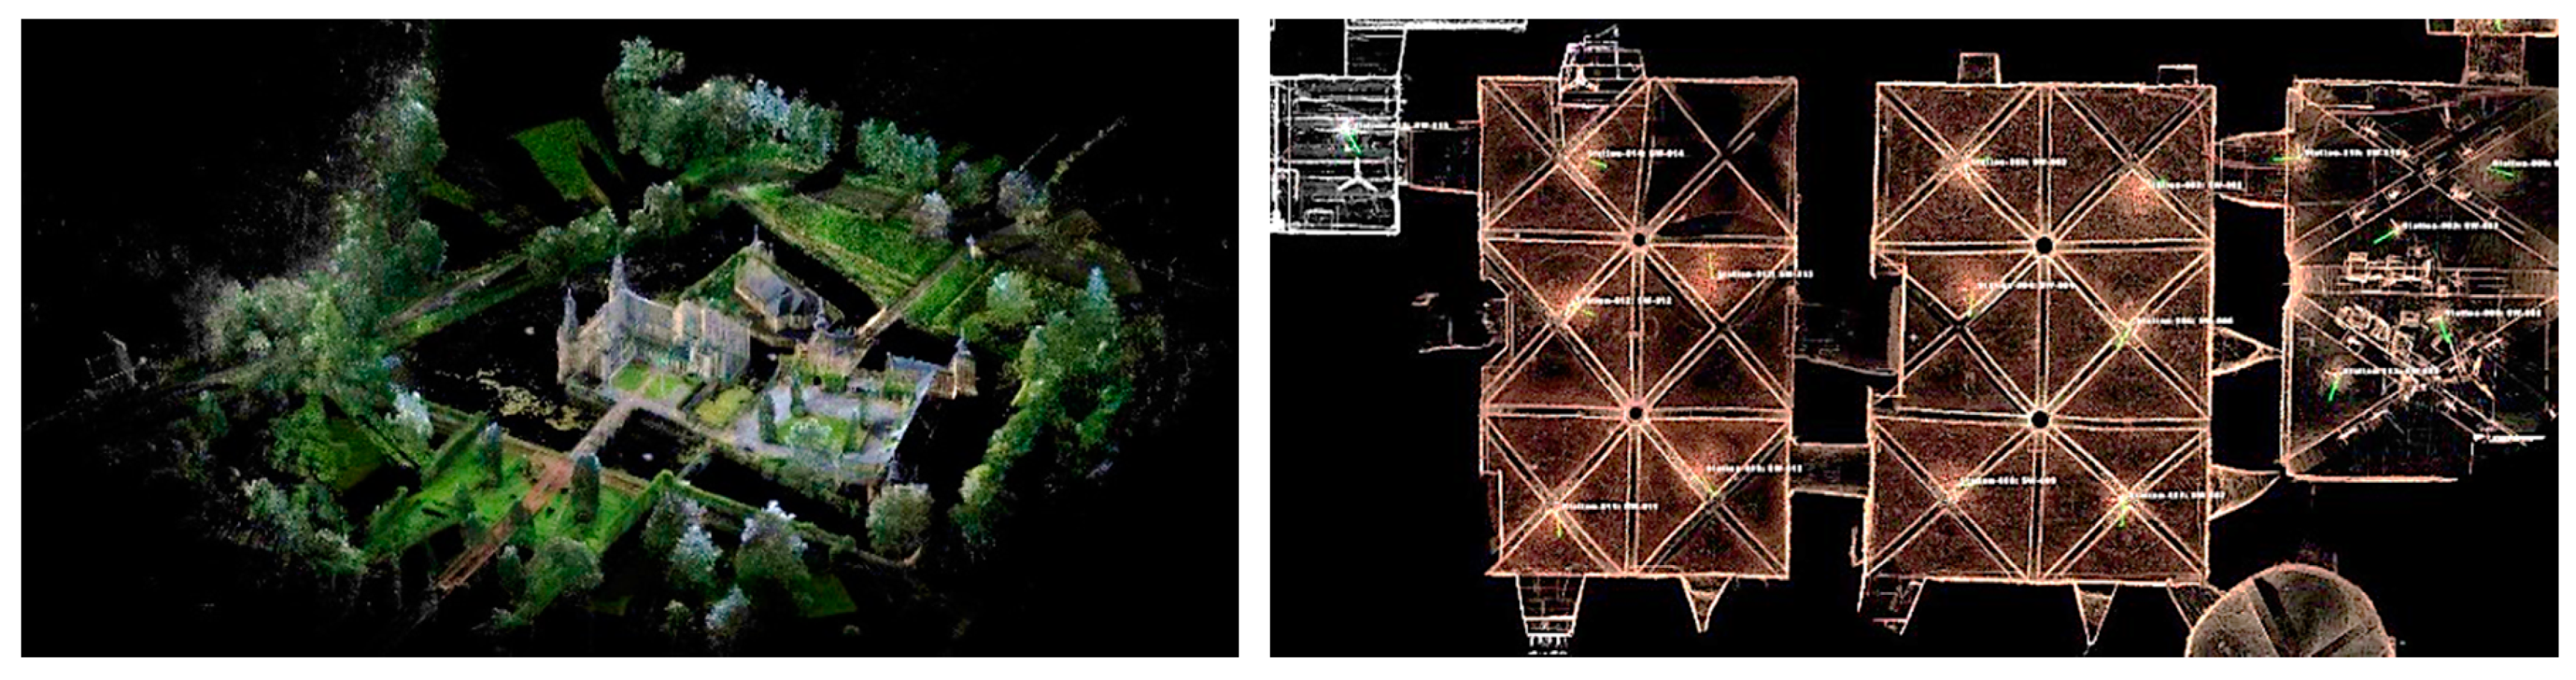
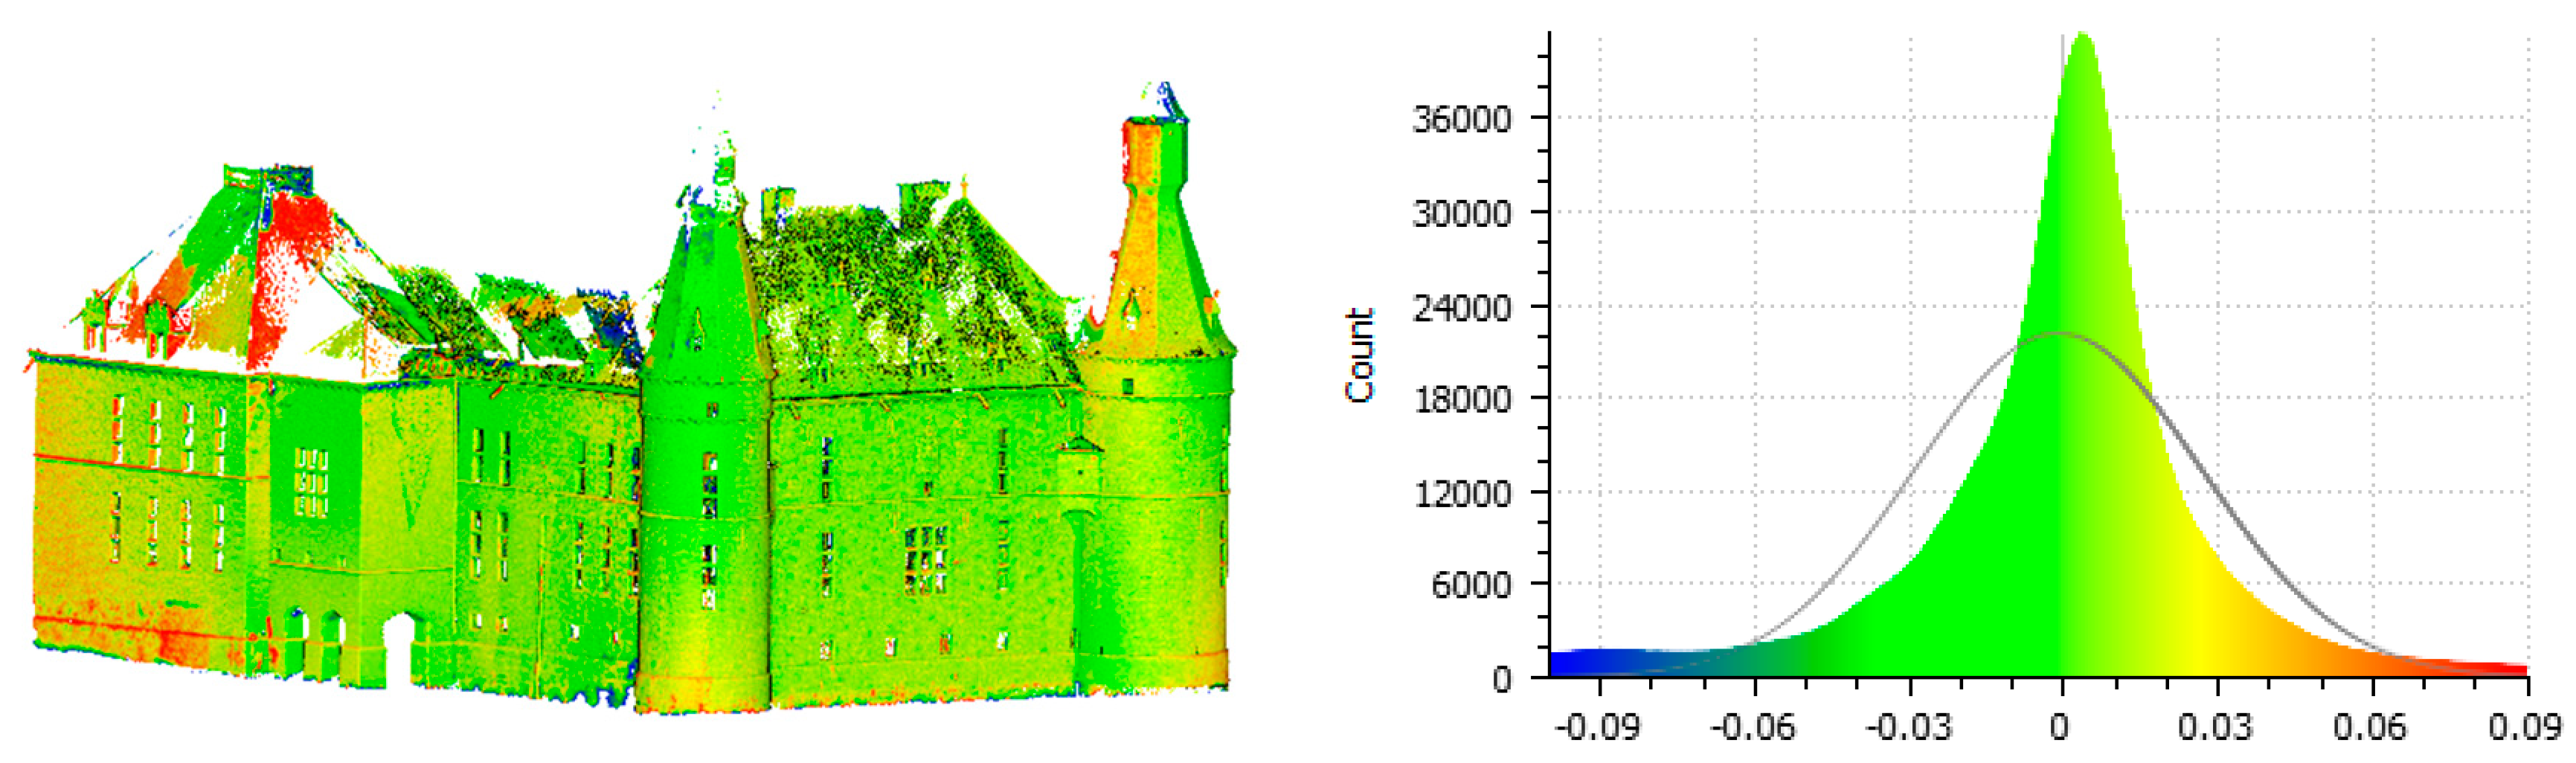
A total of 156 terrestrial laser scanner (TLS) scan stations were made (61 outside, 95 indoors), each composed of an average of 150 million points. A total of 17 total stations (TS) and 1847 images in seven exposures for high dynamic range capture and fusion were taken. The registration of the different entities was made using ground control points (GCPs) from 575 targets (141 outside and 434 indoor), registered using the total station Leica TCRP1200 in the global system ETRS89 Belgian Lambert 2008, by indirect georeferencing utilizing a GNSS receiver Trimble R10 in RTK mode. The misalignment between the TLS and photogrammetric reconstructions was assessed by comparing the iterative closest point (ICP) [87] adjustments between the independent registration obtained using TS GCPs only. We obtained a gaussian of 1 mm permitting the validation of the registration. The standard deviation for the castle’s facade is 21 mm as only 202 photos were used for the initial reconstruction. Thus, low-overlapping areas with a high incidence angle such as the roof (Figure 11) impacted the photogrammetric reconstruction’s precision.
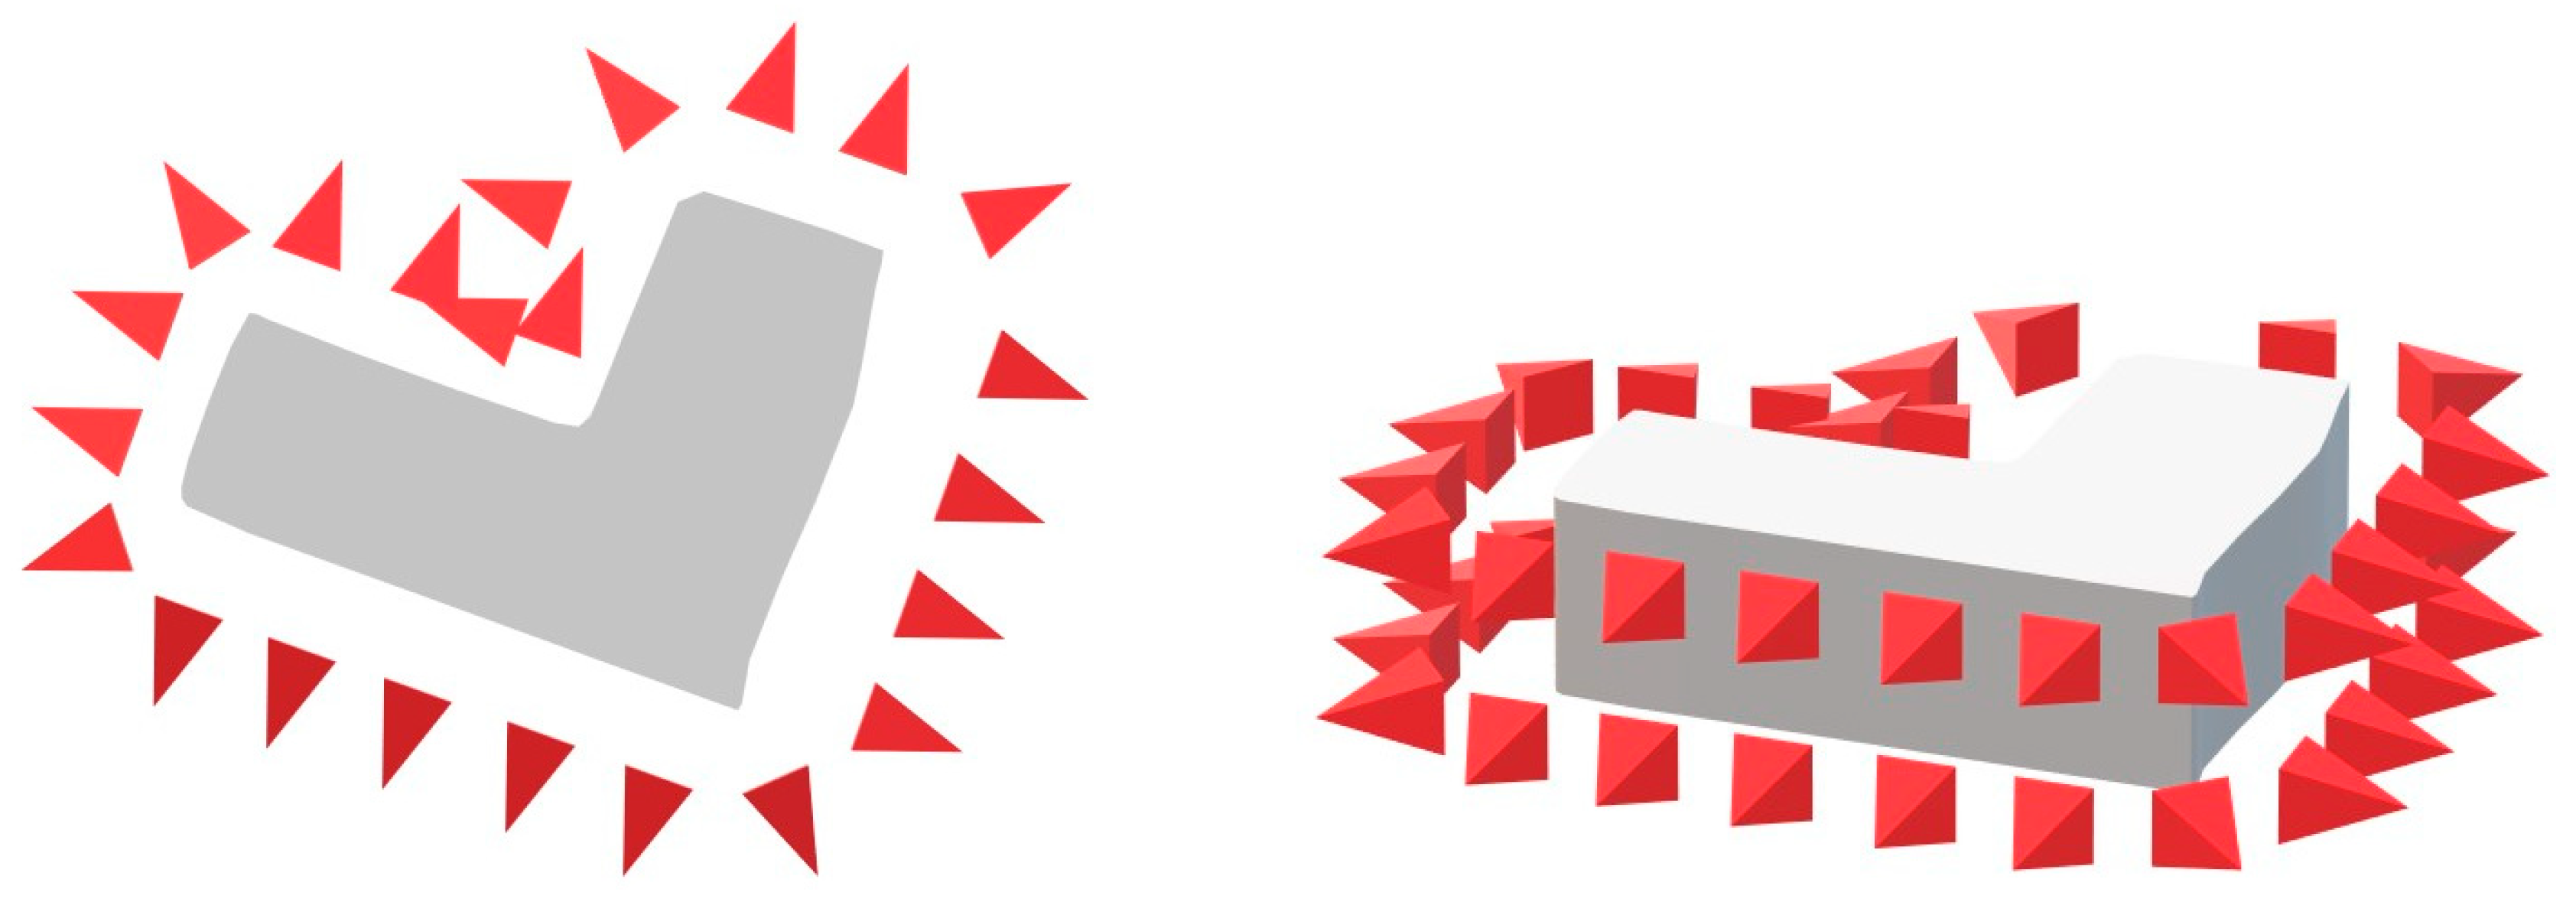
To best design a robust photoshoot, it is important to first obtain a global skeleton from a highly overlapping scenario (above 80% lateral, longitudinal, and vertical overlap) as illustrated in Figure 11. The ability to use a platform such as an Unmanned Aerial Vehicle (UAV) would be beneficial if one wants to better manage a globally consistent overlap and resolution adaptation even on roof elements.
From this, we can precisely get to point of interest by “zooming with the feet”, i.e., getting closer to each object of interest from this initial polygonal object progressively (Figure 12). Taking pictures in the best conditions for a robust data acquisition must answer these criteria:
- It is necessary to prefer diffuse lighting of the scene to avoid the coexistence of shadow ranges and areas under direct sunlight (best results are on a cloudy day without shadows);
- Direct illumination can be the source of image saturation if the scene strongly reflects light (shiny materials);
- The shots will be taken with the best resolution of the camera to produce the most accurate 3D model possible (the resolution greatly impact the intended reconstruction precision).
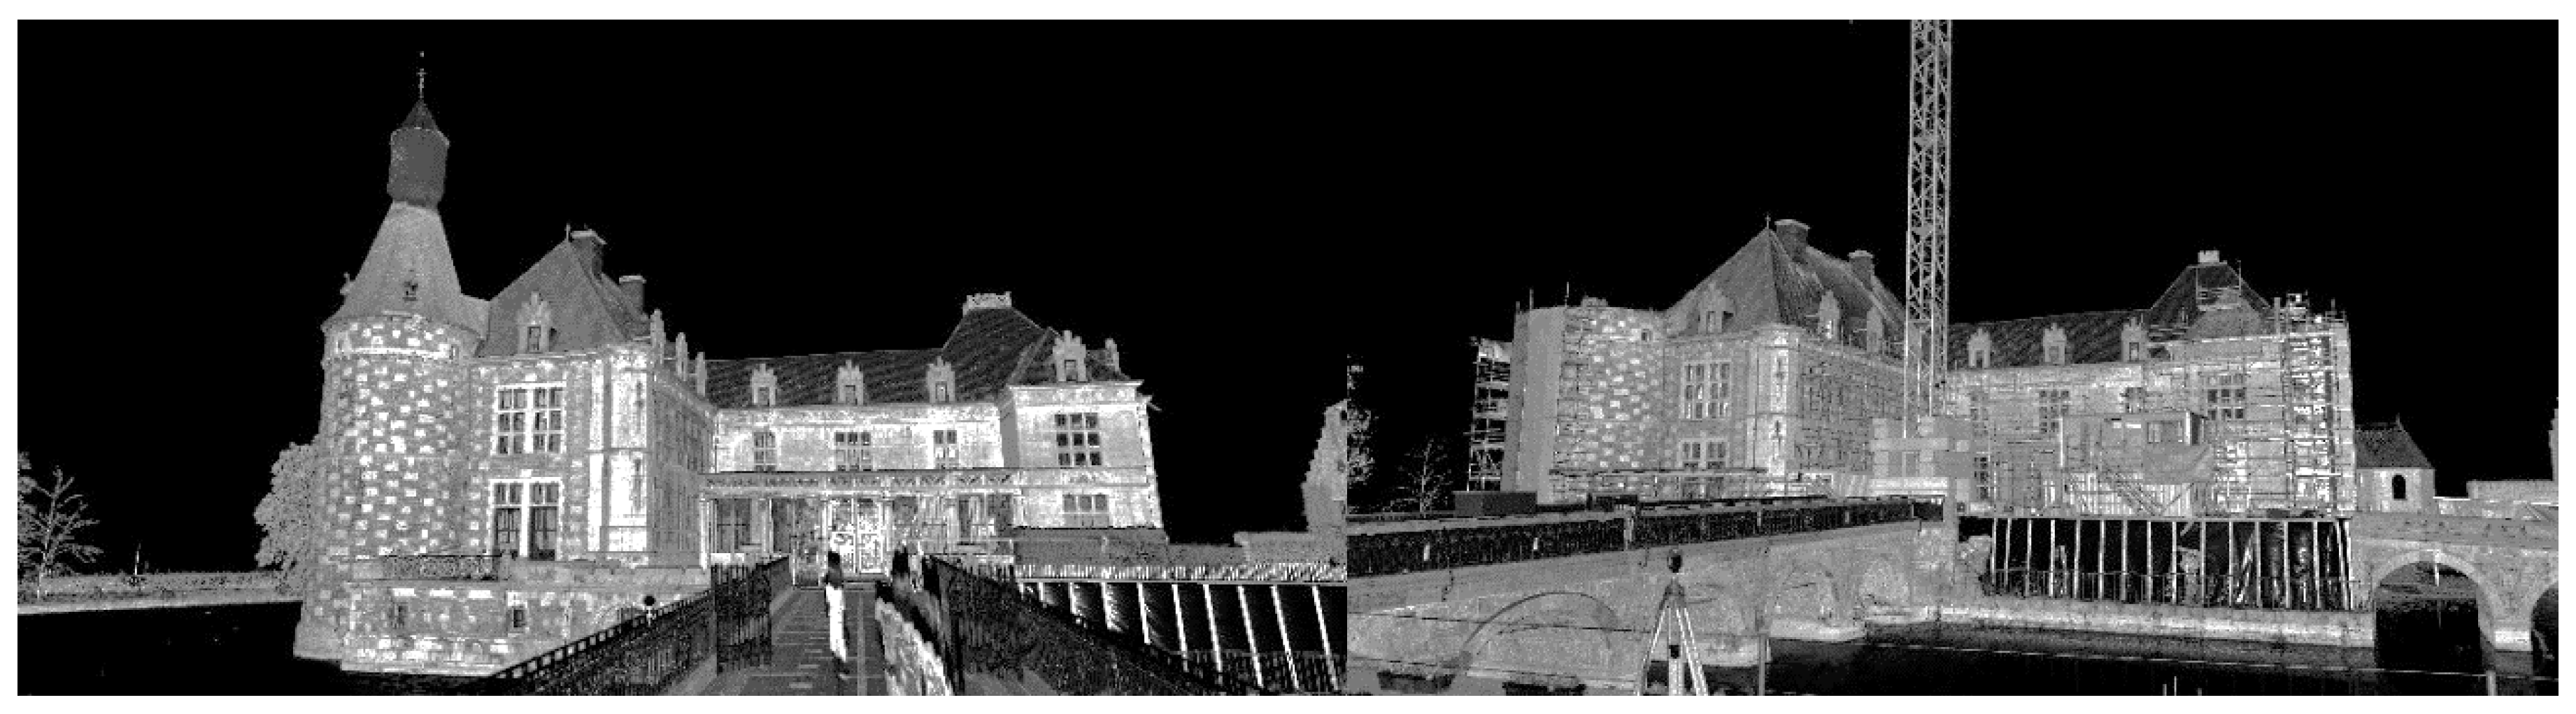
To permit a quick indoor acquisition, we captured the geometry using only the TLS with a nodal-point full-dome overlay on 95 stations using the Canon 5D Mark III full-frame camera for colorization, delivering results such as those presented in Figure 13.
While the approach behind the reconstruction is really interesting, it exceeds the scope of this paper, and we refer the reader to the work of Remondino et al. [64] for more details. We employed the software ContextCapture [66] for the independent modeling of photos (statues, the exterior of the castle) and RealityCapture [74] for converting TLS scans in mesh elements for the indoor parts. The choice toward the software solutions ContextCapture and RealityCapture was made by integrating considerations of automatic efficiency and needed accuracy for the reconstruction, as well as QC possibilities due to the first demand of the contractor. However, open-source solutions exist, such as Meshroom [88], MicMac [89], VisualSfm [69] or even Graphos [90].
5.3. Data Integration (Geometry Optimization and Visualization Optimization)
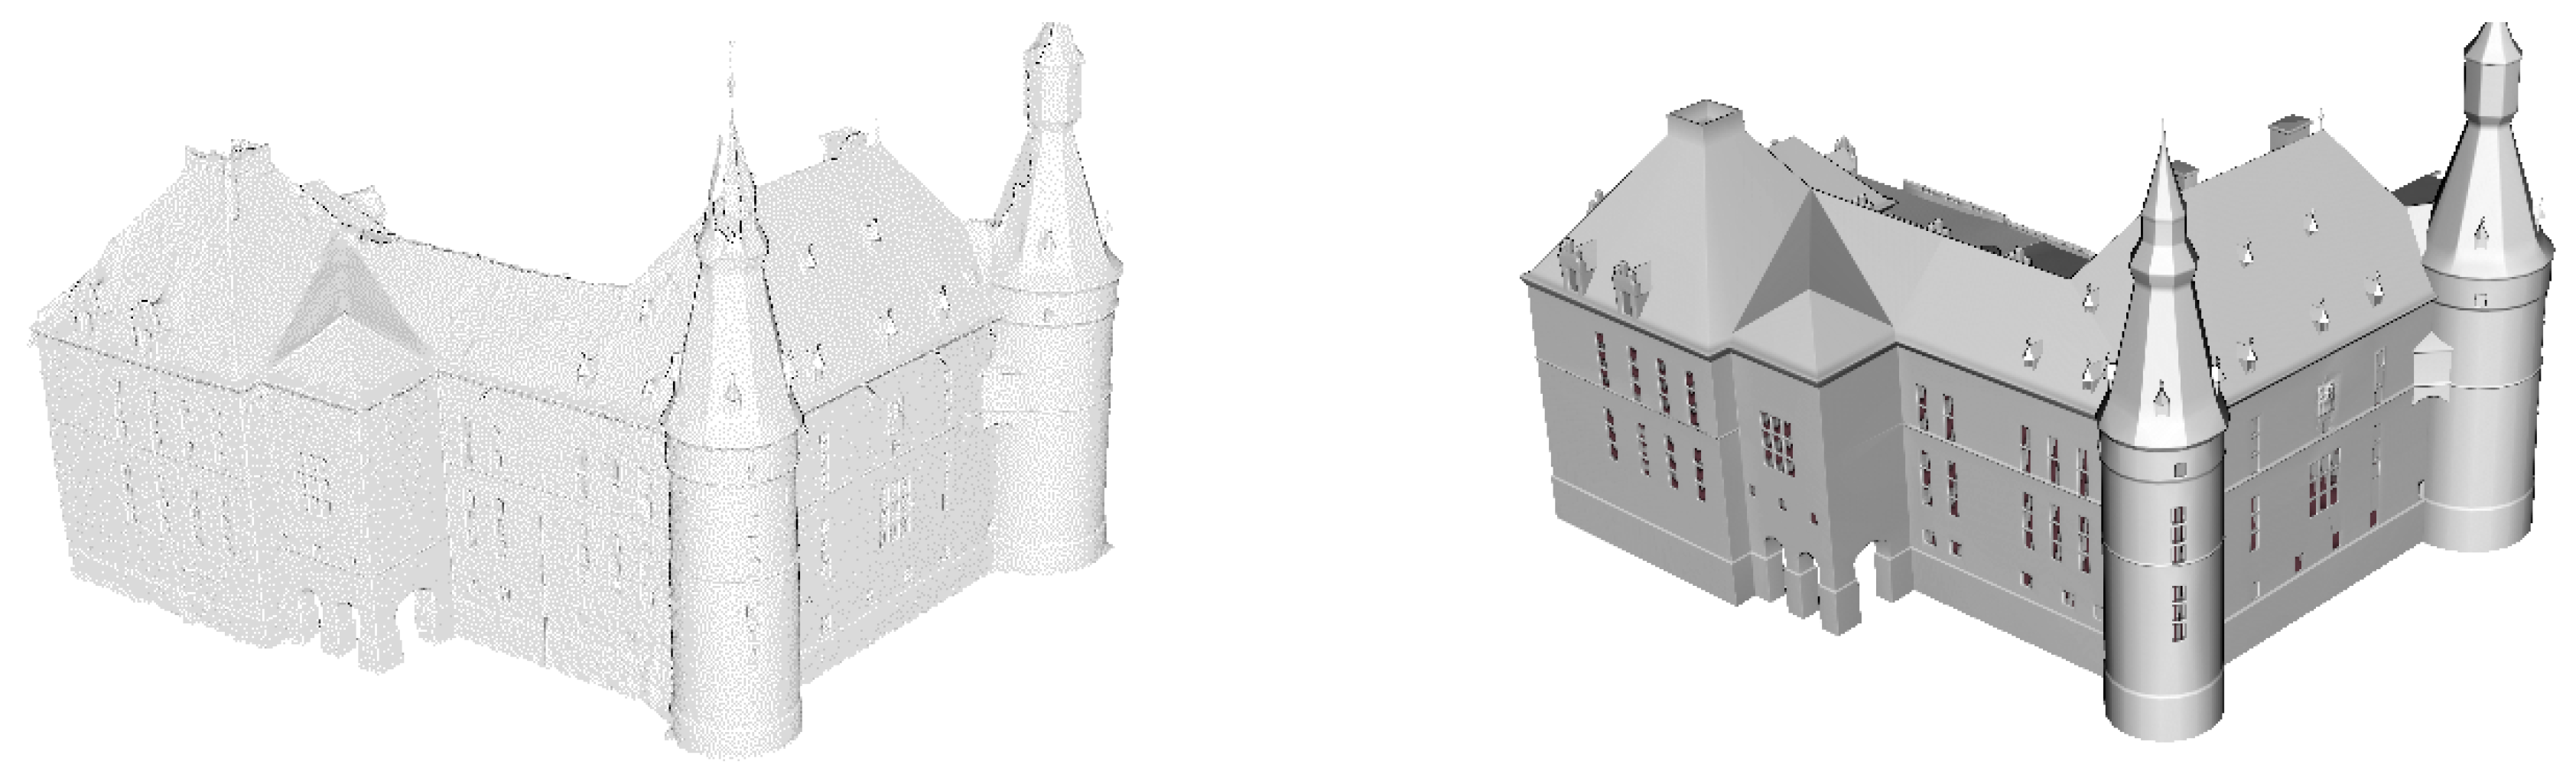
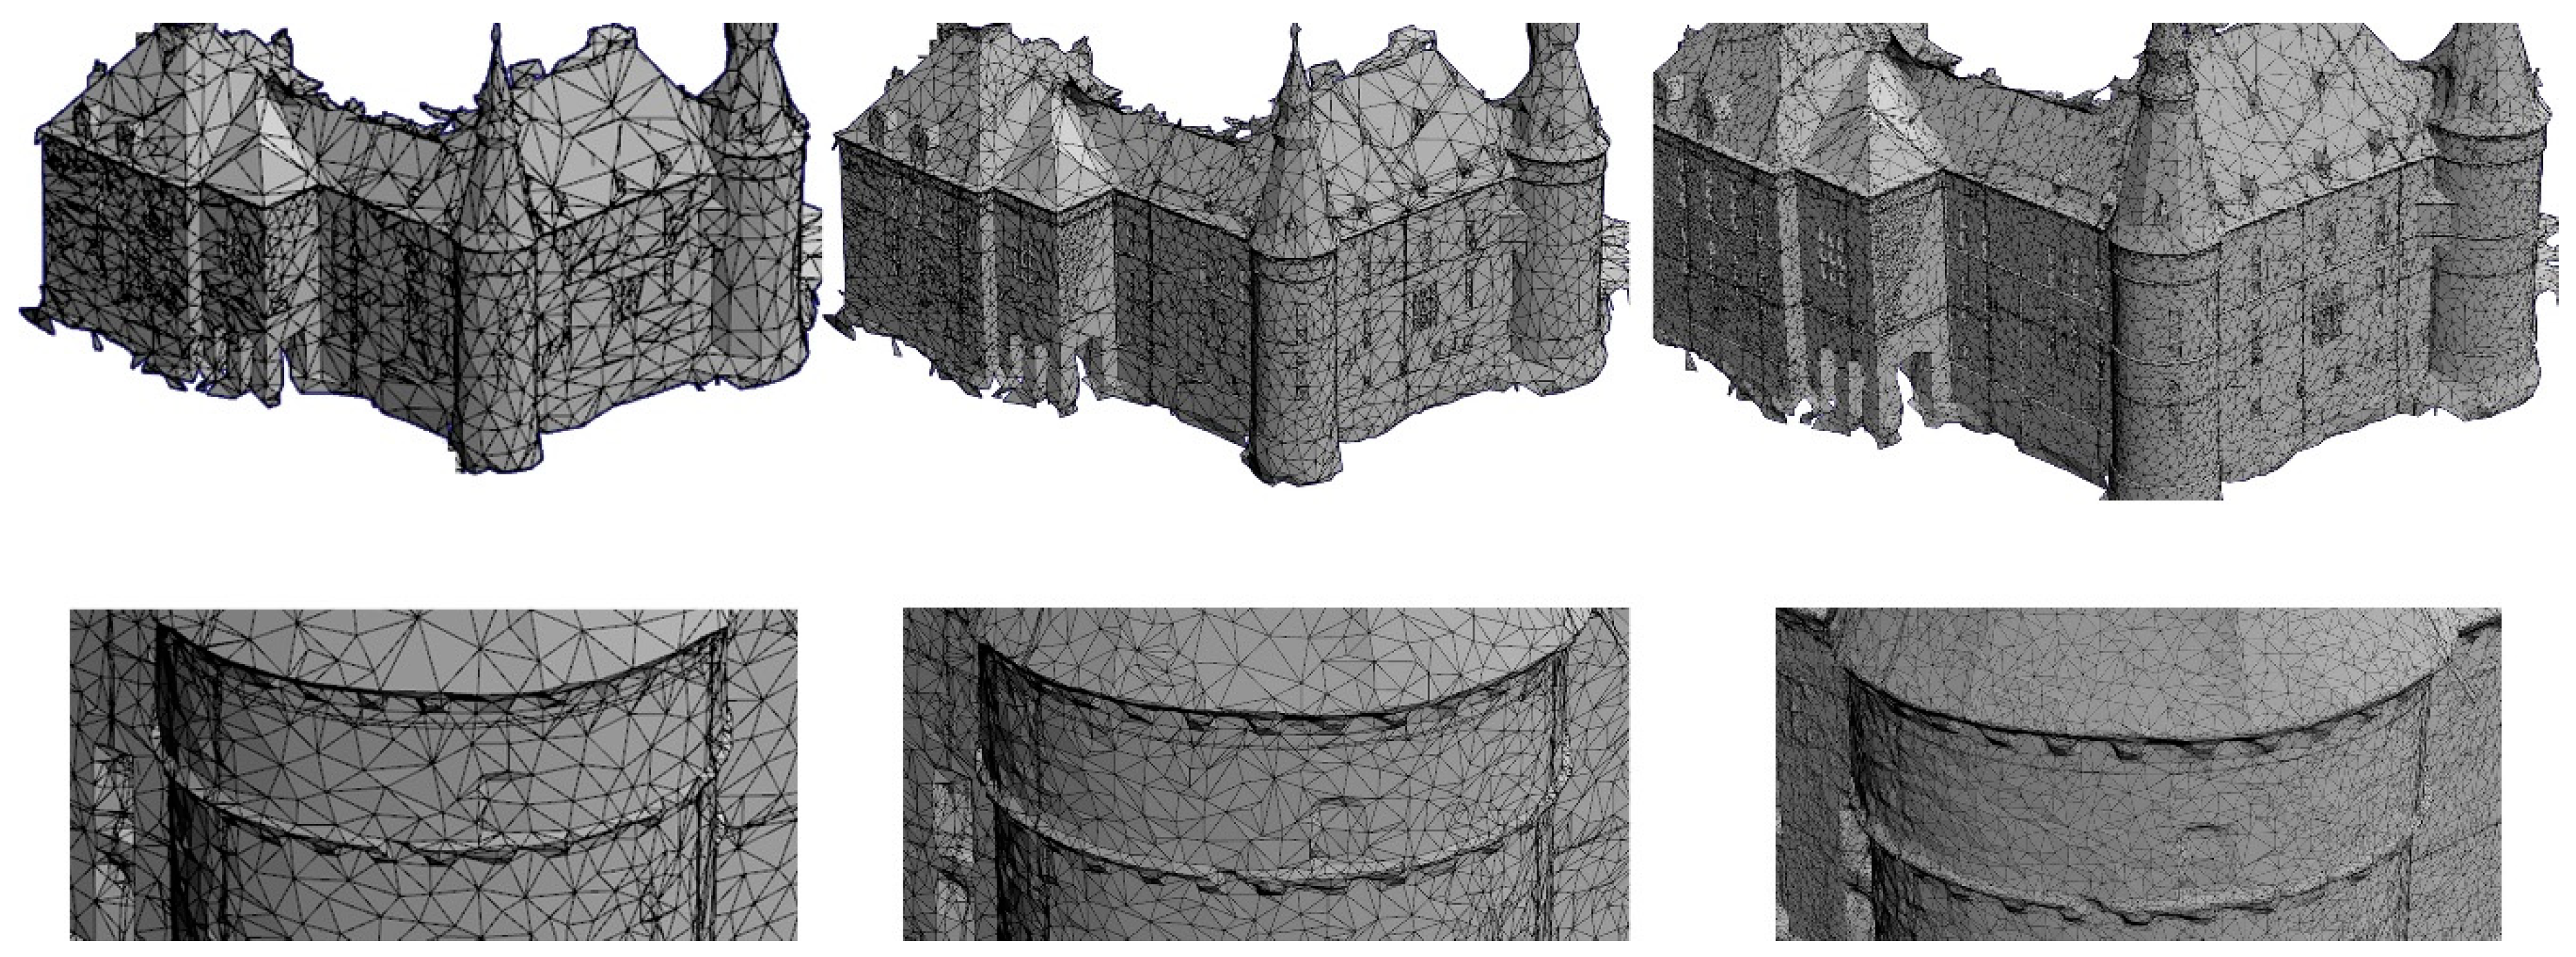
From the 3D data acquisition phase, we generate the initial highly detailed mesh elements: two separate meshes for the floor, and one for the castle exterior. To deploy a ready-to-use virtual site, the data is integrated with a set of tools and techniques to favor a fluid human–machine interaction. As such, the stereoscopic effect requires rendering the scene for each eye. Therefore, a VR environment is prone to latency if too complex. A naïve approach to reduce the complexity of a scene is to downgrade the quality of the visual elements such as the visual effects or the amount of details of the 3D model’s mesh. However, it is often necessary to reduce initial meshes that are often redundant as they do not have an acceptable number of triangles and vertices. Thus, the obtained meshes are down-sampled using a quadric-based edge collapse decimation approach (with texture) as described in [91] and implemented in MeshLab. It permits the reduction in the exterior of the castle from 20 million triangles to 53,000 (Figure 14) without noticeable effects on the rendering quality for users.
As for the indoor mesh we extracted with RealityCapture [74], three million triangle mesh elements per floor were used, simplified with the same quadric-based edge collapse decimation approach, to aim for 50,000 triangles per floor at the lower Level of Detail (LoD) level.
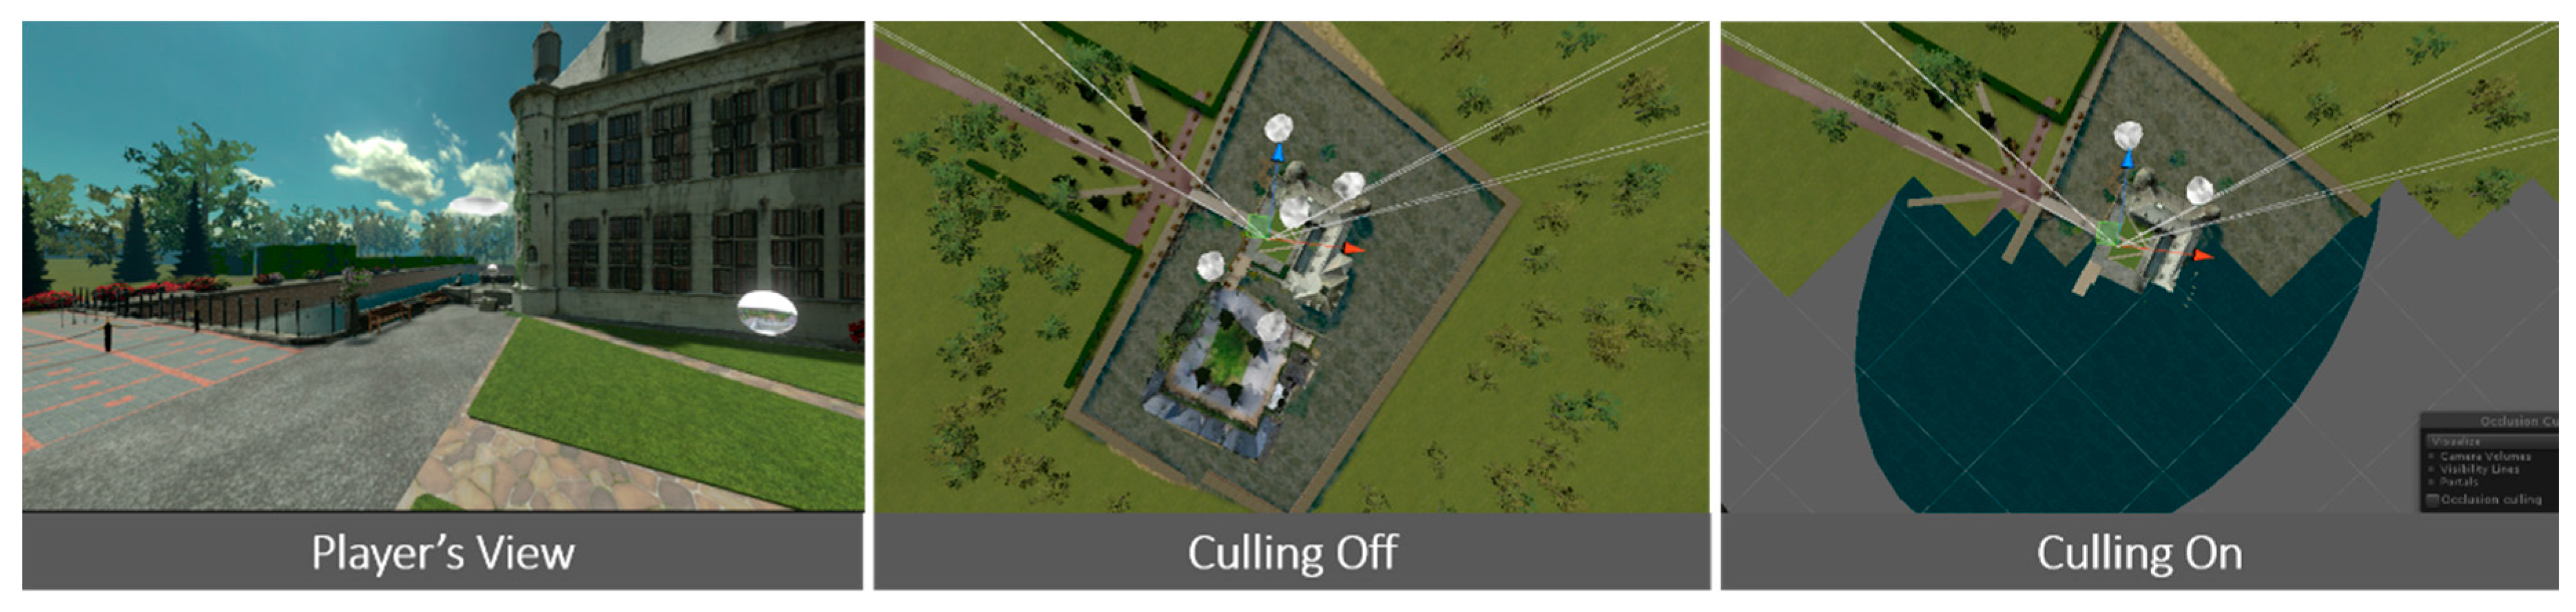
Both the indoor and outdoor captured environments of the castle of Jehay are integrated into the game engine Unity [92]. This implicit outdoor–indoor space partition is leveraged through our LoD strategy described in Section 5.3.5. As such, the entire castle is separated into two scenes: the interior space and the exterior space, each further refined and calling different mesh complexities ranging between the initial high-polygon meshes and the lowest levels. This is then used for automated occlusion culling with frustum culling to ensure a stable framerate (illustrated in Figure 15., see Section 5.3.4).
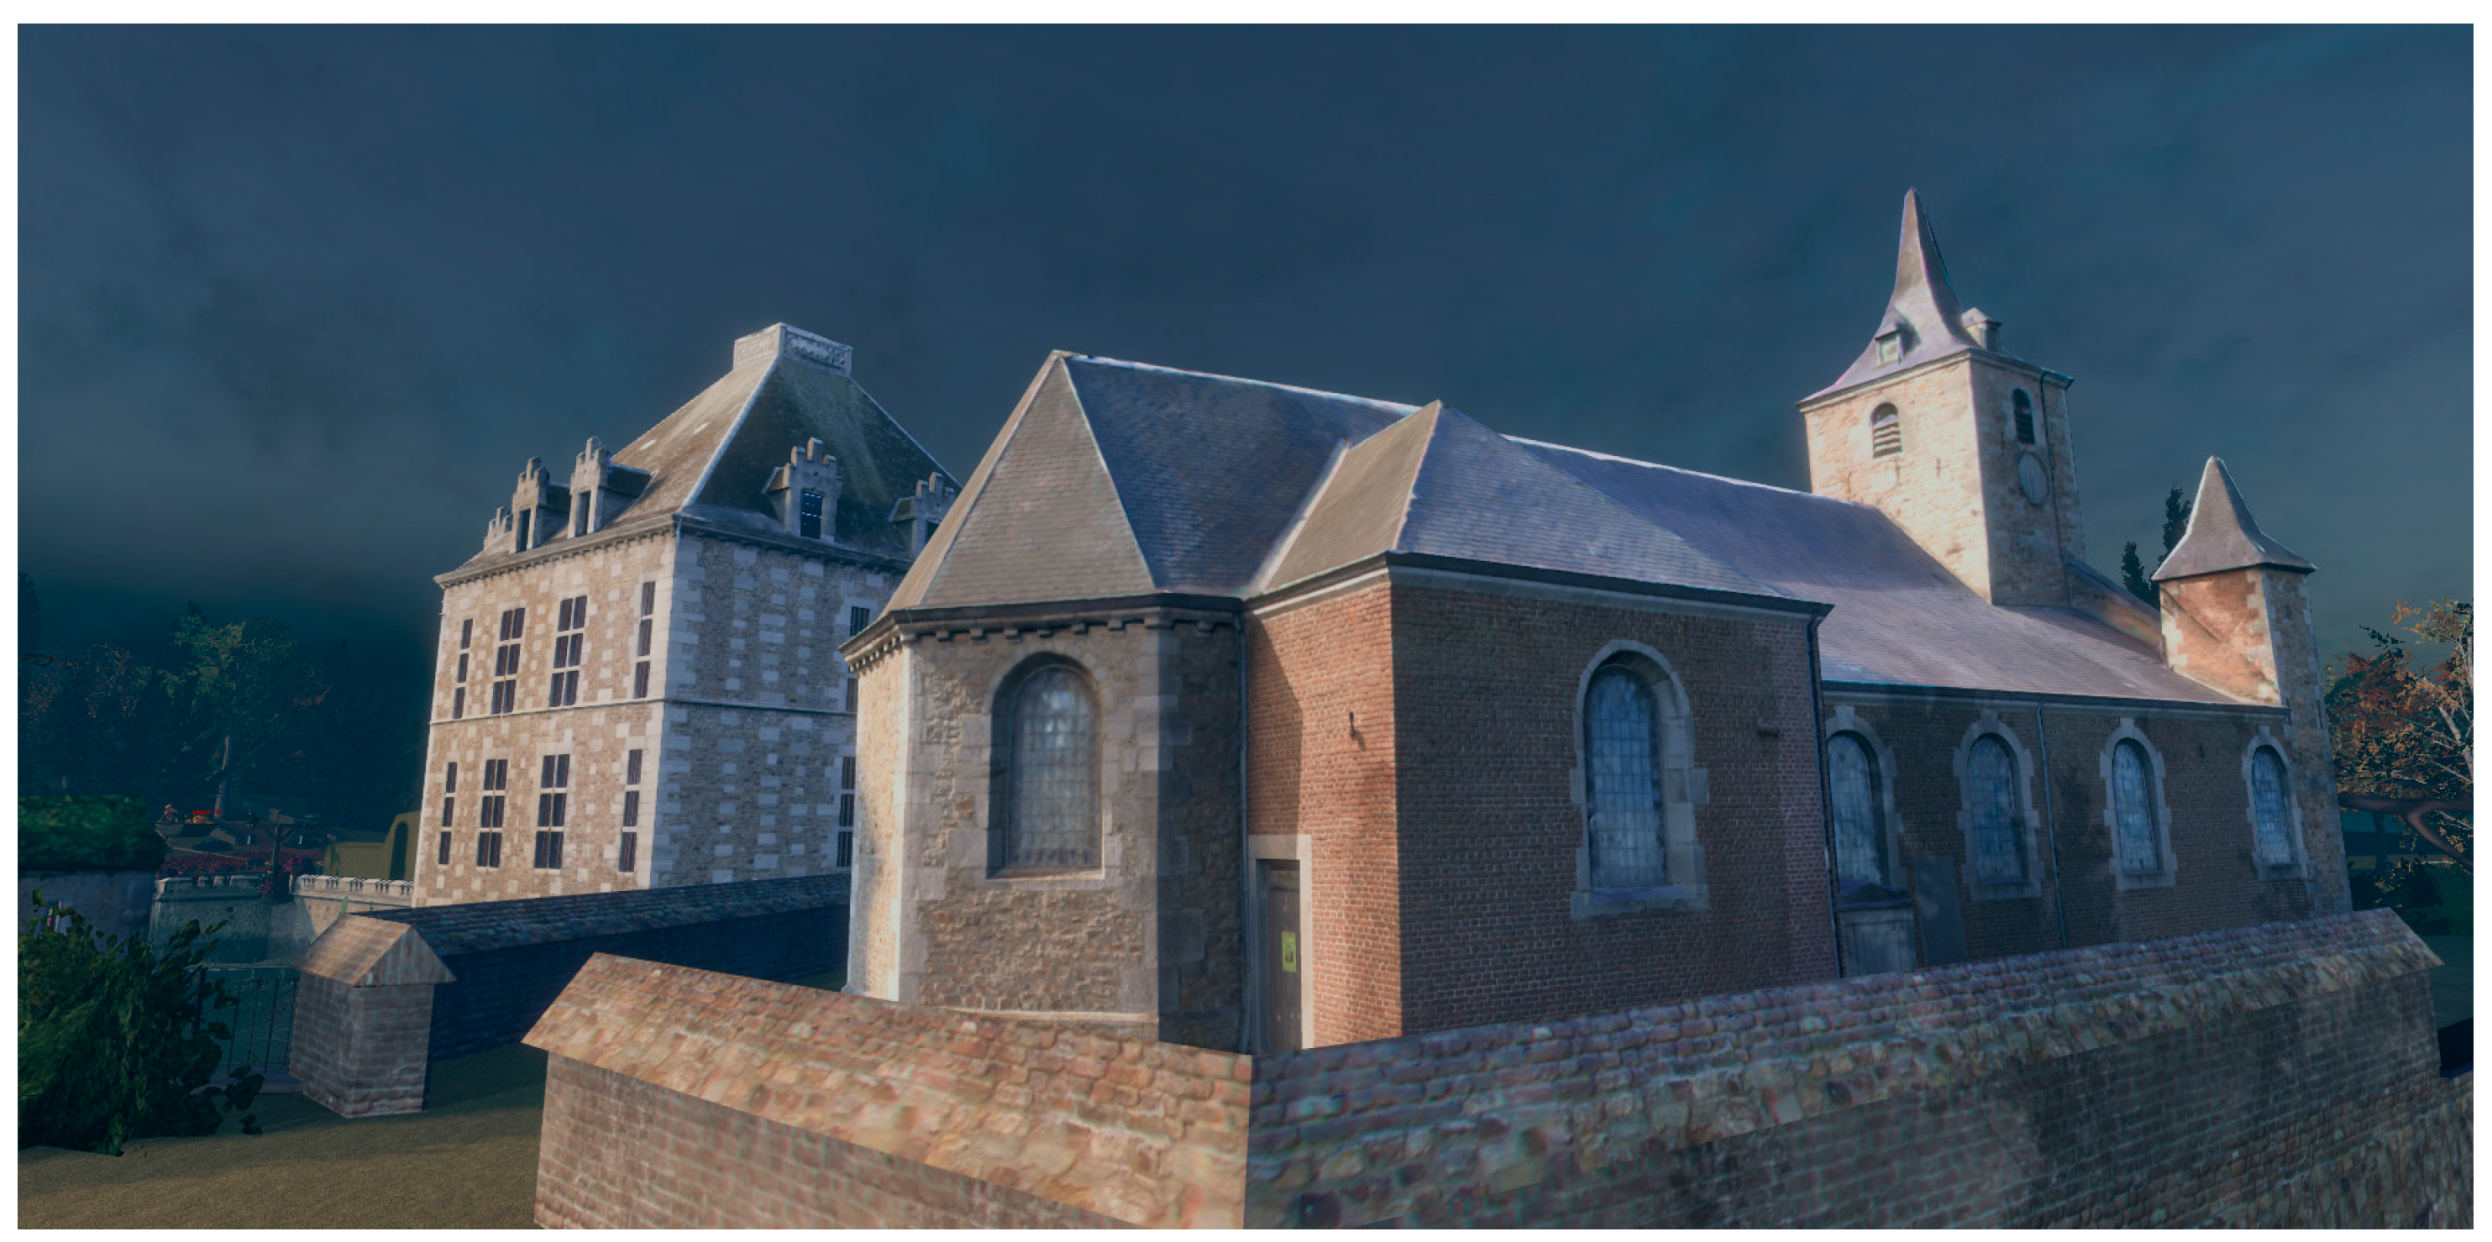
Some surrounding areas and vegetation of the castle of Jehay are modeled using computer-aided design techniques. Thus, the obtained mesh elements fall into both the categories (computer-generated and reality capture) as seen in Section 4.3. Furthermore, other reality captured elements are integrated, such as the chapel, as seen in Figure 16.
Concerning this trade-off between visual fidelity and optimality, one should find a balance between getting a fluid environment and the intended visual quality. We describe this process in more detail in the following sub-sections.
5.3.1. Hard Surface Normal-Map Baking
To reduce the complexity of a mesh without downgrading its visuals, a common technique in computer graphics is normal-map baking [91,93,94]. As described in [93], the workflow consists of creating a simplified version of the 3D mesh. The simplified mesh can be generated automatically [91] and by altering the mesh’s topology in a 3D software. We created an additional texture—the normal map—which will gather the surface detail of the original mesh in a compressed image format. Finally, this detailed texture is applied to the simplified mesh and used to retrieve the same details, created by the lighting, as the original mesh. Figure 17 shows the results of this process.
5.3.2. Draw Call Batching
To be drawn on the screen, a scene element must call the GPU in a process named draw call. If the number of elements in the scene is high, the back and forth iterations between the element and the GPU can be computationally demanding. To reduce the number of calls, an easy optimization technique is to use draw call batching to group all elements that share the same materials before calling [95].
Some game engines like Unity can automatically batch game objects that share the same materials [92]. It is noteworthy that this automated batching requires the copying of the combined geometry and thus increases the memory footprint. On the other hand, one can reduce the number of draw calls by merging two meshes sharing the same material into one. Moreover, when two 3D models only differ by the texture of their material, a common technique is to make an atlas [96] of the two textures. Therefore, instead of having two draw calls for the separated textures, we can benefit from only one draw call using the atlas.
5.3.3. Lightmap Baking
As explained by Jason Gregory in [97], lighting is one of the most important aspects for visual quality. In a game engine, the lighting makes use of a mathematical model which can be described as a partial solution of the rendering equation depending on the level of visual fidelity wanted [98]. Therefore, achieving realistic lighting requires additional calculations which can be computationally demanding. To overcome this issue, a common technique in real-time rendering is to pre-calculate (bake) the lighting and store the result in a texture map known as a light map. At runtime, the light map texture is projected on the objects in the scene and used to determine the lighting on them. On the downside, a light map needs to store extra memory in the game and objects that are in the light map cannot change their illumination over time.
5.3.4. Occlusion Culling and Frustum Culling
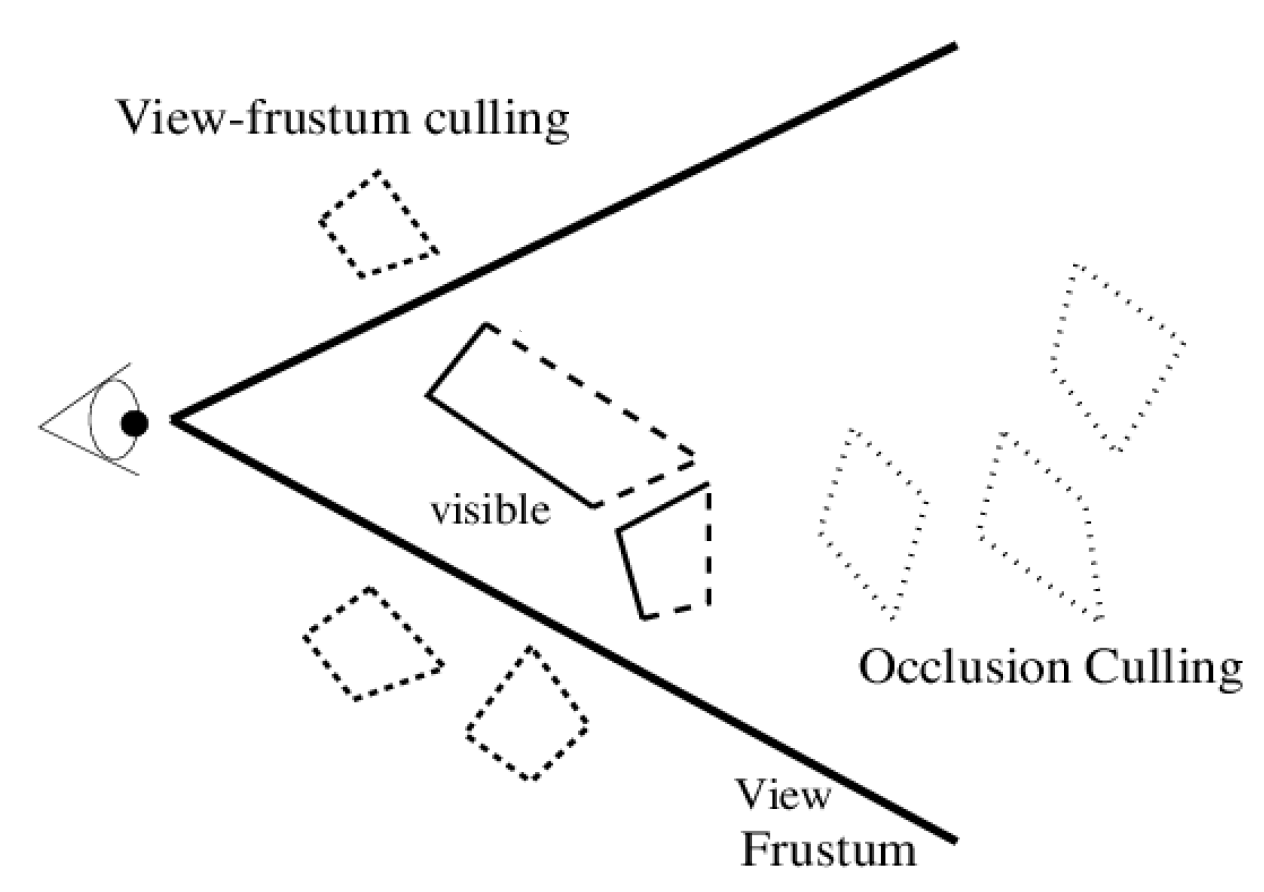
Occlusion culling and frustum culling are two techniques aimed at only rendering what the user sees. While frustum culling removes the objects that are outside of the user view frustum, occlusion culling tends to remove what is occluded by another object. The process is illustrated in Figure 18. Frustum culling can be automated by calculating if a bounding volume of the object (usually a box or sphere) has points under all six planes of the view volume. Occlusion culling is a more complex problem generated automatically. For calculating if an object occludes another object, a common technique is the generation of potentially visible sets (PVS). PVS can be defined manually by cutting the scene into sub-regions, for example. However, other algorithms exist for automated PVS based on the subdivision of regions. Even if the result might be imperfect, automated PVS can provide a quick optimization without the need of additional work. The reader can see an overview of such techniques in [99], where the authors review several algorithms and discriminate them according to four entries: conservative, aggressive, approximate and exact.
5.3.5. Levels of Details (LOD)
When far from a 3D model, the viewer is not able to look at the complexity of a mesh. Based on this observation, game engines tend to use a different level of complexity for a mesh: the level of detail (LOD). Then, the calculated distance between the virtual camera and the object is used to display an adapted version of the mesh to optimize the performance. This technique can even improve the visual fidelity as it reduces geometry aliasing. The downside of using such a technique is that the memory footprint induced by having multiple meshes for one object is higher.
At this step, we obtained several meshes with different levels of detail (e.g., for a part in Figure 19), to be integrated in the VR environment. These were generated by optimizing both the geometry and texture of elements to maximize the performance of the application through normal mapping, culling, and LoD strategies. They constitute the virtual environment data used for populating the prototype, which serves as the backbone for the VR environment design described in Section 5.4.1.
5.4. VR Design
5.4.1. The Locomotion System
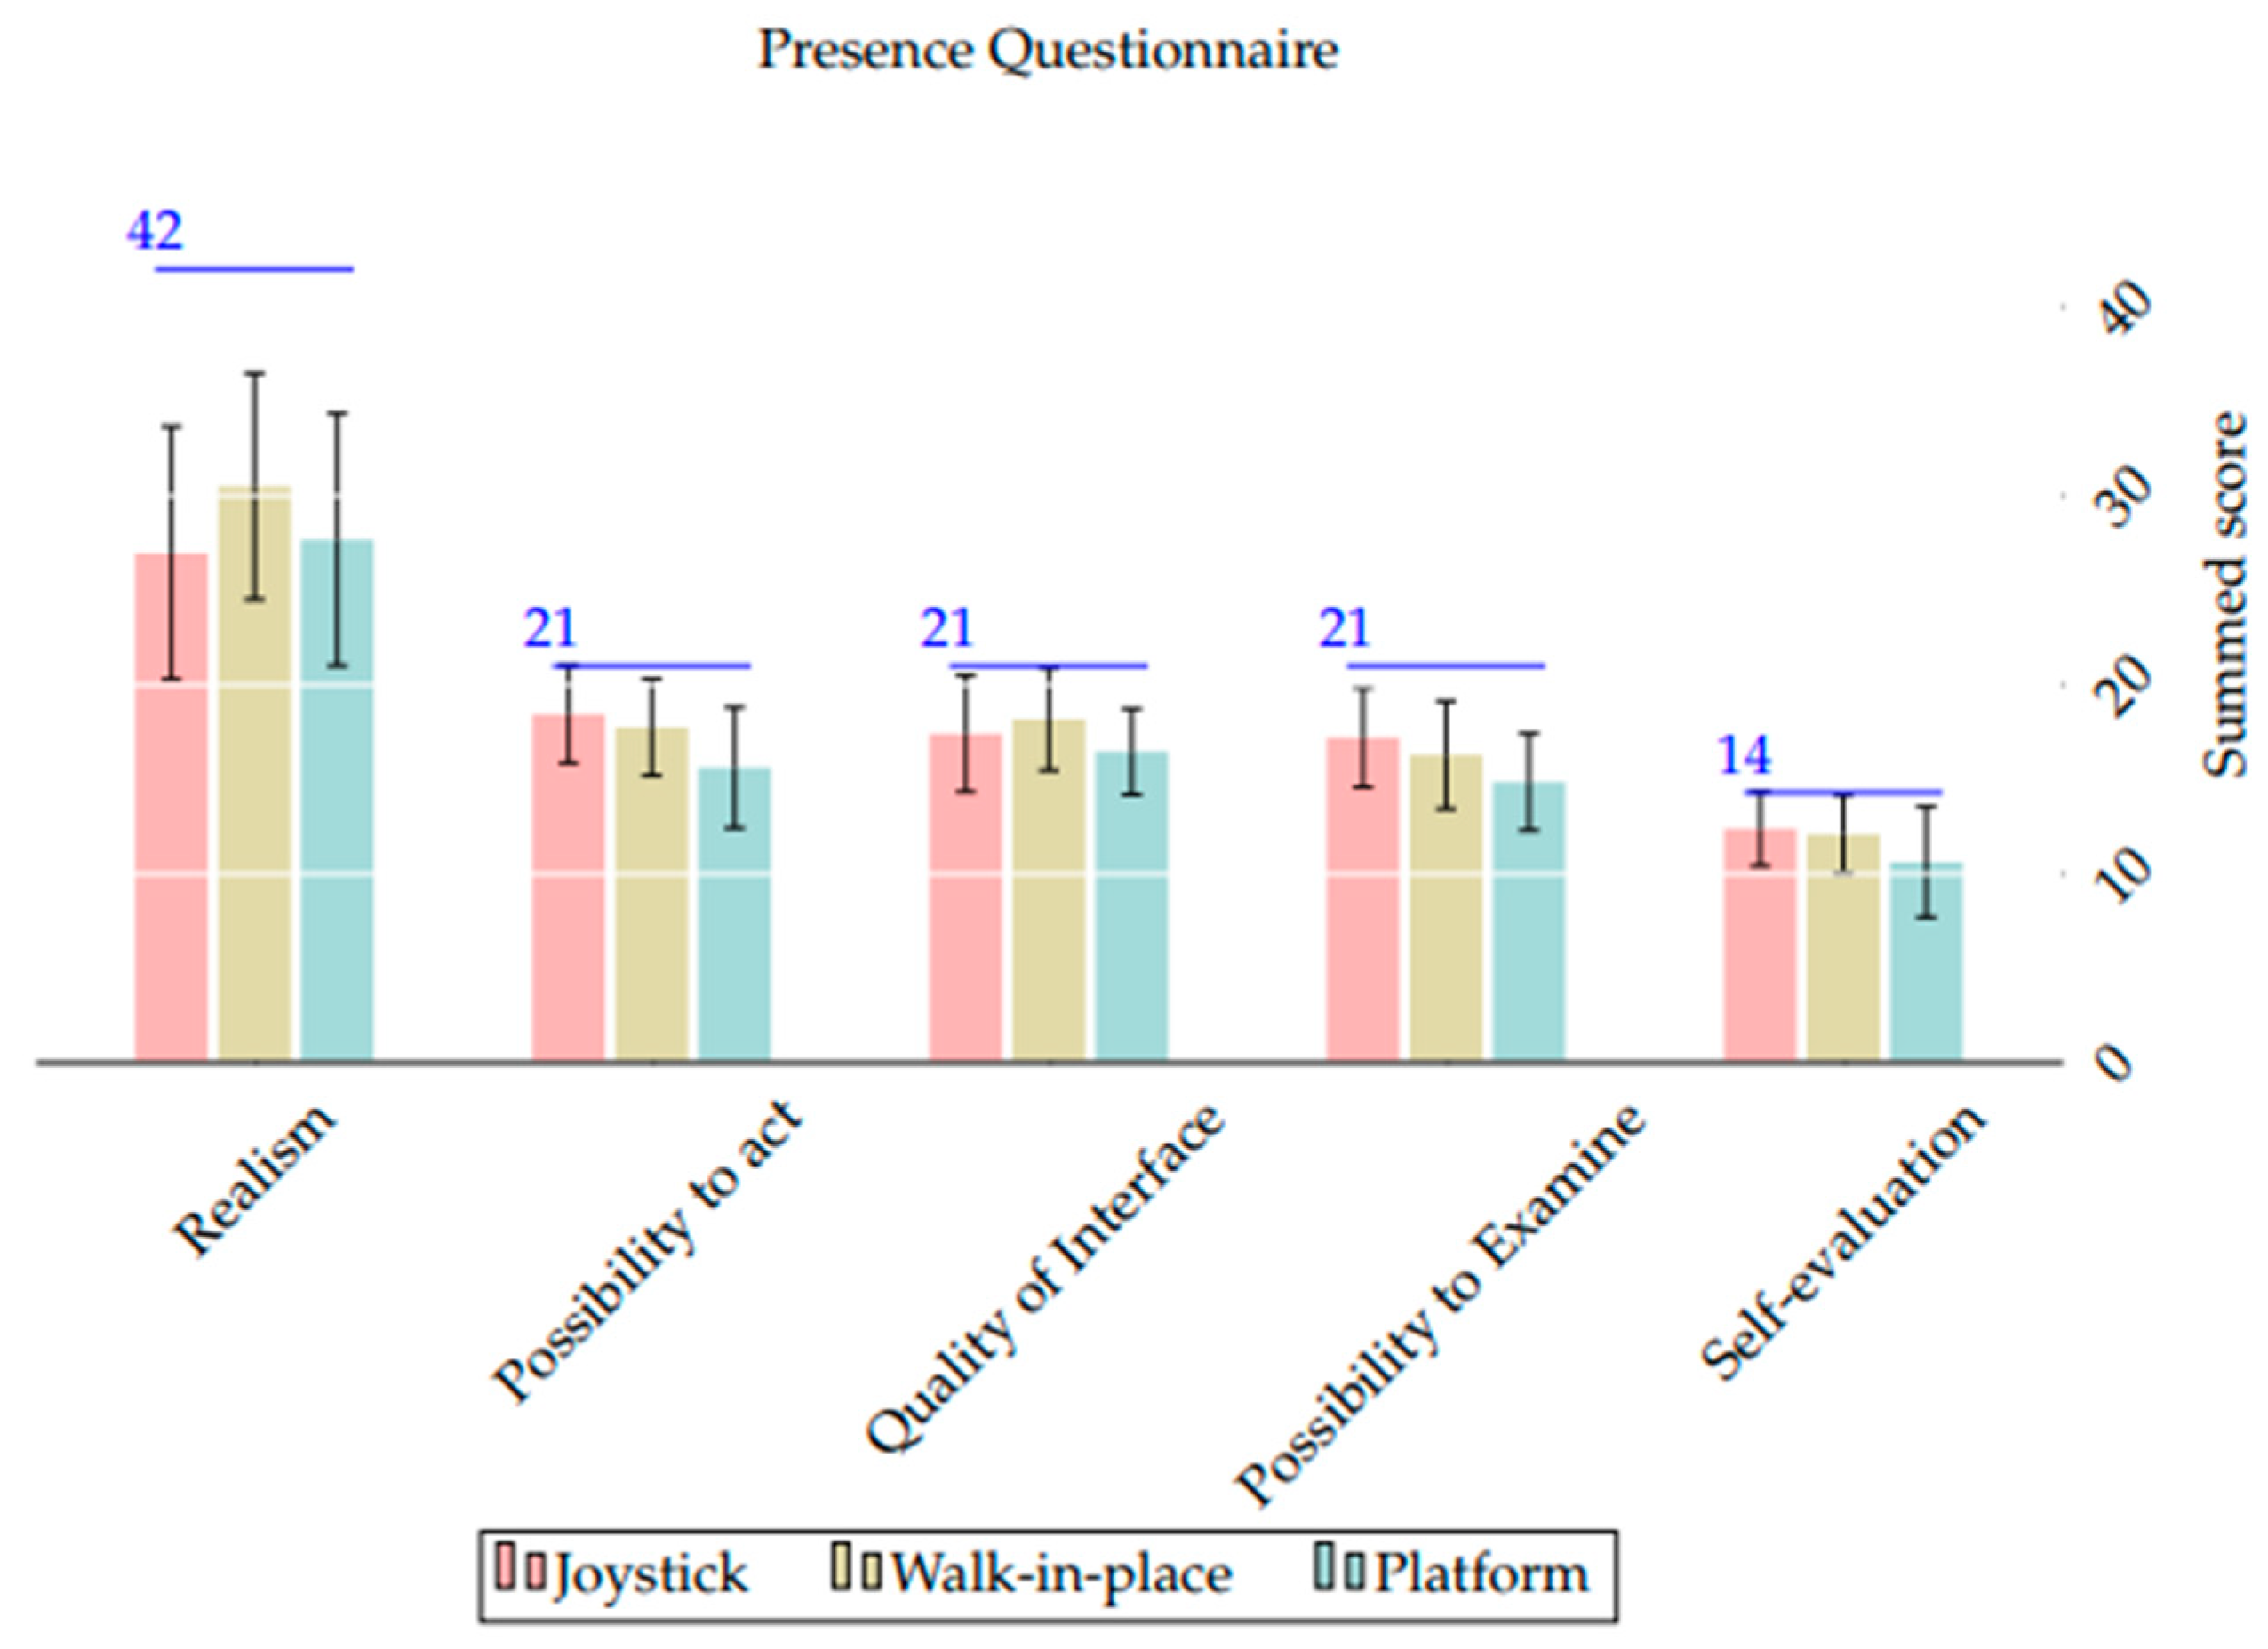
Inadequate locomotion systems lead to VR sickness which, similar to motion sickness, result in symptoms like nausea, headaches, or vomiting and can ruin the user’s experience [100]. In our case study, we needed the user to be able to move freely to discover the virtual environment by himself. For this, we used three different types of locomotion systems simultaneously to extend the user’s area and control where the user could go while reducing VR sickness. We detail each locomotion system in the following subsections below and assess each one as illustrated in Figure 20.
Move-in place. The principal movement implemented was move-in-place. The basic idea of this method is to imitate a walking motion while staying in place. To this end, the authors in [101] used a knee cap to track the movement of the legs and assign the corresponding movement in VR. Another technique is found in [102], where the tracking used is the motion of the headset to detect each step. In our case study, we integrated a walk-in-place motion method using the swing of the controller. The user could swing the arm as if he was running and he would move in the direction he was facing. However, the downside of such a locomotion system is its precision.
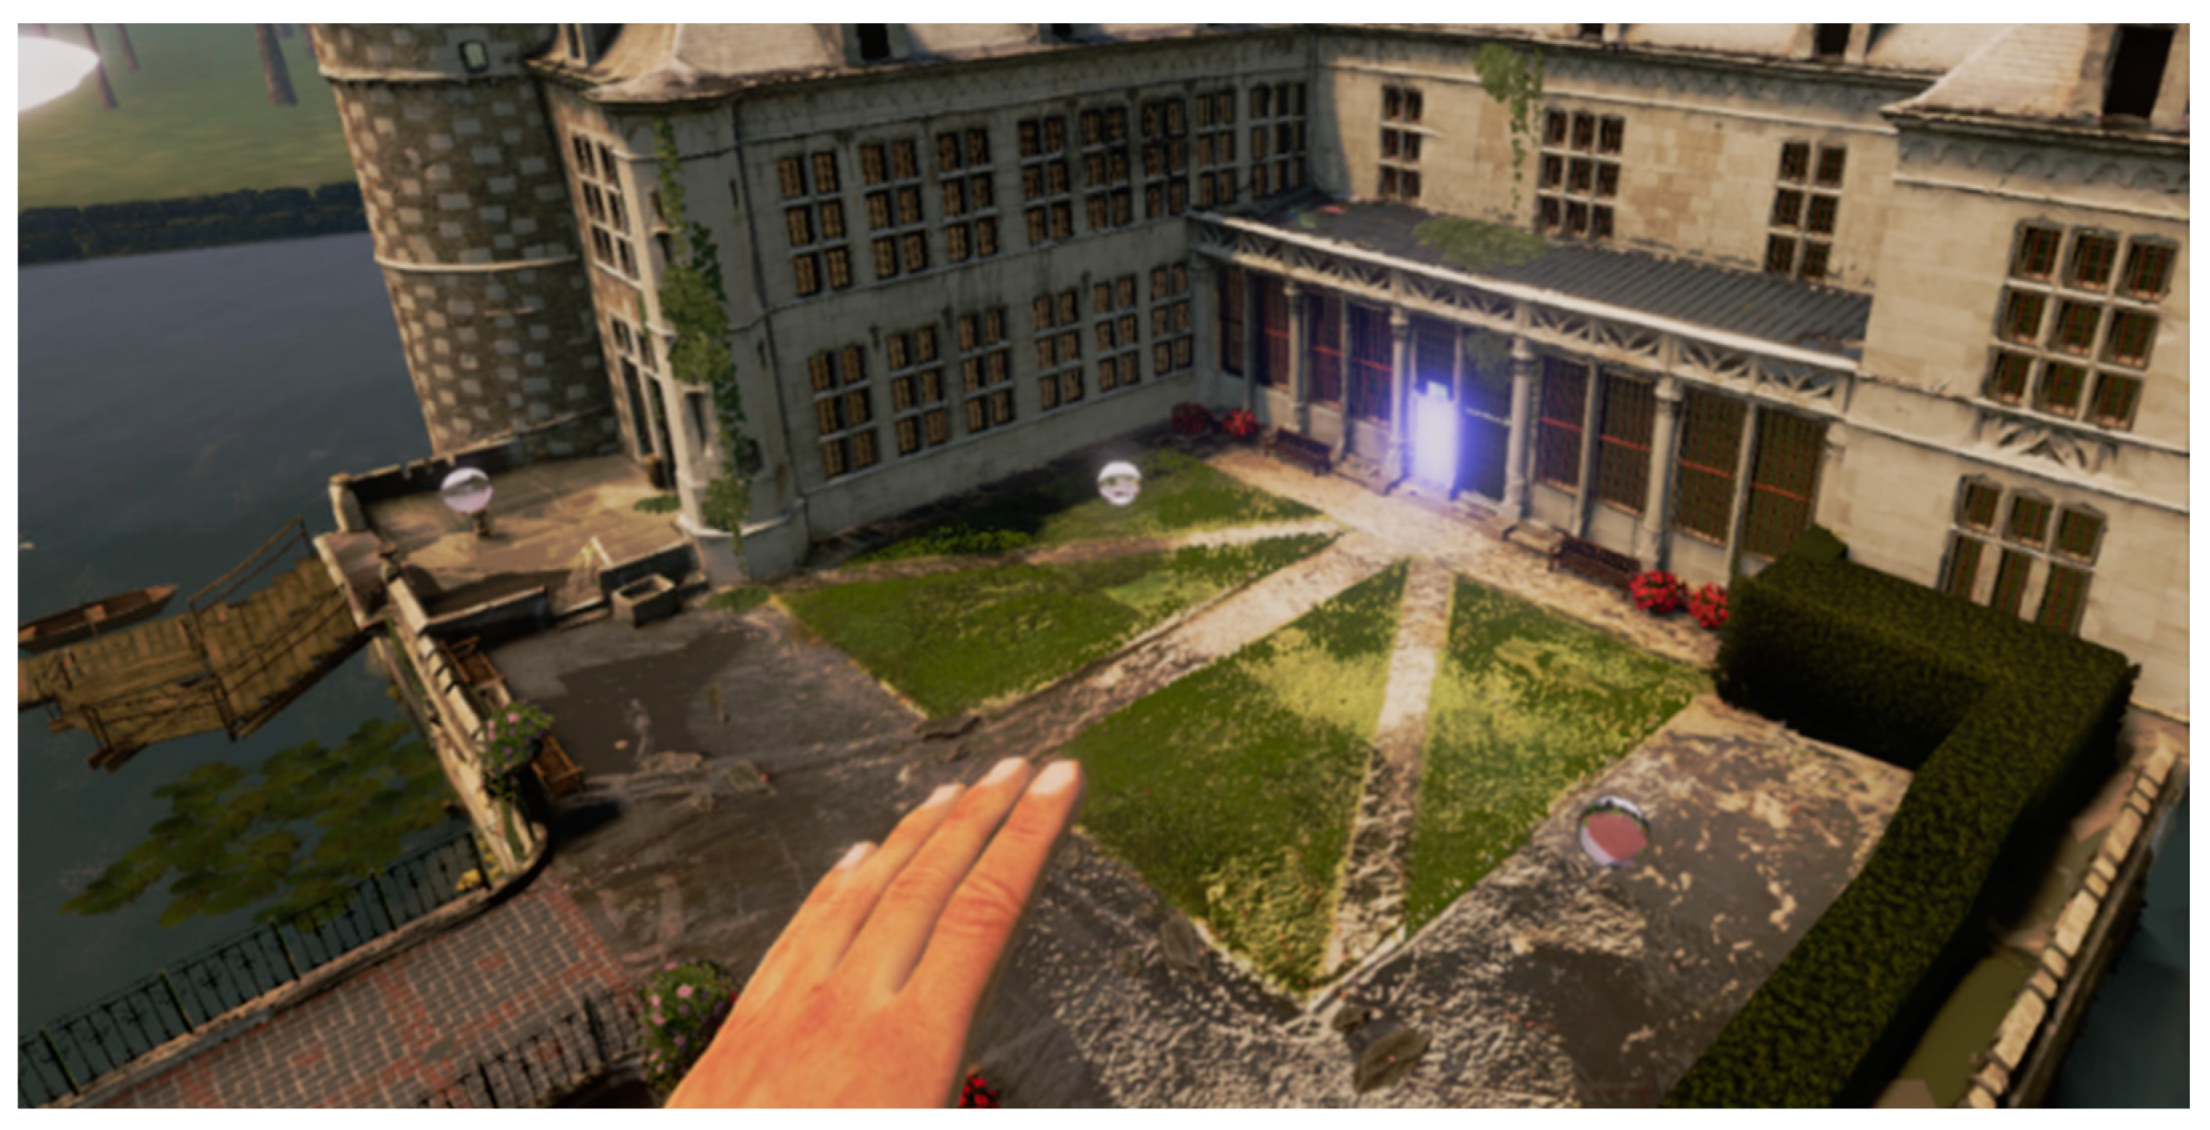
Teleportation. A commonly used solution in VR for moving the user while reducing motion sickness is teleportation. Using a controller, the user can point at a direction indicated by a straight line or a parabolic curve where he wants to be teleported to. Then, at the press of a button, a fade transition occurs, and the user position is set to the desired location. We implemented a teleportation feature (materialized as clouds above the castle ) combined with move-in-place to reach an unattainable zone (Figure 21). The user could point with the controller at the cloud and press a button to be teleported to it, resulting in a unique view of the entire castle and its surrounding from above, which is non-replicable on-site.
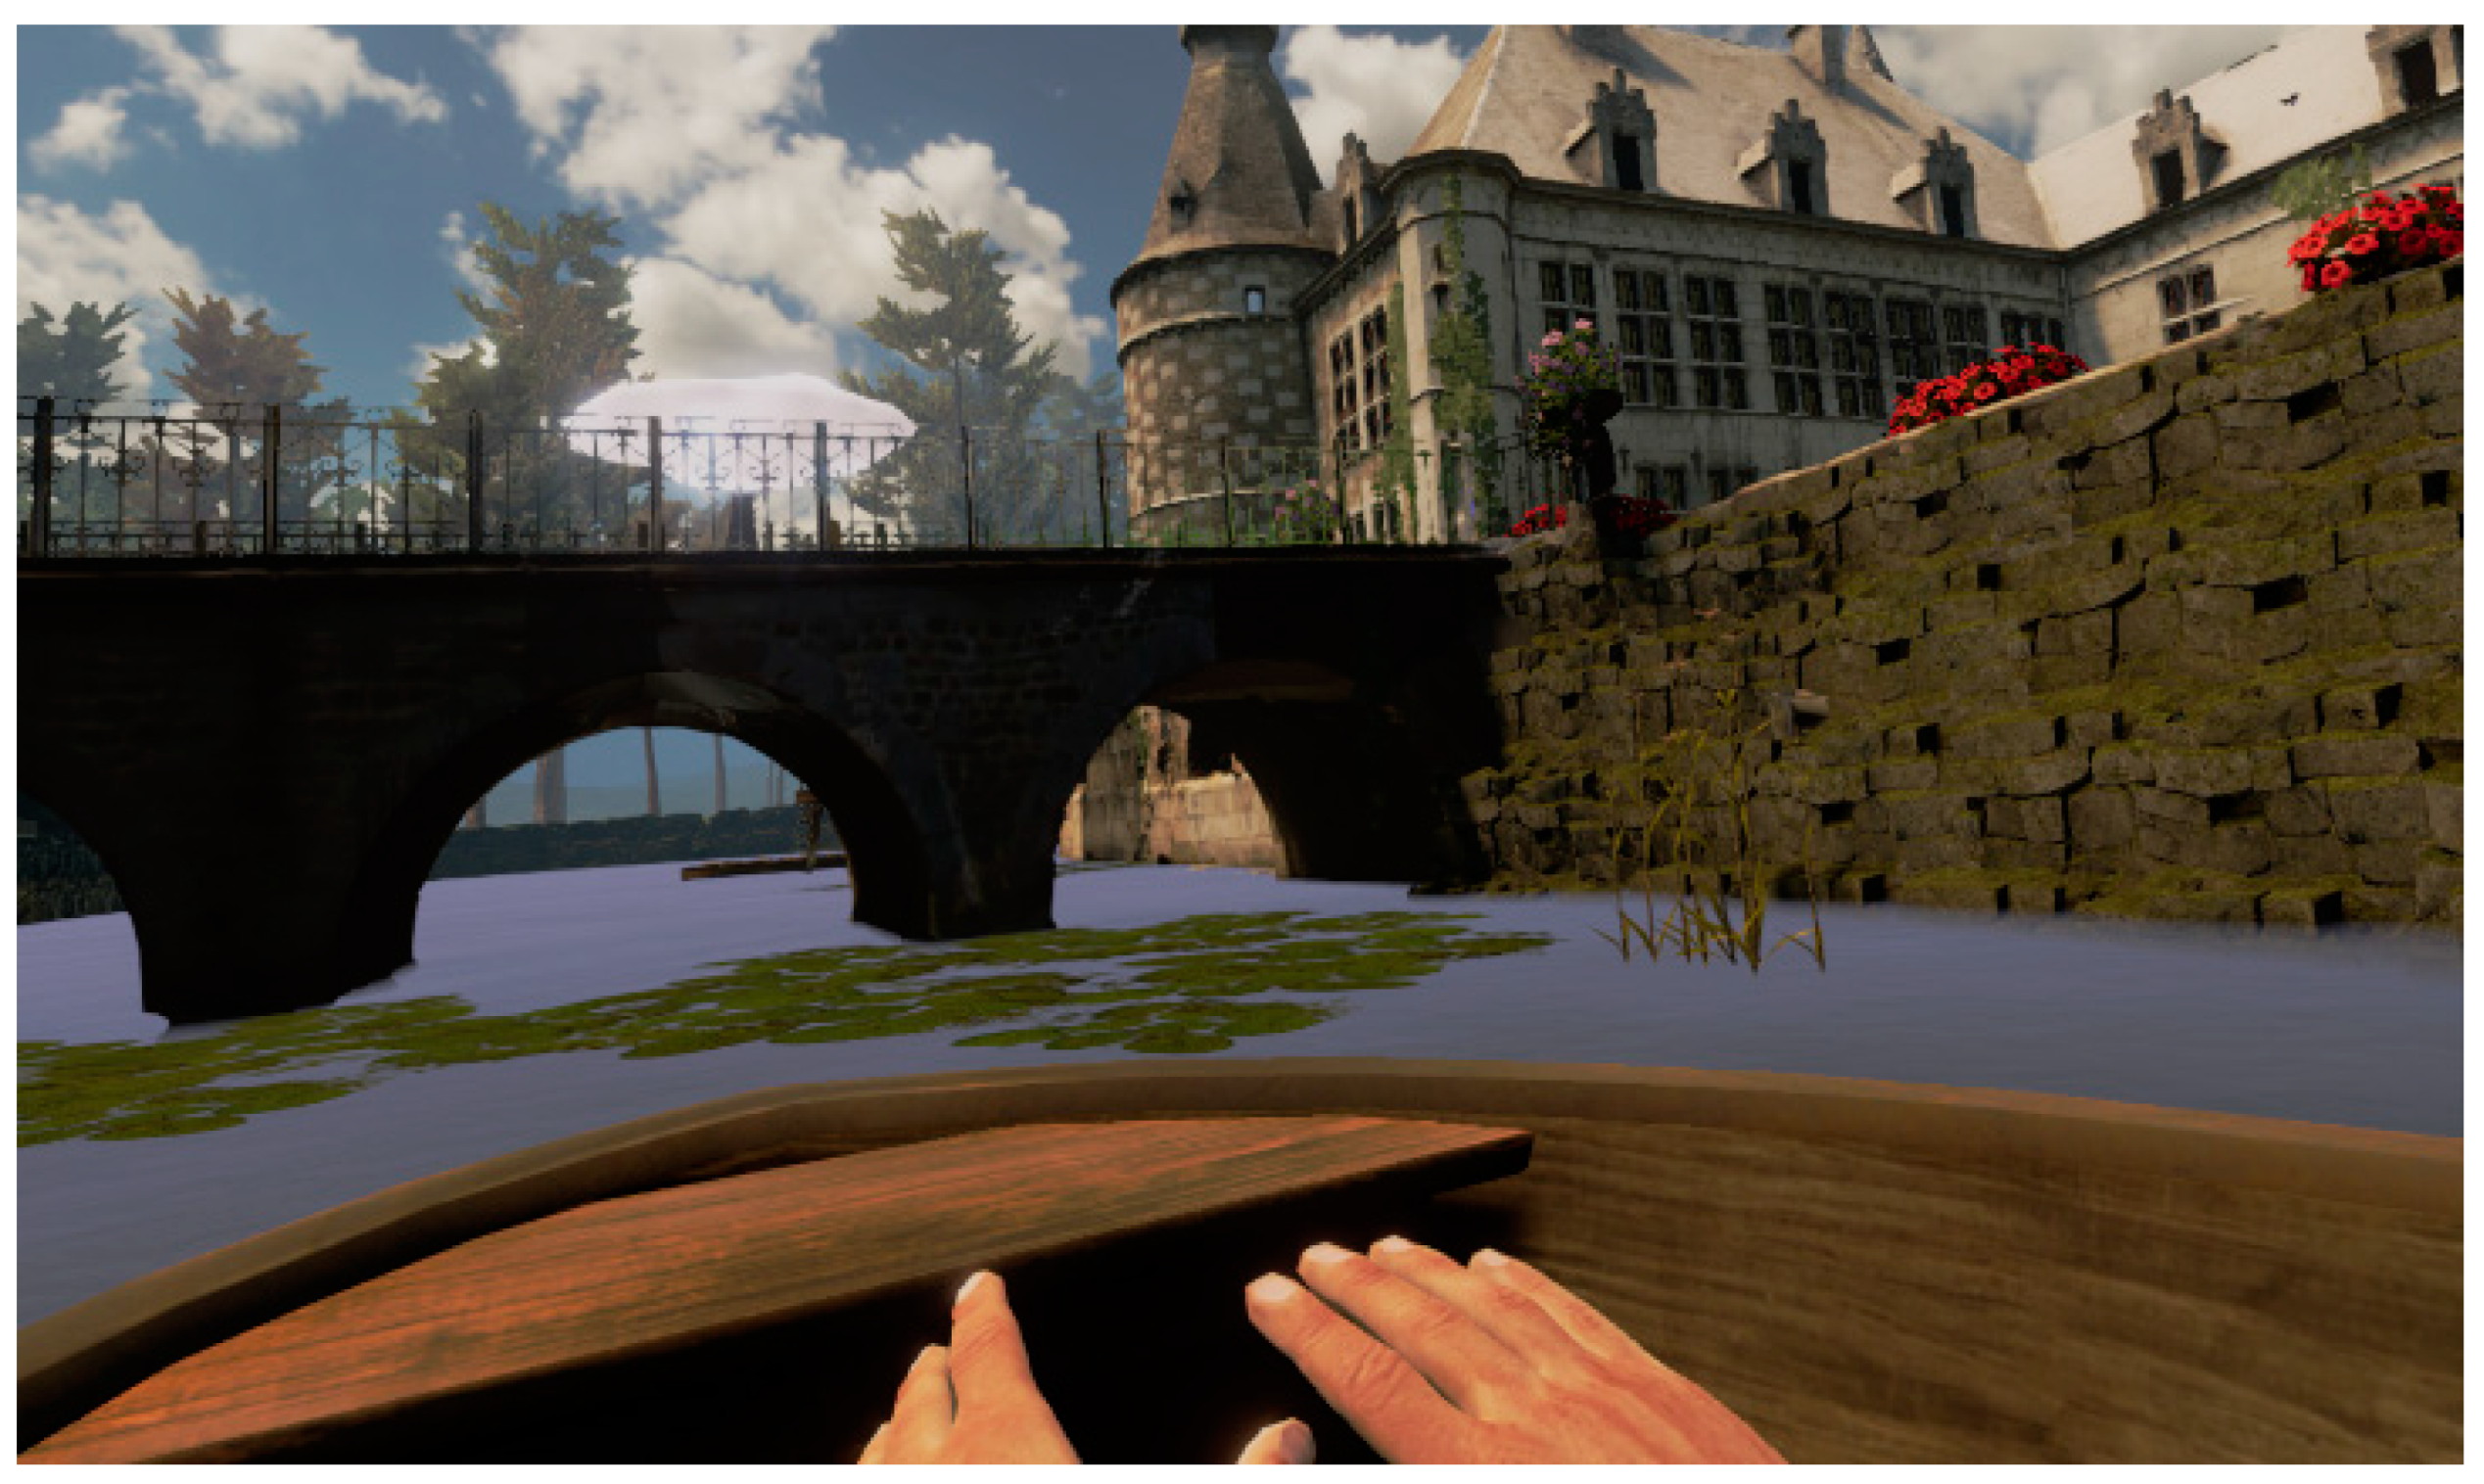
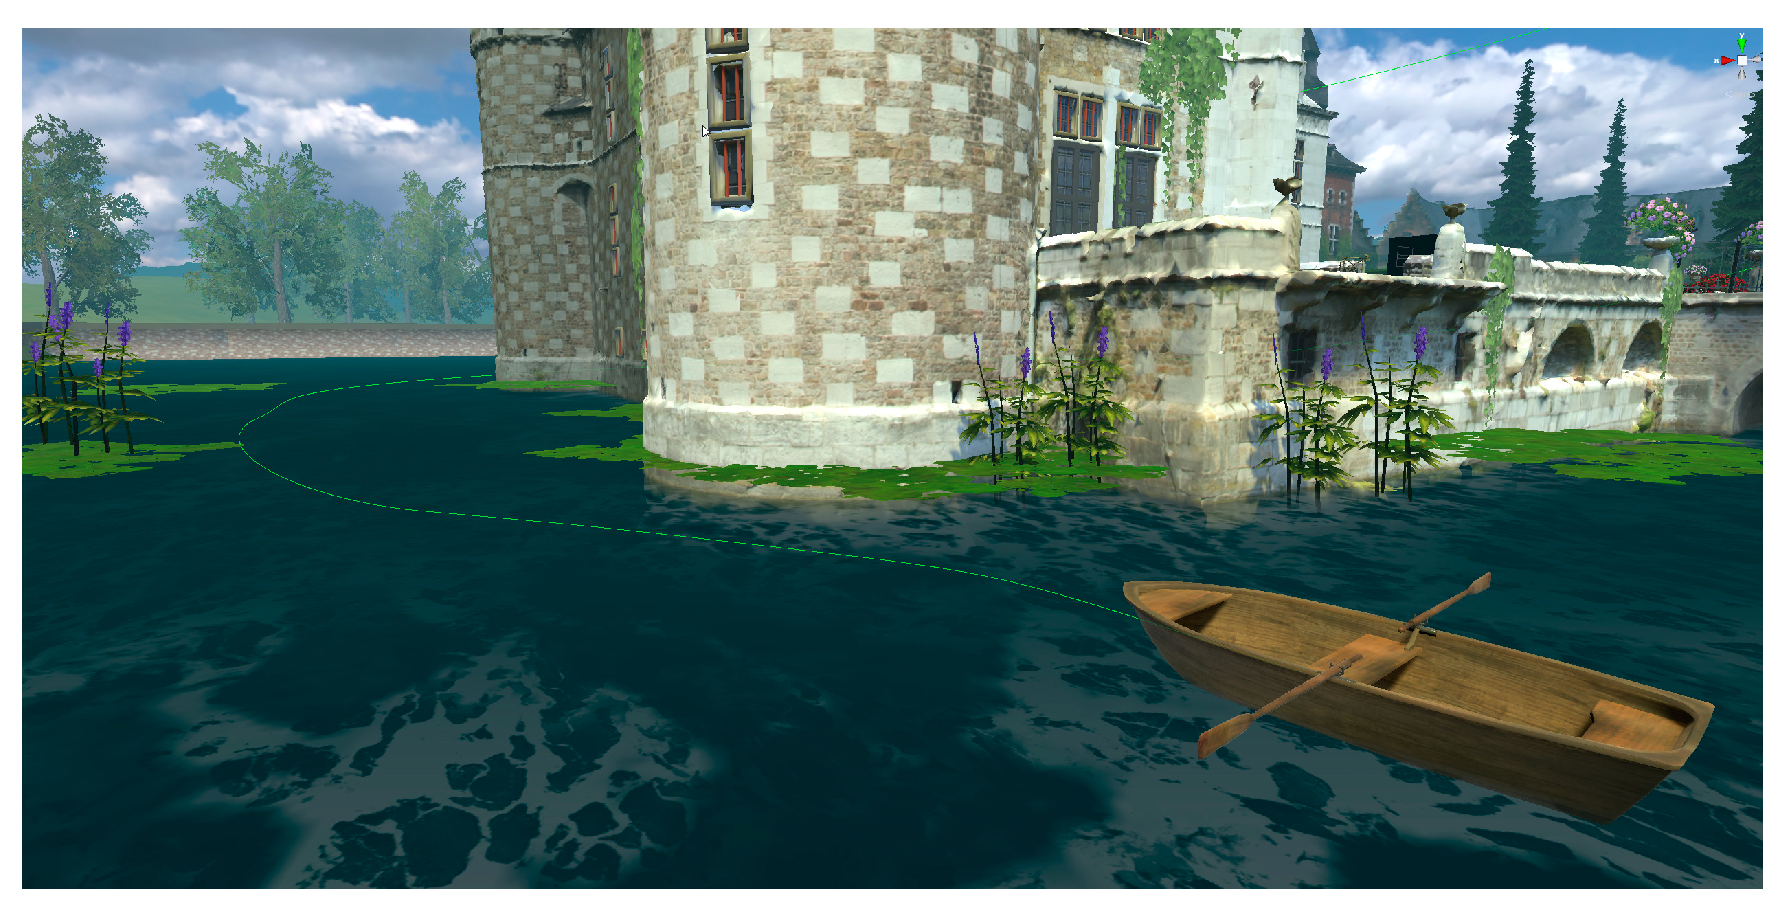
Automatic routing. In some cases, and for passive tourism, it is optimal to prevent a visitor from controlling his VR movement as the visitor must get used to the locomotion system using the controllers. In the case study, we designed a unique way to explore the outside of the castle with a boat tour in the moat of the castle as shown in Figure 22.
The boat is automatically moving along a curve and during the tour, and the user had no control over the movement of the boat apart from looking in all directions. Because the user does not have control over its position, a smooth movement is thus required to avoid motion sickness as sharp turns provide a more stimulus-inducing section, in terms of the impression of motion in a stationary position [100,103]. Even though this method is not aimed at visitors who want to experience a free exploration movement, it is an optimal approach for first VR experiences, as it simplifies the user interaction. Therefore, we built a version of the application using only the automated boat tour for people new to VR and digital immersive experiences (Figure 23).
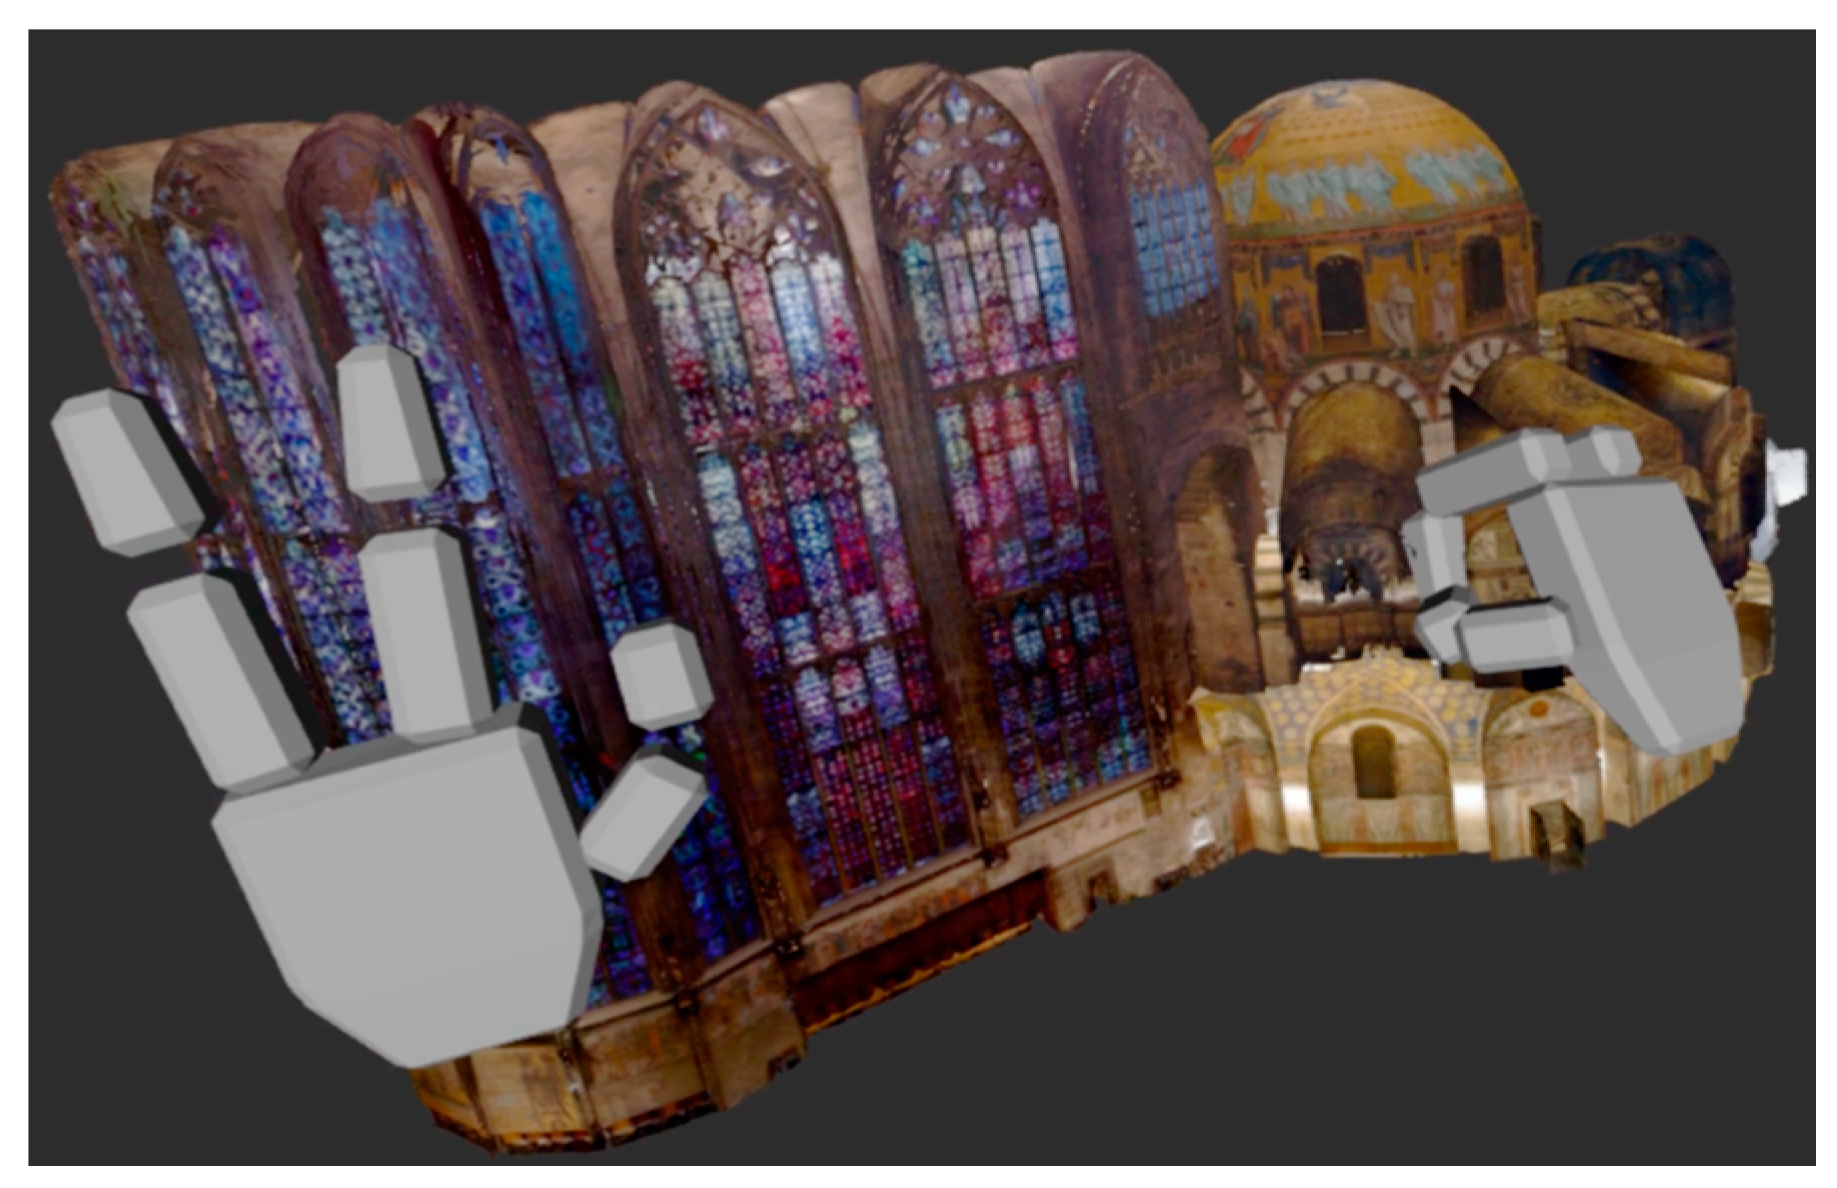
Multi-touch movement. Another promising locomotion mode is multi-touch movement. It is heavily inspired by the multi-touch user experience found in touch screen devices. The VR controllers are rendered as abstracted hands which the user uses to “grab” the environment pressing on the triggers of each controller (Figure 24). When one or more controllers are moved with their triggers held, the scene is transformed (pan, rotate, scale) while keeping the controllers’ scene position as close as possible to their original positions. It allows the user to move efficiently by grabbing the scene and pulling it closer with a single controller, or to even rotate and scale the scene using two controllers.
The transformations mentioned above are subject to a configurable subset of the following constraints:
- ▪
- Keeping the up-axis of the scene aligned with the up-axis of the physical world.
- ▪
- Keeping the scale of the scene fixed.
- ▪
- Keeping the rotation of the scene fixed.
Usually, the first constraint is enforced, as tilting the scene increases the risk of simulator sickness while rarely providing a meaningful way to explore the scene. For users who are not familiar with the multi-touch interactions, it can also be desirable to enforce the other constraints as these prevent accidental rotation or scaling of the scene while moving around.
Compared to previously mentioned movement patterns, multi-touch movement gives the user a higher degree of freedom to explore a VR scene. The scaling transformation (e.g., in Figure 24 where a full indoor scan is scaled in real-time to about 1:5000) allows for a quick exploration when scaling down or detailed observations when magnifying scales. We observed that users quickly became comfortable with this form of movement even in setups with large tracking spaces where regular walking is a valid method to move around the scene. They intuitively decided to remain stationary and relied almost exclusively on multi-touch movement.
5.4.2. Multi-Users VR Environments
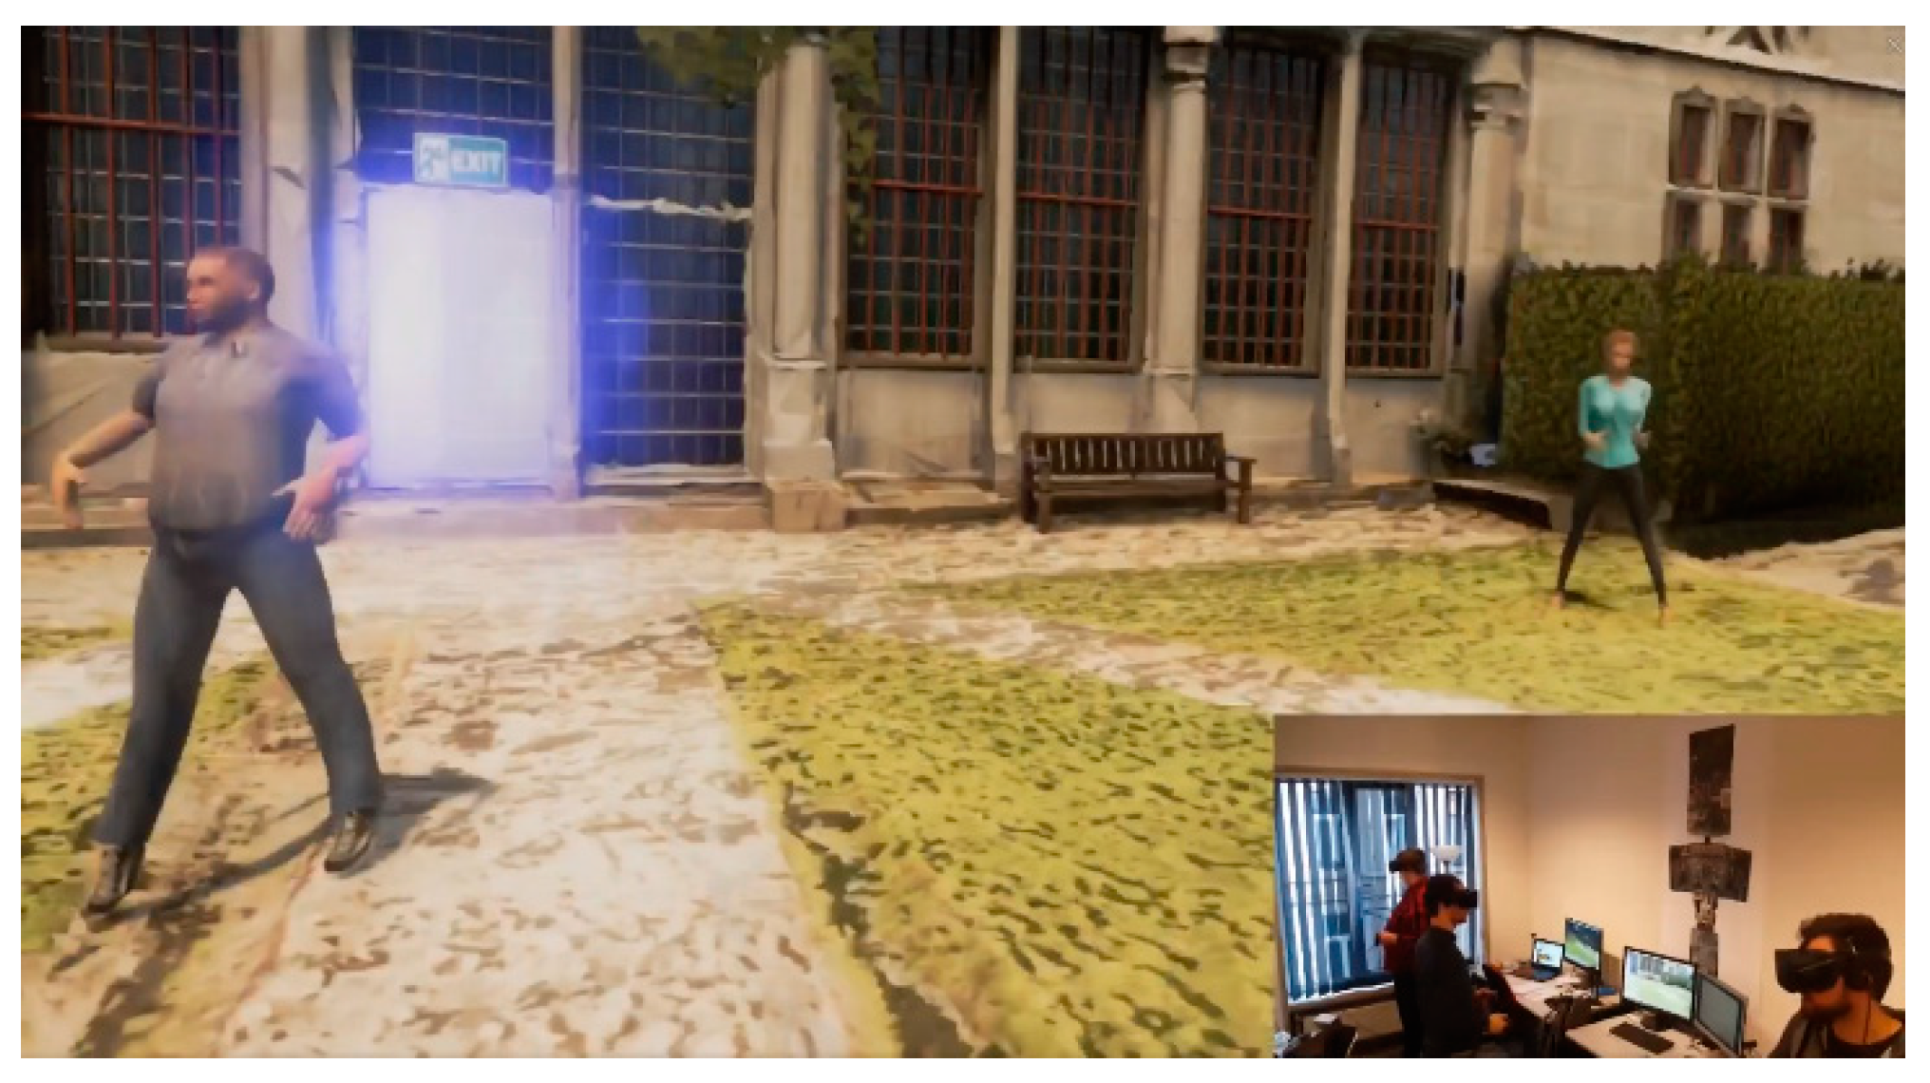
Five computers were available on-site at the castle of Jehay. To benefit from this setup, we decided to integrate a multi-user system to the application. Our approach was to use the network system to synchronize the position and rotation of the headset and the controllers and use the data to animate a full body which will mimic the body of the user in the virtual world, thereby, the visitors could see each other while visiting the castle (Figure 25).
Creating a body in VR is a tedious task. The challenge consists of using the data from the positions of the headset and the controllers to recreate the entire body pose in a realistic form.
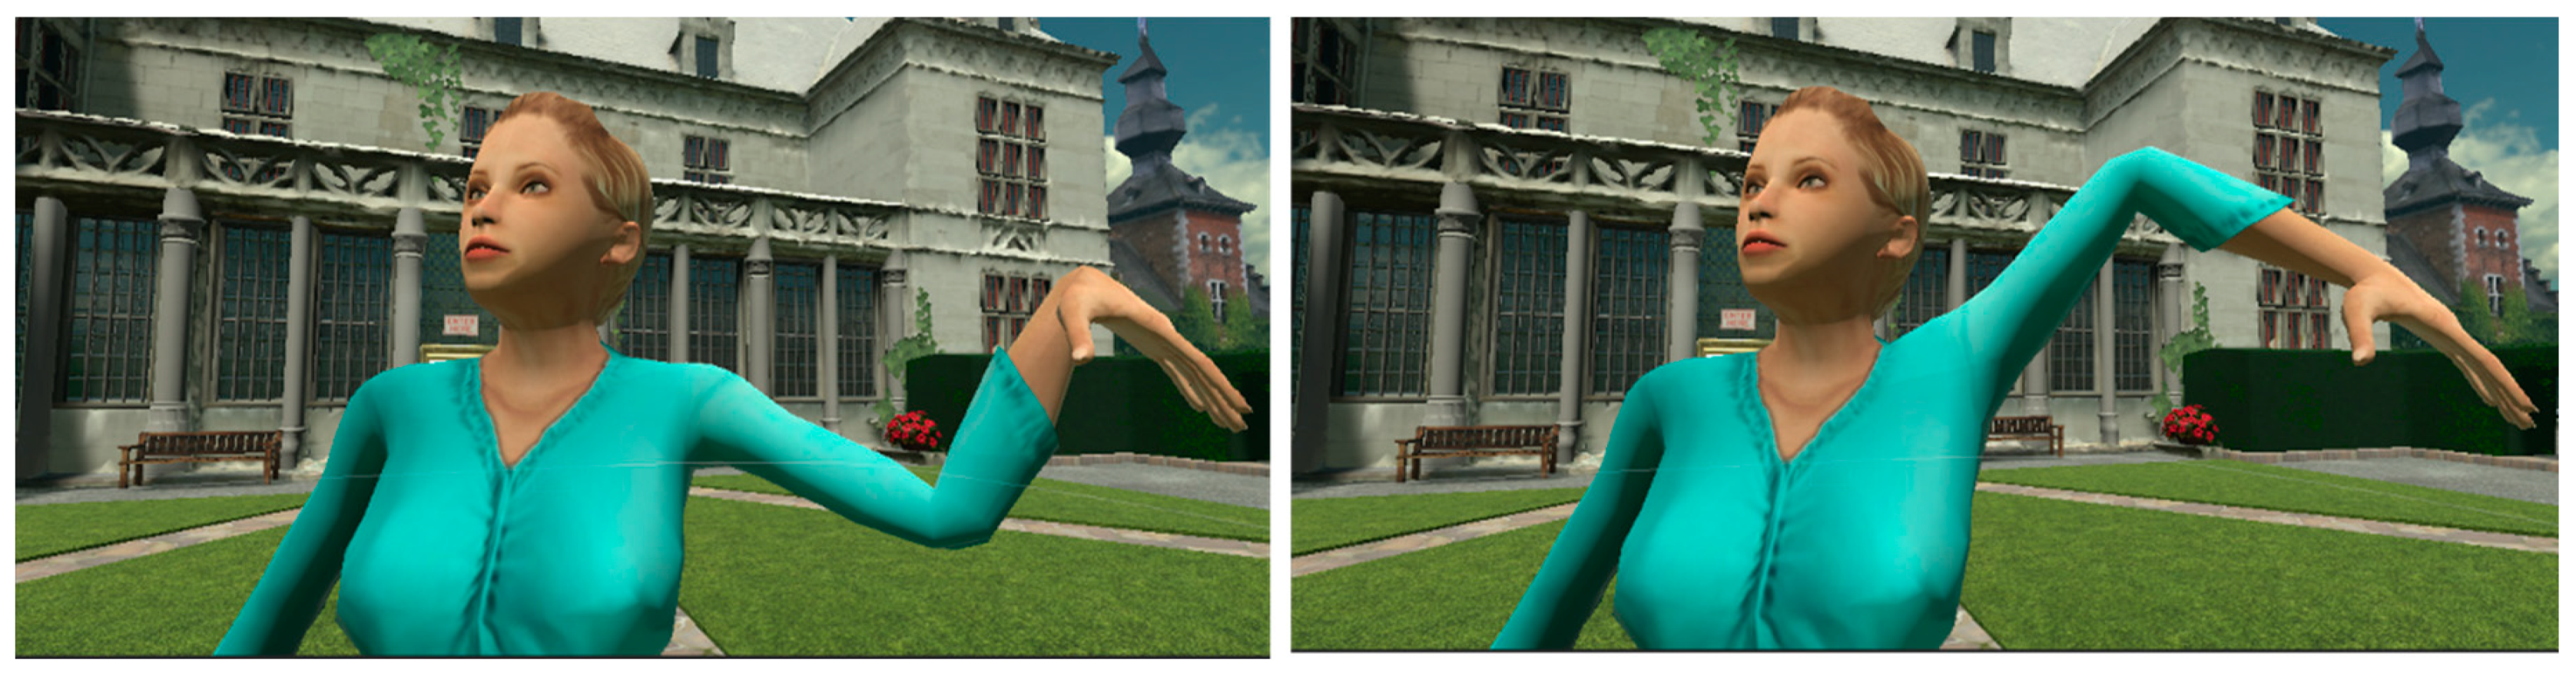
We can address this problem using inverse kinematics [104] which determines a set of joint configurations for retrieving a movement. This method is commonly used in robotics and can be similarly used on the rig of a human 3D mesh. We invite the reader to study [104], which provides a complete summary of the techniques used to solve inverse kinematics. In this case study, the method implemented was the “Forward And Backward Reaching Inverse Kinematics” (FABRIK) [105], which creates a set of points along a line to find each joint position. Then, a series of constraints were combined to retain a realistic movement [106], as shown in Figure 26.
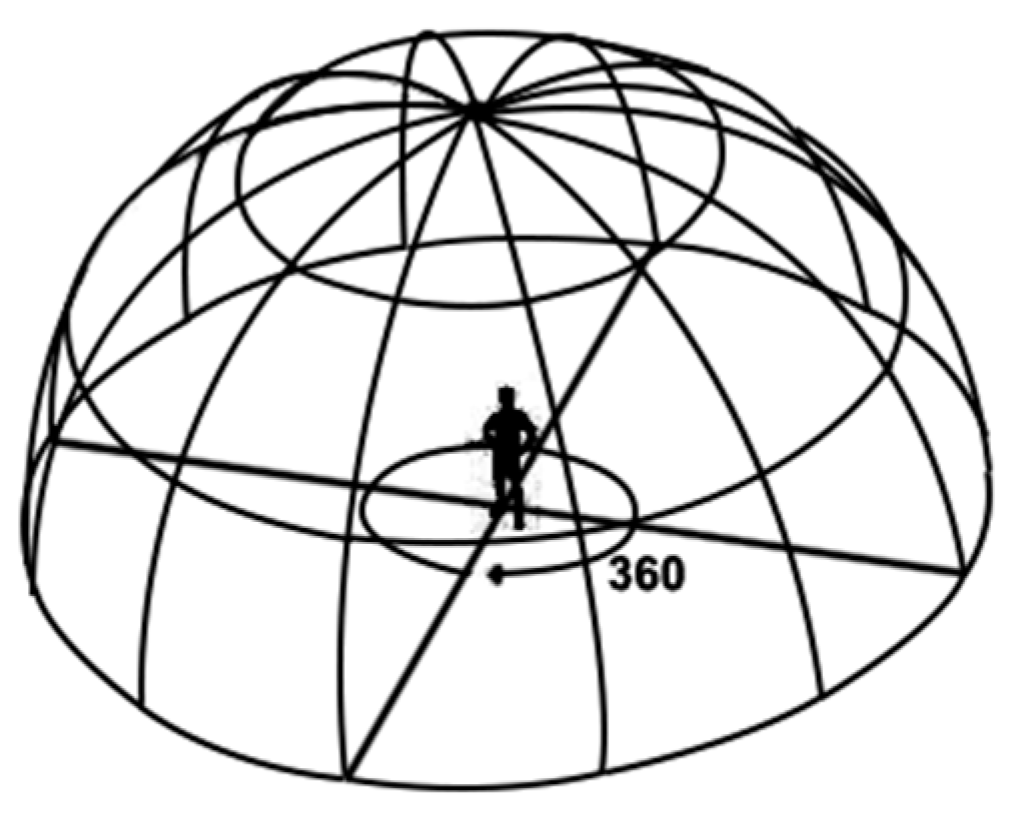
5.4.3. Panoramic 360° Pictures
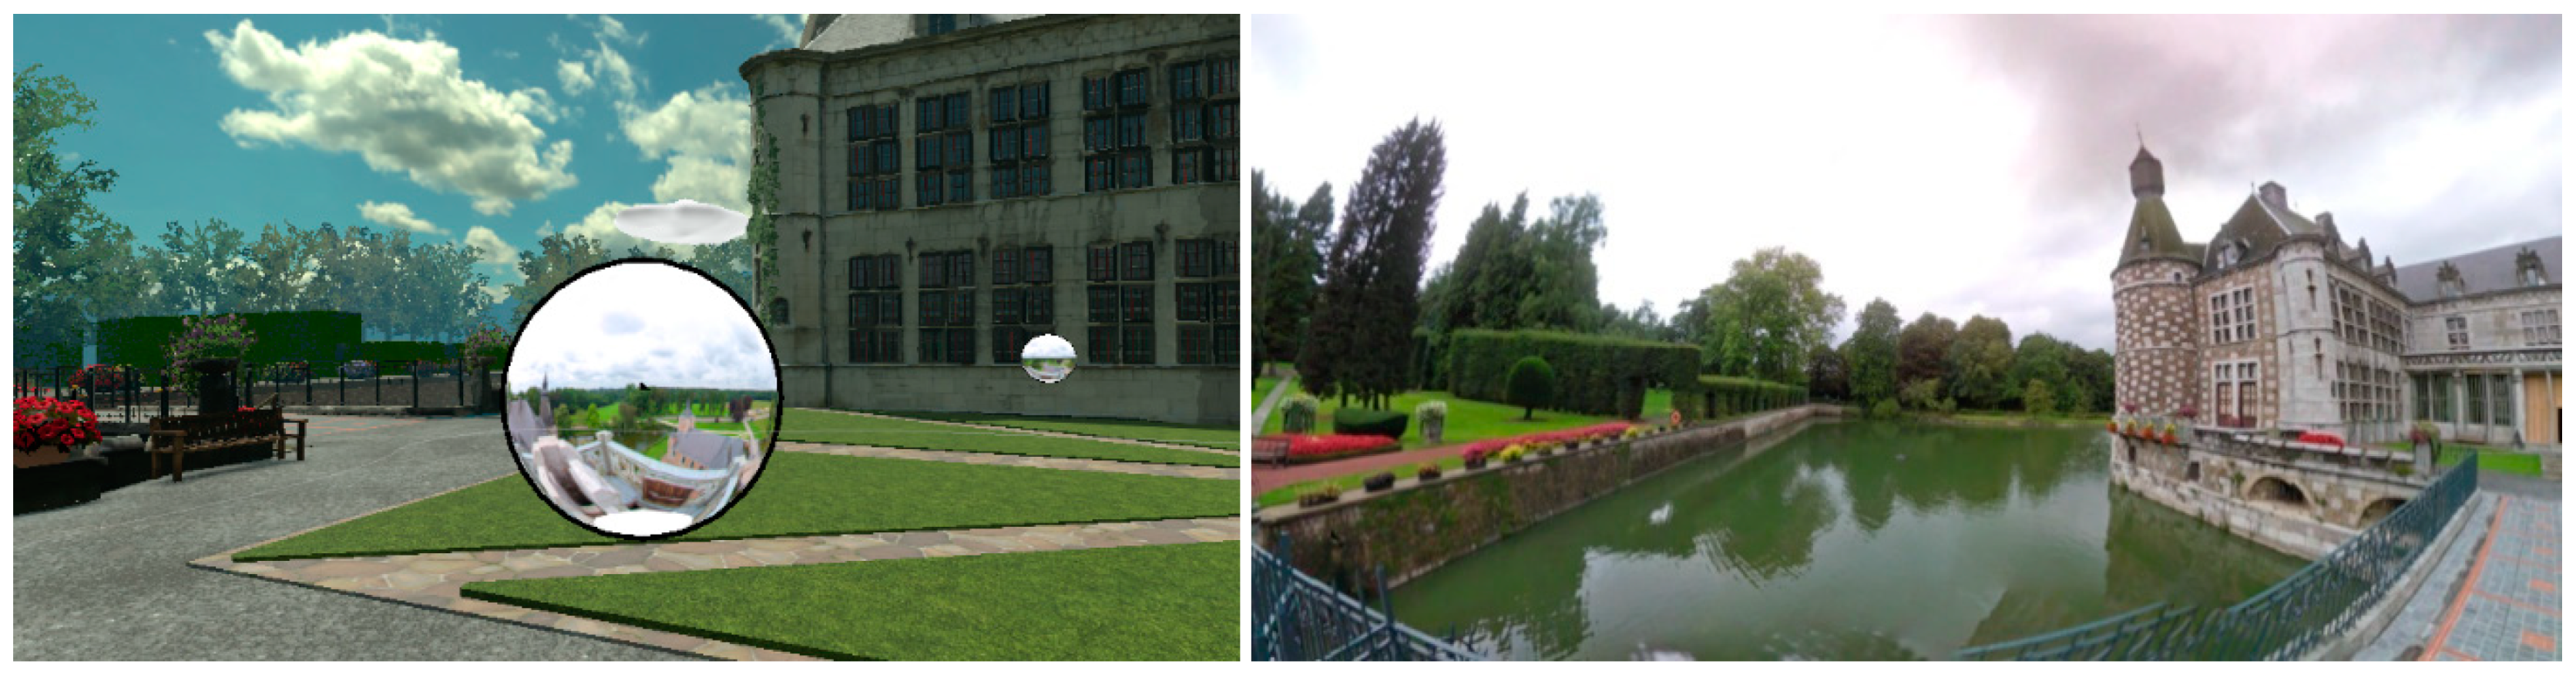
A 360° panorama captures the complete surrounding into a single image that is then mapped to a geometry (sphere, cube, cylinder, etc.) through projective mappings. Several 360° panoramas were taken on-site from scanning positions and leveraged through the creation of a 360°-viewer VR-integrated feature. The viewer works through interactive portals between the real world and the virtual world for the user to see the comparison with the 3D model of the castle. When the user intersects the portal with one of the controllers, he is teleported inside the 360°-viewer, as seen in Figure 27.
When the user intersects the portal with one of the controllers, he is teleported inside the 360°-viewer. For the VR design, we set the 360° panoramas as the main texture of a sphere where we invert the normals so the newly mapped texture is displayed from the interior of the sphere. By doing so, one could position the user inside the sphere as shown in Figure 28. It is noteworthy that, for a better quality, the sphere should be modeled with enough triangles and should not receive lighting.
6. Discussions
The VR environment results in an interactive application which is endowed with a rich control over the user’s immersion. It is worth mentioning that the castle representatives, the most familiar with the site, were surprised to rediscover the castle from a point of view that was not replicable outside of the application, consolidating initial thoughts expressed in [82]. For example, the boat tour around the castle’s moat or the aerial view demonstrates the unique experience that a safe and controlled virtual environment can achieve, even for accustomed users. It is often hard to gather information at the initial user’s need phase and justify a cyclic application design to refine the initial prototype.
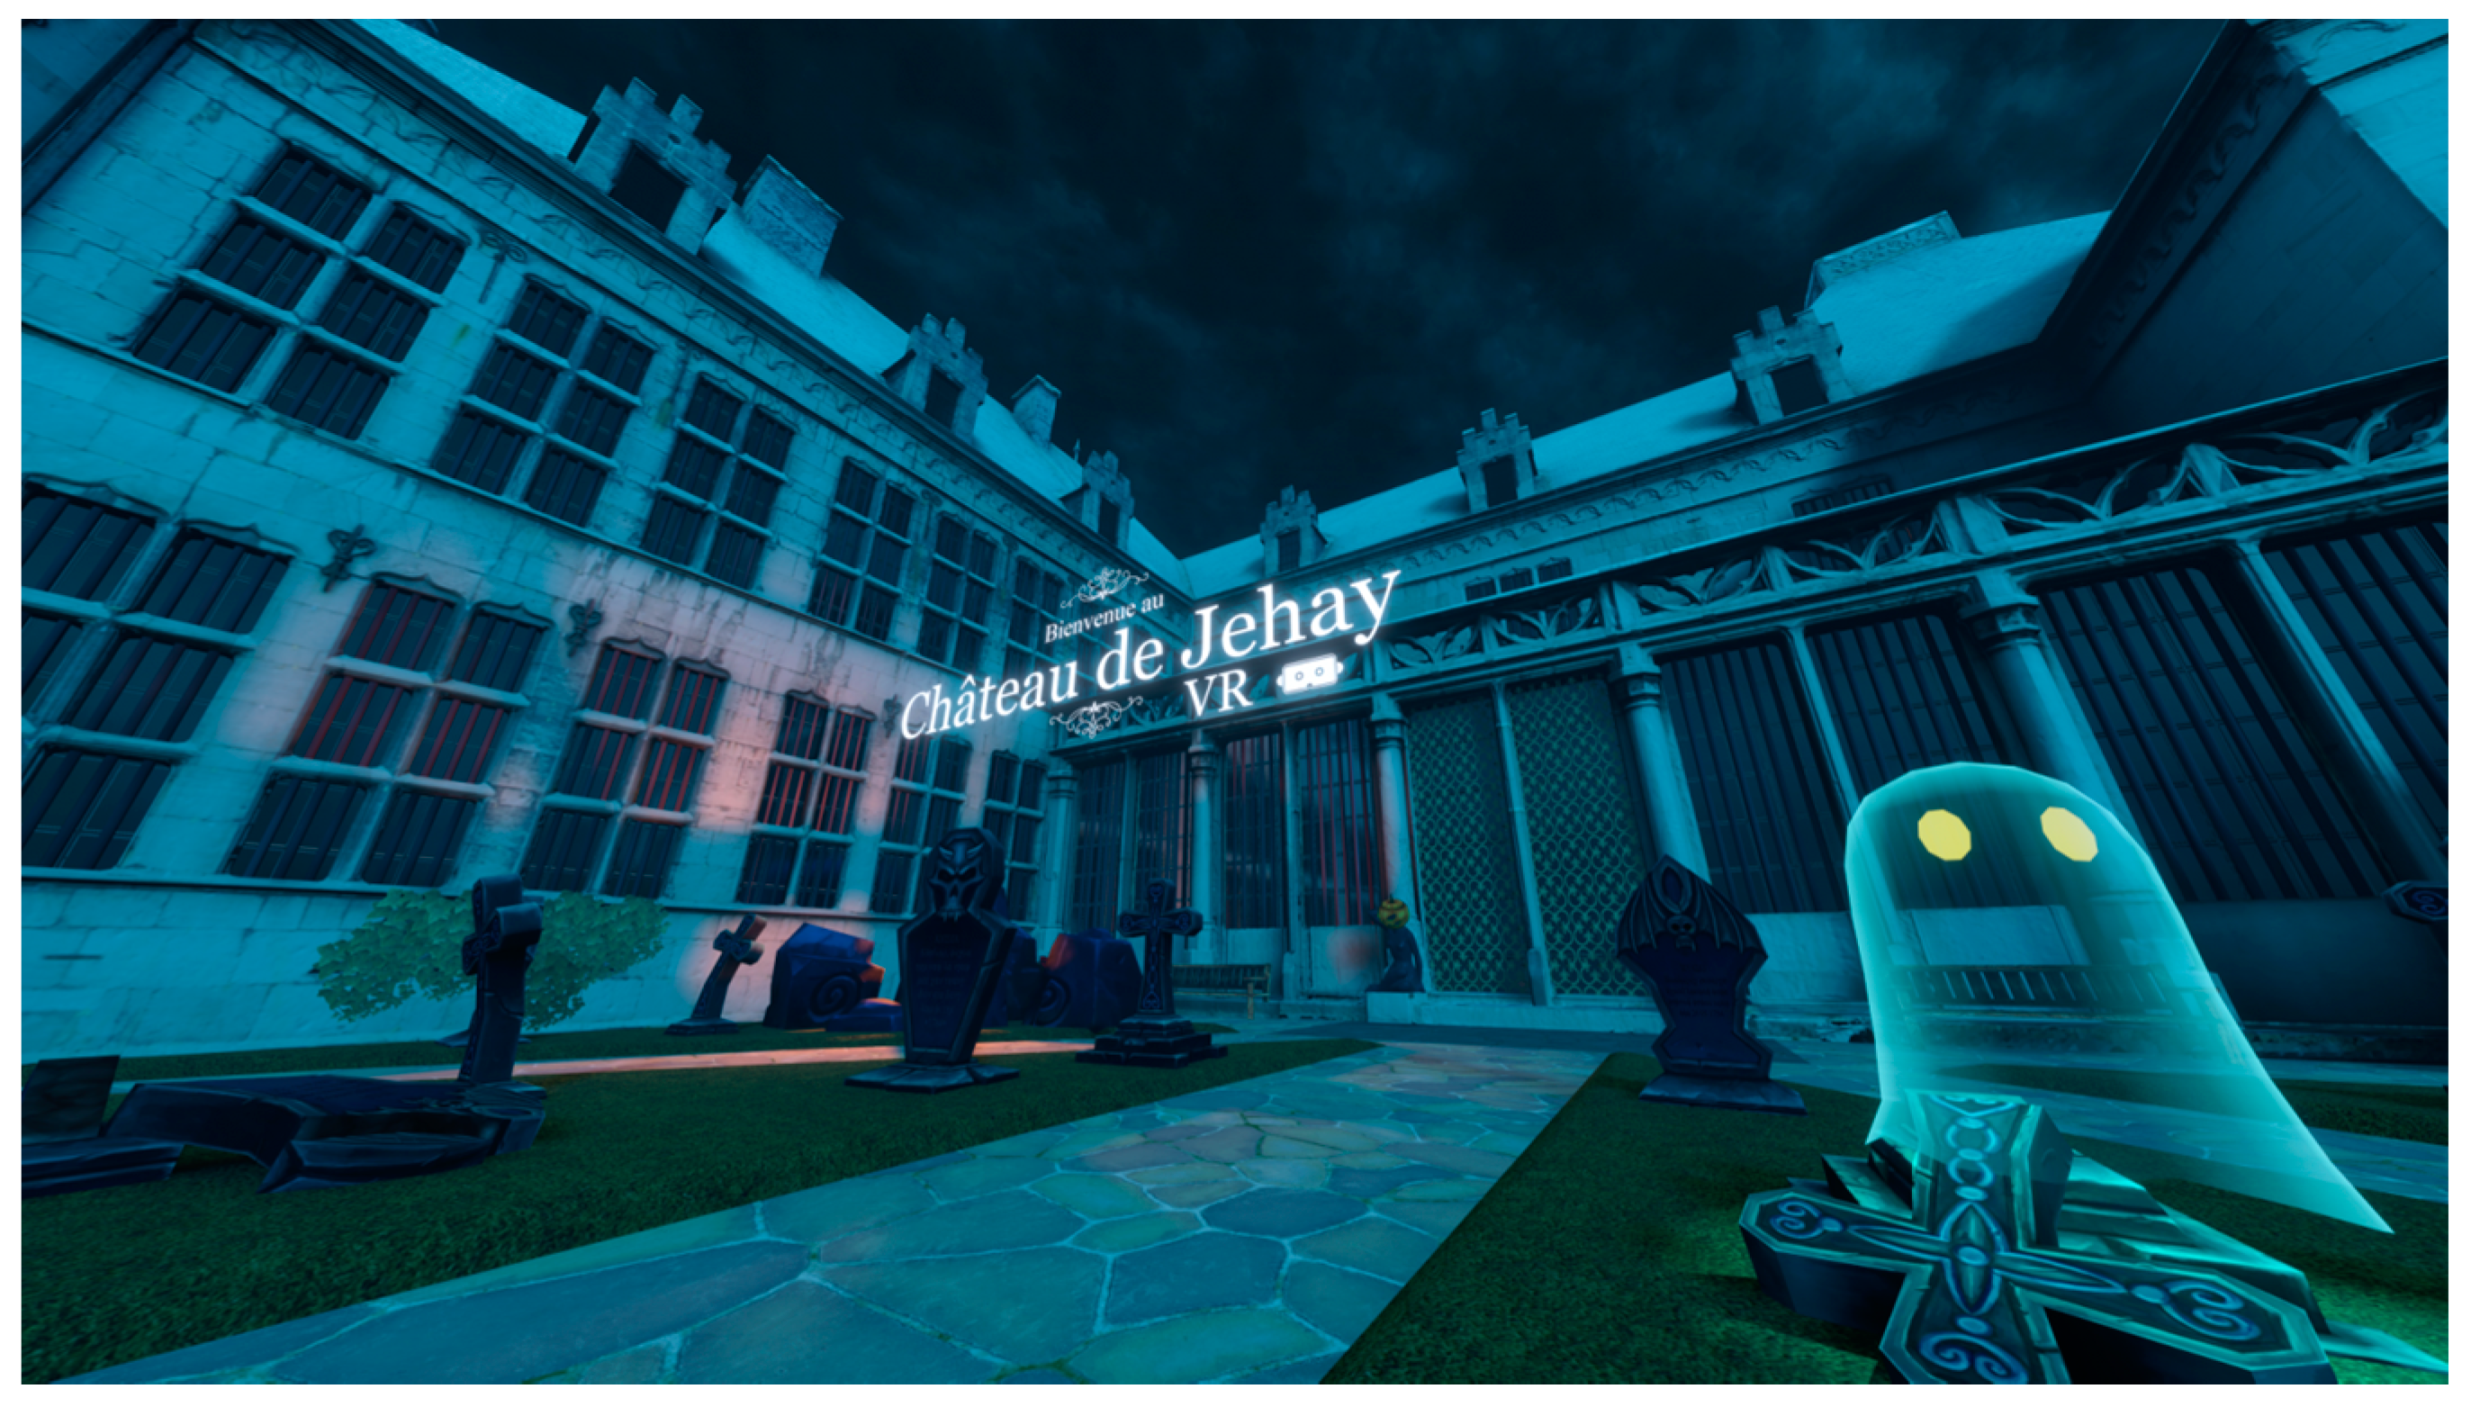
Moreover, reality capture data as a support for VR environments largely eases the application update throughout the development. Indeed, during the feedback iteration phases with the client, we were able to quickly modify the different elements populating the VR application (mesh complexity, 3D temporal curation, environment parameters, textures, etc.) which would not be the case if it was based on a 360° video for example. The georeferencing of data also permits the swapping in place of all the data for quick tests to assess the optimal geometric complexity for the on-site hardware configurations. Furthermore, this characteristic stands even after the development. This allowed us to quickly create a parallel version around the theme of Halloween built upon our original game by solely modifying the lighting properties and adding new 3D models as well as new reality captured elements at different intervals in time (see Figure 29). This modulation is an example of how to set up the virtual heritage environment so that users will be interested to explore further.
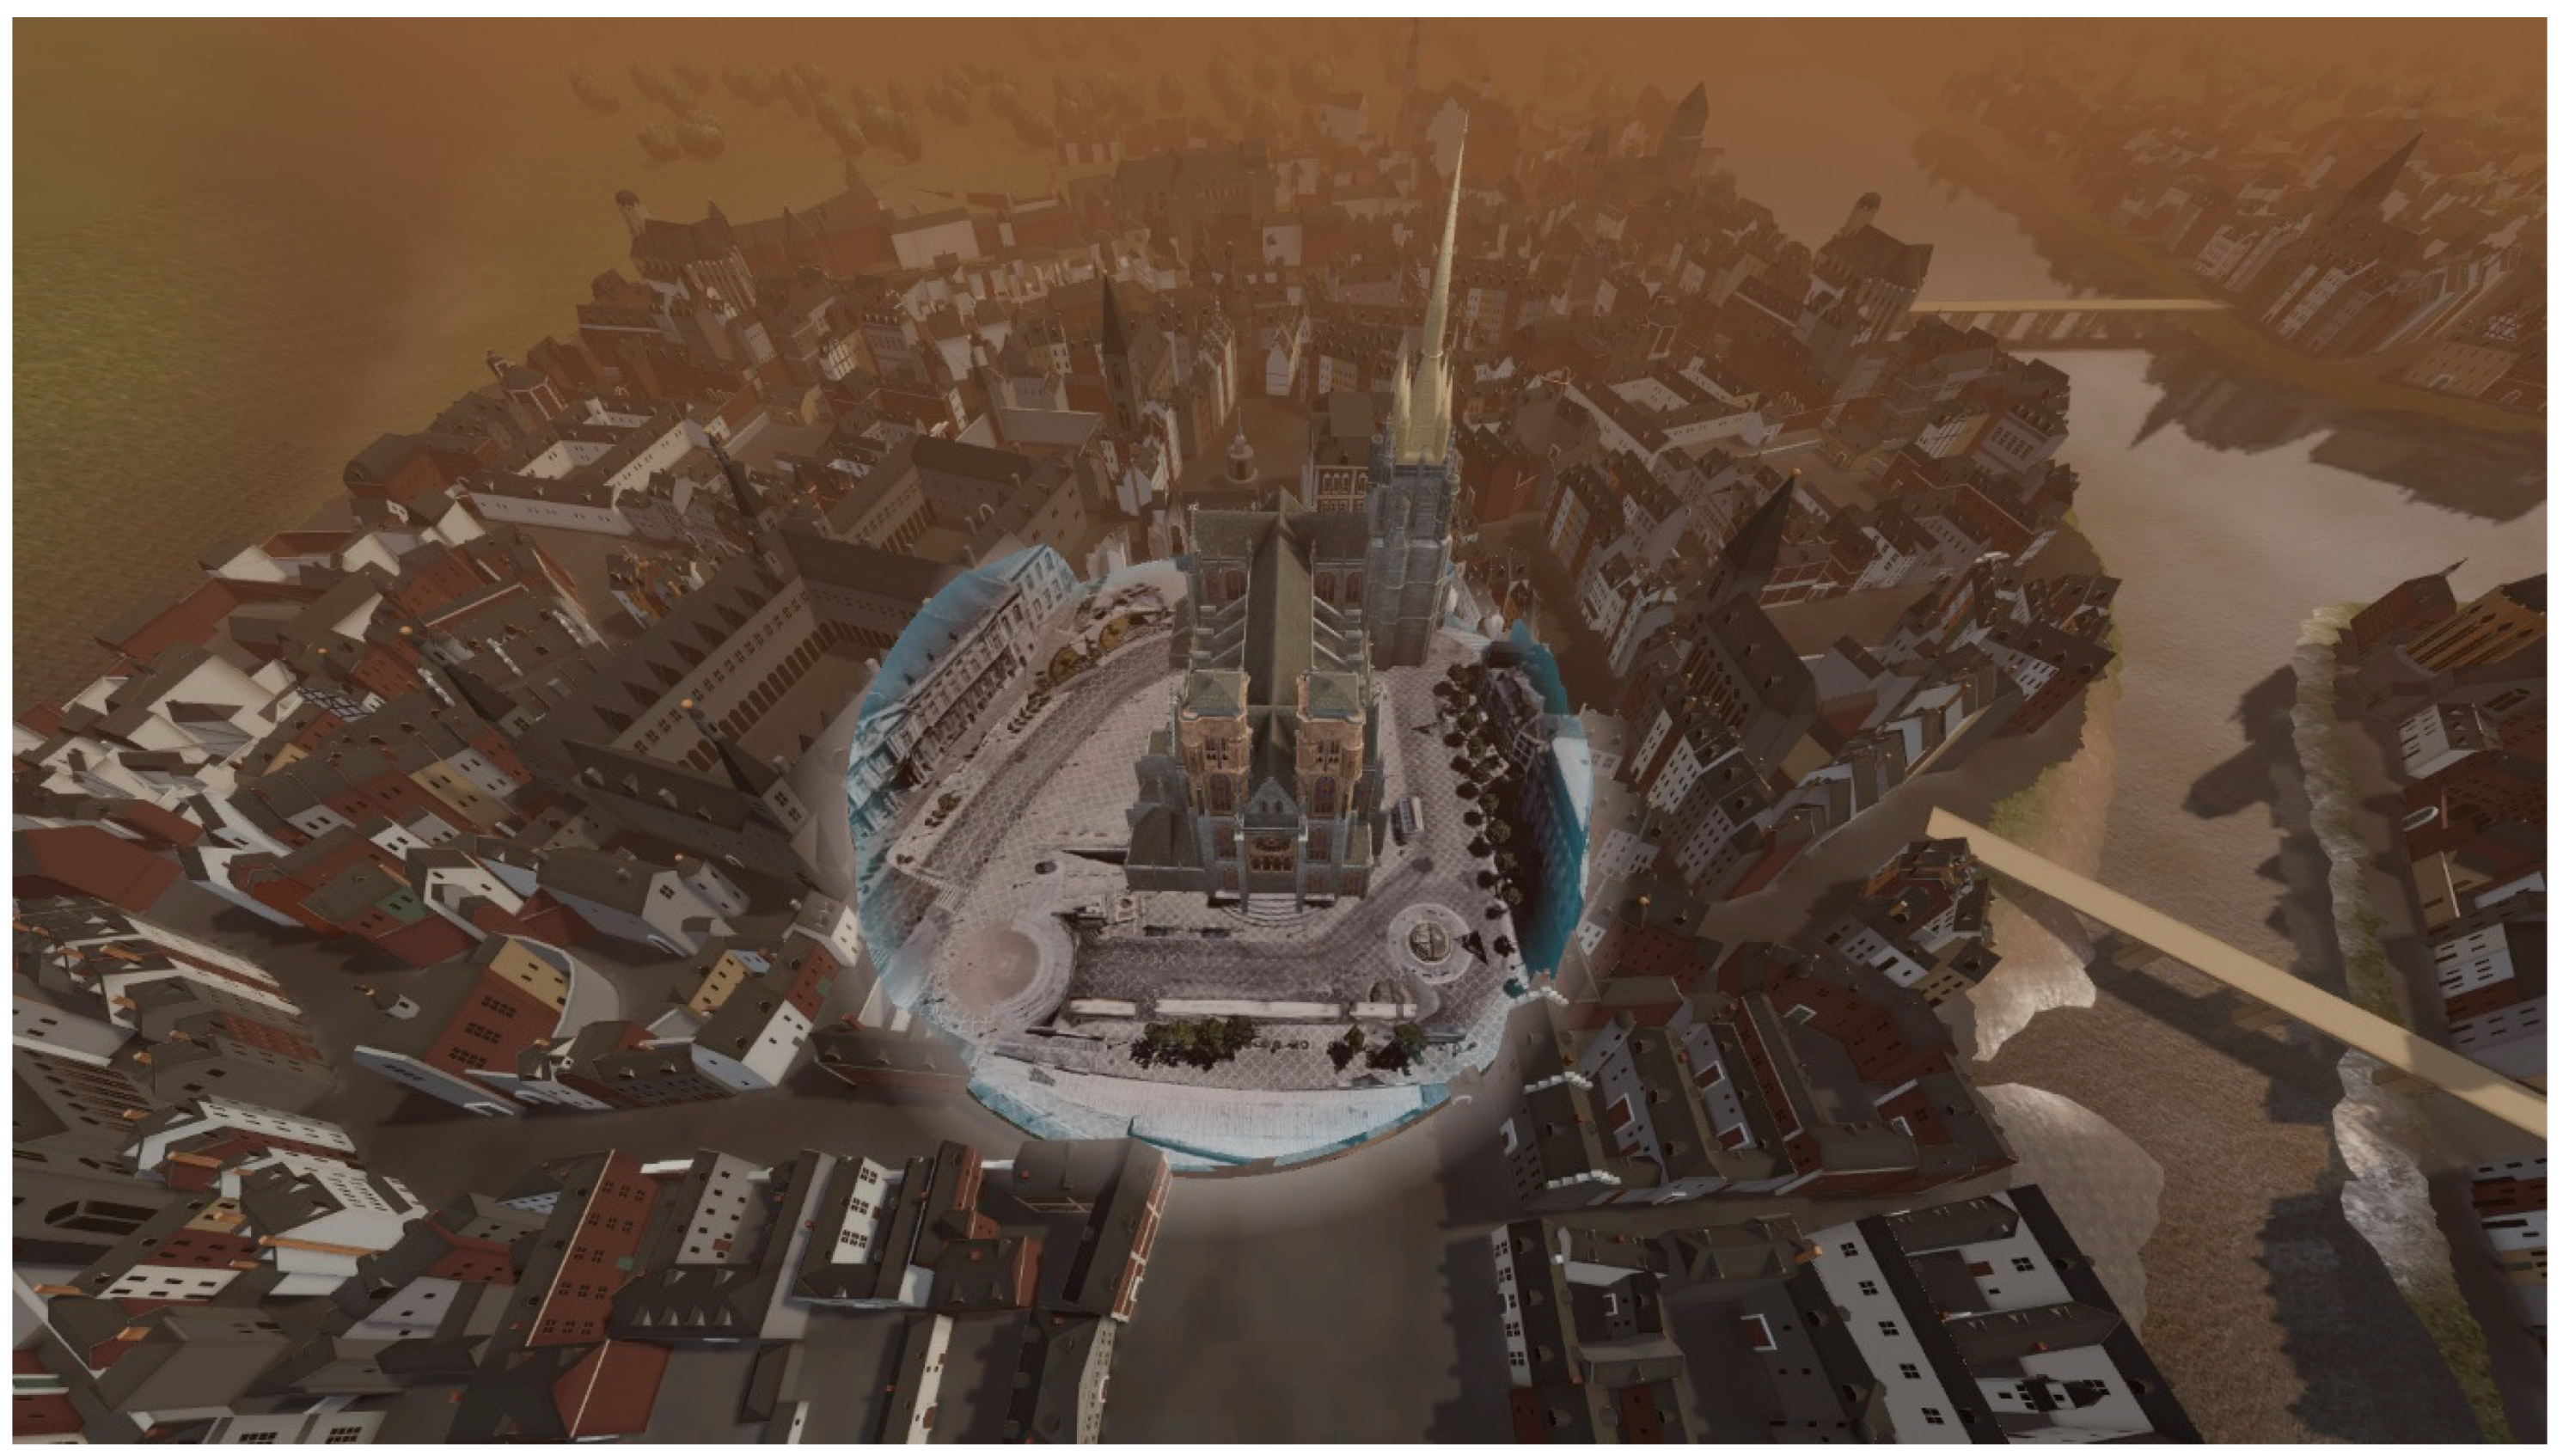
It is noteworthy that the alterable properties of a virtual environment offer opportunities outside the tourism sector. We later used the application as a study environment for user’s behavior, such as a comparison for the VR locomotion system [107], as well as the base for the initial keep track demands of a spatial information system. Additionally, usages were found in other fields such as psychology and architecture. In psychology, the application was expanded to study the phobia of a user inside a realistic environment. In architecture, the immersion was suitable to study the structure of the castle’s building. Furthermore, the V-HS design was used and adapted to create a multi-modal immersive experience to recreate a lost or hidden environment. It lead to a better comprehension of the site and allowed people to discover important changes that are no longer visible, as illustrated in Figure 30 and presented in Supplementary Materials. These advances extend over possibilities given by references [78,79,80] and highlight the multi-user, generalization, and navigation adaptability of our system.
Limitations were encountered during the testing phases of the development. Indeed, while most of our testers were quickly getting familiar with the controls, some subjects not accustomed to VR felt uncomfortable using the headset. It is more problematic as the personnel of the castle had to spare a lot of time explaining how the VR environment worked, which is unpractical for large groups even if all the controls were indicated inside the game. For this reason, a simplified version using only the boat tour around the castle, which did not require any controls, was designed. It provides a solution on how to ease the navigation in a virtual heritage environment to prevent users from leaving early. This highlights the flexibility of the virtual heritage system to handle changes rapidly by following the proposed user-centric design.
Hardware capabilities were another limitation. Concerning the headset, different problems occurred that disrupted the user’s immersion such as the weight, the wire netting around the user and if the user is wearing glasses (the glasses would not fit inside the headset). As mentioned in Section 5.3, a major part of the workflow is spent on the integration of the data inside the virtual environment. With the current state of hardware capabilities, this means meeting the hardware capabilities while maximizing the quality of the environment. We recall from our literature review that this was one of the first concerns about the implication of VR on the tourism sector by the author in [18]. We observe that even if improvements have been made regarding the state of this technology, additional progress is still necessary to deliver a comfortable user experience.
These concerns brought to our attention the importance of the context in which the immersion takes place. Even if developers are cautious about the ease of use of the application, a focused methodology is required through the user-centric design. The iterative steps should provide future users with enough information to get easily familiar with the application and the proper hardware setup that needs to be available to facilitate a user’s experience. As such, further studies are needed to weight the importance of these parameters and how to improve user experience on-site.
Furthermore, as mentioned in Section 4, this article covers only the first stages of the work which consisted of acquiring 3D data and the development of the virtual reality application for a user-centric design. As such, an additional study needs to complete the other stage of the workflow which would benefit from a detailed study of the user’s feedback over the application.
The provided workflow is based on existing tools for a direct replication of the experiment depending on the level of sophistication one needs. It includes the idea that oriented our choice toward the specific acquisition design presented in Section 4.2 and the VR features presented in Section 4.4. While we had access to several surveying techniques and hardware/software solutions, the workflow is easily customizable to create a full low-cost approach. It will mainly impact the level of automation, the human and machine time needed as well as the geometric reconstruction’s accuracy. It is interesting to note that in that case, the workflow would orient the sensory choice toward terrestrial photogrammetry approaches, which then would permit better control of the color mapping fidelity onto the generated mesh.
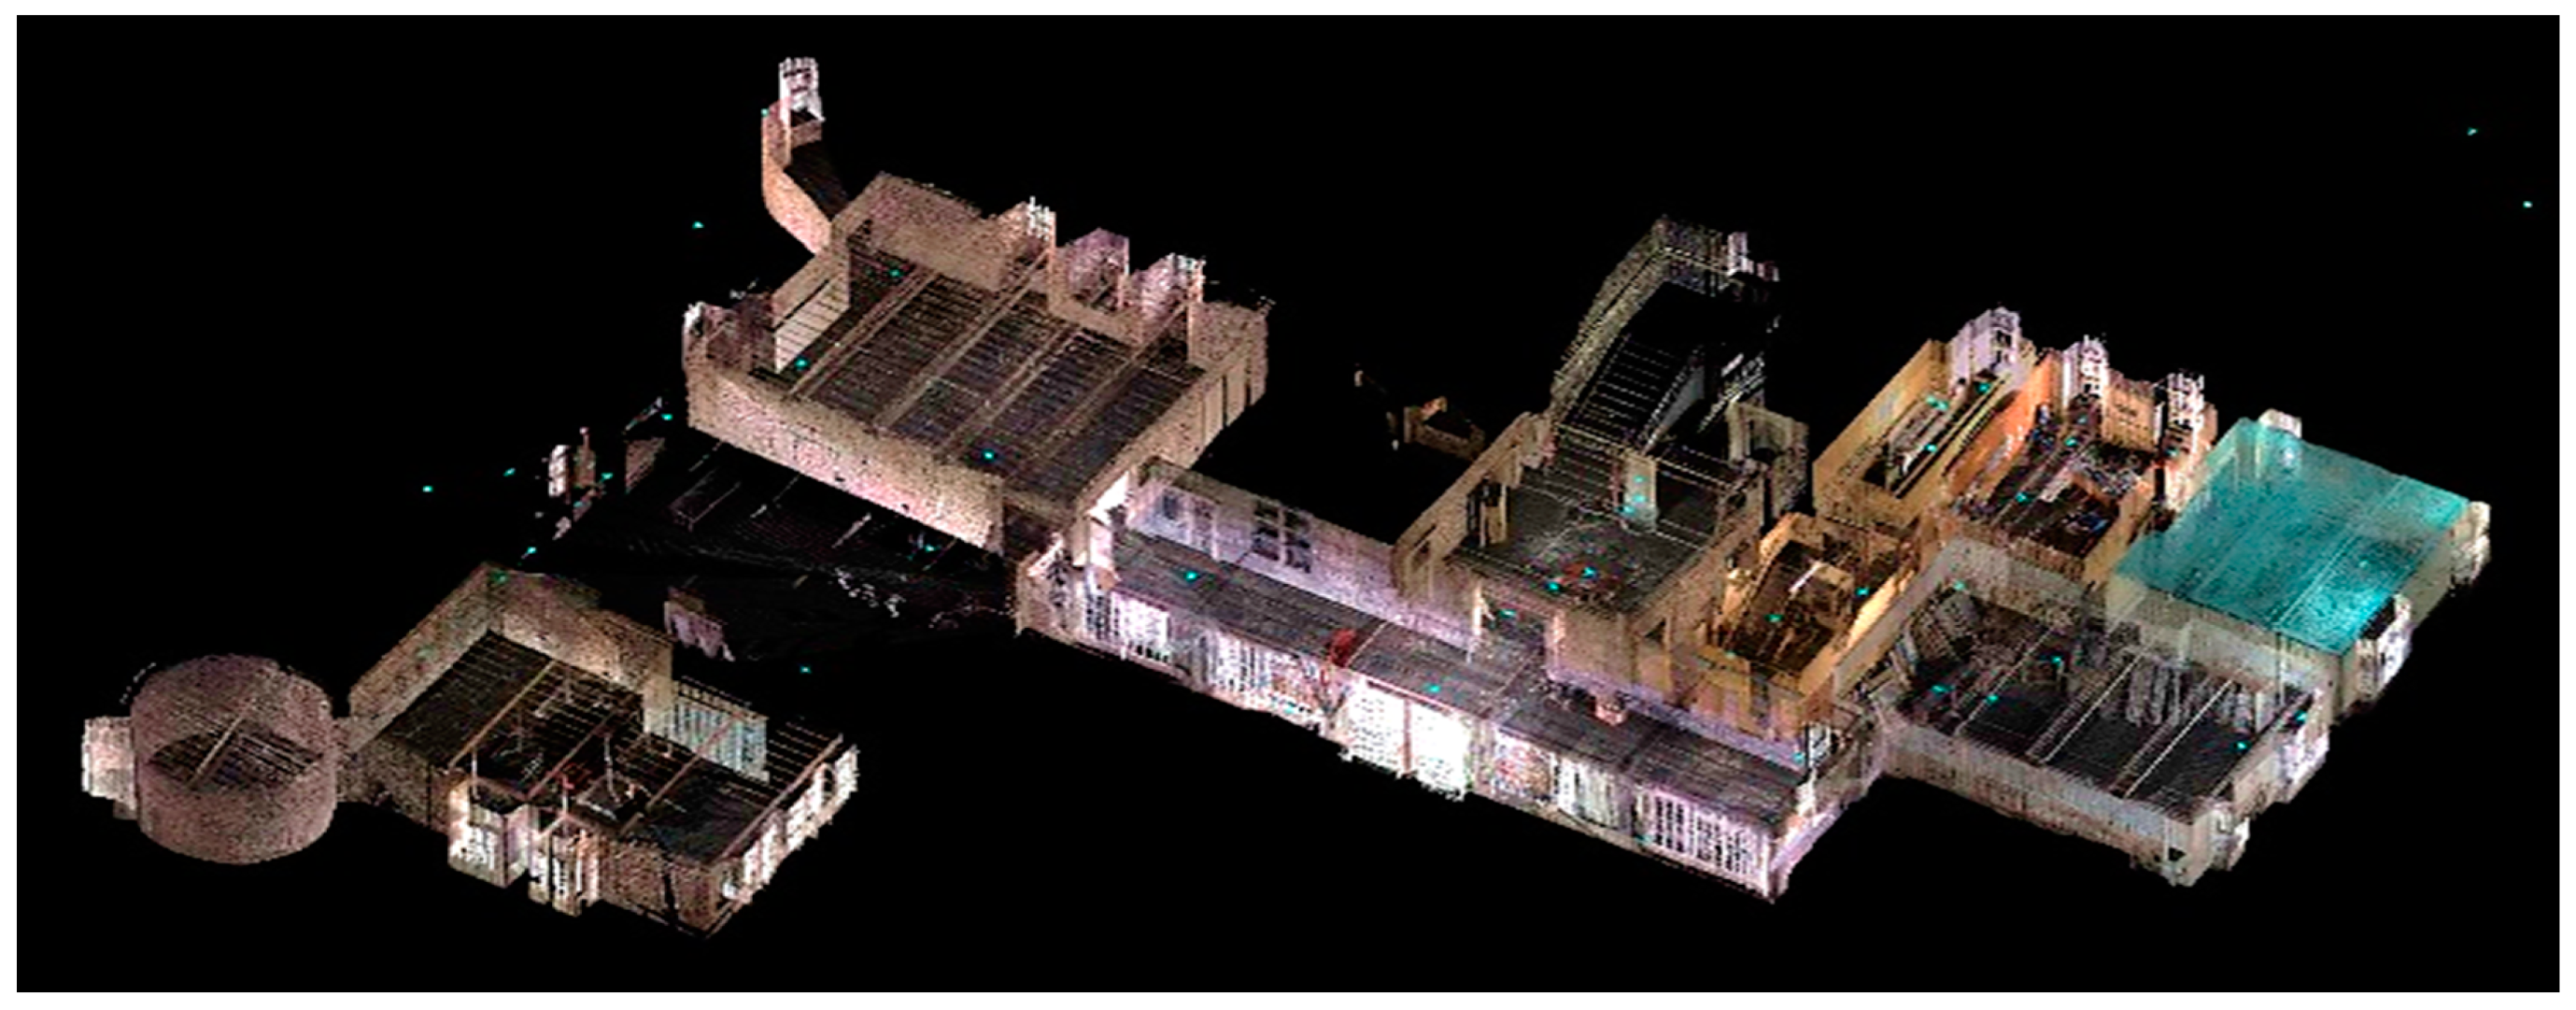
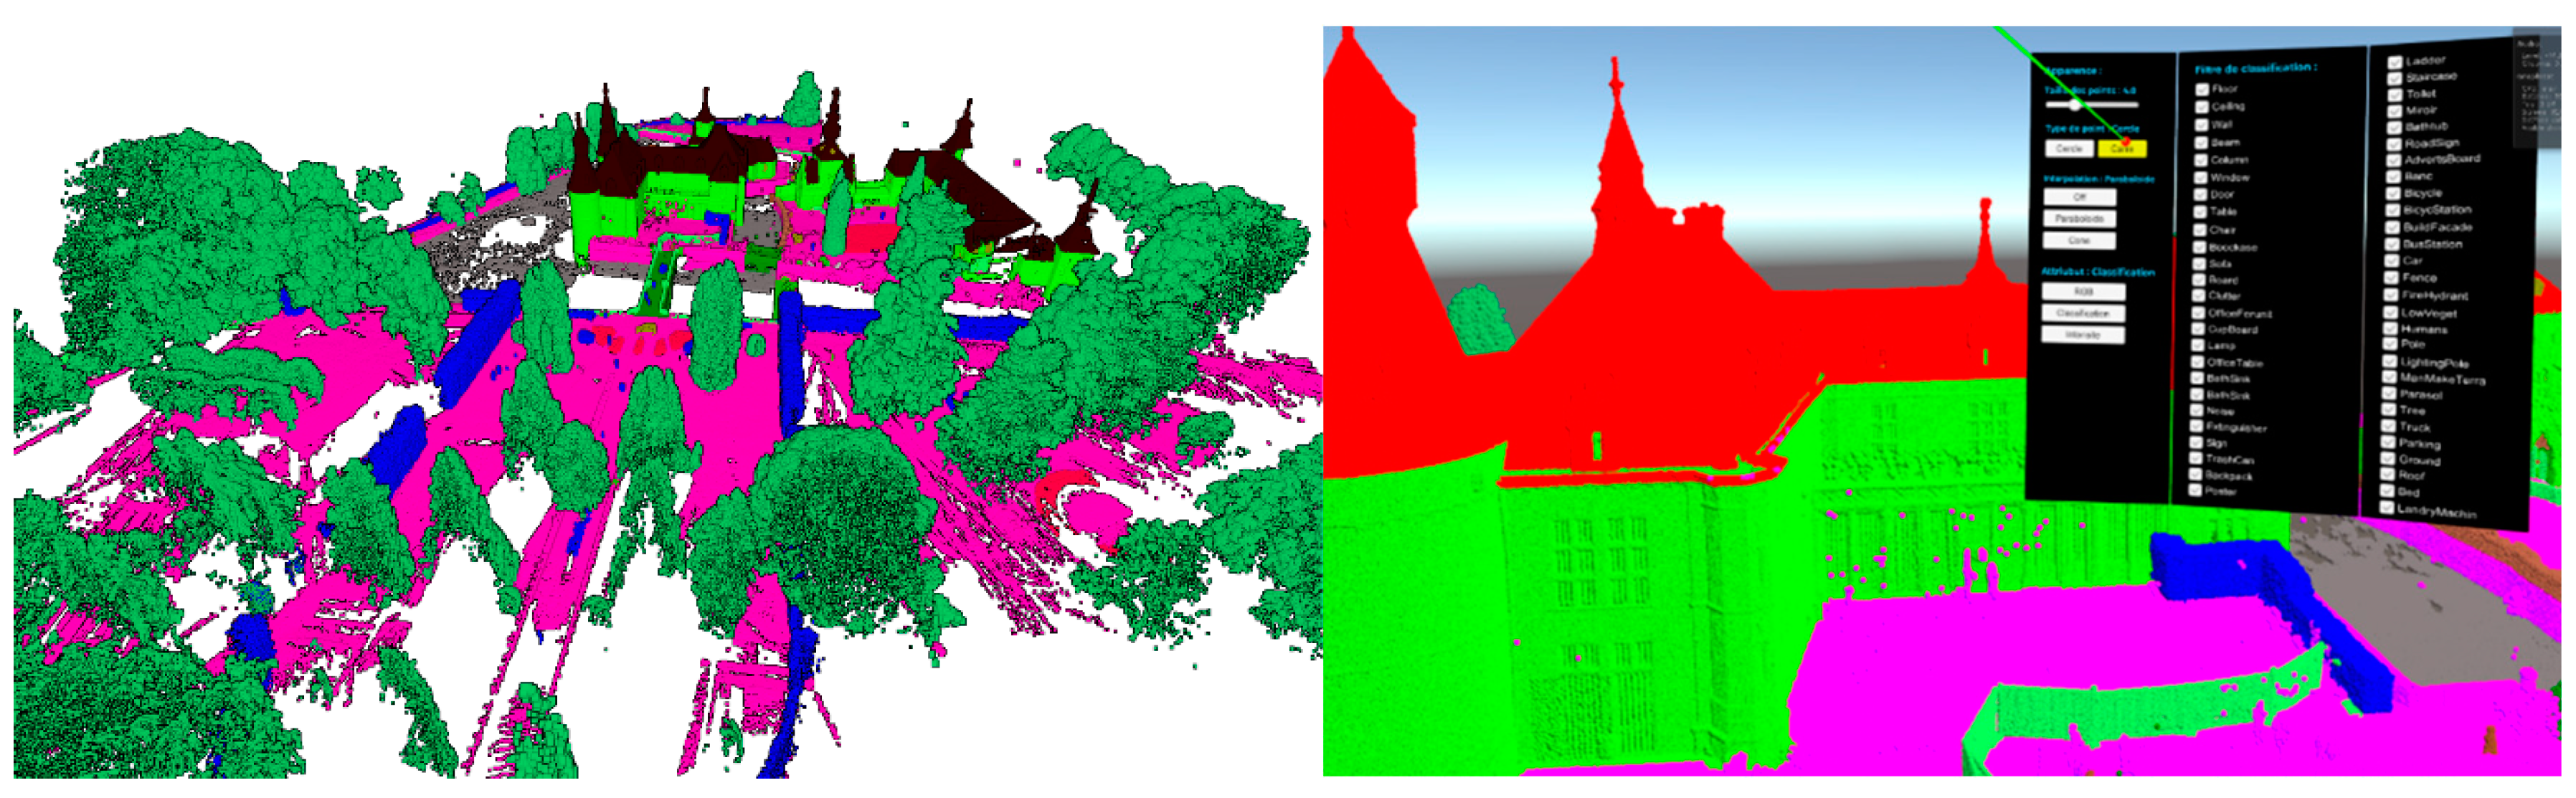
Moreover, the 3D data processing phases toward a virtual reality application proved to be highly dependent on the actual state of the VR technology. It first translated into a data derivation phase to transform point clouds into mesh elements. The current research investigates a direct use of point clouds in VR set-ups to better streamline the framework and leverage point-based rendering (Figure 31).
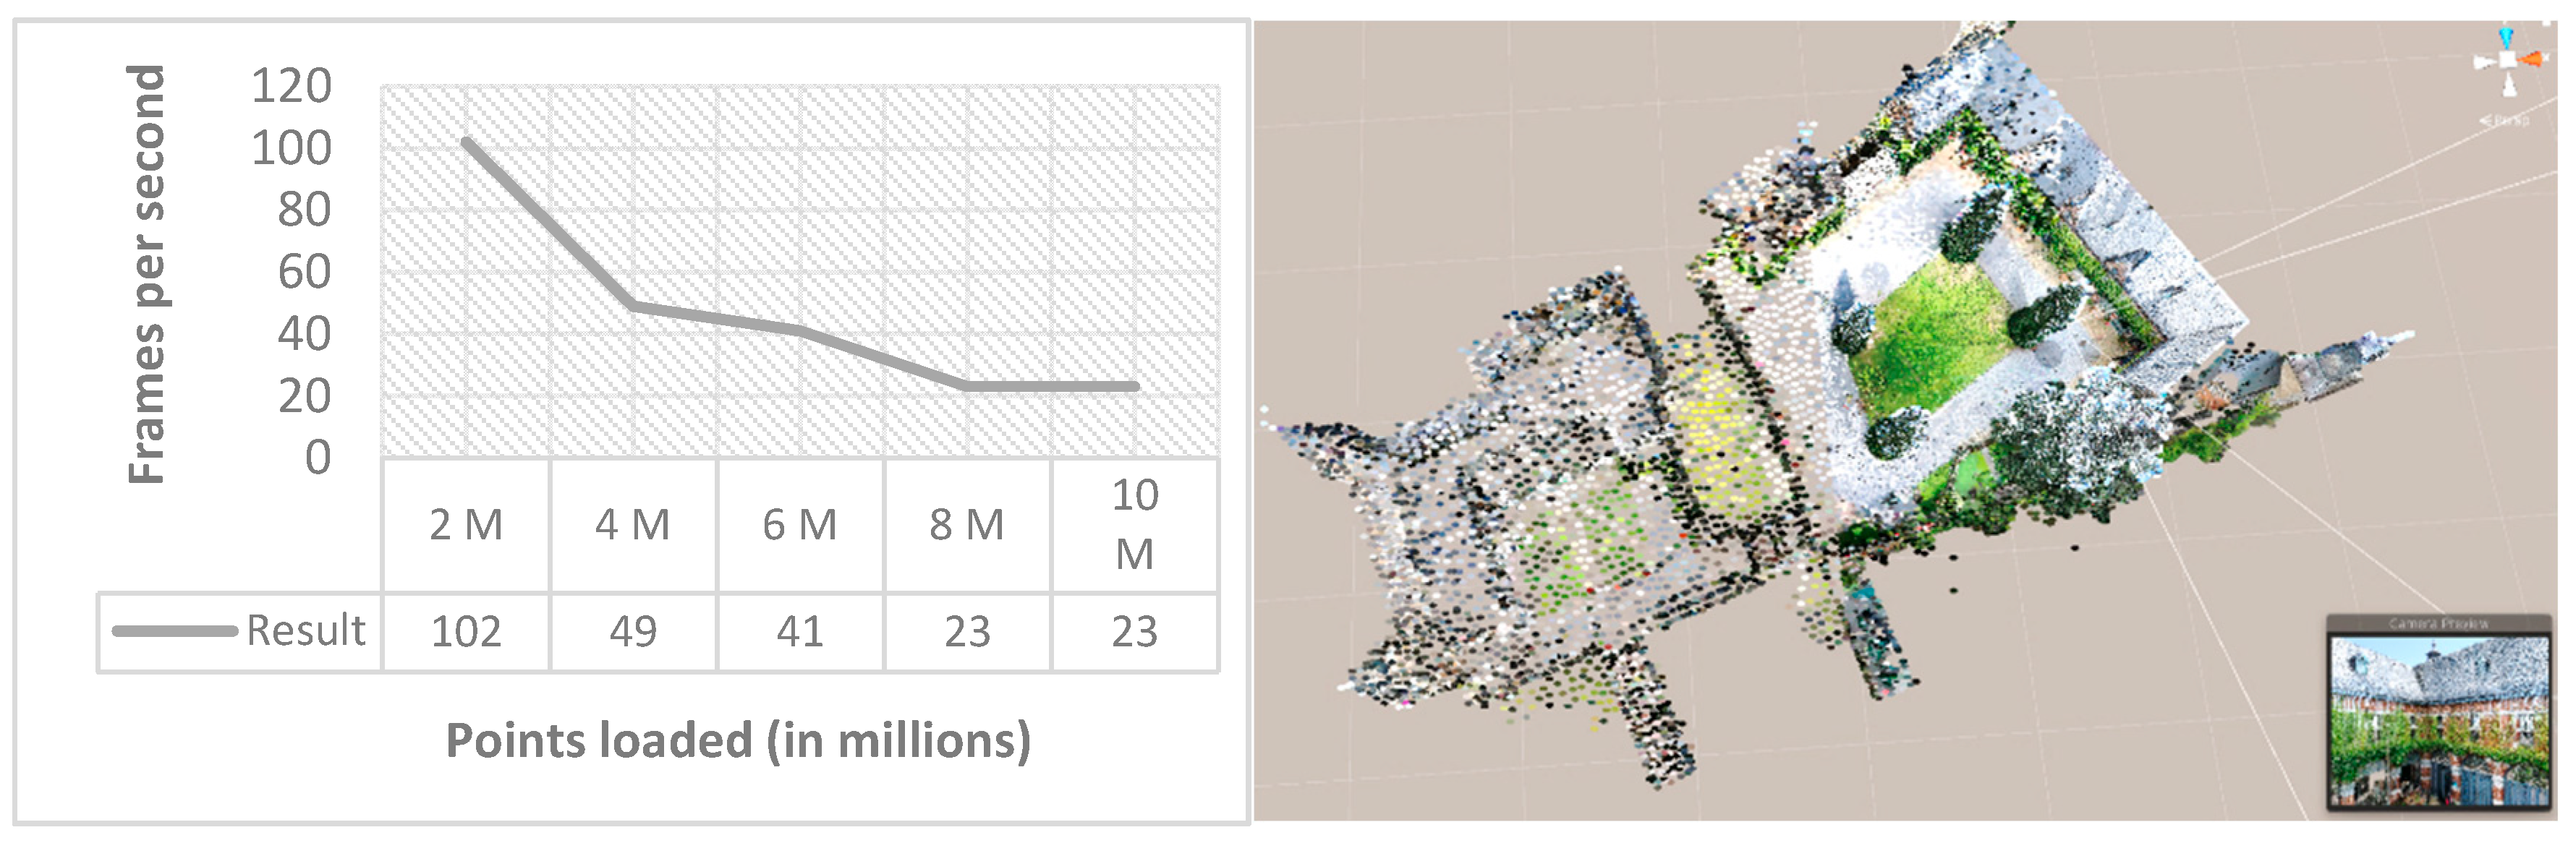
The first results are very encouraging and achieved VR-ready performances when using a spatial structure (modified nested octree) to keep a targeted number of points to be displayed (Figure 32).
A semantic modeling approach, such as the one presented in [108], is an interesting perspective that will be investigated. Additionally, our approach was aimed at optimizing the provided comfort and immersion to the user by the techniques and interactions described in Section 4 and Section 5. As the hardware and software landscape rapidly changes, the enhanced immersive and graphical capabilities will better handle raw point cloud inputs, facilitating the raw data re-use for V-HS.
Regarding the mode of locomotion in a VR application, it is important to note that several presented modes require a different degree of pre-processing. Automatic movement requires the most ahead-of-time input, as a meaningful path of exploration covering the points of interest in the scene has to be implemented. Both the move in place and teleportation modes require the recognition of areas that are feasible to walk on or teleport to. However, multi-touch movement is a very motivating locomotion system as there is no need for such a requirement opening to a fully automatic VR environment creation. Indeed, as the transformation parameters are computed independently from any scene content, it makes it ideal for the visualization of 3D point clouds, giving interesting research perspectives for future work on 3D point clouds to VR environments.
Finally, in a more transversal note, this experiment shows the possibility given by conceptual and modular bricks to establish a more sustainable approach built around a database structure communicating with different interfaces and deliverables. It comes at a cost: we are moving away from the “one-shot” logic and site managers must, therefore, acquire new skills to be able to support the development and maintenance of the system while using and enriching it optimally. Nevertheless, it shows that technological bricks can be added to provide additional outputs without remaking everything from the beginning, which highly contributes to interoperable workflows. Moreover, the V-HS can be used for other use cases as hinted in the previous sections, particularly for efficiently managing semantics and knowledge on top of spatial data.
7. Conclusions
The sustainability of a VR system demands ways of managing the addition of new data (and new types of data) and adapting to new demands (output) using the latest technology. What is important is not the techniques implemented, but the management of the integration of these evolutions into a modular “system”. It is therefore essential to move away from the current trend of separating achievements (preservation vs. visits for non-specialists) to allow a more sustainable approach through evolutionary systems. The provided workflow is based on existing tools for a direct replication of the experiment depending on the level of sophistication one needs. It includes ideas on how to design a user-centric VR application and a concrete illustration on the use case of the castle of Jehay. We propose detailed conceptual meta-models that aim at providing clear guidelines when creating user-centric VR applications from reality capture data. We show that user feedback is key to the success of the application design and that interaction modes, as well as rendering techniques, should often be multi-faceted to cope with independent limitations. Future work will investigate better ways to incorporate reality capture data modalities (e.g., point clouds) without heavy geometric and scene optimizations.
Supplementary Materials
Videos of the castle of Jehay’s VR application are available for download at the following link: https://dox.ulg.ac.be/index.php/s/WS237YvcciHGGsL—videos of the Archeoforum of Liège VR Experiments are available at the following link: https://www.dailymotion.com/video/x7uazt4.
Author Contributions
Conceptualization, F.P.; methodology, F.P.; software, F.P. and Q.V.; validation, F.P. and Q.V.; formal analysis, F.P. and Q.V.; investigation, F.P. and Q.V.; resources, F.P.; data curation, F.P.; Writing—original draft preparation, F.P.; Writing—review and editing, F.P. and R.B.; visualization, F.P., Q.V. and C.M.; supervision, F.P.; project administration, F.P., R.B. and L.K. All authors have read and agreed to the published version of the manuscript.
Funding
This research was supported by “ASBL de gestion du château de Jehay” and partially funded by the European Regional Development Fund, within the Terra Mosana Interreg EMR project.
Acknowledgments
We acknowledge all the members of the castle of Jehay and the “Province de Liege” for their open-minded exchanges. We also would like to express our warm thanks to the various reviewers for their pertinent remarks.
Conflicts of Interest
The authors declare no conflict of interest.
References
- Ortiz, P.; Sánchez, H.; Pires, H.; Pérez, J.A. Experiences about fusioning 3D digitalization techniques for cultural heritage documentation. In Proceedings of the ISPRS Commission V Symposium ‘Image Engineering and Vision Metrology’, Dresden, Germany, 25–27 September 2006; pp. 224–229. [Google Scholar]
- Mayer, H.; Mosch, M.; Peipe, J. Comparison of photogrammetric and computer vision techniques: 3D reconstruction and visualization of Wartburg Castle. In Proceedings of the XIXth International Symposium, CIPA 2003: New Perspectives to Save Cultural Heritage, Antalya, Turkey, 30 September–4 October 2003; pp. 103–108. [Google Scholar]
- Koch, M.; Kaehler, M. Combining 3D laser-Scanning and close-range Photogrammetry—An approach to Exploit the Strength of Both methods. In Proceedings of the Computer Applications to Archaeology, Williamsburg, VA, USA, 22–26 March 2009; pp. 22–26. [Google Scholar]
- Bekele, M.K.; Pierdicca, R.; Frontoni, E.; Malinverni, E.S.; Gain, J. A survey of augmented, virtual, and mixed reality for cultural heritage. J. Comput. Cult. Herit. 2018, 11, 1–36. [Google Scholar] [CrossRef]
- Kersten, T.P.; Tschirschwitz, F.; Deggim, S.; Lindstaedt, M. Virtual reality for cultural heritage monuments—from 3D data recording to immersive visualisation. In Proceedings of the Euro-Mediterranean Conference, Nicosia, Cyprus, 29 October 2018; Springer: Cham, Switzerland, 2018; pp. 74–83. [Google Scholar]
- Santana, M. Heritage recording, documentation and information systems in preventive maintenance. Reflect. Prev. Conserv. Maint. Monit. Monum. Sites 2013, 6, 10. [Google Scholar] [CrossRef] [Green Version]
- Chiabrando, F.; Donato, V.; Lo Turco, M.; Santagati, C. Cultural Heritage Documentation, Analysis and Management Using Building Information Modelling: State of the Art and Perspectives BT. In Mechatronics for Cultural Heritage and Civil Engineering; Ottaviano, E., Pelliccio, A., Gattulli, V., Eds.; Springer International Publishing: Cham, Switzerland, 2018; pp. 181–202. ISBN 978-3-319-68646-2. [Google Scholar]
- Liu, X.; Wang, X.; Wright, G.; Cheng, J.; Li, X.; Liu, R. A State-of-the-Art Review on the Integration of Building Information Modeling (BIM) and Geographic Information System (GIS). Isprs Int. J. Geo-Inf. 2017, 6, 53. [Google Scholar] [CrossRef] [Green Version]
- Poux, F.; Billen, R. A Smart Point Cloud Infrastructure for intelligent environments. In Laser Scanning: An Emerging Technology in Structural Engineering; Lindenbergh, R., Belen, R., Eds.; ISPRS Book Series; Taylor & Francis Group/CRC Press: Boca Raton, FL, USA, 2019. [Google Scholar]
- Poux, F.; Hallot, P.; Neuville, R.; Billen, R. Smart point cloud: Definition and remaining challenges. Isprs Ann. Photogramm. Remote. Sens. Spat. Inf. Sci. 2016, IV-2/W1, 119–127. [Google Scholar] [CrossRef] [Green Version]
- Palomar, I.J.; García Valldecabres, J.L.; Tzortzopoulos, P.; Pellicer, E. An online platform to unify and synchronise heritage architecture information. Autom. Constr. 2020, 110, 103008. [Google Scholar] [CrossRef]
- Dutailly, B.; Feruglio, V.; Ferrier, C.; Chapoulie, R.; Bousquet, B.; Bassel, L.; Mora, P.; Lacanette, D. Accéder en 3D aux données de terrain pluridisciplinaires-un outil pour l’étude des grottes ornées. In Proceedings of the Le réel et le virtuel, Marseille, France, 9–11 May 2019. [Google Scholar]
- Potenziani, M.; Callieri, M.; Scopigno, R. Developing and Maintaining a Web 3D Viewer for the CH Community: An Evaluation of the 3DHOP Framework. In Proceedings of the GCH, Vienna, Austria, 12–15 November 2018; pp. 169–178. [Google Scholar]
- Cheong, R. The virtual threat to travel and tourism. Tour. Manag. 1995, 16, 417–422. [Google Scholar] [CrossRef]
- Perry Hobson, J.S.; Williams, A.P. Virtual reality: A new horizon for the tourism industry. J. Vacat. Market. 1995, 1, 124–135. [Google Scholar] [CrossRef]
- Musil, S.; Pigel, G. Can Tourism be Replaced by Virtual Reality Technology? In Information and Communications Technologies in Tourism; Springer: Vienna, Austria, 1994; pp. 87–94. [Google Scholar]
- Williams, P.; Hobson, J.P. Virtual reality and tourism: Fact or fantasy? Tour. Manag. 1995, 16, 423–427. [Google Scholar] [CrossRef]
- Perry Hobson, J.S.; Williams, P. Virtual Reality: The Future of Leisure and Tourism? World Leis. Recreat. 1997, 39, 34–40. [Google Scholar] [CrossRef]
- Google’s latest VR app lets you gaze at prehistoric paintings Engadget. Available online: www.engadget.com (accessed on 28 March 2020).
- Tsingos, N.; Gallo, E.; Drettakis, G. Perceptual audio rendering of complex virtual environments. Acm Trans. Graph. (Tog) 2004, 23, 249–258. [Google Scholar] [CrossRef]
- Dinh, H.Q.; Walker, N.; Hodges, L.F.; Song, C.; Kobayashi, A. Evaluating the importance of multi-sensory input on memory and the sense of presence in virtual environments. In Proceedings of the IEEE Virtual Reality (Cat. No. 99CB36316), Houston, TX, USA, 13–17 March 1999; pp. 222–228. [Google Scholar]
- Tussyadiah, I.P.; Wang, D.; Jung, T.H.; tom Dieck, M.C. Virtual reality, presence, and attitude change: Empirical evidence from tourism. Tour. Manag. 2018, 66, 140–154. [Google Scholar] [CrossRef]
- Top Trends in the Gartner Hype Cycle for Emerging Technologies, 2017. Smarter with Gartner. Available online: www.gartner.com (accessed on 28 March 2020).
- Han, D.-I.D.; Weber, J.; Bastiaansen, M.; Mitas, O.; Lub, X. Virtual and augmented reality technologies to enhance the visitor experience in cultural tourism. In Augmented Reality and Virtual Reality; Springer: Nature, Switzerland, 2019; pp. 113–128. [Google Scholar] [CrossRef]
- Guttentag, D.A. Virtual reality: Applications and implications for tourism. Tour. Manag. 2010, 31, 637–651. [Google Scholar] [CrossRef]
- Jacobson, J.; Ellis, M.; Ellis, S.; Seethaler, L. Immersive Displays for Education Using CaveUT. In Proceedings of the EdMedia + Innovate Learning, Montreal, QC, Canada, 27 June–2 July 2005; Kommers, P., Richards, G., Eds.; Association for the Advancement of Computing in Education (AACE): Montreal, QC, Canada, 2005; pp. 4525–4530. [Google Scholar]
- Mikropoulos, T.A. Presence: A unique characteristic in educational virtual environments. Virtual Real. 2006, 10, 197–206. [Google Scholar] [CrossRef]
- Roussou, M. Learning by doing and learning through play: An exploration of interactivity in virtual environments for children. Comput. Entertain. (Cie) 2004, 2, 10. [Google Scholar] [CrossRef]
- Gimblett, H.R.; Richards, M.T.; Itami, R.M. RBSim: Geographic Simulation of Wilderness Recreation Behavior. J. For. 2001, 99, 36–42. [Google Scholar]
- Marasco, A.; Buonincontri, P.; van Niekerk, M.; Orlowski, M.; Okumus, F. Exploring the role of next-generation virtual technologies in destination marketing. J. Destin. Market. Manag. 2018, 9, 138–148. [Google Scholar] [CrossRef]
- Tussyadiah, I.P.; Wang, D.; Jia, C.H. Virtual reality and attitudes toward tourism destinations. In Information and Communication Technologies in Tourism 2017; Springer: Cham, Switzerland, 2017; pp. 229–239. [Google Scholar]
- Buhalis, D.; Law, R. Progress in information technology and tourism management: 20 years on and 10 years after the Internet—The state of eTourism research. Tour. Manag. 2008, 29, 609–623. [Google Scholar] [CrossRef] [Green Version]
- Wei, W.; Qi, R.; Zhang, L. Effects of virtual reality on theme park visitors’ experience and behaviors: A presence perspective. Tour. Manag. 2019, 71, 282–293. [Google Scholar] [CrossRef]
- Wilkinson, C. Childhood, mobile technologies and everyday experiences: Changing technologies = changing childhoods? Child. Geogr. 2016, 14, 372–373. [Google Scholar] [CrossRef]
- Kharroubi, A.; Hajji, R.; Billen, R.; Poux, F. Classification and integration of massive 3d points clouds in a virtual reality (VR) environment. Int. Arch. Photogramm. Remote Sens. Spat. Inf. Sci. 2019, 42, 165–171. [Google Scholar] [CrossRef] [Green Version]
- Virtanen, J.P.; Daniel, S.; Turppa, T.; Zhu, L.; Julin, A.; Hyyppä, H.; Hyyppä, J. Interactive dense point clouds in a game engine. Isprs J. Photogramm. Remote Sen. 2020, 163, 375–389. [Google Scholar] [CrossRef]
- Poux, F. The Smart Point Cloud: Structuring 3D Intelligent Point Data. Ph.D. Thesis, Université de Liège, Liège, Belgique, 2019. [Google Scholar]
- Berger, M.; Tagliasacchi, A.; Seversky, L.M.; Alliez, P.; Guennebaud, G.; Levine, J.A.; Sharf, A.; Silva, C.T. A Survey of Surface Reconstruction from Point Clouds. Comput. Graph. Forum 2017, 36, 301–329. [Google Scholar] [CrossRef] [Green Version]
- Poux, F.; Neuville, R.; Hallot, P.; Billen, R. Model for Semantically Rich Point Cloud Data. Isprs Ann. Photogramm. Remote Sens. Spat. Inf. Sci. 2017, IV-4/W5, 107–115. [Google Scholar] [CrossRef] [Green Version]
- Schütz, M.; Krösl, K.; Wimmer, M. Real-Time Continuous Level of Detail Rendering of Point Clouds. In Proceedings of the IEEE VR 2019, the 26th IEEE Conference on Virtual Reality and 3D User Interfaces, Osaka, Japan, 23–27 March 2019; pp. 1–8. [Google Scholar]
- Remondino, F. From point cloud to surface: The modeling and visualization problem. Isprs—Int. Arch. Photogramm. Remote Sens. Spat. Inf. Sci. 2003, XXXIV, 24–28. [Google Scholar]
- Koenderink, J.J.; van Doorn, A.J. Affine structure from motion. J. Opt. Soc. Am. A 1991, 8, 377. [Google Scholar] [CrossRef]
- Haala, N. The Landscape of Dense Image Matching Algorithms. J. Opt. Soc. Am. A 2013, 8, 377–385. [Google Scholar] [CrossRef]
- Quintero, M.S.; Blake, B.; Eppich, R. Conservation of Architectural Heritage: The Role of Digital Documentation Tools: The Need for Appropriate Teaching Material. Int. J. Arch. Comput. 2007, 5, 239–253. [Google Scholar] [CrossRef]
- Remondino, F. Heritage Recording and 3D Modeling with Photogrammetry and 3D Scanning. Remote Sens. 2011, 3, 1104–1138. [Google Scholar] [CrossRef] [Green Version]
- Noya, N.C.; Garcia, Á.L.; Ramirez, F.C.; García, Á.L.; Ramírez, F.C. Combining photogrammetry and photographic enhancement techniques for the recording of megalithic art in north-west Iberia. Digit. Appl. Archaeol. Cult. Herit. 2015, 2, 89–101. [Google Scholar] [CrossRef]
- Yastikli, N. Documentation of cultural heritage using digital photogrammetry and laser scanning. J. Cult. Herit. 2007, 8, 423–427. [Google Scholar] [CrossRef]
- Poux, F.; Neuville, R.; Van Wersch, L.; Nys, G.-A.; Billen, R. 3D Point Clouds in Archaeology: Advances in Acquisition, Processing and Knowledge Integration Applied to Quasi-Planar Objects. Geosciences 2017, 7, 96. [Google Scholar] [CrossRef] [Green Version]
- Tabkha, A.; Hajji, R.; Billen, R.; Poux, F. Semantic enrichment of point cloud by automatic extraction and enhancement of 360° panoramas. Isprs—Int. Arch. Photogramm. Remote Sens. Spat. Inf. Sci. 2019, XLII-2/W17, 355–362. [Google Scholar] [CrossRef] [Green Version]
- Napolitano, R.K.; Scherer, G.; Glisic, B. Virtual tours and informational modeling for conservation of cultural heritage sites. J. Cult. Herit. 2018, 29, 123–129. [Google Scholar] [CrossRef]
- Rua, H.; Alvito, P. Living the past: 3D models, virtual reality and game engines as tools for supporting archaeology and the reconstruction of cultural heritage—the case-study of the Roman villa of Casal de Freiria. J. Archaeol. Sci. 2011, 38, 3296–3308. [Google Scholar] [CrossRef]
- Poux, F.; Billen, R. Voxel-based 3D point cloud semantic segmentation: Unsupervised geometric and relationship featuring vs. deep learning methods. Isprs Int. J. Geo-Inf. 2019, 8, 213. [Google Scholar] [CrossRef] [Green Version]
- Poux, F.; Neuville, R.; Billen, R. Point Cloud Classification Of Tesserae From Terrestrial Laser Data Combined With Dense Image Matching For Archaeological Information Extraction. Isprs Ann. Photogramm. Remote Sens. Spat. Inf. Sci. 2017, IV-2/W2, 203–211. [Google Scholar] [CrossRef] [Green Version]
- Koutsoudis, A.; Vidmar, B.; Ioannakis, G.; Arnaoutoglou, F.; Pavlidis, G.; Chamzas, C. Multi-image 3D reconstruction data evaluation. J. Cult. Herit. 2014, 15, 73–79. [Google Scholar] [CrossRef]
- Mozas-Calvache, A.T.; Pérez-García, J.L.; Cardenal-Escarcena, F.J.; Mata-Castro, E.; Delgado-García, J. Method for photogrammetric surveying of archaeological sites with light aerial platforms. J. Archaeol. Sci. 2012, 39, 521–530. [Google Scholar] [CrossRef]
- Burens, A.; Grussenmeyer, P.; Guillemin, S.; Carozza, L.; Lévêque, F.; Mathé, V. Methodological Developments in 3D Scanning and Modelling of Archaeological French Heritage Site: The Bronze Age Painted Cave of “Les Fraux”, Dordogne (France). Isprs—Int. Arch. Photogramm. Remote Sens. Spat. Inf. Sci. 2013, XL-5/W2, 131–135. [Google Scholar] [CrossRef] [Green Version]
- Kai-Browne, A.; Kohlmeyer, K.; Gonnella, J.; Bremer, T.; Brandhorst, S.; Balda, F.; Plesch, S.; Lehmann, D. 3D Acquisition, Processing and Visualization of Archaeological Artifacts. In Proceedings of the EuroMed 2016: Digital Heritage. Progress in Cultural Heritage: Documentation, Preservation, and Protection, LImassol, Cyprus, 31 October–5 November 2016; Springer: Cham, Switzerland, 2016; pp. 397–408. [Google Scholar]
- Armesto-González, J.; Riveiro-Rodríguez, B.; González-Aguilera, D.; Rivas-Brea, M.T. Terrestrial laser scanning intensity data applied to damage detection for historical buildings. J. Archaeol. Sci. 2010, 37, 3037–3047. [Google Scholar] [CrossRef]
- James, M.R.; Quinton, J.N. Ultra-rapid topographic surveying for complex environments: The hand-held mobile laser scanner (HMLS). Earth Surf. Process. Landf. 2014, 39, 138–142. [Google Scholar] [CrossRef] [Green Version]
- Lauterbach, H.; Borrmann, D.; Heß, R.; Eck, D.; Schilling, K.; Nüchter, A. Evaluation of a Backpack-Mounted 3D Mobile Scanning System. Remote Sens. 2015, 7, 13753–13781. [Google Scholar] [CrossRef] [Green Version]
- Slama, C.; Theurer, C.; Henriksen, S. Manual of Photogrammetry; Slama, C., Theurer, C., Henriksen, S.W., Eds.; Taylor & Francis Group/CRC Press: Boca Raton, FL, USA, 1980; ISBN 0-937294-01-2. [Google Scholar]
- Westoby, M.J.; Brasington, J.; Glasser, N.F.; Hambrey, M.J.; Reynolds, J.M. ‘Structure-from-Motion’ photogrammetry: A low-cost, effective tool for geoscience applications. Geomorphology 2012, 179, 300–314. [Google Scholar] [CrossRef] [Green Version]
- Weinmann, M. Reconstruction and Analysis of 3D Scenes; Springer International Publishing: Cham, Switzerland, 2016; ISBN 978-3-319-29244-1. [Google Scholar]
- Remondino, F.; Spera, M.G.; Nocerino, E.; Menna, F.; Nex, F. State of the art in high density image matching. Photogramm. Rec. 2014, 29, 144–166. [Google Scholar] [CrossRef] [Green Version]
- Pix4D Terrestrial 3D Mapping Using Fisheye and Perspective Sensors-Support. Available online: https://support.pix4d.com/hc/en-us/articles/204220385-Scientific-White-Paper-Terrestrial-3D-Mapping-Using-Fisheye-and-Perspective-Sensors#gsc.tab=0 (accessed on 18 April 2016).
- Bentley 3D City Geographic Information System—A Major Step Towards Sustainable Infrastructure. Available online: https://www.bentley.com/en/products/product-line/reality-modeling-software/contextcapture (accessed on 12 February 2020).
- Agisoft LLC Agisoft Photoscan. Available online: http://www.agisoft.com/pdf/photoscan_presentation.pdf (accessed on 12 February 2020).
- nFrames. Available online: http://nframes.com/ (accessed on 12 February 2020).
- Changchang Wu VisualSFM. Available online: http://ccwu.me/vsfm/ (accessed on 12 February 2020).
- Moulon, P. openMVG. Available online: http://imagine.enpc.fr/~moulonp/openMVG/ (accessed on 12 February 2020).
- Autodesk. Autodesk: 123D catch. Available online: http://www.123dapp.com/catch (accessed on 12 February 2020).
- PROFACTOR GmbH ReconstructMe. Available online: http://reconstructme.net/ (accessed on 12 February 2020).
- Eos Systems Inc Photomodeler. Available online: http://www.photomodeler.com/index.html (accessed on 12 February 2020).
- Capturing Reality s.r.o RealityCapture. Available online: https://www.capturingreality.com (accessed on 12 February 2020).
- Bassier, M.; Vergauwen, M.; Poux, F. Point Cloud vs. Mesh Features for Building Interior Classification. Remote Sens. 2020, 12, 2224. [Google Scholar] [CrossRef]
- Gareth, J. The elements of user experience: User-centered design for the Web and beyond. Choice Rev. Online 2011, 49. [Google Scholar]
- Gasson, S. Human-Centered Vs. User-Centered Approaches to Information System Design. J. Inf. Technol. Theory Appl. 2003, 5, 29–46. [Google Scholar]
- Reunanen, M.; Díaz, L.; Horttana, T. A holistic user-centered approach to immersive digital cultural heritage installations: Case Vrouw Maria. J. Comput. Cult. Herit. 2015, 7, 1–16. [Google Scholar] [CrossRef]
- Barbieri, L.; Bruno, F.; Muzzupappa, M. User-centered design of a virtual reality exhibit for archaeological museums. Int. J. Interact. Des. Manuf. 2018, 12, 561–571. [Google Scholar] [CrossRef]
- Ibrahim, N.; Ali, N.M. A conceptual framework for designing virtual heritage environment for cultural learning. J. Comput. Cult. Herit. 2018, 11, 1–27. [Google Scholar] [CrossRef]
- Cipolla Ficarra, F.V.; Cipolla Ficarra, M. Multimedia, user-centered design and tourism: Simplicity, originality and universality. Stud. Comput. Intell. 2008, 142, 461–470. [Google Scholar]
- Loizides, F.; El Kater, A.; Terlikas, C.; Lanitis, A.; Michael, D. Presenting Cypriot Cultural Heritage in Virtual Reality: A User Evaluation. In LNCS; Springer: Cham, Switzerland, 2014; Volume 8740, pp. 572–579. [Google Scholar]
- Sukaviriya, N.; Sinha, V.; Ramachandra, T.; Mani, S.; Stolze, M. User-Centered Design and Business Process Modeling: Cross Road in Rapid Prototyping Tools. In Human-Computer Interaction–INTERACT 2007. INTERACT 2007. Lecture Notes in Computer Science; Baranauskas, C., Palanque, P., Abascal, J., Barbosa, S.D.J., Eds.; Springer: Berlin/Heidelberg, Germany, 2007; Volume 4662 LNCS, pp. 165–178. [Google Scholar] [CrossRef] [Green Version]
- Kinzie, M.B.; Cohn, W.F.; Julian, M.F.; Knaus, W.A. A user-centered model for Web site design: Needs assessment, user interface design, and rapid prototyping. J. Am. Med. Inform. Assoc. 2002, 9, 320–330. [Google Scholar] [CrossRef] [PubMed] [Green Version]
- Jung, T.; tom Dieck, M.C.; Lee, H.; Chung, N. Effects of virtual reality and augmented reality on visitor experiences in museum. In Information and Communication Technologies in Tourism 2016; Springer: Cham, Switzerland, 2016; pp. 621–635. [Google Scholar]
- Treffer, M. Un Système d’ Information Géographique 3D Pour le Château de Jehay; Définition des besoins et modélisation conceptuelle sur base de CityGML. Master’s Thesis, Université de Liège, Liège, Belgique, 2017. [Google Scholar]
- Besl, P.J.; McKay, N.D. A Method for Registration of 3-D Shapes. IEEE Trans. Pattern Anal. Mach. Intell. 1992, 14, 239–256. [Google Scholar] [CrossRef]
- AliceVision Meshroom-3D Reconstruction Software. Available online: https://alicevision.org/#meshroom (accessed on 30 July 2019).
- IGN France MicMac. Available online: https://micmac.ensg.eu/index.php/Accueil (accessed on 30 July 2019).
- Gonzalez-Aguilera, D.; López-Fernández, L.; Rodriguez-Gonzalvez, P.; Hernandez-Lopez, D.; Guerrero, D.; Remondino, F.; Menna, F.; Nocerino, E.; Toschi, I.; Ballabeni, A.; et al. GRAPHOS-open-source software for photogrammetric applications. Photogramm. Rec. 2018, 33, 11–29. [Google Scholar] [CrossRef] [Green Version]
- Garland, M. Quadric-Based Polygonal Surface Simplification. Master’s Thesis, Carnegie Mellon University, Pittsburgh, PA, USA, 1999. [Google Scholar]
- Unity. Unity-Manual: Draw Call Batching; Unity Technologies: San Francisco, CA, USA, 2017. [Google Scholar]
- Webster, N.L. High poly to low poly workflows for real-time rendering. J. Vis. Commun. Med. 2017, 40, 40–47. [Google Scholar] [CrossRef]
- Ryan, J. Photogrammetry for 3D Content Development in Serious Games and Simulations; MODSIM: San Francisco, CA, USA, 2019; pp. 1–9. [Google Scholar]
- Group, F. OpenGL Insights, 1st ed.; Cozzi, P., Riccio, C., Eds.; A K Peters/CRC Press: Boca Raton, FL, USA, 2012; ISBN 9781439893777. [Google Scholar]
- NVIDIA Corporation SDK White Paper Improve Batching Using Texture Atlases; SDK White Paper; NVIDIA: Santa Clara, CA, USA, 2004.
- Gregory, J. Game Engine Architecture; A K Peters/CRC Press: Boca Raton, FL, USA, 2014; Volume 47, ISBN 9781466560062. [Google Scholar]
- Kajiya, J.T. The Rendering Equation. Acm Siggraph Comput. Graph. 1986, 20, 143–150. [Google Scholar] [CrossRef]
- Nirenstein, S.; Blake, E.; Gain, J. Exact From-Region Visibility Culling. In Proceedings of theThirteenth Eurographics Workshop on Rendering, Pisa, Italy, 26–28 June 2002. [Google Scholar]
- LaViola, J.J., Jr. A discussion of cybersickness in virtual environments. ACM Sigchi Bull. 2000, 32, 47–56. [Google Scholar] [CrossRef]
- Templeman, J.N.; Denbrook, P.S.; Sibert, L.E. Virtual locomotion: Walking in place through virtual environments. Presence: Teleoper. Virtual Environ. 1999, 8, 598–617. [Google Scholar] [CrossRef]
- Tregillus, S.; Folmer, E. VR-STEP: Walking-in-Place using Inertial Sensing for Hands Free Navigation in Mobile VR Environments. In Proceedings of the 2016 CHI Conference on Human Factors in Computing Systems—CHI ’16, San Jose, CA, USA, 7–12 May 2016; pp. 1250–1255. [Google Scholar]
- Mccauley, M.E.; Sharkey, T.J. Cybersickness: Perception of Self-Motion in Virtual Environment. Presence Teleoper. Virtual Environ. 1992, 1, 311–318. [Google Scholar] [CrossRef]
- Parger, M.; Mueller, J.H.; Schmalstieg, D.; Steinberger, M. Human upper-body inverse kinematics for increased embodiment in consumer-grade virtual reality. In Proceedings of the 24th ACM Symposium on Virtual Reality Software and Technology, Tokyo, Japan, 28 November 2018; pp. 1–10. [Google Scholar]
- Aristidou, A.; Lasenby, J. FABRIK: A fast, iterative solver for the Inverse Kinematics problem. Graph. Model. 2011, 73, 243–260. [Google Scholar] [CrossRef]
- Maciel, A.; De, S. Extending FABRIK with model constraints. Graph. Model. Wil. Online Libr. 2015, 73, 243–260. [Google Scholar]
- Schyns, O. Locomotion and Interactions in Virtual Reality; Liège University: Liège, Belgique, 2018. [Google Scholar]
- Poux, F.; Neuville, R.; Nys, G.-A.; Billen, R. 3D Point Cloud Semantic Modelling: Integrated Framework for Indoor Spaces and Furniture. Remote Sens. 2018, 10, 1412. [Google Scholar] [CrossRef] [Green Version]
Figure 1.
Reality capture sensors. (a) A total station (TS); (b) the Leica P30 terrestrial laser scanner (TLS); (c) a full-frame camera for terrestrial photogrammetry.
Figure 1.
Reality capture sensors. (a) A total station (TS); (b) the Leica P30 terrestrial laser scanner (TLS); (c) a full-frame camera for terrestrial photogrammetry.

Figure 2.
Three-dimensional point cloud of the castle of Jehay and its surrounding from the TLS (left), cave of the castle of Jehay, top-view point cloud with TLS scan positions (right).
Figure 2.
Three-dimensional point cloud of the castle of Jehay and its surrounding from the TLS (left), cave of the castle of Jehay, top-view point cloud with TLS scan positions (right).

Figure 3.
TLS intensity-based rendering of the point cloud of the castle acquired before the renovation in February 2016 (left image), and in April 2019 during the renovation (right image).
Figure 3.
TLS intensity-based rendering of the point cloud of the castle acquired before the renovation in February 2016 (left image), and in April 2019 during the renovation (right image).

Figure 4.
Global workflow for the realization of a comprehensive virtual reality experience for heritage tourism. It comprises the three layers from the conceptual methodology to the technology adaptation through the functional layer.
Figure 4.
Global workflow for the realization of a comprehensive virtual reality experience for heritage tourism. It comprises the three layers from the conceptual methodology to the technology adaptation through the functional layer.

Figure 5.
Needs analysis diagram. The solution is obtained by following a narrowing gathering process from the general need to user needs and system needs.
Figure 5.
Needs analysis diagram. The solution is obtained by following a narrowing gathering process from the general need to user needs and system needs.

Figure 6.
Definition of the different categories influenced by the needs analysis. First, the data part is treated in Section 4.2, followed by the virtual reality (VR) environment creation in Section 4.3, and the optimizations needed for specific interactions are in Section 4.4.
Figure 6.
Definition of the different categories influenced by the needs analysis. First, the data part is treated in Section 4.2, followed by the virtual reality (VR) environment creation in Section 4.3, and the optimizations needed for specific interactions are in Section 4.4.

Figure 7.
Three-dimensional reality capture workflow to maximize automation, both on-site and in the processing phase.
Figure 7.
Three-dimensional reality capture workflow to maximize automation, both on-site and in the processing phase.

Figure 8.
Data type and subpart populating the VR environment prototype.

Figure 9.
Virtual reality application design for cultural heritage tourism.

Figure 10.
User-centric workflow for the development of a heritage VR application on Jehay castle.

Figure 11.
Color-coded distances between the TLS and photogrammetric point clouds after the TS-based registration.
Figure 11.
Color-coded distances between the TLS and photogrammetric point clouds after the TS-based registration.

Figure 12.
Camera position and orientation (in red) for capturing a polygonal object. The overlap is over 80% for lateral, and vertical position planning.
Figure 12.
Camera position and orientation (in red) for capturing a polygonal object. The overlap is over 80% for lateral, and vertical position planning.

Figure 13.
Point cloud of the first floor of the castle of Jehay, before the renovations.

Figure 14.
Original mesh (left) to simplified mesh (right).

Figure 15.
Frustrum and occlusion culling.

Figure 16.
Three-dimensional model of Jehay’s chapel obtained by reality captured.

Figure 17.
Reworked mesh of the castle of Jehay and lightmap creation, with (up) and without (down) texture.
Figure 17.
Reworked mesh of the castle of Jehay and lightmap creation, with (up) and without (down) texture.

Figure 18.
Culling optimization comparison. The second and third pictures display a top view of the scene, the view frustum is indicated between the white lines. We can remark how half of the terrain and castle are not rendered as not inside the user’s view frustum.
Figure 18.
Culling optimization comparison. The second and third pictures display a top view of the scene, the view frustum is indicated between the white lines. We can remark how half of the terrain and castle are not rendered as not inside the user’s view frustum.

Figure 19.
Levels of details for a part of the castle. From left to right, the models are respectively composed of 1000, 10,000, and 100,000 triangles.
Figure 19.
Levels of details for a part of the castle. From left to right, the models are respectively composed of 1000, 10,000, and 100,000 triangles.

Figure 20.
Mean values and standard deviation of the summed scores for each locomotion type. The higher the score, the more the participant felt present in the virtual environment. The maximum theoretical score is indicated in blue.
Figure 20.
Mean values and standard deviation of the summed scores for each locomotion type. The higher the score, the more the participant felt present in the virtual environment. The maximum theoretical score is indicated in blue.

Figure 21.
User’s view once teleported on a cloud.

Figure 22.
Boat tour around the castle.

Figure 23.
Curve of the boat (in green).

Figure 24.
First-person view of multi-touch interactions with a TLS indoor scan. One hand is triggered and allows a translation in the direction of the visitor’s hand motion.
Figure 24.
First-person view of multi-touch interactions with a TLS indoor scan. One hand is triggered and allows a translation in the direction of the visitor’s hand motion.

Figure 25.
Three users seeing each other in the castle of Jehay while playing together as seen in the bottom right corner.
Figure 25.
Three users seeing each other in the castle of Jehay while playing together as seen in the bottom right corner.

Figure 26.
The angle exceeds the threshold on the left figure and is corrected on the right figure.

Figure 27.
User inside the 360°-viewer.

Figure 28.
On the left is the portal to a 360° image integrated in the VR application. On the right is one of the images displayed when the user interacts with the portal.
Figure 28.
On the left is the portal to a 360° image integrated in the VR application. On the right is one of the images displayed when the user interacts with the portal.

Figure 29.
Jehay’s castle with a Halloween theme.

Figure 30.
A virtual reality experiment showing the multi-modal data integration to serve the comprehension of construction phases.
Figure 30.
A virtual reality experiment showing the multi-modal data integration to serve the comprehension of construction phases.

Figure 31.
Real-time VR rendering of the full point cloud (left) with visualization and manipulation of semantic attributes (right). A shader is employed to enhance the edge rendering.
Figure 31.
Real-time VR rendering of the full point cloud (left) with visualization and manipulation of semantic attributes (right). A shader is employed to enhance the edge rendering.

Figure 32.
The nodes in front of the camera (right image) are rendered in more detail than those partially in view. The target of 100 Frames Per Seconds (FPS) is found with two million points displayed, out of 2.3 billion points in total for the data (left image).
Figure 32.
The nodes in front of the camera (right image) are rendered in more detail than those partially in view. The target of 100 Frames Per Seconds (FPS) is found with two million points displayed, out of 2.3 billion points in total for the data (left image).

© 2020 by the authors. Licensee MDPI, Basel, Switzerland. This article is an open access article distributed under the terms and conditions of the Creative Commons Attribution (CC BY) license (http://creativecommons.org/licenses/by/4.0/).
Share and Cite
MDPI and ACS Style
Poux, F.; Valembois, Q.; Mattes, C.; Kobbelt, L.; Billen, R. Initial User-Centered Design of a Virtual Reality Heritage System: Applications for Digital Tourism. Remote Sens. 2020, 12, 2583. https://doi.org/10.3390/rs12162583
AMA Style
Poux F, Valembois Q, Mattes C, Kobbelt L, Billen R. Initial User-Centered Design of a Virtual Reality Heritage System: Applications for Digital Tourism. Remote Sensing. 2020; 12(16):2583. https://doi.org/10.3390/rs12162583
Chicago/Turabian StylePoux, Florent, Quentin Valembois, Christian Mattes, Leif Kobbelt, and Roland Billen. 2020. "Initial User-Centered Design of a Virtual Reality Heritage System: Applications for Digital Tourism" Remote Sensing 12, no. 16: 2583. https://doi.org/10.3390/rs12162583
Note that from the first issue of 2016, this journal uses article numbers instead of page numbers. See further details here.