Article

The Estimation of Lava Flow Temperatures Using Landsat Night-Time Images: Case Studies from Eruptions of Mt. Etna and Stromboli (Sicily, Italy), Kīlauea (Hawaii Island), and Eyjafjallajökull and Holuhraun (Iceland)

1
Faculty of Natural Sciences, University of Silesia, 60 Będzińska Street, 41-200 Sosnowiec, Poland
2
Dipartimento di Scienze Biologiche, Geologiche e Ambientali, Università di Catania, Corso Italia 57, 95129 Catania, Italy
3
Istituto Nazionale di Geofisica e Vulcanologia—Sezione di Catania, Osservatorio Etneo, Piazza Roma 2, 95125 Catania, Italy
*
Author to whom correspondence should be addressed.
Remote Sens. 2020, 12(16), 2537; https://doi.org/10.3390/rs12162537
Submission received: 18 June 2020 / Revised: 29 July 2020 / Accepted: 3 August 2020 / Published: 7 August 2020

Abstract

:
Using satellite-based remote sensing to investigate volcanic eruptions is a common approach for preliminary research, chiefly because a great amount of freely available data can be effectively accessed. Here, Landsat 4-5TM, 7ETM+, and 8OLI night-time satellite images are used to estimate lava flow temperatures and radiation heat fluxes from selected volcanic eruptions worldwide. After retrieving the spectral radiance, the pixel values were transformed into temperatures using the calculated calibration constants. Results showed that the TIR and SWIR bands were saturated and unable to detect temperatures over the active lava flows. However, temperatures were effectively detected over the active lava flows in the range ~500–1060 °C applying the NIR-, red-, green- or blue-band. Application of the panchromatic band with 15 m resolution also revealed details of lava flow morphology. The calculated radiant heat flux for the lava flows accords with increasing cooling either with slope or with distance from the vent.

Graphical Abstract

1. Introduction

Surveys of ground thermal anomalies in volcanic areas due to lava flow-forming eruptions are of great importance in monitoring the activity of active volcanoes. Effusive events are considerable hazards, influencing populations, properties, and anthropic activities at volcanoes worldwide [1,2,3,4]. In this regard, temperature measurements of lava flows can help to obtain information on the development of lava flow fields. Those measurements are also useful for predicting the behavior of the lava flow in the future [5]. However, this task is rather problematic due to the resurfacing of lava flows and because of technical issues related to hazardous survey locations in the case of spatially extended flows [5]. Using moderate and high-resolution multispectral satellite remote sensing data can therefore help to monitor such extreme thermal events, filling critical gaps in volcanic hazard and risk mitigation [5,6]. Satellite image data are a cost-effective and available tool with global surveillance at a wide range of spatial and temporal resolutions. However, problems are related to discriminating between recently cooled lava flows and older lava flow fields [2,5,6,7,8,9,10,11]. None of the spaceborne sensors, such as the low-to-moderate spatial resolution Moderate Resolution Imaging Spectroradiometer (MODIS) on the Terra and Aqua satellites, the Spinning Enhanced Visible and InfraRed Imager (SEVIRI) on the Meteosat Second Generation (MSG) geostationary platform, or the higher spatial resolution Landsat 8OLI (Operational Land Imager) were designed to specifically undertake volcanic thermal mapping during effusive eruptions [12]. The wavelength of the maximum energy recorded by the radiometer onboard the remote sensing platform depends on the temperature of the emitting surface. The thermal emission of an active volcanic surface relates directly to the radiative power of the emitter at a specific time. It can be detected and measured from space to identify physical processes occurring on the ground [7,8,12]. Thus, different spectral windows must be used to study phenomena occurring at different temperatures. For example, high temperature phenomena, e.g., lava lakes or lava flows, can be studied in short wavelength infrared windows (1.2–2.5 µm). The short wavelength infrared (SWIR) bands of day-time–night-time Landsat series can detect high temperature thermal anomalies from 160 to 420 °C, e.g., burning coal seam fires or lava flows [12,13,14,15,16,17]. Lower temperature phenomena, such as small ground thermal anomalies, must be studied in the thermal infrared (TIR) window (8–14 µm; [7,8]). The thermal saturation of TIR band 6 of Landsat 4-5TM and Landsat ETM+ 6/1 is 70–74 °C, whereas the maximum is 49 °C for 6/2 (Landsat ETM+) [16,17,18]. For TIR bands of Landsat 8OLI, the saturation level is 94 °C (band 10) and ~110 °C for band 11 (see Figure 1E,F). The saturation level of the TIR band of Landsat 7ETM+ (60 m resolution) on Etna and Kīlauea volcanoes, highlighted by light purple (Landsat 7ETM+) and pale green colors for Landsat 8OLI, illustrates this well. Furthermore, the TIR bands of the Landsat series or ASTER are generally unsuitable for precise temperature measurements because of their larger pixel dimensions in comparison with SWIR bands [18].
Temperatures derived from the short wavelength infrared of Landsat Thematic Mapper (TM) sensors are able to detect pixel-integrated temperatures from 150 to 1000 °C or higher [14]. The SWIR 1.6 µm band preferentially reflects thermal anomalies derived from high temperature materials (e.g., greater than several hundred degrees), even if they occupy only a small surface within the pixel [19,20]. If the temperature of the effusing lava reaches 970–990 °C, it will increase the size thermal anomalies in the 1.6 µm images [21]. According to Wien’s displacement law, the wavelength of maximum radiance emission shifts to shorter wavelengths with increasing temperature [12]. However, temperatures detected over lava flows in the SWIR1-2 bands are hot enough to saturate these bands, rendering them unusable. Therefore, using SWIR bands for the two-component dual-band method will fail to resolve any of the major properties of the temperature distributions [22]. Using the VNIR (visible and near-infrared) 9–13 (0.436–0.518 µm) bands of EO-1 Hyperion or Landsat can be sufficient to perform accurate temperature characterization of active lava flow surfaces from space [22]. NIR (spectral range 0.845–0.885 μm) can be used to detect objects that are hot enough to begin to glow in the NIR range. When the temperature reaches a sufficiently high level, the wavelength of the heat radiation will be short enough to be imaged using near-infrared images. These images usually do not resemble TIRS images [23]. Visible spectrum (red, green, and blue bands) can also be used to identify thermal phenomena. As with SWIR and NIR, the most reliable in this spectral range will be night images [24,25]. The ability to detect increased temperatures using VIS bands mainly depends on the value of these temperatures. Visible channels can only identify places with heightened temperatures if these temperatures are high enough [26,27]. The specific temperature range depends mainly on the wavelength range. In general, when an object cools, it appears more clearly at further wavelengths [26,27]. Thus, the blue band (0.450–0.515 μm), due to the lower wavelength range, will detect higher temperatures than the green band (0.525–0.600 μm), and the green band higher temperatures than the red band (0.630–0.680 μm) [27].
To obtain information about the temperature of the Earth’s surface or about objects on it, it is possible to use the other single bands provided by the satellites, including NIR, red, green, and blue (VIS). The aim of this research is to apply blue-, green-, red-, and panchromatic NIR night-time Landsat scene bands, as an alternative to SWIR, in order to detect lava flow temperatures for some eruptions that occurred at different volcanoes (Figure 2). Application of these bands with different resolution and sensitivity may help to recognize more details of lava flow emplacement mechanisms or may be useful for the evaluation of volcanic hazard. The calculated temperatures and radiant heat flux were then compared with the literature data to confirm the reliability of the applied methods, as in situ measurements were not available.

2. Materials and Methods

The Landsat 4-5TM, 7ETM+, and 8OLI night-time images (freely downloaded from https://earthexplorer.usgs.gov/Table 1) were used to avoid solar radiation. The atmospheric correction as an artificial modification on satellite data was not applied. Most of the used multispectral wavebands, i.e., blue, green, red, near-infrared (NIR), panchromatic, and short wave infrared (SWIR1, SWIR2), are mainly noisy, caused by the absence of reflected energy from the sun at night and radiometric sensitivity of the sensor. Only lava flows are visible as hot surfaces. Therefore, the effect of dust, smoke, gases, and vapor over the lava flow is highly problematic to be removed.
Using Planck’s law, which relates spectral radiance to the temperature of the emitting surface, satellite measurements of spectral radiance may be used to calculate the temperature (inverse of the Planck Function) of the corresponding ground surface [22]. All objects above absolute zero (0 K) emit electromagnetic radiation at a wavelength and intensity that are functions of the surface temperature and emissivity (radiating efficiency). According to the Stefan–Boltzmann law, the radiance emitted by the surface will increase as the temperature of the surface rises [28]. As a hotter volcanic surface will radiate more energy and higher radiant flux density, any observed radiance variation will reflect changes in volcanic activity on the ground [12]. Therefore, there is a direct relationship between thermal emissions and thermal volcanic activity [29]. Sensors having channels in the mid-infrared (MIR) and thermal infrared (TIR) bands (e.g., MODIS) have been widely used for decades to detect volcanic thermal anomalies and have proven to be a valuable tool for identifying trends and monitoring volcanic activity [20,29,30,31]. On the other hand, sensors such as the Multi-Spectral Imager (MSI) on Sentinel-2 satellites and OLI, which have channels in the short wave infrared (SWIR) and provide data at medium-high spatial resolution, enable a better identification of high temperature thermal anomalies (if these pixel values are not saturated), e.g., lava flows [32,33]. Thus, the authors in [13] used Landsat TM images (SWIR bands), showing that the active dome at the summit of the Lascar volcano in Chile had surface temperatures in the range 148–367.8 °C.
The Planck Function is:
B λ ( T ) = 2 hc 2 λ 5 ( e hc / k λ T 1 )
h = 6.626068 × 10⁻³⁴ joule sec (Planck’s Constant);
k = 1.38066 × 10⁻²³ joule deg−1 (Boltzmann’s Constant);
c = 2.997925 × 10⁸ m/s (velocity of light);
T—object temperature in Kelvin;
λ—central wavelength.
The temperature can be computed from the emitted radiance through the relation:
T = ( h c k λ ) ( 1 l n ( ( 2 h c 2 λ 5 ) / ( L λ + 1 ) )
The inverted Planck Function can be written according to [34]:
T = K 2 l n ( K 1 L λ + 1 )
To make the substitutions more systematic, the factors K1 and K2 calculated according to [35] (see calculated constants in Table 2):
K 1 = 2 h c 2 λ 5
K 2 = h c k λ
T = ( K 2 l n ( ε λ K 1 L λ + 1 ) ) 273.15
However, when the temperature of an object is estimated, the reduced emissivity should be accounted for. The emissivity (ε; 0 < ε λ <1) is added to the Planck Function, such that ε = 1 for blackbody emission. A typical emissivity of 0.95 has been used for calculations [12,36]. However, the emissivity for molten- and hot volcanic rocks is not well quantified [12]. Several thermal emission studies of silicate glasses and basaltic lava suggest that the emissivity of molten material is significantly lower than that of the same material in its solid state [37]. Thus, emissivity is not only wavelength-dependent but also temperature-dependent [12,38].
The DN (digital number) of Landsat bands is converted to radiance units according to [39]:
L λ = ( L m a x λ L m i n λ Q C A L m a x Q C A L m i n ) ( D N Q C A L m i n ) + L m i n λ
Lλ—the cell value as radiance;
DN—the digital number of the band (range between 0 and 255);
Lminλ—spectral radiance scales to QCALMIN;
Lmaxλ—spectral radiance scales to QCALMAX;
QCALmin—the minimum quantized calibrated pixel value (typically = 1) spectral radiance scaling factor;
QCALmax—the maximum quantized calibrated pixel value (typically = 255).
All of the required values for the DN conversion to radiance units can be found in the metadata provided with the Level 1T USGS Landsat data products.
Additionally, the radiation heat transfer was calculated to describe the general heat loss over a lava flow. The radiant heat transfer was estimated (Φrad) according to
Φ rad = ε σ A ( T h o t 4 T c o l d 4 )
where ε = 0.95, σ is the Stefan–Boltzmann constant (5.67 × 10⁻⁸ W m−2 K−4), 900 m2 is the pixel area for Landsat image resolution except panchromatic, T h o t 4 is the calculated temperature in Kelvin for each band, and T c o l d 4 is the surrounding air temperature (290 K).

3. Results and Discussion

The eruptions at Mount Etna and Stromboli (Sicily, Southern Italy), Kīlauea (Island of Hawaii), and Eyjafjallajökull, Fimmvörðuháls, and Holuhraun (Iceland) were selected because adequate satellite images showing lava flows, fissures, and vents are available for these volcanic areas.

3.1. Lava Flow Temperature Estimations

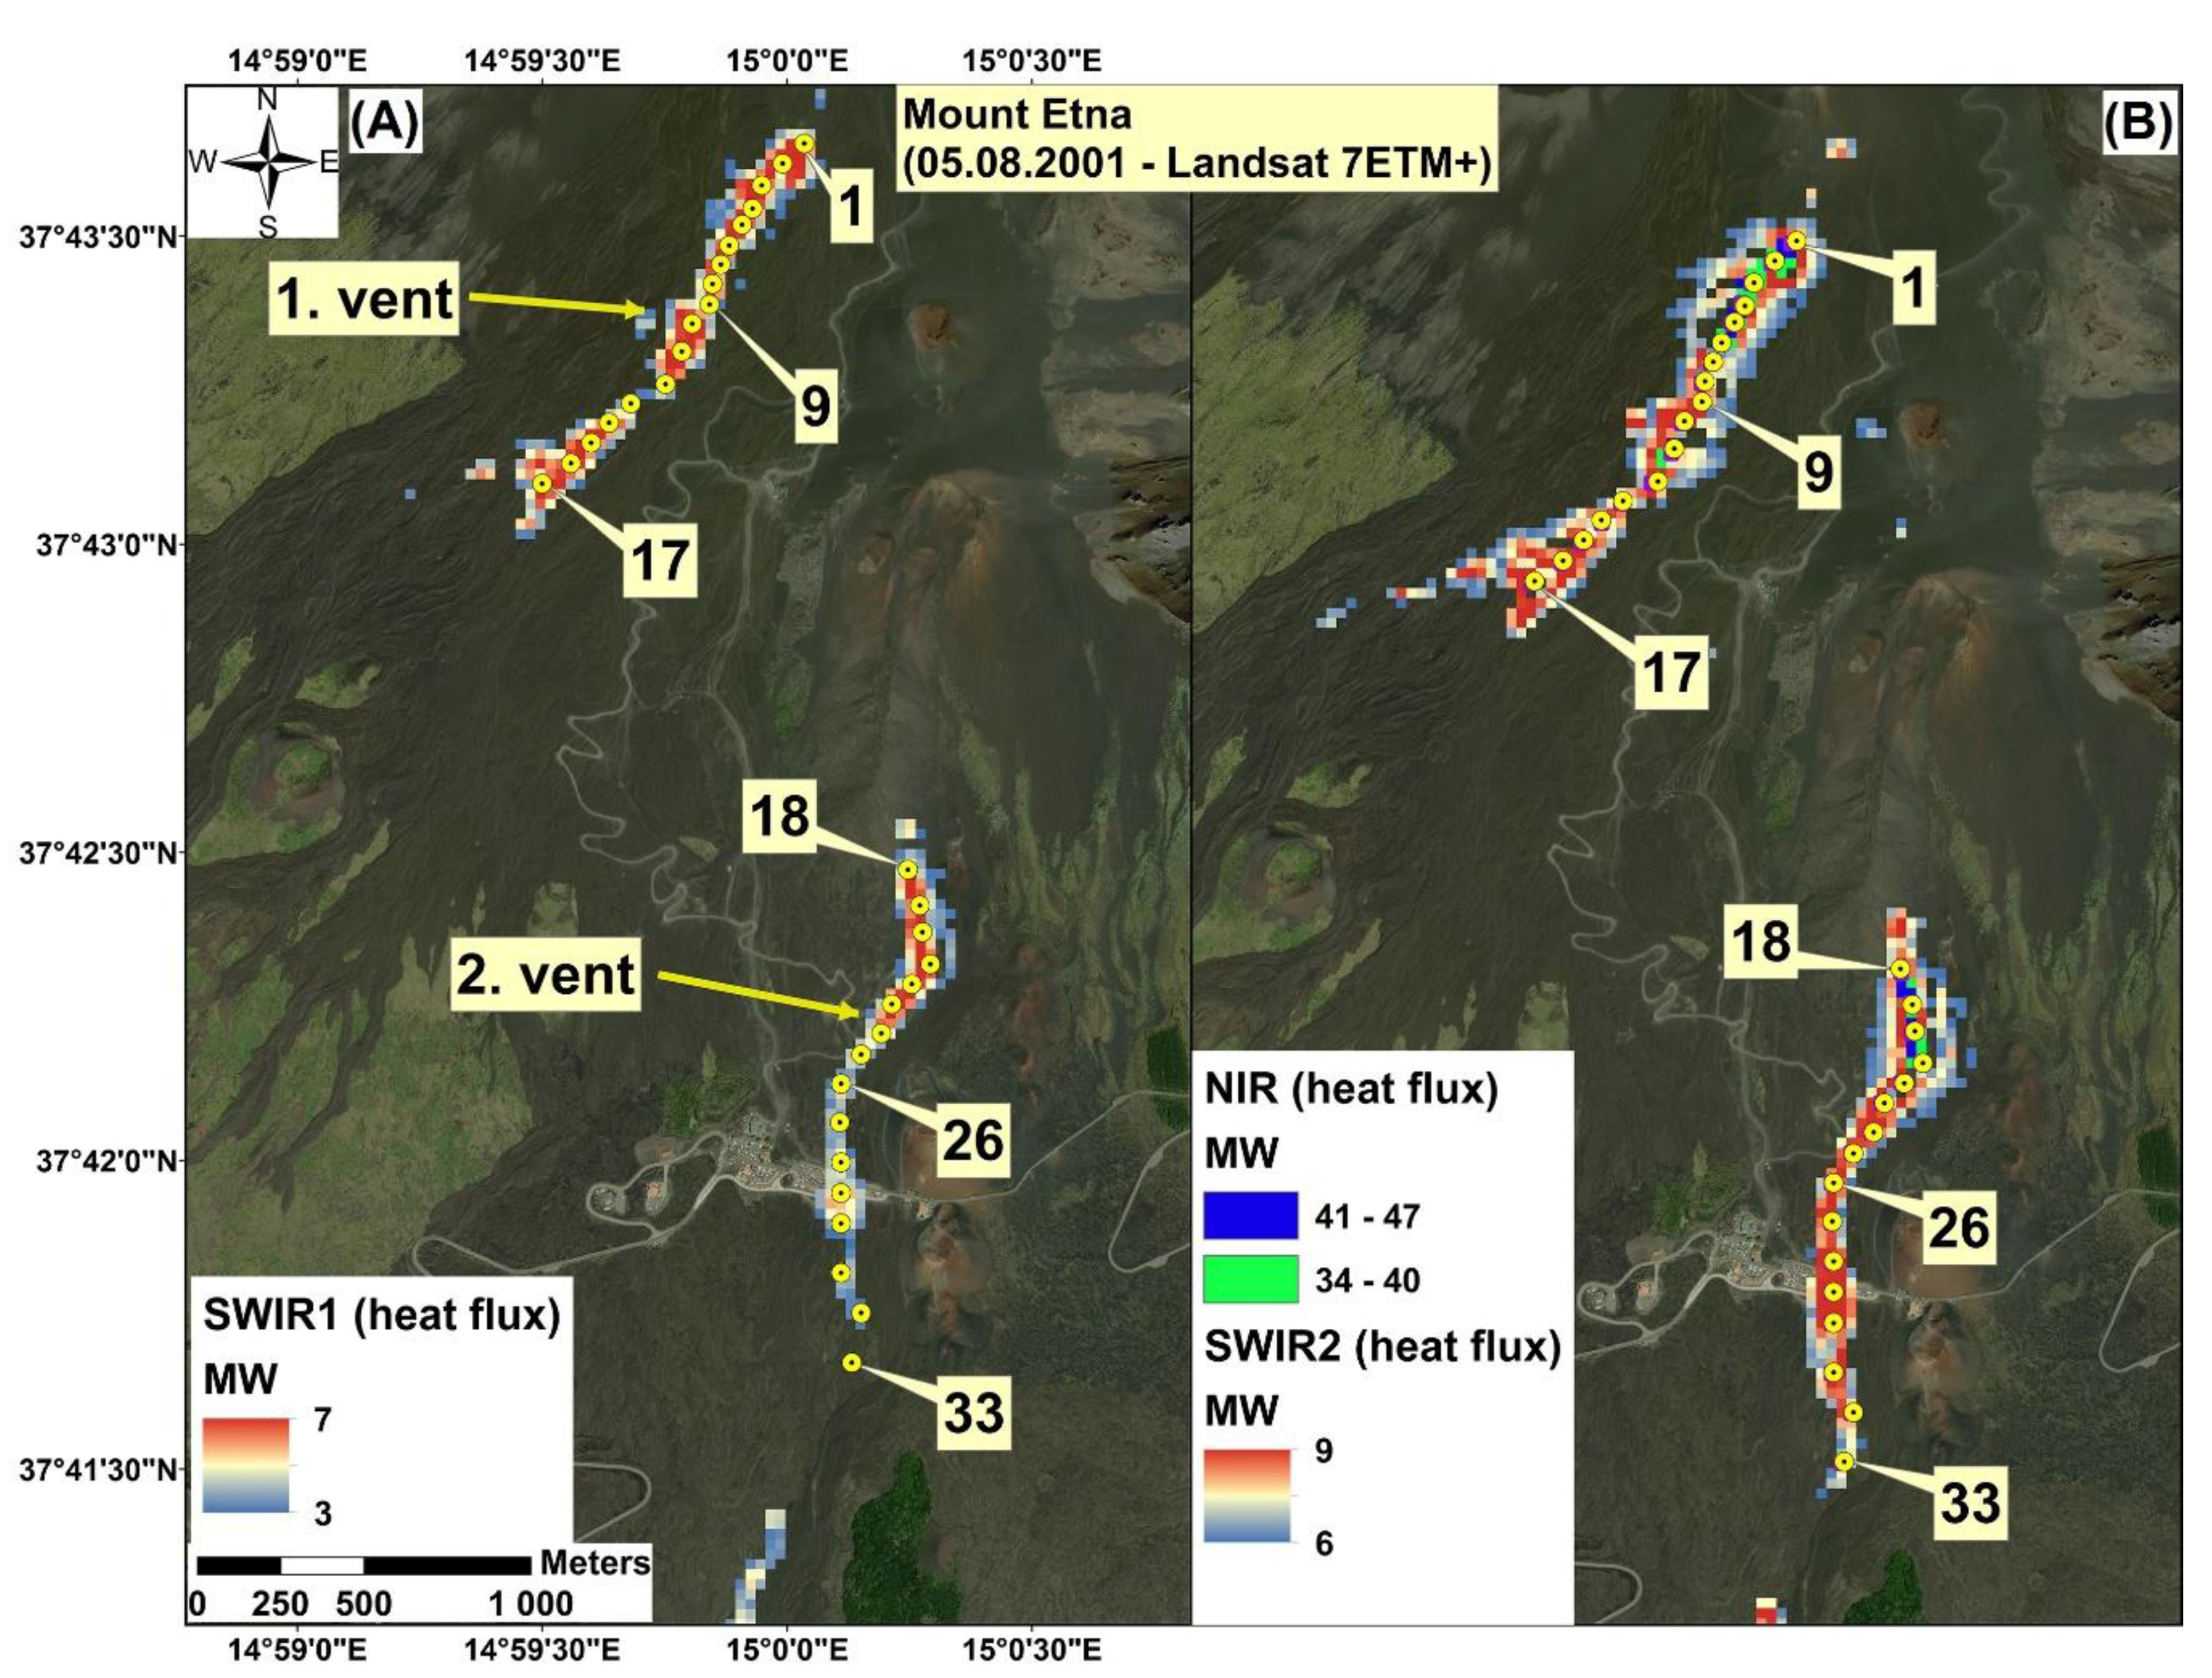
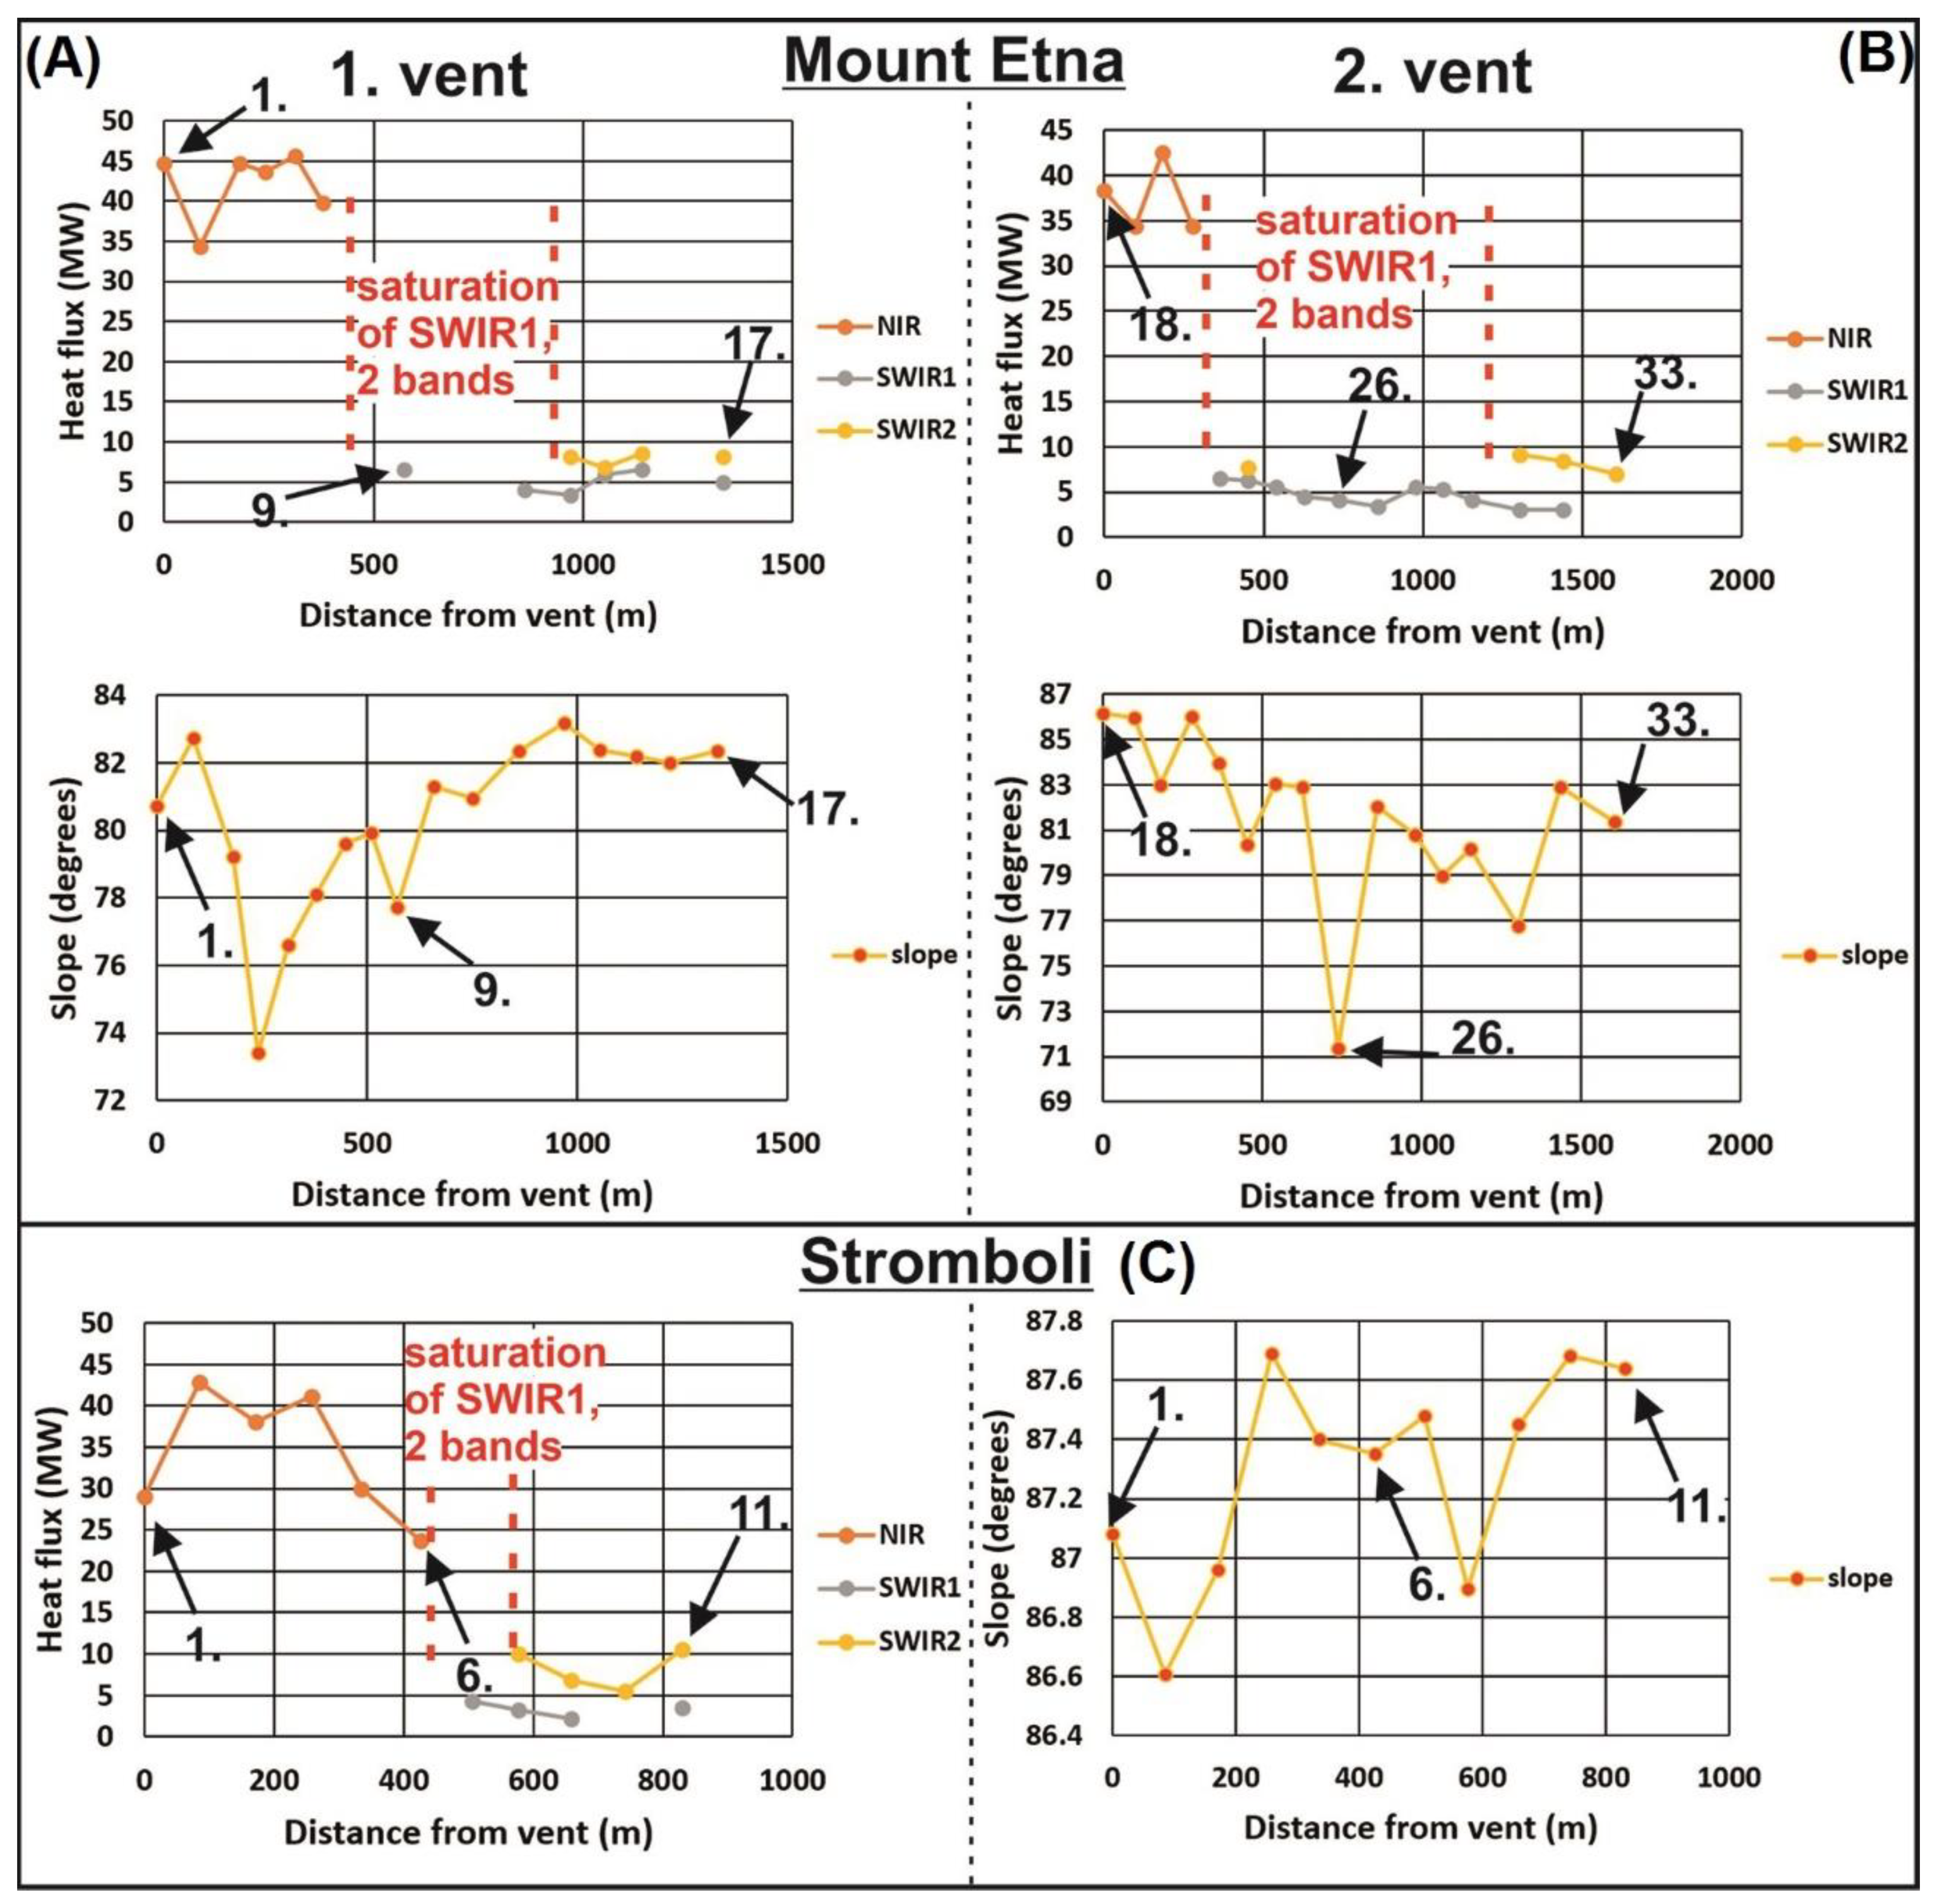
3.1.1. Mt. Etna Eruptions 1991–2020

Mt. Etna (Sicily, Italy; Figure 2), one of the most active basaltic volcanoes in the world, is characterized by persistent and variegated eruptive activity at the summit craters and along fissures on its flanks [40,41,42,43]. It is located in the suture zone between two colliding plates, the European and African plates, currently affected by oblique tectonics resulting from the southeastward shifting of the Calabrian Arc [44]. Volcanism in the Etnean region is interpreted as due to a deep tearing in the lithosphere at the southwestern edge of the Ionian/Calabrian subduction zone, which formed as a result of the differential retreat of the Ionian slab. This is associated with passive upwelling of the mantle that melts as a consequence of adiabatic decompression [44,45,46,47,48,49]. Activity at Mt. Etna began about 500 ka ago and, after an initial tholeiitic phase, produced slightly Na-alkaline volcanic products with prevailing hawaiitic lava emissions [50]. Both summit and flank eruptions are characterized by lava flows and by explosive activity with conspicuous tephra fall-out that constitutes a major hazard for nearby communities [51,52]. Volcanic activity at the summit craters can range from exclusive degassing to short-term (minutes/hours) or long-term eruptions of several months, with strombolian or lava fountaining activity often accompanied by lava flow effusions [53,54,55,56]. Among several lava flows produced since 2000, the most impressive occurred in July–August 2001 and between October 2002 and January 2003 [57]. These flows caused serious damages to the local economy [58]. Subsequent eruptions between September 2004 and July 2009 chiefly occurred from fissures at the southeastern base of the South East Crater (SEC), which is today one of the six active summit craters of Mt. Etna volcano [57,59]. All of these lava flows poured out towards the uninhabited Valle del Bove, a wide depression on the eastern flank of Mt. Etna. The 2008–2009 eruption was the longest flank eruption after a large 1991–1993 eruption, and the second longest since the seventeenth century [10,42,60,61,62]. From January 2011 to December 2013, 44 eruptions occurred at the New South East Crater (NSEC), most of them characterized by short-term paroxysmal activity with vigorous lava fountaining accompanying extrusion of rheomorphic lava flows [55,63,64]. The activity changed drastically in July 2014 with a prevalently effusive eruption at the North East Crater (NEC) and the NSEC lasting from 5 July to 16 August [65]. After the short-lived, effusive eruption of 31 January to 2 February 2015 at NSEC, the activity moved to the Voragine and gave rise on December 2015 and May 2016 to the most energetic, paroxysmal eruptions of the last two decades [66]. There were two major eruptions from the SEC–NSEC craters in February–April 2017 [67] and from fissures at the southeastern base of the NSEC in December 2018. Since September 2019, the volcano has been undergoing a prolonged period of weak Strombolian activity at the Voragine and from the SEC–NSEC craters [67].
Some of the volcanic activities on Mt. Etna from 1991 to 2020 are shown in Figure 3. The SWIR1-2, NIR or panchromatic bands were sufficient for temperature detection. The 1991–1993 flank eruption was the most prolonged and volumetrically significant at Mt. Etna throughout the last 350 years [68]. According to [68], the eruption began on 14 December 1991, with the opening of a discontinuous fracture system from the base of SEC which later extended in a southeast direction to intersect the western wall of Valle del Bove at an altitude of ~2500 m a.s.l. Lava began to flow from the lowest tip of this fissure. The eruption lasted for 473 days, during which about 235 × 106 m3 of lava have been emplaced, forming a lava flow field 8.5 km long [68]. The picture from 24.12.1991 (Figure 3A) was taken 1.5 weeks after the eruption. The hottest temperatures of active lava by the vent were 640–765 °C (detected by NIR). According to [40,69], a lava tube segment was present on 2 January 1992 and on 22 March 1992. The separated fragments of hot surfaces where lava expelled with saturated temperatures between 210 and 379 °C represent the formation of the main lava tube (Figure 3B). There were three stages of tube formation during the 1991–1993 Etna eruption. During 15 December 1991, the flow front required only four days to form a tube sector. In the same flow, the tube formation along narrow channels and steep gradient zones required 15 days, while a stable crust formation over the wide channels of the middle portion of this flow required ~1 month [40]. The temperature data (max. 102 °C) provided by the ASTER TIR band (Figure 3G) for the active lava flow from 26 December 2018 eruption cannot be considered realistic because of poor ground resolution (90 × 90 m) and saturation TIR band. The highest temperature (920 °C) detected by the panchromatic band (15 m resolution) relates to the 18 July 2006 eruption (Figure 3E). As active lava flows on Etna have temperatures between 870 and 1080 °C [68,70,71], some of the snapshots presented refer to moments of relative inactivity of the flow field. Where NIR- and panchromatic bands are applied together with SWIR1-2 bands, the wider areas of SWIR bands usually show the detection of radiance from relatively cooler peripheral flow surfaces and NIR- and panchromatic bands represent the emissions from the lava flow itself [19,72].
In Figure 3C, the high temperatures of NIR data (644–712 °C) or the panchromatic band (810–850 °C) represent eruptive vents, which were active between 19 July and 6 August 2001 [73]. Temperatures of the lava flow on 05.08.2001 compare well with the results of [12]. In Figure 3C, the calculated maximal temperatures for the 05.08.2001 lava flow 386 °C (659 K) and 335 °C (608 K) for SWIR2 and SWIR1, respectively, using ε:0.95, are compared with the maximal temperatures presented by [12] for the same lava flow, namely, 565 K (SWIR2) and 735 K (SWIR 1) using ε:0.93. The calculated temperatures from the NIR band (644–717 °C) covered the areas where SWIR1-2 became saturated (Figure 3C). The thermal images processed by [12] involved the use of the radiant pixels in SWIR and TIR using the three emissivities (1.0, 0.93, and 0.80), where the spatial heterogeneity of the emissivity was retrieved from the ASTER Global Emissivity Database (GED) and combined with the laboratory-satellite emissivity values. This was used to establish a realistic land surface temperature from ETM+ to obtain an instant temperature–radiant flux [12]. Adding the TIRS 1 band from Landsat 8OLI for the lava flow from 04.12.2013, size and temperatures of the lava flow were not saturated by the TIRS band (Figure 3F). However, because of its lower resolution (100 m), this band could not detect the detailed surface temperatures as could SWIR2.
The calculated pixel heat flux for lava flows erupted from the vent regions on Etna is well-defined by the active channel with 34–47 MW (Figure 4B). Similar pixel values were calculated by [36], where the peak surface cooling of 36 MW was observed in the vicinity of the vent on Etna on 14 September 2014. The lava flow cooled with distance from the vent (~1 km) following the ground slope with a 5–10 MW pixel heat flux, in good agreement with the results of [36], who reported an average lava cooling rate between 5.6 and 8.9 MW at greater distances from the vent.
Unfortunately, as the saturation of the SWIR bands and the sensitivity of the NIR band leave a gap in the heat flux calculation, the pixel values of the SWIR band had to be removed from the diagram in Figure 5. The cooling degree of lava surfaces with increasing slopes on both Etna and Stromboli is clear (Figure 5). This is also in agreement with the results of [36] who reported that increases in slope correlate with enhanced cooling at distances of 150, 300, and 430 m from the vent, consistent with enhanced disruption of the lava crust exposing hotter lava from the flow core at breaks in slope.

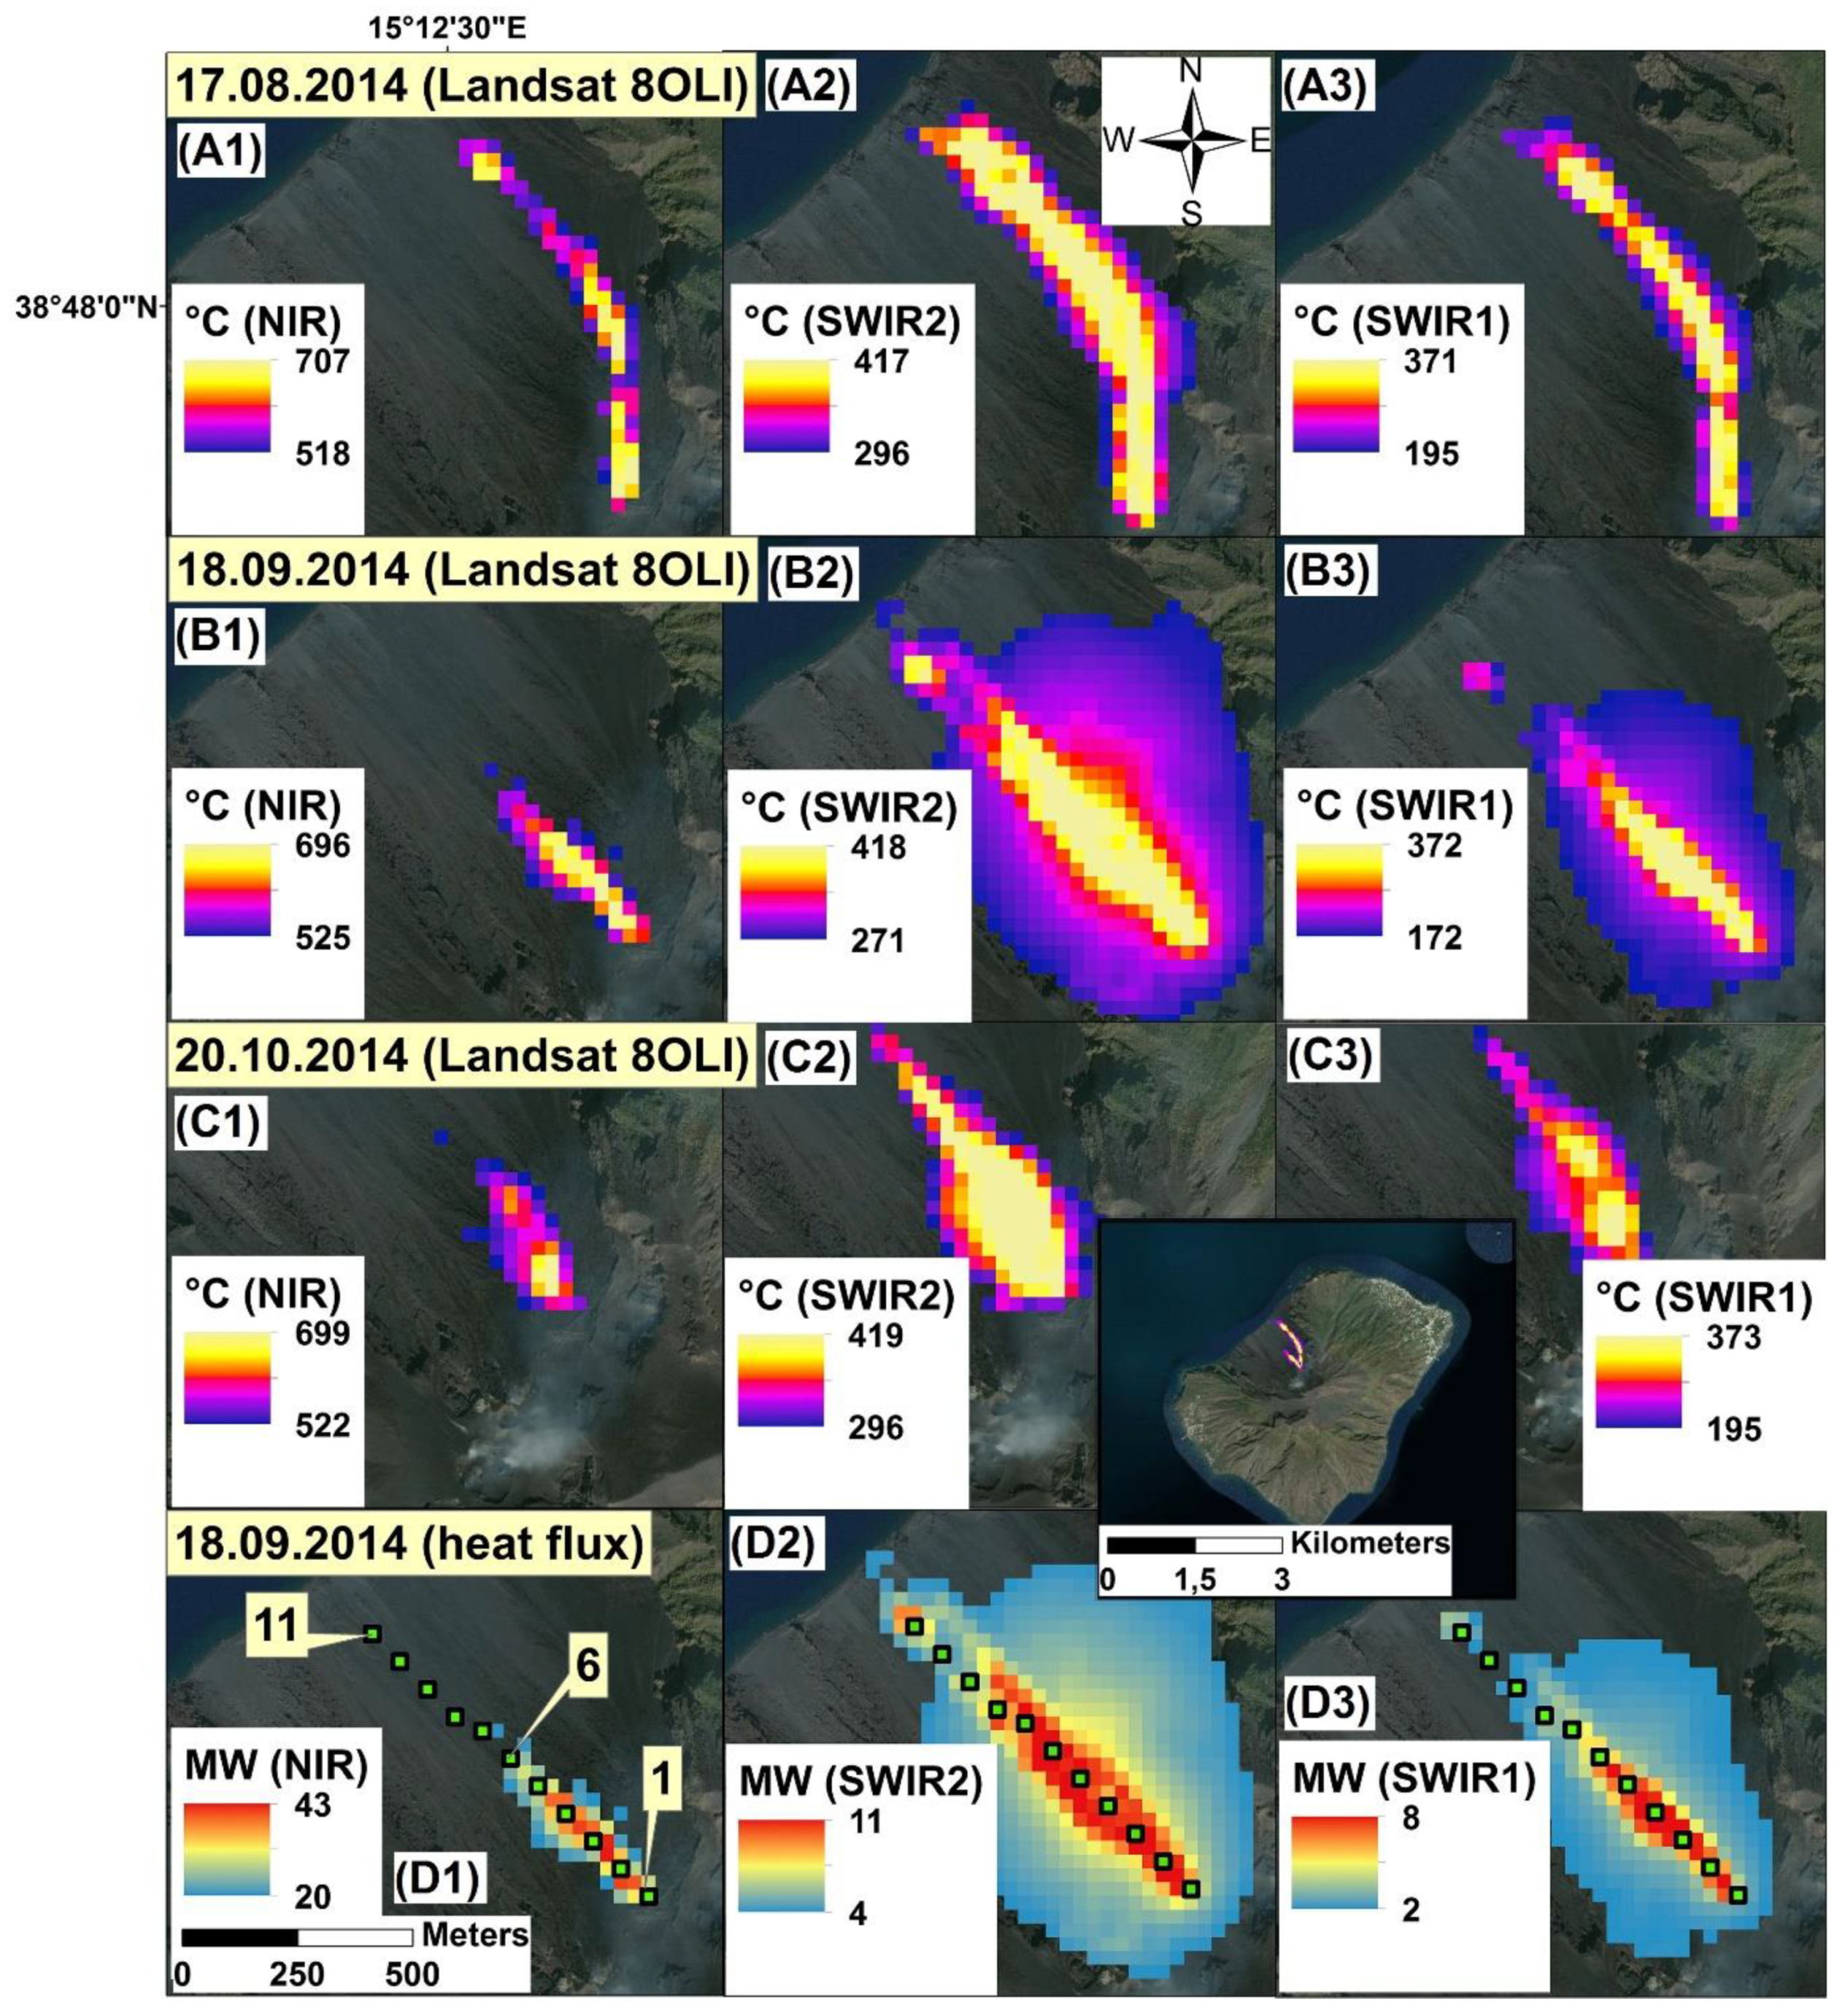
3.1.2. Stromboli Eruptions

Stromboli is located in the southern Tyrrhenian Sea and is considered one of the most active volcanoes over the world (Figure 2). Already famous for its persistent explosive character during Roman times, it was named ‘the Lighthouse of the Mediterranean’. The typical eruptive activity of Stromboli is characterized by very spectacular explosions which eject gas, ash, and incandescent pyroclastic shreds [74]. The volcanic products consist of a large variety of rock types, generally including high-K calc-alkaline and shoshonitic products [75,76,77,78]. The volcanism started about 0.8 Myr and is placed above a zone of deep seismicity believed to be generated by subduction of the Ionian slab beneath the southern Tyrrhenian Sea [79,80].
During the selected eruptions (Figure 6(A1–C3)), the temperatures of the main core of actively flowing lavas reached ~700 °C, as shown by the NIR band. The SWIR bands, despite being saturated, clearly indicate that hot surfaces (and air) at ~200–420 °C surrounded the main lava core. This is in good agreement with the thermal images of [81] on the basis of which, detected maximal temperatures of vents and lava flows reached 250–530 °C in July–August 2019. The SWIR band temperatures for 18.09.2014 agree well with the temperatures (400–450 °C) presented by [82] for the same lava flow. However, the temperature of that lava flow was changing fast (see lava front movement by [82]—the thermal images were taken about 12:05–12:50, in Figure 3 of [82]) and the satellite image was taken at 20:46 (Table 1—scene center time). Thus, the temperatures provided by the NIR band (525–700 °C Figure 6(B1)) close to the vents remained relatively higher as the eruption continued during that day. However, such high temperatures (or even 806 °C) were also registered by [82] during their field observations at Stromboli.
In the case of Stromboli, the pixel-related heat flux values (Figure 6(D1)) reached 20–43 MW by the lava flow vent and extended for a maximal length of 400 m. As the main lava flow field on Stromboli had a steep slope, the cooling of the emitted lava was much faster; the SWIR bands can detect such without saturation some 500–600 meters from the vent (Figure 5C).

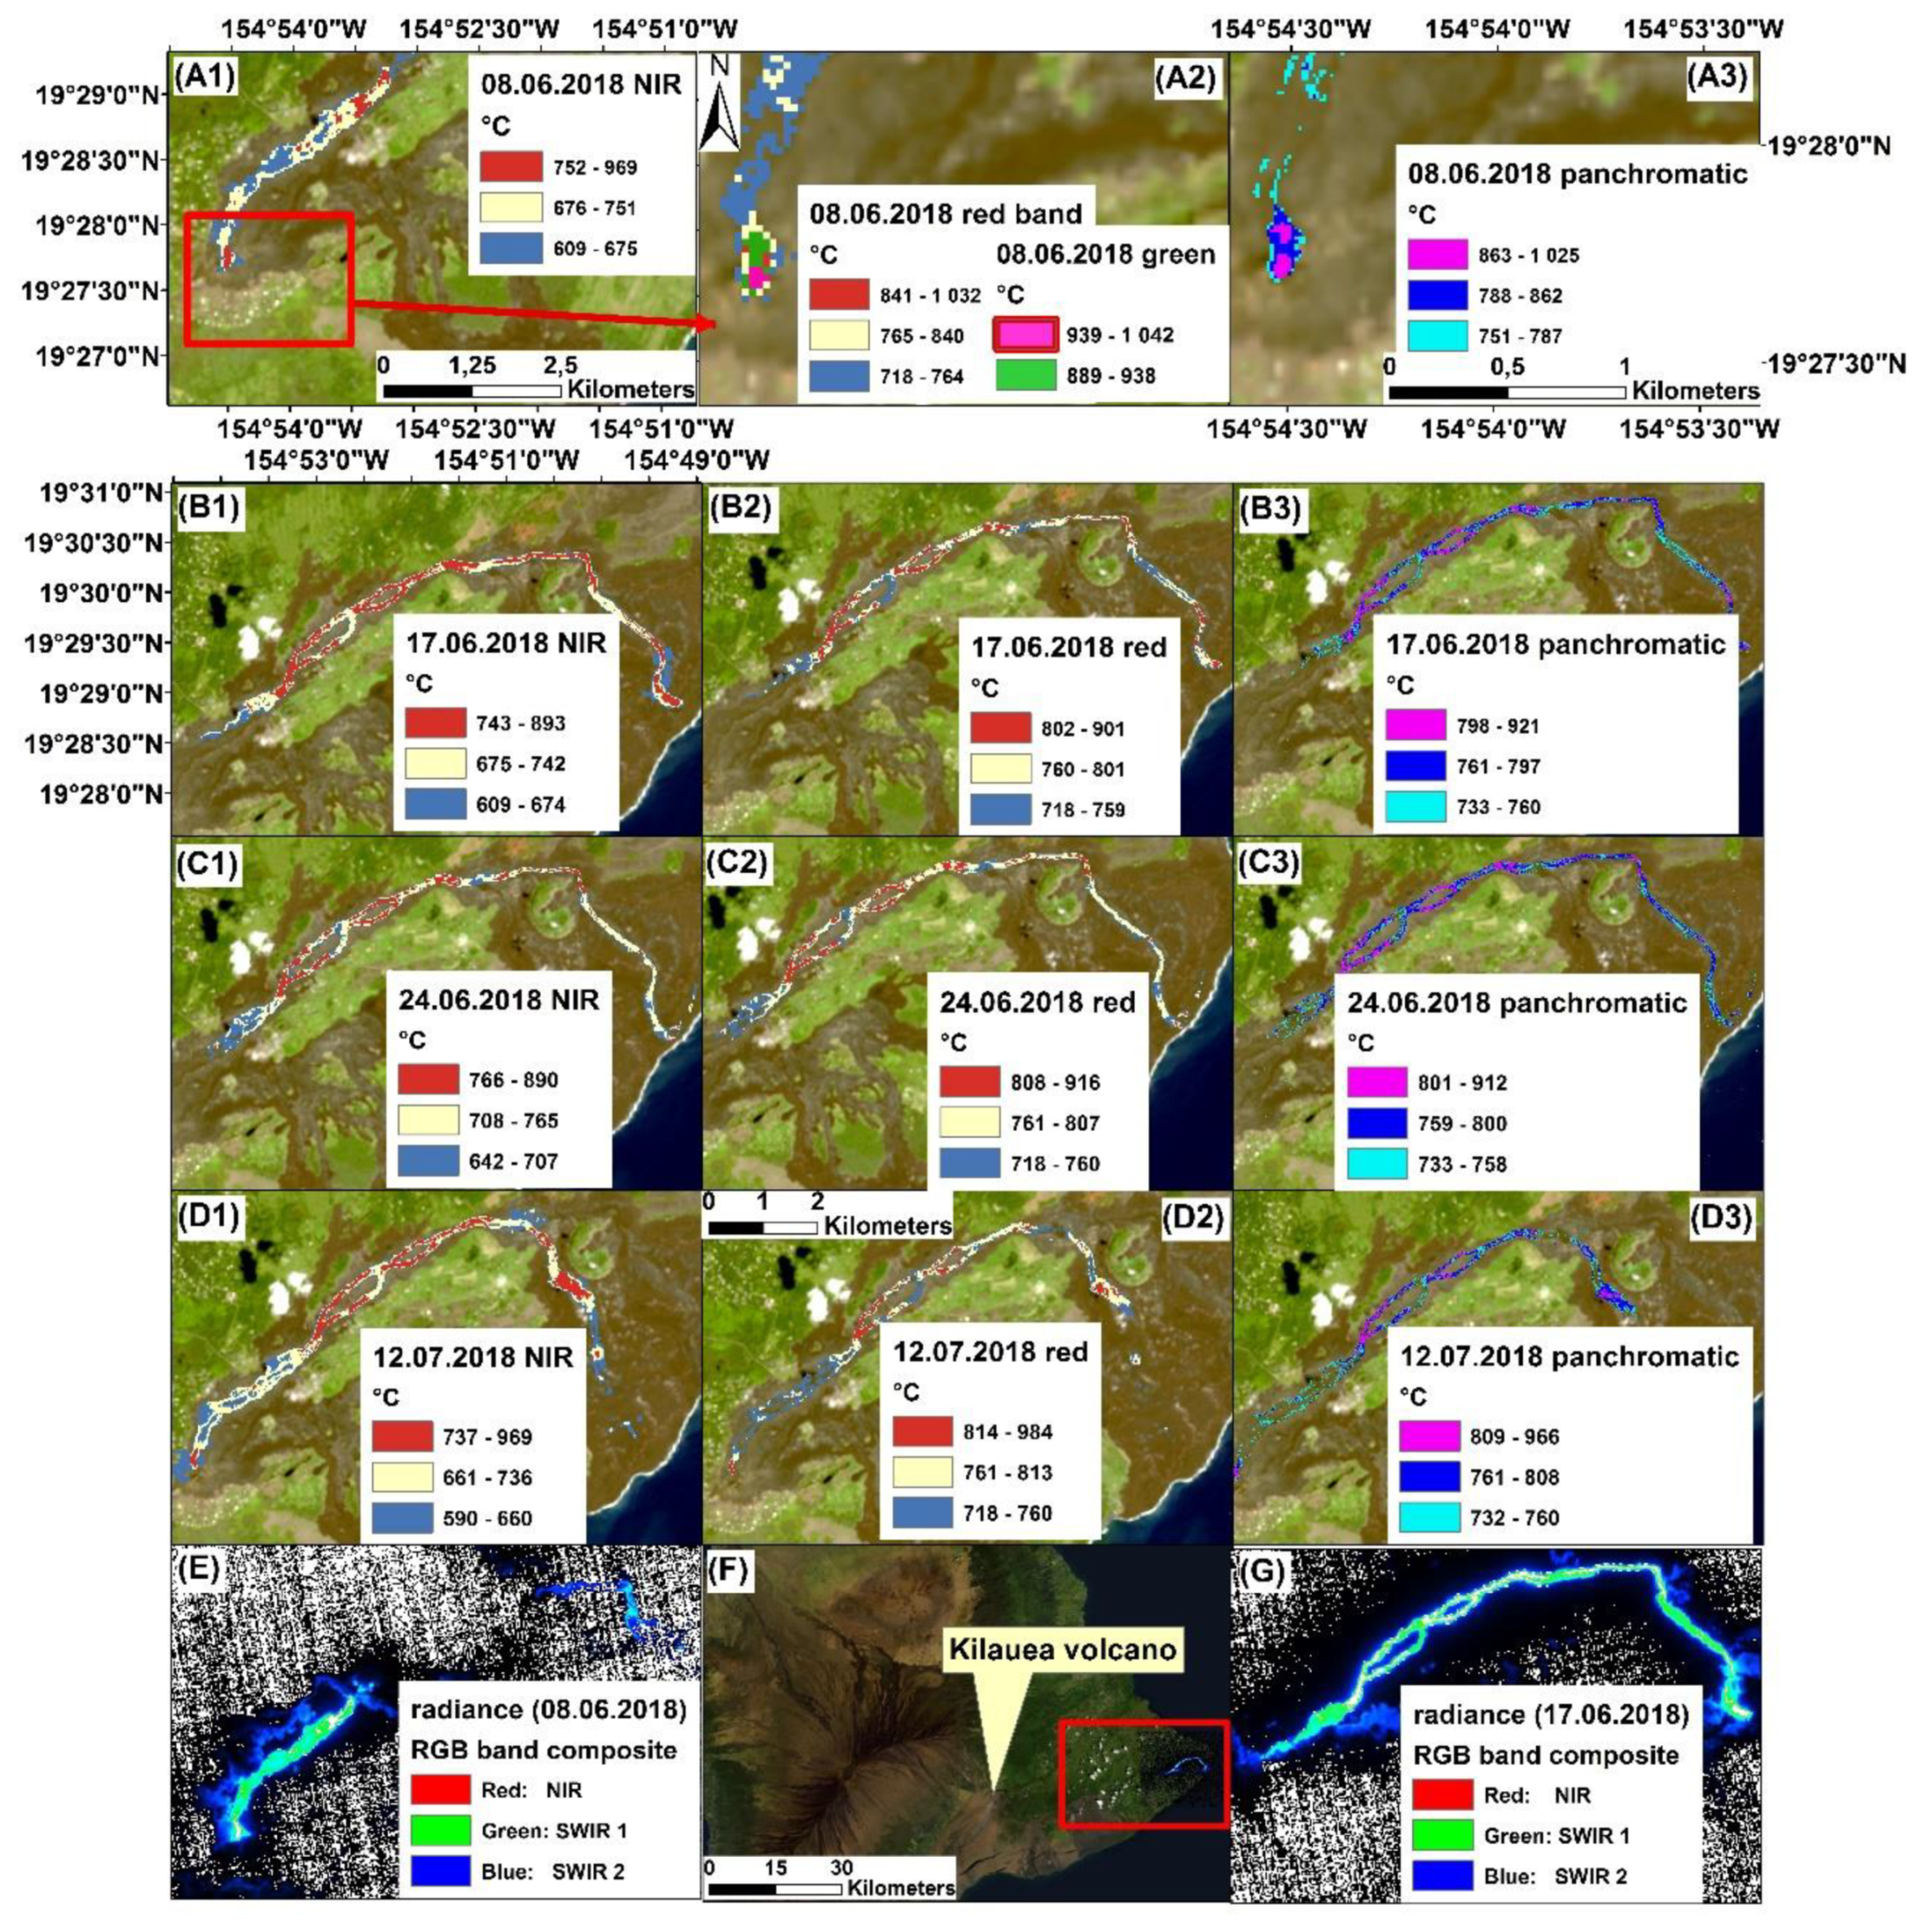
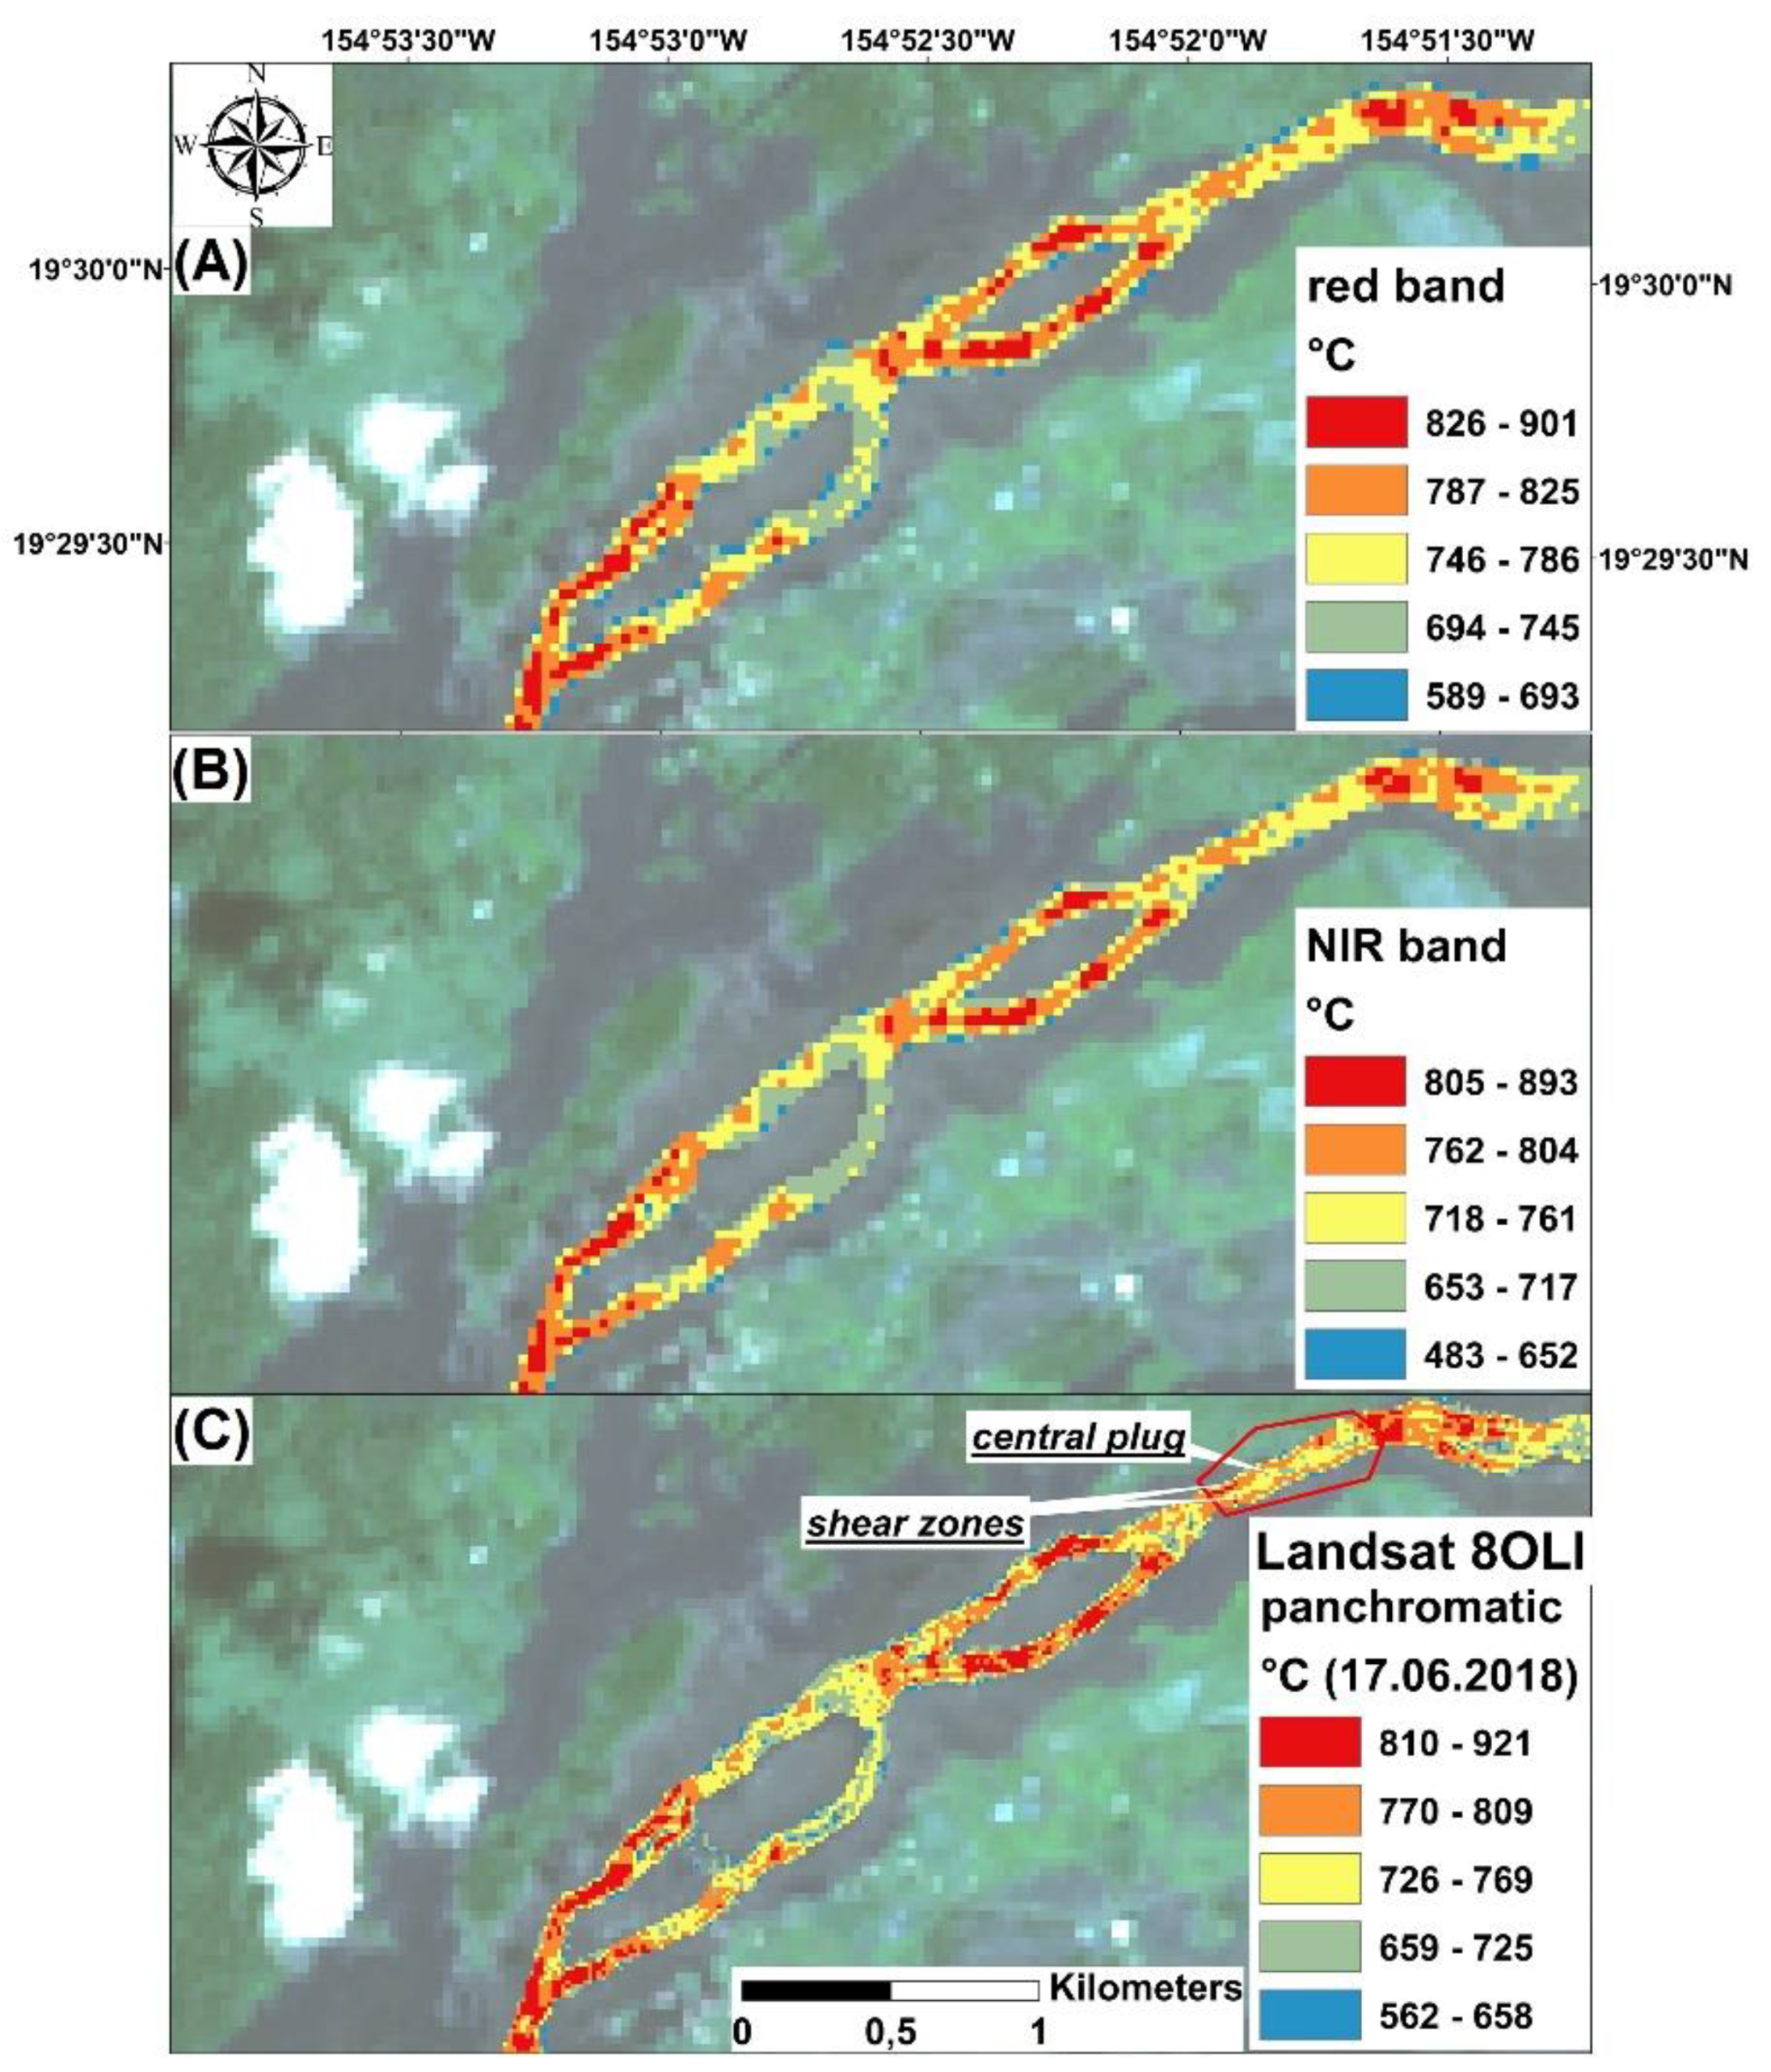
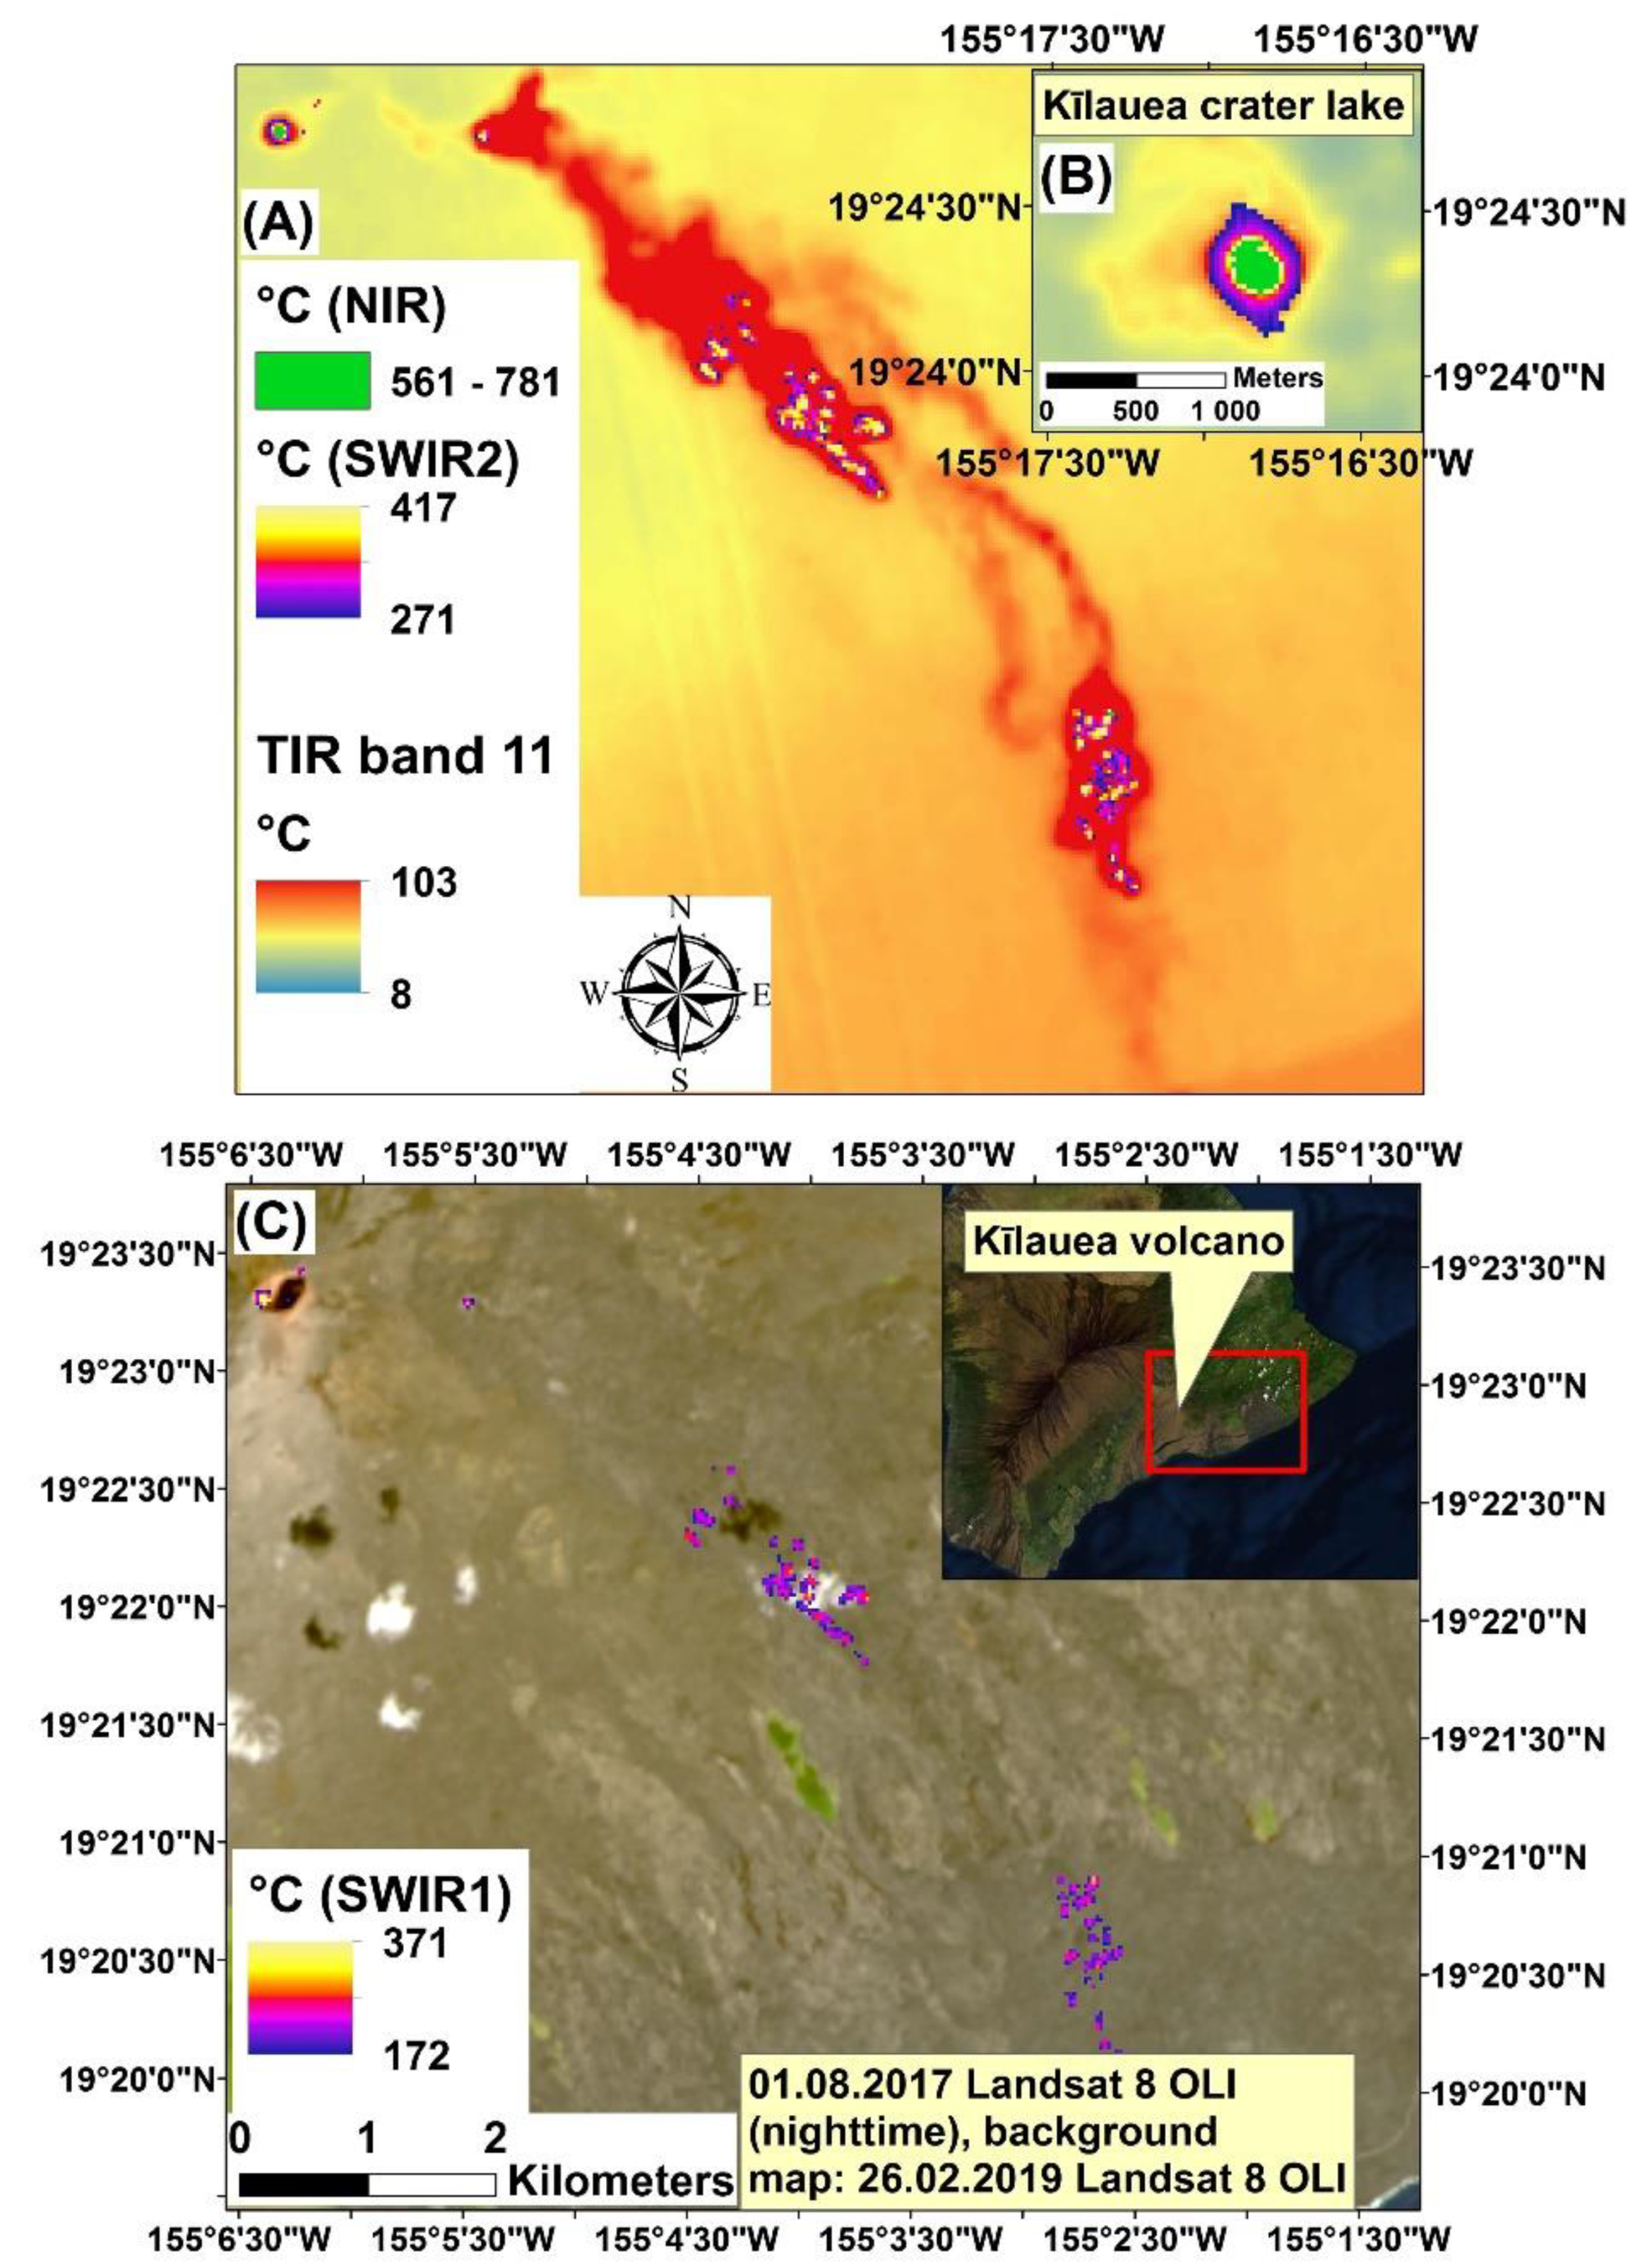
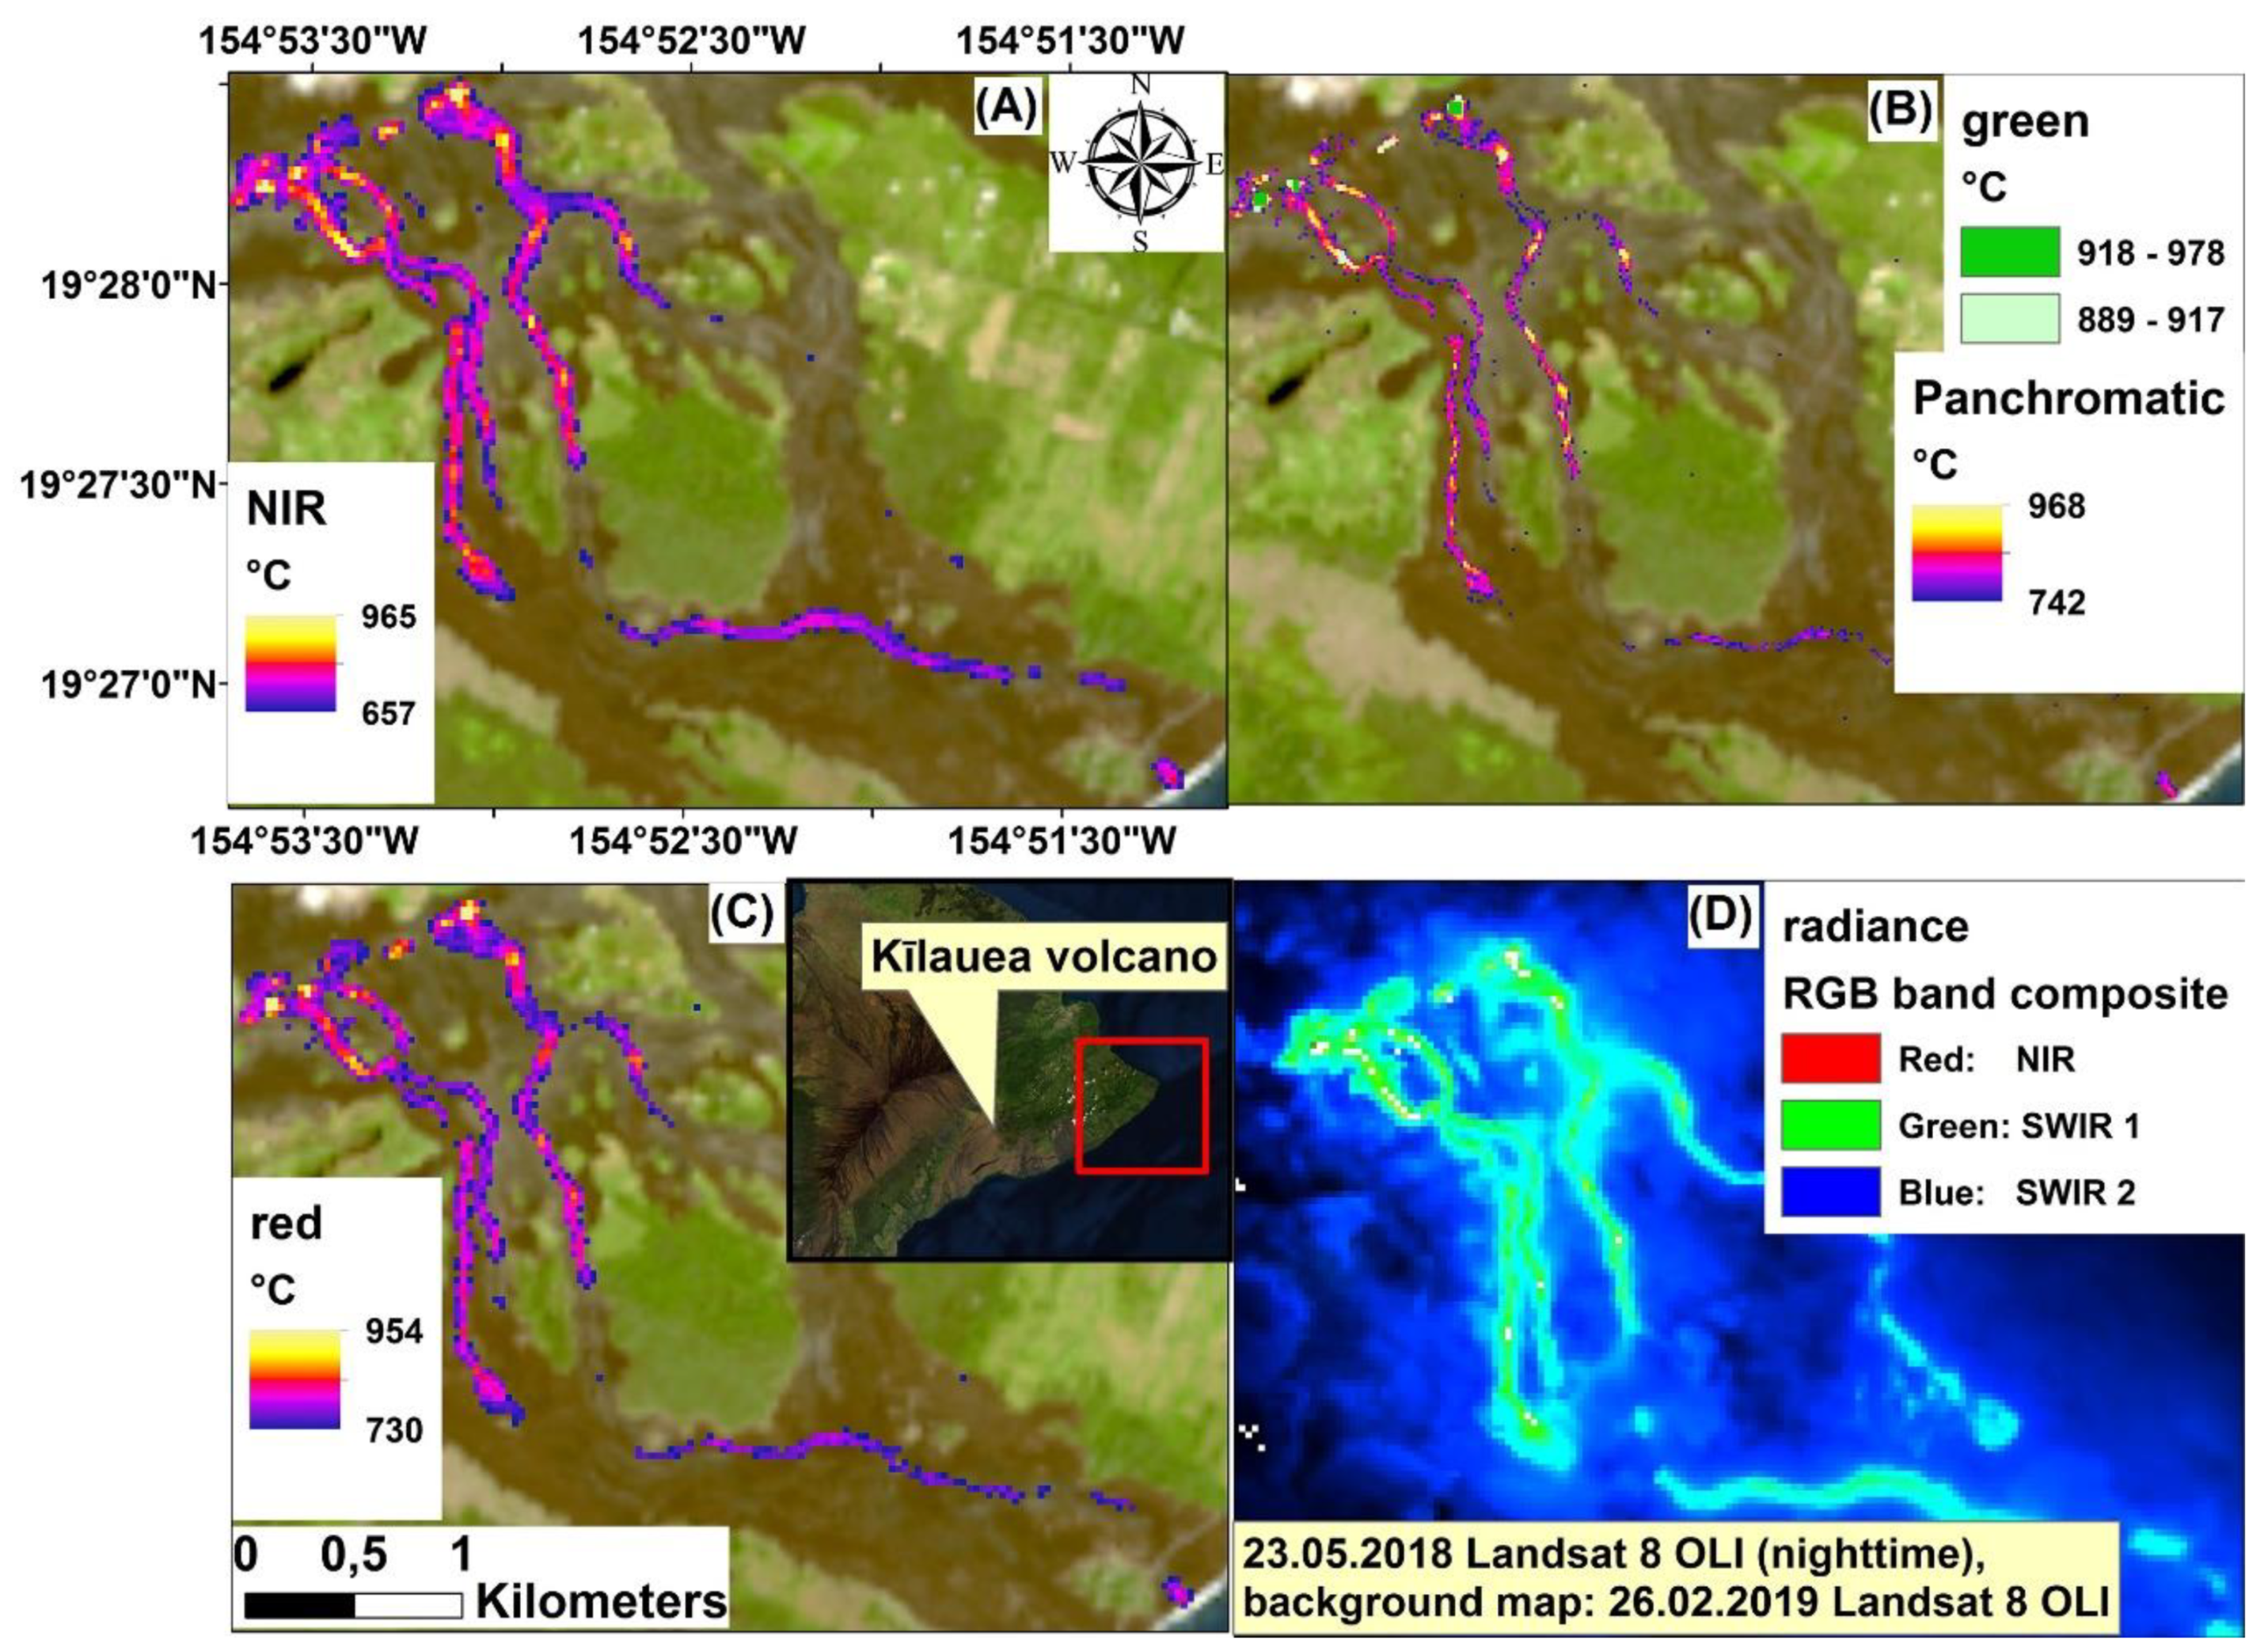
3.1.3. The 2018 Eruption at Kīlauea Volcano (Island of Hawaii)

Frequent and long-lasting eruptions and recurrent strong earthquakes create a unique combination of natural hazards across the Hawaiian Islands. This is especially true on the Island of Hawaii, which hosts five volcanoes, four of which are classified as active, namely, Kīlauea, Mauna Loa, Hualālai, and Mauna Kea [83]. The volcanic chain formed by the Hawaiian Ridge is the result of the Pacific plate moving to northwest over a mantle hot spot (Figure 2) [84]. The considered Hawaiian lavas are tholeiitic basalts that erupted during the shield-building stage. Volcanic growth begins with a poorly voluminous alkaline stage and ends with an alkaline or peralkaline stage [85,86,87]. The prelude of the disastrous l90-day 2018 eruption at the Eastern Rift Zone (ERZ) of Kīlauea volcano was marked, on 3 April, by the collapse of the Pu’u O’o vent in the middle of the ERZ [88]. The active lava lake at the summit Halema’uma’u crater started to drop and the summit caldera underwent deflation as a consequence of magma drainage throughout the ERZ [88]. The 1–2 May were characterized by hundreds of low-magnitude earthquakes along the ERZ, accompanying ground deformation. The 2018 eruption started on 3 May after a magnitude 5.0 earthquake with ground fracturing and lava flow emission in Leilani Estates. Another major earthquake (6.9 magnitude) shook the island on 4 May and produced further fissure opening with lava effusions, spattering and lava fountaining. There were 24 active fissures towards the end of May [88].
The lava flow series are shown on Landsat 8OLI images with calculated temperatures (Figure 7). Intensive eruption was captured (Figure 7(A1–A3)), where even the NIR was saturated at ~969 °C. However, the erupted lava had 1025–1042 °C with 15–30 m resolution using the red-, green- or panchromatic bands. Here, the SWIR1-2 bands were useless because they were saturated; they rather reflected the hot air and steam around the lava flows (see RGB band composites). The NIR-, red-, and panchromatic bands were well suited to illustrate the active lava flow series with high surface temperatures of ~800–950 °C (Figure 7(A1–D3)).
Using the zoomed image prepared from the lava flow series, the morphology and distribution of hot surfaces, i.e., the central plug and shear zones, are shown in Figure 8C. The temperatures detected using high resolution Landsat images agree well with the in situ temperatures measured by [89] using a narrow band spectroradiometer on Pu’u ‘O’o on the East Rift Zone of Kīlauea. The lava flow crust temperatures reached 940 °C, and a hot component near the channeled margin a temperature of 1120 °C, while the crust temperature reached 586 °C. The temperatures in Figure 8 also agree well with the classification of [90], who measured active flows and tubes on Kīlauea using infrared Minolta/Land Cyclops radiometers. Their results suggest that the upper surface of the flows can be divided into a minimum of four thermal components, i.e., core (>1050 °C), visco-elastic skin (750–900 °C), rigid solid crust (<750 °C), and flow margins (<175 °C). Usually, temperatures >1000 °C were registered in the fissures. Figure 8, especially the more detailed panchromatic 15 m resolution, shows that a cool rigid crust characteristically developed in the central part of the channel on some parts of the lava flow and that incandescent lava was exposed in the marginal shear zones of channels. This affects the heat loss and lava morphology in active channels [90]. The application of panchromatic band by [19] was able to detect very high temperature of lava channels at Lascar volcano, mapping lava flow fields with more details. Considering the limits of Landsat bands resolution (30 m—blue, green, red, NIR, SWIR1-2; panchromatic 15 m), large differences could occur within a sub-pixel which, as well explained by [14], is due to the total at-satellite radiance which is a weighted average of that emitted by all radiators present within the pixel at the time of sampling. Typically, high temperature radiant sources occupy less than a whole pixel, as in the case of fumaroles or crusted lava surfaces with incandescent cracks exposing hotter material from the lava interior.
Maximal temperatures are different in several bands, i.e., green, red, NIR, panchromatic (Figure 7 and Figure 8). This can be explained by the fact that the emitted radiance depends on both wavelength and temperature. Thus, a single temperature calculated for any surface, e.g., the pixel-integrated temperatures reported by [13], will only describe the temperature of one of these radiators and will differ on the basis of the wavelength used. The spectral radiance at high temperatures increases at shorter wavelengths, and a much greater portion of the total radiance from molten lava will be detectable in SWIR rather than longer wavelengths. This is why pixel-integrated temperatures vary with the wavelength [14,22,91].
A pāhoehoe lava flow on Kīlauea, where the SWIR1-2 bands were sufficient to show their approximate temperatures (200–400 °C), is illustrated in Figure 9A,C. However, the NIR band was more suitable (560–780 °C) compared to the saturated SWIR bands for the Kīlauea lava lake (Figure 9B).
The pāhoehoe lava flow temperatures recorded on Kīlauea are generally well in accordance with the results of [92], who used helicopter-borne georeferenced thermal images with high spatial resolution (~1 m) near the town of Pāhoa. According to their results, temperatures of such pāhoehoe breakouts range between 150 and 300 °C. The surface breakouts appear in clustered concentrations over significant areas near the active upslope of the flow front. The temperature distributions on the pāhoehoe fields range up to 150 °C above active lava tubes and tumuli [90]. However, the pāhoehoe flow temperatures on Kīlauea can reach 1094 °C, as was shown by [21] using a forward-looking infrared (FLIR) ThermaCAM 595 PM thermal imaging camera. The system of fissures with high temperatures and lava source temperatures of 950–980 °C, detected (23.05.2018) by different wavelengths is well seen in Figure 10A–C. In contrast, temperatures in the lower part of the lava flow ranged between 660 and 900 °C. Figure 10 represents the state of volcanic activity at the end of May. During the first half of June, volcanic activity intensified and moved mainly to Fissure 8 in Leilani Estates, with major lava flow emission and vigorous lava fountaining (Figure 7) [88]. This activity at Fissure 8 was well described by [88] and characterized by only small fluctuations with rather steady lava output rate (98 m3/s) until 5 August, when activity decreased markedly. When the eruption ended on 15 August, ~700 houses and significant agricultural areas in the southeastern part of Big Island were destroyed [88].

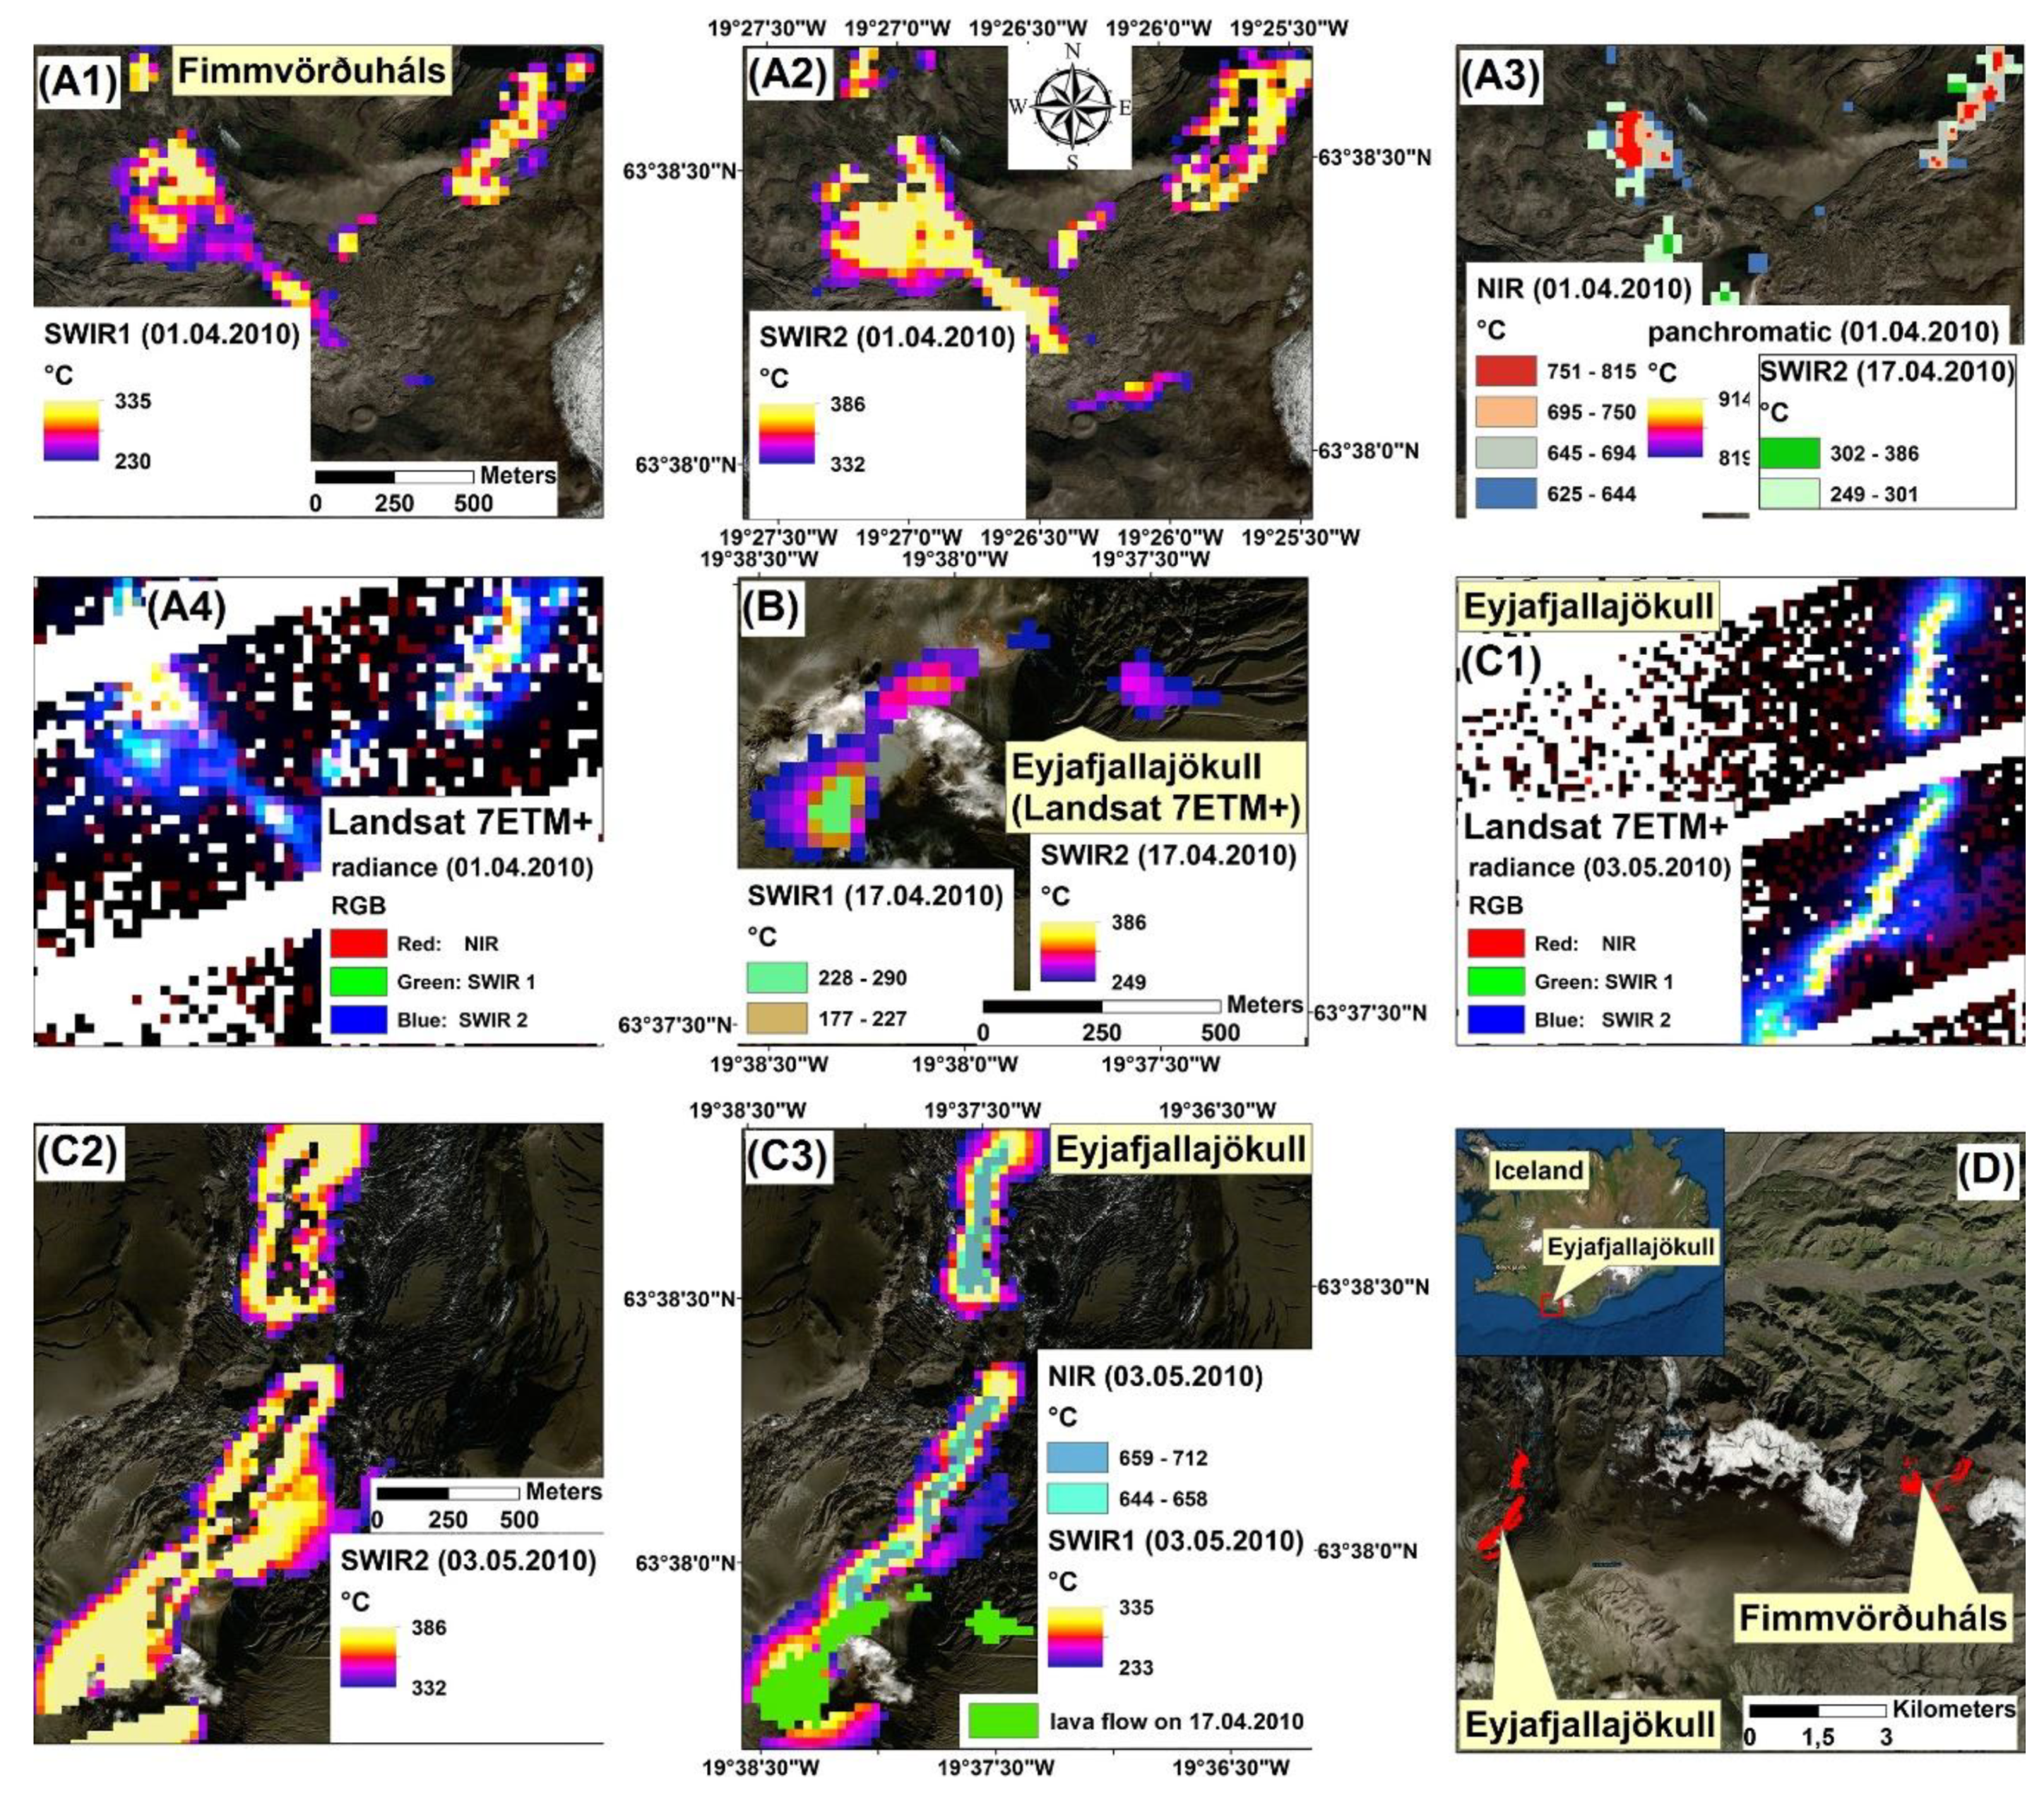
3.1.4. The 2010 Eruption at Eyjafjallajökull (Southern Iceland)

Volcanic eruptions are common in Iceland with individual volcanic events occurring, on average, every 3–4 years, small eruptions once every 4–5 years, and the largest flood-basalt eruptions occurring at 500–1000-year intervals. Despite the dominance of basalts, explosive eruptions are more common than effusive as, frequently, eruptions through glaciers give rise to hydromagmatic activity [93]. It is one of the few places on Earth where active plate spreading can be observed on land. The plate boundary between the North American and Eurasian plates formed Iceland as a series of seismic and volcanic rift zones with ~32 volcanic systems [94,95]. The volcanoes typically consist of a central volcano, commonly with a caldera and one or more associated fissure swarms. In 2015–2016, Katla and Bárðarbunga were the most seismically active volcanoes [95].
The 2010 eruption of Eyjafjallajökull started on 20 March 2010; firstly, near Fimmvörðuháls, with Strombolian activity and lava fountains coupled with small basaltic lava flow effusions lasting until 12 April 2010 (Figure 11(A1–B); [96,97,98,99]). Lava flows melted snow, generating steam. As the temperatures reached 625–914 °C, the SWIR1-2 is saturated (see the whole of SWIR2—01.04.2010). On 17.04.2010, SWIR2 data indicate that the lava flow field was cooling (Figure 11B). As second, a predominantly explosive phase of activity started on 14 April 2010 at the central crater of Eyjafjallajökull, just two days after the end of lava flow extrusions in the Fimmvörðuháls area. The first days were characterized by powerful hydromagmatic explosions that produced a ~10 km high plume of ash with benmoreitic-trachytic composition [97,98]. The hydromagmatic activity decreased dramatically in intensity as it evolved to magmatic; in less than one week, temperatures in the range 180–386 °C were visible on Landsat 7ETM+ (17.04.2010; Figure 11(A3,B)). The period 18 April–4 May was characterized by moderate explosive activity accompanied by lava flows. Indeed, classical lava flows were visible on 3 May 2010, with saturated SWIR2 visible as missing pixels, where NIR could detect temperatures of 640–712 °C (Figure 11(C1–C3)). Another peak of explosive activity was recorded on 5–6 May before the eruption ended on 22 May 2010. Until 20 April, weather conditions had decreed that the plume of volcanic ash spread towards Europe, resulting in major air travel restrictions [100].

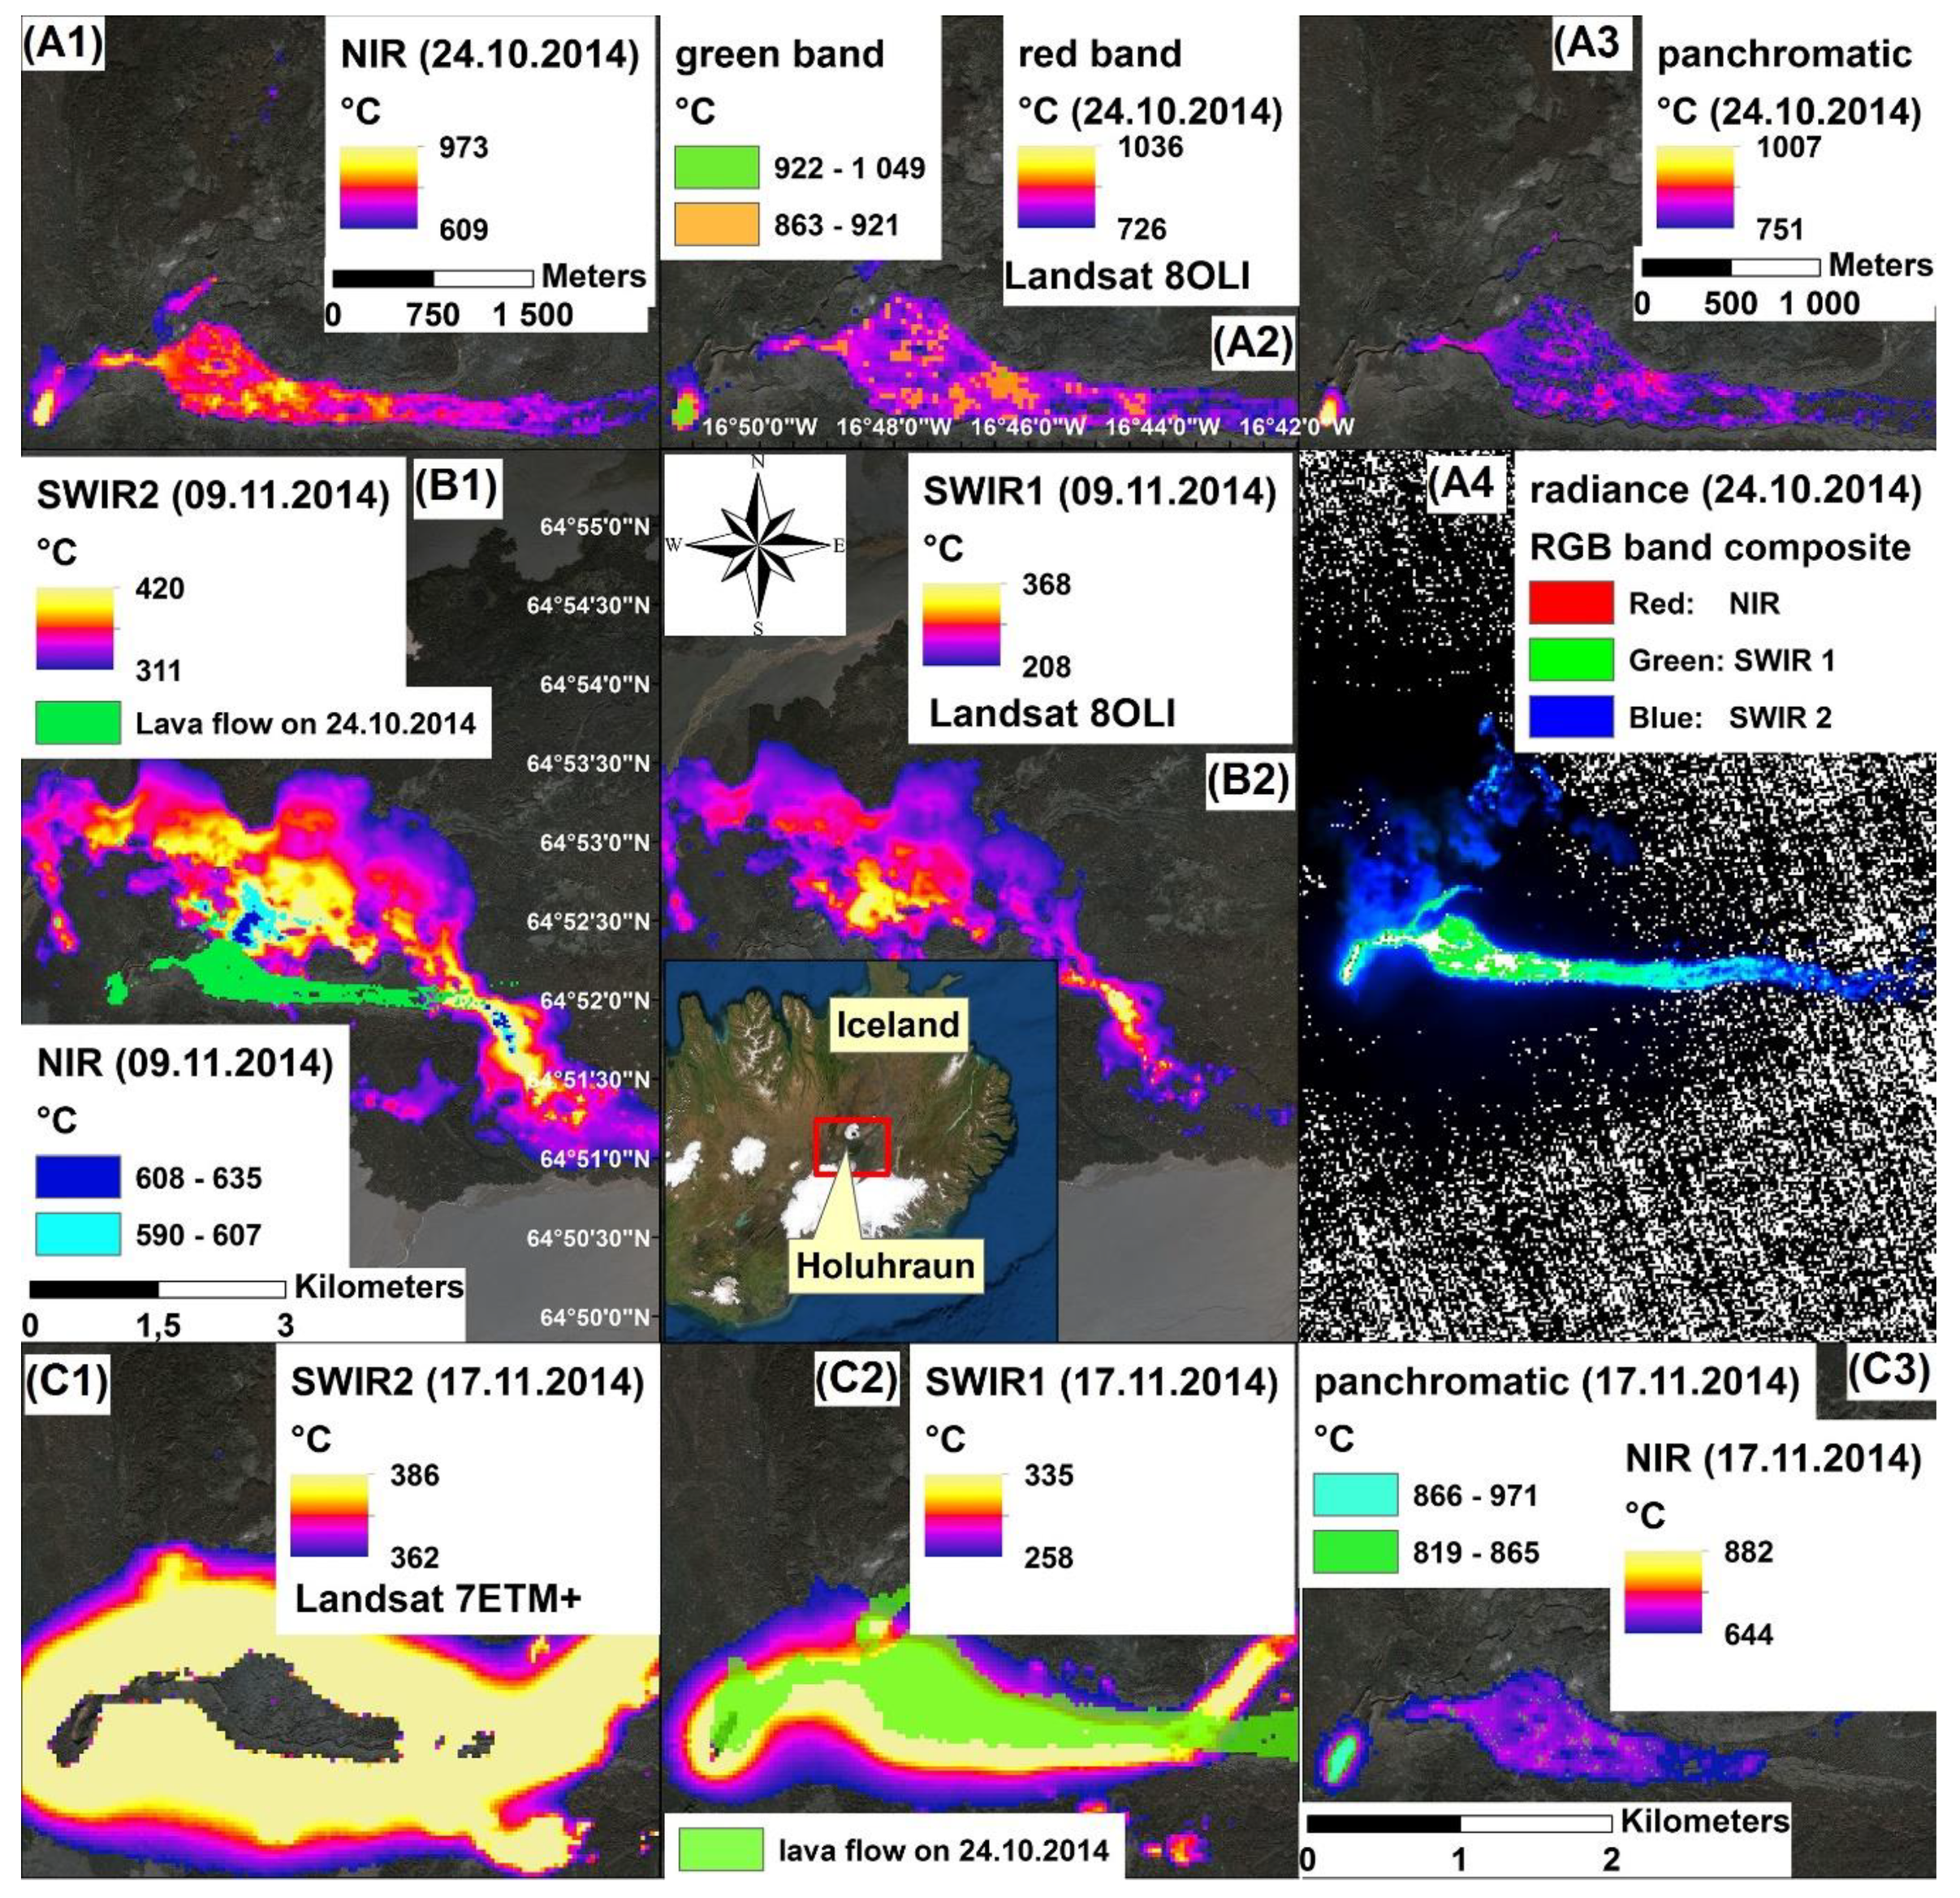
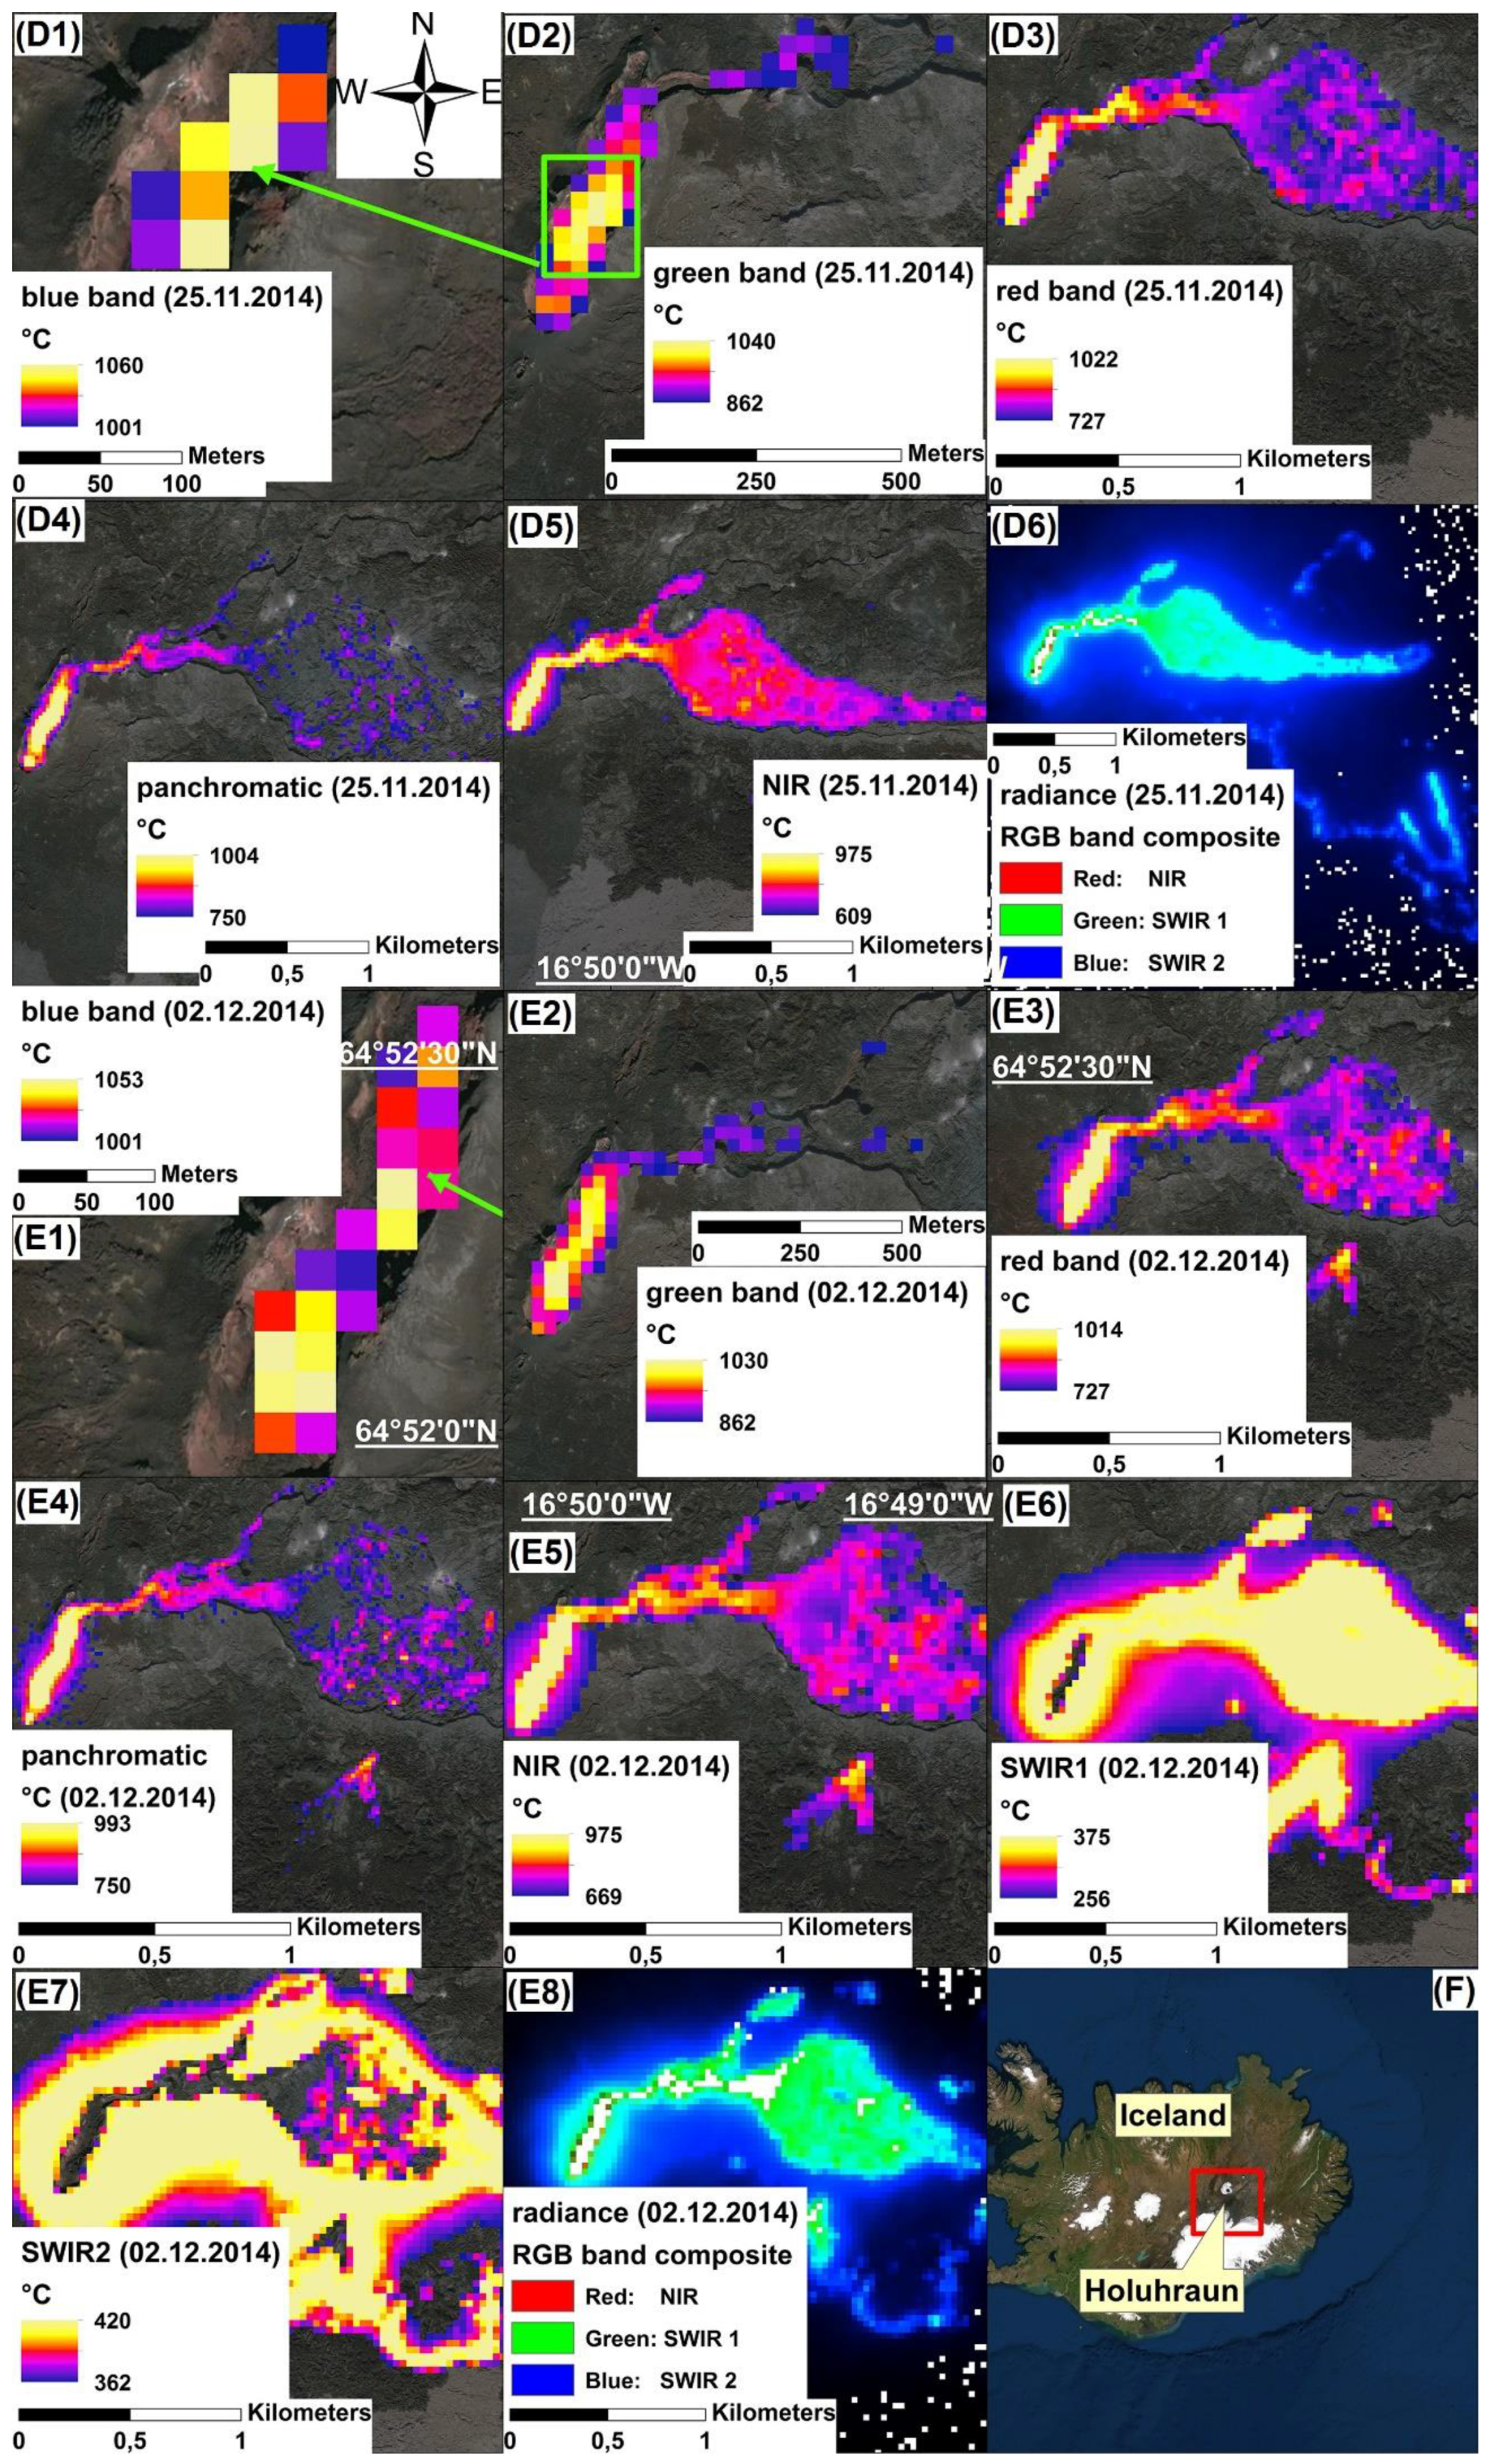
3.1.5. The 2014–15 Eruption at the Holuhraun (Icelandic Highlands)

A lava flow field formed at Holuhraun north of the Vatnajökull glacier between 29 August 2014 and 27 February 2015. The Holuhraun eruption has been acknowledged as the largest basaltic fissure eruption in Iceland over the last 230 years, with an estimated lava volume of ~1.6 km3 covering an area of ~84 km2 [101]. The eruption had an average discharge rate of ~77 m3/s, making it the longest effusive eruption observed in modern times with such a flux [102,103,104,105]. The eruption was divided into three phases based on the lava flow field evolution provided by [101]: (1) development of open channel lava pathways from 31 August to mid-October 2014; (2) lava pond formation from mid-October to the end of November 2014; (3) formation of tube-fed lava pathways from early December 2014 until 27 February 2015. Satellite images reported in the present work relate to the second phase of activity, during which high temperatures (1050–1060 °C) appeared beside the lava ponds (Figure 12(D1,E1)).
Temperatures detected for lava flows emitted by the Holuhraun fissures are on the order of 1050 °C, much higher than those observed for the 2010 eruption at Eyjafjallajökull (Figure 12). The NIR band was saturated at 973 °C (Figure 12(A1)), whereas the green- or red band worked well. Furthermore, SWIR1-2 saturation is visible by Figure 12(C1,C2), where temperatures were 644–882 °C (Figure 12(C3)). Applying the blue band to other stages of the second phase of the eruption (Figure 12(D1,E1)), the estimated temperatures reached 1060 °C. During this phase, a lava lake surrounded by spatter-built ramparts ∼60 m in height formed in Baugur. This lake drained into a secondary lava pond east of the central vent through a narrow opening on the northeast. Afterwards, the lava proceeded to flow eastwards through an open channel system [106]. Thus, the green- or red bands can be effectively applied to detect larger areas with more details where temperatures can reach the saturation level of NIR. Comparison of the temperature calculations (Figure 12(D1–D5,E1–E8)) with the estimations of [105] for lavas of the 2014–15 Holuhraun eruption, derived using a dual-band method, reveals similar temperature values. However, as the authors in [105] applied Landsat 8OLI SWIR1 and TIRS bands for their dual-band method, temperature detection failed over the lava lake. Thus, our application of red, NIR- or panchromatic bands revealed more details concerning the hot and cold surfaces of lava flows than do the images of [105]. The dual-band method is often used to determine lava surface temperatures from infrared satellite data. The method is based on the assumption that such surfaces can be described in terms of two end-member thermal components, namely, hot cracks within a thermally homogeneous crust [22]. This method was successfully applied by [18] to show the cooling of crusted andesite lava flow from 170 to 250 °C at Volcán Lonquimay, Chile, using two short wavelength infrared bands of Landsat TM. That temperature range is below the detection limits of SWIR bands, as these were saturated at ~350–420 °C.

4. Conclusions

Using the calculated calibration constants and spectral radiances for Landsat night-time images, and the inverted Planck Function, enabled approximate temperatures of active and cooling lava flows to be determined. Applying night-time images seems to be the best option for monitoring lava flows as there is no disturbance by the sun. Our results successfully indicated the saturation and detection limits of SWIR and TIR bands of Landsat series applied in the context of high temperatures over lava flows. However, application of the NIR band was sufficient to detect the emitted radiance from active lava flows and could show more realistic temperatures from the interval between 500–970 °C. Higher temperatures could be visible via red-, green- or blue bands with 30 m resolution as well exemplified by lava lakes in Iceland and Hawaii. The panchromatic band with 15 m resolution could reveal more details of lava morphology. Applying the SWIR bands usually showed wider areas which detected radiance from relatively cooler peripheral flow surfaces and from hot air surrounding lava. The calculated temperatures also allowed the pixel heat flux from erupted lava flows on Etna and Stromboli to be determined. On Stromboli, the highest pixel values clearly defined the active channel with 34–47 MW and the decreasing heat flux with distance from the vent.
Several factors could affect the accuracy of spectral radiance measurements by satellite, and calculated temperatures for volcanic activities, e.g., band detection limits due to saturation of Landsat pixel values, pixel size, and application of the proper ε (composition, surface roughness and temperature-related emissivity) in the Planck Function calculated for each pixel, haze, vapor, and cloud cover. Thus, precise true surface temperatures of lava flows can be measured only in situ using thermal cameras with a relatively higher resolution. However, applications using satellite images with resolutions of 15–30 m can aid recovery of data from areas logistically difficult to access or which are extremely hazardous.

Author Contributions

Conceptualization, Á.N.; methodology, Á.N.; validation, Á.N. and A.A.; formal analysis, Á.N.; investigation, Á.N. and M.V.; resources, Á.N.; data curation, Á.N.; writing—original draft preparation, Á.N.; writing—review and editing, Á.N., A.A., M.V. and R.M.; visualization, Á.N.; supervision, R.M. and M.V.; funding acquisition, Á.N. All authors have read and agreed to the published version of the manuscript.

Funding

This research received no external funding.

Acknowledgments

The authors are grateful to Pádhraig Kennan (University College, Dublin, Ireland) for language corrections. R.M. and M.V. acknowledge research programs UNICT 2020-22 PIACERI line 2.

Conflicts of Interest

The authors declare no conflict of interest.

References

  1. Bonneville, A.; Gouze, P. Thermal survey of Mount Etna volcano from space. Geophys. Res. Lett. 1992, 19, 725–728. [Google Scholar] [CrossRef]
  2. Del Negro, C.; Cappello, A.; Neri, M.; Bilotta, G.; Hérault, A.; Ganci, G. Lava flow hazards at Mount Etna: Constraints imposed by eruptive history and numerical simulations. Sci. Rep. 2013, 3, 3493. [Google Scholar] [CrossRef] [Green Version]
  3. Cappello, A.; Geshi, N.; Neri, M.; Del Negro, C. Lava flow hazards—An impending threat at Miyakejima volcano, Japan. J. Volcanol. Geotherm. Res. 2015, 308, 1–9. [Google Scholar] [CrossRef]
  4. Pedrazzi, D.; Cappello, A.; Zanon, V.; Del Negro, C. Impact of effusive eruptions from the Eguas-Carvao fissure system, Sao Miguel Island, Azores Archipelago (Portugal). J. Volcanol. Geotherm. Res. 2015, 291, 1–13. [Google Scholar] [CrossRef] [Green Version]
  5. Corradino, C.; Ganci, G.; Cappello, A.; Bilotta, G.; Hérault, A.; Del Negro, C. Mapping Recent Lava Flows at Mount Etna Using Multispectral Sentinel-2 Images and Machine Learning Techniques. Remote Sens. 2019, 11, 1916. [Google Scholar] [CrossRef] [Green Version]
  6. Del Negro, C.; Cappello, A.; Ganci, G. Quantifying lava flow hazards in response to effusive eruption. Geol. Soc. Am. Bull. 2016, 128, 752–763. [Google Scholar] [CrossRef]
  7. Bonneville, A.; Vasseur, G.; Kerr, Y. Satellite thermal infrared observations of Mount Etna after the 17th March 1981 eruption. J. Volcanol. Geotherm. Res. 1985, 36, 209–232. [Google Scholar] [CrossRef]
  8. Bonneville, A.; Kerr, Y. A thermal forerunner of the 28th March 1983 Mount Etna eruption from satellite thermal infrared data. J. Geodyn. 1987, 7, 1–31. [Google Scholar] [CrossRef]
  9. Cappello, A.; Ganci, G.; Bilotta, G.; Herault, A.; Zago, V.; Del Negro, C. Satellite-driven modeling approach for monitoring lava flow hazards during the 2017 Etna eruption. Ann. Geophys. Geophys. 2018, 61, 2–13. [Google Scholar] [CrossRef]
  10. Ganci, G.; Cappello, A.; Bilotta, G.; Corradino, C.; Del Negro, C. Satellite-Based Reconstruction of the Volcanic Deposits during the December 2015 Etna Eruption. Data 2019, 4, 120. [Google Scholar] [CrossRef] [Green Version]
  11. Cappello, A.; Zanon, V.; Del Negro, C.; Ferreira, T.J.L.; Queiroz, M.G.P.S. Exploring lava-flow hazards at Pico Island, Azores Archipelago (Portugal). Terra Nova 2015, 27, 156–161. [Google Scholar] [CrossRef]
  12. Rogic, N.; Cappello, A.; Ganci, G.; Maturilli, A.; Rymer, H.; Blake, S.; Ferrucci, F. Spaceborne EO and a Combination of Inverse and Forward Modelling for Monitoring Lava Flow Advance. Remote Sens. 2019, 11, 3032. [Google Scholar] [CrossRef] [Green Version]
  13. Francis, P.W.; Rothery, D.A. Using Landsat Thematic Mapper to detect and monitor active volcanoes: An example from Lascar volcano, northern Chile. Geology 1987, 15, 614–617. [Google Scholar] [CrossRef]
  14. Rothery, D.A.; Francis, P.W.; Wood, C.A. Volcano monitoring using short wavelength infrared data from satellites. J. Geophys. Res. Solid Earth 1988, 93, 7993–8008. [Google Scholar] [CrossRef]
  15. Pieri, D.C.; Glaze, L.S.; Abrams, M.J. Thermal radiance observations of an active lava flow during the June 1984 eruption of Mount Etna. Geology 1990, 18, 1018–1022. [Google Scholar] [CrossRef]
  16. Chatterjee, R.S. Coal fire mapping from satellite thermal IR data—A case example in Jharia Coalfield, Jharkhand, India. ISPRS J. Photogramm. Remote Sens. 2006, 60, 113–128. [Google Scholar] [CrossRef]
  17. Huo, H.; Jiang, X.; Song, X.; Li, Z.L.; Ni, Z.; Gao, C. Detection of coal fire dynamics and propagation direction from multi-temporal nighttime Landsat SWIR and TIR data: A case study on the Rujigou Coalfield, Northwest (NW) China. Remote Sens. 2014, 6, 1234–1259. [Google Scholar] [CrossRef] [Green Version]
  18. Oppenheimer, C. Lava Flow Cooling Estimated from Landsat Thematic Mapper Infrared Data: The Lonquimay Eruption (Chile, 1989). J. Geophys. Res. 1991, 96, 21865–21878. [Google Scholar] [CrossRef]
  19. Flynn, L.P.; Harris, A.J.L.; Wright, R. Improved identification of volcanic features using Landsat 7 ETM+. Remote Sens. Environ. 2001, 78, 180–193. [Google Scholar] [CrossRef]
  20. Wooster, M.J.; Rothery, D.A. Thermal monitoring of Lascar volcano, Chile, using infrared data from the along-track scanning radiometer: A 1992–1995 time series. Bull. Volcanol. 1997, 58, 566–579. [Google Scholar] [CrossRef]
  21. Sano, T.; Shirao, M.; Tani, K.; Tsutsumi, Y.; Kiyokawa, S.; Fujii, T. Progressive enrichment of arc magmas caused by the subduction of seamounts under Nishinoshima volcano, Izu-Bonin Arc, Japan. J. Volcanol. Geotherm. Res. 2016, 319, 52–65. [Google Scholar] [CrossRef]
  22. Wright, R.; Flynn, L.P. On the retrieval of lava-flow surface temperatures from infrared satellite data. Geology 2003, 31, 893–896. [Google Scholar] [CrossRef]
  23. Jiang, H.Y.; Xie, L.J.; Peng, Y.S.; Ying, Y.B. Study on the influence of temperature on near infrared spectra. Spectrosc. Spectr. Anal. 2008, 28, 1510–1513. [Google Scholar]
  24. Foster, J.L. Observations of The Earth Using Nighttime Visible Imagery. In Proceedings of the SPIE 0414, Optical Engineering for Cold Environments, Arlington, VA, USA, 7–8 April 1983. [Google Scholar]
  25. Liu, J.G.; Mason, P.J. Image Processing and GIS for Remote Sensing: Techniques and Applications; John Wiley & Sons: Chichester, UK, 2016; p. 472. [Google Scholar]
  26. Maldague, X.P.V. Nondestructive Evaluation of Materials by Infrared Thermography; Springer Science & Business Media: Berlin/Heidelberg, Germany, 2012; p. 207. [Google Scholar]
  27. Lisiecka, E.; Passia, H.A. Concept of the method and device for optical measurement of high temperatures (in Polish). Pomiary Autom. Kontrola 2014, 60, 272–274. [Google Scholar]
  28. Donegan, S.J.; Flynn, L.P. Comparison of the response of the Landsat 7 Enhanced Thematic Mapper Plus and the Earth Observing-1 Advanced Land Imager over active lava flows. J. Volcanol. Geotherm. Res. 2004, 135, 105–126. [Google Scholar] [CrossRef]
  29. Ramsey, M.; Dehn, J. Spaceborne observations of the 2000 Bezymianny, Kamchatka eruption: The integration of high-resolution ASTER data into near real-time monitoring using AVHRR. J. Volcanol. Geotherm. Res. 2004, 135, 127–146. [Google Scholar] [CrossRef]
  30. Wright, R.; Flynn, L.P.; Garbeil, H.; Harris, A.J.L.; Pilger, E. MODVOLC: Near-real-time thermal monitoring of global volcanism. J. Volcanol. Geotherm. Res. 2004, 135, 29–49. [Google Scholar] [CrossRef]
  31. Rothery, D.A.; Borgia, A.; Carlton, R.W.; Oppenheimer, C. The 1992 Etna lava flow imaged by Landsat TM. Int. J. Remote Sens. 1992, 13, 2759–2763. [Google Scholar] [CrossRef]
  32. Hirn, B.; Di Bartola, C.; Ferrucci, F. Spaceborne monitoring 2000-2005 of the Pu’u ’O’o-Kupaianaha (Hawaii) eruption by synergetic merge of multispectral payloads ASTER and MODIS. IEEE Trans. Geosci. Remote Sens. 2008, 46, 2848–2856. [Google Scholar] [CrossRef]
  33. Marchese, F.; Neri, M.; Falconieri, A.; Lacava, T.; Mazzeo, G.; Pergola, N.; Tramutoli, V. The contribution of multi-sensor infrared satellite observations to monitor Mt. Etna (Italy) Activity during May to August 2016. Remote Sens. 2018, 10, 1948. [Google Scholar] [CrossRef] [Green Version]
  34. Landsat Handbook. Available online: https://www.usgs.gov/land-resources/nli/landsat/using-usgs-landsat-level-1-data-product (accessed on 10 March 2020).
  35. Computing the Planck Function. Yale University. Available online: https://www.yumpu.com/en/document/read/51092673/computing-the-planck-function-yale-university (accessed on 11 March 2020).
  36. Wright, R.; Garbeil, H.; Davies, A.G. Cooling rate of some active lavas determined using an orbital imaging spectrometer. J. Geophys. Res. Solid Earth 2010, 115, B06205. [Google Scholar] [CrossRef] [Green Version]
  37. Lee, R.J.; Ramsey, M.S.; King, P.L. Development of a new laboratory technique for high-temperature thermal emission spectroscopy of silicate melts. J. Geophys. Res. Solid Earth 2013, 118, 1968–1983. [Google Scholar] [CrossRef] [Green Version]
  38. Ramsey, M.; Chevrel, M.; Coppola, D.; Harris, A. The influence of emissivity on the thermo-rheological modeling of the channelized lava flows at Tolbachik volcano. Ann. Geophys. 2019, 62, 222. [Google Scholar] [CrossRef]
  39. Using the USGS Landsat Level-1 Data Product. Available online: https://www.usgs.gov/land-resources/nli/landsat/using-usgs-landsat-level-1-data-product (accessed on 10 March 2020).
  40. Calvari, S.; Pinkerton, H. Formation of lava tubes and extensive flow field during the 1991–1993 eruption of Mount Etna. J. Geophys. Res. 1998, 103, 27291–27301. [Google Scholar] [CrossRef]
  41. Allard, P.; Behncke, B.; D’Amico, S.; Neri, M.; Gambino, S. Mount Etna 1993–2005: Anatomy of an evolving eruptive cycle. Earth Sci. Rev. 2006, 78, 85–114. [Google Scholar] [CrossRef]
  42. Cappello, A.; Bilotta, G.; Neri, M.; Del Negro, C. Probabilistic modeling of future volcanic eruptions at Mount Etna. J. Geophys. Res. Solid Earth 2013, 118, 1925–1935. [Google Scholar] [CrossRef] [Green Version]
  43. Acocella, V.; Neri, M.; Behncke, B.; Bonforte, A.; Del Negro, C.; Ganci, G. Why does a mature volcano need new vents? The case of the new southeast crater at Etna. Front. Earth Sci. 2016, 4. [Google Scholar] [CrossRef] [Green Version]
  44. Barreca, G.; Branca, S.; Monaco, C. Three-Dimensional Modeling of Mount Etna Volcano: Volume Assessment, Trend of Eruption Rates, and Geodynamic Significance. Tectonics 2018, 37, 842–857. [Google Scholar] [CrossRef]
  45. Gvirtzman, Z.; Nur, A. Formation of Mount Etna as a consequence of slab rollback. Nature 1999, 401, 782–785. [Google Scholar] [CrossRef]
  46. Nicolich, R.; Laigle, M.; Hirn, A.; Cernobori, L.; Gallart, J. Crustal structure of the Ionian margin of Sicily: Etna volcano in the frame of regional evolution. Tectonophysics 2000, 329, 121–139. [Google Scholar] [CrossRef]
  47. Doglioni, C.; Innocenti, F.; Mariotti, S. Why Mt. Etna? Terra Nova 2001, 13, 25–31. [Google Scholar] [CrossRef] [Green Version]
  48. Palano, M.; Ferranti, L.; Monaco, C.; Mattia, M.; Aloisi, M.; Bruno, V.; Cannavò, F.; Siligato, G. GPS velocity and strain fields in Sicily and southern Calabria, Italy: Updated geodetic constraints on tectonic block interaction in the central Mediterranean. J. Volcanol. Geotherm. Res. 2012, 117, B07401. [Google Scholar] [CrossRef] [Green Version]
  49. Viccaro, M.; Zuccarello, F. Mantle ingredients for making the fingerprint of Etna alkaline magmas: Implications for shallow partial melting within the complex geodynamic framework of Eastern Sicily. J. Geodyn. 2017, 109, 10–23. [Google Scholar] [CrossRef]
  50. Díaz-Moreno, A.; Barberi, G.; Cocina, O.; Koulakov, I.; Scarfî, L.; Zuccarello, L.; Prudencio, J.; García-Yeguas, A.; Álvarez, I.; García, L.; et al. New Insights on Mt. Etna’s Crust and Relationship with the Regional Tectonic Framework from Joint Active and Passive P-Wave Seismic Tomography. Surv. Geophys. 2018, 39, 57–97. [Google Scholar] [CrossRef] [PubMed] [Green Version]
  51. Del Negro, C.; Cappello, A.; Neri, M.; Bilotta, G.; Hérault, A.; Ganci, G. Etna flank lava flows between 1610 and 2008. Pangaea 2013. [Google Scholar] [CrossRef]
  52. Corradino, C.; Ganci, G.; Cappello, A.; Bilotta, G.; Calvari, S.; Del Negro, C. Recognizing Eruptions of Mount Etna through Machine Learning using Multiperspective Infrared Images. Remote Sens. 2020, 12, 970. [Google Scholar] [CrossRef] [Green Version]
  53. Calvari, S.; Salerno, G.G.; Spampinato, L.; Gouhier, M.; La Spina, A.; Pecora, E.; Boschi, E. An unloading foam model to constrain Etna’s 11–13 January 2011 lava fountaining episode. J. Geophys. Res. Solid Earth 2011, 116, 1–18. [Google Scholar] [CrossRef]
  54. Calvari, S.; Ganci, G.; Victória, S.S.; Hernandez, P.A.; Perez, N.M.; Barrancos, J.; Alfama, V.; Dionis, S.; Cabral, J.; Cardoso, N.; et al. Satellite and Ground Remote Sensing Techniques to Trace the Hidden Growth of a Lava Flow Field: The 2014–2015 Effusive Eruption at Fogo Volcano (Cape Verde). Remote Sens. 2018, 10, 1115. [Google Scholar] [CrossRef] [Green Version]
  55. Giuffrida, M.; Viccaro, M. Three years (2011–2013) of eruptive activity at Mt. Etna: Working modes and timescales of the modern volcano plumbing system from micro-analytical studies of crystals. Earth Sci. Rev. 2017, 171, 289–322. [Google Scholar] [CrossRef]
  56. Cappello, A.; Ganci, G.; Bilotta, G.; Corradino, C.; Herault, A.; Del Negro, C. Changing eruptive styles at the South-East Crater of Mount Etna: Implications for assessing lava flow hazards. Front. Earth Sci. 2019, 7, 1–10. [Google Scholar] [CrossRef] [Green Version]
  57. Palano, M.; Viccaro, M.; Zuccarello, F.; Gresta, S. Magma transport and storage at Mt. Etna (Italy): A review of geodetic and petrological data for the 2002-03, 2004 and 2006 eruptions. J. Volcanol. Geotherm. Res. 2017, 347, 149–164. [Google Scholar] [CrossRef]
  58. Neri, M.; Acocella, V.; Behncke, B.; Maiolino, V.; Ursino, A.; Velardita, R. Contrasting triggering mechanisms of the 2001 and 2002–2003 eruptions of Mount Etna (Italy). J. Volcanol. Geotherm. Res. 2005, 144, 235–255. [Google Scholar] [CrossRef]
  59. Nicotra, E.; Viccaro, M. Transient uprise of gas and gas-rich magma batches fed the pulsating behavior of the 2006 eruptive episodes at Mt. Etna volcano. J. Volcanol. Geotherm. Res. 2012, 227, 102–118. [Google Scholar] [CrossRef]
  60. Bonaccorso, A.; Bonforte, A.; Calvari, S.; Del Negro, C.; Di Grazia, G.; Ganci, G.; Neri, M.; Vicari, A.; Boschi, E. The initial phases of the 2008–2009 Mount Etna eruption: A multidisciplinary approach for hazard assessment. J. Geophys. Res. 2011, 116, B03203. [Google Scholar] [CrossRef] [Green Version]
  61. Ganci, G.; Vicari, A.; Cappello, A.; Del Negro, C. An emergent strategy for volcano hazard assessment: From thermal satellite monitoring to lava flow modeling. Remote Sens. Environ. 2012, 119, 197–207. [Google Scholar] [CrossRef]
  62. Behncke, B.; Fornaciai, A.; Neri, M.; Favalli, M.; Ganci, G.; Mazzarini, F. Lidar surveys reveal eruptive volumes and rates at Etna, 2007–2010. Geophys. Res. Lett. 2016, 43, 4270–4278. [Google Scholar] [CrossRef] [Green Version]
  63. Viccaro, M.; Calcagno, R.; Garozzo, I.; Giuffrida, M.; Nicotra, E. Continuous magma recharge at Mt. Etna during the 2011–2013 period controls the style of volcanic activity and compositions of erupted lavas. Miner. Petrol. 2015, 109, 67–83. [Google Scholar] [CrossRef]
  64. Giuffrida, M.; Viccaro, M.; Ottolini, L. Ultrafast syn-eruptive degassing and ascent trigger high-energy basic eruptions. Sci. Rep. 2018, 8, 1–7. [Google Scholar] [CrossRef]
  65. Viccaro, M.; Zuccarello, F.; Cannata, A.; Palano, M.; Gresta, S. How a complex basaltic volcanic system works: Constraints from integrating seismic, geodetic, and petrological data at Mount Etna volcano during the July-August 2014 eruption. J. Geophys. Res. Solid Earth 2016, 121, 5659–5678. [Google Scholar] [CrossRef] [Green Version]
  66. Cannata, A.; Di Grazia, G.; Giuffrida, M.; Gresta, S.; Palano, M.; Sciotto, M.; Viccaro, M.; Zuccarello, F. Space-time evolution of magma storage and transfer at Mt. Etna volcano (Italy): The 2015-2016 reawakening of Voragine crater. Geochem. Geophys. Geosyst. 2018, 19, 471–495. [Google Scholar] [CrossRef]
  67. Viccaro, M.; Giuffrida, M.; Zuccarello, F.; Scandura, M.; Palano, M.; Gresta, S. Violent paroxysmal activity drives self-feeding magma replenishment at Mt. Etna. Sci. Rep. 2019, 9, 6717. [Google Scholar] [CrossRef] [PubMed] [Green Version]
  68. Calvari, S.; Coltelli, M.; Neri, M.; Pompilio, M.; Scribano, V. The 1991-1993 Etna eruption: Chronology and geological observations. Acta Vulcanol. 1994, 4, 1–14. [Google Scholar]
  69. Wright, R.; Rothery, D.A.; Blake, S.; Pieri, D.C. Visualising active volcanism with high spatial resolution satellite data: The 1991-1993 eruption of Mount Etna. Bull. Volcanol. 2000, 62, 256–265. [Google Scholar] [CrossRef]
  70. Gauthier, F. Field and laboratory studies of the rheology of Mount Etna lava. Philos. Trans. R. Soc. A 1973, 274, 83–98. [Google Scholar] [CrossRef]
  71. Archambault, C.; Tanguy, J.C. Comparative temperature measurements on Mount Etna lavas: Problems and techniques. J. Volcanol. Geotherm. Res. 1976, 1, 113–125. [Google Scholar] [CrossRef]
  72. Blackett, M. An Overview of Infrared Remote Sensing of Volcanic Activity. J. Imaging 2017, 3, 13. [Google Scholar] [CrossRef]
  73. Behncke, B.; Neri, M. The July–August 2001 eruption of Mt. Etna (Sicily). Bull. Volcanol. 2003, 65, 461–476. [Google Scholar] [CrossRef]
  74. Rosi, M.; Bertagnini, A.; Landi, P. Onset of the persistent activity at Stromboli Volcano (Italy). Bull. Volcanol. 2000, 62, 294–300. [Google Scholar] [CrossRef]
  75. Ellam, R.M.; Hawkesworth, C.J.; Menzies, M.A.; Rogers, N.W. The volcanism of southern Italy: Role of subduction and the relationship between potassic and sodic alkaline magmatism. J. Geophys. Res. 1989, 94, 4589–4601. [Google Scholar] [CrossRef]
  76. Francalanci, L.; Manetti, P.; Peccerillo, A. Volcanological and magmatological evolution of Stromboli volcano (Aeolian Islands): The roles of fractional crystallization, magma mixing, crustal contamination, and source heterogeneity. Bull. Volcanol. 1989, 51, 355–378. [Google Scholar] [CrossRef]
  77. Gillot, P.Y.; Keller, J. Radiochronological dating of Stromboli. Acta Vulcanol. 1993, 3, 69–77. [Google Scholar]
  78. Conrey, R.M.; Sherrod, D.R.; Hooper, P.R.; Swanson, D.A. Diverse primitive magmas in the Cascade Arc, northern Oregon and southern Washington. Can. Mineral. 1997, 35, 367–396. [Google Scholar]
  79. Gasparini, P.; Lannaccone, G.; Scandone, P.; Scarpa, R. The seismotectonics of the Calabrian Arc. Tectonophysics 1982, 84, 267–286. [Google Scholar] [CrossRef]
  80. Soloviev, S.L.; Kuzin, I.P.; Kovacev, S.A.; Ferri, M.; Guerra, I.; Luongo, G. Microearthquakes in the Tyrrhenian Sea as revealed by joint land and sea-bottom seismographs. Mar. Geol. 1990, 94, 131–146. [Google Scholar] [CrossRef]
  81. Global Volcanism Program. 2020. Available online: https://volcano.si.edu/volcano.cfm?vn=211040 (accessed on 20 May 2020).
  82. Zakšek, K.; Hort, M.; Lorenz, E. Satellite and Ground Based Thermal Observation of the 2014 Effusive Eruption at Stromboli Volcano. Remote Sens. 2015, 7, 17190–17211. [Google Scholar] [CrossRef] [Green Version]
  83. U.S. Geological Survey. 2020. Available online: https://volcanoes.usgs.gov/observatories/hvo/hawaii_hazards.html (accessed on 15 June 2020).
  84. Torsvik, T.; Doubrovine, P.; Steinberger, B.; Gaina, C.; Spakman, W.; Domeier, M. Pacific plate motion change caused the Hawaiian-Emperor Bend. Nat. Commun. 2017, 8, 15660. [Google Scholar] [CrossRef] [Green Version]
  85. Wilson, J.T. A possible origin of the Hawaiian Islands. Can. J. Phys. 1963, 41, 863–870. [Google Scholar] [CrossRef]
  86. Clague, D.A.; Dalrymple, G.B. The Hawaiian–Emperor volcanic chain, Part 1, Geologic evolution. Geol. Surv. Prof. Pap. 1987, 1350, 5–54. [Google Scholar]
  87. Richards, M.A.; Lithgow-Bertelloni, C. Plate motion changes, the Hawaiian-Emperor bend, and the apparent success and failure of geodynamic models. Earth Planet. Sci. Lett. 1996, 137, 19–27. [Google Scholar] [CrossRef]
  88. Neal, C.A.; Brantley, S.R.; Antolik, L.; Babb, J.L.; Burgess, M.; Calles, K.; Cappos, M.; Chang, J.C.; Conway, S.; Desmither, L.; et al. The 2018 rift eruption and summit collapse of Kīlauea Volcano. Science 2019, 363, 367–374. [Google Scholar] [CrossRef]
  89. Flynn, L.P.; Mouginis-Mark, P.J. Temperature of an active lava channel from spectral measurements, Kilauea Volcano, Hawaii. Bull. Volcanol. 1994, 56, 297–301. [Google Scholar] [CrossRef]
  90. Pinkerton, H.; James, M.; Jones, A. Surface temperature measurements of active lava flows on Kilauea volcano, Hawai′i. J. Volcanol. Geotherm. Res. 2002, 113, 159–176. [Google Scholar] [CrossRef] [Green Version]
  91. Gray, D.M.; Burton-Johnson, A.; Fretwell, P.T. Evidence for a lava lake on Mt. Michael volcano, Saunders Island (South Sandwich Islands) from Landsat, Sentinel-2 and ASTER satellite imagery. J. Volcanol. Geotherm. Res. 2019, 379, 60–71. [Google Scholar] [CrossRef]
  92. Patrick, M.; Orr, T.; Fisher, G.; Trusdell, F.; Kauahikaua, J. Thermal mapping of a pāhoehoe lava flow, Kīlauea Volcano. J. Volcanol. Geotherm. Res. 2017, 332, 71–87. [Google Scholar] [CrossRef]
  93. Gudmundsson, M.T.; Larsen, G.; Höskuldsson, A.; Gylfason, A.G. Volcanic hazards in Iceland. Jökull 2008, 58, 251–268. [Google Scholar]
  94. Árnadóttir, T.; Geirsson, H.; Jiang, W. Crustal deformation in Iceland: Plate spreading and earthquake deformation. Jökull 2008, 58, 59–74. [Google Scholar]
  95. Sigmundsson, F.; Einarsson, P.; Hjartardóttir, Á.R.; Drouin, V.; Jónsdóttir, K.; Árnadóttir, T.; Geirsson, H.; Hreinsdóttir, S.; Li, S.; Ófeigsson, B.G. Geodynamics of Iceland and the signatures of plate spreading. J. Volcanol. Geotherm. Res. 2020, 391, 106436. [Google Scholar] [CrossRef]
  96. Gudmundsson, M.T.; Pedersen, R.; Vogfjörd, K.; Thorbjarnardóttir, B.; Jakobsdóttir, S.; Roberts, M.J. Eruptions of Eyjafjallajökull Volcano, Iceland. Eos 2010, 91, 190–191. [Google Scholar] [CrossRef]
  97. Sigmundsson, F.; Hreinsdottir, S.; Hooper, A.; Arnadottir, T.; Pedersen, R.; Roberts, M.J.; Oskarsson, N.; Auriac, A.; Decriem, J.; Einarsson, P.; et al. Intrusion triggering of the 2010 Eyjafjallajökull explosive eruption. Nature 2010, 468, 426–430. [Google Scholar] [CrossRef] [PubMed]
  98. Sigmarsson, O.; Vlastelic, I.; Andreasen, R.; Bindeman, I.; Devidal, J.L.; Moune, S.; Keiding, J.K.; Larsen, G.; Hoskuldsson, A.; Thordarson, T. Remobilization of silicic intrusion by mafic magmas during the 2010 Eyjafjallajökull eruption. Solid Earth 2011, 2, 271–281. [Google Scholar] [CrossRef] [Green Version]
  99. Viccaro, M.; Giuffrida, M.; Nicotra, E.; Cristofolini, R. Timescales of magma storage and migration recorded by olivine crystals in basalts of the March-April 2010 eruption at Eyjafjallajökull volcano, Iceland. Am. Miner. 2016, 101, 222–230. [Google Scholar] [CrossRef]
  100. Elliot, A.J.; Singh, N.; Loveridge, P.; Harcourt, S.; Smith, S.; Pnaiser, R.; Kavanagh, K.; Robertson, C.; Ramsay, C.N.; McMenamin, J.; et al. Syndromic surveillance to assess the potential public health impact of the Icelandic volcanic ash plume across the United Kingdom. Eurosurveillance 2010, 15, 19583. [Google Scholar] [CrossRef] [PubMed]
  101. Giíslason, S.R.; Stefánsdóttir, G.; Pfeffer, M.A.; Barsotti, S.; Jóhannsson, T.; Galeczka, I.; Bali, E.; Sigmarsson, O.; Stefánsson, A.; Keller, N.S.; et al. Environmental pressure from the 2014–15 eruption of Bárðarbunga volcano, Iceland. Geochem. Perspect. 2015, 1, 84–93. [Google Scholar] [CrossRef] [Green Version]
  102. Dürig, T.; Gudmundsson, M.; Högnadóttir, T.; Jónsdóttir, I. Estimation of lava flow field volumes and volumetric effusion rates from airborne radar profiling and other data: Monitoring of the Nornahraun (Holuhraun) 2014/15 eruption in Iceland. In European Geosciences Union, General Assembly; European Geosciences Union: Vienna, Austria, 2015; Volume 17, p. 8519. [Google Scholar]
  103. Pedersen, G.; Höskuldsson, A.; Riishuus, M.S.; Jónsdóttir, I.; Thórdarson, T.; Gudmundsson, M.T.; Durmont, S. Emplacement dynamics and lava field evolution of the flood basalt eruption at Holuhraun, Iceland: Observations from field and remote sensing data. In EGU General Assembly; European Geosciences Union: Vienna, Austria, 2016; Volume 18, p. 13961. [Google Scholar]
  104. Pedersen, G.B.M.; Höskuldsson, A.; Dürig, T.; Thordarson, T.; Jónsdóttir, I.; Riishuus, M.S.; Óskarsson, B.V.; Dumont, S.; Magnusson, E.; Gudmundsson, M.T.; et al. Lava field evolution and emplacement dynamics of the 2014–2015 basaltic fissure eruption at Holuhraun, Iceland. J. Volcanol. Geotherm. Res. 2017, 340, 155–169. [Google Scholar] [CrossRef] [Green Version]
  105. Aufaristama, M.; Hoskuldsson, A.; Jonsdottir, I.; Ulfarsson, M.O.; Thordarson, T. New Insights for Detecting and Deriving Thermal Properties of Lava Flow Using Infrared Satellite during 2014–2015 Effusive Eruption at Holuhraun, Iceland. Remote Sens. 2018, 10, 151. [Google Scholar] [CrossRef] [Green Version]
  106. Kolzenburg, S.; Giordano, D.; Thordarson, T.; Höskuldsson, A.; Dingwell, D.B. The rheological evolution of the 2014/2015 eruption at Holuhraun, central Iceland. Bull. Volcanol. 2017, 79, 45–60. [Google Scholar] [CrossRef]
Figure 1. An example of temperature detection problems (saturation) with different spectral bands (TIR (A,B,F), NIR (E), and SWIR1-2 (C,D)) from Mt. Etna and Kīlauea. The identifiable thermal range depends on the used spectral band. The (D) image is zoomed in of (C); the NIR was able to detect higher temperatures where SWIR2 was saturated.
Remotesensing 12 02537 g001
Figure 2. Locations of the studied volcanos.
Remotesensing 12 02537 g002
Figure 3. The location of active- and cooling lava flows on Etna from 1991 to 2020 (J) detected on night-time images by Landsat series 4-5TM, 7ETM+, 8OLI (AF,H,I), and ASTER TIR (G). Background map: Esri, DigitalGlobe, GeoEye, Earthstar Geographics, CNES/Airbus DS, USDA, USGS, AeroGRID, IGN, and the GIS User Community.
Remotesensing 12 02537 g003
Figure 4. The calculated radiation heat flux of lava flows on Etna (A,B). The location of these lava flows showed in Figure 3C. The points represent the pixel values shown on a diagram in Figure 5A,B. Background map: as indicated for Figure 3.
Remotesensing 12 02537 g004
Figure 5. Comparison of radiant heat flux with slope and distance from twovents from Mount Etna (A,B) and Stromboli (C). The retrieved pixel values are taken from Figure 4 and Figure 6. The slope was calculated from SRTM digital elevation models downloaded from https://earthexplorer.usgs.gov/.
Remotesensing 12 02537 g005
Figure 6. Some eruptions followed by lava flows on Stromboli from 17.08.2014 to 20.10.2014 (A1C3) detected by Landsat 8OLI night-time images and calculated radiation heat flux (D1D3) of the lava flow of 18.09.2014. Background map: as indicated for Figure 3.
Remotesensing 12 02537 g006
Figure 7. Lava flow series illustrated with different bands (A1–D3) on Kīlauea detected by Landsat 8OLI night-time images from 08.06 to 12.07.2018. Background map: Landsat 8OLI (26.02.2019). The (A2A3) images are zoomed in of (A1). The NIR saturated on (A1) image. The (E,G) images are composite of emitted spectral radiance by the lava flow. The red rectangle illustrating the location of the particular lava flow (F) close to Kīlauea.
Remotesensing 12 02537 g007
Figure 8. Zoomed images (AC) of lava flow (Figure 7(B1–B3)) on Kīlauea to show more details of hot and cooler surfaces (C), 15 × 15 m resolution). Background map: Landsat 8OLI (26.02.2019).
Remotesensing 12 02537 g008
Figure 9. Temperatures of pāhoehoe lava (A,C) and of lava lake on Kīlauea (B).
Remotesensing 12 02537 g009
Figure 10. Lava flow formation detected by NIR (A), green–panchromatic (B), red (C) bands from different vents on the lower East Rift Zone (Pu’u O’o vents, Kīlauea) where an eruption occurred, and new fissures opened in the residential neighborhood of Leilani Estates on 3 May 2018. The combination of different spectral radiances is well representative of the lava flow system (D).
Remotesensing 12 02537 g010
Figure 11. The eruption events of Fimmvörðuháls in April (A1–B) and Eyjafjallajökull in May (C1–C3) of 2010 as detected by Landsat 7ETM+ night-time images. Background map: as indicated for Figure 3. The (D) well indicates the extension of these volcanic activities.
Remotesensing 12 02537 g011
Figure 12. Eruption and lava flow on Holuhraun (F) from 24.10.2014 to 17.11.2014 (A1B2); 25.11.2014 (D1–D6) to 02.12.2014 (E1E8) as detected by Landsat 8OLI and 7ETM+ (C1C3) night-time images. (C1,C2,E6,E7) illustrate the uselessness of SWIR bands in this case—note the gaps over the active lava and lava lake. Background map: as indicated for Figure 3.
Remotesensing 12 02537 g012aRemotesensing 12 02537 g012b
Table 1. Product ID and the details of Landsat (ASTER) datasets used in this study.
Product IDImage AcquiredScene Centre TimeSensor Type
Etna (Sicily, Italy)
LT50522101991358FUI0024.12.199120:10:05Landsat 4-5TM
LT50522101992073FUI0013.03.199220:09:54Landsat 4-5 TM
LE70522102001217EDC0005.08.200120:34:48Landsat 7ETM+
LE70522102001153EDC0002.06.200120:35:27Landsat 7ETM+
LE70522102006199EDC0018.07.200620:35:30Landsat 7ETM+
LC80522102013338LGN0104.12.201320:47:22Landsat 8OLI
LC80522102019211LGN0030.07.201920:45:47Landsat 8OLI
LC80522102020038LGN0007.02.202020:45:48Landsat 8OLI
AST_L1T_00312262018210330_20181228005119_1151626.12.201821:03:30ASTER TIR
Stromboli (Sicily, Italy)
LC80522112014229LGN0117.08.201420:46:13Landsat 8OLI
LC80522112014261LGN0118.09.201420:46:16Landsat 8OLI
LC80522112014293LGN0120.10.201420:46:23Landsat 8OLI
Kīlauea (Hawaii Island)
LC81651972017213LGN0001.08.201708:18:54Landsat 8OLI
LC81661972018143LGN0023.05.201808:23:59Landsat 8OLI
LC81661982018159LGN0008.06.201808:24:17Landsat 8OLI
LC81651982018168LGN0017.06.201808:18:15Landsat 8OLI
LC81661982018175LGN0024.06.201808:24:28Landsat 8OLI
LC81641972018193LGN0012.07.201808:11:58Landsat 8OLI
Eyjafjallajökull and Fimmvörðuháls (Iceland)
LE70672292010091EDC0001.04.201022:18:13Landsat 7ETM+
LE70672292010107EDC0017.04.201022:18:13Landsat 7ETM+
LE70672292010123EDC0003.05.201022:18:11Landsat 7ETM+
Holuhraun (Iceland)
LC80642292014297LGN0124.10.201422:07:41Landsat 8OLI
LC80642292014313LGN0109.11.201422:07:42Landsat 8OLI
LE70642302014321ASN0017.11.201422:06:06Landsat 7ETM+
LC80642302014329LGN0125.11.201422:08:03Landsat 8OLI
LC80652292014336LGN0102.12.201422:13:50Landsat 8OLI
Table 2. The constants calculated according to Formulas (4) and (5) using the central wavelengths provided. K1: w/(m2·sr·µm); K2: Kelvin. * Calibration constants are provided in the metadata file of the satellite image. The minimum and maximum pixel integrated temperatures for Landsat TM and for ETM+ (high-gain–low gain), see details in [19].
BandsCalibration ConstantsLandsat 4-5TMLandsat 7ETM+Landsat 8OLIUsed Central Wavelength
(λ) in µm
Pixel Size (m)Pixel-Integrated Temperatures Which Can Be Detected Without Achieving Saturation [19]
Landsat 4-5TMLandsat 7ETM+Landsat 8OLILandsat 4-5TMLandsat 7ETM+
min. (°C)max. (°C)min. (°C)max. (°C)
BlueK14438321096.94530975960.14530975960.10.4850.4830.48330 × 30105014901051 (1075)1483 (1526)
K229665.329788.129788.1
GreenK11996944890.02162655164.62162655164.60.5690.560.5630 × 309601410900 (922)1301 (1340)
K225285.925692.225692.2
PanchromaticK1-679053366.21109245158.4-0.7060.6415 × 15--702 (721)1056 (1092)
K220379.122480.7
RedK1958297463.8936779686.0951059600.70.6590.6620.6630 × 308101170755 (775)1119 (1156)
K221832.621733.621799.5
NIRK1283104930.3293423595.4245950026.90.8410.8350.86530 × 306201000595 (613)926 (961)
K217107.817230.716633.1
SWIR1K12198908.42279816.42208831.32.2222.2062.2230 × 3012029092 (101)258 (276)
K26475.16522.16480.9
SWIR2K19006526.79798088.99738850.31.6761.6481.6530 × 30220430206 (217)417 (440)
K28584.58730.48719.8
TIR *K1607.76666.09band 10: 774.9
band 11: 480.9
-Landsat TM: 120 × 120;
Landsat 7ETM+: 60 × 60;
Landsat 8OLI: 100 × 100
----
K21260.561282.71band 10: 1321.1
band 11: 1201.1
-

