Intraseasonal Vertical Cloud Regimes Based on CloudSat Observations over the Tropics


1
Department of Atmospheric Sciences, Chinese Culture University, Taipei 11114, Taiwan
2
Department of Atmospheric Sciences, National Taiwan University, Taipei 10617, Taiwan
3
Department of Atmospheric and Ocean Sciences, McGill University, QC H3A 0G4, Canada
*
Author to whom correspondence should be addressed.
Remote Sens. 2020, 12(14), 2273; https://doi.org/10.3390/rs12142273
Submission received: 9 June 2020
/
Revised: 9 July 2020
/
Accepted: 14 July 2020
/
Published: 15 July 2020
(This article belongs to the Special Issue Satellite Remote Sensing for Tropical Meteorology and Climatology)
Abstract
:This study identifies the evolution of tropical vertical cloud regimes (CRs) and their associated heating structures on the intraseasonal time scales. Using the cloud classification retrievals of CloudSat during boreal winter between 2006 and 2017, the CR index is defined as the leading pair of the combined multivariate empirical orthogonal functions of the daily mean frequency of deep, high, and low clouds over the tropical Indian Ocean, Maritime Continents, and the Western Pacific. The principal components of the CR index exhibit robust temporal variance in the 30 to 80 day intraseasonal band. Based on the propagation stages of the CRs, the coherent vertical structures of cloud composition and large-scale moisture and vertical motion exhibit a westward-tilted structure. The associated Q1-QR diabatic heating and cloud radiative forcing are consistent with the key characteristics of the Madden Julian Oscillation (MJO) documented in the previous studies. Lastly, an MJO case study showcases that the presented approach characteristically captures the propagation of moisture, cloud vertical structure, and precipitation activity across spatial and temporal scales. The current results suggest that the CR index can potentially serve as an evaluation metric to cloud-associated processes in the simulated tropical intraseasonal variability in global climate models.

1. Introduction
Tropical convective clouds and the associated precipitation are essential modulators of the climate system. Given their significant contribution to the energy balance and the close connections to the hydrological cycle, modulation of clouds and precipitation, including the coverage, frequency of occurrence, and optical and microphysical properties, can lead to substantial climate feedbacks [1,2,3,4,5,6,7,8,9,10,11,12]. Tropical convection systems exhibit multiple scales; the cumulus can upscale to mesoscale systems and further to planetary-scale such as the Madden Julian Oscillation (MJO), the dominant intraseasonal (30–90 days) variability during the boreal winter. The upscale convection organization/aggregation remains a challenge to simulate this particular tropical phenomenon in global circulation models (GCMs). Mapes [13] noted the progression from shallow to deep convection to stratiform anvils is self-similar in the tropical variabilities of various time scales. They argued that the multiscale structure, which is modulated by larger scale waves, consists of mesoscale convection systems (MCSs) with varying durations of shallow, deep, and stratiform anvil clouds, instead of simple superpositions of fixed cloud structures. Therefore, multiple cloud species usually coexist in the Tropics, and their relative composition reflects the changes in the large-scale states.
Satellite remote sensing provides global observations on the structures and spatial-temporal variability of the multi-scale tropical convection systems. These observations provide valuable constraints that facilitate not only the process-level understandings of cloud and precipitation, but also the improvement of their representations in global models. The International Satellite Cloud Climatology Project (ISCCP) [14] provides the longest record of global cloud cover since the year 1983 based on visible and infrared radiances collected from multiple operational weather satellites in geostationary orbits. The multi-decadal ISCCP data, therefore, serve as important constraints on the climatology and variability of different “cloud regimes” [15,16,17]. Previous studies have been documented the application and implementation of the ISCCP cloud regime (CR) identification. Jakob and Tselious [15] applied joint histograms of cloud-top pressure and cloud optical thickness three-hourly available data to identify CRs in the tropical Western Pacific (TWP). This simple cluster analysis successfully quantified cloud occurrence and activity over the TWP. Rossow et al. [16] extended the CR identification to the whole tropics by applying a similar procedure. Tan et al. [17] used the same technique to investigate the tropical convection and the associated large-scale atmospheric properties. They found that the CR approach has a great advantage to reveal the different types of clouds and their interactions with the large-scale atmospheric environment. Furthermore, Klein et al. [18] developed a statistical model associated with cloud layer occurrence from the ISCCP to improve the estimation of low cloud coverage and cloud base pressures. Their results provide more details of cloud vertical structure over the globe and benefit the traditional surface weather observation. Additionally, the statistics of the CR have been also extensively applied to evaluate the cloud fields simulated in global models [18,19,20].
Since 2006, the 94 GHz CloudSat Cloud Profiling Radar (CPR) has retrieved vertically resolved cloudiness, hydrometeor loadings, and microphysical properties, which have been widely used to study the characteristics of tropical convection [21,22,23]. The CloudSat retrievals have been applied to study cloud composition and cloud radiative heating (CRH) associated with intraseasonal variabilities such as the MJO [24,25,26] and the Boreal Summer Intraseasonal Oscillation (BSISO) [27,28]. Based on these studies, the vertical structure of the cloud radiative effect is crucial information for understanding the convection-radiation interactions involved with the MJO. Besides, a process-oriented metrics to determine the MJO propagation is also applied to the vertical distribution of clouds, which provides an opportunity to examine the simulation and prediction of the intraseasonal time-scale variability. Luo et al. [29] derived vertical CR by applying the k-means clustering algorithm to the multiple satellites’ observation including CloudSat CPR over the entire tropics and compared to the ISCCP CRs from the passive sensors. The four CRs identified in their study provide comprehensive information about typical vertical structures and precipitation features in the tropics, including a regime that represent the mature MCSs frequently formed over the MC and tropical ocean and a regime that signifies the dissipating MCSs.
The prediction and representation of intraseasonal variability in numerical models remain inconsistent and uncertain, largely owing to the lack of model misrepresentation of the moist convection processes [30,31,32]. In recent years, the potential importance of the vertical moist thermodynamic structure and the role of cloud-radiative effects at a different stage from the initiation and propagation of the MJO have received prominent attention in the research community [33,34,35,36]. Observation-based studies on these topics were carried out using the latest remote sensing data [27,37,38] and intensive field campaigns such as The Cooperative Indian Ocean Experiment on Intraseasonal Variability in the year 2011 (CINDY2011), the Dynamics of the Madden-Julian Oscillation (DYNAMO) program, and The Years of Maritime Continent (YMC). These observational supports provide constraints and validation for models and help to quantitatively examine the possible mechanisms on MJO initiation and propagation, including the potential importance of the moist layer depth and convective populations at the different stages [39].
Current monitoring and forecast operations typically use the Real-time Multi-variate MJO (RMM) index [40] to identify MJO variability. The RMM index is derived by the combined outgoing longwave radiation (OLR) at the top of the atmosphere and zonal winds measured at 850 hPa (u850) and 200 hPa (u200). By projecting these three daily observations near the Equator to the leading pair of multi-variable empirical orthogonal functions (EOFs) on the intraseasonal time scale, this method has been widely applied to investigate the evolution of the MJO signal in space and the modulation of global MJO intensity (variance) in time. Similarly, univariate indices have also been developed to identify the convective signal of the MJO using OLR [41] or convective precipitation [42] from the satellite observations.
As previous studies have shown that satellite-derived CRs correspond well to the large-scale states of the Tropics [15,16,29] and the CloudSat observations composited for various phases of the intraseasonal variability revealed distinct patterns of vertically-resolved cloud structure [24,25,26,27,28], the goal of the present study is to identify the major tropical vertical CRs at intraseasonal time scales as a description index from the CloudSat regarding the relative abundance of multiple cloud types. The evolution of the moisture environment and heating structures associated with the CRs are investigated. The data used in the analyses and the method to derive the tropical CRs are described in Section 2. Section 3 presents the main results, including the spatial-temporal structure of the CRs, the composite analyses of the large-scale environment and heating, and a case study of a strong MJO event. The discussion and conclusion are finally provided in Section 4 and Section 5, respectively.
2. Data and Methodology
2.1. CloudSat Cloud Class Frequency and the Combined EOFs to Identify Cloud Regimes
The CloudSat cloud classification product (2B-CLDCLASS) [43] from 2006 to 2017 was used to derive the tropical CRs. The CloudSat CPR detects the vertical cloud distribution with a nominal horizontal footprint size of 1.4 km across by 1.8 km along the track; vertically, there are a total of 125 bins between the surface and 30 km. Eight cloud types are retrieved by the 2B-CLDCLASS algorithm, namely cirrus (Ci), altocumulus (Ac), altostratus (As), cumulus (Cu), stratocumulus (Sc), stratus (St), nimbostratus (Ns), and deep cumulus (DC). To monitor the evolution of the cloud types, in particular the vertical extent in association with the large-scale environment, here we group the cloud types into three major classes: shallow (Cu+St+Sc), deep (Ns+Dc), and high-mid level CRs (Ci+As+Ac).
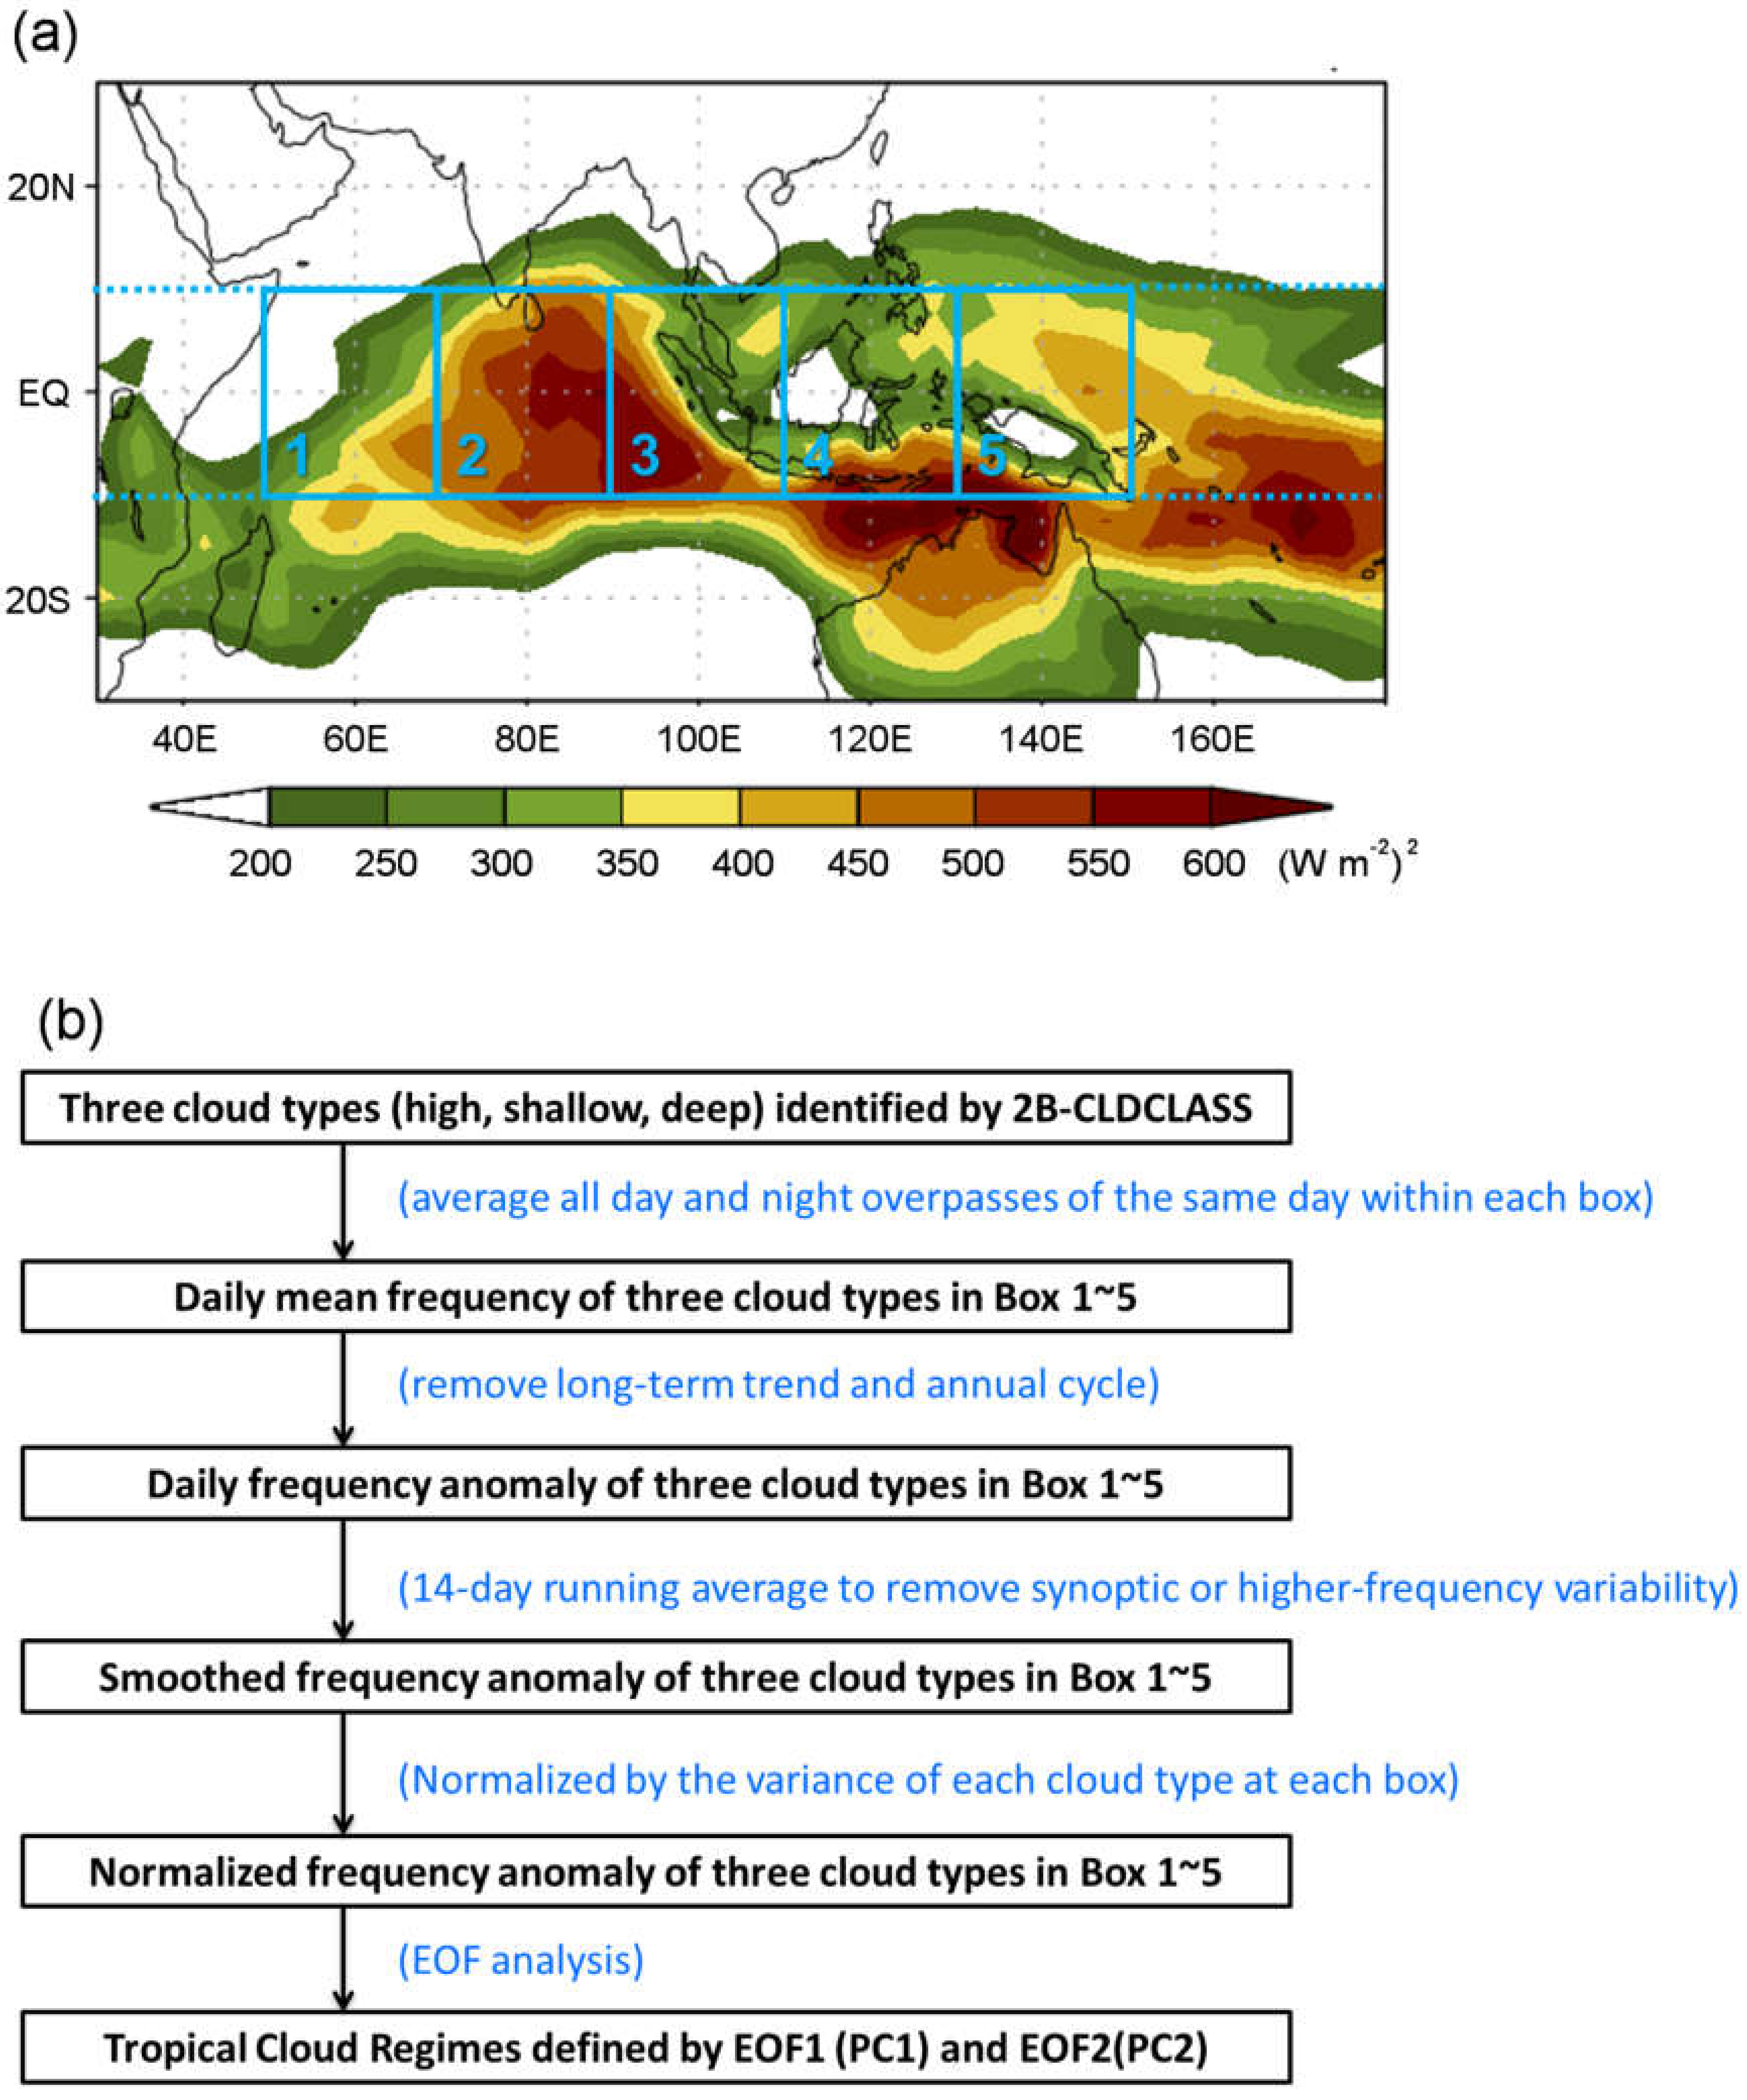
The domain (10°S–10°N, 50°E–150°E) from the tropical Indian Ocean to the Western Pacific warm pool was divided into five 20° by 20° boxes, as shown in Figure 1a. The size of the boxes (20°) was chosen with the consideration of the typical scale of intraseasonal variability in the Tropics so that the evolution of the relative composition of cloud types with the large-scale environment could be captured. Figure 1b provides the data-processing flow of this study. We collected and averaged all the daytime and nighttime CloudSat overpass of the same UTC day within each box to compute the daily time series of the detection frequency of the three major cloud classes in these five boxes. These daily time series were then detrended to remove the long-term linear trend. The climatology annual cycle was also subtracted to remove the seasonal variation, followed by a 14-day running average to remove the high-frequency (synoptic-scale or faster) variations. The smoothed time series was further normalized by the variance of each cloud class in each box.
To derive the cloud regimes, a combined multivariate EOF analysis was applied to the processed daily time series of the three cloud classes at the five geo-location boxes. The EOF analysis is a statistical method that decomposes the spatially weighted anomaly covariance matrix orthogonally and completely into the eigenvectors (i.e., the EOFs) that represent the spatial patterns and the corresponding eigenvalues that represent the percent variance explained by each pattern. The temporal coefficients (principle components) of projecting the original matrix onto the eigenvectors give the amplitude time series of each pattern. The tropical CRs are defined as the leading pair of the EOFs with the highest percent variance (eigenvalues) to describe the large-scale eastward propagating signal as in deriving the RMM index. Their spatial structures and the temporal variation of their principal components are shown in the following section.
2.2. Satellite Diabatic Heating Products and Reanalysis
The vertical distribution of shortwave (SW) and longwave (LW) CRH was obtained from the CloudSat R04 2B-FLXHR product [44]. The estimates of cloud heating rates represent the change of the radiation fluxes owing to the presence of clouds, which were derived by subtracting the clear-sky radiative fluxes from the measured all-sky radiative fluxes. Equivalent clear sky radiative flux profiles were generated by radiative transfer calculations with the removal of cloud liquid and ice water content retrievals from the CloudSat CPR.
Here, we also used the daily mean vertical profiles of large-scale diabatic heating Q1-QR [45] from the spectral latent heating (SH) product [46,47,48,49] at a horizontal resolution of 0.5°. This was based on the reflectivity of the Tropical Rainfall Measuring Mission (TRMM) Precipitation Radar (PR). We note that this diabatic heating product mainly detects the deep cloud and congestus and can underestimate the contribution from the shallow convections that are weakly precipitating [50,51].
Daily mean precipitation estimates from the TRMM 3B42 Version 7 dataset [52,53] were analyzed. This Level-3 rainfall product is the combined retrievals of the microwave radiometer, precipitation radar, and infrared channel, with a 0.25° horizontal resolution. Daily mean moisture, temperature, and vertical motion were taken from the fifth-generation of the European Centre for Medium-Range Weather Forecasts Reanalysis (ERA5) [54] with 30-km horizontal resolution.
3. Results
3.1. Basic Characteristics of Tropical Cloud Regimes
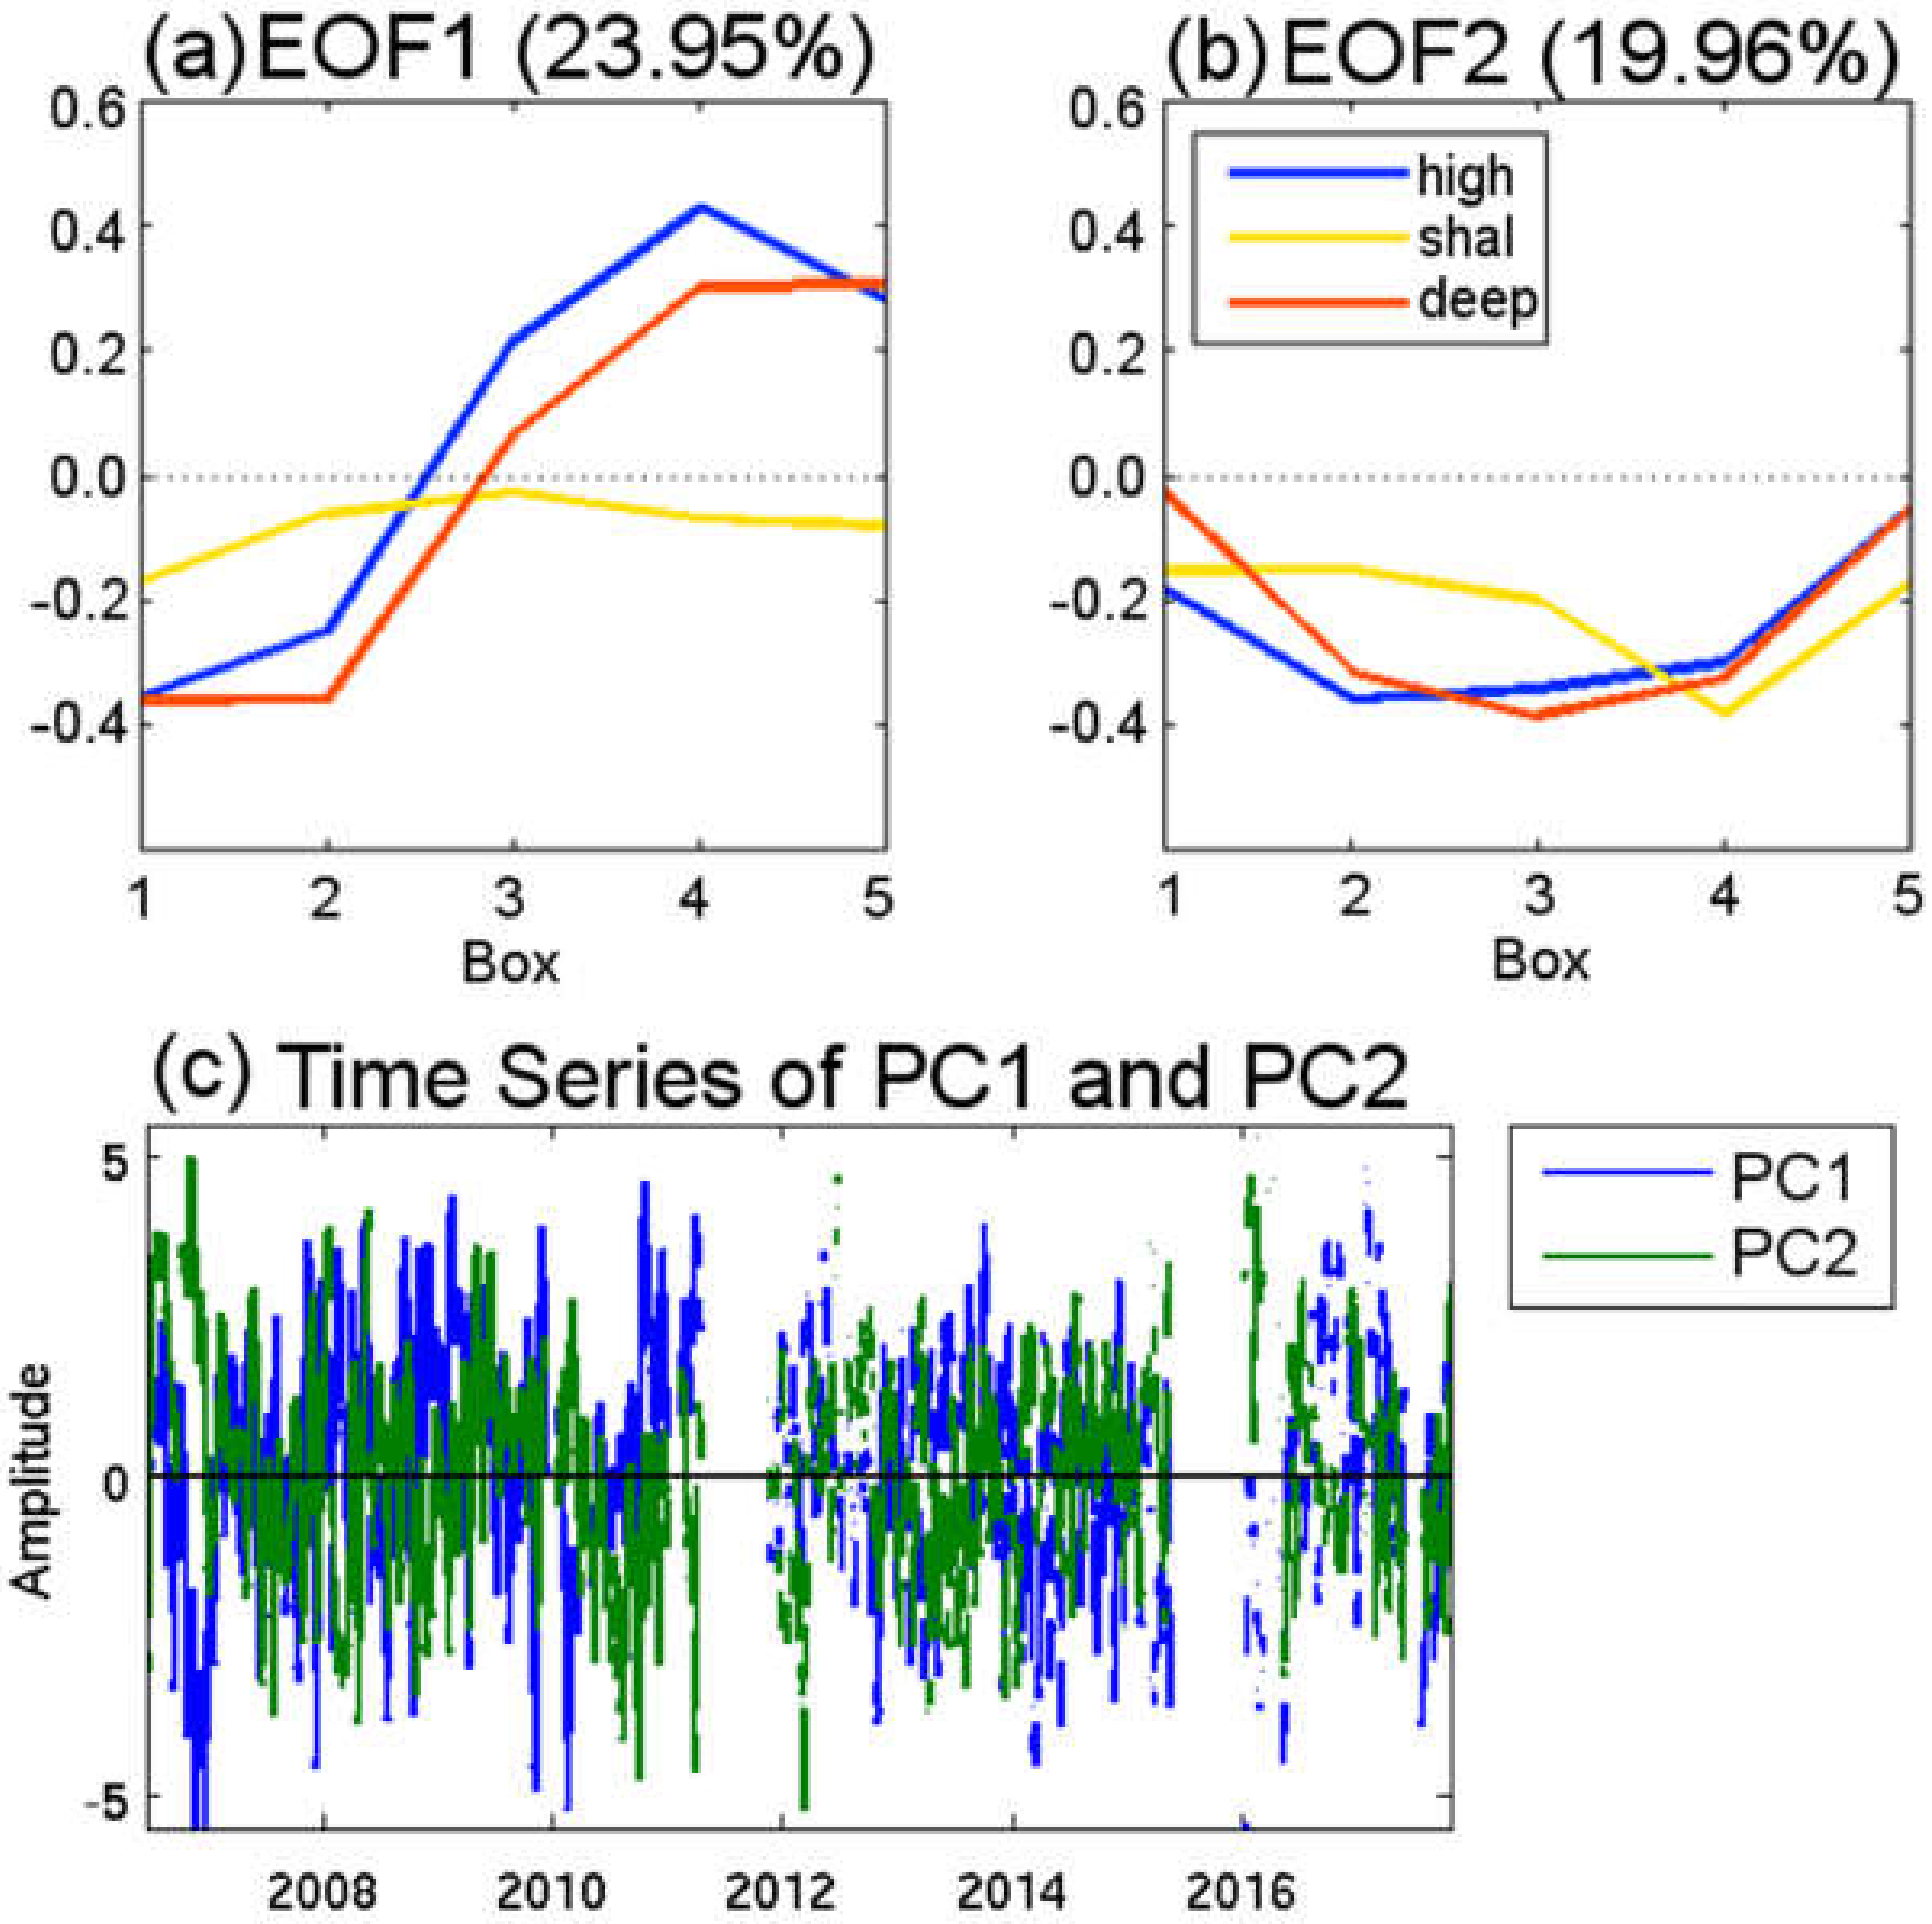
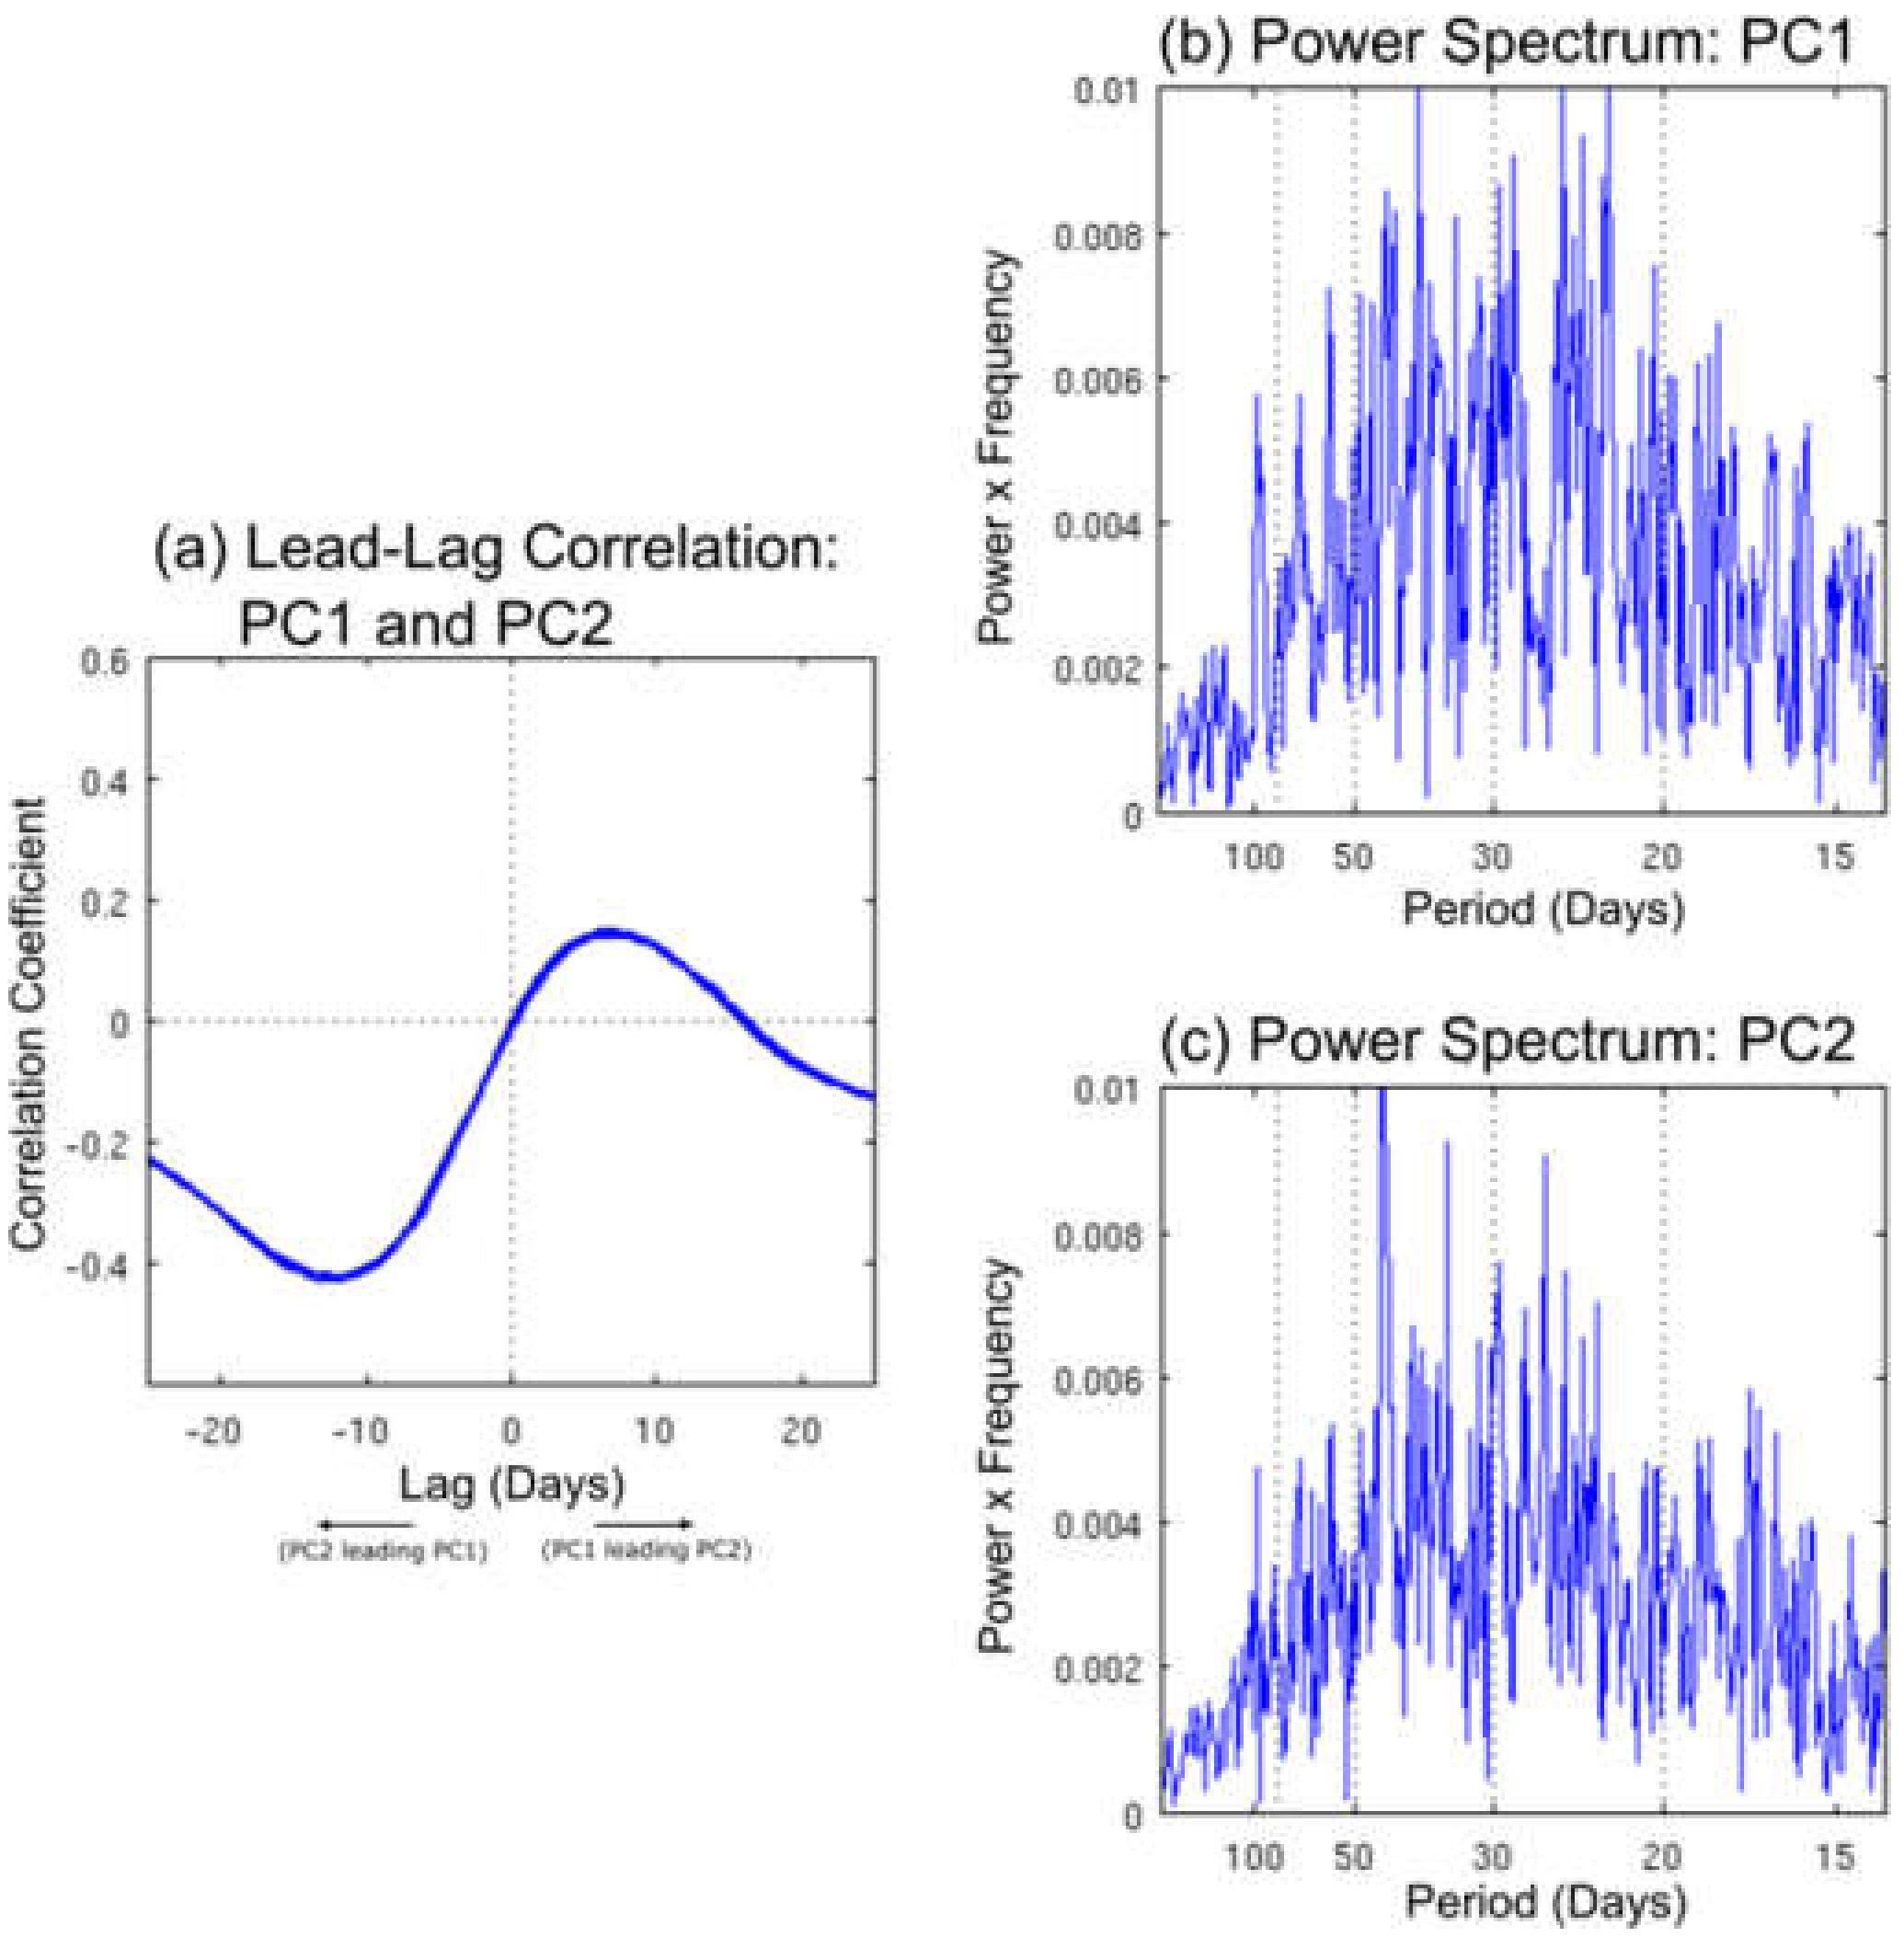
Figure 2a,b displays the spatial structures of the first pair of leading EOFs (CR-EOFs). CR-EOF1 and CR-EOF2 explained around 24% and 20% of the variance of the original cloud frequency data, which was significantly higher than the remaining EOFs (e.g., for CR-EOF3, about 13% of the variance was not shown). CR-EOF1 represents the condition when strong MJO convection locates at the Maritime Continent (MC), as the enhanced presence of deep clouds occurred over Boxes 4 and 5 in Figure 1. CR-EOF2 (if flipping the sign) had enhanced deep clouds over the Indian Ocean in Boxes 2 and 3 in Figure 1. Upon closer examination, deep clouds in CR-EOF1 coexisted with anvil clouds and shallow clouds, while in CR-EOF2, enhanced shallow clouds led the deep cloud to the east, while the anvil clouds lagged to the west, forming the familiar “westward tilting” of cloud type evolution. Projection of the daily cloud frequency time series on to the combined EOFs yielded the principal components (CR-PCs) or the temporal coefficients of the EOFs, shown in Figure 2c. The CR-PCs consistently had high day-to-day noise during the study period. The large amplitudes may reveal the different stages of a propagating structure. Meanwhile, the lead/lag correlation analysis showed that CR-PC2 tended to lead CR-PC1 by around 10–12 days with a maximum correlation of around −0.4 (Figure 3a). This significant lead/lag relationship implied the potential in drawing the characteristics of this important intraseasonal propagating activity. In the power spectrum analysis, the CR-PC pairs showed robust variance concentrated on the intraseasonal band of 30–80 days (Figure 3a,b). This suggested that the proposed index was very capable of determining the cloud variability on this specific time scale.
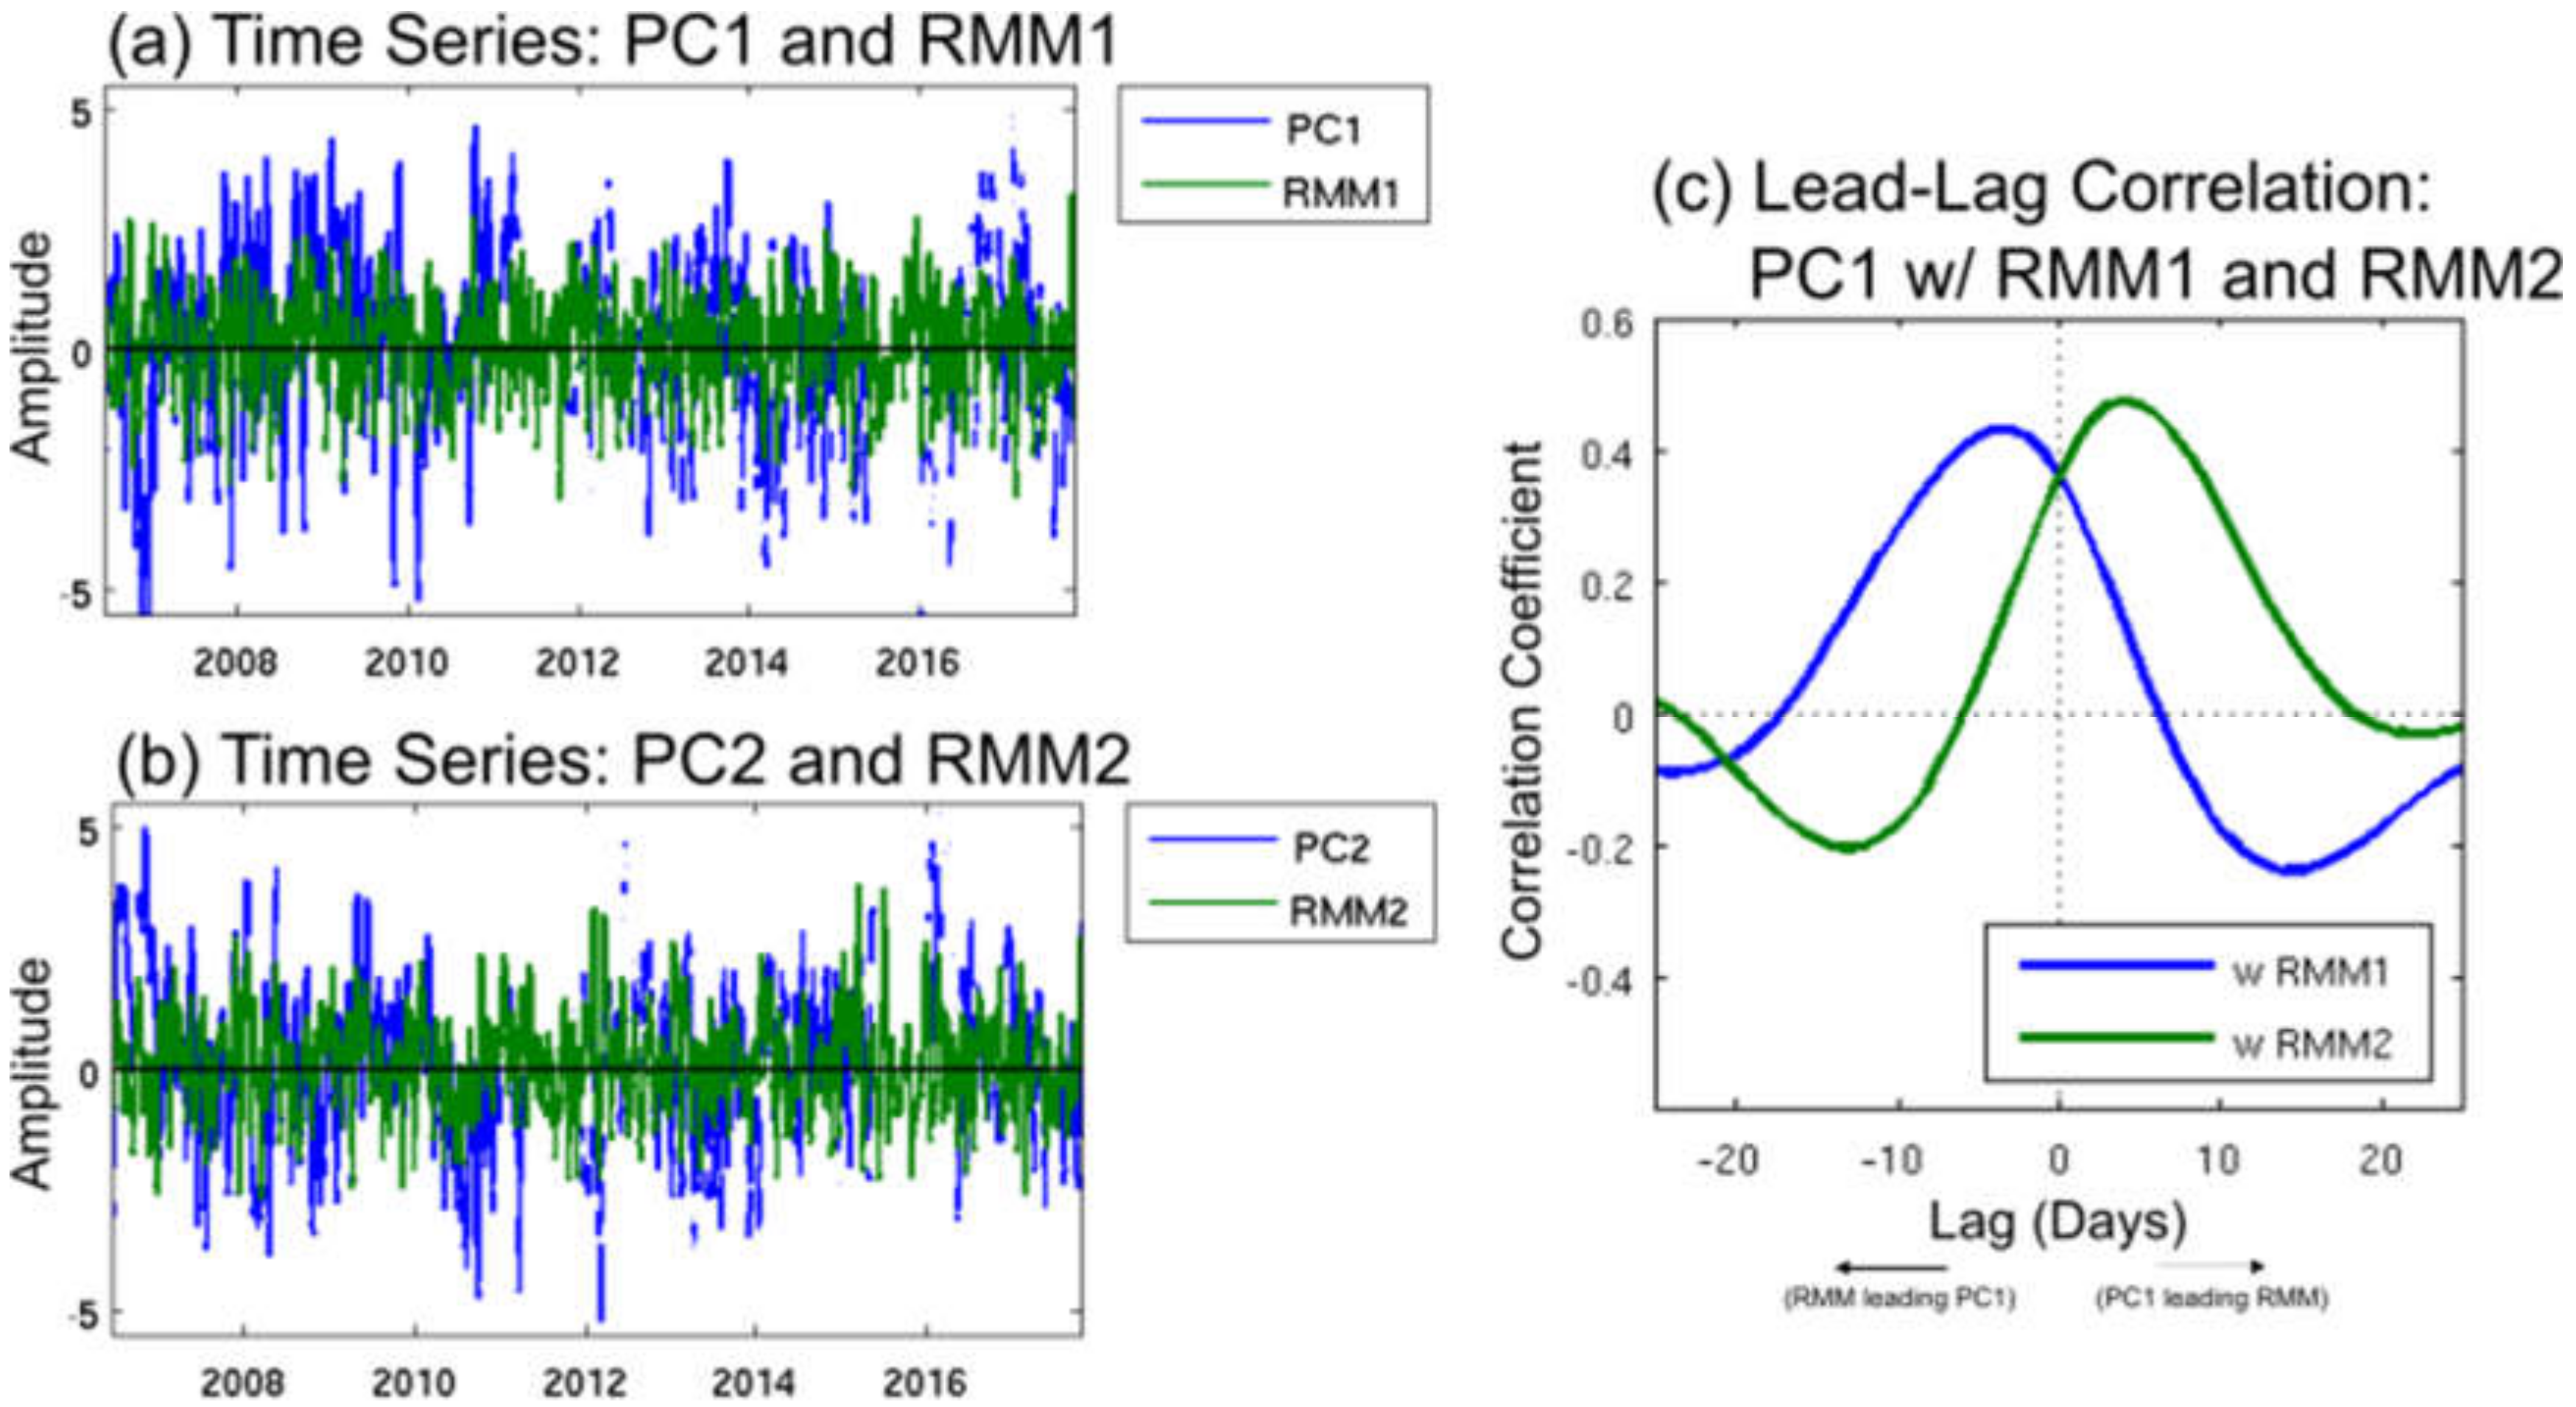
The relationship between CR-PCs and the RMM is further explored in Figure 4. The time series of the CR-PCs and the RMM are shown in Figure 4a,b. Both indices were generally in phase. Notice that the variability of CR-PCs (blue) seemed to be larger than that of the RMM. It was expected that CR-PCs should have more details of MJO-related cloud information since their derivation did not have any bandpass filter process. To further understand their relationship, the lead-lag correlation between these two indices was also calculated (Figure 4c). The results showed that CR-PC1 had a maximum correlation coefficient of around 0.4 with the RMM1 (i.e., the first PC in the multi-variate EOF analysis in the RMM index, also signifying enhanced convection over the MC) when CR-PC1 lagged the RMM1 by about two days (green line). As a similar relationship to CR-PC2, the RMM2 lead the CR-PC1 by about 10-12 days with a maximum correlation of about −0.2 (Figure 4c). This relationship implied that CR-PC2 was certainly in-phase with the RMM2.
3.2. Vertical Structures of Cloud, Environment, and Heating Associated with the Propagation of CRs
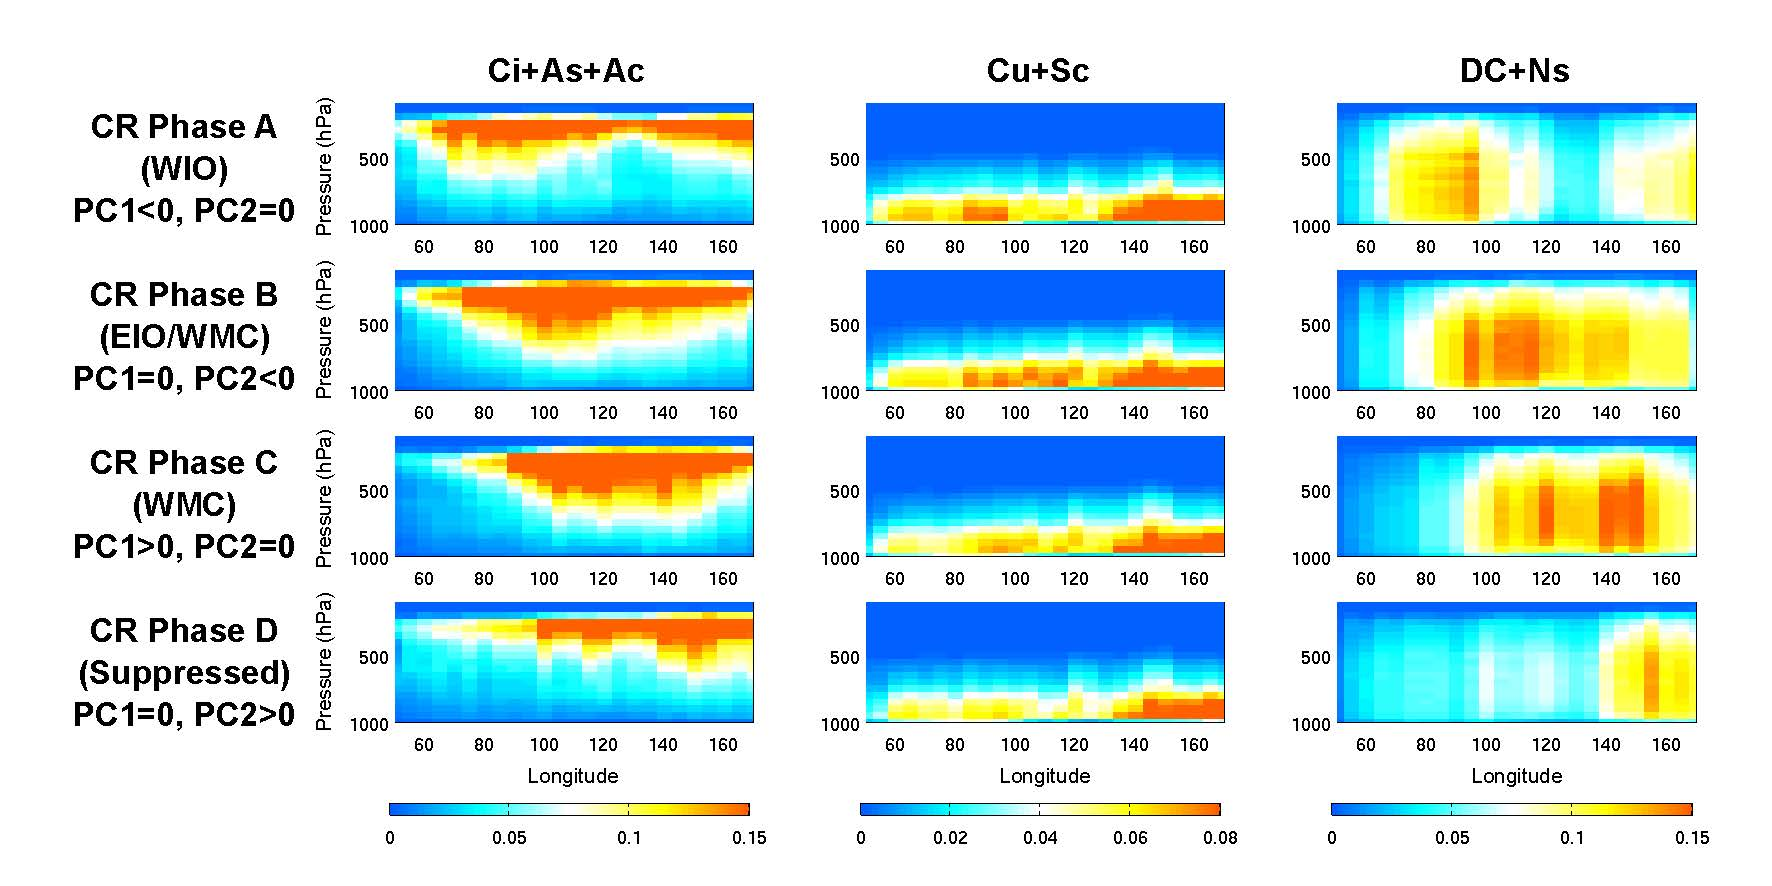
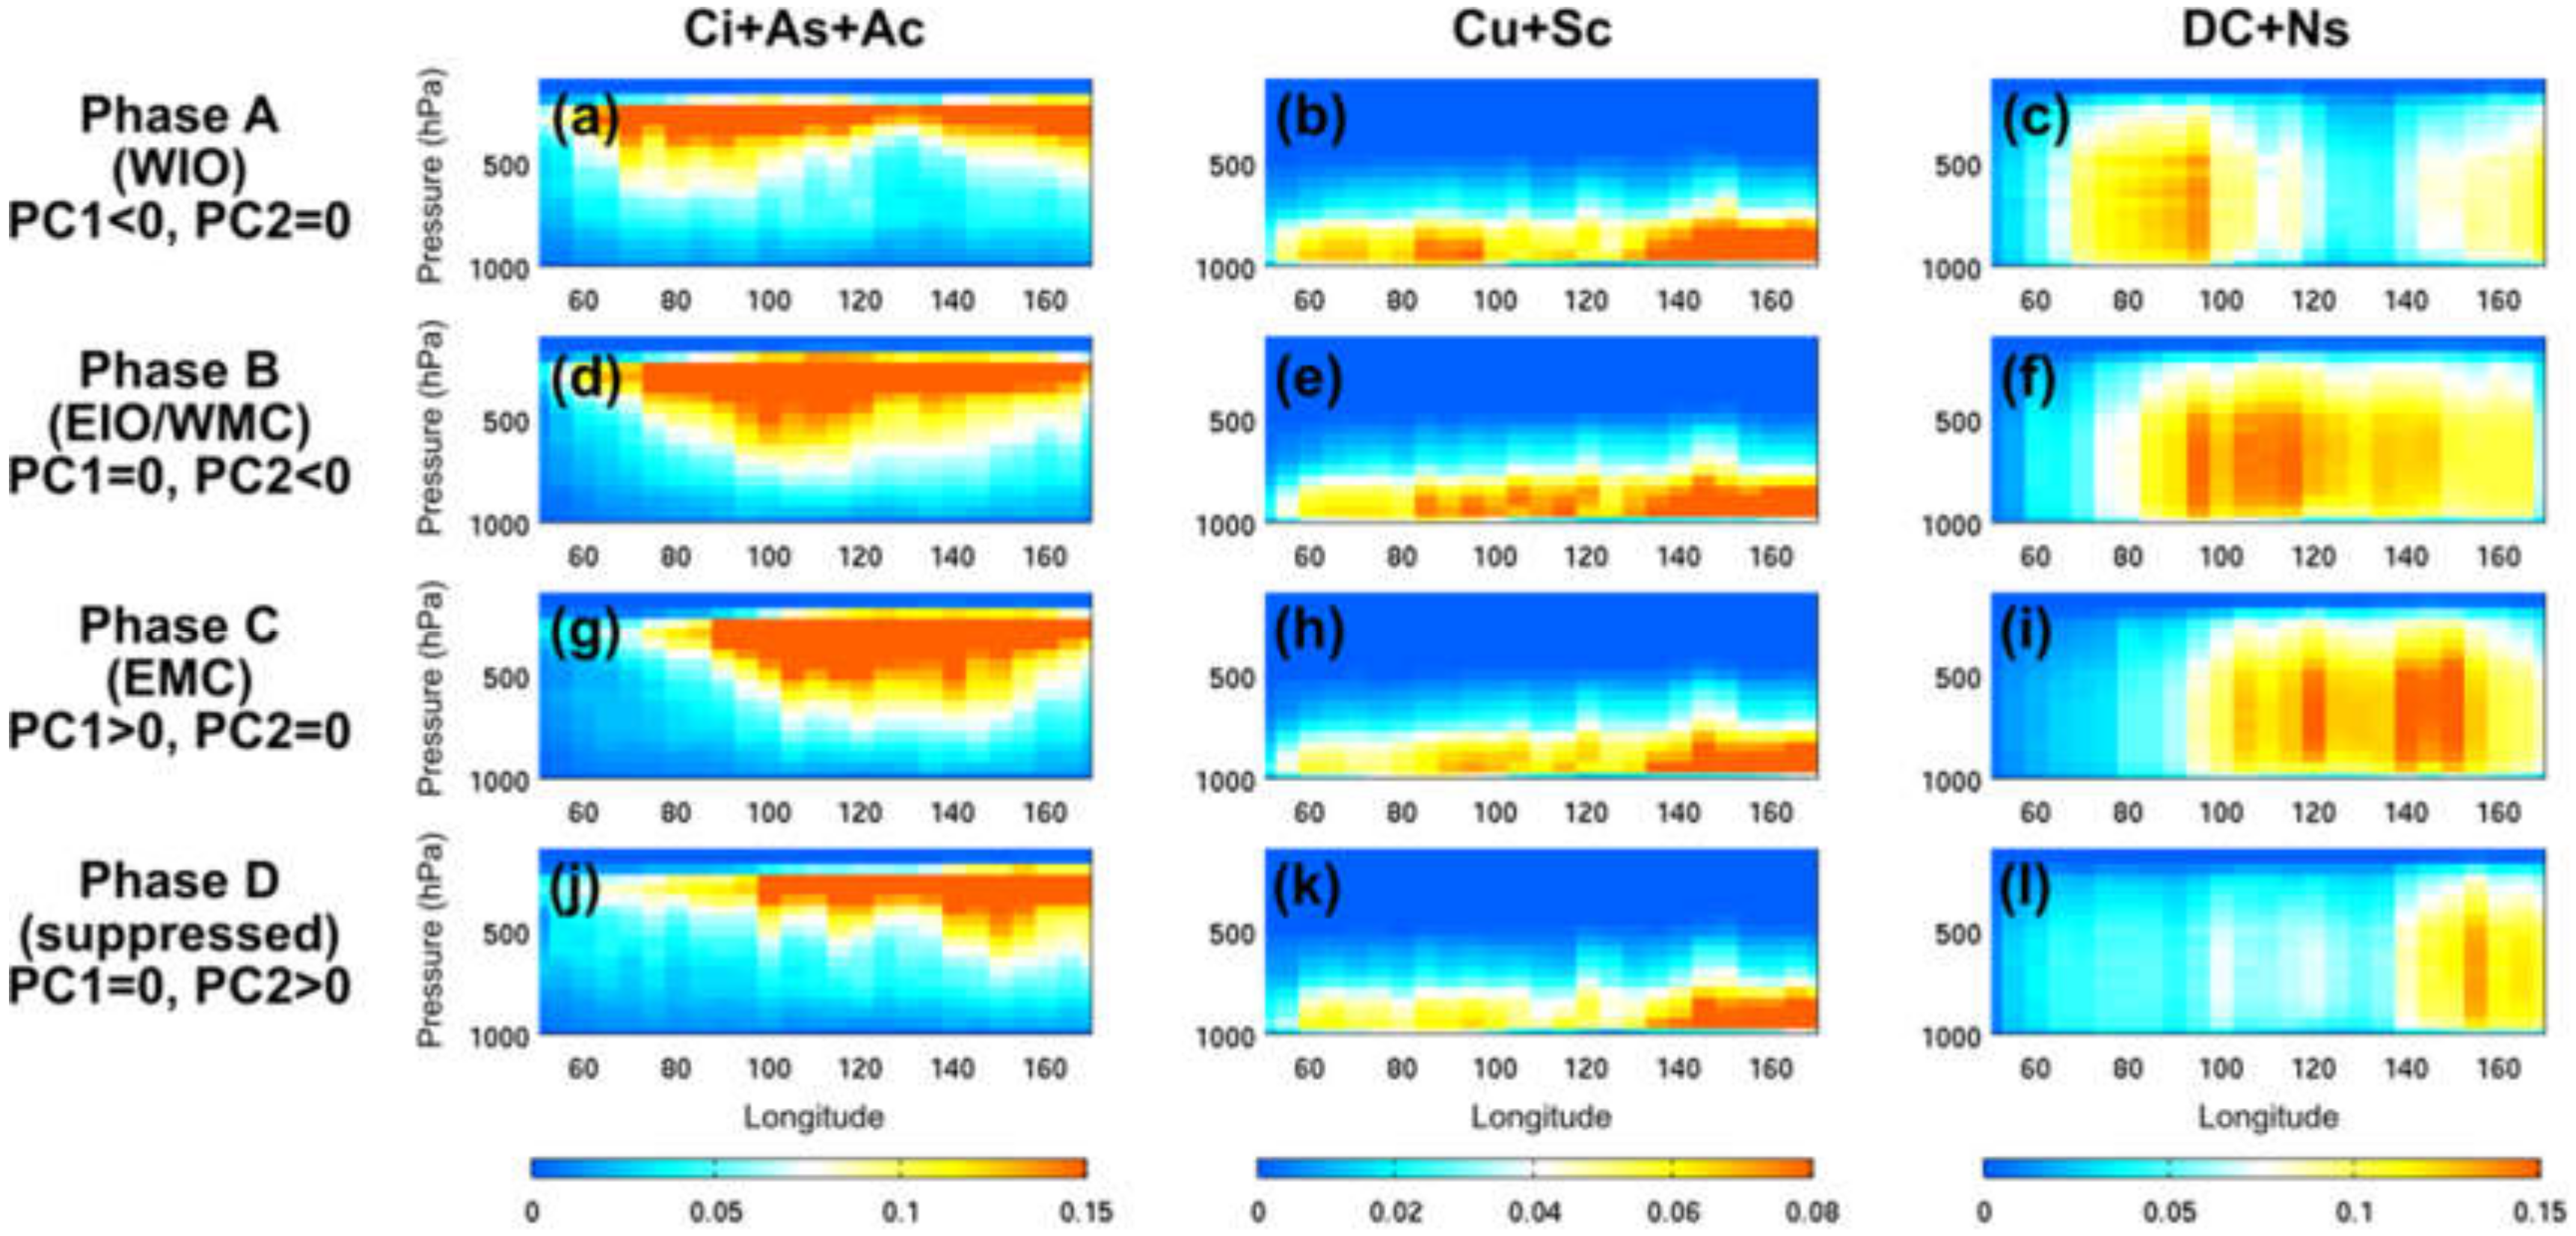
To understand how vertical cloud occurrences and the large-scale thermodynamics and dynamics vary with the MJO CR, the CloudSat cloud type and ERA5 reanalysis dataset was composited for different phases defined by the CR index from 2006 to 2017. Figure 5 shows the longitude-latitude cross-section of anomalous occurrence frequency for high and mid-level clouds (left), shallow clouds (middle), and deep clouds (right) over tropical oceans between 50°E and 170°E, averaged within 10°S–10°N. During CR Phase A, the moderate occurrence of mid-high clouds (Figure 5a) can be seen over the Central to Eastern Indian Ocean through the Western Pacific (70°E–150°E, Boxes 2–5 in Figure 1), while the Eastern MC and the Western Pacific (130°E–150°E, Box 5 in Figure 1) exhibit the significant enhancement of low clouds and suppression of high-mid and deep clouds. All cloud types reached maximum enhancement during Phase B over the tropical Central Indian Ocean, with a westward-tilting pattern (Figure 5d–f). This structure was maintained when the deep convection envelope propagated over the Eastern Indian Ocean (90°E–110°E, Box 3 in Figure 1) in Phase C (Figure 5g–i). The westward-tilting structure was less pronounced when deep convection shifted over the MC through Phase D (Figure 5j–l), while it was likely a result of the interactions between convection and the island topography or the multi-scale interactions between the MJO and the strong diurnal convection over this region. These results were consistent with previous studies [1,4,24,25]. Note that in the proposed analysis, the data were not treated with any bandpass filtering; only the annual cycle was removed and part of the high-frequency signals being smoothed out by the 14 day running average to remove the cloud modulation by synoptic systems. The combined EOF analysis indicated the dominance of the MJO signal in the cloud evolution pattern.
Figure 6 presents the longitude-latitude cross-section of anomalous specific humidity, the vertical velocity from the ERA5 reanalysis dataset, and the total diabatic heating anomaly derived from TRMM for each CR phase. During Phase A, the concentrated warm moist air with upwelling flow develops a convection system from 900–200 hPa over the Western Indian Ocean. In contrast, the dry subsiding flow takes place in the MC and the Western Pacific (Figure 6a–c). Led by moist ascending flow at the lower atmosphere, this westward-tilting type convention gradually moves into the MC when it heads to the second phase of its life cycle (Figure 6d–f). In the following phases, the convection with this westward-tilting structure propagates eastward from the MC to the Western Pacific (Figure 6g–i). The system keeps shifting further out of the region till the cold dry air with downwelling flow taking place in Phase D (Figure 6j–l).
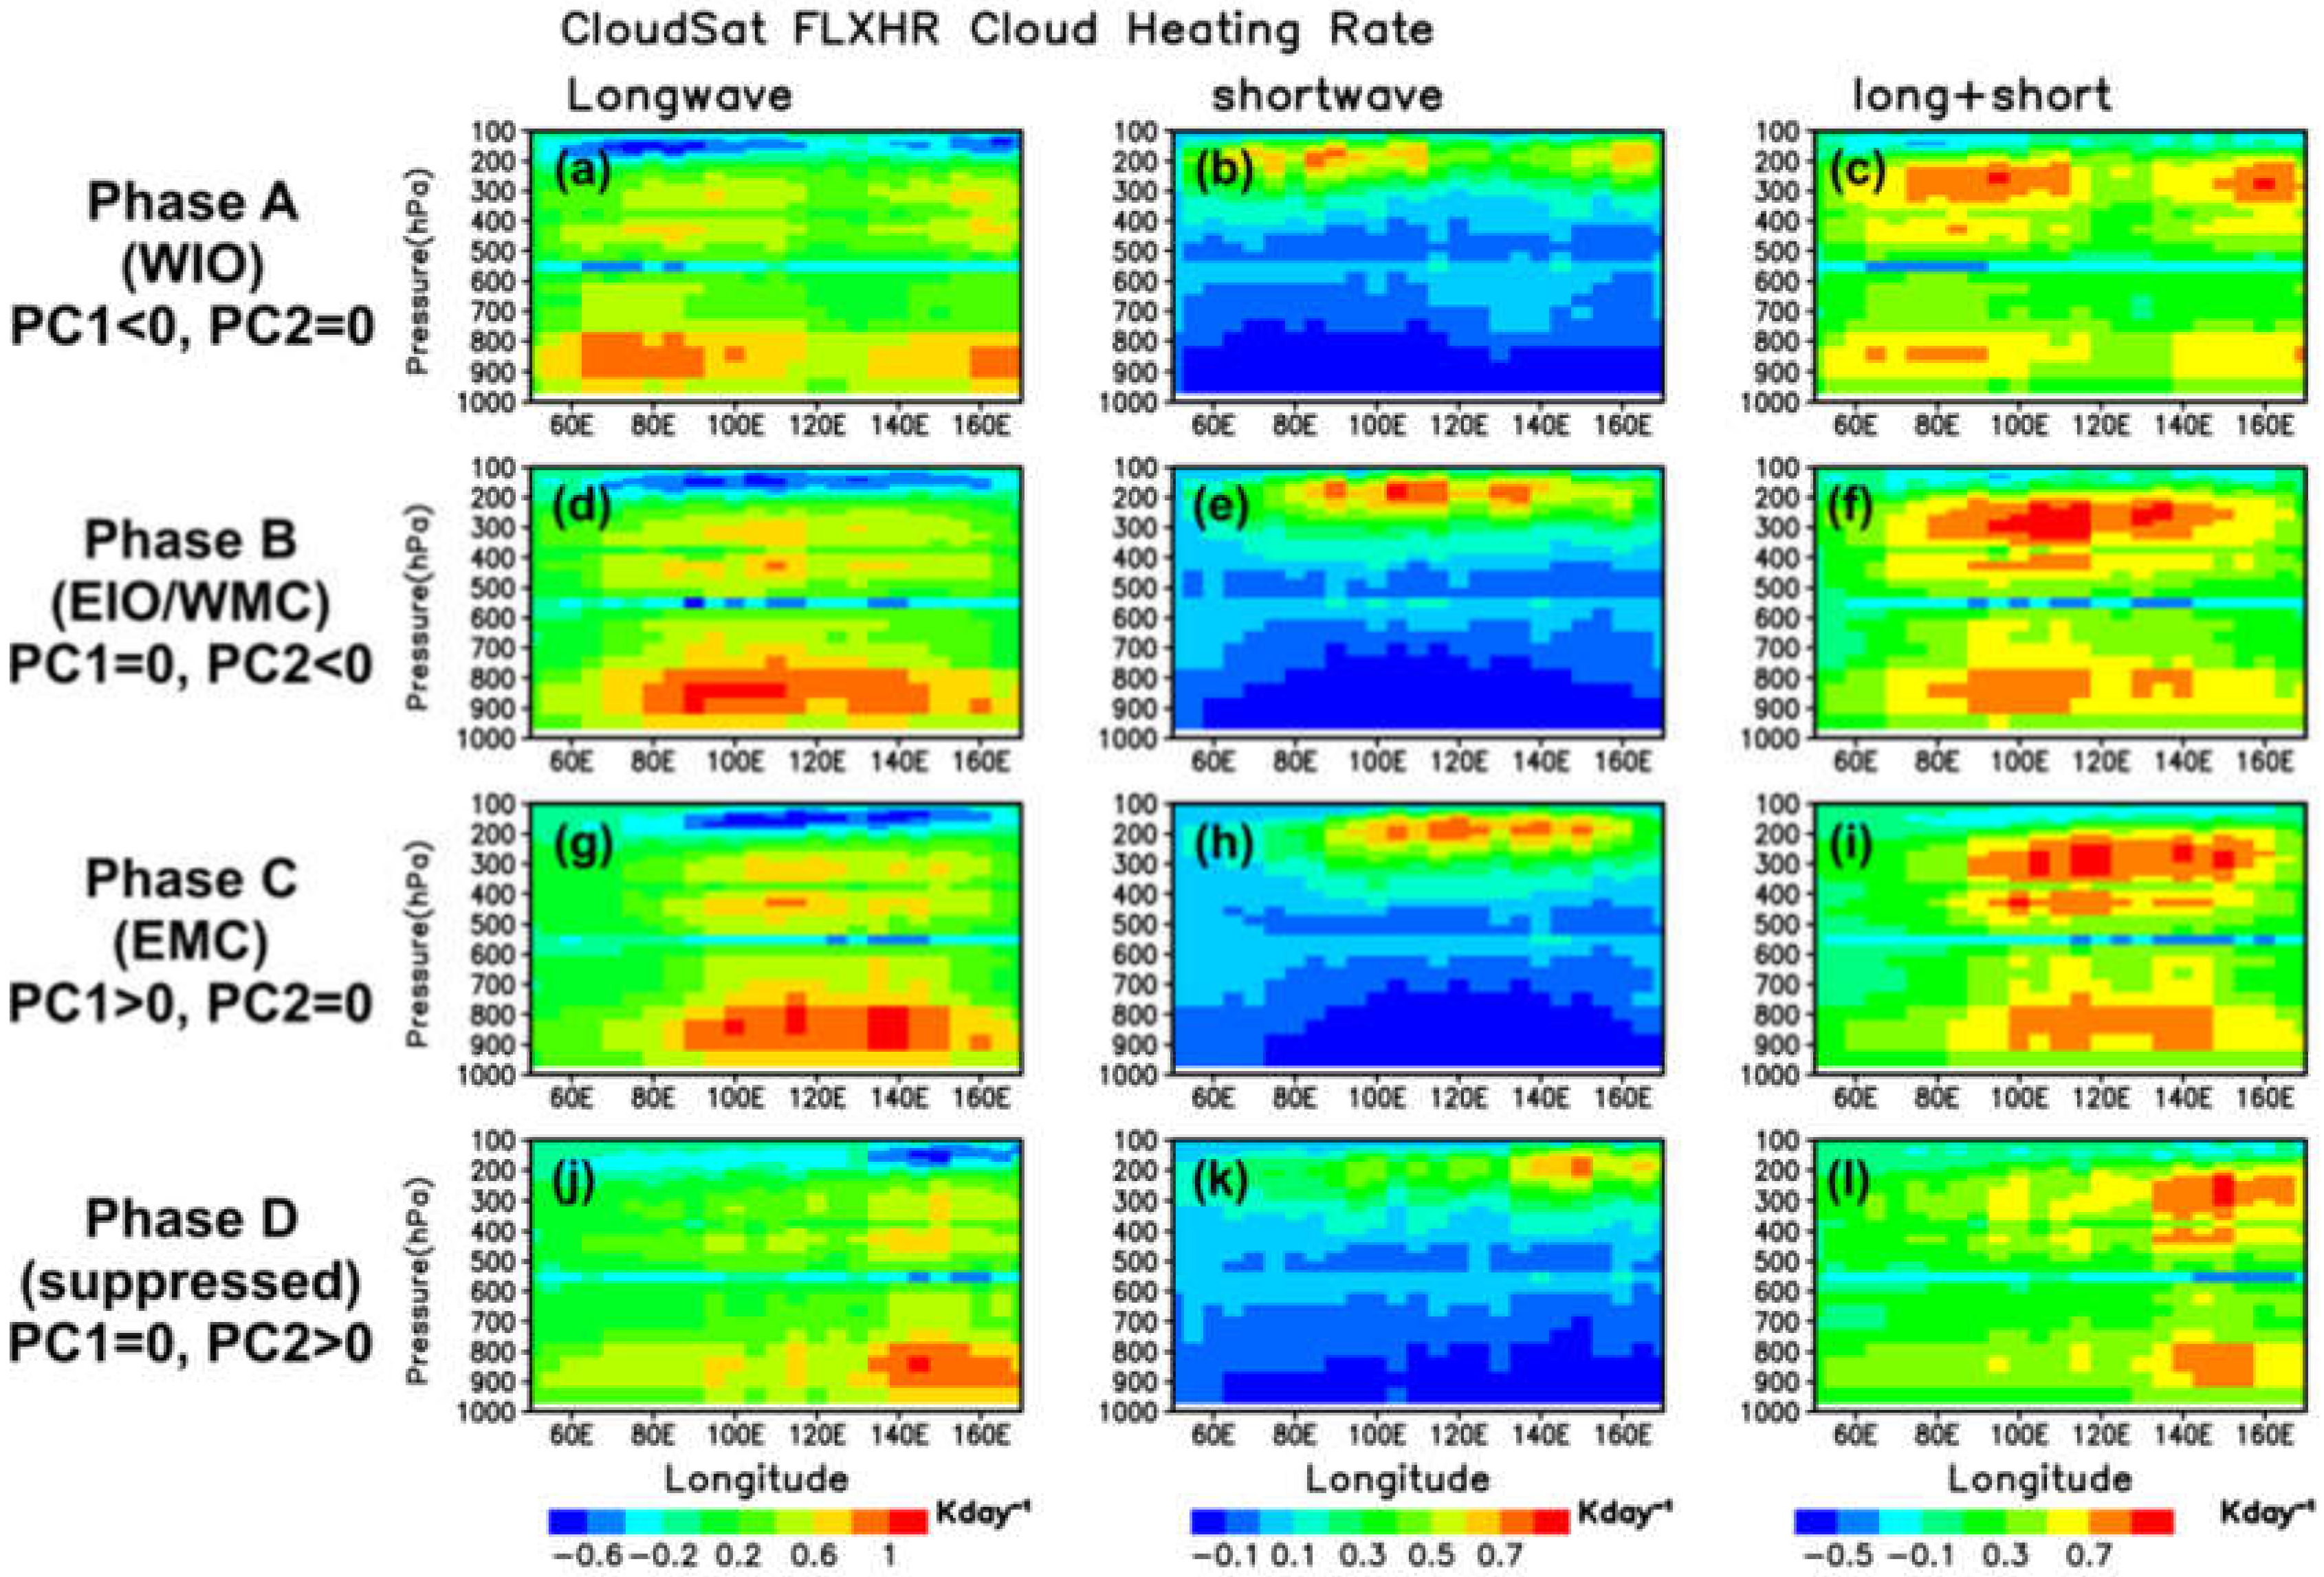
The composite mean profiles of the CRH rates from CloudSat retrievals are shown in Figure 7. The LW and SW CRH generally propagate towards the east in conjunction with the eastward activity of MJO-scale convection. During Phase A (Figure 7a), the LW CRH over the Western to the Central Indian Ocean has a heating (positive) maximum in the lower atmosphere (900–850 hPa), while a cooling (negative) peak is located at the top of the troposphere (200–100 hPa). This LH heating profile is associated with moistened column and enhanced shallow and deep clouds (Figure 5b and Figure 6b) [1,25,28]. The SW CRH anomaly is smaller in magnitude and mostly opposite in sign to the LW anomaly at the same time (Figure 7b). This upper-layer SW warming is associated with cirrus clouds (Figure 5a), consistent with previous studies over the tropics [25,55]. At the lower levels, the SW cloud radiative cooling effect is considered as an important contribution during MJO development [30,36,56]. In Phase B, both LW and SW CRH structures (Figure 7c,d) are amplified while propagating to the Eastern Indian Ocean/Western Pacific region, with the LW and SW heating dominating the bottom and top of the troposphere, respectively. This coupled heating structure strengthens deep cloud development and matures the convection over the Eastern Indian Ocean and MC during the MJO active phases (Figure 7c–f). In Phase D, the CRH moves with the convection center into the Western Pacific. Both the LW and SW CRH over the Indian Ocean and MC are decreased after the convection passes though (Figure 7g,h), associated with the lack of cloudiness in the suppressed and the more stabilized environment behind MJO rainfall (Figure 6j,k); only a moderate SW heating at the top of the troposphere reflects the anvil type cloud left by the deep convection. Overall, the cloud-radiative analysis reveals that the LW and SW anomalies are bottom-heavy and top-heavy structures during the MJO lifecycle, respectively. The interactions of these stratiform-like heating and cooling effects are consistent with the MJO features including the eastward propagation, as well as the westward-tilted structure of the vertical dynamic and thermodynamic fields. These features were consistent with those documented in the previous studies as well [25,33,34,36,57].
3.3. Case Study of a Strong MJO Event in 2009
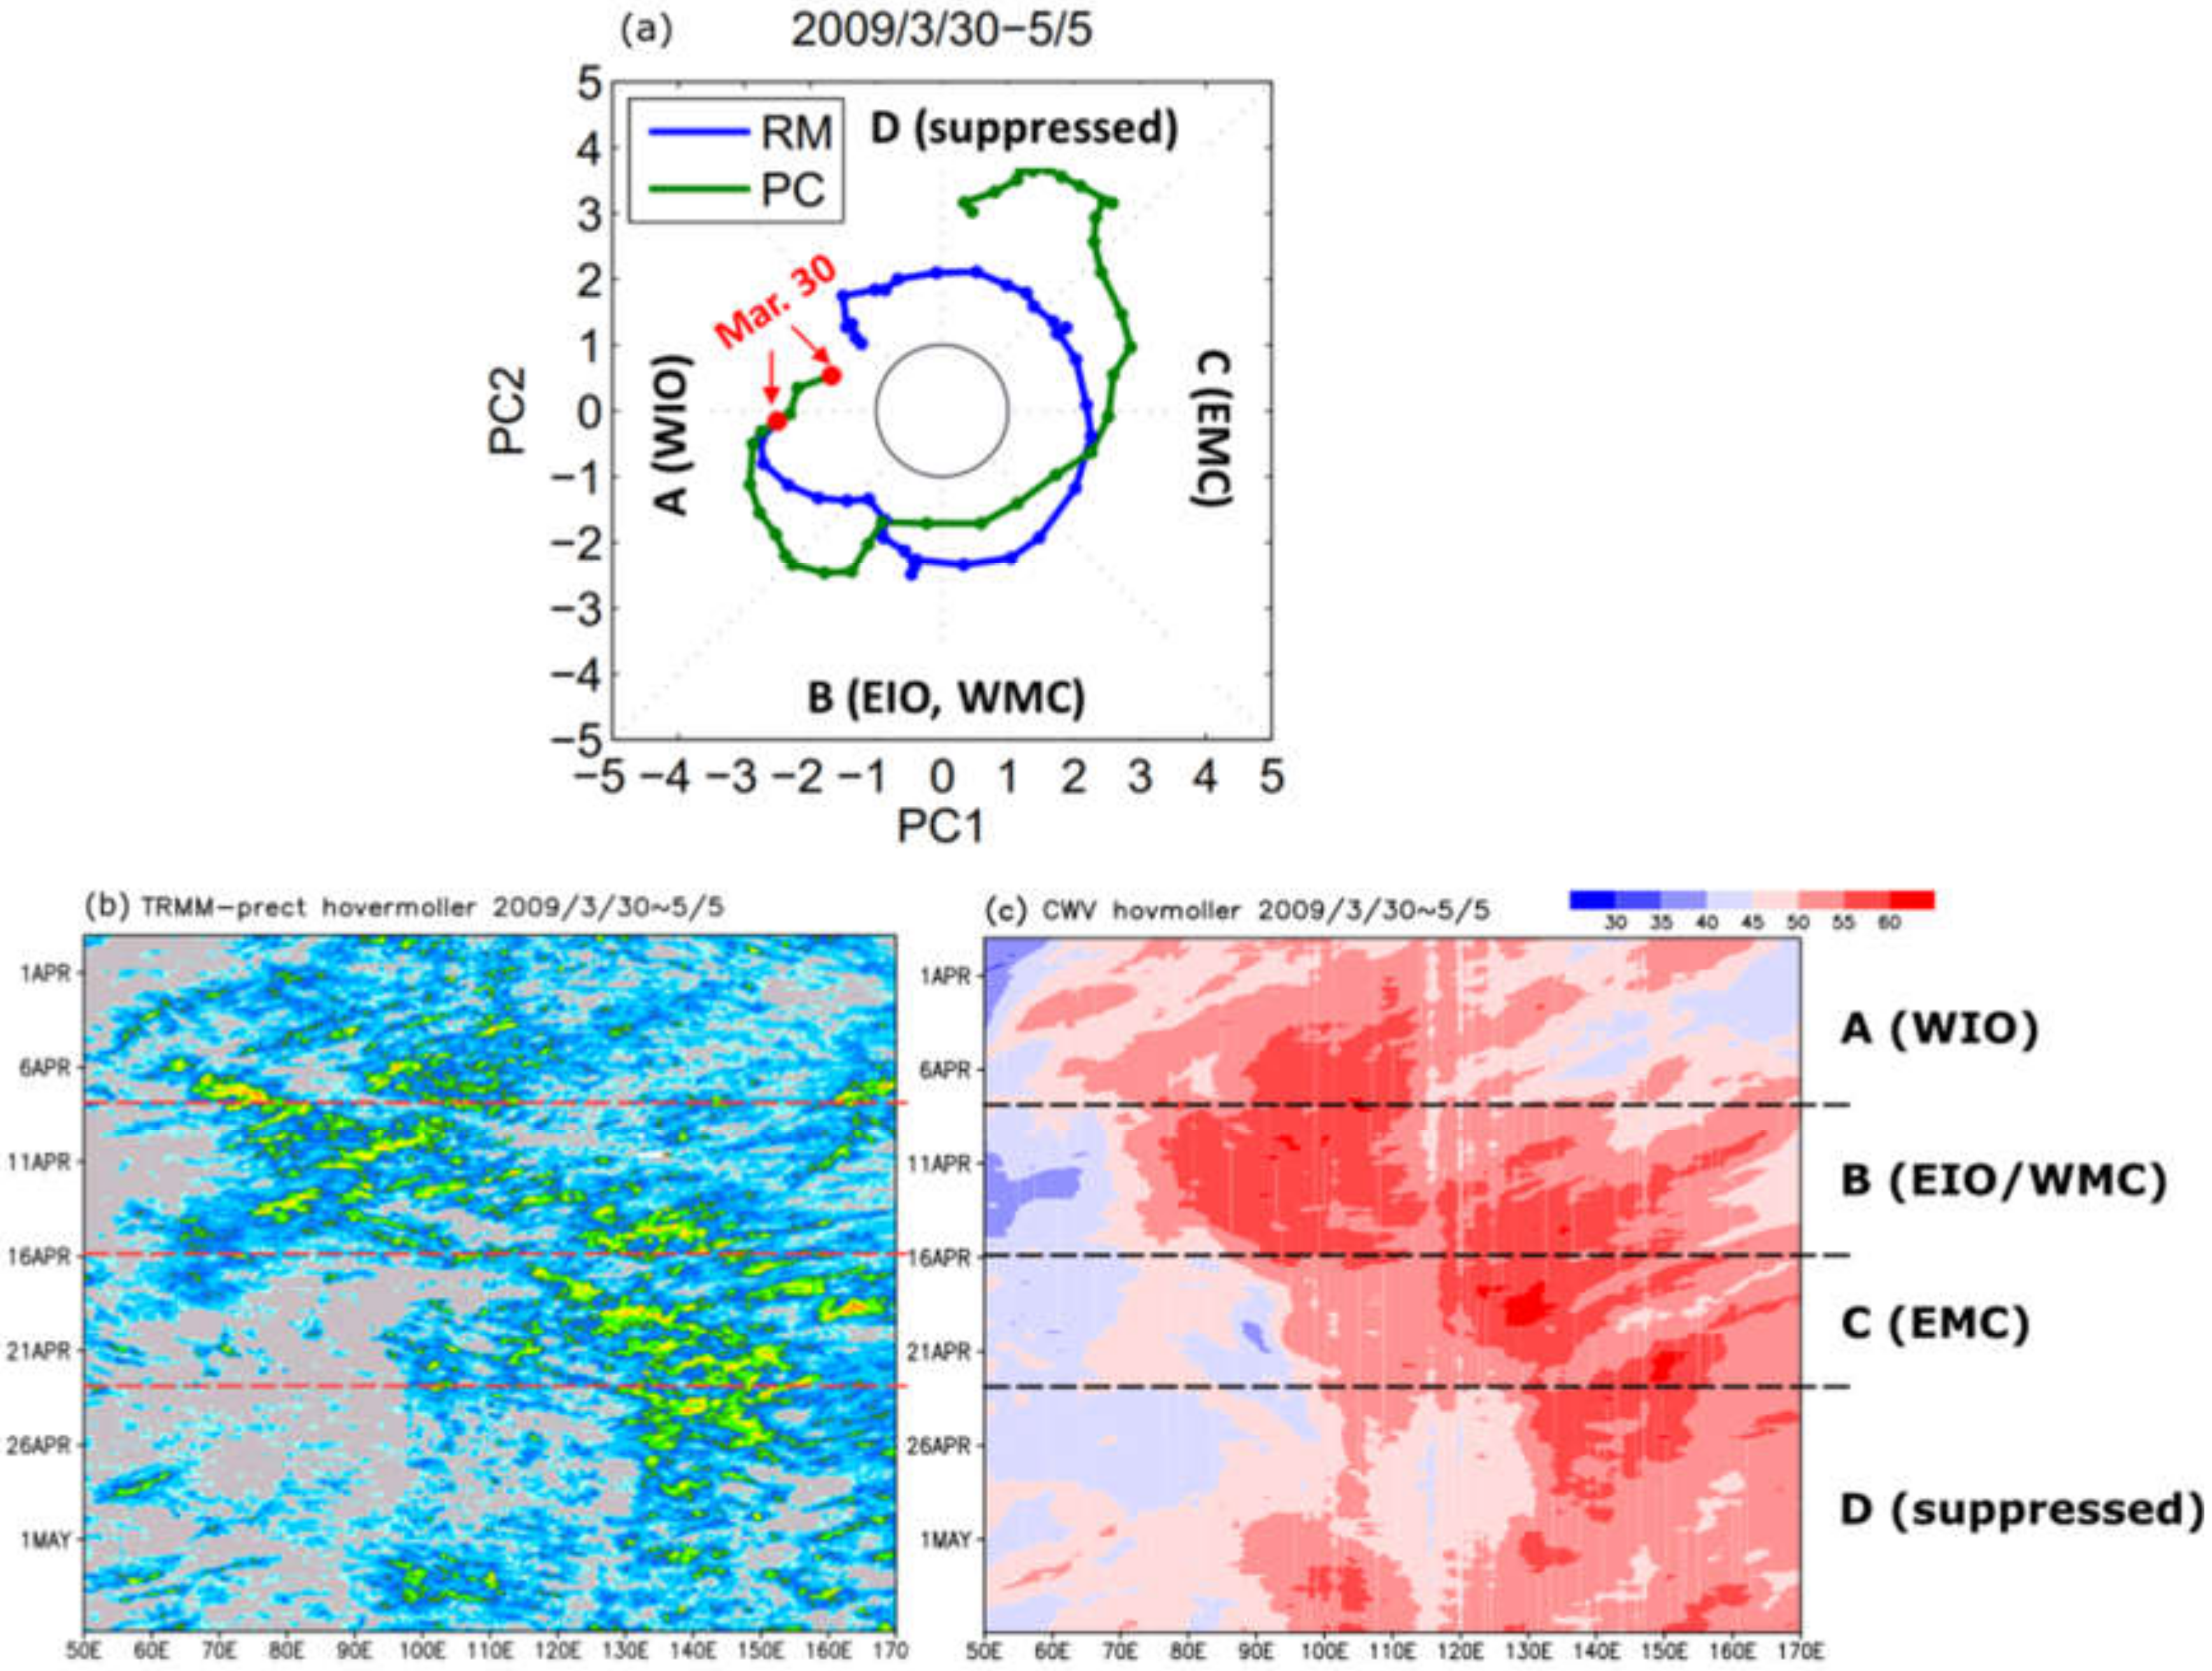
The newly developed CR index, similarly to the RMM index, traces the propagation of the MJO signal. To facilitate this concept visually, a strong propagating type MJO event exhibited from March 13th to May 5th in 2009 was selected by using the proposed index to determine its associated CRs in convective and suppressed stages when it passed through the studied domain (i.e., Boxes 1–5 shown in Figure 1). Figure 8a shows the MJO trajectory on the phase diagram defined by leading the PC pair of the RMM/CR index. The intensity of MJO variance is represented by the distance from the origin, as the central circle signifies the threshold between weak (inside) and strong (outside) MJO activity. The four-phase space and the corresponding geographical regions are labeled to show the approximate locations of the enhanced convective signal (e.g., Phases A and B for convection over the Indian Ocean region). Trajectories show the MJO evolution characterized by the CR index (green) and the RMM index (blue), starting at the red dots. The propagating speed and the intensity in each phase characterized by the two indices are similar, but not identical, indicating that the CR index can successfully track the MJO signal while highlighting different aspects of the convective activities. The evolutions of equatorial (10°S–10°N) precipitation and column-integrated water vapor (CWV) anomalies, in this case, are shown in Figure 8b,c. Although the enhanced convection started in early April 2009, the CR index was able to capture the rainfall initiation at the end of March. During Phase B, the intense rainfall associated with abundant CWV propagates eastwardly through the Indian Ocean and reaches the MC. In mid-April, the mature convective system continually moves forward to the Pacific (140°E–150°E) in May during Phases C and D. This zonal scale evolution is consistent with the MJO trajectory shown in Figure 8a, indicating that the CR index is certainly a capable approach to resolve the MJO lifecycle, especially in MJO-related rainfall and the further propagation activity.
Figure 9 illustrates the evolutions of daily mean vertical cloud fraction, precipitation, and CWV during the strong MJO case of March 30th to May 5th 2009 over the tropical Central Indian Ocean (5°S–5°N, 75°E–85°E; Box 2 in Figure 1). During the initiation phase (CR Phase A), the Indian Ocean is mainly dominated by mid- to high-level clouds, corresponding to the moderate precipitation associated with the positive CWV trend initializing this MJO event. As advanced to the active Phase B, the deep and convective clouds associated with heavy rainfall (~18 mm day−1) and maximum CWV in the air (~55 mm) take control of the Eastern Indian Ocean and Western MC (Figure 9b,c). During Phase C, the Indian Ocean is mainly taken over by the subsidence motion and the anvil-type high cloud on the top. Meanwhile, the decreases in precipitation and water vapor reveal the dissipation of convection. The suppressed Phase D generally takes place with shallow clouds in the mid to low troposphere. The atmosphere is drier, but slight moistening and weak precipitation are near the surface.
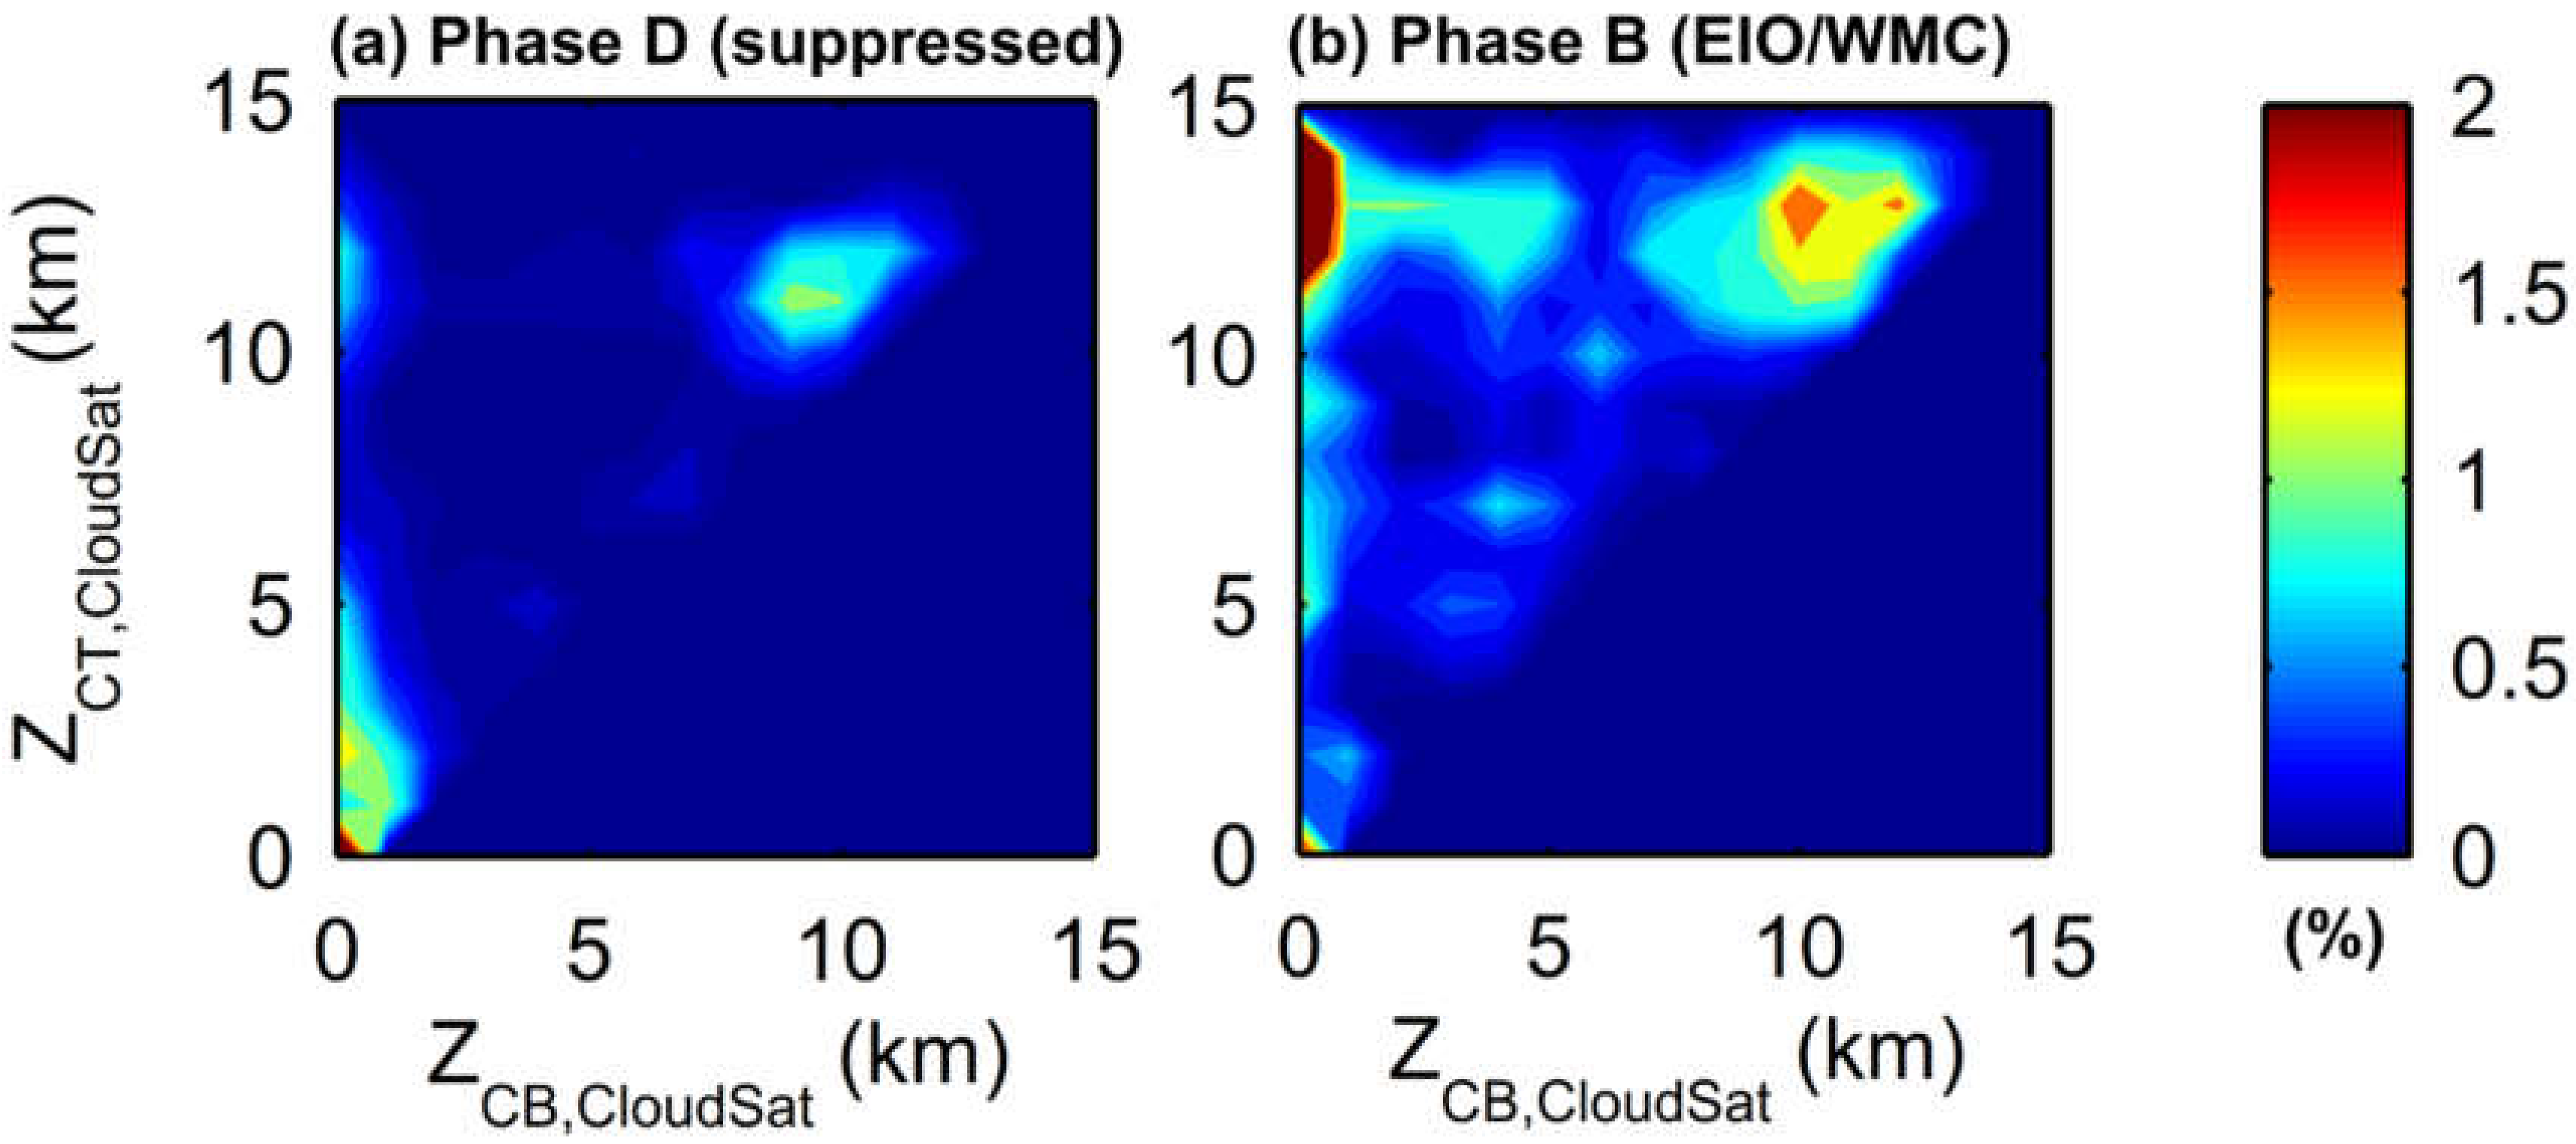
Figure 10 presents the joint probability distribution functions (PDFs) of the cloud bottom and cloud top height detected by CloudSat during the MJO case presented in Figure 9. The majority of the clouds in the suppressed phase are found in the first 5 km of the atmosphere (Figure 10a), corresponding to the shallow-type cloud and moisture in the lower troposphere after April 22nd. There is a minor occurrence of a thin high cloud layer at about a 10 km height, consistent with the climatology shown in Figure 6, and the overall cloud radiative effects are dominated by the SW cooling of the low cloud according to Figure 7. In the active Phase B (Figure 10b), the PDF shows three distinct modes: the well-developed deep convection (cloud bottom < 3 km and cloud top > 10 km), the thick anvil cloud (cloud bottom ~ 5 km and cloud top ~ 12 km), and the high cloud layer (cloud bottom ~ 10 km and cloud top ~ 12 km). This structure is consistent with both the results shown in Figure 5 and the previous studies [1,4,25,57]. The evidence supports that the CR index can detail the essential information of cloud characteristics and its vertical evolution during the entire MJO lifecycle. More importantly, it creates a direct view to inspect the role of CRH in different MJO phases and to improve the understanding of its linkage to environmental moisture and circulation.
4. Discussion
With a relatively simple and efficient way to remove interannual variability and extract the MJO signal from the large-scale environment, the RMM index has been widely applied to the MJO real-time monitoring and forecasting, as well as to study the physical mechanisms in the community. To determine and represent definite relationships with the weather effects related to this important tropical variability, the MJO definition of the RMM is based on the use of EOFs of combined OLR, u850, and u200, which emphasize the signal associated with mature deep convection and the involved large-scale vertical circulation cells. Based on this index, the uniform diagnostic and sets of skill metrics have been promoted and implemented in the real-time forecast [40,57,58] and multi-model skill evaluation [31,59,60]. The most improved understandings are its multiscale structure, large-scale vertical structure, and air-sea interaction [61]. Although it is currently a popular method, the RMM index still has considered that OLR might contribute less information than zonal wind fields to the projected MJO activity [41,57,62]. This weakness implies that the RMM mainly reflects the circulation features more than the convective structure and associated cloud-radiative processes. It thus introduces the uncertainty to determine a realistic MJO-related convection and increase the impact on the prediction during the initiation and evolution [62].
On the other hand, several variables associated with MJO initiation and propagation, including moisture convergence, vertical cloud structure, radiative heating, and the relationships between radiation, cloud, and convection in terms of cloud-radiative interaction have recently found important roles in driving the MJO phase transition [1,4,10,24,25,35,63]. By using the direct observations of the vertical cloud structure, these studies can depict a progression of cloud types through the entire MJO lifecycle. With varying cloud profiles, the details of cloud physics in terms of radiative heating, cloud-water enhancement, and related moist physics have proven that cloud plays a crucial role in the atmospheric radiative transfer processes during the active and suppressed phases of the MJO. Different from the RMM index, the presented CR index provides another point of view by directly using cloud spatial and temporal characteristics to define this important tropical convection. As shown above, the CR index captures the profile of the cloud radiative effects and the feedback interacting with the convective precipitation during each phase of the MJO lifecycle. This is particularly helpful to improve the understandings of the cloud and its specific role in the stages of initiation and propagation.
This study is the first attempt to establish an intraseasonal index from a vertical cloud structure consisting of multiple cloud types. The domain for deriving the current CR was chosen at the equatorial region between the Indian Ocean to the Western Pacific to capture the major signal of the boreal winter intraseasonal variability (i.e., MJO). In the future, a similar index can be derived by computing cloud frequency time series extended to the extratropics in the Northern Hemisphere to describe northeastward propagating BSISO. Furthermore, the current CR index is based on the CloudSat-only 2B-CLDCLASS product, as it provides a temporally more continuous cloud classification observation. As the CPR mainly detects cloud particles and small precipitating hydrometeors, thin cirrus and the bottom of thick precipitating clouds will be missing/attenuated in the cloud structures reported in this study. The cloud classification from joint CALIPSO-CloudSat-MODIS retrievals (2B-CLDCLASS-Lidar [64]) has improved the detection of thin cirrus, mixed-phase clouds, and very shallow clouds owing to the sensitivity of the lidar measurements. There are, however, more data gaps in this product due to the collocation requirement of multiple sensors that may impose difficulties in deriving the long-term descriptive index. In the future, the cloud distribution from the joint retrievals can be composited for the CR phases using the current index, to understand the contribution of optically thin clouds and mixed-phase clouds to the diabatic heating structure.
5. Conclusions
The evolution of tropical vertical cloud regimes at an intraseasonal time scale is investigated using the decade-long CloudSat observations. The objective CR index was derived from the leading pair of the multivariate EOF of the daily frequency anomalies of deep, high, and shallow clouds from the 11 year CloudSat cloud classification data. The composite analyses and case studies show that the CR index characterizes the coherent modulation of cloud occurrence and large-scale thermodynamics and dynamics conditions from the tropical Indian Ocean to MC and the Western Pacific warm pool. For each MJO cloud phase, the vertical structures of cloud-radiative forcing, moisture, diabatic heating, and circulation are examined. The proposed CR index, indeed, highlights the importance of cloud statistics given the large-scale moisture distribution, which provides guidelines for evaluating the bias in climate models. The cloud statistics picked up by the CR index are sensitive to environmental moisture. For example, the congestus clouds developing during the suppressed phase over the MC comprise the key signal for the MJO initiation. In the future, process-oriented diagnoses can be conducted to evaluate the model skill in terms of suitable cloud statistics given the environmental moisture, which can benefit the MJO simulation and prediction.
Author Contributions
Conceptualization, W.-T.C.; methodology, W.-T.C., M.-P.H., and C.-M.W.; software, P.-J.C. and P.-N.F.; validation, W.-T.C.; formal analysis, W.-T.C., P.-J.C., and P.-N.F.; investigation, W.-T.C. and M.-P.H.; resources, C.-M.W.; data curation, P.-J.C. and P.-N.F.; writing, original draft preparation, M.-P.H. and W.-T.C.; writing, review and editing, M.-P.H and W.-T.C.; visualization, W.-T.C. and P.-J.C.; supervision, M.-P.H., W.-T.C., and C.-M.W.; project administration, W.-T.C., M.-P.H., and C.-M.W.; funding acquisition, W.-T.C., M.-P.H., and C.-M.W. All authors read and agreed to the published version of the manuscript.
Funding
This research was funded by Taiwan’s Ministry of Science and Technology (MOST) Grants MOST 106-2111-M-034-007 to Chinese Culture University (M.H.) and MOST 108-2111-M-002-004 and MOST 107-2111-M-002-010-MY4 to National Taiwan University (W.C., C.W., and P.F.), and Central Weather Bureau Project #1082268A 09BZA20003 to National Taiwan University (W.C. and P.C.)
Acknowledgments
The authors would like to thank the following institutes for producing and hosting the repositories of the datasets analyzed in this study: Cooperative Institute for Research in the Atmosphere, CSU (CloudSat 2B-CLDCLASS and 2B-FLXHR, http://www.cloudsat.cira.colostate.edu/order-data), Earth Observation Research Center, JAXA (TRMM-SLH, https://www.eorc.jaxa.jp/TRMM/lh/l2lh_grid_e.html), ECMWF (ERA5, https://www.ecmwf.int/en/forecasts/datasets/reanalysis-datasets/era5), Goddard Space Flight Center, NASA (TRMM 3B42, https://disc.gsfc.nasa.gov/datasets?keywords=TMPA&page=1), and NOAA (NOAA OLR, https://psl.noaa.gov/data/gridded/data.interp_OLR.html).
Conflicts of Interest
The authors declare no conflict of interest.
References
- Ciesielski, P.E.; Johnson, R.H.; Jiang, X.; Zhang, Y.; Xie, S. Relationships between radiation, clouds, and convection during DYNAMO. J. Geophys. Res. Atmos. 2017, 122, 2529–2548. [Google Scholar] [CrossRef]
- Chen, T.; Rossow, W.B.; Zhang, Y. Radiative Effects of Cloud-Type Variations. J. Clim. 2000, 13, 264–286. [Google Scholar] [CrossRef]
- Del Genio, A.D.; Kovari, W. Climatic Properties of Tropical Precipitating Convection under Varying Environmental Conditions. J. Clim. 2002, 15, 2597–2615. [Google Scholar] [CrossRef] [Green Version]
- Del Genio, A.D.; Chen, Y.; Kim, D.; Yao, M.-S. The MJO Transition from Shallow to Deep Convection in CloudSat/CALIPSO Data and GISS GCM Simulations. J. Clim. 2012, 25, 3755–3770. [Google Scholar] [CrossRef]
- Hartmann, D.L.; Doelling, D. On the net radiative effectiveness of clouds. J. Geophys. Res. Atmos. 1991, 96, 869–891. [Google Scholar] [CrossRef]
- Hartmann, D.L.; Ockert-Bell, M.E.; Michelsen, M.L. The Effect of Cloud Type on Earth’s Energy Balance: Global Analysis. J. Clim. 1992, 5, 1281–1304. [Google Scholar] [CrossRef] [Green Version]
- Hartmann, D.L.; Short, D.A. On the Use of Earth Radiation Budget Statistics for Studies of Clouds and Climate. J. Atmos. Sci. 1980, 37, 1233–1250. [Google Scholar] [CrossRef] [Green Version]
- Kiehl, J.T. On the Observed Near Cancellation between Longwave and Shortwave Cloud Forcing in Tropical Regions. J. Clim. 1994, 7, 559–565. [Google Scholar] [CrossRef] [Green Version]
- Randall, D.A.; Tjemkes, S. Clouds, the earth’s radiation budget, and the hydrologic cycle. Glob. Planet. Chang. 1991, 4, 3–9. [Google Scholar] [CrossRef]
- Stein, T.H.M.; Holloway, C.E.; Tobin, I.; Bony, S. Observed Relationships between Cloud Vertical Structure and Convective Aggregation over Tropical Ocean. J. Clim. 2016, 30, 2187–2207. [Google Scholar] [CrossRef]
- Stephens, G.L.; Campbell, G.G.; Haar, T.H.V. Earth radiation budgets. J. Geophys. Res. Oceans 1981, 86, 9739–9760. [Google Scholar] [CrossRef]
- Stephens, G.L. Cloud Feedbacks in the Climate System: A Critical Review. J. Clim. 2005, 18, 237–273. [Google Scholar] [CrossRef] [Green Version]
- Mapes, B.; Tulich, S.; Lin, J.; Zuidema, P. The mesoscale convection life cycle: Building block or prototype for large-scale tropical waves? Dyn. Atmos. Oceans 2006, 42, 3–29. [Google Scholar] [CrossRef]
- Rossow, W.B.; Schiffer, R.A. Advances in Understanding Clouds from ISCCP. Bull. Am. Meteorol. Soc. 1999, 80, 2261–2288. [Google Scholar] [CrossRef] [Green Version]
- Jakob, C.; Tselioudis, G. Objective identification of cloud regimes in the Tropical Western Pacific. Geophys. Res. Lett. 2003, 30. [Google Scholar] [CrossRef] [Green Version]
- Rossow, W.B.; Tselioudis, G.; Polak, A.; Jakob, C. Tropical climate described as a distribution of weather states indicated by distinct mesoscale cloud property mixtures. Geophys. Res. Lett. 2005, 32. [Google Scholar] [CrossRef] [Green Version]
- Tan, J.; Jakob, C.; Lane, T.P. On the Identification of the Large-Scale Properties of Tropical Convection Using Cloud Regimes. J. Clim. 2013, 26, 6618–6632. [Google Scholar] [CrossRef]
- Klein, S.A.; Zhang, Y.; Zelinka, M.D.; Pincus, R.; Boyle, J.; Gleckler, P.J. Are climate model simulations of clouds improving? An evaluation using the ISCCP simulator. J. Geophys. Res. Atmos. 2013, 118, 1329–1342. [Google Scholar] [CrossRef]
- Pincus, R.; Batstone, C.P.; Hofmann, R.J.P.; Taylor, K.E.; Glecker, P.J. Evaluating the present-day simulation of clouds, precipitation, and radiation in climate models. J. Geophys. Res. Atmos. 2008, 113. [Google Scholar] [CrossRef]
- Lauer, A.; Hamilton, K. Simulating Clouds with Global Climate Models: A Comparison of CMIP5 Results with CMIP3 and Satellite Data. J. Clim. 2013, 26, 3823–3845. [Google Scholar] [CrossRef]
- Stephens, G.L.; Vane, D.G.; Boain, R.J.; Mace, G.G.; Sassen, K.; Wang, Z.; Illingworth, A.J.; O’Connor, E.J.; Rossow, W.B.; Durden, S.L.; et al. The cloudsat mission and the a-train. Bull. Am. Meteorol. Soc. 2002, 83, 1771–1790. [Google Scholar] [CrossRef] [Green Version]
- Stephens, G.L.; Vane, D.G.; Tanelli, S.; Im, E.; Durden, S.; Rokey, M.; Reinke, D.; Partain, P.; Mace, G.G.; Austin, R.; et al. CloudSat mission: Performance and early science after the first year of operation. J. Geophys. Res. 2008, 113, D00A18. [Google Scholar] [CrossRef]
- Luo, Z.; Liu, G.Y.; Stephens, G.L. CloudSat adding new insight into tropical penetrating convection. Geophys. Res. Lett. 2008, 35. [Google Scholar] [CrossRef] [Green Version]
- Riley, E.M.; Mapes, B.E.; Tulich, S.N. Clouds Associated with the Madden–Julian Oscillation: A New Perspective from CloudSat. J. Atmos. Sci. 2011, 68, 3032–3051. [Google Scholar] [CrossRef]
- Del Genio, A.D.; Chen, Y. Cloud-radiative driving of the Madden-Julian oscillation as seen by the A-Train. J. Geophys. Res. Atmos. 2015, 120, 5344–5356. [Google Scholar] [CrossRef]
- Zhang, B.; Kramer, R.J.; Soden, B.J. Radiative Feedbacks Associated with the Madden–Julian Oscillation. J. Clim. 2019, 32, 7055–7065. [Google Scholar] [CrossRef]
- Jiang, X.; Waliser, D.E.; Li, J.-L.; Woods, C. Vertical cloud structures of the boreal summer intraseasonal variability based on CloudSat observations and ERA-interim reanalysis. Clim. Dyn. 2011, 36, 2219–2232. [Google Scholar] [CrossRef] [Green Version]
- Kim, J.; Waliser, D.E.; Cesana, G.V.; Jiang, X.; L’Ecuyer, T.; Neena, J.M. Cloud and radiative heating profiles associated with the boreal summer intraseasonal oscillation. Clim. Dyn. 2018, 50, 1485–1494. [Google Scholar] [CrossRef]
- Luo, Z.J.; Anderson, R.C.; Rossow, W.B.; Takahashi, H. Tropical cloud and precipitation regimes as seen from near-simultaneous TRMM, CloudSat, and CALIPSO observations and comparison with ISCCP. J. Geophys. Res. Atmos. 2017, 122, 5988–6003. [Google Scholar] [CrossRef]
- Lin, J.; Mapes, B.; Zhang, M.; Newman, M. Stratiform Precipitation, Vertical Heating Profiles, and the Madden–Julian Oscillation. J. Atmos. Sci. 2004, 61, 296–309. [Google Scholar] [CrossRef]
- Kim, D.; Sperber, K.; Stern, W.; Waliser, D.; Kang, I.-S.; Maloney, E.; Wang, W.; Weickmann, K.; Benedict, J.; Khairoutdinov, M.; et al. Application of MJO Simulation Diagnostics to Climate Models. J. Clim. 2009, 22, 6413–6436. [Google Scholar] [CrossRef] [Green Version]
- Hung, M.-P.; Lin, J.-L.; Wang, W.; Kim, D.; Shinoda, T.; Weaver, S.J. MJO and Convectively Coupled Equatorial Waves Simulated by CMIP5 Climate Models. J. Clim. 2013, 26, 6185–6214. [Google Scholar] [CrossRef]
- Bony, S.; Emanuel, K.A. On the Role of Moist Processes in Tropical Intraseasonal Variability: Cloud–Radiation and Moisture–Convection Feedbacks. J. Atmos. Sci. 2005, 62, 2770–2789. [Google Scholar] [CrossRef]
- Crueger, T.; Stevens, B. The effect of atmospheric radiative heating by clouds on the Madden-Julian Oscillation. J. Adv. Model. Earth Syst. 2015, 7, 854–864. [Google Scholar] [CrossRef]
- Kim, D.; Ahn, M.-S.; Kang, I.-S.; Del Genio, A.D. Role of Longwave Cloud–Radiation Feedback in the Simulation of the Madden–Julian Oscillation. J. Clim. 2015, 28, 6979–6994. [Google Scholar] [CrossRef]
- Cao, G.; Zhang, G.J. Role of Vertical Structure of Convective Heating in MJO Simulation in NCAR CAM5.3. J. Clim. 2017, 30, 7423–7439. [Google Scholar] [CrossRef]
- Tian, B.; Waliser, D.E.; Fetzer, E.J.; Yung, Y.L. Vertical Moist Thermodynamic Structure of the Madden–Julian Oscillation in Atmospheric Infrared Sounder Retrievals: An Update and a Comparison to ECMWF Interim Re-Analysis. Mon. Weather Rev. 2010, 138, 4576–4582. [Google Scholar] [CrossRef] [Green Version]
- Xu, W.; Rutledge, S.A. Morphology, Intensity, and Rainfall Production of MJO Convection: Observations from DYNAMO Shipborne Radar and TRMM. J. Atmos. Sci. 2014, 72, 623–640. [Google Scholar] [CrossRef] [Green Version]
- Zuluaga, M.D.; Houze, R.A. Evolution of the Population of Precipitating Convective Systems over the Equatorial Indian Ocean in Active Phases of the Madden–Julian Oscillation. J. Atmos. Sci. 2013, 70, 2713–2725. [Google Scholar] [CrossRef] [Green Version]
- Wheeler, M.C.; Hendon, H.H. An All-Season Real-Time Multivariate MJO Index: Development of an Index for Monitoring and Prediction. Mon. Weather Rev. 2004, 132, 1917–1932. [Google Scholar] [CrossRef]
- Kiladis, G.N.; Dias, J.; Straub, K.H.; Wheeler, M.C.; Tulich, S.N.; Kikuchi, K.; Weickmann, K.M.; Ventrice, M.J. A Comparison of OLR and Circulation-Based Indices for Tracking the MJO. Mon. Weather Rev. 2013, 142, 1697–1715. [Google Scholar] [CrossRef]
- Ling, J.; Zhang, C.; Bechtold, P. Large-Scale Distinctions between MJO and Non-MJO Convective Initiation over the Tropical Indian Ocean. J. Atmos. Sci. 2013, 70, 2696–2712. [Google Scholar] [CrossRef] [Green Version]
- Sassen, K.; Wang, Z. Classifying clouds around the globe with the CloudSat radar: 1-year of results. Geophys. Res. Lett. 2008, 35, L04805. [Google Scholar] [CrossRef]
- L’Ecuyer, T.S.; Wood, N.B.; Haladay, T.; Stephens, G.L.; Stackhouse, P.W. Impact of clouds on atmospheric heating based on the R04 CloudSat fluxes and heating rates data set. J. Geophys. Res. 2008, 113, D00A15. [Google Scholar] [CrossRef] [Green Version]
- Yanai, M.; Esbensen, S.; Chu, J.-H. Determination of Bulk Properties of Tropical Cloud Clusters from Large-Scale Heat and Moisture Budgets. J. Atmos. Sci. 1973, 30, 611–627. [Google Scholar] [CrossRef]
- Shige, S.; Takayabu, Y.N.; Tao, W.-K.; Johnson, D.E. Spectral Retrieval of Latent Heating Profiles from TRMM PR Data. Part I: Development of a Model-Based Algorithm. J. Appl. Meteorol. 2004, 43, 1095–1113. [Google Scholar] [CrossRef]
- Shige, S.; Takayabu, Y.N.; Tao, W.-K.; Shie, C.-L. Spectral Retrieval of Latent Heating Profiles from TRMM PR Data. Part II: Algorithm Improvement and Heating Estimates over Tropical Ocean Regions. J. Appl. Meteorol. Climatol. 2007, 46, 1098–1124. [Google Scholar] [CrossRef]
- Shige, S.; Takayabu, Y.N.; Tao, W.-K. Spectral Retrieval of Latent Heating Profiles from TRMM PR Data. Part III: Estimating Apparent Moisture Sink Profiles over Tropical Oceans. J. Appl. Meteorol. Climatol. 2008, 47, 620–640. [Google Scholar] [CrossRef]
- Shige, S.; Takayabu, Y.N.; Kida, S.; Tao, W.-K.; Zeng, X.; Yokoyama, C.; L’Ecuyer, T. Spectral Retrieval of Latent Heating Profiles from TRMM PR Data. Part IV: Comparisons of Lookup Tables from Two- and Three-Dimensional Cloud-Resolving Model Simulations. J. Clim. 2009, 22, 5577–5594. [Google Scholar] [CrossRef]
- Takayabu, Y.N.; Shige, S.; Tao, W.-K.; Hirota, N. Shallow and Deep Latent Heating Modes over Tropical Oceans Observed with TRMM PR Spectral Latent Heating Data. J. Clim. 2010, 23, 2030–2046. [Google Scholar] [CrossRef]
- Tao, W.-K.; Takayabu, Y.N.; Lang, S.; Shige, S.; Olson, W.; Hou, A.; Skofronick-Jackson, G.; Jiang, X.; Zhang, C.; Lau, W.; et al. TRMM Latent Heating Retrieval: Applications and Comparisons with Field Campaigns and Large-Scale Analyses. Meteorol. Monogr. 2016, 56, 1–2. [Google Scholar] [CrossRef]
- Huffman, G.J.; Adler, R.F.; Bolvin, D.T.; Nelkin, E.J. The TRMM Multi-Satellite Precipitation Analysis (TMPA). In Satellite Rainfall Applications for Surface Hydrology; Gebremichael, M., Hossain, F., Eds.; Springer: Amsterdam, The Netherlands, 2010; pp. 3–22. ISBN 978-90-481-2914-0. [Google Scholar]
- Kummerow, C.; Simpson, J.; Thiele, O.; Barnes, W.; Chang, A.T.C.; Stocker, E.; Adler, R.F.; Hou, A.; Kakar, R.; Wentz, F.; et al. The Status of the Tropical Rainfall Measuring Mission (TRMM) after Two Years in Orbit. J. Appl. Meteorol. 2000, 39, 1965–1982. [Google Scholar] [CrossRef]
- Hersbach, H.; Bell, B.; Berrisford, P.; Hirahara, S.; Horányi, A.; Muñoz-Sabater, J.; Nicolas, J.; Peubey, C.; Radu, R.; Schepers, D.; et al. The ERA5 global reanalysis. Q. J. R. Meteorol. Soc. 2020. [Google Scholar] [CrossRef]
- Lolli, S.; Campbell, J.R.; Lewis, J.R.; Gu, Y.; Marquis, J.W.; Chew, B.N.; Liew, S.-C.; Salinas, S.V.; Welton, E.J. Daytime Top-of-the-Atmosphere Cirrus Cloud Radiative Forcing Properties at Singapore. J. Appl. Meteorol. Climatol. 2017, 56, 1249–1257. [Google Scholar] [CrossRef] [Green Version]
- Barnes, H.C.; Zuluaga, M.D.; Houze, R.A. Latent heating characteristics of the MJO computed from TRMM Observations. J. Geophys. Res. Atmos. 2015, 120, 1322–1334. [Google Scholar] [CrossRef]
- Kim, H.; Vitart, F.; Waliser, D.E. Prediction of the Madden–Julian Oscillation: A Review. J. Clim. 2018, 31, 9425–9443. [Google Scholar] [CrossRef]
- Gottschalck, J.; Wheeler, M.; Weickmann, K.; Vitart, F.; Savage, N.; Lin, H.; Hendon, H.; Waliser, D.; Sperber, K.; Nakagawa, M.; et al. A Framework for Assessing Operational Madden–Julian Oscillation Forecasts. Bull. Am. Meteorol. Soc. 2010, 91, 1247–1258. [Google Scholar] [CrossRef] [Green Version]
- Waliser, D.; Sperber, K.; Hendon, H.; Kim, D.; Maloney, E.; Wheeler, M.; Weickmann, K.; Zhang, C.; Donner, L.; Gottschalck, J.; et al. MJO Simulation Diagnostics. J. Clim. 2009, 22, 3006–3030. [Google Scholar] [CrossRef]
- Ahn, M.-S.; Kim, D.; Sperber, K.R.; Kang, I.-S.; Maloney, E.; Waliser, D.; Hendon, H.; on behalf of WGNE MJO Task Force. MJO simulation in CMIP5 climate models: MJO skill metrics and process-oriented diagnosis. Clim. Dyn. 2017, 49, 4023–4045. [Google Scholar] [CrossRef] [Green Version]
- Zhang, C. Madden-Julian Oscillation. Rev. Geophys. 2005, 43. [Google Scholar] [CrossRef] [Green Version]
- Straub, K.H. MJO Initiation in the Real-Time Multivariate MJO Index. J. Clim. 2013, 26, 1130–1151. [Google Scholar] [CrossRef]
- Vincent, C.L.; Lane, T.P. Mesoscale Variation in Diabatic Heating around Sumatra, and Its Modulation with the Madden–Julian Oscillation. Mon. Weather Rev. 2018, 146, 2599–2614. [Google Scholar] [CrossRef]
- Sassen, K.; Wang, Z.; Liu, D. Global distribution of cirrus clouds from CloudSat/Cloud-Aerosol Lidar and Infrared Pathfinder Satellite Observations (CALIPSO) measurements. J. Geophys. Res. Atmos. 2008, 113. [Google Scholar] [CrossRef]
Figure 1.
(a) The geo-location of the five chosen areas for the multi-variate combined orthogonal function (EOF) analysis of the CloudSat cloud frequency time series. Each labeled box covers a 10° longitude by 10° latitude region in the domain over 10°S–10°N, 50°E–150°E. The color shading shows the boreal winter (November–April) outgoing longwave radiation (OLR) variance in the 20–100 day band from the NOAA OLR observation of 1979–2012. (b) The flowchart of the data processing procedure to derive the cloud regime. 2B-CLDCLASS, cloud classification product.

Figure 2.
(a,b) Spatial structures of the first two leading EOFs of the combined fields of high (blue), deep (red), and shallow (yellow) clouds. (c) The daily time series of cloud regime (CR)-PC1 (blue) and CR-PC2 (green) of the two leading EOFs.
Figure 2.
(a,b) Spatial structures of the first two leading EOFs of the combined fields of high (blue), deep (red), and shallow (yellow) clouds. (c) The daily time series of cloud regime (CR)-PC1 (blue) and CR-PC2 (green) of the two leading EOFs.

Figure 3.
(a) Lead-lag correlations between CR-PC1 and CR-PC2 time series of the leading two EOFs of the combined analysis. Negative lag days denote CR-PC2 leading CR-PC1, while positive lag days indicate CR-PC1 leading CR-PC2. (b,c) Power spectra of CR-PC1 and CR-PC2, as calculated by using the whole time series between 2006 and 2017. The four black dashed lines mark the intraseasonal band as 20, 30, 50, and 80 days.

Figure 4.
(a) The daily time series of CR-PC1 (blue) and the Real-time Multi-variate (RMM1) index (green) from 2006 to 2017. (b) The daily time series of CR-PC2 (blue) and the RMM2 index (green). (c) Lead-lag correlation coefficients for CR-PC1 against the RMM1 (blue) and RMM2 (green) index during 2006–2017. Negative lag days denote the RMM1/2 leading CR-PC1, while positive lag days indicate CR-PC1 leading the RMM1/2.

Figure 5.
Longitude-altitude cross-section of the composite occurrence frequency of the cloud type of (a,d,g,j) high and mid-level clouds (Ci+As+Ac), (b,e,h,k) low clouds (Cu+Sc), and (c,f,i,l) deep clouds (DC+Ns) over the tropical ocean (10°S–10°N) for each cloud regime phase (sampled longitudinally at every 5°, November–April 2006–2017, composite of the days when the magnitude of the CR-PC > 1.5). The corresponding convective areas marked on the left of each row: WIO = Western Indian Ocean, EIO = Eastern Indian Ocean, WMC = Western Maritime Continent, and EMC = Eastern Maritime Continent. Cloud types: cirrus (Ci), altocumulus (Ac), altostratus (As), cumulus (Cu), stratocumulus (Sc), stratus (St), nimbostratus (Ns), and deep cumulus (DC).

Figure 6.
Longitude-altitude cross-sections of ERA5 (a,d,g,j) specific humidity anomaly (g kg−1) and (b,e,h,k) vertical velocity (hPa day−1) and (c,f,i,l) TRMM-SLH heating (Q1-QR) anomaly (K day−1) over the Tropics (10°S–10°N) during each cloud regime phase (marked on the left of each row). The anomaly is relative to the mean climatology over November–April 2006–2017, but excluding the days when the magnitude of the CR-PC > 1.5.

Figure 7.
Longitude-altitude cross-section of the (a,d,g,j) longwave, (b,e,h,k) shortwave, and (c,f,i,l) net cloud radiative heating rate (K day−1) from CloudSat FLXHR over the Tropics (10°S–10°N) for each cloud regime phase (November–April 2006–2017, composite of the days when the magnitude of the CR-PC > 1.5).

Figure 8.
(a) The phase diagram of a strong Madden Julian Oscillation (MJO) case from 30 March–5 May 2009. Green lines show the trajectory of the CR index, while the blue lines show the trajectory of the RMM index. The central circle signifies an amplitude of one. The Hovmöller diagram of (b) TRMM 3B42 precipitation and (c) column-integrated water vapor from ERA-Int during the selected MJO case (averaged over 10°S–10°N). The horizontal dashed lines in (b,c) separate the phases defined by the CR index, as marked on the right of (c).

Figure 9.
The domain-averaged time series of (a) daily vertical cloud frequency, (b) precipitation, and (c) column-integrated water vapor over the tropical Central Indian Ocean (Box 2 in Figure 1) during the selected MJO case in Figure 8. The phase defined by the CR index is marked at the bottom of (c).

Figure 10.
The joint probability density functions of cloud-top height (y-axis) and cloud-bottom height (x-axis) over the tropical Central Indian Ocean from CloudSat observations for (a) CR Phase D (suppressed) and (b) CR Phase B (convective EIO/WMC) in the selected MJO case in Figure 8.
Figure 10.
The joint probability density functions of cloud-top height (y-axis) and cloud-bottom height (x-axis) over the tropical Central Indian Ocean from CloudSat observations for (a) CR Phase D (suppressed) and (b) CR Phase B (convective EIO/WMC) in the selected MJO case in Figure 8.

© 2020 by the authors. Licensee MDPI, Basel, Switzerland. This article is an open access article distributed under the terms and conditions of the Creative Commons Attribution (CC BY) license (http://creativecommons.org/licenses/by/4.0/).
Share and Cite
MDPI and ACS Style
Hung, M.-P.; Chen, W.-T.; Wu, C.-M.; Chen, P.-J.; Feng, P.-N. Intraseasonal Vertical Cloud Regimes Based on CloudSat Observations over the Tropics. Remote Sens. 2020, 12, 2273. https://doi.org/10.3390/rs12142273
AMA Style
Hung M-P, Chen W-T, Wu C-M, Chen P-J, Feng P-N. Intraseasonal Vertical Cloud Regimes Based on CloudSat Observations over the Tropics. Remote Sensing. 2020; 12(14):2273. https://doi.org/10.3390/rs12142273
Chicago/Turabian StyleHung, Meng-Pai, Wei-Ting Chen, Chien-Ming Wu, Peng-Jen Chen, and Pei-Ning Feng. 2020. "Intraseasonal Vertical Cloud Regimes Based on CloudSat Observations over the Tropics" Remote Sensing 12, no. 14: 2273. https://doi.org/10.3390/rs12142273
Note that from the first issue of 2016, this journal uses article numbers instead of page numbers. See further details here.