Biomass Burning in Africa: An Investigation of Fire Radiative Power Missed by MODIS Using the 375 m VIIRS Active Fire Product


1
Geospatial Sciences Center of Excellence, Geography Department, South Dakota State University, Brookings, SD 57007, USA
2
NOAA/NESDIS/Center for Satellite Applications and Research, College Park, MD 20740, USA
*
Author to whom correspondence should be addressed.
Remote Sens. 2020, 12(10), 1561; https://doi.org/10.3390/rs12101561
Submission received: 16 April 2020
/
Revised: 6 May 2020
/
Accepted: 13 May 2020
/
Published: 14 May 2020
(This article belongs to the Special Issue Remote Sensing of Biomass Burning)
Abstract
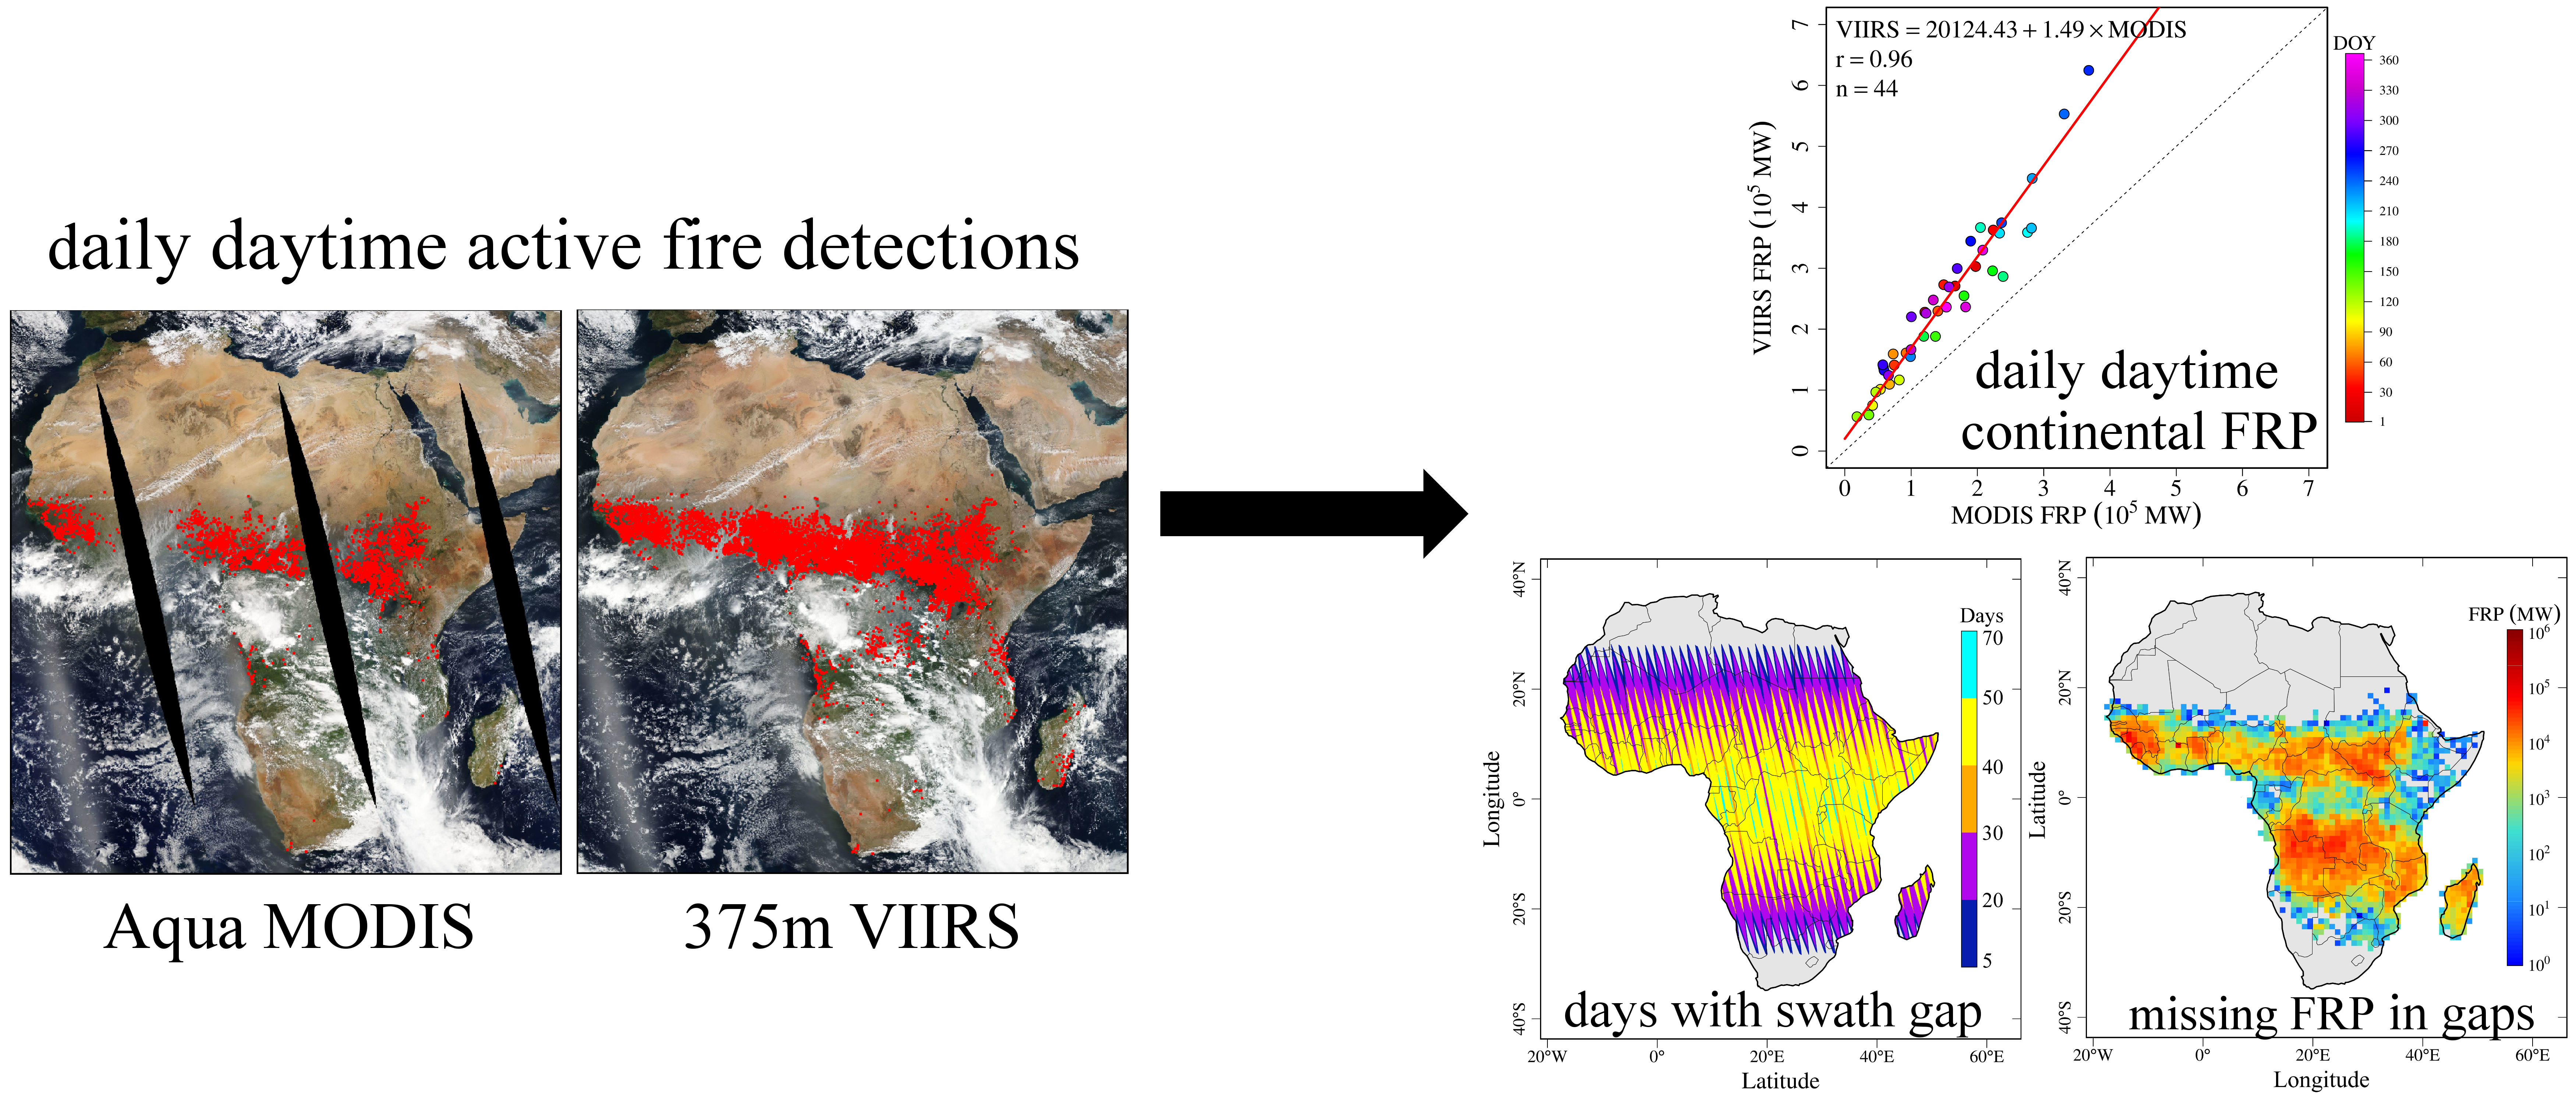
:Biomass burning plays a key role in the interaction between the atmosphere and the biosphere. The nearly two-decade-old Moderate Resolution Imaging Spectroradiometer (MODIS) active fire product provides critical information (e.g., fire radiative power or FRP) for characterizing fires and estimating smoke emissions. Due to limitations of sensing geometry, MODIS fire detection capability degrades at off-nadir angles and the sensor misses the observation of fires occurring inside its equatorial swath gaps. This study investigates missing MODIS FRP observations using the 375 m Visible Infrared Imaging Radiometer Suite (VIIRS) active fire data across Africa where fire occurs in the majority of vegetation-covered areas and significantly contributes to global biomass-burning emissions. We first examine the FRP relationship between the two sensors on a continental scale and in grids of seven different resolutions. We find that MODIS misses a considerable number of low-intensity fires across Africa, which results in the underestimation of daily MODIS FRP by at least 42.8% compared to VIIRS FRP. The underestimation of MODIS FRP varies largely with grid size and satellite view angle. Based on comparisons of grid-level FRP from the two sensors, adjustment models are established at seven resolutions from 0.05°–0.5° for mitigating the underestimation of MODIS grid FRP. Furthermore, the investigation of the effect of equatorial swath gaps on MODIS FRP observations reveals that swath gaps could lead to the underestimation of MODIS monthly summed FRP by 12.5%. The quantitative information of missing MODIS FRP helps to improve our understanding of potential uncertainties in the MODIS FRP based applications, especially emissions estimation.

1. Introduction
Vegetation fire, as an important component of biogeochemical cycles, combusts fuels on the land and releases water vapor, trace gases, and aerosol emissions into the atmosphere [1]. Global biomass burning contributes a substantial amount of emissions that significantly affect the atmospheric carbon budget, weather conditions, air quality, and climate [2,3]. For example, global fires annually burn an area of ~350–422 Mha [4,5] and release ~2.2 Pg carbon [6], among which 67% (burned area) and 52% (carbon) are, respectively, contributed by biomass burning in Africa alone [4,6]. Fire emissions are likely underestimated from satellite observations due to a substantial number of undetected small fires [6,7,8]. One of the most important fire parameters observed from satellites is fire radiative power (FRP)—the instantaneous fire radiative energy [9]. FRP has been increasingly used to understand fire characteristics [10,11,12], analyze impacts of fire weather conditions on fire activity [13], and predict smoke injection height [14,15]. More importantly, FRP is a proxy of the rates of biomass combustion and emissions [9,16,17], which has been confirmed in lab-based combustion experiments [18], prescribed fires [19], and landscape wildfires [20,21,22,23]. Thus, satellite-based FRP provides an effective way to quantify biomass-burning emissions.
Among all satellite-based FRP products, the most commonly used and scientifically reliable one is from the Moderate Resolution Imaging Spectroradiometer (MODIS) onboard the NASA Earth Observing System (EOS) Aqua and Terra satellites. The MODIS active fire products have provided FRP data since 2000, which has been widely applied to estimate regional-to-global trace gases and aerosol emissions [24,25,26,27,28,29]. However, global applications of MODIS FRP are affected by the MODIS sampling limitations and the equatorial swath gaps. First, the MODIS sensor is able to detect a fire pixel of above 10 MW confidently at nadir but its fire detection capability decreases quickly at off-nadir angles due to degrading pixel resolution [30,31,32]. Thus, MODIS could miss observations of fires (at off-nadir angles) that are detectable at nadir, which results in the underestimation of MODIS FRP and emissions estimates. To mitigate FRP underestimation caused by the sampling limitation-, a quadratic model has been proposed separately for Aqua MODIS and Terra MODIS [30], and a mapping method has been developed based on cumulative distribution function (CDF) [33]. Both methods assume that MODIS FRP or FRP CDF in all scan angles should be the same as that at nadir if MODIS pixel size is the same across all angles. This assumption would be valid only if fires burn consistently in the same locations with constant FRP values during a long period when the sensor senses the fires in all angles with the same observation frequency. It could be the case for gas flares but not landscape wildfires because wildfires evolve fast with environmental conditions and its intensity is very dynamic [34]. Wang et al. [35] mitigate the underestimation of emissions at MODIS large view angles in the Northern Hemisphere of Africa, by using emissions estimated with the smallest view angle within ±2 days, assuming persistent burning patterns during the same period. This may not work well because burning sites could vary largely due to human activity [36].
Second, due to MODIS swath gaps between adjacent orbits at low latitudes, MODIS needs two days to provide a full coverage of the equatorial regions between ~30°S and ~30°N [37]. As a result, MODIS misses observations of fires daily inside its swath gaps, which has been known in fire detection [38,39] and emissions estimation [40]. Due to the lack of comparable reference data, the effects of swath-gap-caused missing fire observations on FRP and emissions estimates are poorly understood quantitatively. To deal with the swath gap issue, studies often make assumptions that fire activity within the swath gaps is consistent during a day or two days [24,35].
The imagery bands (I-band) of Visible Infrared Imaging Radiometer Suite (VIIRS) onboard the Suomi National Polar-orbiting Partnership (S-NPP) satellite for the first time provides daily global fire observations at a resolution of 375 m without any gaps [41]. As a complement of the VIIRS 750 m active fire product [42], the VIIRS I-band 375 m active fire data theoretically detect many more small and cool fires than the 1 km MODIS active fire data, which have been demonstrated in agriculture burnings in China [43] and India [44]. Therefore, the VIIRS I-band 375 m active fire data has a large potential to improve biomass-burning emissions estimation. Both the S-NPP VIIRS and Aqua MODIS cross the equator approximately at 01:30 and 13:30 local time and observe the same area with an overpassing time difference of fewer than 50 min [37,45].
In this study, we use the 375 m VIIRS fire data as a reference to investigate the missing MODIS fire observations due to the sampling limitations and the equatorial swath gaps. This study is conducted in the following steps. First, we introduce the sensing geometry of MODIS and VIIRS I-band and compare their fire detection capability across swath. Second, MODIS and VIIRS active fire detections are preprocessed to correct inter-scanline repeat fire detections and extract fire detections sensed contemporaneously by the two sensors. Third, we quantify VIIRS fire observations missed by MODIS and compare contemporaneous FRP estimates from the two sensors at a continental scale and in grids of seven different resolutions to establish empirical MODIS FRP adjustment models. Finally, we investigate the swath-gap-caused missing MODIS FRP observations.
2. Data
2.1. MODIS Sensing Geometry and Active Fire Data
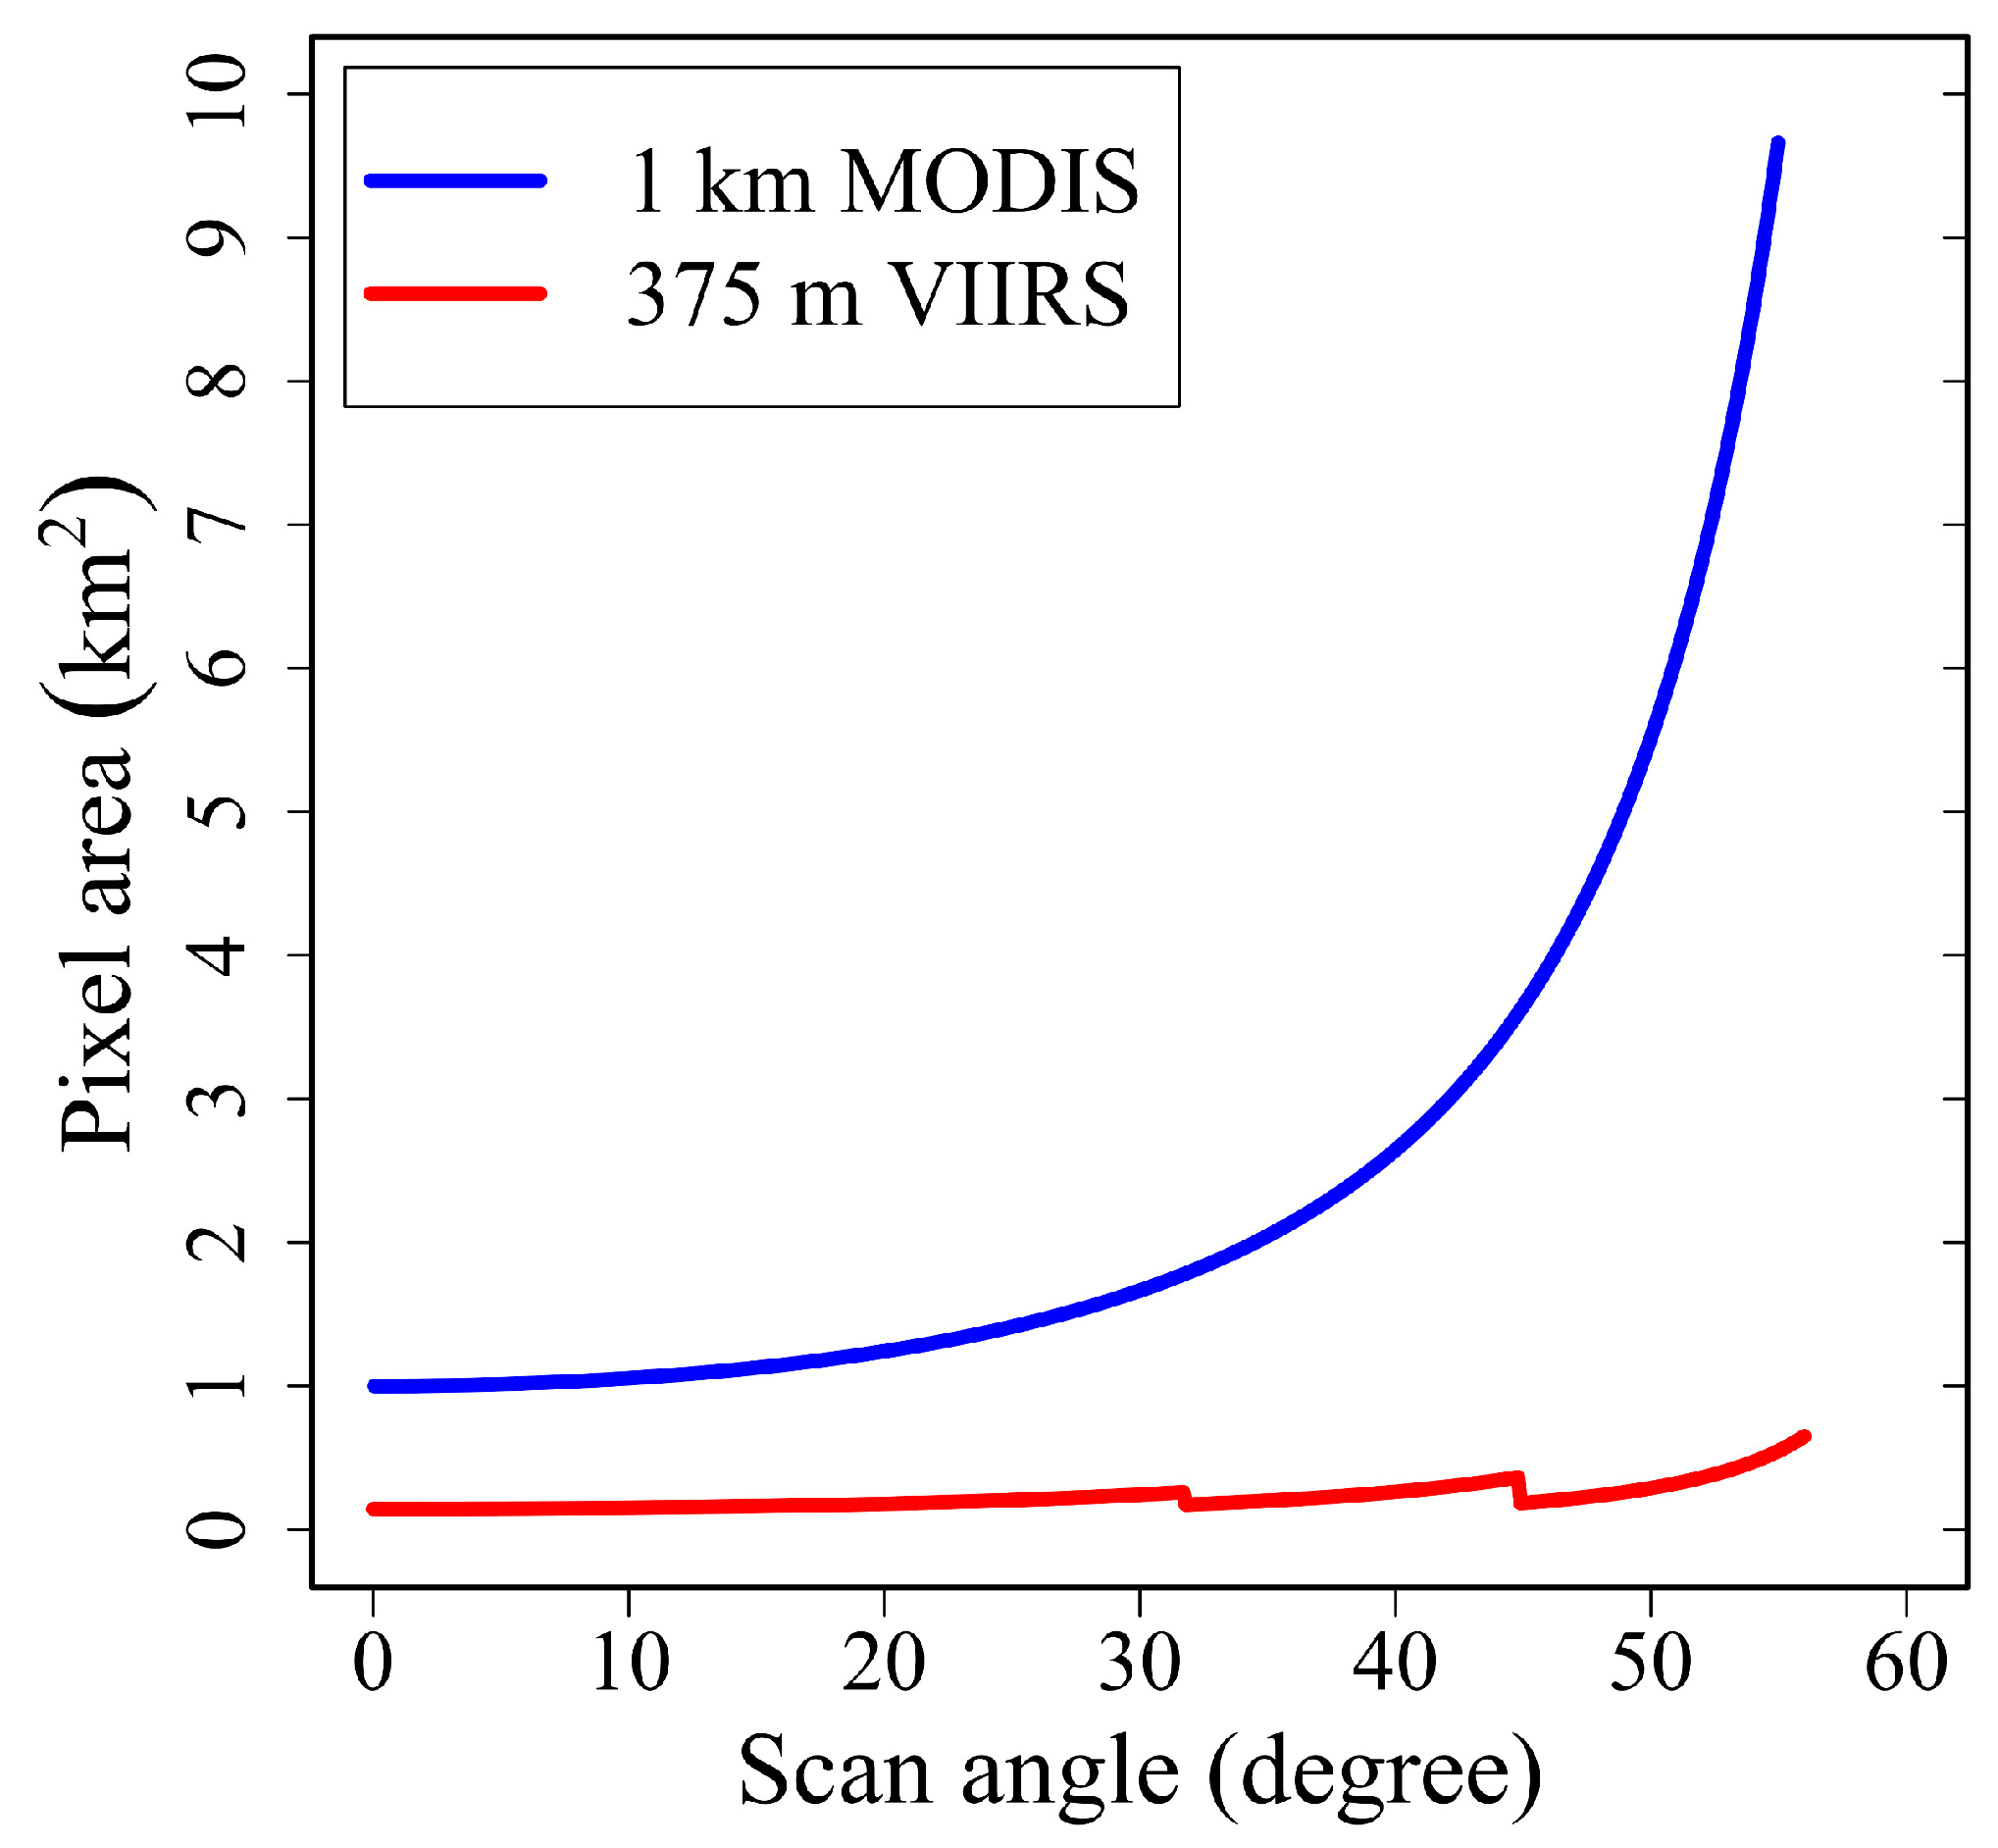
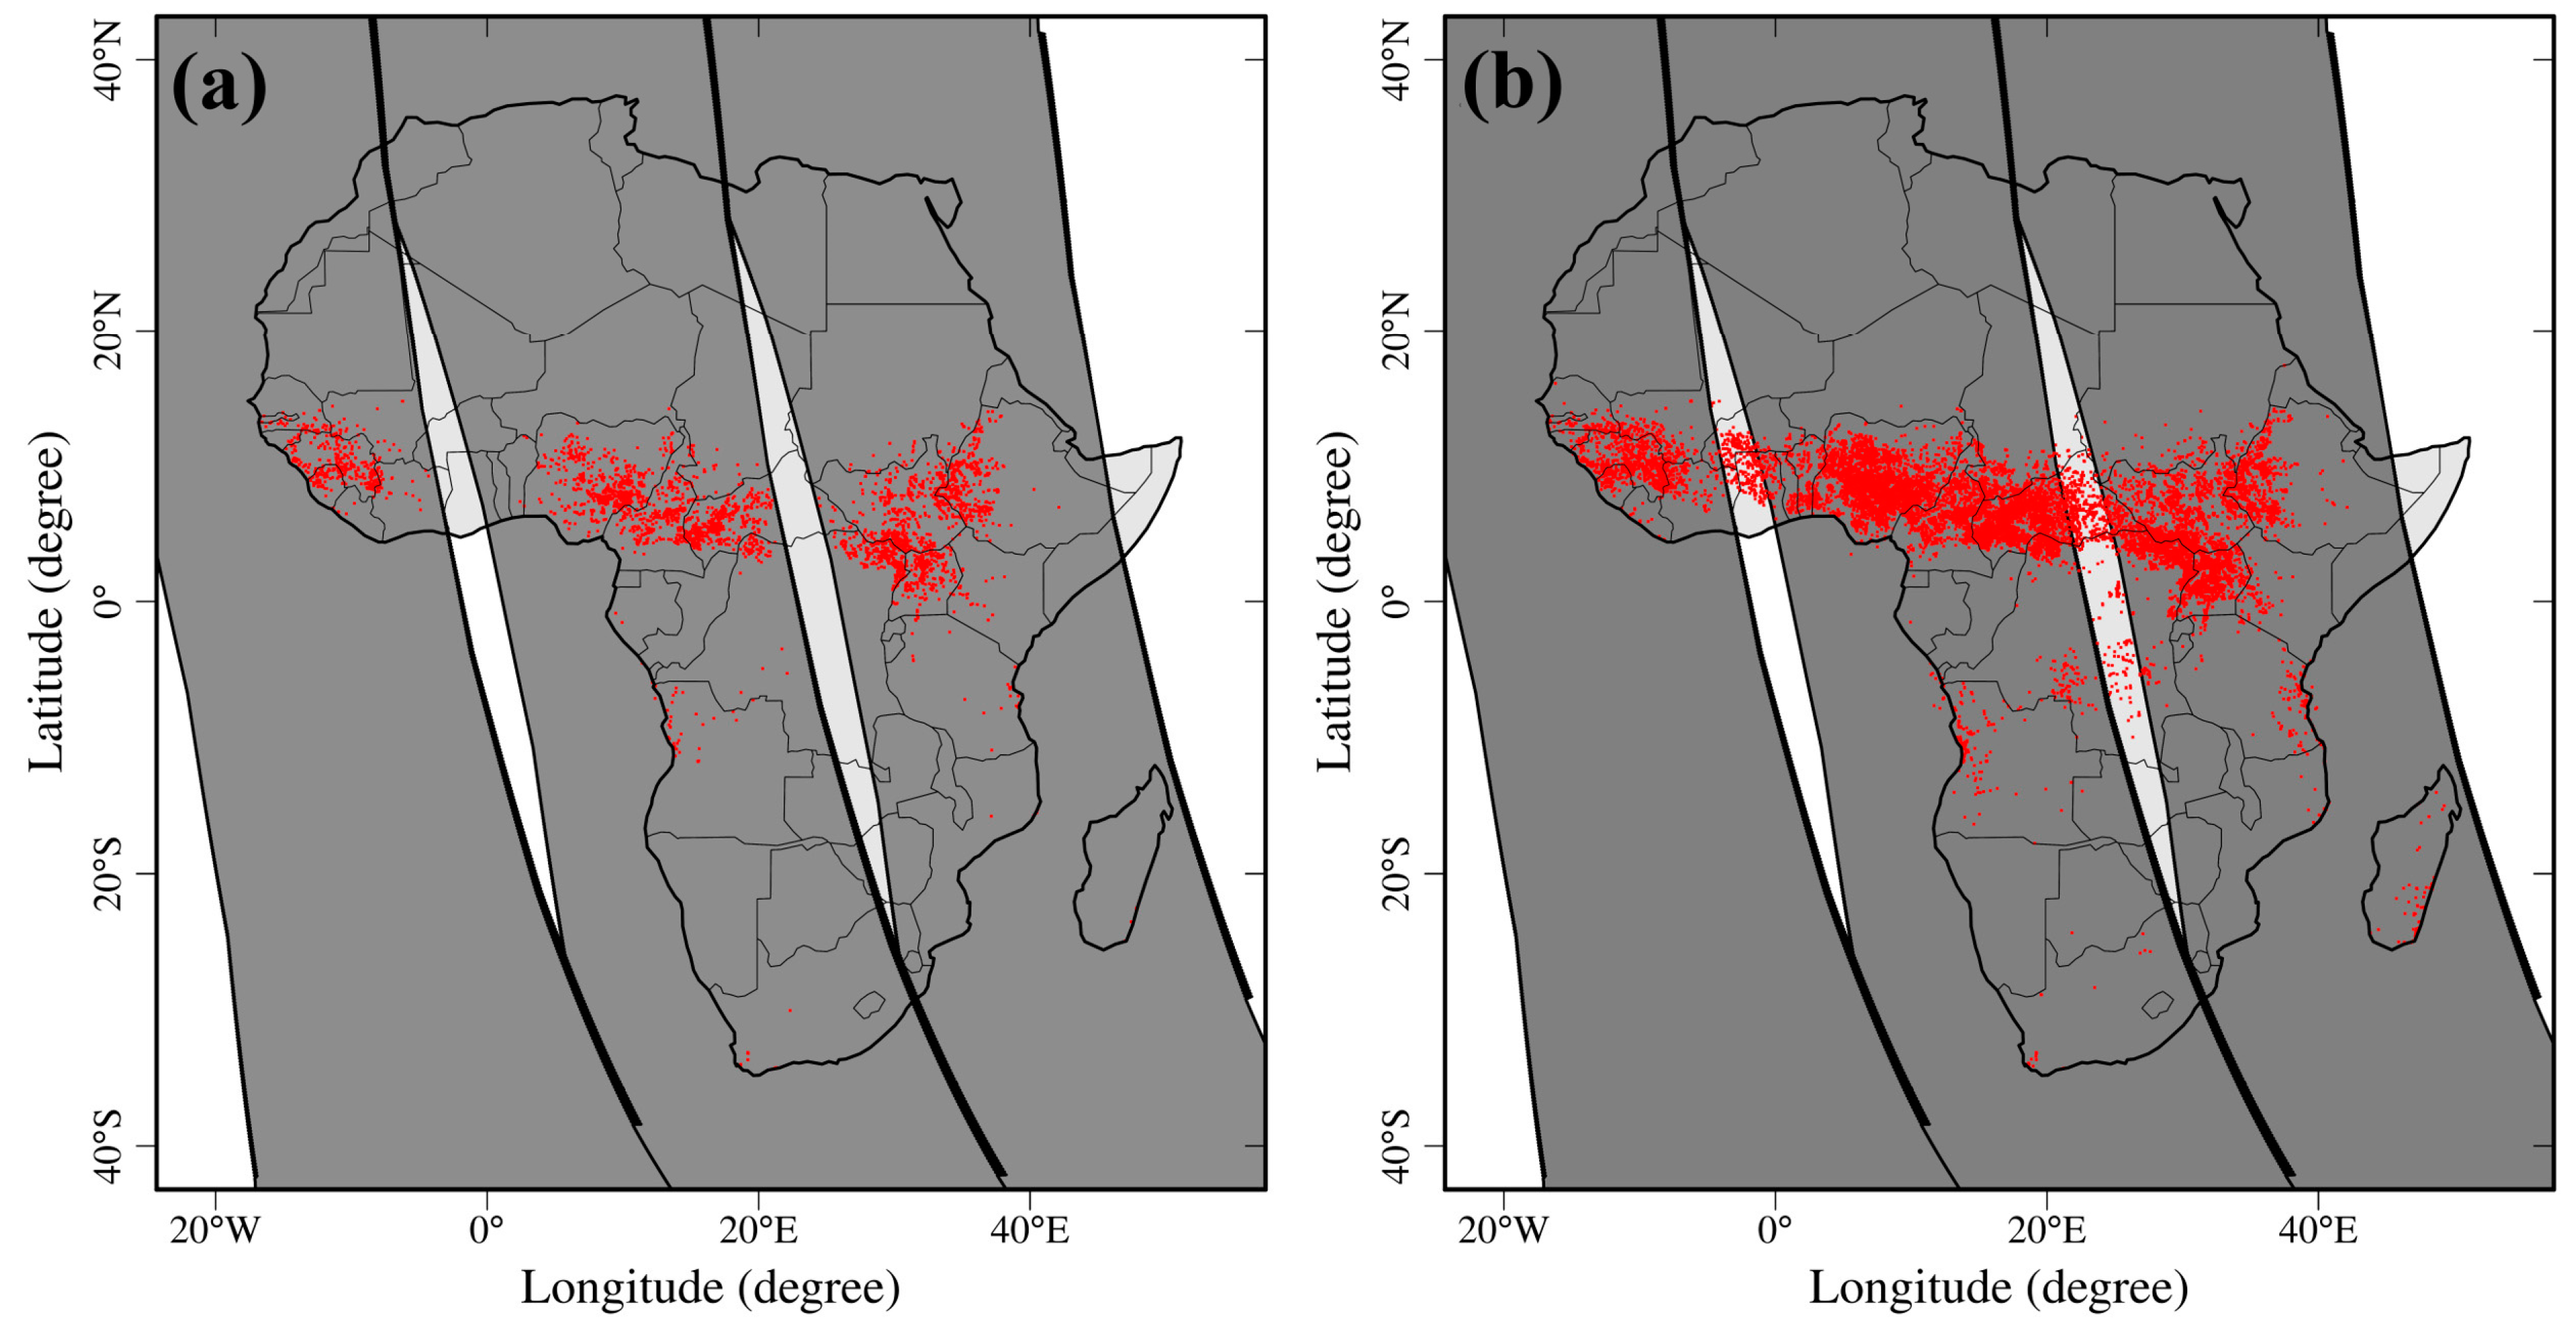
MODIS observes actively burning fires in a sun-synchronous orbit, with a repeat cycle of 16 days [46]. MODIS crosses the equator at approximately 01:30 (Aqua, descending orbit), 10:30 (Terra, descending orbit), 13:30 (Aqua, ascending orbit), and 22:30 (Terra, ascending orbit) local time [37], which provides near-global coverage four times a day. Over a 110° field of view, a MODIS swath consists of ten scan lines and each line has 1354 pixels with a swath width of 2340 km [37]. As scan angle varies from nadir to the scan edge, the nominal pixel size increases from ~1 km to ~2.01 km and ~4.83 km in the along-track and along-scan directions, respectively [46]. Accordingly, the pixel area increases by a factor of ~9.6 (Figure 1), and adjacent scans overlap by up to 50%, which is called the “bow-tie” effect [37]. As a result, the “bow-tie” effect results in the repeat detection of the same fires by adjacent scans [32,47]. MODIS provides a full coverage of the globe every 2 days due to daily swath gaps across equatorial regions between 30°S and 30°N [37], which results in missing observations of fires within the swath gaps (Figure 2). MODIS sensing geometry information (i.e., geolocation and angles) is stored in the swath-level geolocation products (abbreviated MOD03 for Terra and MYD03 for Aqua).
The collection 6 (C6) MODIS 1 km Level-2 active fire products (abbreviated MOD14 for Terra and MYD14 for Aqua) are generated in MODIS sensing geometry (or a swath-level product). The products provide for each fire pixel the observing time, coordinates, detection confidence (0%-100%), FRP (units: MW per pixel), view zenith angle (VZA), brightness temperatures at the 4 and 11-μm bands, and average brightness temperature of ambient background pixels at these two bands [48], as described in Equation (1). FRP in the C6 products is estimated using radiances of the fire pixel and its ambient non-fire pixels at the 4-μm band [49]. This study obtained the C6 Aqua MODIS geolocation product (MYD03) and Level-2 active fire product (MYD14) from the NASA’s Level-1 and Atmosphere Archive and Distribution System (LAADS) (https://ladsweb.modaps.eosdis.nasa.gov/) for the year 2017. The MYD14 product for the 2003-2018 period was also obtained for the correction of historical MODIS FRP. MYD03 was used to locate and extract the swath gaps. For the sake of brevity, hereafter Aqua MODIS is referred to as MODIS.
where FRP is fire radiative power (units: MW); A is pixel area (units: km2); σ is the Stefan–Boltzmann constant (σ = 5.67 × 10⁻⁸ Wm−2 K−4); α is a sensor-specific constant; Lf, MIR and Lb, MIR are radiances of the fire pixel and its ambient background non-fire pixels at the 4-μm band.
2.2. VIIRS I-band Sensing Geometry and Active Fire Data
S-NPP VIIRS is also in a sun-synchronous orbit, with a repeat cycle of 16 days [45]. Very similar to Aqua MODIS, S-NPP VIIRS flies over the equator at approximately 1:30 (descending orbit) and 13:30 (ascending orbit) local time [45]. The VIIRS imagery-resolution bands sense 32 375 m-pixel lines per scan with a field view of 112.56°, and each scan line is composed of 6400 pixels with a swath width of 3000 km [45,50]. The I-band pixel size generally increases along scan direction from nominal 375 m at nadir to ~806 m at the scan edge (Figure 1) [45]. The growth rate of VIIRS pixel size with view angle is largely reduced relative to MODIS because of the VIIRS pixel aggregation scheme that aggregates three scan-direction samples from nadir to scan angle of 31.72° (three-sample zone) and subsequently two samples to scan angle of 44.86° (two-sample zone) and one sample to the scan edge (one-sample zone) [45]. Pixel size varies sharply at the boundaries between aggregation zones (Figure 1). Due to the onboard bow-tie deletion algorithm, repeat detections of the same fires from VIIRS adjacent scans are significantly fewer than MODIS [32]. Moreover, the wider swath width (3000 km), compared with MODIS swath (2340 km), enables VIIRS to provide a daily full coverage of the globe without any gaps. Thus, VIIRS can observe fires inside the equatorial MODIS swath gaps (Figure 2).
The S-NPP VIIRS 375 m Level-2 active fire product (VNP14IMG) for the first time improves the daily global active fire data to a sub-kilometer resolution. As with MODIS Level-2 active fire data, VNP14IMG, a swath-level product (6 min), is produced in VIIRS I-band geometry. For each fire pixel, VNP14IMG provides detection time, coordinates, and confidence, VZA, solar zenith angle, brightness temperatures at the I-4 (3.550–3.937 μm) and I-5 (10.560–12.428 μm) imagery bands, and day/night flag [41,51]. Due to a relatively low saturation temperature of 367K, the S-NPP VIIRS I-4 band can be easily saturated over powerful fires, which makes it very difficult to directly retrieve FRP from radiance at I-4 band [51]. Thus, FRP recorded in the VNP14IMG product is indirectly estimated using radiances of the collocated 750 m fire pixel and ambient non-fire pixels at the 4-μm Moderate-resolution band (M-13, 3.987–4.145 μm) [50,51]. This study obtained the 375 m VNP14IMG product from NASA’s LAADS for the year 2017.
3. Methods
3.1. Correction of Inter-Scanline Repeat Fire Detections
The FRP estimates affected by inter-scanline repeat fire detections from adjacent scans were corrected. First, we extracted the inter-scanline repeat fire detections by following the approach proposed by Li et al. [32] for MODIS and VIIRS separately. Then, for each pair of repeat detections, one remained while the other was excluded and their mean FRP was assigned to the remaining detection. This correction process was applied to all MODIS and VIIRS fire detections of 2017.
Although the overlap of the S-NPP VIIRS swaths from adjacent orbits could also result in repeat fire detections, the effect of these repeat detections to aggregated FRP is negligible, especially in low-latitude regions (i.e., Africa) where the orbital overlap is very limited [32]. Thus, this study did not correct these inter-orbits repeat detections.
3.2. Investigation of Missing MODIS FRP Due to Sampling Limitations
We explored missing MODIS FRP by comparing with contemporaneous 375 m VIIRS FRP at a continental scale and a set of grid sizes.
3.2.1. Extraction of Contemporaneous Fire Detections
Daytime fire detections that were contemporaneously observed by MODIS and VIIRS were extracted first for comparison purposes because fire is highly dynamic and evolves very fast as environmental conditions (i.e., topography, fuel conditions, and fire weather) change [34]. This study considered only daytime fire detections because fires burn mainly during daytime in most ecosystems across Africa [52]. Specifically, for each MODIS ascending orbit (daytime) overpassing the Africa continent, VIIRS fire detections were first clipped using the MODIS swath boundaries to exclude VIIRS fire detections observed inside the equatorial MODIS swath gaps. Then, fire detections observed contemporaneously by Aqua MODIS and S-NPP VIIRS within an observing time difference of ±5 min were extracted by assuming that FRP on the ground and cloud cover remained the same.
3.2.2. Examination of Fire Detection Capability
The difference between fire the detection capabilities of the MODIS sensor and VIIRS I-band was examined by comparing their minimum, mean, and maximum FRP per fire pixel across swath. Specifically, the extracted contemporaneous fire detections were first grouped by every 1° VZA. Then, the minimum and maximum FRP estimates were calculated for each group as the FRP values at 0.5% and 99.5% percentiles of all the corresponding pixel-level FRP to avoid potential extreme FRP values.
3.2.3. Comparison of FRP on a Continental Scale and Various Grid Sizes
To determine the overall missing MODIS FRP over Africa, we compared daily sum FRP from the extracted daytime MODIS and VIIRS I-band contemporaneous active fire detections. There was a total of 44 days from January 8 to December 26, 2017 when the two sensors sensed actively burning fires contemporaneously (within ±5 min) in the same region across Africa. Note that the difference between MODIS and VIIRS overpass time was longer than 5 min during the rest of days. For each of the 44 days, FRP of the contemporaneous active fire detections was summed up separately for MODIS and VIIRS. Then, the daily sum FRP from the two sensors were statistically compared using the reduced major axis regression (RMA) method that minimizes errors of both dependent and independent variables [53]. Their FRP correlation was characterized using Pearson’s correlation coefficient (r).
We further compared MODIS and VIIRS FRP at a set of grid sizes to explore the spatially detailed difference in FRP from the two sensors. Specifically, the extracted contemporaneous fire detections were first gridded into the seven grids of 0.05°, 0.1°, 0.25°, 0.5°, 1°, 2.5°, and 5°, separately, for MODIS and VIIRS. Then, grids with valid fire detections (FRP > 0 MW) were spatially matched between two sensors. This is because, even within an observing time difference of 5 min, fires sensed by one sensor (e.g., VIIRS) could be missed by the other sensor (e.g., MODIS), and vice versa [32]. Grids where both MODIS and VIIRS contemporaneously detected fires were considered as the matched grids; otherwise, grids, where only one of the two sensors observed fires, were grouped as the not-matched grids. In the not-matched grids, fire detections observed by one sensor were considered as missing fire observations by the other sensor. Subsequently, the percentage of these missing fire detections and their contribution to the sum FRP were calculated for MODIS and VIIRS, respectively. Meanwhile, for a matched grid, grid-level FRP was obtained separately for VIIRS and MODIS by summing up FRP within a given grid. Finally, the ratio of VIIRS grid FRP to MODIS grid FRP was calculated using Equation (2):
where φ is the grid FRP ratio, and FRPV and FRPM are VIIRS and MODIS grid FRP, respectively.
The variation in grid FRP from MODIS and VIIRS data was examined for the seven grid scales. The finest grid resolution was set as 0.05° as it is approximately a MODIS pixel (~5 km) at the scan edge along the equator.
3.2.4. Adjustment of Grid-Level MODIS FRP
We also explored the potential relationship between MODIS and VIIRS grid FRP across MODIS VZA. For a given grid size, mean MODIS VZA in a grid was calculated based on VZA values of MODIS fire detections. Then, the grid FRP ratio was grouped for every 1° VZA, and for each group the median grid FRP ratio was obtained. Subsequently, the median grid FRP ratio was fitted as a function of MODIS VZA using a second-order polynomial function:
where φmed is the median of the grid-level FRP ratio (φ), θ is MODIS VZA (in units of radian), and β0, β1, and β2 are three model parameters. Note that the use of the median instead of the mean grid FRP ratio was to avoid the effects of potential extreme FRP ratio values.
A set of polynomial functions was calculated for the seven different grid sizes from 0.05° to 5°. These functions were considered as empirical models for adjusting MODIS FRP.
3.3. Investigation of Missing MODIS FRP inside Equatorial Swath Gaps
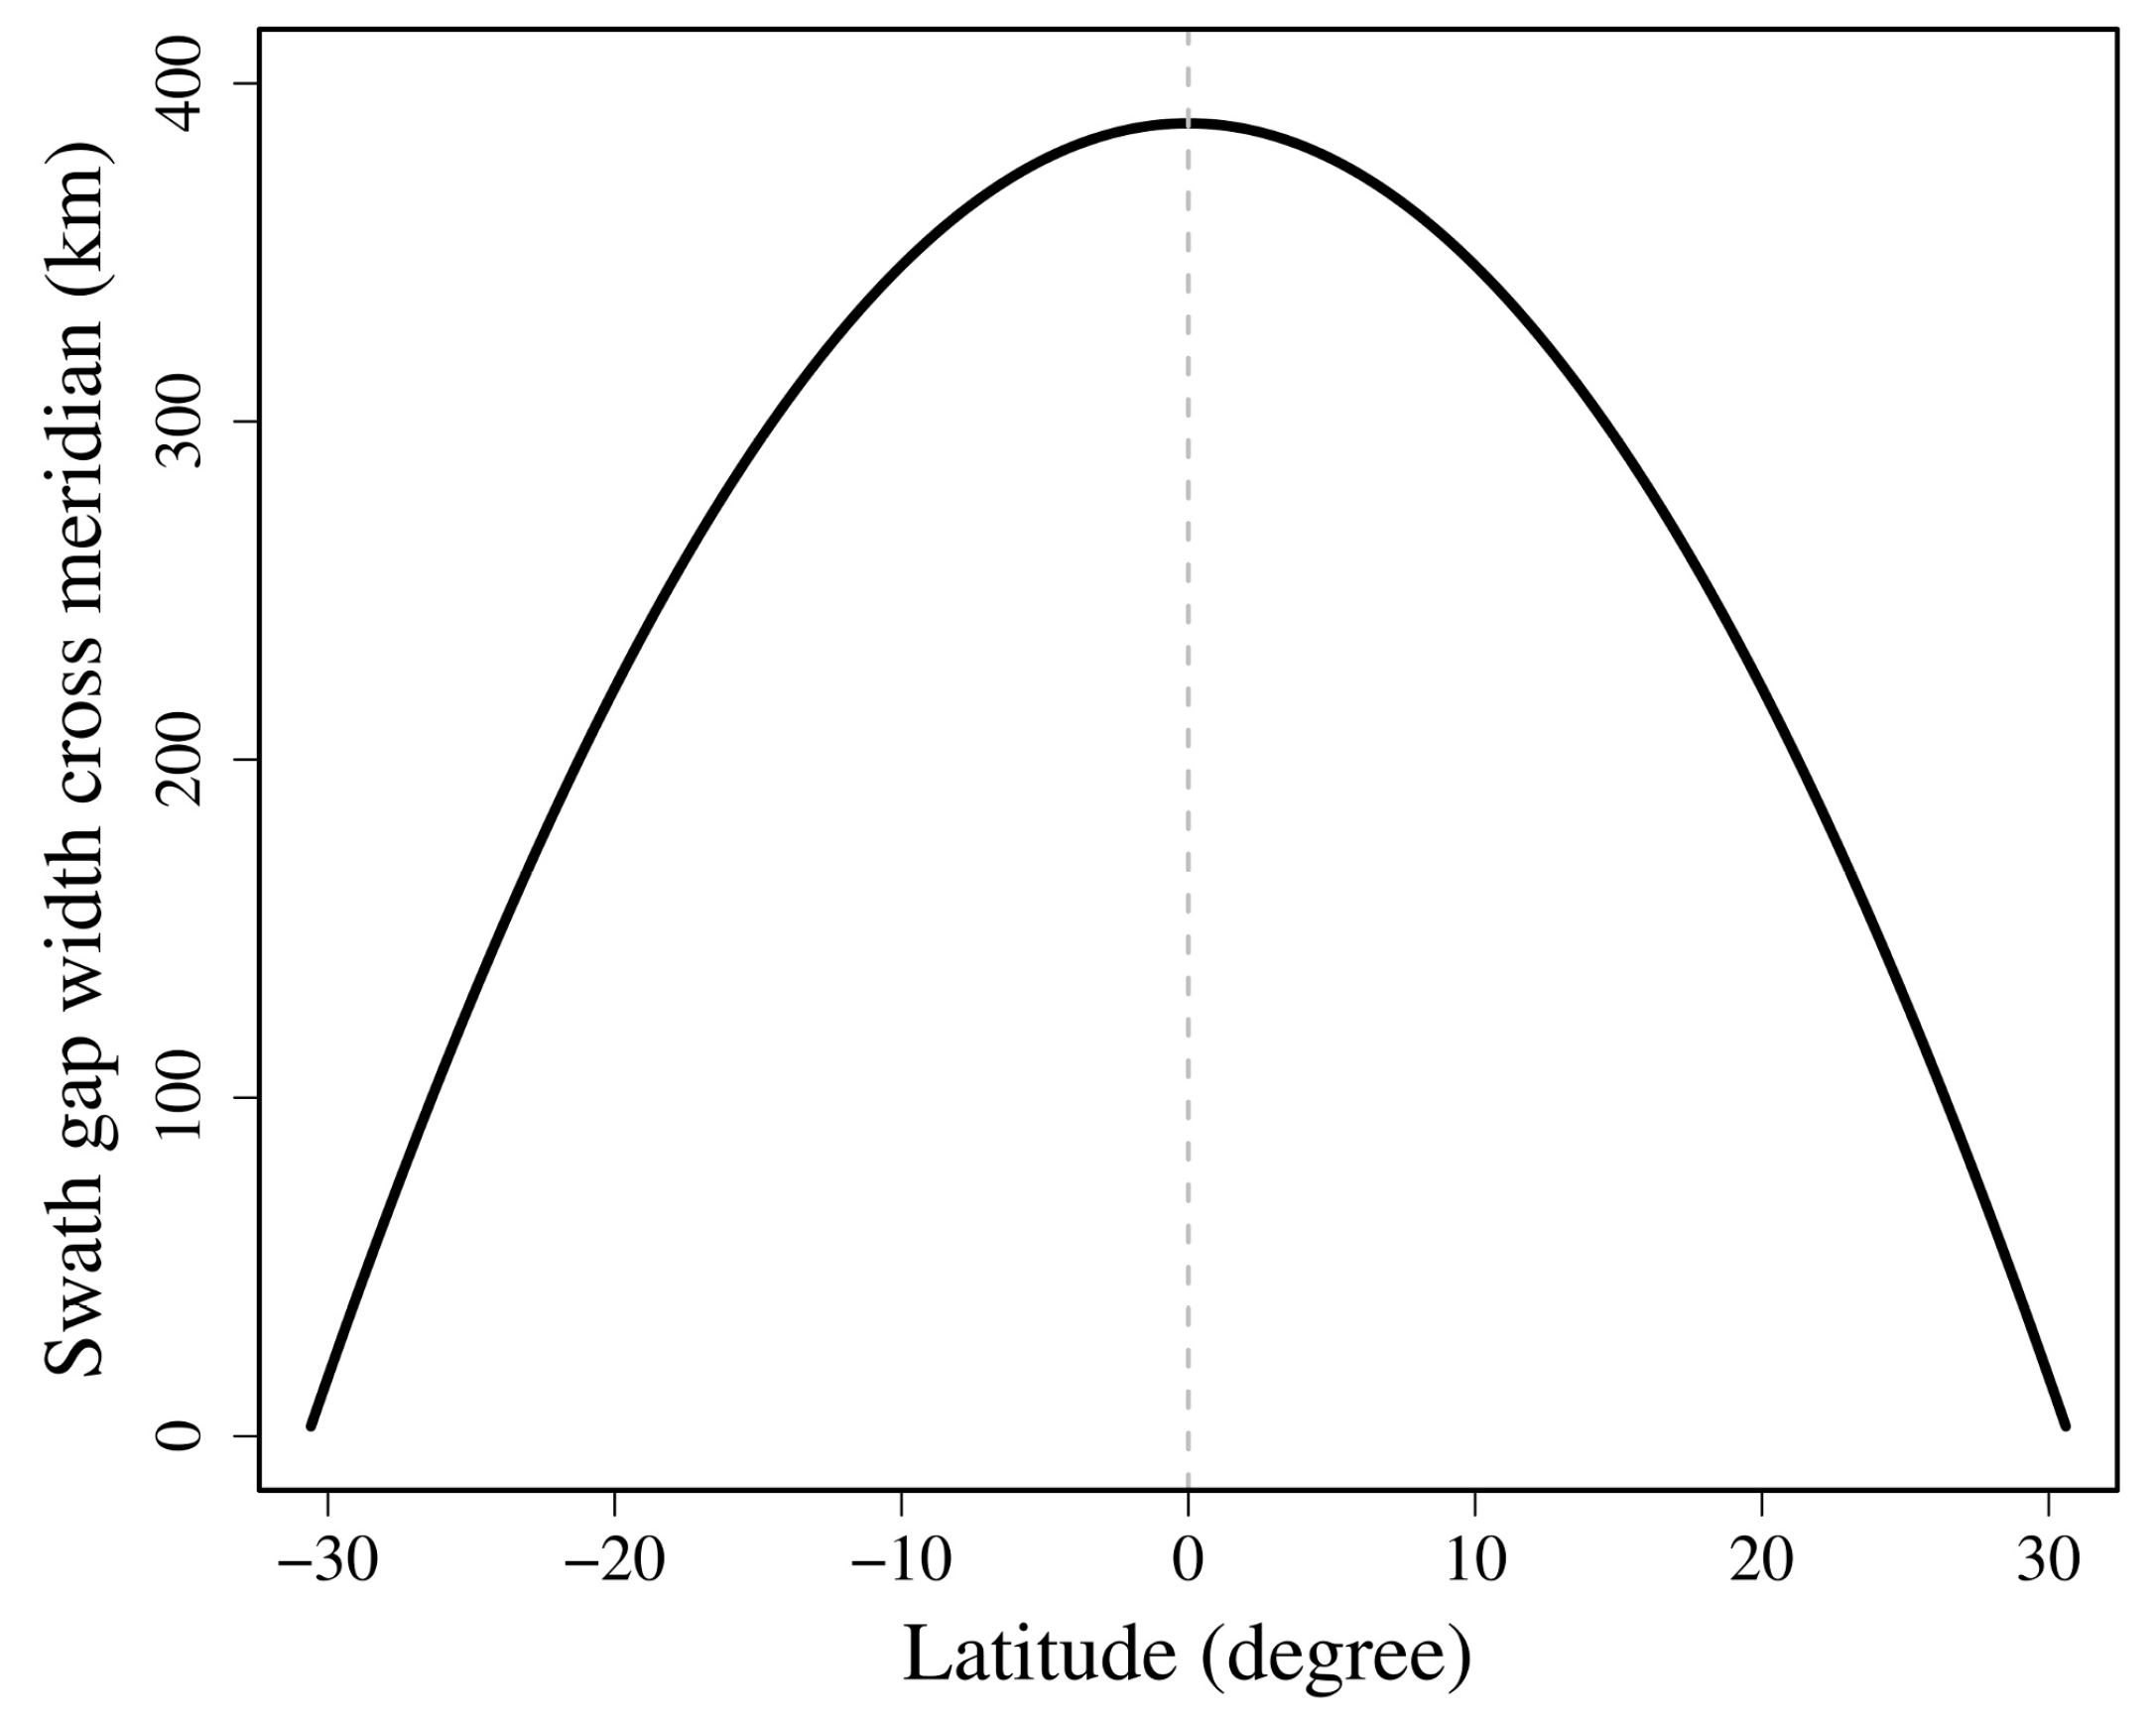
The missing MODIS FRP inside its swath gaps was estimated using VIIRS FRP. The width of a MODIS swath gap across the meridian is a function of latitude, as described in Appendix A. The gap width decreases from 388.1 km at the equator to zero at ~30.7°N and ~30.7°S (Figure 3). By taking VIIRS FRP as reference data, missing MODIS FRP were estimated in the following steps. First, daily MODIS swath gaps were built by intersecting boundaries of adjacent swaths based on MODIS geolocation product (MYD03). Second, the swath gap polygons were applied to clip daily VIIRS fire detections observed inside swath gaps. Third, FRP from the clipped VIIRS fire detections were aggregated in 1° grids to examine the spatial patterns and were summed up across Africa for the whole study period to infer the underestimation of MODIS FRP due to swath gaps. Fourth, FRP from VIIRS fire detections observed inside and outside MODIS swath gaps were also summed up at an interval of one month to explore the seasonal variation of missing MODIS FRP.
4. Results
4.1. Fire Detection Capability across Swath
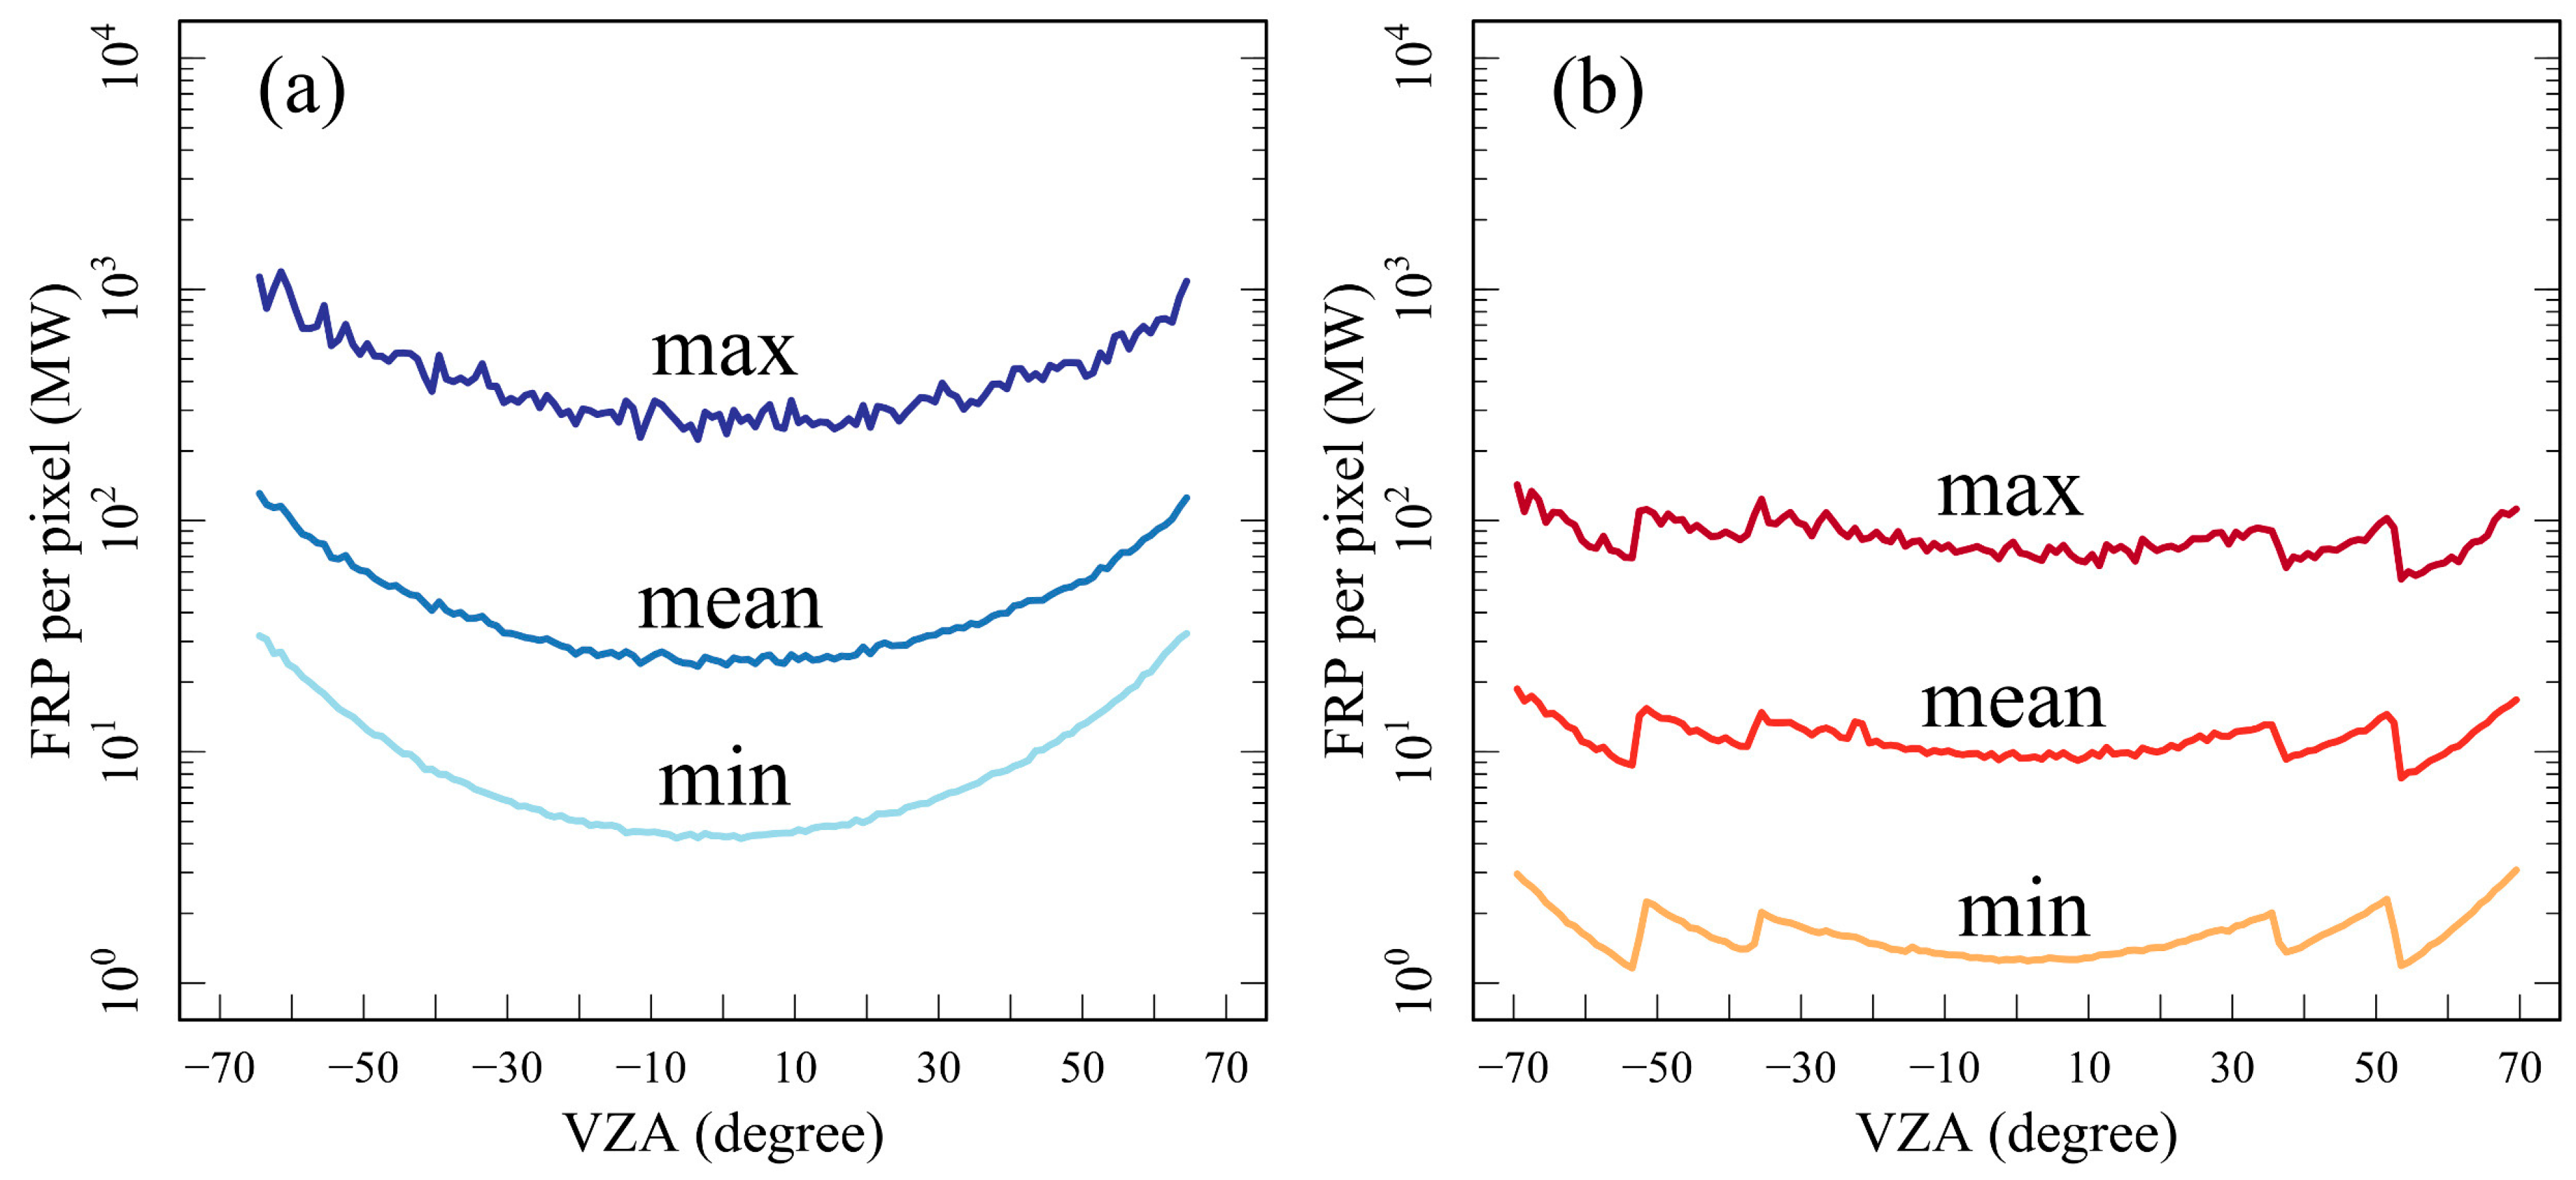
Comparisons of the minimum, mean, and maximum FRP per fire pixel show that the fire detection capability across swath (or VZA) varies considerably for the MODIS sensor while it is generally consistent for VIIRS I-band. As VZA increases from nadir to the scan edge, the minimum, mean, and maximum FRP from MODIS all show an increasing trend, while those from VIIRS show a very small variation (Figure 4). The VIIRS FRP at the boundaries between aggregation zones shows a triangular zig pattern due to the sharp change of VIIRS I-band pixel size (Figure 1 and Figure 4). Minimum FRP shows that MODIS is able to detect fires with FRP of ~4.3 MW (per pixel) at nadir and > 31.7 MW at the scan edge, whereas VIIRS can sense fires with FRP of ~1.3 MW (per pixel) and > 2.9 MW, respectively. This indicates that the fire detection capability of MODIS decreases by a factor of 7.4 at the scan edge while the capability of VIIRS changes by a factor of 1.5, 1.6 and 2.2 in the three-sample, two-sample, and one-sample aggregation zones. As view angle varies from nadir to the scan edge, the mean FRP increases from ~23.7–~130.8 MW for MODIS and ~9.4–~18.6 MW for VIIRS and the maximum FRP increases from ~237.2–~1130.7 MW and ~72.4–~142.6 MW for MODIS and VIIRS, respectively (Figure 4). The sharp decrease in MODIS fire detection capability at large VZAs is associated with the increase in MODIS pixel size at off nadir (Figure 1); on the contrary, VIIRS fire detection capability varies slightly due to the generally consistent pixel size across swath (Figure 1).
4.2. Continental-Scale FRP
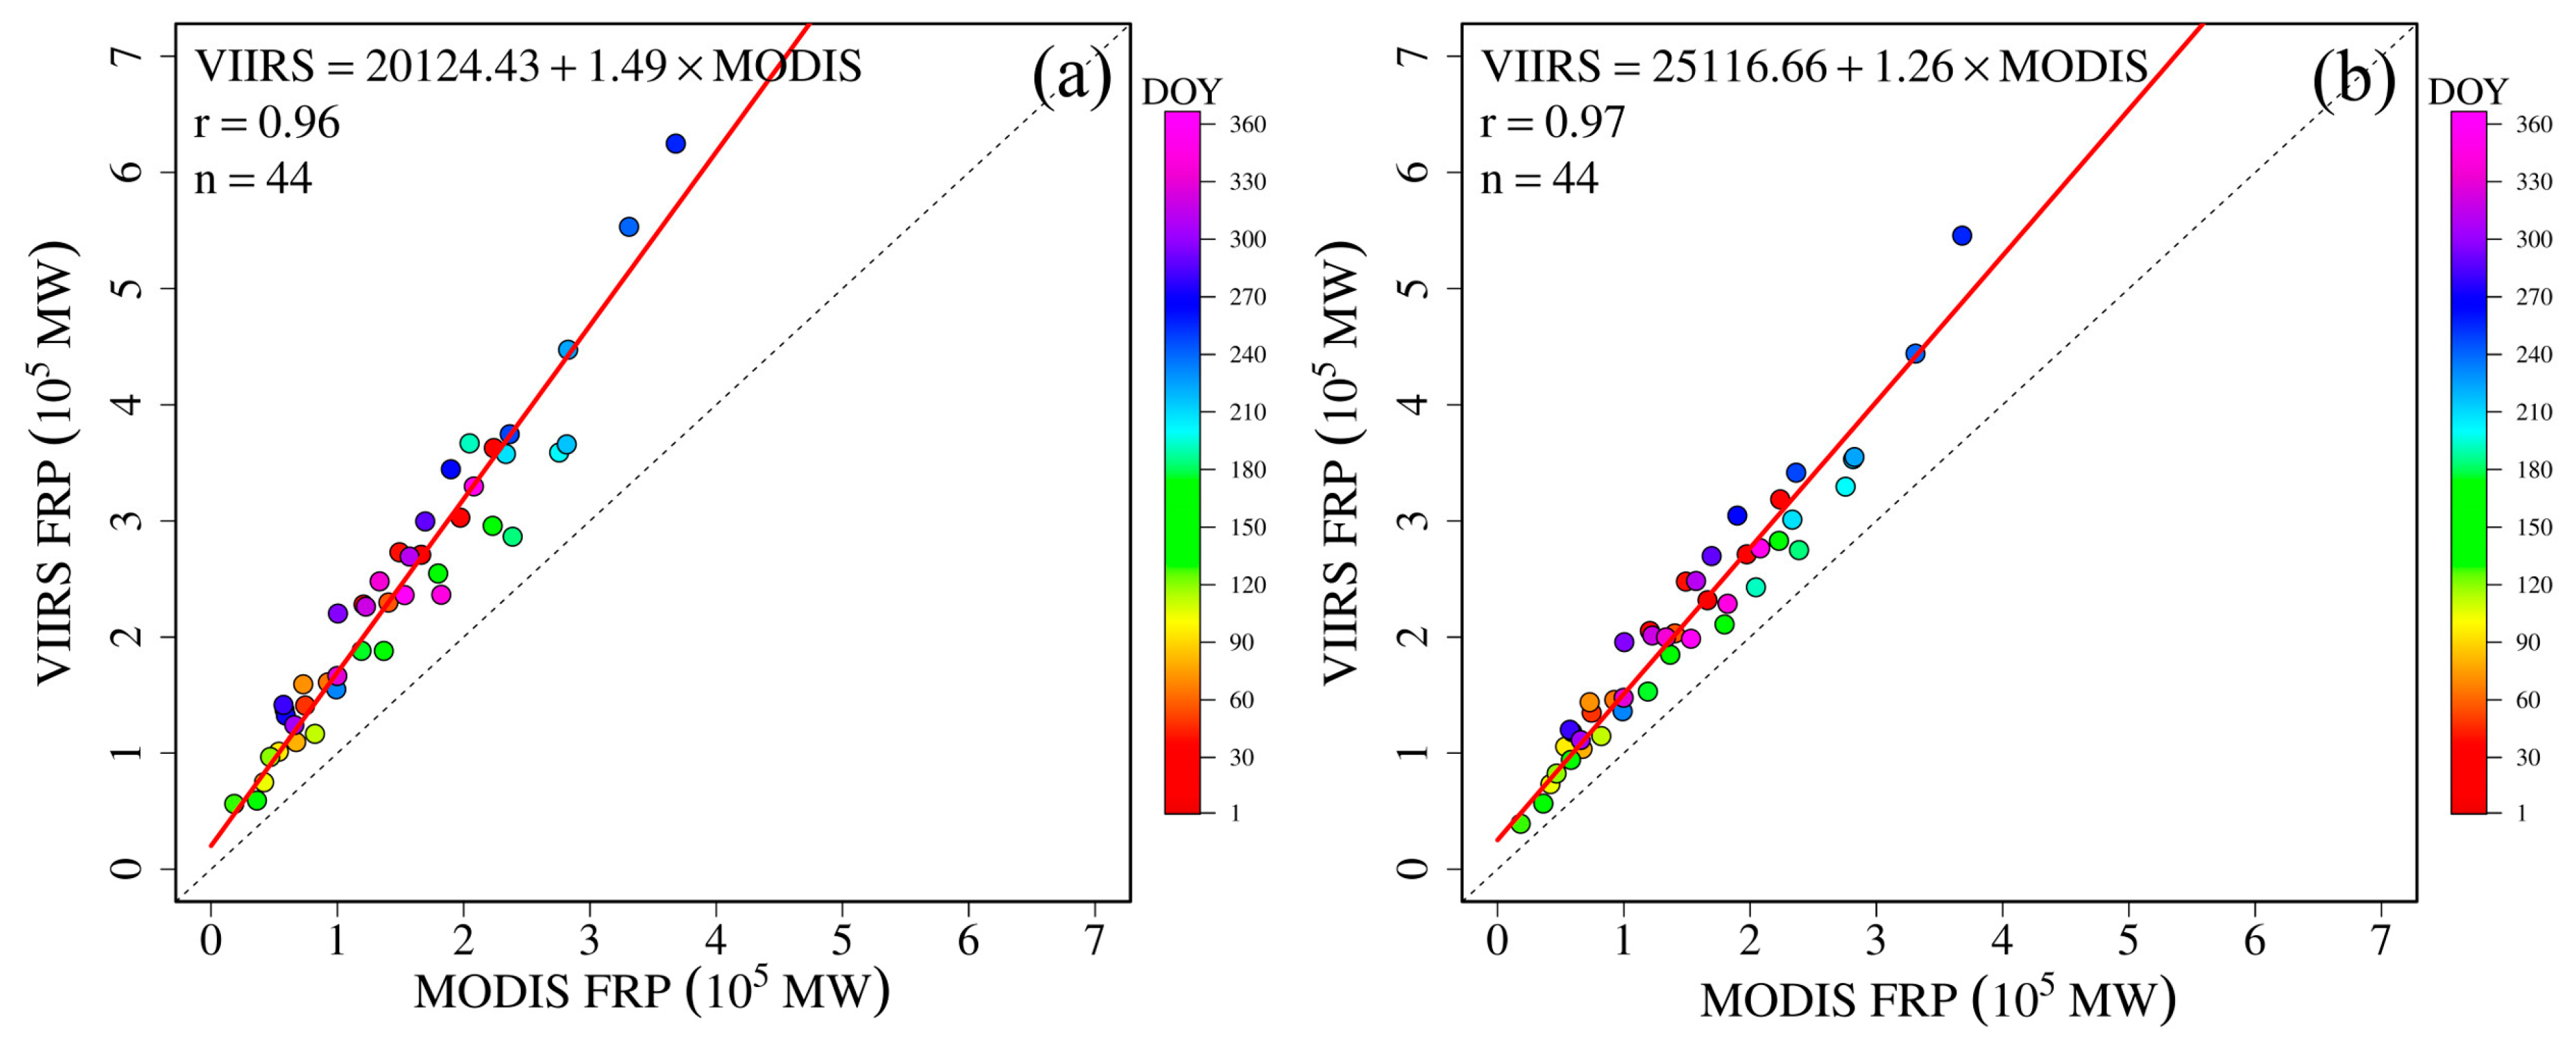
MODIS FRP is much smaller than VIIRS FRP on a continental scale in Africa. Linear regression shows that the daily sum FRP estimates from contemporaneous fire detections between MODIS and VIIRS are highly correlated (Pearson r > 0.95). However, their FRP value differs significantly. In comparison with the VIIRS sum FRP from VIIRS fire detections observed both inside and outside the MODIS swath gaps, MODIS sum FRP is approximately 49% smaller according to the regression slope, with a significant bias of 20124.43 MW that accounts for 13.5% of the daily mean of MODIS sum FRP or 8.3% of the daily mean of VIIRS sum FRP (Figure 5a). Comparing with only VIIRS sum FRP from VIIRS fire detections sensed outside MODIS swath gaps, MODIS sum FRP is approximately 26% smaller with a bias of 25116.66 MW that explains 16.8% of the daily mean of MODIS sum FRP and 11.8% of the daily mean of VIIRS sum FRP outside MODIS swath gaps (Figure 5b).
4.3. Grid-Level FRP
4.3.1. Missing MODIS FRP Due to Sampling Limitations
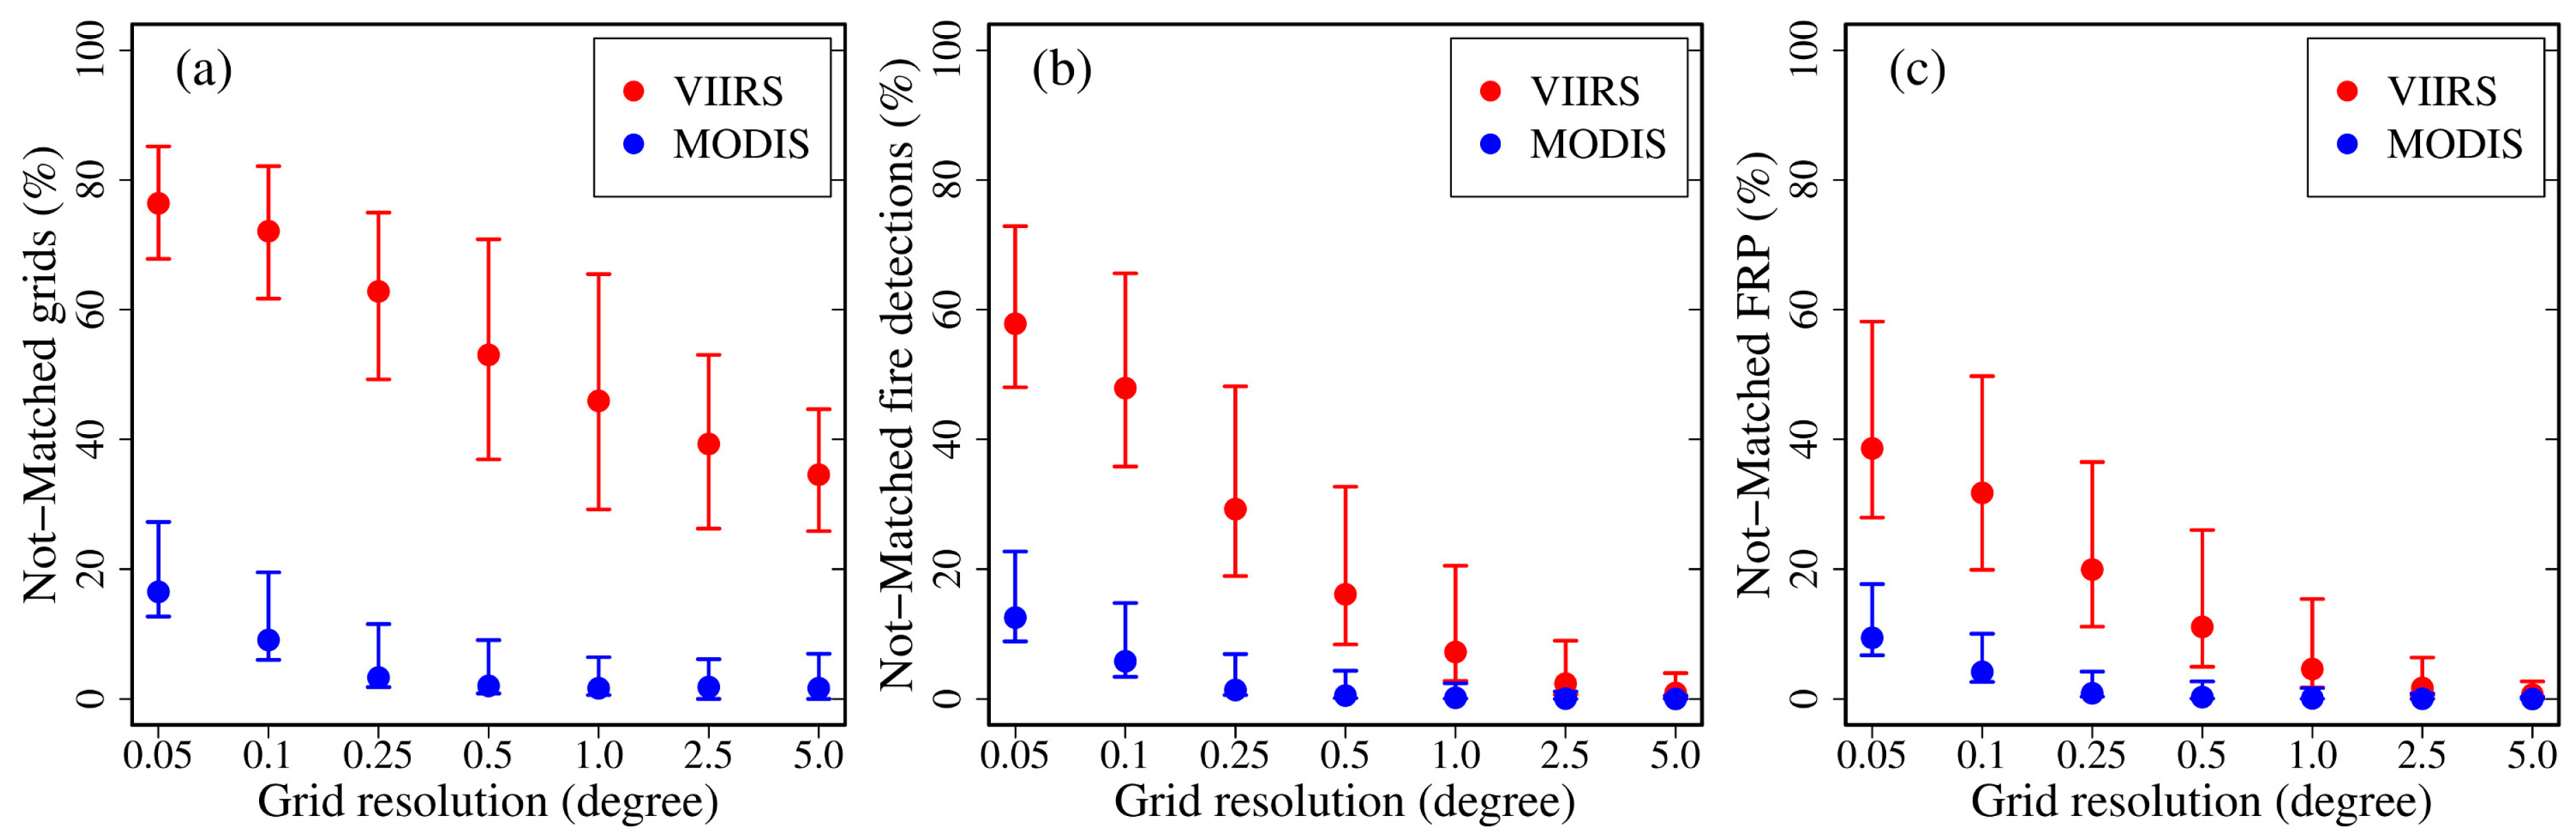
MODIS misses a considerable number of fire observations (counts) and FRP (Figure 6). At a grid size of 0.05°, Aqua MODIS has no fire detections in 76% of grids where VIIRS I-band senses at least one detection (Figure 6a) and fires detected by VIIRS in these grids account for 58% of daily VIIRS I-band fire detections (Figure 6b) and 39% of daily VIIRS sum FRP (Figure 6c) across Africa. Similarly, the VIIRS I-band observes no fires in 16% of grids where Aqua MODIS senses at least one fire detection (Figure 6a) and MODIS fire detections in these grids explain 12% of daily MODIS fire detections (Figure 6b) and 9% of daily MODIS sum FRP (Figure 6c). As grid size grows, the missing fire detections and FRP retrievals in the not-matched grids decrease sharply. For instance, when grid size grows to 0.25°, the number of VIIRS I-band fire detections missed by Aqua MODIS in the not-matched grids reduces to 28% (Figure 6b) accounting for 20% of daily VIIRS sum FRP (Figure 6c), while VIIRS merely misses <1% of daily Aqua MODIS fire detections (Figure 6b) and <1% of daily Aqua MODIS sum FRP. When grid size further grows to 5°, there are still 34% of grids where only VIIRS observes fires (Figure 6a) but these grids explain < 1% of daily VIIRS fire detections (Figure 6b) and < 1% of daily VIIRS sum FRP (Figure 6a).
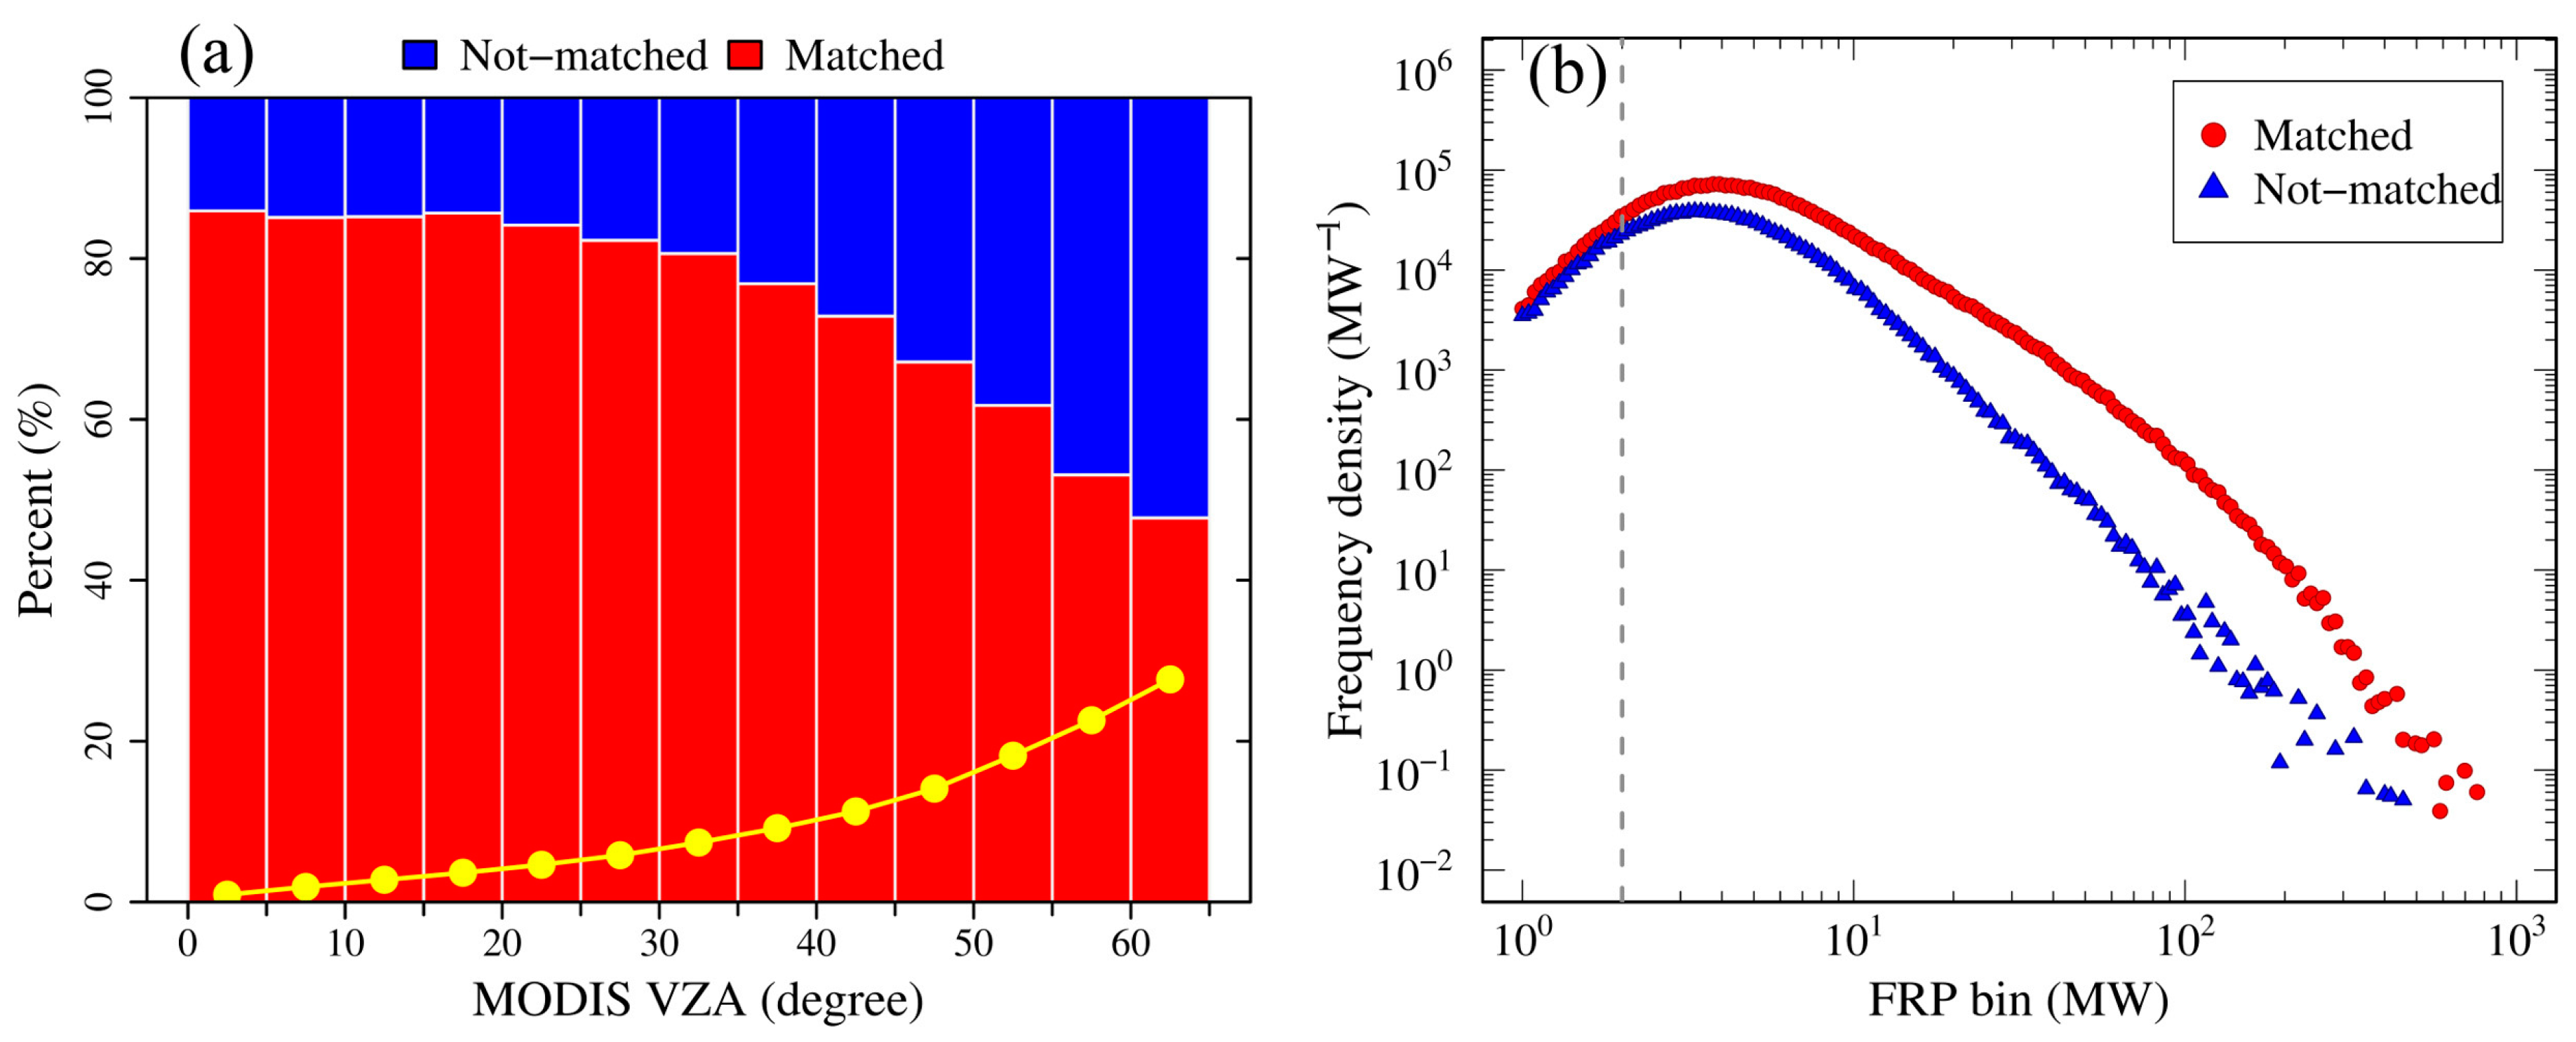
Missing MODIS fire detections increase along view angles and the missing fires generally have relatively small FRP values (Figure 7). At a 0.25° grid across Africa, the percent of VIIRS fire detections missed by Aqua MODIS in every 5° VZA increases from 14% to 52% as the MODIS view angle increases from nadir to the scan edge, with 79% of all the missing fire detections located in grids with MODIS VZAs > 30° (Figure 7a). The VIIRS fire detections missed by Aqua MODIS have an average FRP of 6.8 MW per fire pixel, which is much smaller than the average FRP (12.4 MW per fire pixel) of VIIRS fire detections observed by Aqua MODIS. Furthermore, the VIIRS FRP frequency density distributions indicate that MODIS observed and missed a similar number of VIIRS fires with FRP less than 2 MW but MODIS observed more VIIRS fires than missed ones with an FRP larger than 2 MW than it missed (Figure 7b).
4.3.2. Underestimation of MODIS Grid FRP and Adjustment Models
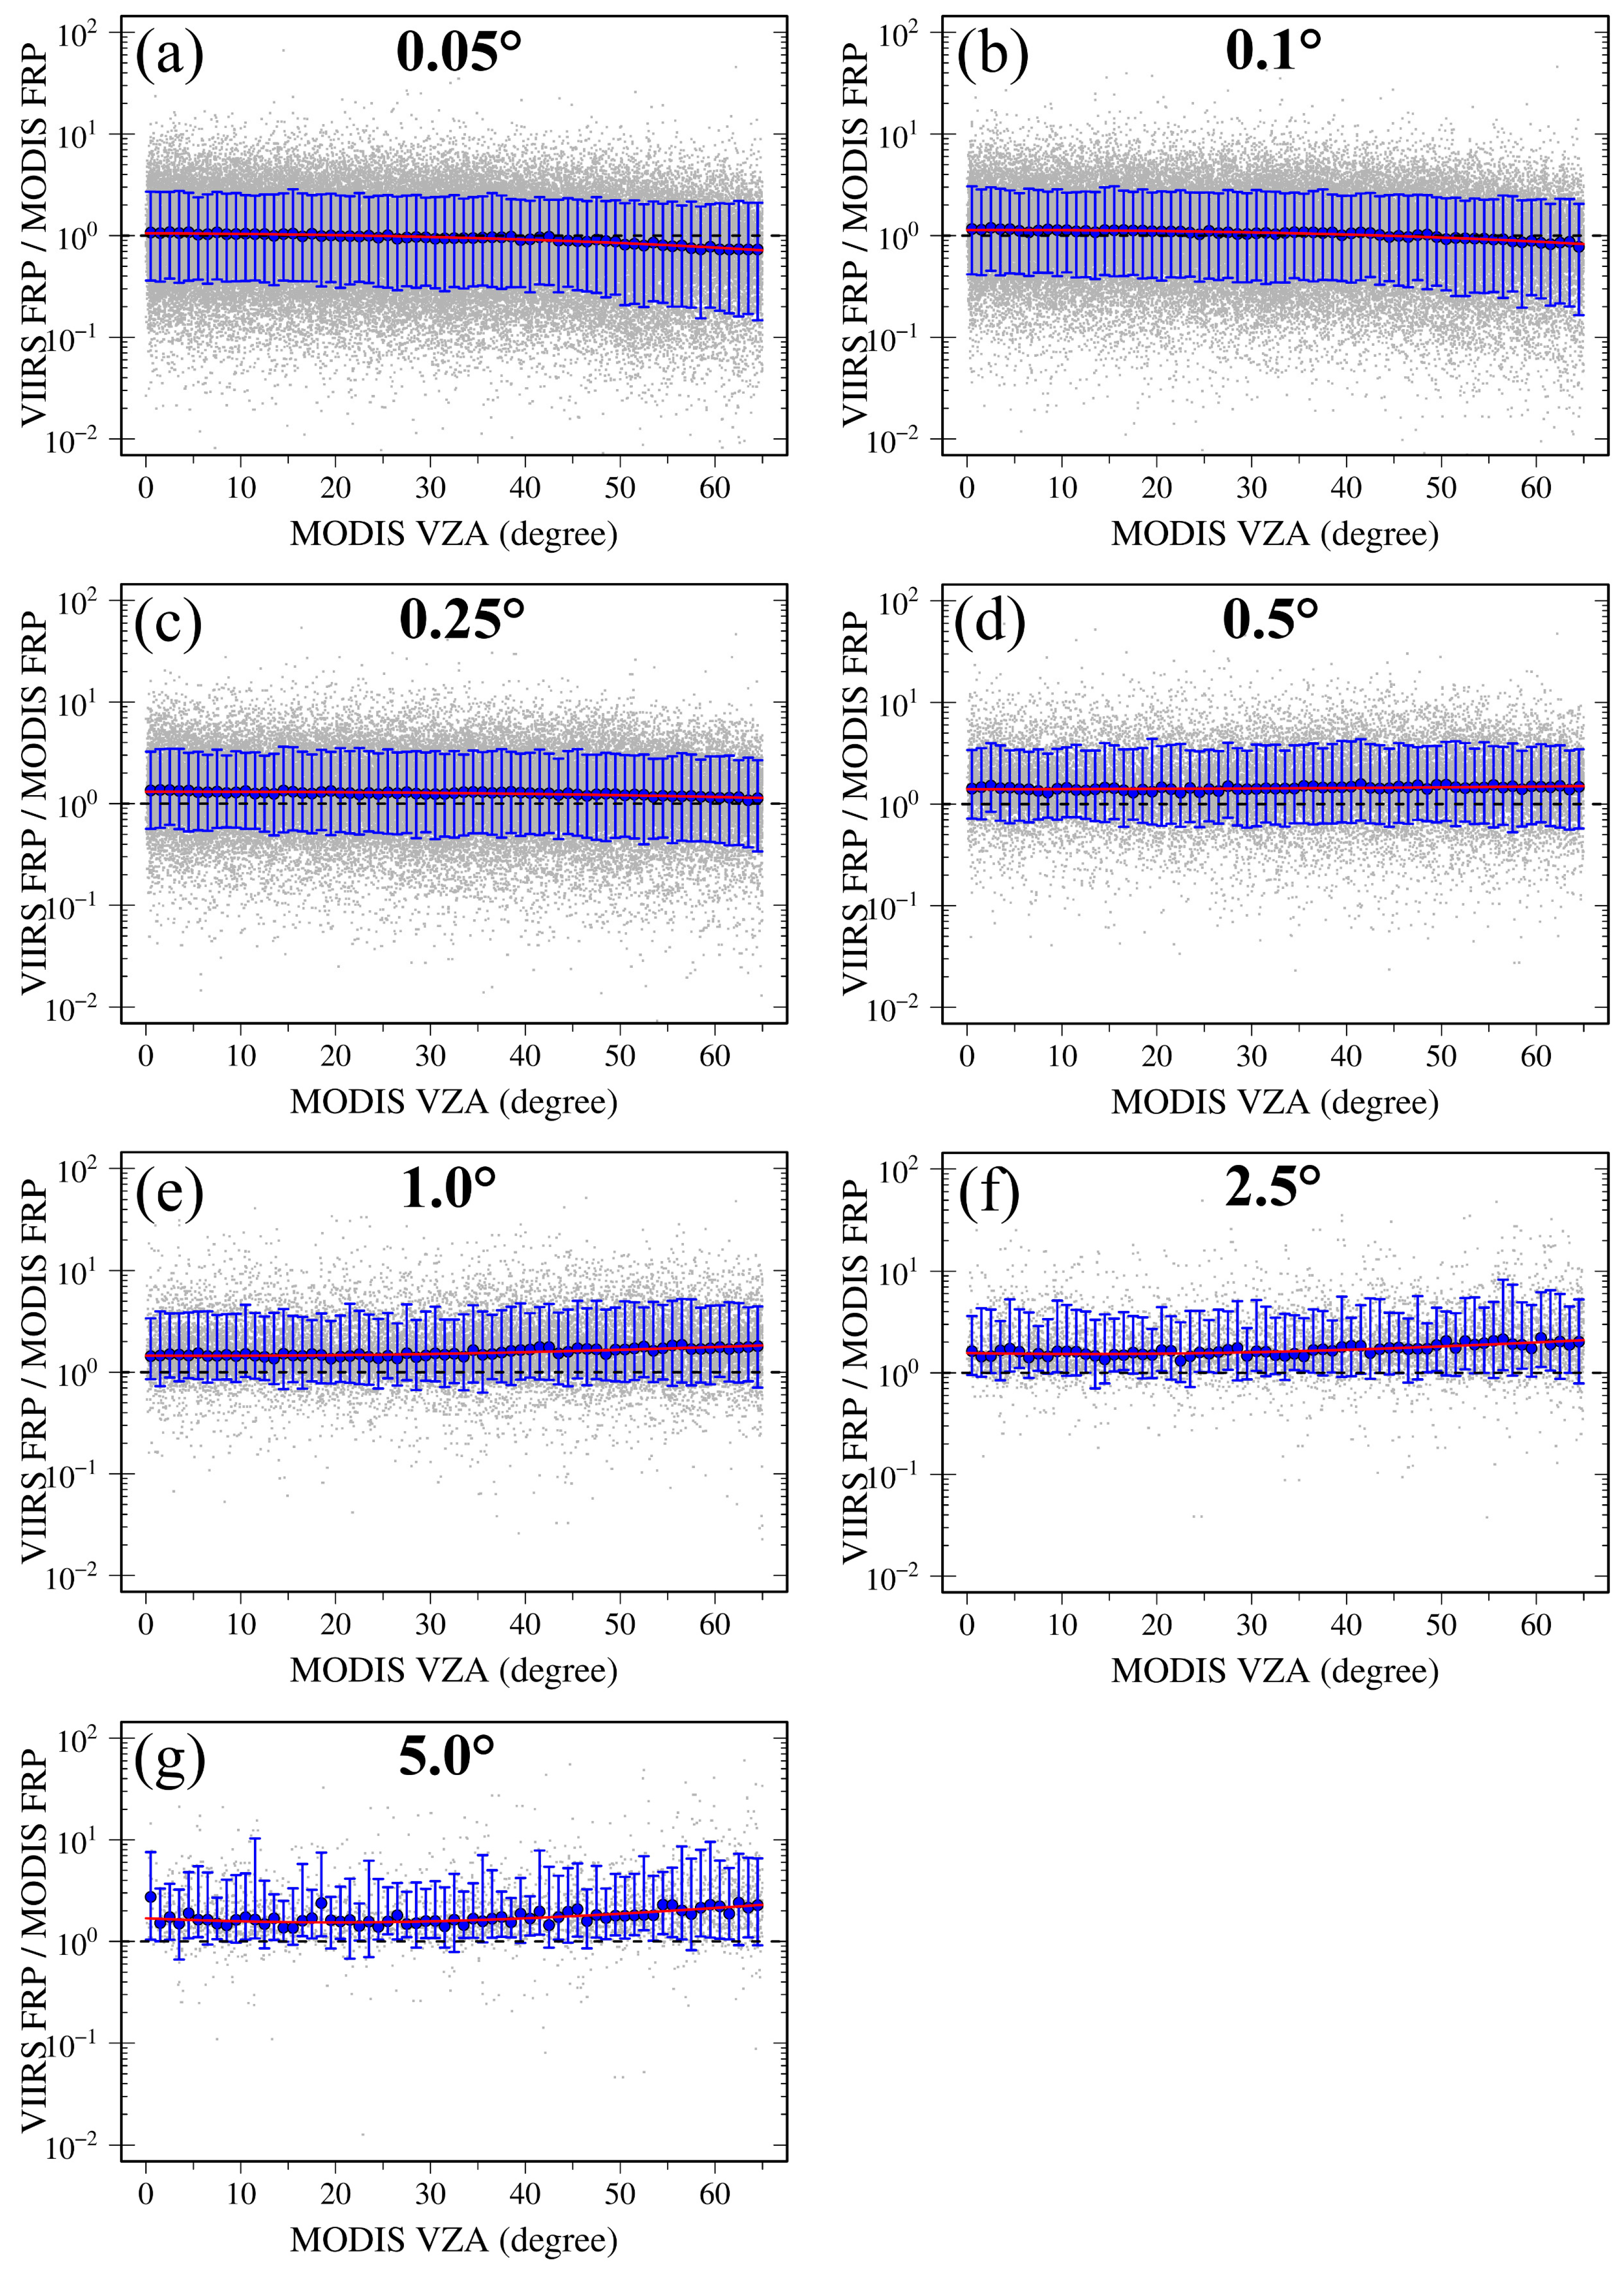
The relationship between MODIS and VIIRS grid FRP, characterized as the median FRP ratio of VIIRS to MODIS, varies with satellite VZA and grid size (Figure 8 and Table 1). Generally, the FRP ratio decreases slightly along VZA for grid size finer than 0.5° (Figure 8a–c), remains nearly constant at a grid size of 0.5° (Figure 8d, as also indicated by the fitted model and small r2 showing in Table 1), but increases for the grid size coarser than 0.5° (Figure 8e–g). At the finest grid size of 0.05°, the FRP ratio indicates that MODIS and VIIRS grid FRP are generally comparable in view angles close to nadir but VIIRS grid FRP becomes smaller in large view angles, although the ratio at individual grids varies largely from 0.1–10 (Figure 8a). As the grid grows to 0.25°, a commonly used resolution in biomass-burning emissions inventories, MODIS grid FRP on average is underestimated by 14–31% in all view angles relative to VIIRS grid FRP according to the FRP ratio (Figure 8c), in which MODIS misses 20% of VIIRS sum FRP (Figure 6b). At the coarsest grid size of 5°, the FRP ratio also reveals that MODIS FRP underestimation generally increases from 69–130% with VZA (Figure 8g). Consequently, the underestimation of MODIS grid FRP increases with the increase in grid size and VZA.
The VIIRS-to-MODIS FRP ratio is a function of satellite VZA at a grid size, which provides empirical relationships to adjust the underestimation of MODIS FRP partly at different resolutions (Table 1). All the best-fit models for the seven grid sizes show a high coefficient of determination (r2 ≥ 0.67) and small root-mean-square error (RMSE) (<0.146). Interestingly, the parameter β0, the bias of FRP ratio, which measures the degree of underestimation of MODIS grid FRP in nadir (VZA = 0°) underestimation of MODIS grid FRP (in nadir with VZA = 0°), increases significantly from 1.05 to 1.69 as grid size grows from the finest to the coarsest.
4.4. Missing FRP inside MODIS Swath Gaps
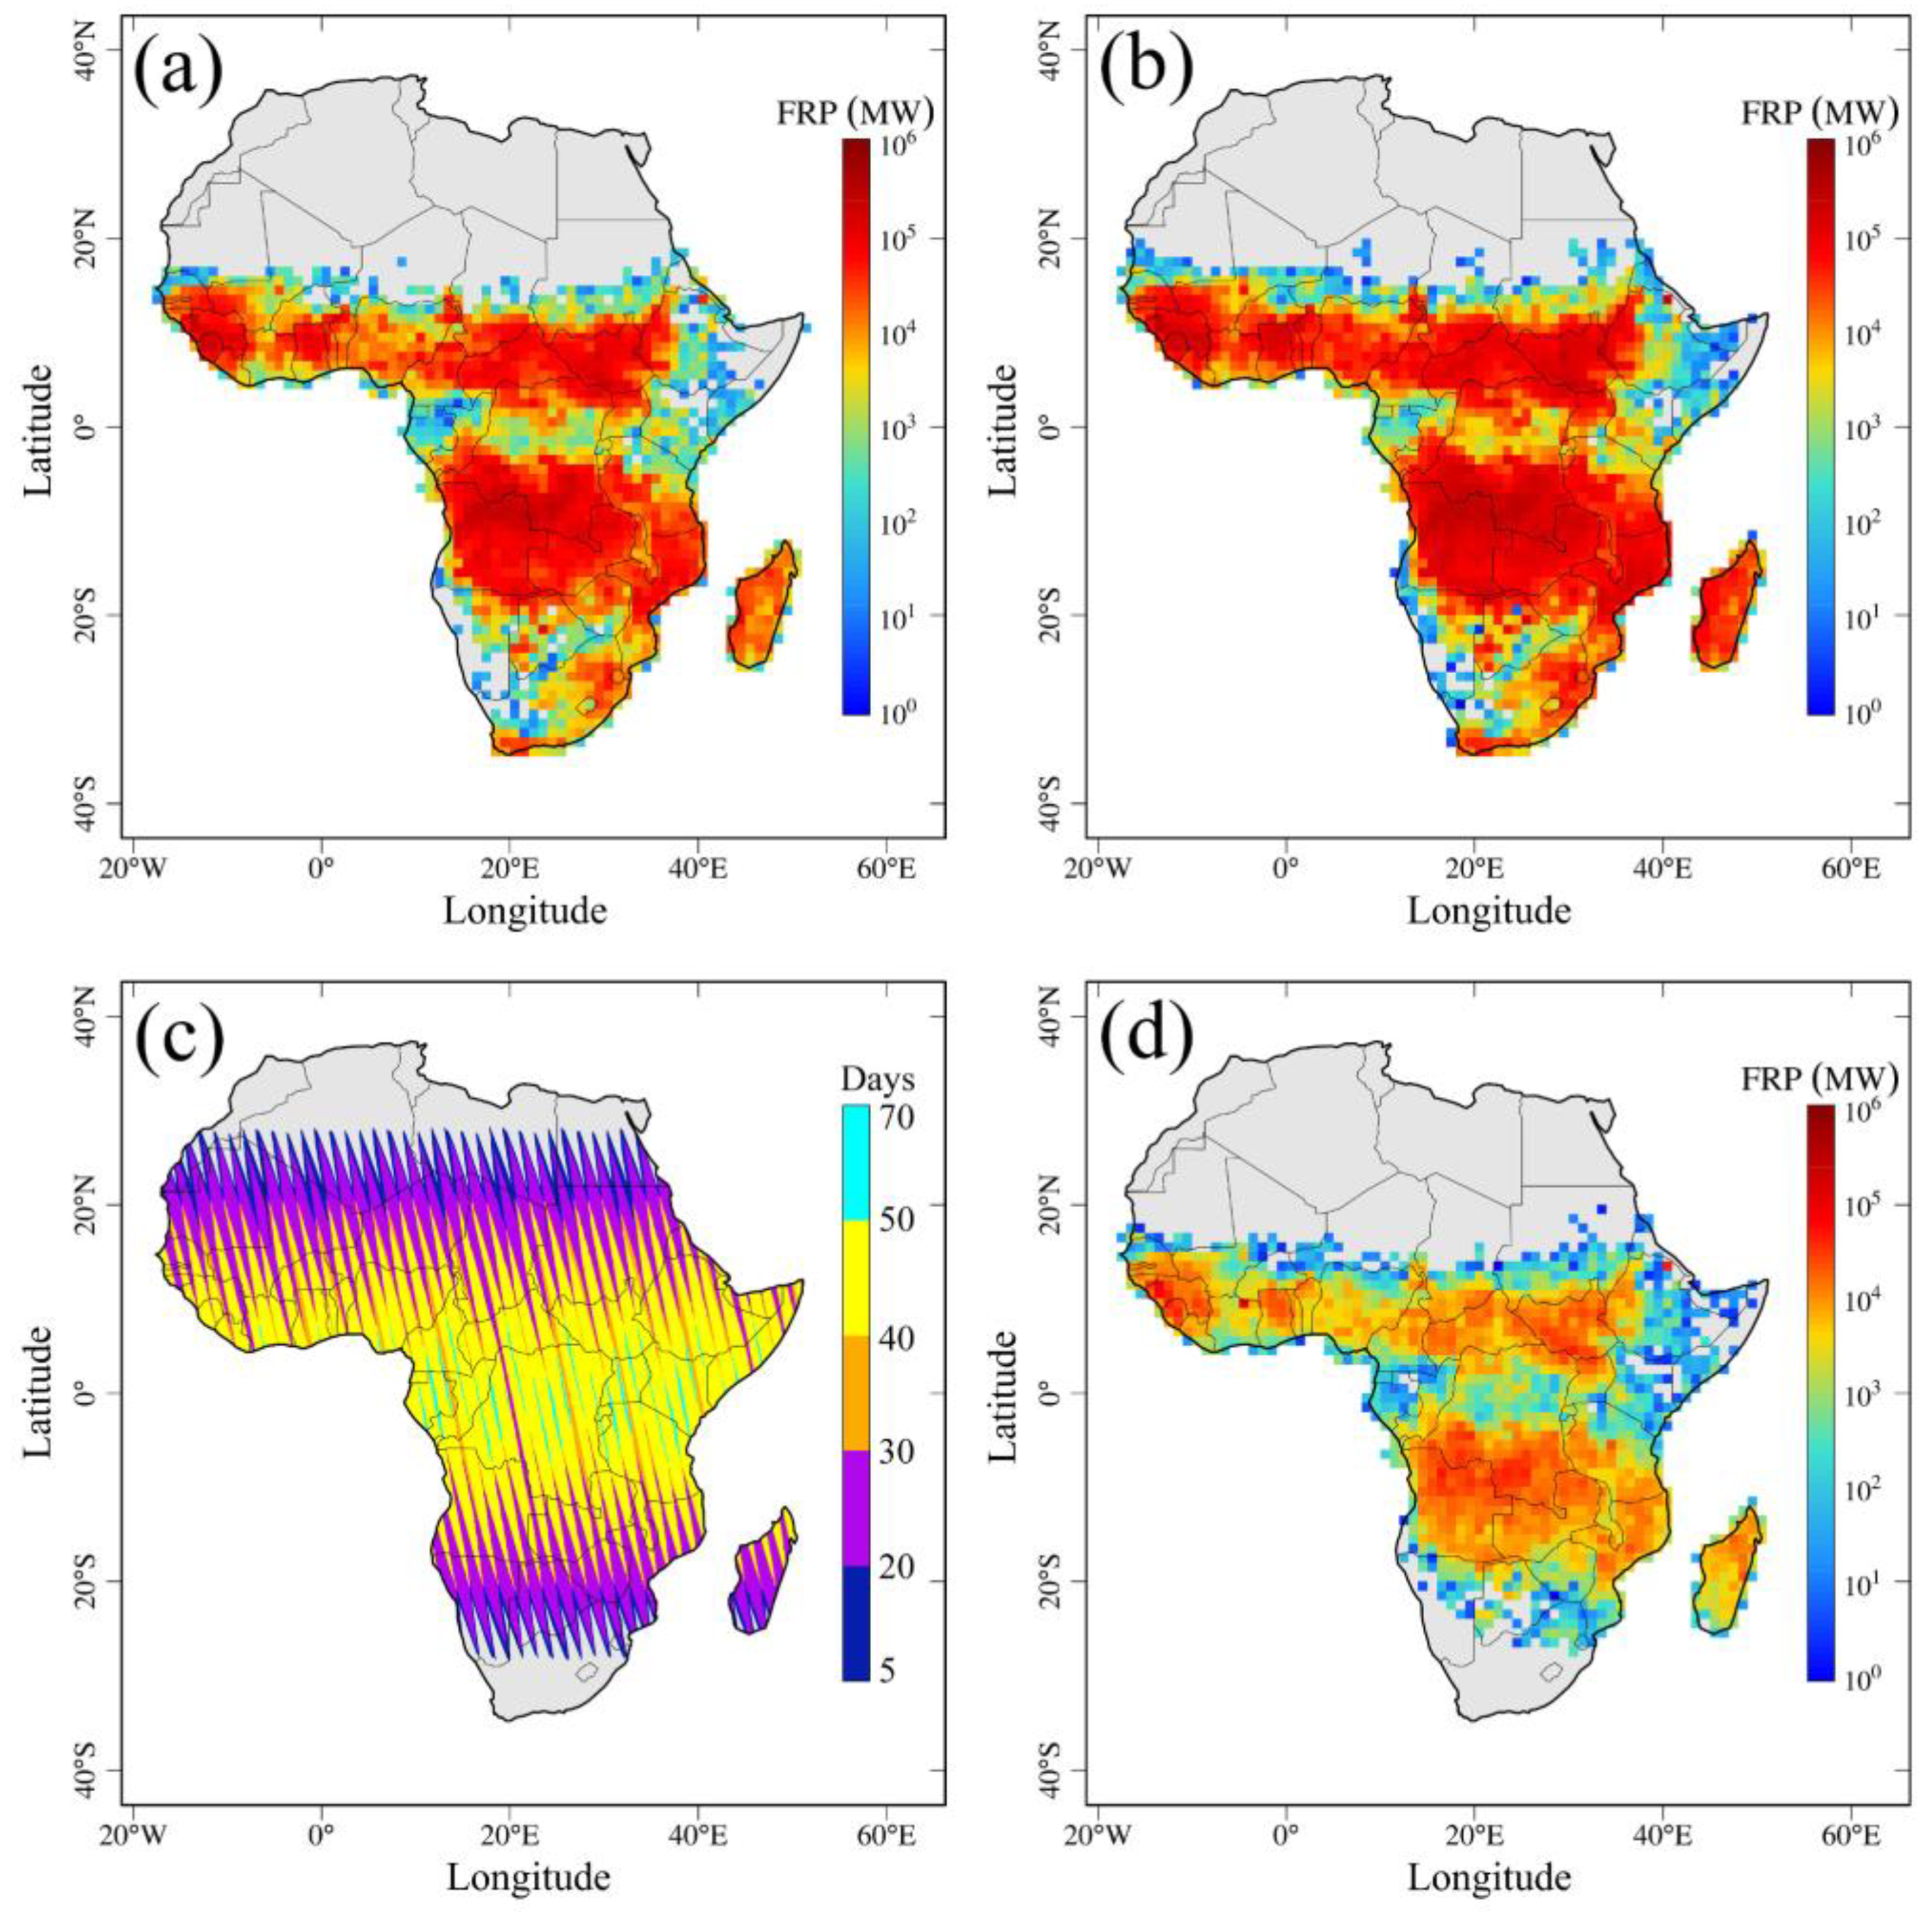
Active fires inside the MODIS swath gaps contribute substantial FRP. Figure 9a and b show yearly summed MODIS and VIIRS FRP at 1° grids in the MODIS observed area (outside swath gaps) in 2017. The FRP spatial pattern shows that fires mainly burn in areas between 4°N and 16°N in the Northern Hemisphere, Africa, and between 2°S and 20°S in the Southern Hemisphere, Africa.
Figure 9c shows that MODIS swath gaps occur in ~80% of the areas between 30°S and 30°N across Africa, of which 41% was not observed by MODIS for more than 30 days in 2017. Figure 9d shows the yearly summed VIIRS FRP observed inside MODIS swath gaps. It indicates that fires observed by VIIRS inside MODIS swath gaps account for 10.7% of yearly summed FRP (9.0 × 10⁷ MW) from all VIIRS fire detections across Africa. Indeed, MODIS could miss fire observations in most of the areas where a swath gap occurs, especially fire-prone regions with a highly frequent occurrence of gaps. Therefore, to a large extent, the amount of FRP missed by MODIS is related to fire frequency and the number of days when swath gaps appear.
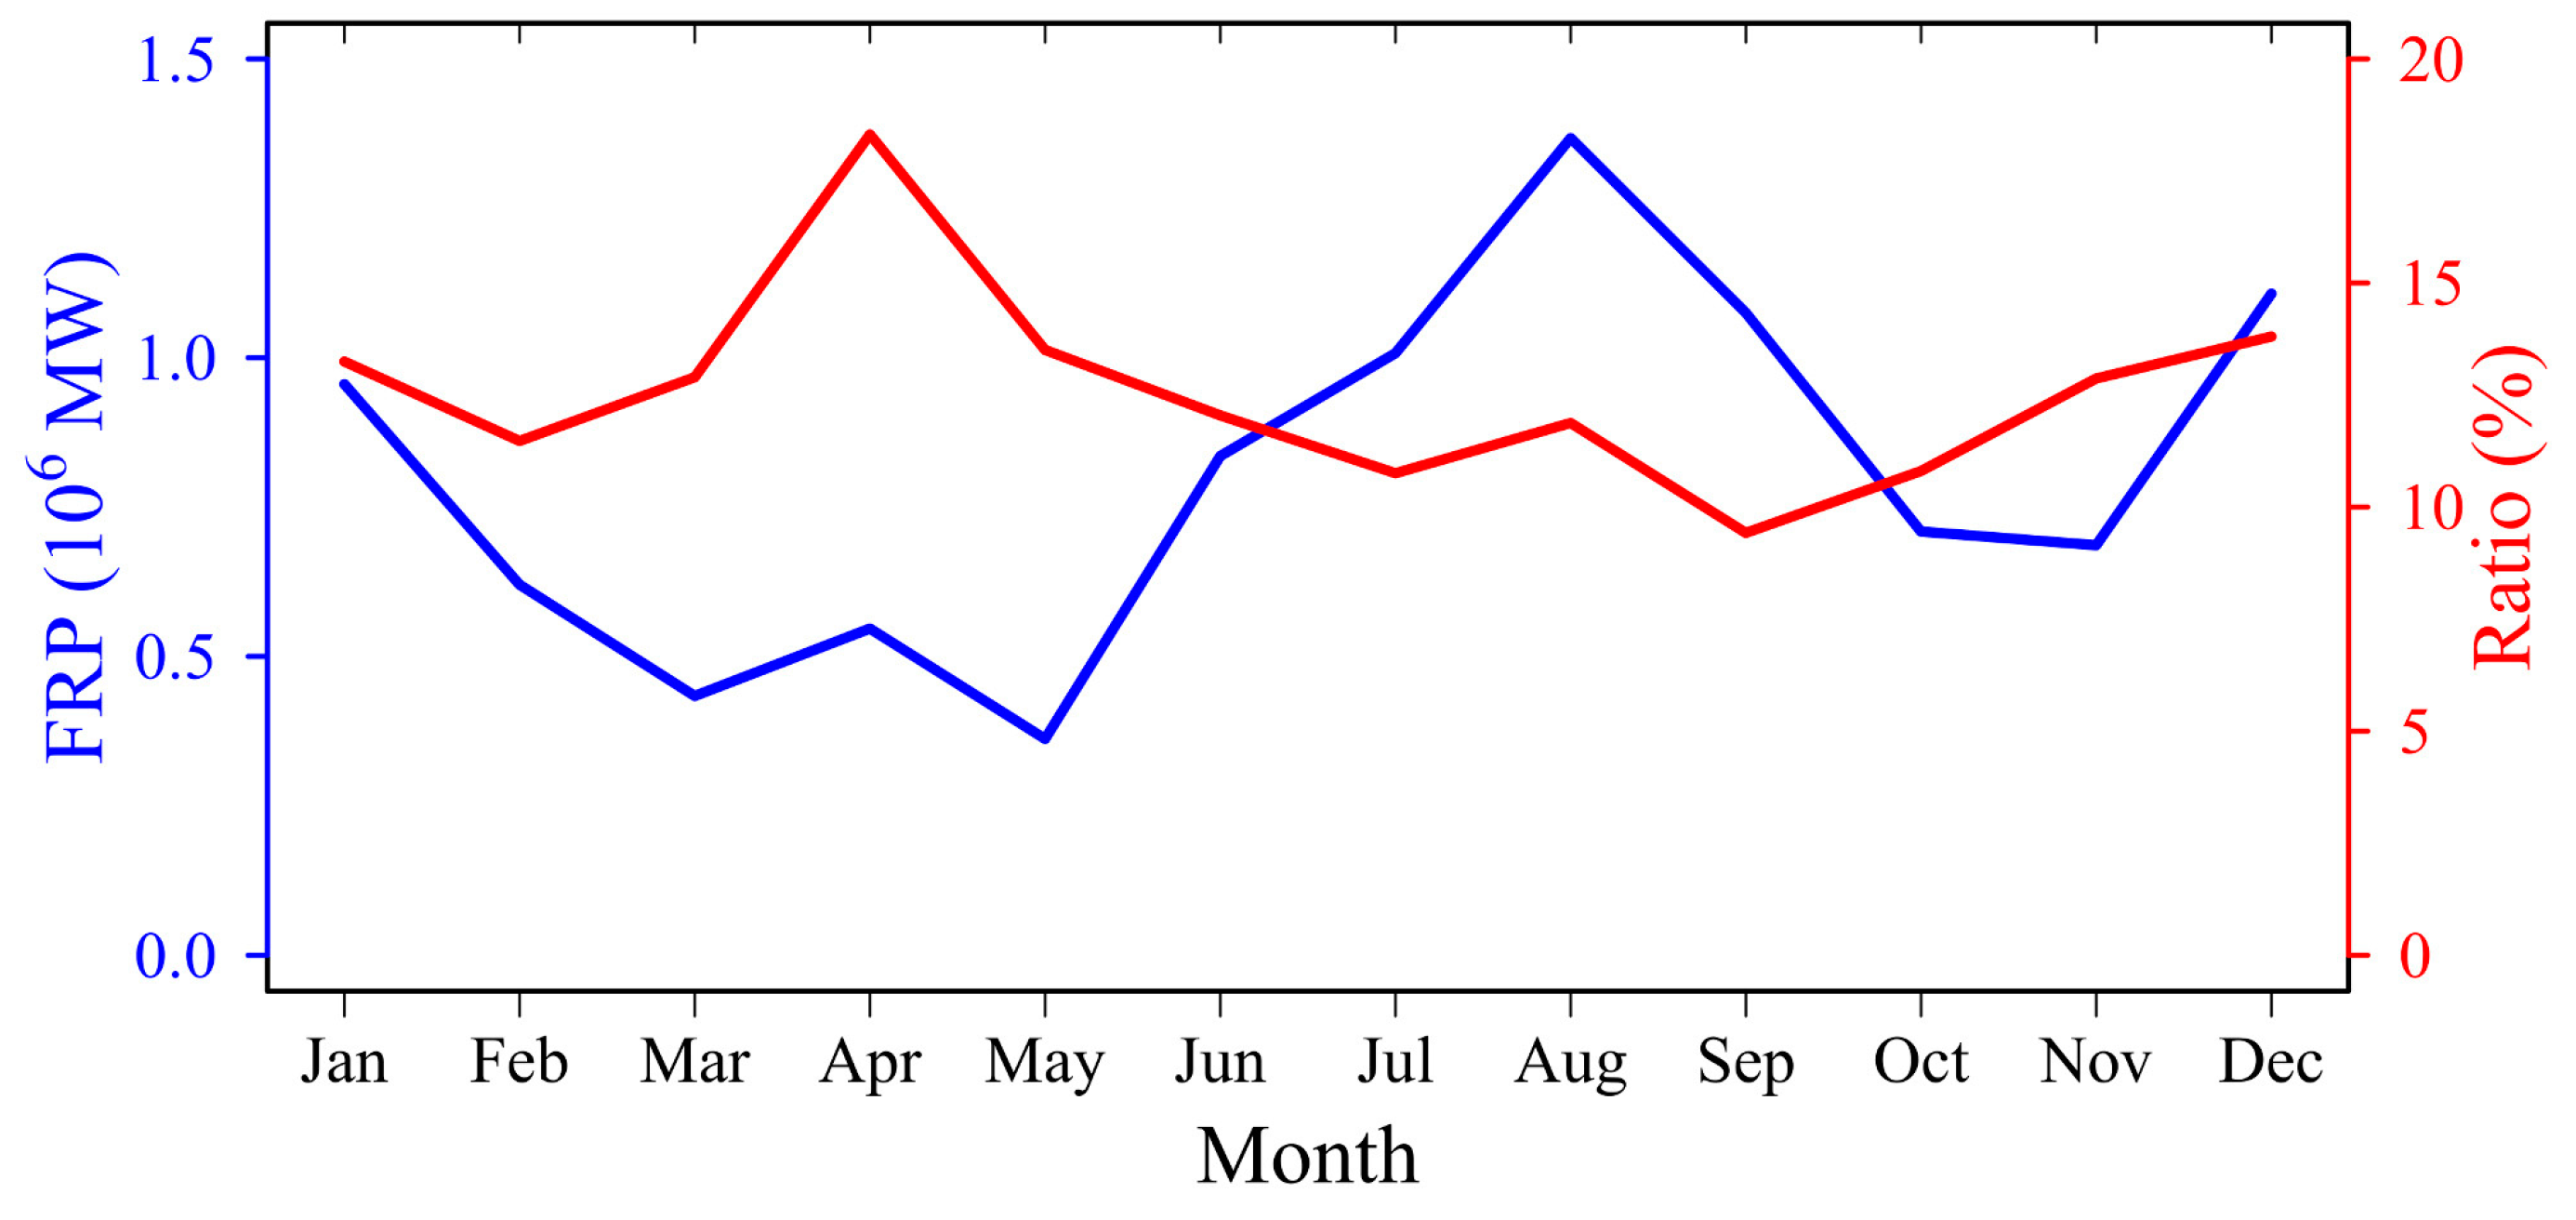
VIIRS FRP observed inside MODIS swath gaps varies seasonally (Figure 10). The monthly sum VIIRS FRP inside the gaps peaks in August and December when peak fire seasons generally occur in Southern and Northern Hemisphere Africa [52], which reflects that MODIS misses 0.4–1.4 ×10⁶ MW FRP monthly (an average of ~0.8×10⁶ MW). This monthly missing FRP in gaps explains 9.4–18.3% (an average of 12.5%) of monthly VIIRS FRP observed outside MODIS swath gaps. In, MODIS missing FRP accounts for 10.7% and 12.8% of VIIRS FRP observed outside swath gaps, respectively, in Southern Hemisphere Africa during fire season from July to October [52] and Northern Hemisphere Africa during fire season from November to March (next year). The relatively larger percent of missing FRP in Northern Hemisphere Africa is due to the fact that MODIS swath gap occurs in many more days over fire-prone regions in Northern Hemisphere Africa than that in Southern Hemisphere Africa (Figure 9c).
5. Discussion
The MODIS sensor has a relatively low fire detection capability and misses a large portion of FRP observations relative to the VIIRS I-band sensor. The minimal FRP (per fire pixel) across swath suggests that the MODIS sensor misses fires with intensity less than ~4.3 MW at nadir and ~31.7 MW at the scan edge (Figure 4a), whereas VIIRS I band (375m) can detect approximate 3-11 times smaller fires (Figure 4b). Across the African continent, fires missed by MODIS result in the underestimation of MODIS FRP by 42.8% (26% + bias interpreted as 16.8% of daily mean MODIS FRP in Figure 5b) because fires with FRP<31.7 MW account for a significant portion of all fires as indicated by VIIRS FRP frequency density distributions (Figure 7b). Our previous comparison between MODIS and VIIRS M-band FRP suggests that the daily MODIS sum FRP is only underestimated by approximately 10.5% across Africa [32]. Thus, much more underestimation of MODIS FRP is revealed by comparing with VIIRS I-band FRP. Similar findings on underestimation of MODIS FRP have also been demonstrated in cropland fires [43,44]. For example, compared with the Aqua MODIS monthly summed FRP in agriculture burnings, VIIRS I-band measures 120% more FRP in Punjab, India [44], and synthesized VIIRS I-band and M-band radiances measure FRP about six times larger in eastern China [43]. Additionally, it is worth noting that, for relatively small fires detected by the MODIS sensor, high albedo across the fire-prone Africa savannas also causes uncertainty in MODIS FRP retrievals [54,55].
Furthermore, missing MODIS FRP due to relatively lower fire detection capability is also evident at the grid level. For a given grid size from the finest 0.05° to the coarsest 0.5°, MODIS senses no fires in a large number of grids where only VIIRS has fire detections (Figure 6). It indicates that VIIRS senses many more fires with FRP beyond MODIS fire detection capability. These MODIS missing fires occur in many areas across Africa, as suggested by the large percentages of grids where only VIIRS senses fires (Figure 6a). For example, the percentage is still 34% even at a grid size of 0.5° (Figure 6a), although fires in these grids contribute to a very small portion of daily VIIRS sum FRP (Figure 6b,c). In addition, the increase in the ratio of VIIRS to MODIS grid FRP with view angles suggests that MODIS misses more FRP at large view angles than in nadir as its detection capability reduces at off nadir. For example, as grid size grows larger than 1.0° (Figure 6), the underestimation of MODIS FRP could increase by up to ~60% at the scan edge relative to in nadir (Figure 8e,f).
MODIS FRP underestimation due to relatively low detection capability can be partly mitigated. At a continent scale, daily MODIS FRP underestimation can be directly adjusted based on the derived relationship between MODIS and VIIRS FRP illustrated in Figure 5b. This adjustment undoubtedly improves the estimation of total biomass-burning emissions from MODIS FRP across Africa. On a grid level, the fitted models at seven different grid resolutions can be applied to adjust MODIS FRP in grids where MODIS senses fires. Indeed, these fitted models can help to adjust grid-based MODIS FRP that is used in most of biomass-burning emissions inventories at a grid resolution from 0.1°–1.0°, including GBBEPx—Global Biomass Burning Emissions Products [28]—GFAS—the Global Fire Assimilation System [24]—and FEER—Fire Energetics and Emissions Research [26]. For example, at the grid size of 0.5° the model can improve MODIS FRP by 40–50%. It is worthwhile to note that there is a trade-off between grid size and degree to which the MODIS FRP underestimation can be adjusted. At a fine grid resolution (e.g., 0.25°), there is a considerable number of grids with only VIIRS fire detections but without MODIS fire detections. In these grids, the missing MODIS FRP cannot be adjusted using the corresponding models that require FRP values available from both MODIS and VIIRS fire detections. For the grid size being larger than 2.5°, almost all grids contain both VIIRS and MODIS fire detections. In this case, the fitted models can be applied to improve MODIS FRP underestimation at almost all coarse grids, but spatial details are missed relative to fine-resolution ones. Therefore, choosing an appropriate grid resolution to adjust the MODIS FRP underestimation depends on the application purposes.
The FRP comparisons in different grid resolutions provide direct evidence to evaluate the published methods for adjusting the bow-tie effect caused MODIS FRP underestimation. First, our results show that MODIS FRP in 0.5° grids is relatively underestimated by 40–50% compared to VIIRS (Figure 8d and Table 1). This is very similar to the previous finding that MODIS FRP at a 0.5° grid could be improved by 44% across Africa by correcting the MODIS bow-tie effect [30]. However, this study indicates that the MODIS FRP underestimation should be attributed to two factors: (1) the MODIS bow-tie effect and (2) the MODIS coarser-resolution effect relative to VIIRS I-band in nadir. In other words, VIIRS I-band, theoretically, is able to sense smaller and/or cooler fires than MODIS even at nadir, although both sensors observe fires in the same grid. Thus, it is likely the algorithm of bow-tie correction [30] could overestimate MODIS FRP.
Second, Kaur et al. [33] correct the MODIS bow-tie effect on FRP by mapping the CDF of grid FRP at large VZA to nadir and find that MODIS FRP could be improved by up to 44% for 1° grids with a VZA > 55°. Our results show that MODIS FRP is underestimated by 47–85% relative to VIIRS in 1° grids as VZA varies from nadir to the scan edge. Because VIIRS fire detection capability is almost consistent across VZA (Figure 1 and Figure 4b), it can be derived that the underestimation of MODIS FRP attributed to VZA effect could be as large as 38% (38% = 85% − 47%), which is slightly smaller than the 44% found by Kaur et al. [33]. However, MODIS FRP in nadir is still underestimated by 47% compared to VIIRS FRP.
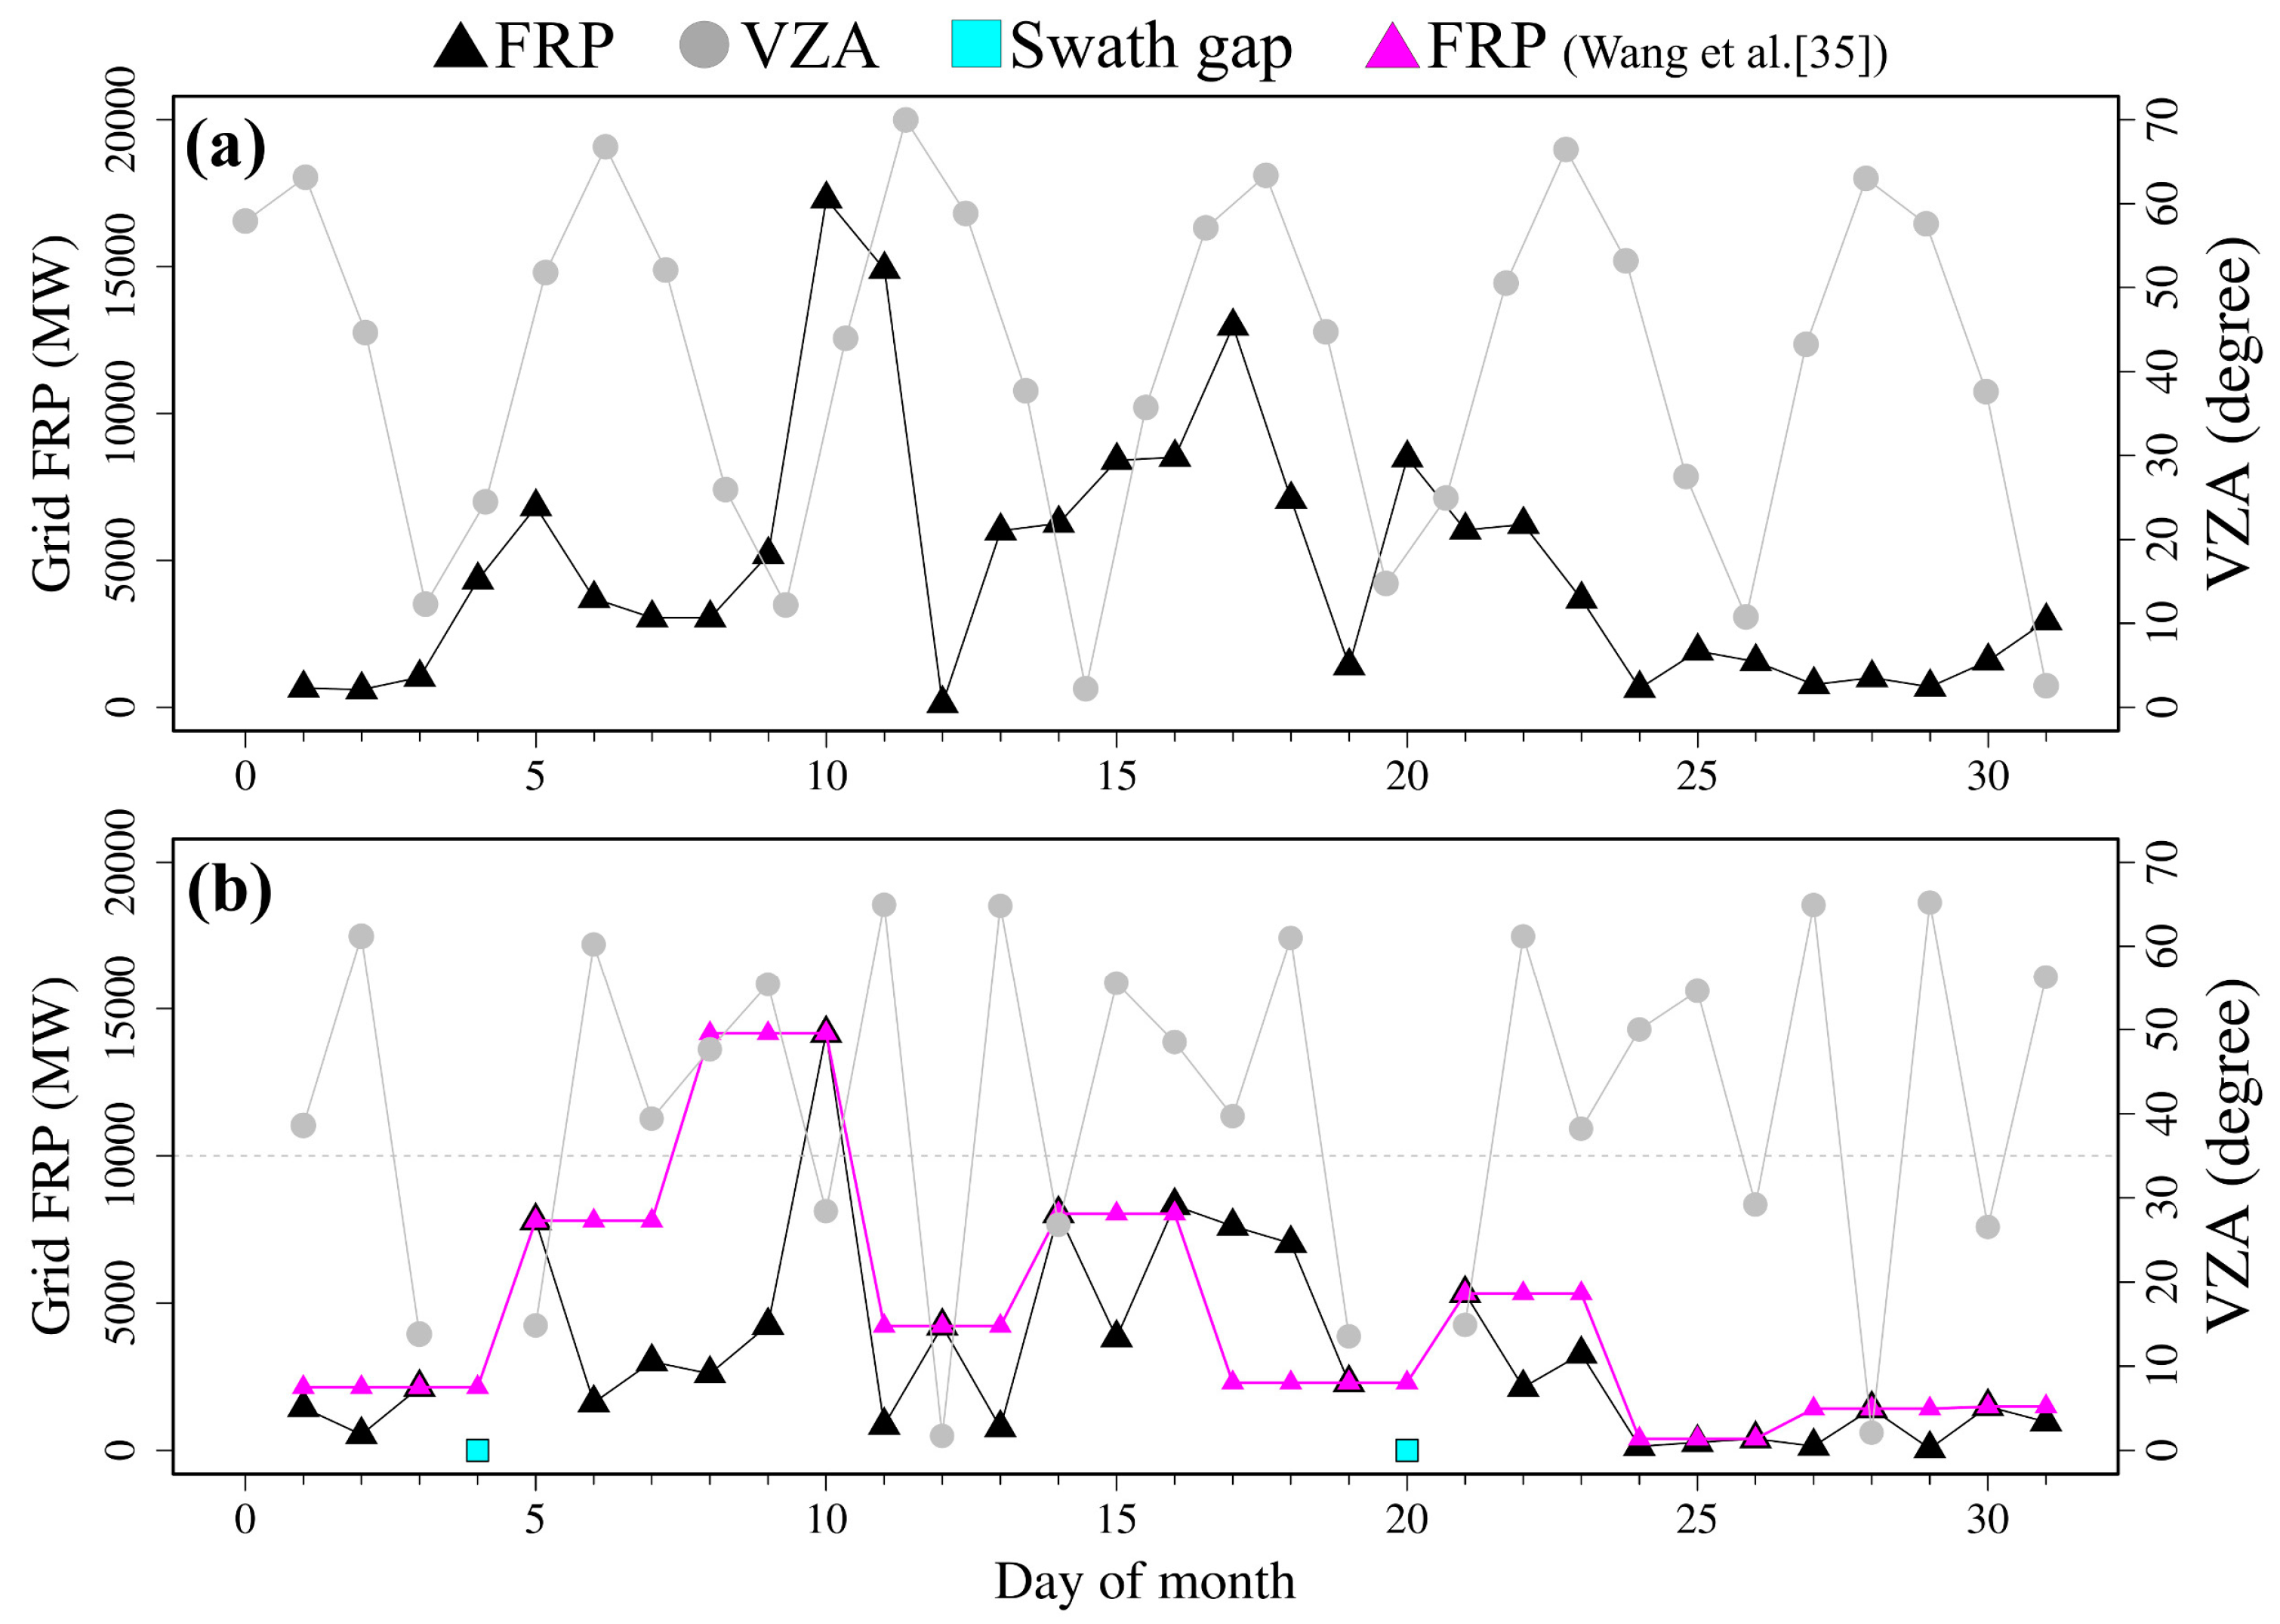
Third, Wang et al. [35] corrects MODIS FRP at large view angles (VZA>35°) in 27 km × 27 km grids by using FRP at smallest VZA observed within two days and finds that emissions estimates could be increased by a factor of two across Northern Hemisphere Africa, including the FRP improvements by correction of clouds and swath gaps. However, our results show that MODIS grid FRP on average is smaller than VIIRS grid FRP by up to 31% at a grid resolution of 0.25° (~25 km at the equator, Figure 7c). Even when all VIIRS I-band FRP inside and outside MODIS swath gaps across Africa are considered, the continental-scale MODIS FRP is relatively underestimated by ~62.5% (49% + bias interpreted as 13.5% of daily mean MODIS FRP in Figure 5a), much smaller than the difference of a factor of two. It is likely that the assumption proposed by Wang et al. [35] for correcting MODIS FRP at large VZA and swath gaps may not work well and could overestimate MODIS FRP. This is demonstrated in Figure 11, which shows the variations of mean VZA and daily FRP of MODIS and VIIRS I-band in a 1° grid centering at 30.232°E and 4.139°N in January 2017. The grid FRP estimates from the two sensors show similar temporal patterns, although MODIS swath gap occurred on January 4 and 20. According to the assumption in Wang et al. [35], MODIS FRP requires correction for a total of 23 days in January 2017. The correction of VZA and swath gaps obviously results in the overestimation of MODIS grid FRP and alters a temporal pattern compared to the observed VIIRS grid FRP, especially during days from Jan 5-10 and Jan 15-20 (Figure 11).
The MODIS equatorial swath gaps also significantly affect its observation of actively burning fires at low latitudes. By referencing to VIIRS FRP, MODIS swath gaps result in a mean monthly omission error of ~12.5% in MODIS FRP, which varies largely in different seasons. It is similar to a previous finding that swath gaps explain 14% of omission error by comparing MODIS fire detections with field observations in the Yucatán forest, Mexico [38]. At low latitudes, it is well known that cloud obscuration is one of key factors that limit fire observations [56]. For instance, cloud contamination could lead to an omission error of 11% in MODIS fire detections across the Amazon region [56], which is very close to the omission error caused by swath gaps. Thus, MODIS swath gaps play an equally important role in affecting MODIS active fire data as clouds. Therefore, the prediction of MODIS missing FRP inside swath gaps for historical MODIS fire data during the past two decades could significantly improve the estimation of biomass-burning emissions and benefit related applications.
Mitigation of the swath-gap-caused underestimation of MODIS FRP is very challenging. Although MODIS swath gap has been a known problem in fire detection since the first release of the MODIS active fire product [57], very limited studies have investigated potential approaches to mitigate the swath gap effect on MODIS FRP. For any day without valid observations due to swath gaps, a commonly used strategy is to use the FRP observations of the previous day (or previous days with the minimal VZA) directly [24,35]. This approach could largely underestimate or overestimate the missing FRP inside swath gaps, as illustrated in Figure 11, because burn sites most likely do not persist from day to day due to human activity and changes in fire weather [36]. For the time period with the VIIRS fire observations available, a potential mitigation approach is to examine the daily FRP relationship between the MODIS and VIIRS sensors over the areas outside swath gaps and apply it to predict FRP missed by MODIS inside swath gaps.
6. Conclusions
MODIS FRP has been applied to estimate biomass-burning emissions [24,25,26,27,28,29] and generate global emissions products [24,26,28] for nearly two decades. However, MODIS misses a large amount of small and cool fires because of a coarse pixel size of 1.0–4.83 km [30,31,32,33] and all fires inside MODIS swath gaps [35,40], which could result in a significant omission of actively burning fires, and the underestimation of emissions subsequently. This is especially noticeable in Africa where fires have characteristics of low-to-moderate intensity and high frequency [58] and release more than half of global biomass-burning emissions [6].
This study investigates FRP observations missed by Aqua MODIS due to sampling limitations and swath gaps using the S-NPP VIIRS I-band (375 m) active fire data across Africa. The variation of pixel-level minimum, mean, and maximum FRP across swath indicates that MODIS detection capability decreases sharply while that of VIIRS is generally consistent as view angle increases from nadir to the scan edge. The dependence of the MODIS and VIIRS fire detection capability on view angle is expected to be validated in the next step using the airborne-based very-high-resolution FRP observations during the NASA and NOAA lead 2019 FIREX-AQ (Fire Influence on Regional to Global Environments and Air Quality) field campaign [59]. Comparing FRP from fire detections observed contemporaneously by MODIS and VIIRS for the whole Africa continent and in seven grid sizes from 0.05°–5° quantifies the underestimation of MODIS FRP. On a continental scale, MODIS underestimates FRP by at least 42.8% relative to the contemporaneous VIIRS FRP. In grids, MODIS misses more than half of VIIRS fire detections and ~39% VIIRS FRP in 0.05°grids, although the missing rate decreases with grid size. The MODIS FRP underestimation could be partially mitigated using FRP adjustment models established from VIIRS-to-MODIS FRP ratio at seven different grid sizes, separately. Moreover, MODIS misses a large number of fires inside its swath gaps, where the missed FRP accounts for 12.5% of VIIRS FRP observed in the areas outside swath gaps. The missing MODIS FRP could be predicted using VIIRS fire data if available. Overall, the significantly large underestimation of MODIS FRP found in this study provides crucially quantitative information for understanding the uncertainties in the MODIS FRP and the related applications, especially biomass-burning emissions estimation. These uncertainties could be significantly improved by using the FRP adjustment models developed in this study.
Author Contributions
Conceptualization and methodology, F.L. and X.Z.; writing, F.L., X.Z., and S.K. All authors have read and agreed to the published version of the manuscript.
Funding
This study is funded by NOAA contract NA14NES4320003.
Acknowledgments
The manuscript contents are solely the opinions of the author(s) and do not constitute a statement of policy, decision, or position on behalf of NOAA or the U.S. Government. The raw input datasets (Aqua MODIS C6 MYD14 and MYD03, and Suomi NPP VIIRS I-band VNP14IMG) used in this study are available for the public at NASA’s Level-1 and Atmosphere Archive and Distribution System (LAADS; https://ladsweb.modaps.eosdis.nasa.gov/). We thank three anonymous reviewers’ comments that improved this paper.
Conflicts of Interest
The authors declare no conflict of interest.
Appendix A. Calculation of the Cross-Meridian Width of a MODIS Swath Gap
The cross-meridian width of a MODIS swath gap at a given latitude is calculated as follows:
where, given a latitude λ, dλ is the cross-meridian gap width (units of km), Lλ and LM are the circumference of the cycle of latitude (at λ) and the length of Aqua MODIS daily coverage along the cycle of latitude, respectively. n is number of Aqua orbits in 24 h (n = 24 h × 60 min/98.9 min = 14.56), where the 98.9 min is the mean orbital period of MODIS. The circumference of the cycle of latitude (at λ) is calculated as:
where Lλ is the same as in A1, Rλ is radius of the cycle of latitude (at λ), and π is the constant Pi. a (a = 6378.1 km) and b (b = 6356.8 km) are the equatorial radius of the earth and polar radius of the earth, respectively. The length of Aqua MODIS daily coverage along the cycle of latitude is calculated as:
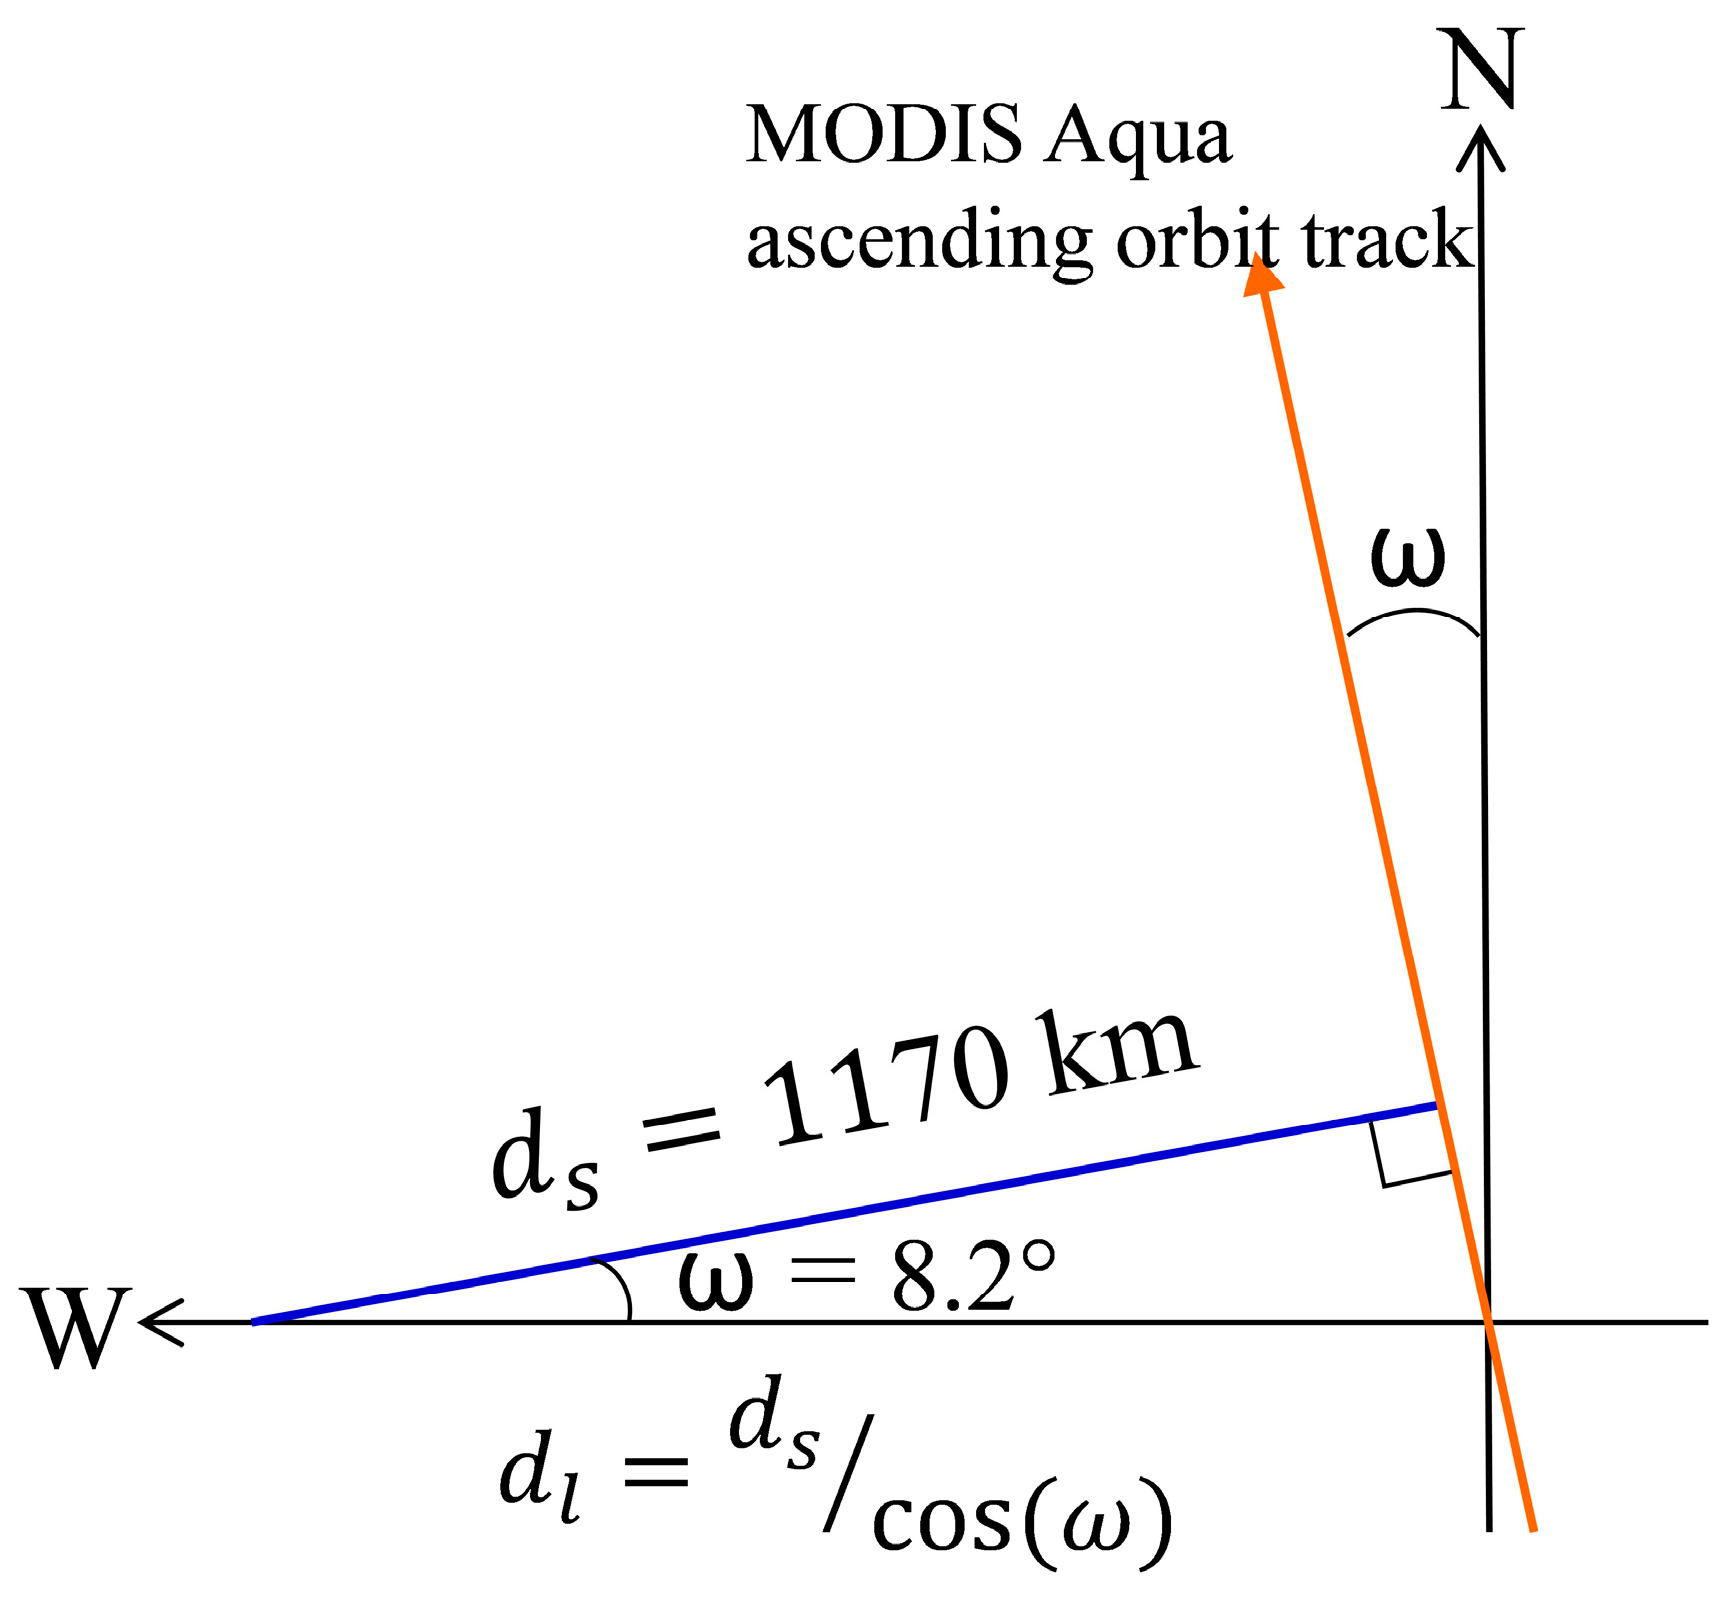
where Lλ and n are the same as in A1. dl is the length of a cross-track half of MODIS swath (or length from nadir to the scan edge, ds = 2340 km/2 = 1170 km) projected along the cycle of latitude, and ω is the angle between the ascending orbit track of MODIS Aqua and the north direction (ω = 98.2° − 90° = 8.2°), as illustrated in Figure A1. Note that MODIS Aqua orbit has an inclination of 98.2°.
Figure A1.
Illustration of calculating the projected length of a MODIS swath along the cycle of latitude. The orange arrow represents between the ascending orbit track of MODIS Aqua and the blue line shows a cross-track half of MODIS swath.
Figure A1.
Illustration of calculating the projected length of a MODIS swath along the cycle of latitude. The orange arrow represents between the ascending orbit track of MODIS Aqua and the blue line shows a cross-track half of MODIS swath.

References
- Crutzen, P.J.; Andreae, M.O. Biomass Burning in the Tropics: Impact on Atmospheric Chemistry and Biogeochemical Cycles. Science 1990, 250, 1669–1678. [Google Scholar] [CrossRef]
- Bond, T.C.; Doherty, S.J.; Fahey, D.W.; Forster, P.M.; Berntsen, T.; DeAngelo, B.J.; Flanner, M.G.; Ghan, S.; Kärcher, B.; Koch, D.; et al. Bounding the role of black carbon in the climate system: A scientific assessment. J. Geophys. Res. Atmos. 2013, 118, 5380–5552. [Google Scholar] [CrossRef]
- Bowman, D.M.J.S.; Balch, J.K.; Artaxo, P.; Bond, W.J.; Carlson, J.M.; Cochrane, M.A.; D’Antonio, C.M.; DeFries, R.S.; Doyle, J.C.; Harrison, S.P.; et al. Fire in the Earth System. Science 2009, 324, 481–484. [Google Scholar] [CrossRef]
- Giglio, L.; Boschetti, L.; Roy, D.P.; Humber, M.L.; Justice, C.O. The Collection 6 MODIS burned area mapping algorithm and product. Remote Sens. Environ. 2018, 217, 72–85. [Google Scholar] [CrossRef]
- Giglio, L.; Randerson, J.T.; van der Werf, G.R. Analysis of daily, monthly, and annual burned area using the fourth-generation global fire emissions database (GFED4). J. Geophys. Res. Biogeosci. 2013, 118, 317–328. [Google Scholar] [CrossRef] [Green Version]
- van der Werf, G.R.; Randerson, J.T.; Giglio, L.; van Leeuwen, T.T.; Chen, Y.; Rogers, B.M.; Mu, M.; van Marle, M.J.E.; Morton, D.C.; Collatz, G.J.; et al. Global fire emissions estimates during 1997–2016. Earth Syst. Sci. Data 2017, 9, 697–720. [Google Scholar] [CrossRef] [Green Version]
- Randerson, J.T.; Chen, Y.; van der Werf, G.R.; Rogers, B.M.; Morton, D.C. Global burned area and biomass burning emissions from small fires. J. Geophys. Res. Biogeosci. 2012, 117, G04012. [Google Scholar] [CrossRef]
- Roteta, E.; Bastarrika, A.; Padilla, M.; Storm, T.; Chuvieco, E. Development of a Sentinel-2 burned area algorithm: Generation of a small fire database for sub-Saharan Africa. Remote Sens. Environ. 2019, 222, 1–17. [Google Scholar] [CrossRef]
- Kaufman, Y.J.; Justice, C.O.; Flynn, L.P.; Kendall, J.D.; Prins, E.M.; Giglio, L.; Ward, D.E.; Menzel, W.P.; Setzer, A.W. Potential global fire monitoring from EOS-MODIS. J. Geophys. Res. Atmos. 1998, 103, 32215–32238. [Google Scholar] [CrossRef]
- Rogers, B.M.; Soja, A.J.; Goulden, M.L.; Randerson, J.T. Influence of tree species on continental differences in boreal fires and climate feedbacks. Nat. Geosci. 2015, 8, 228–234. [Google Scholar] [CrossRef]
- Smith, A.M.S.; Wooster, M.J. Remote classification of head and backfire types from MODIS fire radiative power and smoke plume observations. Int. J. Wildland Fire 2005, 14, 249–254. [Google Scholar] [CrossRef] [Green Version]
- Wooster, M.J.; Zhang, Y.H. Boreal forest fires burn less intensely in Russia than in North America. Geophys. Res. Lett. 2004, 31, L20505. [Google Scholar] [CrossRef] [Green Version]
- Freeborn, P.H.; Jolly, W.M.; Cochrane, M.A. Impacts of changing fire weather conditions on reconstructed trends in U.S. wildland fire activity from 1979 to 2014. J. Geophys. Res. Biogeosci. 2016, 121, 2856–2876. [Google Scholar] [CrossRef] [Green Version]
- Paugam, R.; Wooster, M.; Freitas, S.; Val Martin, M. A review of approaches to estimate wildfire plume injection height within large-scale atmospheric chemical transport models. Atmos. Chem. Phys. 2016, 16, 907–925. [Google Scholar] [CrossRef] [Green Version]
- Peterson, D.; Hyer, E.; Wang, J. Quantifying the potential for high-altitude smoke injection in the North American boreal forest using the standard MODIS fire products and subpixel-based methods. J. Geophys. Res. Atmos. 2014, 119, 3401–3419. [Google Scholar] [CrossRef]
- Ichoku, C.; Kaufman, Y.J. A method to derive smoke emission rates from MODIS fire radiative energy measurements. IEEE Trans. Geosci. Remote Sens. 2005, 43, 2636–2649. [Google Scholar] [CrossRef]
- Wooster, M.J.; Zhukov, B.; Oertel, D. Fire radiative energy for quantitative study of biomass burning: Derivation from the BIRD experimental satellite and comparison to MODIS fire products. Remote Sens. Environ. 2003, 86, 83–107. [Google Scholar] [CrossRef]
- Freeborn, P.H.; Wooster, M.J.; Hao, W.M.; Ryan, C.A.; Nordgren, B.L.; Baker, S.P.; Ichoku, C. Relationships between energy release, fuel mass loss, and trace gas and aerosol emissions during laboratory biomass fires. J. Geophys. Res. Atmos. 2008, 113, D01301. [Google Scholar] [CrossRef]
- Kremens, R.L.; Dickinson, M.B.; Bova, A.S. Radiant flux density, energy density and fuel consumption in mixed-oak forest surface fires. Int. J. Wildland Fire 2012, 21, 722–730. [Google Scholar] [CrossRef]
- Konovalov, I.B.; Berezin, E.V.; Ciais, P.; Broquet, G.; Beekmann, M.; Hadji-Lazaro, J.; Clerbaux, C.; Andreae, M.O.; Kaiser, J.W.; Schulze, E.D. Constraining CO2 emissions from open biomass burning by satellite observations of co-emitted species: A method and its application to wildfires in Siberia. Atmos. Chem. Phys. 2014, 14, 10383–10410. [Google Scholar] [CrossRef] [Green Version]
- Li, F.; Zhang, X.; Kondragunta, S.; Roy, D.P. Investigation of the Fire Radiative Energy Biomass Combustion Coefficient: A Comparison of Polar and Geostationary Satellite Retrievals Over the Conterminous United States. J. Geophys. Res. Biogeosci. 2018, 123, 722–739. [Google Scholar] [CrossRef]
- Lu, X.; Zhang, X.; Li, F.; Cochrane, M.A. Investigating Smoke Aerosol Emission Coefficients using MODIS Active Fire and Aerosol Products—A Case Study in the CONUS and Indonesia. J. Geophys. Res. Biogeosci. 2019, 124, 1413–1429. [Google Scholar] [CrossRef]
- Mota, B.; Wooster, M.J. A new top-down approach for directly estimating biomass burning emissions and fuel consumption rates and totals from geostationary satellite fire radiative power (FRP). Remote Sens. Environ. 2018, 206, 45–62. [Google Scholar] [CrossRef] [Green Version]
- Kaiser, J.W.; Heil, A.; Andreae, M.O.; Benedetti, A.; Chubarova, N.; Jones, L.; Morcrette, J.J.; Razinger, M.; Schultz, M.G.; Suttie, M.; et al. Biomass burning emissions estimated with a global fire assimilation system based on observed fire radiative power. Biogeosciences 2012, 9, 527–554. [Google Scholar] [CrossRef] [Green Version]
- Vermote, E.; Ellicott, E.; Dubovik, O.; Lapyonok, T.; Chin, M.; Giglio, L.; Roberts, G.J. An approach to estimate global biomass burning emissions of organic and black carbon from MODIS fire radiative power. J. Geophys. Res. Atmos. 2009, 114, D18205. [Google Scholar] [CrossRef]
- Ichoku, C.; Ellison, L. Global top-down smoke-aerosol emissions estimation using satellite fire radiative power measurements. Atmos. Chem. Phys. 2014, 14, 6643–6667. [Google Scholar] [CrossRef] [Green Version]
- Li, F.; Zhang, X.; Roy, D.P.; Kondragunta, S. Estimation of biomass-burning emissions by fusing the fire radiative power retrievals from polar-orbiting and geostationary satellites across the conterminous United States. Atmos. Environ. 2019, 211, 274–287. [Google Scholar] [CrossRef]
- Zhang, X.; Kondragunta, S.; Da Silva, A.; Lu, S.; Ding, H.; Li, F.; Zhu, Y. The Blended Global Biomass Burning Emissions Product from MODIS, VIIRS, and Geostaionary Satellites (GBBEPx) Version 3.1. Available online: http://www.ospo.noaa.gov/Products/land/gbbepx/docs/GBBEPx_ATBD.pdf (accessed on 15 April 2020).
- Zhang, X.; Kondragunta, S.; Ram, J.; Schmidt, C.; Huang, H.-C. Near-real-time global biomass burning emissions product from geostationary satellite constellation. J. Geophys. Res. Atmos. 2012, 117, D14201. [Google Scholar] [CrossRef]
- Freeborn, P.H.; Wooster, M.J.; Roberts, G. Addressing the spatiotemporal sampling design of MODIS to provide estimates of the fire radiative energy emitted from Africa. Remote Sens. Environ. 2011, 115, 475–489. [Google Scholar] [CrossRef]
- Kumar, S.S.; Roy, D.P.; Boschetti, L.; Kremens, R. Exploiting the power law distribution properties of satellite fire radiative power retrievals: A method to estimate fire radiative energy and biomass burned from sparse satellite observations. J. Geophys. Res. Atmos. 2011, 116, D19303. [Google Scholar] [CrossRef] [Green Version]
- Li, F.; Zhang, X.; Kondragunta, S.; Csiszar, I. Comparison of Fire Radiative Power Estimates From VIIRS and MODIS Observations. J. Geophys. Res. Atmos. 2018, 123, 4545–4563. [Google Scholar] [CrossRef]
- Kaur, I.; Hüser, I.; Zhang, T.; Gehrke, B.; Kaiser, J.W. Correcting Swath-Dependent Bias of MODIS FRP Observations With Quantile Mapping. Remote Sens. 2019, 11, 1205. [Google Scholar] [CrossRef] [Green Version]
- Pyne, S.J.; Andrews, P.L.; Laven, R.D. Introduction to Wildland Fire; John Wiley and Sons: Hoboken, NJ, USA, 1996. [Google Scholar]
- Wang, J.; Bhattacharjee, P.S.; Tallapragada, V.; Lu, C.H.; Kondragunta, S.; da Silva, A.; Zhang, X.; Chen, S.P.; Wei, S.W.; Darmenov, A.S.; et al. The implementation of NEMS GFS Aerosol Component (NGAC) Version 2.0 for global multispecies forecasting at NOAA/NCEP – Part 1: Model descriptions. Geosci. Model Dev. 2018, 11, 2315–2332. [Google Scholar] [CrossRef] [Green Version]
- Earl, N.; Simmonds, I.; Tapper, N. Weekly cycles of global fires—Associations with religion, wealth and culture, and insights into anthropogenic influences on global climate. Geophys. Res. Lett. 2015, 42, 9579–9589. [Google Scholar] [CrossRef] [Green Version]
- Wolfe, R.E.; Nishihama, M.; Fleig, A.J.; Kuyper, J.A.; Roy, D.P.; Storey, J.C.; Patt, F.S. Achieving sub-pixel geolocation accuracy in support of MODIS land science. Remote Sens. Environ. 2002, 83, 31–49. [Google Scholar] [CrossRef]
- Cheng, D.; Rogan, J.; Schneider, L.; Cochrane, M. Evaluating MODIS active fire products in subtropical Yucatán forest. Remote Sens. Lett. 2013, 4, 455–464. [Google Scholar] [CrossRef]
- Giglio, L.; Loboda, T.; Roy, D.P.; Quayle, B.; Justice, C.O. An active-fire based burned area mapping algorithm for the MODIS sensor. Remote Sens. Environ. 2009, 113, 408–420. [Google Scholar] [CrossRef]
- Wiedinmyer, C.; Akagi, S.K.; Yokelson, R.J.; Emmons, L.K.; Al-Saadi, J.A.; Orlando, J.J.; Soja, A.J. The Fire INventory from NCAR (FINN): A high resolution global model to estimate the emissions from open burning. Geosci. Model Dev. 2011, 4, 625–641. [Google Scholar] [CrossRef] [Green Version]
- Schroeder, W.; Oliva, P.; Giglio, L.; Csiszar, I.A. The New VIIRS 375 m active fire detection data product: Algorithm description and initial assessment. Remote Sens. Environ. 2014, 143, 85–96. [Google Scholar] [CrossRef]
- Csiszar, I.; Schroeder, W.; Giglio, L.; Ellicott, E.; Vadrevu, K.P.; Justice, C.O.; Wind, B. Active fires from the Suomi NPP Visible Infrared Imaging Radiometer Suite: Product status and first evaluation results. J. Geophys. Res. Atmos. 2014, 119, 803–816. [Google Scholar] [CrossRef]
- Zhang, T.; Wooster, M.J.; Xu, W. Approaches for synergistically exploiting VIIRS I- and M-Band data in regional active fire detection and FRP assessment: A demonstration with respect to agricultural residue burning in Eastern China. Remote Sens. Environ. 2017, 198, 407–424. [Google Scholar] [CrossRef] [Green Version]
- Vadrevu, K.; Lasko, K. Intercomparison of MODIS AQUA and VIIRS I-Band Fires and Emissions in an Agricultural Landscape—Implications for Air Pollution Research. Remote Sens. 2018, 10, 978. [Google Scholar] [CrossRef] [PubMed] [Green Version]
- Wolfe, R.E.; Lin, G.; Nishihama, M.; Tewari, K.P.; Tilton, J.C.; Isaacman, A.R. Suomi NPP VIIRS prelaunch and on-orbit geometric calibration and characterization. J. Geophys. Res. Atmos. 2013, 118, 11508–11521. [Google Scholar] [CrossRef] [Green Version]
- Wolfe, R.E.; Roy, D.P.; Vermote, E. MODIS land data storage, gridding, and compositing methodology: Level 2 grid. IEEE Trans. Geosci. Remote Sens. 1998, 36, 1324–1338. [Google Scholar] [CrossRef] [Green Version]
- Freeborn, P.H.; Wooster, M.J.; Roy, D.P.; Cochrane, M.A. Quantification of MODIS fire radiative power (FRP) measurement uncertainty for use in satellite-based active fire characterization and biomass burning estimation. Geophys. Res. Lett. 2014, 41, 1988–1994. [Google Scholar] [CrossRef]
- Giglio, L.; Schroeder, W.; Hall, J.V.; Justice, C.O. MODIS Collection 6 Active Fire Product User’s Guide. Available online: http://modis-fire.umd.edu/files/MODIS_C6_Fire_User_Guide_B.pdf (accessed on 15 April 2020).
- Giglio, L.; Schroeder, W.; Justice, C.O. The collection 6 MODIS active fire detection algorithm and fire products. Remote Sens. Environ. 2016, 178, 31–41. [Google Scholar] [CrossRef] [Green Version]
- Cao, C.; Luccia, F.J.D.; Xiong, X.; Wolfe, R.; Weng, F. Early On-Orbit Performance of the Visible Infrared Imaging Radiometer Suite Onboard the Suomi National Polar-Orbiting Partnership (S-NPP) Satellite. Remote Sens. 2014, 52, 1142–1156. [Google Scholar] [CrossRef] [Green Version]
- Schroeder, W.; Giglio, L. NASA SPIS 375 m & 750 m Active Fire Detection Product User’s Guide Version 1.4. Available online: https://lpdaac.usgs.gov/documents/427/VNP14_User_Guide_V1.pdf (accessed on 15 April 2020).
- Roberts, G.; Wooster, M.J.; Lagoudakis, E. Annual and diurnal african biomass burning temporal dynamics. Biogeosciences 2009, 6, 849–866. [Google Scholar] [CrossRef] [Green Version]
- Smith, R.J. Use and misuse of the reduced major axis for line-fitting. Am. J. Phys. Anthropol. 2009, 140, 476–486. [Google Scholar] [CrossRef]
- He, L.; Li, Z. Enhancement of a fire-detection algorithm by eliminating solar contamination effects and atmospheric path radiance: Application to MODIS data. Int. J. Remote Sens. 2011, 32, 6273–6293. [Google Scholar] [CrossRef]
- Klein, D.; Richter, D.; Strobl, C.; Schläpfer, D. Solar Influence on Fire Radiative Power Retrieved With the Bispectral Method. IEEE Trans. Geosci. Remote Sens. 2019, 57, 4521–4528. [Google Scholar] [CrossRef]
- Schroeder, W.; Csiszar, I.; Morisette, J. Quantifying the impact of cloud obscuration on Remote Sens. of active fires in the Brazilian Amazon. Remote Sens. Environ. 2008, 112, 456–470. [Google Scholar] [CrossRef]
- Justice, C.O.; Giglio, L.; Korontzi, S.; Owens, J.; Morisette, J.T.; Roy, D.; Descloitres, J.; Alleaume, S.; Petitcolin, F.; Kaufman, Y. The MODIS fire products. Remote Sens. Environ. 2002, 83, 244–262. [Google Scholar] [CrossRef]
- Archibald, S.; Lehmann, C.E.R.; Gómez-Dans, J.L.; Bradstock, R.A. Defining pyromes and global syndromes of fire regimes. Proc. Natl. Acad. Sci. USA 2013, 110, 6442–6447. [Google Scholar] [CrossRef] [Green Version]
- Roberts, J.; Trainer, M.; Murphy, D.; Brown, S.; Brewer, A.; Gao, R.S.; Fahey, D. Fire Influence on Regional to Global Environments and Air Quality (FIREX-AQ). Available online: https://www.esrl.noaa.gov/csd/projects/firex-aq/whitepaper.pdf (accessed on 15 April 2020).
Figure 1.
Variation of the area of a Moderate Resolution Imaging Spectroradiometer (MODIS) (blue line) and VIIRS I-band (red line) pixel along the scan angle from nadir to the scan edge.
Figure 1.
Variation of the area of a Moderate Resolution Imaging Spectroradiometer (MODIS) (blue line) and VIIRS I-band (red line) pixel along the scan angle from nadir to the scan edge.

Figure 2.
Daytime active fire detections from Aqua MODIS (a) and Suomi National Polar-orbiting Partnership (S-NPP Visible Infrared Imaging Radiometer Suite (VIIRS) I-band (b) on January 16, 2017. The shading areas show areas observed by MODIS in three consecutive Aqua orbits across Africa. Note that VIIRS observations have full coverage and the gaps from MODIS are added in (b) for comparison purpose.

Figure 3.
Cross-meridian width of a MODIS swath gap along latitude (the gray dash line indicates the equator).
Figure 3.
Cross-meridian width of a MODIS swath gap along latitude (the gray dash line indicates the equator).

Figure 4.
Variations of the minimum (min), mean, and maximum (max) fire radiative power (FRP) per fire detection (or pixel) of the MODIS (a) and VIIRS (b) sensors in different satellite view zenith angles (VZAs) from nadir to the scan edge. Note that the y-axis is on a logarithmic scale.
Figure 4.
Variations of the minimum (min), mean, and maximum (max) fire radiative power (FRP) per fire detection (or pixel) of the MODIS (a) and VIIRS (b) sensors in different satellite view zenith angles (VZAs) from nadir to the scan edge. Note that the y-axis is on a logarithmic scale.

Figure 5.
Comparison of daily continental sum FRP from daytime active fire detections observed contemporaneously by MODIS and VIIRS I-band across Africa in 2017. (a) MODIS FRP versus VIIRS FRP from all VIIRS fire detections, and (b) MODIS FRP versus VIIRS FRP inside MODIS granules (VIIRS detections in swath gaps were excluded). The color legend on the right represents the date (day of year, abbreviated as DOY) of each sample observation. The red solid line represents the best-fitted model line and the dashed line is the 1:1 line.

Figure 6.
Percentages of the daily not-matched grids (a) and fire detections (b) and sum FRP (c) in these grids between Aqua MODIS (blue) and VIIRS I-band (red) at seven different resolutions across Africa. The solid cycles represent median values and the error bars indicate values at the 5th and 95th percentiles.

Figure 7.
VIIRS fire detection count and FRP distributions in the matched and not-matched 0.25° grids across Africa. (a) The stacked histogram shows the percent of the matched (red) and not-matched (blue) VIIRS fire detections in every 5° MODIS VZA from nadir to the scan edge, and the yellow line displays the cumulative percentage of the not-matched VIIRS fire detections to all the fire detections contemporaneously observed by VIIRS I-band. (b) VIIRS FRP frequency density distributions in the matched (red cycle) and not-matched (blue triangle) grids. The gray dash line shows the location of 2 MW FRP.

Figure 8.
Derived best-fitted models (Equation (3)) at seven grid resolutions: (a) 0.05°, (b) 0.1°, (c) 0.25°, (d) 0.5°, (e) 1.0°, (f) 2.5°, and (g) 5.0°. Gray solid dots represent the matched grids, blue solid cycles and bars are the median, 10th, and 90th percentiles of the FRP ratio in every 1° MODIS VZA, and the red solid line is the best-fitted model. Note that the y-axis uses logarithmic scale for visualization purposes.

Figure 9.
Yearly summed MODIS and VIIRS daytime FRP at a 1° grid across Africa in 2017. (a) The observed MODIS FRP, (b) the observed VIIRS FRP in the MODIS-sensed areas (outside MODIS swath gaps), (c) the total number of days without Aqua MODIS observations (inside MODIS swath gaps), and (d) the VIIRS FRP observed inside MODIS swath gaps.

Figure 10.
Seasonal variations of VIIRS FRP observed inside MODIS swath gaps (blue) and the ratio (red) of the VIIRS FRP inside to outside MODIS swath gaps across Africa in 2017.
Figure 10.
Seasonal variations of VIIRS FRP observed inside MODIS swath gaps (blue) and the ratio (red) of the VIIRS FRP inside to outside MODIS swath gaps across Africa in 2017.

Figure 11.
Mean VZA and daily grid FRP from (a) VIIRS and (b) MODIS in a 1° grid centering at 30.232°E and 4.139°N in January 2017. The black triangle represents grid FRP and the gray solid cycle is VZA. In (b), the cyan squares indicate the days without valid MODIS fire observations due to swath gaps and the dashed line of 35° VZA is considered as a VZA threshold to adjust MODIS FRP (results are denoted as pink triangles) based on the algorithm proposed by Wang et al. [35].


Table 1.
Best-fitted models for VIIRS to MODIS FRP ratio as a function of MODIS VZA at seven grid sizes.
Table 1.
Best-fitted models for VIIRS to MODIS FRP ratio as a function of MODIS VZA at seven grid sizes.
| Grid Size (Degree) | Model Parameters | r2 | RMSE | ||
|---|---|---|---|---|---|
| β0 | β1 | β2 | |||
| 0.05 | 1.054 ± 0.02 ** | −0.045 ± 0.08 | −0.223 ± 0.07 ** | 0.93 | 0.026 |
| 0.10 | 1.133 ± 0.02 ** | 0.030 ± 0.08 | −0.265 ± 0.07 ** | 0.91 | 0.028 |
| 0.25 | 1.313 ± 0.02 ** | −0.006 ± 0.09 | 0.141 ± 0.07 ** | 0.74 | 0.030 |
| 0.50 | 1.401 ± 0.04 ** | 0.004 ± 0.16 | 0.074 ± 0.14 | 0.23 | 0.054 |
| 1.0 | 1.456 ± 0.05 ** | −0.085 ± 0.22 | 0.369 ± 0.18 ** | 0.72 | 0.070 |
| 2.5 | 1.564 ± 0.08 ** | −0.295 ± 0.35 * | 0.672 ± 0.29 ** | 0.68 | 0.113 |
| 5.0 | 1.690 ± 0.12 ** | −0.851 ± 0.48 ** | 1.219 ± 0.40 ** | 0.67 | 0.146 |
Note that ** and * represent p-value < 0.001 and p-value < 0.1, respectively, and the term after “±” is the 95% level confidence interval.
© 2020 by the authors. Licensee MDPI, Basel, Switzerland. This article is an open access article distributed under the terms and conditions of the Creative Commons Attribution (CC BY) license (http://creativecommons.org/licenses/by/4.0/).
Share and Cite
MDPI and ACS Style
Li, F.; Zhang, X.; Kondragunta, S. Biomass Burning in Africa: An Investigation of Fire Radiative Power Missed by MODIS Using the 375 m VIIRS Active Fire Product. Remote Sens. 2020, 12, 1561. https://doi.org/10.3390/rs12101561
AMA Style
Li F, Zhang X, Kondragunta S. Biomass Burning in Africa: An Investigation of Fire Radiative Power Missed by MODIS Using the 375 m VIIRS Active Fire Product. Remote Sensing. 2020; 12(10):1561. https://doi.org/10.3390/rs12101561
Chicago/Turabian StyleLi, Fangjun, Xiaoyang Zhang, and Shobha Kondragunta. 2020. "Biomass Burning in Africa: An Investigation of Fire Radiative Power Missed by MODIS Using the 375 m VIIRS Active Fire Product" Remote Sensing 12, no. 10: 1561. https://doi.org/10.3390/rs12101561
Note that from the first issue of 2016, this journal uses article numbers instead of page numbers. See further details here.