Article

Validation of ASTER Emissivity Retrieval Using the Mako Airborne TIR Imaging Spectrometer at the Algodones Dune Field in Southern California, USA

1
Department of Earth and Space Sciences, University of Washington, Box 351310, Seattle, WA 98195-1310, USA
2
Geological Survey of Israel, 32 Yishayahu Leibovitz St., Jerusalem 9692100, Israel
3
Jet Propulsion Laboratory, Pasadena, CA 91109, USA
4
The Aerospace Corporation, El Segundo, CA 90245-4609, USA
*
Author to whom correspondence should be addressed.
Remote Sens. 2020, 12(5), 815; https://doi.org/10.3390/rs12050815
Submission received: 29 January 2020 / Revised: 25 February 2020 / Accepted: 26 February 2020 / Published: 3 March 2020
(This article belongs to the Special Issue ASTER 20th Anniversary)

Abstract

:
Validation of emissivity (ε) retrievals from spaceborne thermal infrared (TIR) sensors typically requires spatial extrapolations over several orders of magnitude for a comparison between centimeter-scale laboratory ε measurements and the common decameter and lower resolution of spaceborne TIR data. In the case of NASA’s Advanced Spaceborne Thermal Emission and Reflection Radiometer (ASTER) temperature and ε separation algorithm (TES), this extrapolation becomes especially challenging because TES was originally designed for the geologic surface of Earth, which is typically heterogeneous even at centimeter and decameter scales. Here, we used the airborne TIR hyperspectral Mako sensor with its 2.2 m/pixel resolution, to bridge this scaling issue and robustly link between ASTER TES 90 m/pixel emissivity retrievals and laboratory ε measurements from the Algodones dune field in southern California, USA. The experimental setup included: (i) Laboratory XRD, grain size, and TIR spectral measurements; (ii) radiosonde launches at the time of the two Mako overpasses for atmospheric corrections; (iii) ground-based thermal measurements for calibration, and (iv) analyses of ASTER day and night ε retrievals from 21 different acquisitions. We show that while cavity radiation leads to a 2% to 4% decrease in the effective emissivity contrast of fully resolved scene elements (e.g., slipface slopes and interdune flats), spectral variability of the site when imaged at 90 m/pixel is below 1%, because at this scale the dune field becomes an effectively homogeneous mixture of the different dune elements. We also found that adsorption of atmospheric moisture to grain surfaces during the predawn hours increased the effective ε of the dune surface by up to 0.04. The accuracy of ASTER’s daytime emissivity retrievals using each of the three available atmospheric correction protocols was better than 0.01 and within the target performance of ASTER’s standard emissivity product. Nighttime emissivity retrievals had lower precision (<0.03) likely due to residual atmospheric effects. The water vapor scaling (WVS) atmospheric correction protocol was required to obtain accurate (<0.01) nighttime ASTER emissivity retrievals.

Graphical Abstract

1. Introduction

The Advanced Spaceborne Thermal Emission and Reflection Radiometer (ASTER, [1,2,3,4]) was launched into a sun-synchronous orbit on 19 December 1999 onboard NASA’s Terra satellite. It includes a five band (8 to 12 μm) thermal infrared (TIR) scanner delivering 60 × 60 km radiance images with 90 m/pixel spatial resolution and with instrumental capability of 1 K accuracy and <0.3 K precision (NEΔT300K). The temperature and emissivity (T/ε) separation algorithm “TES” developed for ASTER TIR data [5] was designed to generate the standard land-surface products AST08 (T) and AST05 (ε) for the geologic surface of Earth. TES builds on the relatively high contrast in ε spectra of geologic surfaces for its T/ε separation approach and was not designed to recover the T or relatively low contrast ε spectra of water or vegetation surfaces, for which ε is largely well known a priori (e.g., [6], https://speclib.jpl.nasa.gov/). Before launch, AST08 and AST05 were estimated to have a nominal predicted accuracy of ±1.5 K and precision of 0.015, respectively [5].
Validation tests of ASTER radiance data and its standard T and ε products have been conducted over the years since launch, resulting in adjustments to the TES algorithm itself [7,8], as well as improvements of the atmospheric correction procedures applied to the standard land-leaving radiance product (AST09T) that is input into the TES algorithm [9]. Many validation studies focused on water bodies [8,10] and vegetated or low contrast soil-mantled landscapes [11,12,13] that provide large homogenous surfaces resolvable by ASTER. These validation studies have shown that the ASTER radiance products are capable of recovering T for water bodies, for example, accurately and precisely. The TES algorithm, however, performs less reliably over these surfaces, due in large measure to the empirical regression between spectral contrast (measured as the ε m a x i m i m ε m i n i m u m difference, or “MMD”) and minimum ε which is at the heart of the algorithm originally designed for bare geologic surfaces [5].
ASTER emissivity retrievals (i.e., AST05) were tested over bare geologic surfaces (e.g., [14,15]). Hulley et al. [16] focused on several sand dune sites in North America to validate the North American ASTER Land Surface Emissivity Database (NAALSED) [17], in addition to a set of global sand dune sites to validate the ASTER Global Emissivity Dataset (GED) v3 [18]. They found an absolute mean difference of 0.016 between ASTER ε retrievals (using TES + water vapor scaling) and representative laboratory spectra from these sites. Sabol et al. [19] focused on bare basalt fields in Hawaii and on the Railroad Valley playa surface in Nevada, USA, and found that the AST05 ε for these sites again was generally within the predicted accuracy limitations of TES. However, their observations of temporal changes in soil moisture and texture across the playa surface, as well as the natural geologic variability in the composition and texture of the Hawaii basalt surfaces, highlighted the inherent complications in the conventional validation approach of comparing “snapshot” ASTER TIR measurements acquired at 90 m/pixel against centimeter-scale laboratory ε spectra of “representative” field samples. This conventional validation approach is not designed to effectively account for sub-pixel heterogeneity in the TIR properties of natural geologic surfaces. This common TIR heterogeneity of geologic surfaces can arise from compositional variability, differential solar heating, or multiple reflections between unresolved landscape elements [20].
Here, we address the fundamental scaling assumption in field-based validation experiments of satellite TIR data, which in the case of testing TES ε retrievals requires a nearly four orders of magnitude extrapolation to link between ASTER’s 90 m/pixel measurements and centimeter-scale laboratory TIR spectra. We focus on the Algodones dune field in southern California (Figure 1) and use 2.2 m/pixel hyperspectral thermal data (128 channels between 7.8 and 13.4 μm) acquired by the airborne Mako imaging spectrometer [21,22] to bridge the spatial scale gap between laboratory spectra and the 90 m scale of the AST05 standard ε product. Throughout this paper we use conventional abbreviations (e.g., west-southwest “WSW”) to indicate directions on the compass rose. Times are local Pacific Standard Time (PST).

2. Background

2.1. Remote-Sensing Instrumentation

The spaceborne ASTER scanner collects thermal-infrared images in five spectral channels (#10, 8.125–8.475 μm; #11, 8.475–8.825 μm; #12, 8.925–9.275 μm; #13, 10.25–10.95 μm; and #14, 10.95–11.65 μm). The Terra satellite, which hosts ASTER, is in a sun-synchronous polar orbit 705 km above the Earth’s surface, crossing the equator at about 10:30 and 22:30 local time. Images are acquired on request during the descending daytime overpass and also during the ascending nighttime overpass. Terra passes overhead every 16 days. The image data are calibrated to radiance at the sensor and, then, corrected for the effects of the atmosphere to produce a land-leaving radiance standard product (AST09T), which also includes an image plane containing the calculated downwelling sky irradiance (e.g., [13]). The default atmospheric correction is based on an interpolated National Center for Atmospheric Research/National Centers for Environmental Prediction (NCAR/NCEP) atmosphere characterization adjusted for surface elevation with a km-scale DEM. Optionally, a MODIS (Moderate Resolution Imaging Spectroradiometer, also on Terra) water-vapor special product (MOD07) can be employed [23], or an ASTER-derived water vapor scaling (WVS) can be used to adjust the nominal corrections [9]. WVS can improve the accuracy of AST05 ε data by up to 0.03 under warm, humid atmospheric conditions [24].
Mako is an airborne hyperspectral thermal infrared whiskbroom imaging spectrometer with a 128 × 128 element sensor, designed and built by The Aerospace Corporation (El Segundo, California) and operated from a Twin Otter aircraft [21,22]. It operates in the 7.8 to 13.4 μm spectral region employing a cryogenically cooled grating-based spectrometer with a native spectral resolution of ~4 cm−1 at 10 μm (0.04 μm per channel). The instantaneous field of view (IFOV) is 0.55 mrad, which results in ~2 m GSD at a flight elevation of 3.8 km above ground. The nominal NEΔT300K of the Mako data is 0.03 K. Mako whisks are 128 pixels wide, the number of whisks comprising an imaging session being determined by the duration of the data-collection overpass. Imaging sessions with 160 whisks of length 4.9 km were designed to incorporate both the Algodones dune field area-of-interest and the adjacent environs. Visible-wavelength context images are co-collected with the thermal data.

2.2. The TES Algorithm

Surface T and the ε in each of the five ASTER TIR channels for each image pixel are the products of the TES algorithm [5]. Inputs to TES are “land-leaving radiance” [25] and downwelling sky irradiance, and both are in ASTER standard product AST09T. To convert land-leaving radiance to the land-emitted component, the reflected sky irradiance must first be subtracted. To do this it is necessary to know the reflectivity (ρ) of the land surface, but since ρ = 1 ε (Kirchhoff’s law, [26]), this requires that the ε be first determined. However, this requirement is not met for most geologic surfaces, and therefore has to also be dealt with in TES.
A fundamental hurdle in finding T and ε from remotely sensed land-emitted TIR data is that both are unknowns in the Planck equation, which describes measured radiance R as:
R λ   =   ε λ c 1 π λ 5 ( e c 2 ( λ T ) 1 1 ) 1   W   m 1   sr 1   μ m 1
where λ is wavelength, c1 and c2 are characteristic constants, and T is in K. TES makes use of two observations to break this indeterminacy as follows: First, for most rocks, at λ > 10 μm ε ≈ 0.965; and second, the minimum value of ε in the spectrum ( ε m i n i m u m ), is related to the spectral contrast as measured in the laboratory as the difference between ε m i n i m u m and the maximum value of ε in the spectrum ( ε m a x i m u m ). This first observation can be used in the “normalized emissivity method” (NEM) to approximate T by inversion of Planck’s law, and then the normalized values of ε at other wavelengths can be found since T is now estimated [27,28]. TES makes use of the normalized ε to calculate and, then, subtract the downwelling sky irradiance, given the land-leaving radiance. Then, it essentially uses the new spectral contrast to estimate ε m i n i m u m , and hence a refined approximation of T (AST08), and thus the ε data (AST05). Gillespie et al. [5] used 86 laboratory ε spectra to relate ε m i n i m u m for each to their spectral contrast. They gave the relation as a power law, later simplified by Sabol et al. [19] for practical considerations to:
ε m i n i m u m   =   0.955 0.8625 M M D .
The simplification was made to reduce the impact of measurement “noise” in the calculated emissivity images for grey-body targets such as water and vegetation. For geological surfaces with 0.05 < MMD < 0.3 the difference in εmin between the linear and power-law versions of the equation was less than 0.004.

2.3. Sources for Error in AST05

There are multiple sources of error in calculating AST05. Calibration coefficients are used to convert data collected by ASTER to radiance change as the sensor sensitivities change and do not account for electronic striping (e.g., [8]). Atmospheric correction is prone to error from several sources [25]. The atmosphere is characterized from distant radiosonde launches and must be interpolated to the desired site and, then, adjusted for site elevation using a DEM (with 1 km resolution). The TES algorithm itself can introduce error in its assumed ε m a x i m u m value and, especially, in its empirical regression relating ε m i n i m u m to ε contrast. Before launch, Gillespie et al. [5] considered that uncertainties from these three main sources (radiance measurement, atmospheric characterization, and TES regression) were all about the same magnitude, although more extreme examples were encountered later.
In addition to these three sources of uncertainty in AST05, there are also possible “geological” sources of uncertainty that are the focus of the present study. These “geological” sources relate to radiance mixing in the 90 m ASTER pixels, and to multiple reflections among surface elements, which would affect the recovered effective T and ε regardless of imaging resolution. It is worth recalling that when Terra and its instruments were designed, 1 km resolution in the thermal infrared was regarded as ”moderate” resolution, and ASTER with its 90 m data was regarded as the high-resolution “zoom lens” for MODIS. However, the imaged surface is potentially heterogeneous at much finer scales, and radiance mixing from diverse surface materials affects nearly all remote-sensing measurements (e.g., [29]). Geological uncertainties include unresolved topographic facets that are differentially heated or have different compositions and multiple reflections between facets, reducing the spectral contrast and changing the surface temperature (e.g., [30,31]). In the presence of significant topographic structure, these effects can be several percent and can present a challenge for robust validation of 90 m/pixel data against centimeter-scale laboratory emissivity spectra.

3. Approach and Methods

We tested the performance of the TES algorithm and the AST05 standard product over bare geologic terrain having high ε contrast, which is the type of surface TES was originally designed for. We focused on a presumably compositionally homogenous sand dune site and used two Mako datasets to quantitatively map and characterize this assumed homogeneity during daytime and nighttime with 2.2 m/pixel data, which allowed us to effectively bridge the spatial scale gap between centimeter-scale laboratory ε spectra of surface samples and the native 90 m/pixel scale of AST05. To retrieve and validate surface emissivities from the Mako data we employed: (i) laboratory analyses to characterize the primary surface materials within the imaged scene, (ii) radiosonde launches at time of Mako overpasses to drive atmospheric corrections; and (iii) ground-based thermal measurements at time of Mako overpasses to validate the Mako T retrievals. The methodology for these experiments and the validation of AST05 using Mako are described below.
The study site is a 1 km2 area within the 10 × 70 km Algodones dune field in southern CA (Figure 1). The dune field, which is located ~30 km southeast of the Salton Sea, strikes NW-SE and was previously used for validating NASA’s North American Land Surface Emissivity Database (NAALSED) [16,32]. Within the 1 km2 study site we focused on a 270 × 270 m test area at an elevation above mean sea level of 120 to 150 m just south of Rt. 78, the “Ben Hulse Highway” (Figure 1B,C). The primary physical scene elements within the test area, which appears to be visually homogeneous, are ~10 m high dunes and the interdune flats that occur between them. Herein, we further classify the dune elements into their windward, crest, and slipface sections, as these experience different diurnal surface-temperature cycles due to their different topographic slopes and azimuths. The windward and slipface slopes typically dip ~NW and SE, respectively. The strongest winds in this region are northerly and westerly, and the average annual temperatures ranges from 16.5 to 31 °C. Annual precipitation averages 83 mm and the annual relative humidity averages 32%. Vegetation cover across the study site is <1%, mostly in the low-lying interdune areas. The low vegetation cover is likely due to the instability of the dunes in the frequent wind events, rather than low precipitation, as the dune field is surrounded by a shrub steppe.

3.1. Laboratory Analyses

The sand mineralogy was characterized at the Geological Survey of Israel with X-ray diffraction (XRD) using a PANalytical X’Pert diffractometer. The XRD samples were ground using a porcelain mortar and were measured by X-ray diffraction using CuKα radiation. Mineral phase identification was performed using HighScore Plus® software based on the ICSD database. Mineral phase abundances were based on the reference intensity ratio (RIR) method using in-house RIR values. Particle-size distributions (PSDs) for the sand samples (Figure 2A) were measured at the Geological Survey of Israel through laser diffraction using a Malvem Mastersizer MS-2000 (see [33] for detailed procedure).
Laboratory reflectivity (ρ) spectra for surface materials (Figure 2B–F) were determined at the Jet Propulsion Laboratory using a 520FT-IR Nicolet Fourier transform spectrometer with a Labsphere RSA-N1-700D integrating sphere [6]. The Nicolet reflectivity measurements were converted to emissivity according to ε = 1 ρ, with a reported accuracy of ±0.002 (0.2%) [34].

3.2. Field-Based Temperature Measurements

Time-series of kinetic surface-temperatures for the dune scene elements at the test site during the Mako overpasses were acquired using iButton DS1921G-F5# sensors (www.ibuttonlink.com) (±1 K accuracy) at 5 min intervals (Figure 3). The sensors were emplaced 3 to 5 mm below the sand surface approximately 12 h before the first overpass with the implied assumption that measured temperatures at these depths can be used to approximate skin temperatures. In addition, ground-based thermal images were acquired using a handheld FLIR T300 camera (www.flir.com) with an NEΔT of 0.05 K. Processing and analysis of the FLIR images were carried out using the FLIR ResearcherIR software package. The FLIR images were used to map temperature homogeneity of the landscape elements at scales from centimeters to tens of meters, bridging the gap between the point measurements of kinetic surface-temperatures with the iButton sensors and the 2.2 m/pixel scale of the Mako data.

3.3. Remotely Sensed Data

3.3.1. Hyperspectral Airborne Imaging

The Mako datasets used in the present study were collected during two overpasses on 22 April 2015. The first overpass was carried out at predawn at an elevation of 3.75 km above the surface and in an east-southeast (ESE) flight path between 0543 and 0555. The second overpass was carried out between 1125 and 1130 at the same elevation and with a WSW flight trajectory. Processing, orthorectification and analysis of the Mako data were performed using the ENVI 5.4 software package.
Mako at-sensor radiance data (RM) from the noon overpass appear to display more high-frequency noise than that found in the predawn overpass (Figure 4). In-flight calibrations, which demonstrate similar at-sensor measurement noise levels during both overpasses, suggest that effective high-frequency atmospheric lines (e.g., CO2, CH4, N2O, H2O, and O3) are more likely responsible for this difference between the predawn and noon radiance data. However, because H2O is the only atmospheric component directly measured during both overpasses through the radiosonde launches (Figure 5), atmospheric corrections for the other components were based on an assumed model atmosphere, and thus cannot explicitly account for predawn and noon differences. To reduce the impact of these uncompensated high-frequency changes in atmospheric effects we co-added the adjacent native full-resolution 128-channel noon data into 43 spectral channels. Although reducing spectral resolution, this binning also reduced the noise level in the spectrally degraded noon data to match that of the predawn overpass.

3.3.2. Mako Atmospheric Corrections and Retrieval of Surface T and ε

Two radiosonde launches from the validation site were used to characterize atmospheric conditions close in time to the two Mako overpasses (Figure 5A). The first launch was at 0535 and reached an altitude of 12 km above sea level and the second was at 1135, reaching an altitude of 9 km above sea level. Atmospheric profiles from these radiosonde data were used to drive MODTRAN-4 simulations to infer atmospheric ground-to-Mako transmissivity (τ), up-welling path radiance (S), and down-welling sky irradiance (S). Higher-level MODTRAN versions appear to have little effect at the spectral resolution of ASTER. The model parameters τ, S, and S were, then, used to calculate surface-emitted radiation values (R), according to
R = R M τ 1 S τ 1 ρ S π 1
where ρ = 1 ε is the (unknown) surface reflectivity. For each Mako overpass this calculation involved a three-stage process as follows: (i) Application of atmospheric corrections for τ and S to obtain land-leaving radiance values ( R L = R M τ 1 S τ 1 ) for each image pixel; (ii) application of the NEM algorithm [27,28] to RL to obtain a first approximation of ε in each of the Mako channels, assuming a maximum emissivity value ( ε m a x ) of 0.985 (as determined from the laboratory spectra (Figure 2) occurs in one of the Mako channels; and (iii) correction of RL using the value of ε found in step ii for surface-reflected S to obtain R in all Mako channels for each image pixel.
Ultimately, surface T and ε were retrieved from the Mako surface-emitted radiance (R) values in the following two ways: (i) Re-application of the NEM algorithm (with ε m a x i m u m = 0.985) to R to obtain final surface T estimates (Figure 5) as well as ε in all Mako channels at 2.2 m/pixel (“Mako NEM”) (Figure 6), and (ii) application of the ASTER TES algorithm to Mako R values (“Mako TES”) (Figure 7). For Mako TES, the Mako spectral channels were co-added to simulate the five ASTER TIR channels spectrally and the Mako pixels were co-added to obtain 90 m/pixel data to simulate ASTER spatially. T and five ASTER-like spectral channels of ε were retrieved using TES from the resampled Mako noon radiance data (Figure 7).

3.3.3. AST05

Daytime and nighttime ASTER AST05 ε images from 21 dates between 2001 and 2018 were downloaded from NASA’s “EarthData” website (https://search.earthdata.nasa.gov) after visual evaluation for cloud cover and clarity (Table 1). Twelve daytime and nine nighttime acquisitions were selected to represent cloud-free conditions during all seasons of the year. The AST05 products analyzed were processed with the following three different atmospheric correction protocols: (i) The NCAR/NCEP atmospheric correction protocol (“standard correction”), (ii) the NCAR/NCEP atmospheric correction protocol using the WVS correction (“WVS correction”), and (iii) with the MODIS MOD07 [23] atmospheric correction protocol. MOD07 corrections were available only for daytime images. The mean ε values for the 3 × 3 pixel test area (Figure 6, Figure 7 and Figure 8) west of the Osborne Lookout from each AST05 scene are listed in Table 1.

4. Results

4.1. Laboratory Analyses

Quartz is the dominant mineral phase at the surface of the Algodones dunes [16]. The XRD analyses we conducted for samples collected from surfaces of the four primary scene elements in the test area confirm that all have a similar mineralogical composition of >70% quartz, 5% to 20% K-feldspar, <5% plagioclase, and <5% calcite (by weight). The PSDs of the dune elements are also similar with measured median (d50) values of 240, 232, and 190 μm for the dune crest, slipface, and interdune flat, respectively (Figure 2A). Laboratory emissivity spectra reveal effectively overlapping spectra for all four scene elements (Figure 2B). All the spectra are dominated by the “quartz doublet” Reststrahlen bands at ~8.4 and 9.3 μm and the smaller quartz bands at 12.5 and 12.8 μm. Spectral measurements for grain-size splits revealed that, as expected, the depth of the Reststrahlen bands consistently decreases with decreasing grain size for all four scene elements (Figure 2C–F). Nonetheless, these prominent grain-size effects do not translate to significant spectral variability among the scene elements when measured as bulk “whole” samples. All the spectral measurements show an emissivity maximum of 0.985 at ~12.3 μm.

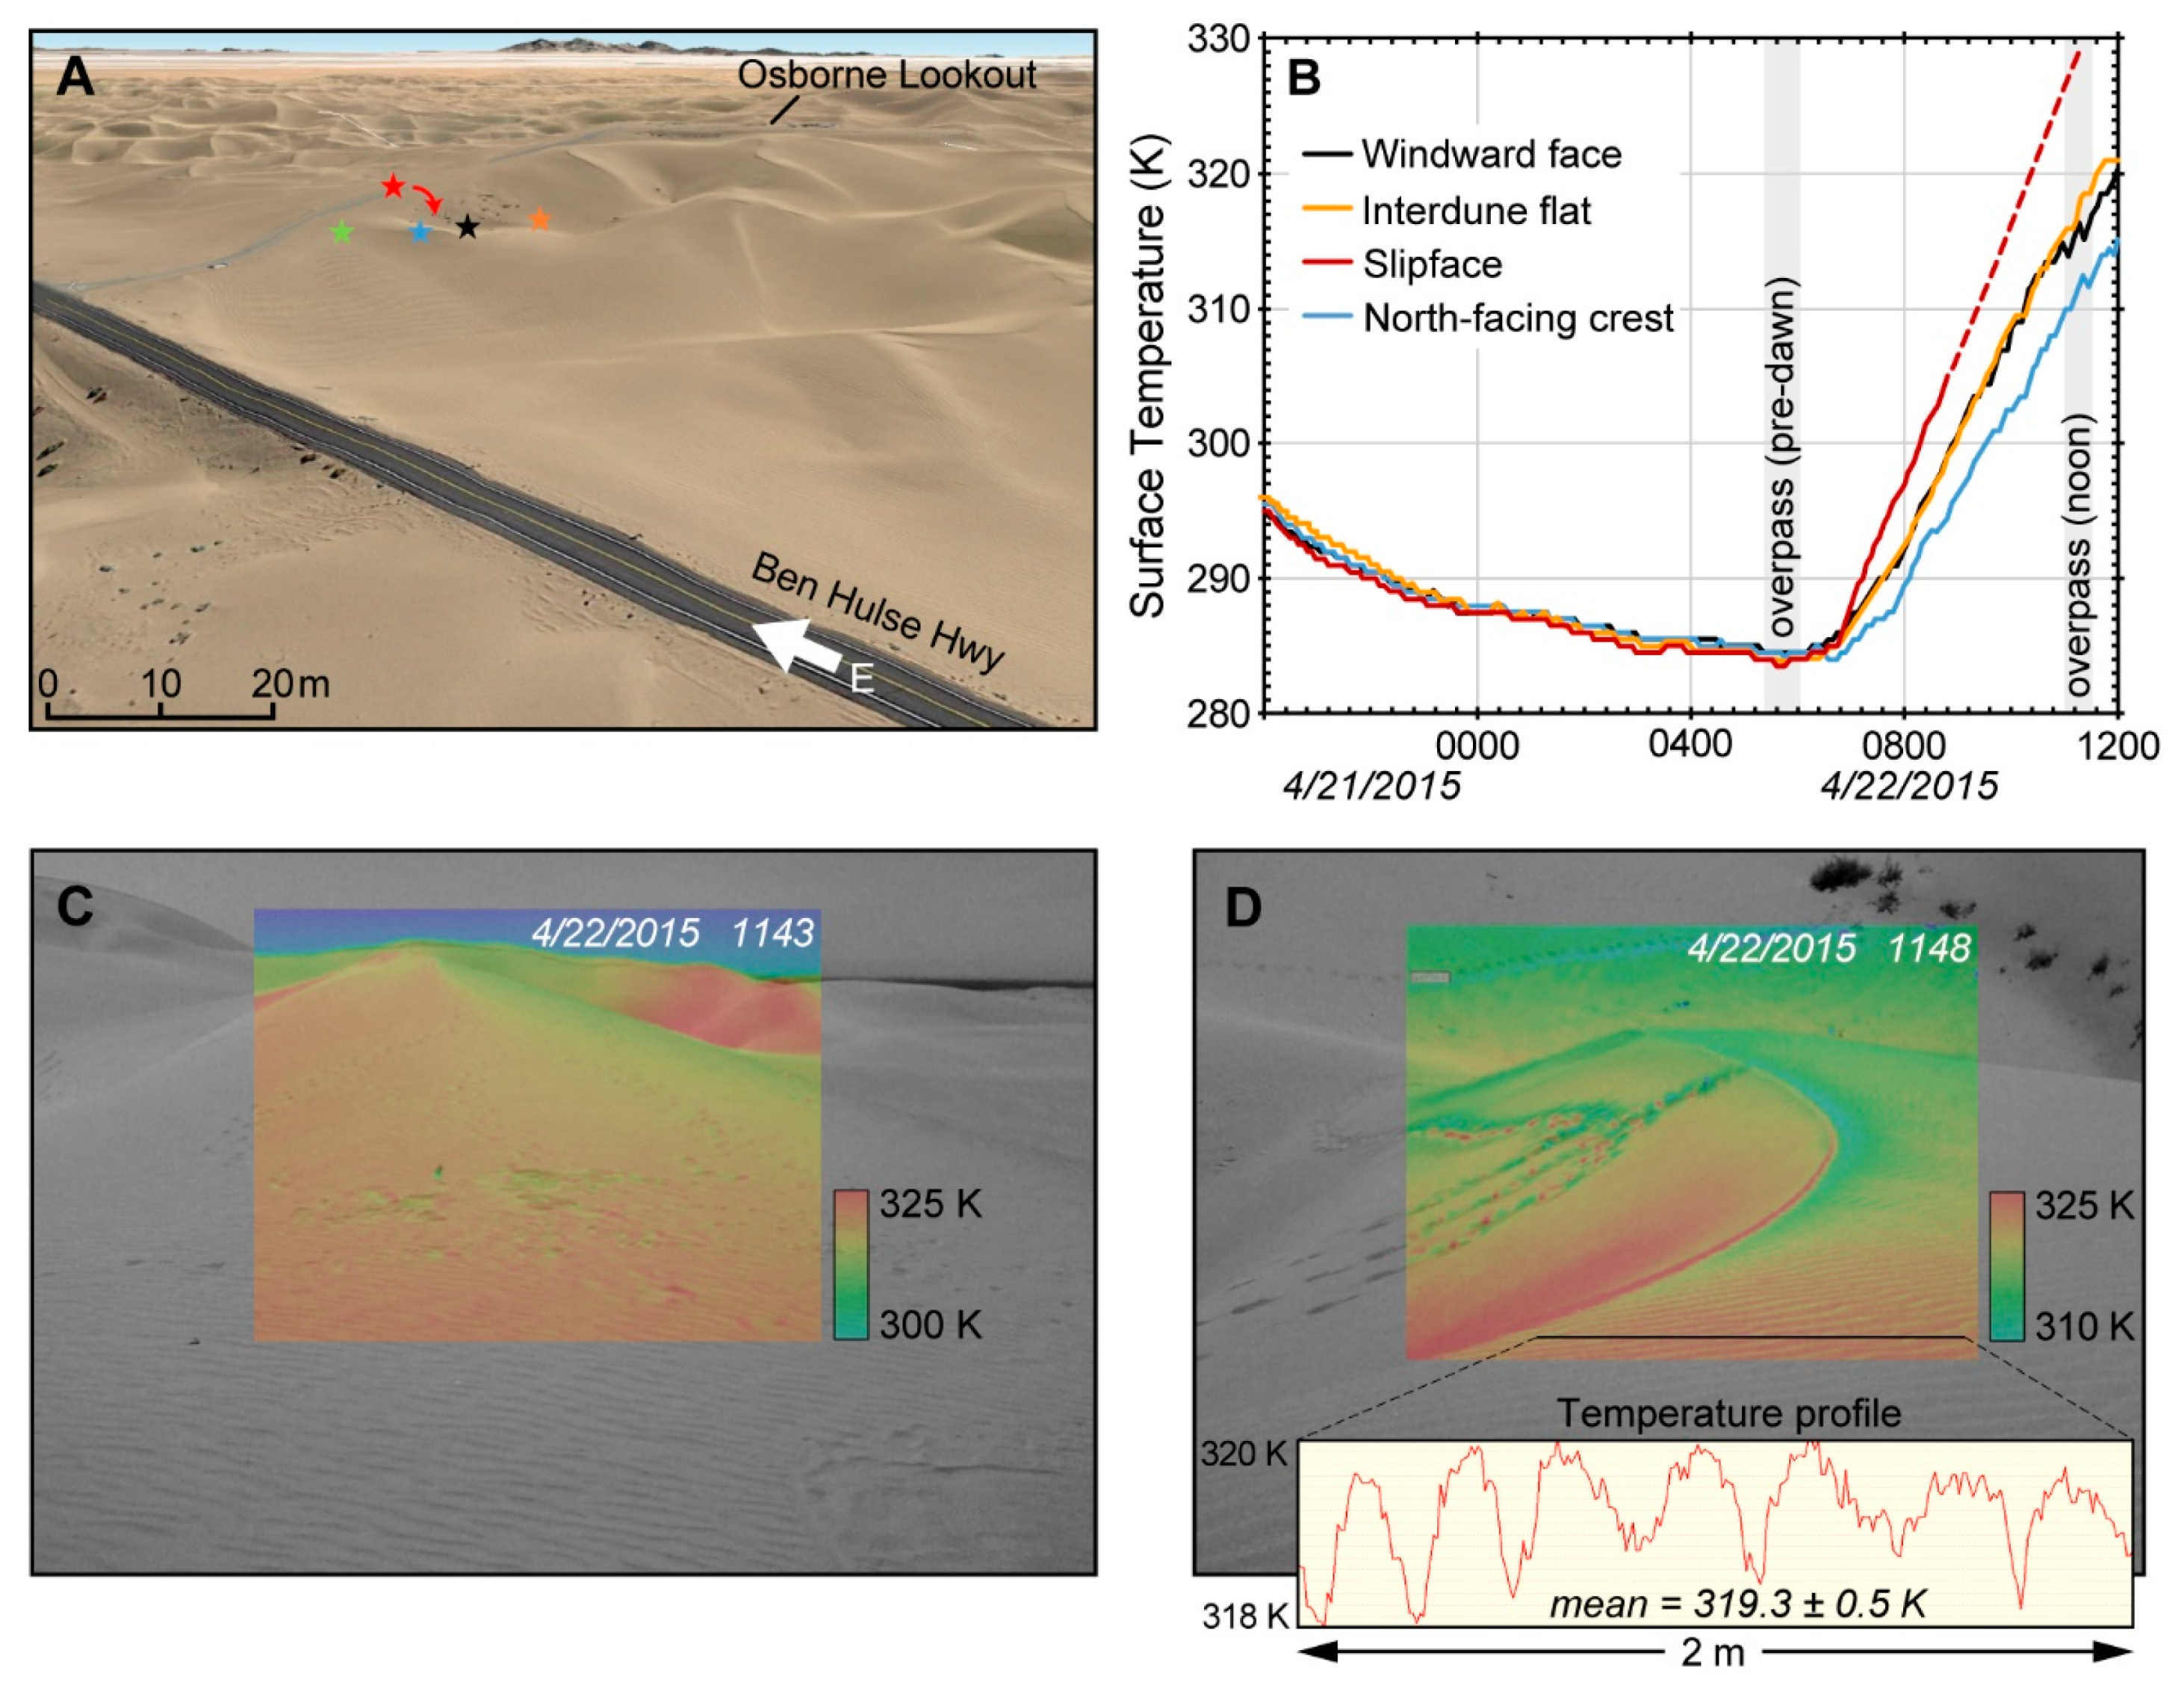
4.2. Field-Based Temperature Measurements

Surface temperature measurements were obtained for the four dune elements during the 16 h time period between 21 and 22 April 2015 at 2000 and 1200, respectively (Figure 3). These measurements revealed tightly clustered temperatures between 284 and 285 K during the predawn Mako overpass at 0545. After sunrise, surface temperatures for all scene elements steadily increased. Because this increase in T occurred at different rates, which were effectively dictated by surface topography and surface-sun geometry, the range and variability of T across the different surface elements also steadily increased during the morning hours after sunrise. Wind-driven erosion around the iButton sensor on the directly sunlit slipface facing 30° ESE resulted in termination of T measurements for this dune element at 0900, when a range of 296–303 K was recorded among the dune elements. Extrapolation of the warming trend measured for the slipface suggests that surface temperatures during the noon overpass ranged between 311 K (measured for a shaded N-facing part of the crest) and ~330 K (extrapolated for the slipface) (Figure 3B). FLIR temperature images acquired during the day overpass support this ~20 K temperature range between the different dune elements (Figure 3C). The FLIR images also show that sub-meter T variability due to ripple morphology on the dune surfaces reached ~2 K during the noon overpass (Figure 3D). FLIR imaging also illustrates the sharp discontinuity in surface T at the crest of the dunes, where a 20 K “jump” in T can occur within 20 to 30 cm across the dune crest at noon. Sharp T transitions at the dune crests such as these cannot be resolved even in the Mako 2.2 m/pixel images.

4.3. Remotely Sensed Data

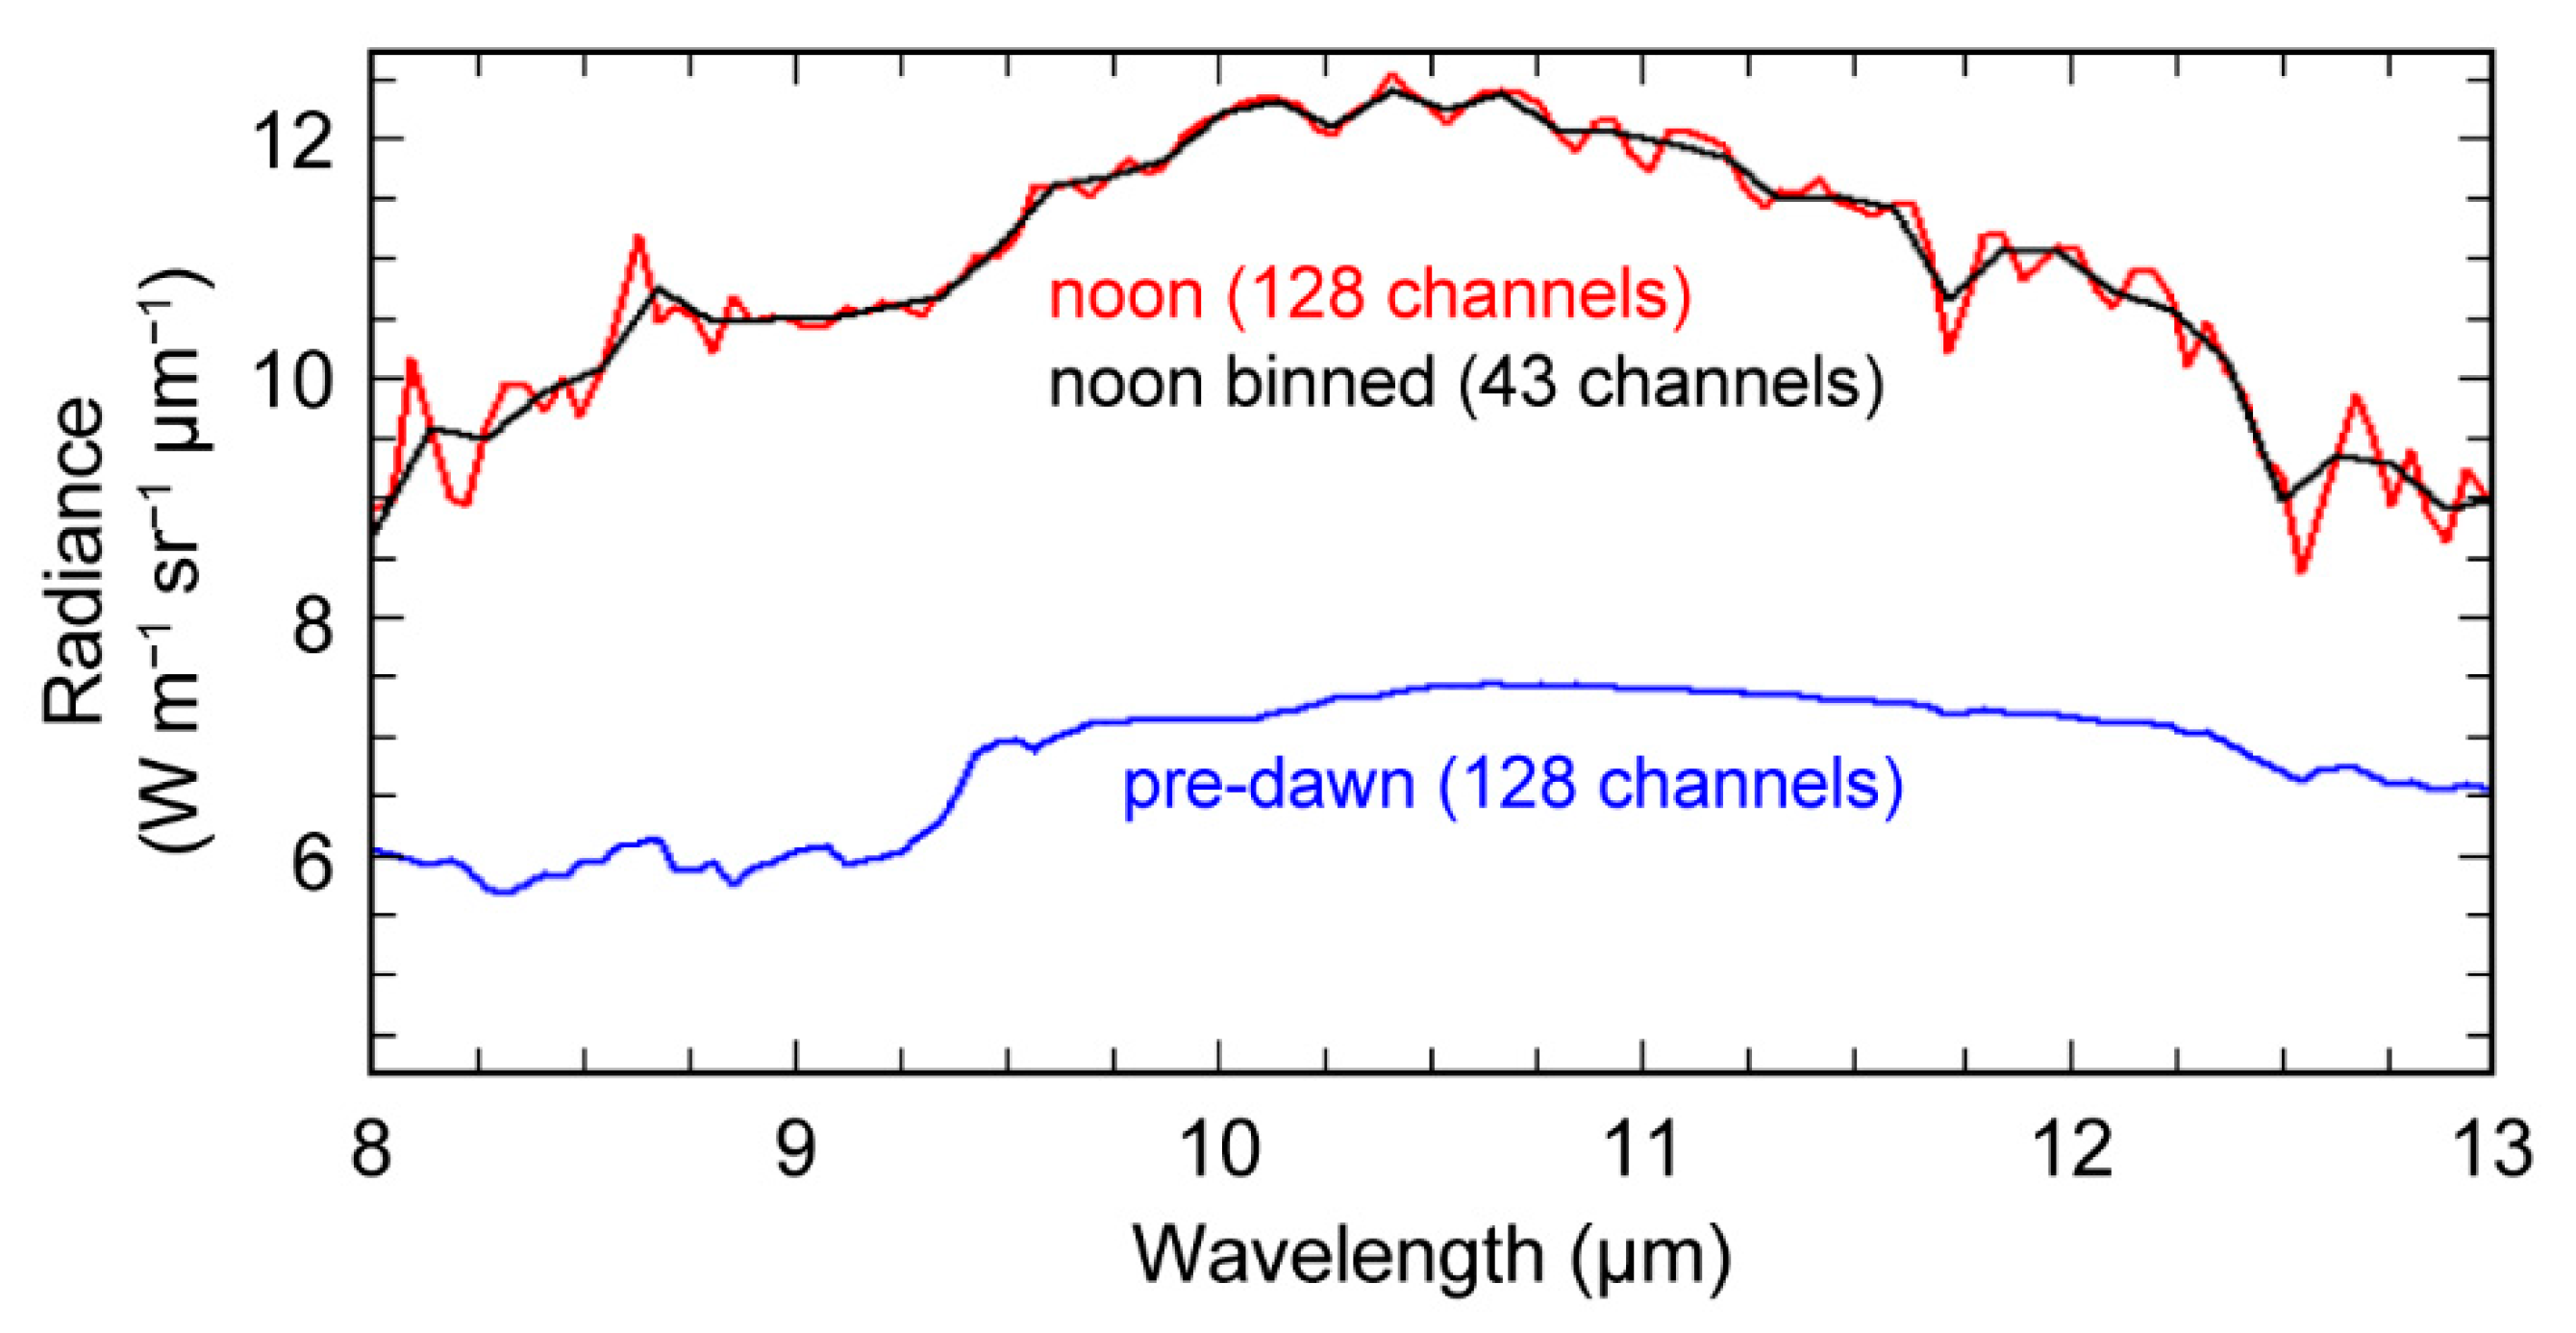
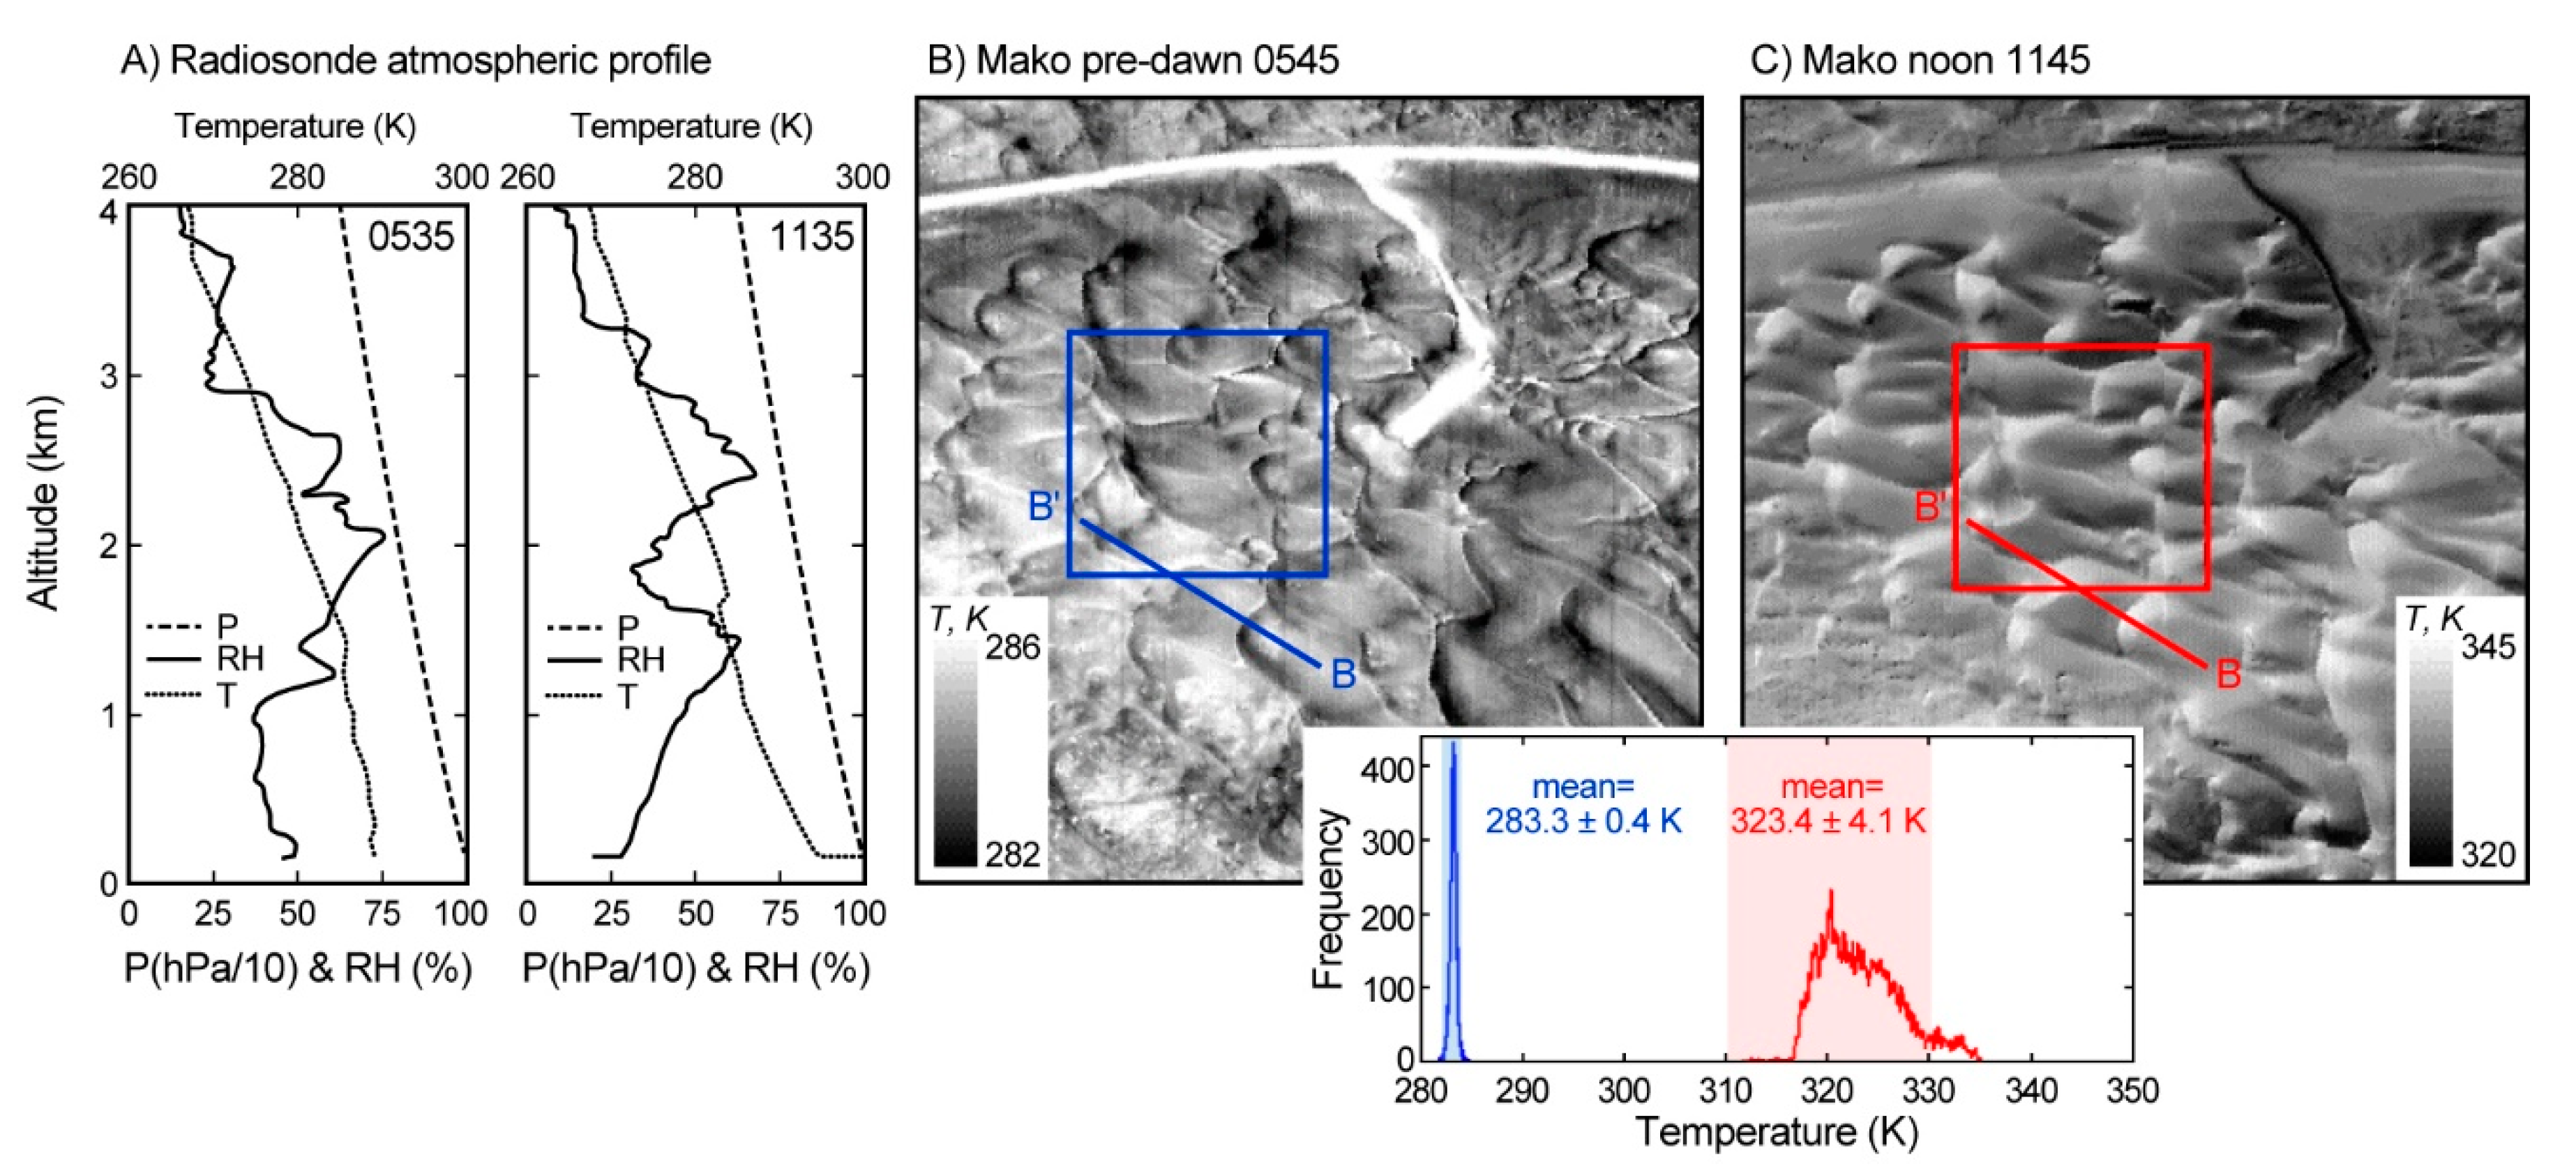
4.3.1. Atmospheric Conditions during Mako Overpasses

Near-surface air temperatures recorded by the radiosonde during the predawn overpass ranged between 288 and 289 K (Figure 5) and were 4 to 5 K higher than the predawn surface temperatures (Figure 3). Relative humidity values during the predawn overpass ranged from 49% to 38% within the lower 1 km of the atmosphere. During the noon overpass near-surface temperatures ranged between 294 and 300 K and were up to 35 K lower than surface T’s on the warmest surface elements. Noontime relative humidity steadily increased upwards from ~20% to ~50% within the lower 1 km of the atmosphere.

4.3.2. Mako NEM Surface Temperatures

Predawn surface temperatures recovered from Mako within a 270 × 270 m test area near the Osborne Lookout all fell between 281.5 and 285.8 K with an average of 283.3 ± 0.4 K (Figure 4). This temperature range is in agreement with the ground measurements obtained at time of overpass for the four scene elements, which ranged between 284 and 285 K (Figure 3). Surface temperatures within the same 270 × 270 m test area recovered from the noon Mako overpass all fell between 311.2 and 335.6 K, with an average of 323.4 ± 4.1 K. These temperatures agreed with the ground measurements obtained at time of overpass for the four scene elements, which ranged between 311 and 330 K.

4.3.3. Mako NEM Emissivity Retrievals

Dune crests are narrow features that are not all resolved by Mako, and therefore are omitted as resolved scene elements in the Mako images. The mean predawn Mako NEM 128 channel spectra for the other three resolved dune elements (32 pixels for each) all display the ”quartz doublet” Reststrahlen bands at ~8.4 and 9.3 μm and the smaller quartz bands at 12.5 and 12.8 μm (Figure 6). The mean ε spectra for slipfaces and interdune areas effectively overlap with each other throughout Mako’s 8 to 13 μm spectral range. The mean windward spectrum effectively overlaps with the slipface and interdune spectra outside the Reststrahlen bands and is ~0.01 lower within them. Accordingly, windward slopes appear to have slightly greater spectral contrast than the other dune elements when imaged at predawn with Mako. The predawn Mako NEM spectra for all the dune elements resemble their Nicolet spectra, except between ~9.0 and 11.6 μm where the Mako spectra all plotted above the Nicolet spectrum by up to 0.04 in some wavelengths. The average Mako NEM spectrum from the 270 × 270 m test area, i.e., ~15,000 Mako 2.2 m pixels, plotted similarly as compared with the Nicolet spectra. The standard deviation of the Mako NEM spectrum for the 270 × 270 m area from the mean is less than 0.005 except within the Reststrahlen bands, where standard deviations reach 0.01.
Similar to the predawn spectra, the mean Mako noon NEM spectra for slipface and windward slopes, as well as interdune flats, all display the Reststrahlen bands and the smaller quartz bands at 12.5 and 12.8 μm (Figure 6). Slipface and interdune spectra effectively overlap with each other throughout the 8 to 13 μm spectral range. The spectrum for windward slope effectively overlaps with the spectra of the slipface and interdune areas outside the Reststrahlen bands and is up to 0.01 lower within the Reststrahlen bands. Thus, as observed in the predawn Mako data, windward slopes appear to have slightly greater spectral contrast than the other dune elements. The noon Mako NEM spectra for all dune elements effectively plot on the Nicolet ε spectrum of these dune elements except for the spectral peak near 8.6 μm, between the Reststrahlen bands, where Mako NEM spectra are ~0.04 lower. The average Mako NEM spectrum from the 270 × 270 m test area, i.e., ~15,000 Mako 2.2 m pixels, correlates similarly with the Nicolet spectra. The standard deviation of the Mako NEM spectrum for the 270 × 270 m test area from their mean is less than 0.005 except within the Reststrahlen bands, where standard deviations are as large as 0.01.
Spectrally resampled to ASTER’s TIR channels predawn Mako ε for the slipface, windward, and interdune scene elements consistently plot ~0.01 above the noon ε retrievals for these scene elements (Figure 6D). In both the predawn and noon data, NEM emissivities for the windward slope in ASTER Channels 10 to 12 plot ~0.01 below the retrieved emissivities for the slipface and interdune areas. This offset in retrieved ε does not occur in ASTER Channels 13 and 14.

4.3.4. TES Simulations Using Mako Data

The robust compatibility between Mako NEM surface temperatures and emissivities with the “ground truth” measurements (Figure 5 and Figure 6) indicates adequate atmospheric corrections and robust calibration of at-sensor radiance values to land-emitted radiation values for both overpasses. Here, we use these calibrated land-emitted radiation data to test the performance of the TES algorithm for a real geologic surface and with real TIR data that were optimally corrected for atmospheric effects (Figure 7). The mean of the noon Mako TES emissivities from the 270 × 270 m test area (nine ASTER-like pixels) all plot consistently ~0.01 below Mako NEM mean ε for the same test area.

4.3.5. Accuracy of the AST05 Products

The validated Mako ε retrievals (Figure 6) were used to test the performance of the AST05 products over the Algodones test site with the implicit assumption that the spectrum of the vegetation-free dunes does not change significantly over time (e.g., [16,32]). For ASTER Channels 13 and 14, all the AST05 emissivities for both night and day fell within ±0.005 of each other (i.e., precision) and within ±0.005 of Mako NEM (Table 1 and Figure 8). For Channels 10 to 12: (i) The means of nighttime AST05 emissivities processed with the ”standard atmospheric” correction were 0.02 to 0.04 below Mako with standard deviations of up to 0.035; (ii) the means of nighttime AST05 with “WVS” correction were within 0.01 from Mako with standard deviations of up to 0.035; and (iii) the means of daytime AST05 Channels 10 to 12 emissivities processed with “standard”, “WVS”, and “MOD07” correction all cluster together within 0.01 below Mako with standard deviations of ~0.015.

5. Discussion

5.1. TIR Site Characterization at Sub-Mako Scales

5.1.1. Mineralogy and Grain-Size Effects

Nicolet ε spectra of the windward and slipface sections of the dunes and the interdune flats that occur between them effectively overlay each other to within 0.005 throughout the 8 to 13 μm spectral range (Figure 2). This spectral commonality reflects the relatively homogeneous quartz-dominated sand mineralogy of these different dune elements as revealed with the XRD analyses. We should not expect spectral differences over the Algodones test site due to mineralogical composition.
The Nicolet spectra demonstrate a dependency of ε on grain size. As the effective grain diameter is increased from 45 to >250 μm in splits of sieved sand the spectral contrast of the sieved samples increases (Figure 2). This is clearest for the Reststrahlen bands, which are noticeably deepened. However, this pronounced grain-size effect does not translate into significant spectral variability among the primary scene elements at Algodones because of their similar grain-size distributions (Figure 2A). At other dune fields, in which sorting is more heterogeneous, grain-size effects could lead to greater spectral variability.

5.1.2. Anisothermal Effects

Spectral “checkerboard” mixing of scene elements having different temperatures will cause the effective emissivity of the mixed region to differ from the spectrum of the components (e.g., [35]). This is because the average of multiple Planck functions, each for a different temperature, is not itself a Planck function, but it is assumed in ε retrieval that the radiance spectrum for a blackbody is one. Model calculations for checkerboard mixing considering the T conditions observed on the ground at Algodones (Figure 3) indicate that the magnitude of the distortion of the retrieved mixed ε spectrum, even at noon, is <0.005, smaller than the predicted precision of AST05.

5.1.3. Multiple-Reflection Effects

The dunes are not topographically flat, and some scene elements are irradiating each other, leading to reduction of spectral contrast. This “cavity-radiation” effect operates for both isothermal and anisothermal surfaces. It raises effective ε selectively at wavelengths for which ε is low, and therefore the reflectivity is high. As a result, the depth of the Reststrahlen bands of dune elements that experience multiple reflection can become effectively reduced as compared with their depth in laboratory spectra of the same sand. This cavity-radiation effect will vary from pixel to pixel as is dictated by the local topographic setting and the time of day due to the local sun angle.
A simple “first reflection” model for the radiance Ri from the “interrogated” scene element i is the radiance Re emitted from that element plus the radiance Rn from a neighboring element n that is incident upon element i and reflected to the sensor. Both terms are given by Planck’s law, Equation (1), in which R is a function of local scene emissivity ε and T.
R i   =   R e ( ε i ,   T i ) + f n 1 π ( 1 ε i ) R n ( ε n ,   T n )
where fn is the fraction of the sky hemisphere subtended by element n and (1   εi) is the reflectivity of element i as given by Kirchhoff’s law (see Danilina et al. [30] for further details). For the observed noon surface temperatures at Algodones (Figure 3) and the Nicolet spectra (Figure 2), and if f is ~5%, this model predicts that cavity radiation could account for an ε increase of ~0.05 near the Reststrahlen bands in the most extreme cases where element i is shaded and cool, and element n is warm.

5.2. Emissivity Retrievals with Mako

The hyperspectral resolution of Mako and its extended spectral range to 13 μm both facilitate the core assumption of the NEM approach that a maximum emissivity value ( ε m a x ) actually occurs within one of the spectral channels. In the specific case of Mako at Algodones we assigned an assumed ε m a x value of 0.985, which was the maximum value consistently observed in the Nicolet spectra for all scene elements. This ε m a x occurred at ~12.8 μm, within the spectral range of Mako (Figure 2).

5.2.1. Moisture Effects in Mako Day and Night Emissivity Retrievals at Algodones

Because the mineralogical composition of the dune elements is invariant, it is generally assumed that the retrieved emissivities are too, if correctly determined. However, there is a consistent change in the retrieved Mako NEM ε between the predawn and noon acquisitions as the predawn spectra for all scene elements are up to 0.04 higher than the Nicolet spectra between ~9.0 and 11.6 μm, whereas the noon emissivities are in good agreement with the Nicolet spectra throughout the spectral range (Figure 6). The near isothermal conditions during the predawn acquisition (Figure 5) suggest that the effects of checkerboard thermal mixing or multiple scattering (cavity radiation), discussed above, are less likely to have a significant impact on the predawn emissivities. Furthermore, the spectral range of the observed increase in Mako NEM ε between ~9.0 and 11.6 μm is inconsistent with that expected from cavity radiation, which should preferentially occur in spectral regions of low ε (high ρ) such as the Reststrahlen bands near ~8.4 and 9.3 μm. Instead, the observed deviation of predawn Mako NEM emissivities from the Nicolet spectra (Figure 6B) more closely resembles the ε increase previously shown for sand dunes in the presence of soil moisture [36,37].
Moisture content in the Algodones dunes was not directly measured during the Mako overpasses. However, the significantly higher near-surface atmospheric relative humidity values measured from the radiosonde during the predawn vs. noon overpasses, i.e., ~50% vs. 20%, respectively (Figure 5), suggest that more atmospheric moisture was adsorbed on grain surfaces during the predawn overpass than at noon. Previously, soil moisture following rain events has been identified at Railroad Valley (Nevada, USA) as a source of concern for TES validation (e.g., [19]), but dune fields have been thought to have been more consistently dry. Spectrally resampled to ASTER’s TIR channels, we find that this prominent day/night change in Mako emissivities at Algodones, which we attribute to increased predawn atmospherically sourced adsorbed soil moisture, translates to an overall ε increase of ~0.01 to 0.02 in all ASTER channels during the predawn acquisition with little change to spectral shape or contrast (Figure 6D). It could be that surface soil moisture should be measured as a routine part of TES validation experiments.

5.2.2. Scaling Up from Lab to Mako Emissivities

Scaling up from laboratory measurements (Figure 2) to remotely sensed measurements at 2.2 m/pixel consistently increased effective emissivities near the Reststrahlen bands at ~8.4 and 9.3 μm by ~0.01 for the slipface and interdune areas during both predawn and noon acquisitions (Figure 6). This spectral behavior is consistent with multiple reflections between the steep slipfaces and the adjacent interdune areas as compared with the lower-gradient windward faces for which f in Equation (4) is lower and cavity radiation effects do not appear to be significant. Thus, the field setting is fundamentally different than the laboratory setting in a way that influences ε, even if only at the percent level for carefully chosen sites.

5.2.3. Spectral Variability of the Algodones Site Mapped with Mako

In Figure 9, we use the Mako NEM ε ratio between ASTER-like Channel 13 and ASTER-like Channel 12, i.e., 10.7/9.1 μm, as a proxy for mapping the variability in spectral contrast among the Algodones dune elements. This ε ratio is closer to unity for spectrally flatter spectra. Mako pixels with a high fraction of vegetation cover (“vegetated pixels”) display lower spectral contrast than vegetation-free pixels and are expressed as a distinct 10.7/9.1 μm ε ratio of ~1.17 in both the predawn and noon overpasses (Figure 9D). Thus, the Mako data demonstrate that the sparse desert vegetation seen in the high-resolution air photos of the Algodones Dunes is not a significant spectral element at the landscape scale because “vegetated” Mako pixels do not show up in the image histograms.
Windward slopes have a 10.7/9.1 μm ε ratio value of 1.27 ± 0.01 as compared with slipface and interdune areas that have distinctly lower ε ratio values of 1.25 ± 0.01 and appear to be more significantly affected by cavity radiation effects (Figure 9C). This ~2% to 4% difference in spectral contrast is similar to the predicted magnitude of cavity-radiation effects on natural geologic surfaces [31,38].
We expect that irradiation of a slope by warmer adjacent scene elements would result in greater cavity-radiation effects (reduction of spectral contrast) than if the adjacent scene elements were cooler. Yet the B-B’ transect demonstrates that although predawn isothermal conditions along the transect break down to T heterogeneity of up to 15 K by noon, due to differential solar heating, the 10.7/9.1 μm ε ratio for the different dune elements does not change significantly between the predawn and noon overpasses (Figure 9C). In both predawn and noon Mako NEM ε images we find the same ~2% to 4% difference between the 10.7/9.1 μm ε ratio for the windward slopes (1.27 ± 0.01) and for the slipface and interdune elements (1.25 ± 0.01) (Figure 9D). Thus, cavity-radiation effects in the Algodones Dunes appear to be dominated by topographic roughness, and any effects of T heterogeneity are secondary.
Whereas Mako’s 2.2 m pixels are sufficient to spatially resolve the primary scene elements (i.e., windward and slipface slopes and interdune flats), ASTER’s 90 m pixels at Algodones are expected to include effective mixtures between them. Figure 10 demonstrates that mixing between windward, slipface, and interdune scene elements could fully account for the distribution of 10.7/9.1 μm ε ratio values (1.257 ± 0.016) within the 270 × 270 m test area (9 ASTER pixels) we use below to test the AST05 product. Examined at an order-of-magnitude larger area of ~2.5 × 2.5 km (Figure 10) the 10.7/9.1 μm ε ratio for the dune field remains similar with a mean of 1.251 ± 0.015 that can also be explained as a mixture of the primary dune elements described above. As this spectral homogeneity to within <1% scales up to moderate spatial resolutions, we suggest that the Algodones dune field can also serve as a validation site for emissivity retrievals from other spaceborne multispectral thermal sensors, such as ECOSTRESS (60 m/pixel) and MODIS (1 km/pixel).

5.3. Testing the TES Algorithm with Mako

The Mako noon data for Algodones provide an opportunity to test the performance of the TES algorithm over a natural geologic surface with high ε contrast using real TIR data optimally corrected for atmospheric effects. For this test, we applied the TES algorithm to Mako calibrated land-emitted radiance data (R) resampled to ASTER-like spectral and spatial resolutions (RAST) to obtain “Mako TES” emissivities for ASTER’s five spectral channels and at 90 m/pixel (Figure 7). While displaying a similar spectral shape, the Mako TES emissivities were consistently 0.01 below Mako NEM emissivities in all channels. This offset in Mako TES emissivities is associated with the scatter about the TES ε m i n vs. MMD regression, Equation (2), which was predicted to be one of the inherent sources of uncertainty in TES. In addition, it appears that effective mixing between surface elements with temperatures ranging between ~310 and ~340 K during the noon acquisition (Figure 5) did not impact TES retrievals.

5.4. Validation of AST05

The mineralogy and PSD measurements, together with Nicolet spectra of the Algodones samples, allowed us to hypothesize minimal compositional and spectral variability across the validation site (Figure 2), as was previously assumed in earlier validation studies at Algodones (e.g., [16,32]). With Mako we confirmed this hypothesis and determined that the natural heterogeneity in surface T and variability in the effective ε of the primary scene elements at Algodones should not significantly affect TES retrievals at ASTER’s spatial scale of 90 m/pixel, provided robust atmospheric corrections are available (Figure 7).
The average daytime AST05 emissivities, for the Algodones 9 pixel (270 × 270 m) test area, were all within the target performance of AST05 (±0.015) for all three atmospheric correction options that were tested, i.e., NCAR/NCEP, WVS, and MOD07 (Figure 8). The AST05 predawn emissivities deviated from the consistent behavior of daytime AST05. Whereas predawn Channels 13 and 14 retrievals for the two available nighttime atmospheric correction methods, i.e., NCAR/NCEP and WVS, were similar to those of the daytime retrievals (accuracy and precision of ~0.005) the repeatability in ASTER Channels 10 to 12 was lower (Figure 8). The precision of AST05 processed with NCAR/NCEP standard corrections was 0.035, 0.020, and 0.020 for channels 10, 11 and 12, respectively. The means were 0.04, 0.02 and 0.02 lower than Mako NEM for Channels 10, 11, and 12, respectively. The precision of the AST05 nighttime products processed with the WVS correction option was similar, but their accuracy was significantly better, as the means in Channels 10, 11, and 12 were 0.02, 0.005, and 0.005 lower than Mako NEM, respectively. Therefore it appears that WVS atmospheric correction is the preferred option for obtaining AST05 retrievals that meet the anticipated performance, except for Channel 10 retrievals which remain slightly below the target accuracy even with the WVS correction.
Soil moisture increased predawn Mako NEM emissivities in all the ASTER-channel wavelengths by 0.01 as compared with Mako NEM noontime emissivities for the 270 × 270 m dune area that was used to validate the AST05 retrievals (Figure 6D). Yet, it appears that this soil-moisture effect did not impact AST05 because AST05 retrievals in Channels 13 and 14 did not change and remained stable and accurate in both day as well as night acquisitions (Figure 8). We suggest that the different overpass times between ASTER night acquisitions (~2230) and the predawn Mako experiment (0535) can account for the absence of the soil moisture effect in AST05 night retrievals at Algodones. As air and surface temperatures typically decrease over the course of the night (e.g., Figure 3), the possibility of developing suitable conditions for effective adsorption of atmospheric humidity into the soil increases as the night progresses. Therefore, it appears that when spectrally significant adsorption of atmospheric humidity occurs at Algodones, it typically happens after the time of ASTER’s overpass.
The differences between AST05 day and AST05 night retrievals occur mainly in Channels 10 to 12, whereas Channel 13 and 14 emissivities are stable (Figure 8). Coincidently, the spectral range of ASTER Channels 10 to 12 is where both cavity radiation as well as atmospheric effects would be expected to impact AST05 retrievals more significantly. The former because of the lower ε values of the Algodones sand at these wavelengths (Figure 2), which would account for a more prominent cavity radiation effect (Equation (4)), and the latter because of the larger atmospheric contributions at these wavelengths (Figure 6D), which have to be accurately corrected for. However, as Mako NEM retrievals reveal an invariant 2% to 4% cavity radiation effect in both the predawn and noon overpasses (Figure 9C,D) we suggest that residual atmospheric effects lead to the somewhat degraded performance of AST05 nighttime retrievals. We also find that this problem with AST05 retrievals is most pronounced in Channel 10, which has been previously identified as the ASTER TIR channel most impacted by atmospheric effects (e.g., [39]).

6. Conclusions

This paper focused on testing the performance of the ASTER TES algorithm and the AST05 product over the Algodones dunes, which provide a natural geologic surface of high ε contrast that is the type of surface that the TES algorithm was designed for. Mako hyperspectral data with 2.2 m/pixel resolution allowed us to constrain the magnitude of the inherent uncertainty associated with validation of remotely sensed thermal data acquired at 90 m/pixel against centimeter-scale laboratory spectra. Our main findings are as follows:
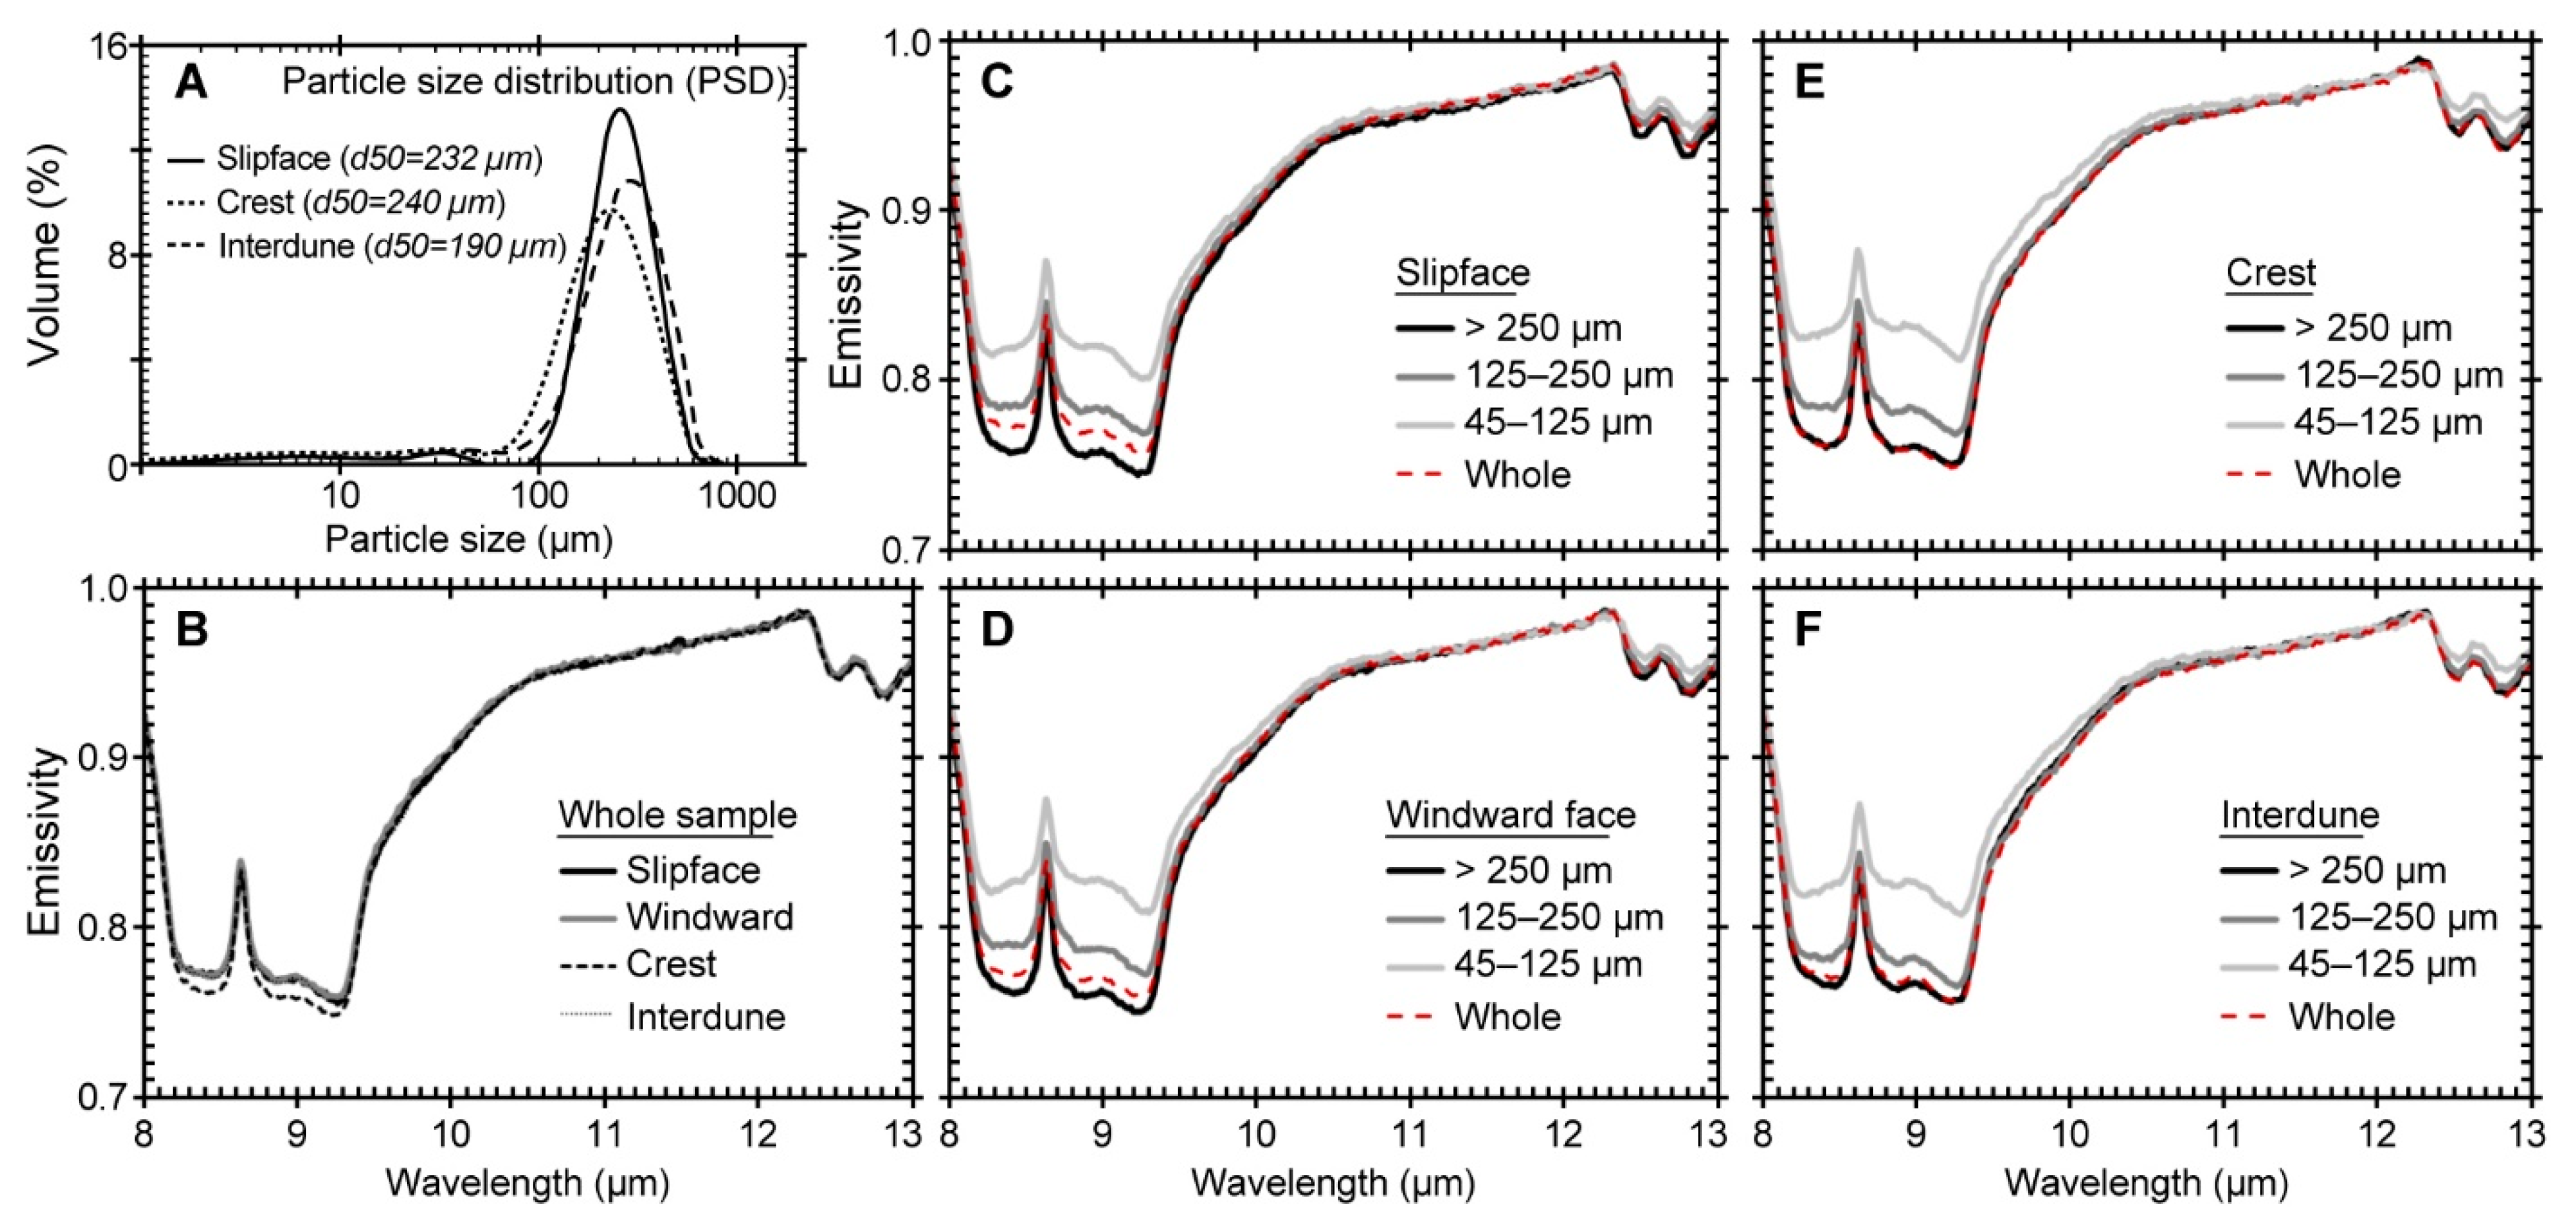
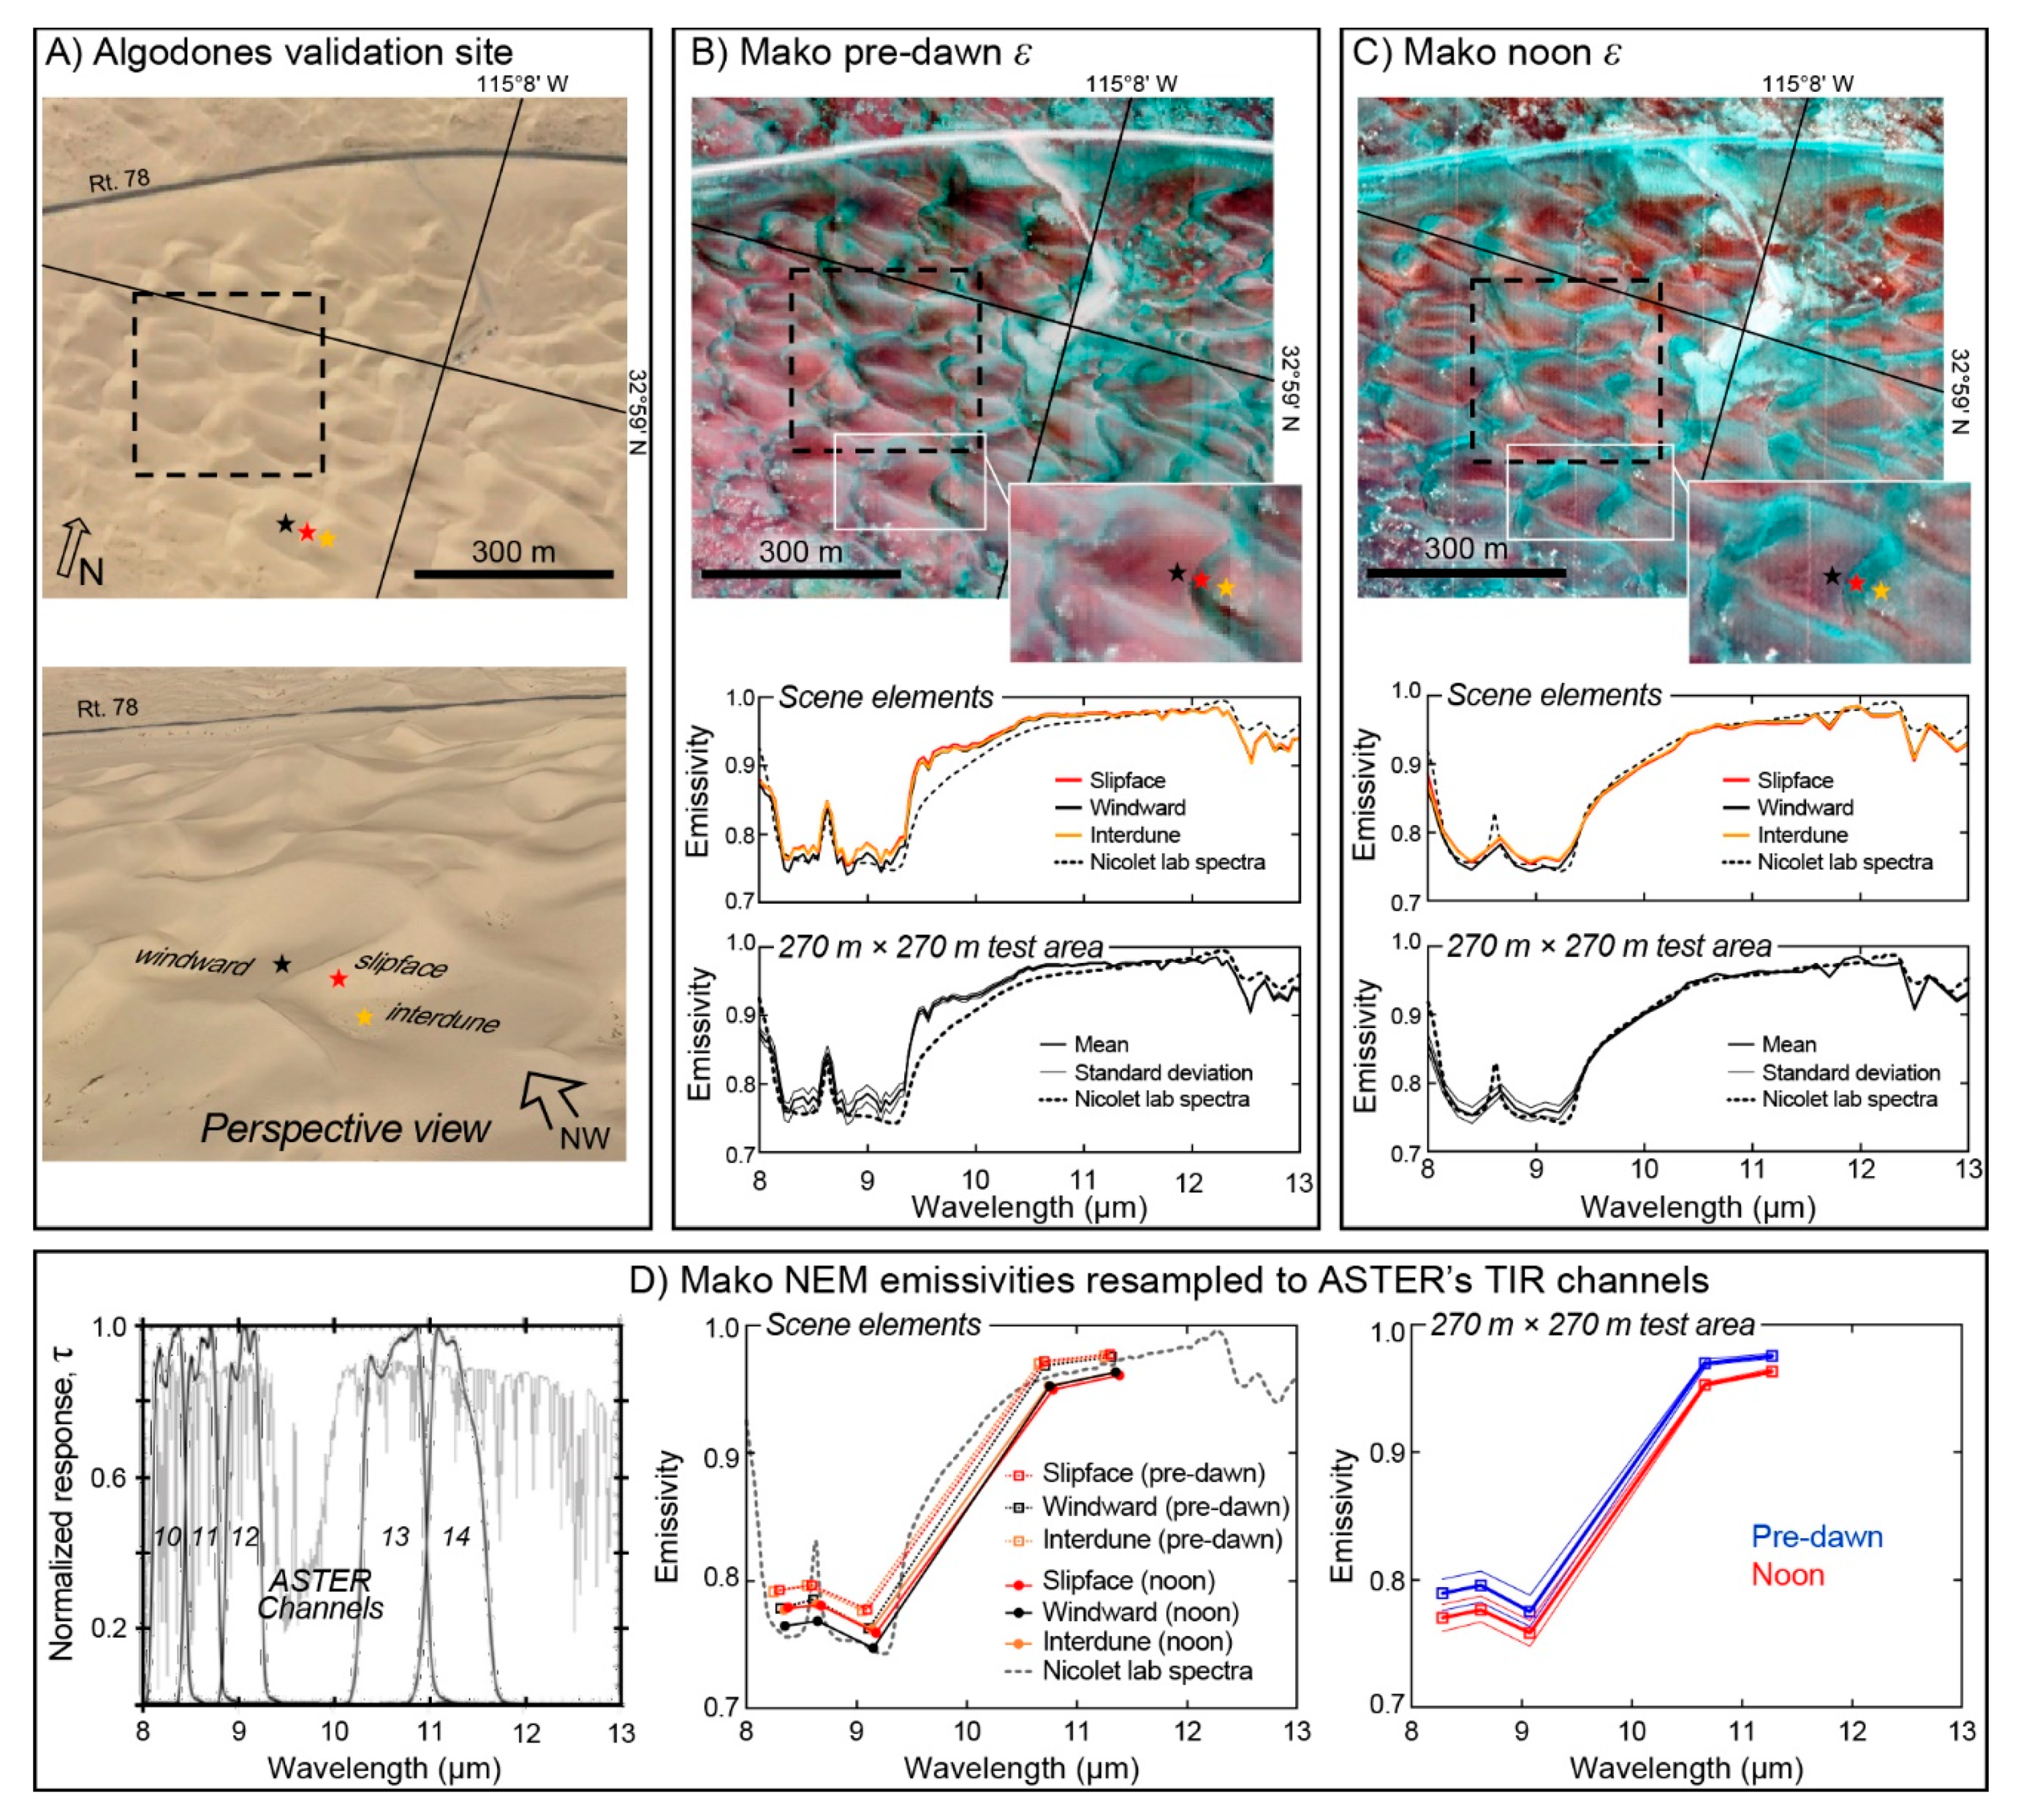
  • Laboratory emissivity spectra for the Algodones sand revealed pronounced grain-size effects on the depth of the Reststrahlen band absorption (Figure 2). Using Mako’s 2.2 m/pixel resolution to resolve the primary scene elements in the dune field we were able to demonstrate that this spectral dependency on grain size does not translate into significant emissivity variability at Mako and ASTER scales (Figure 6 and Figure 9) because grain-size distribution is roughly uniform across the dune field. However, at other dune fields, in which sorting is more heterogeneous, grain-size effects could lead to significant spectral variability.
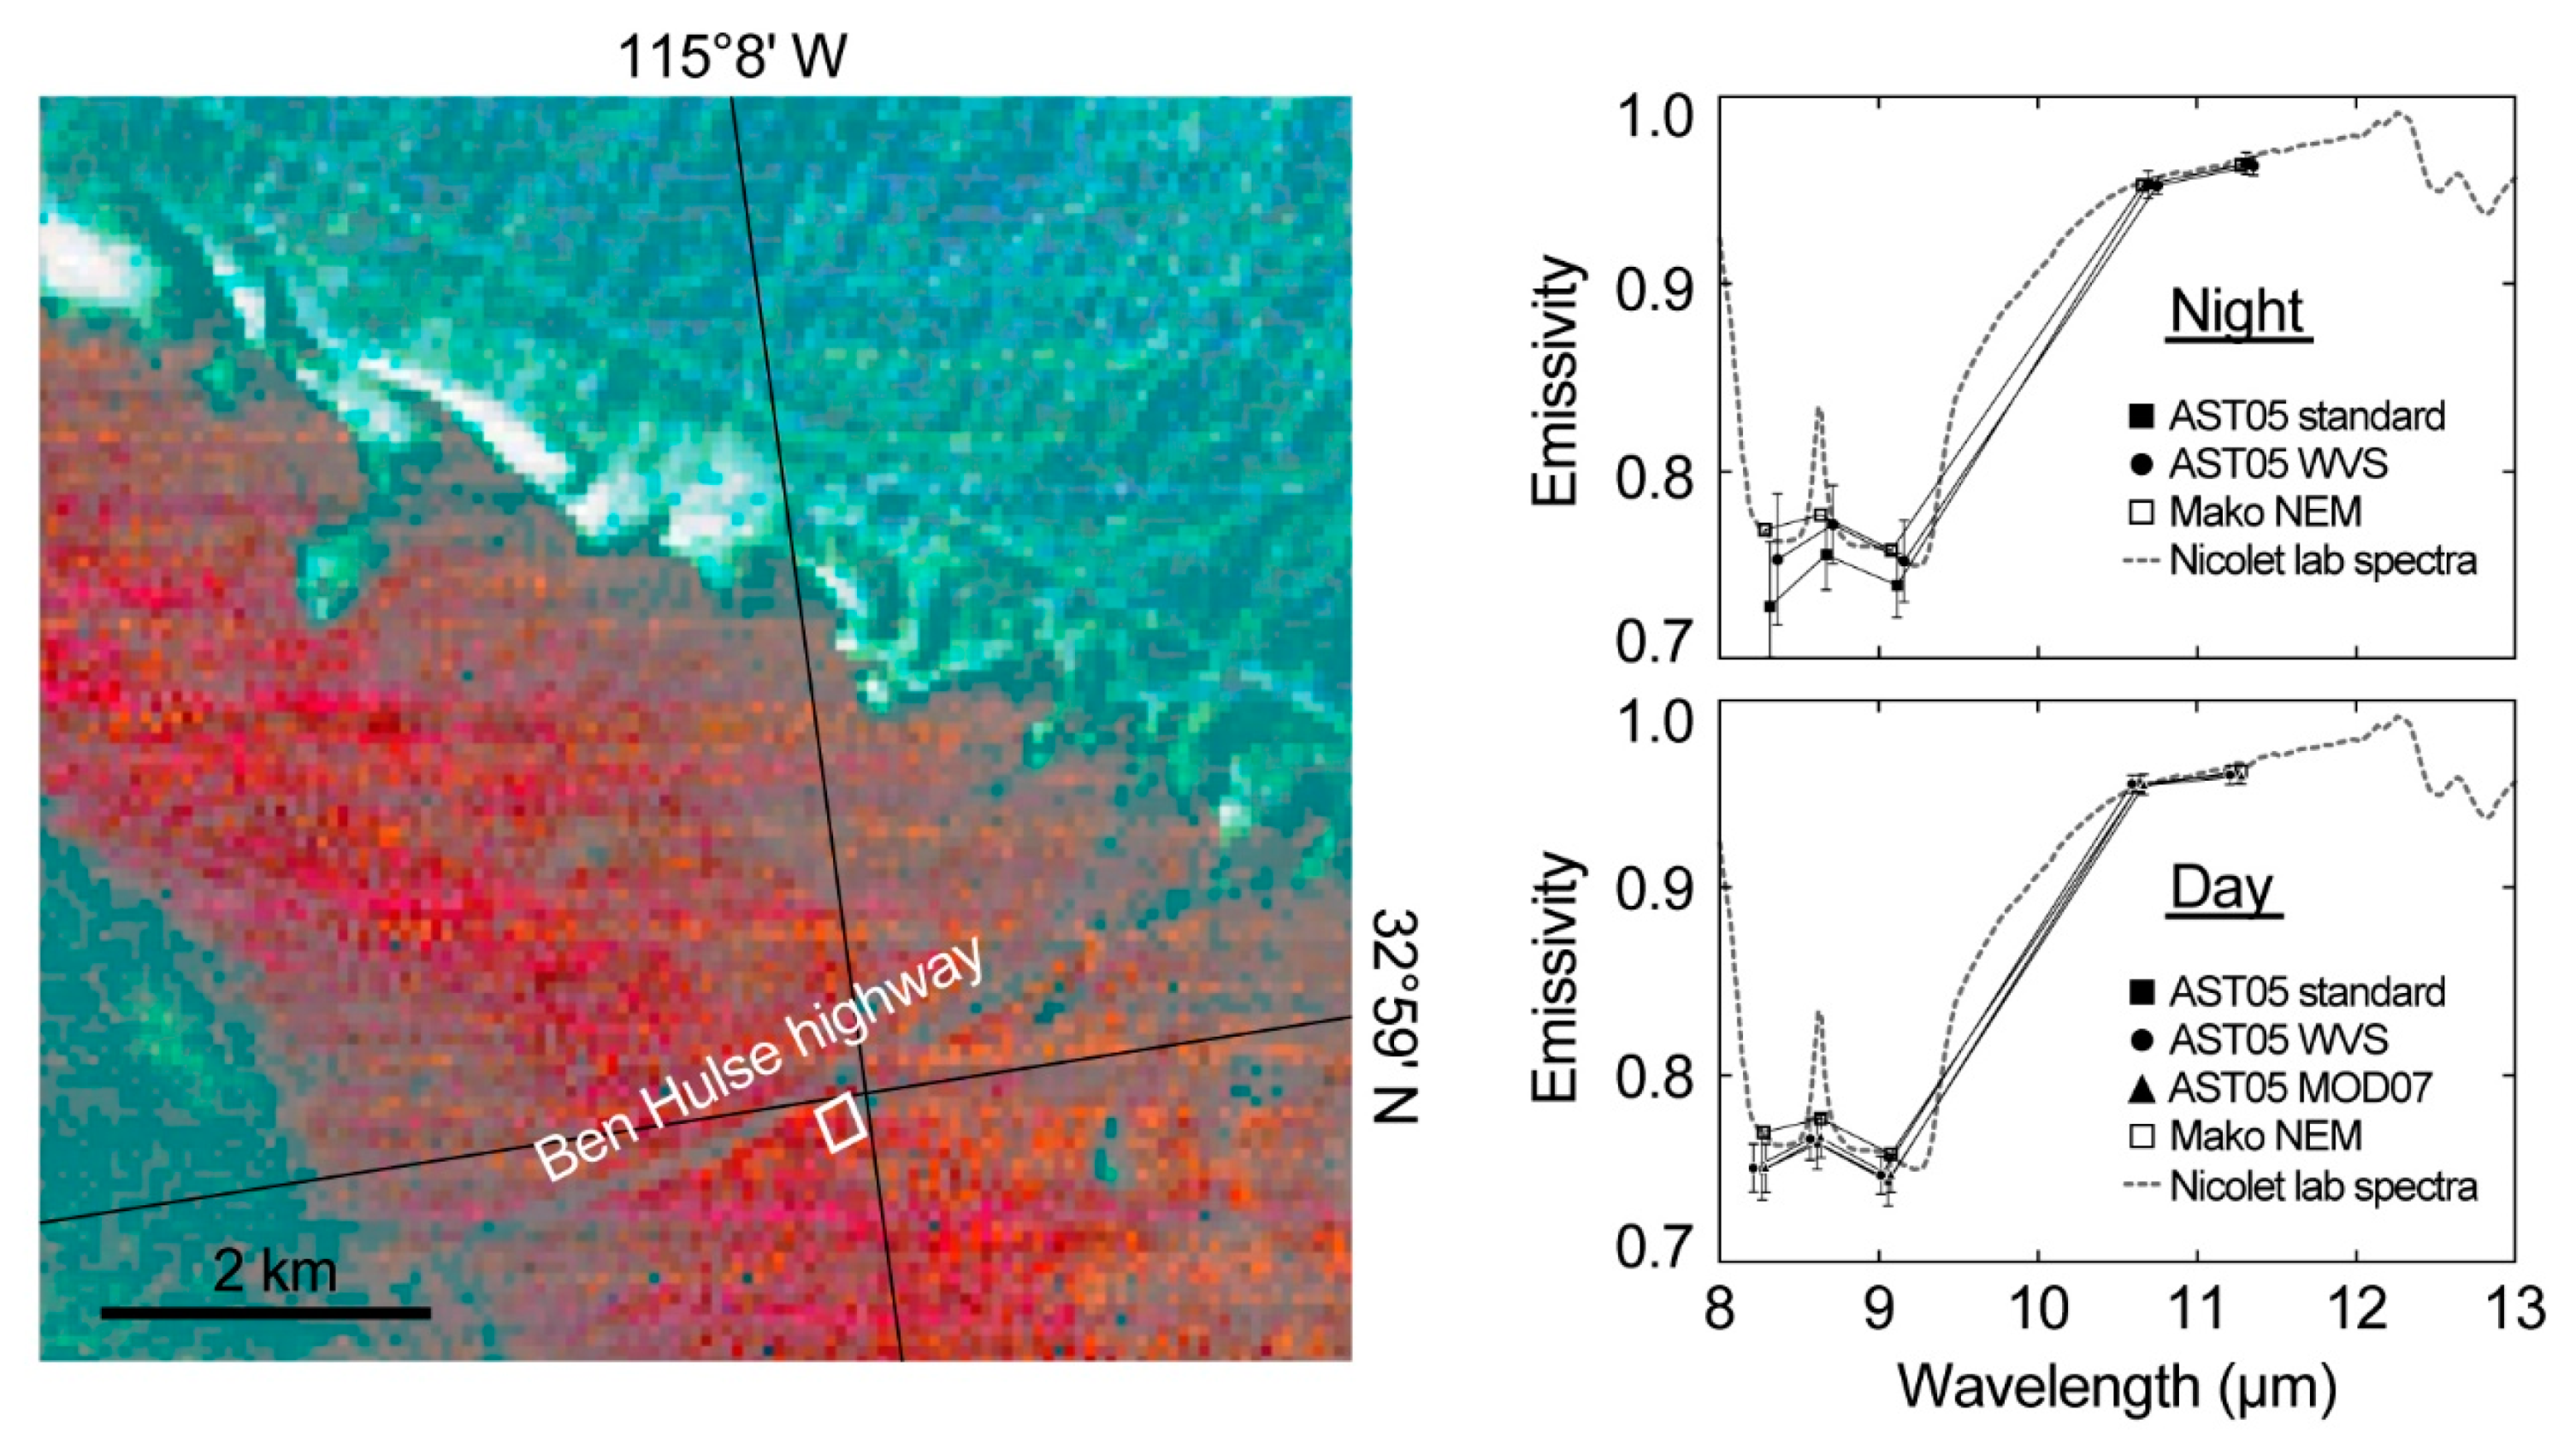
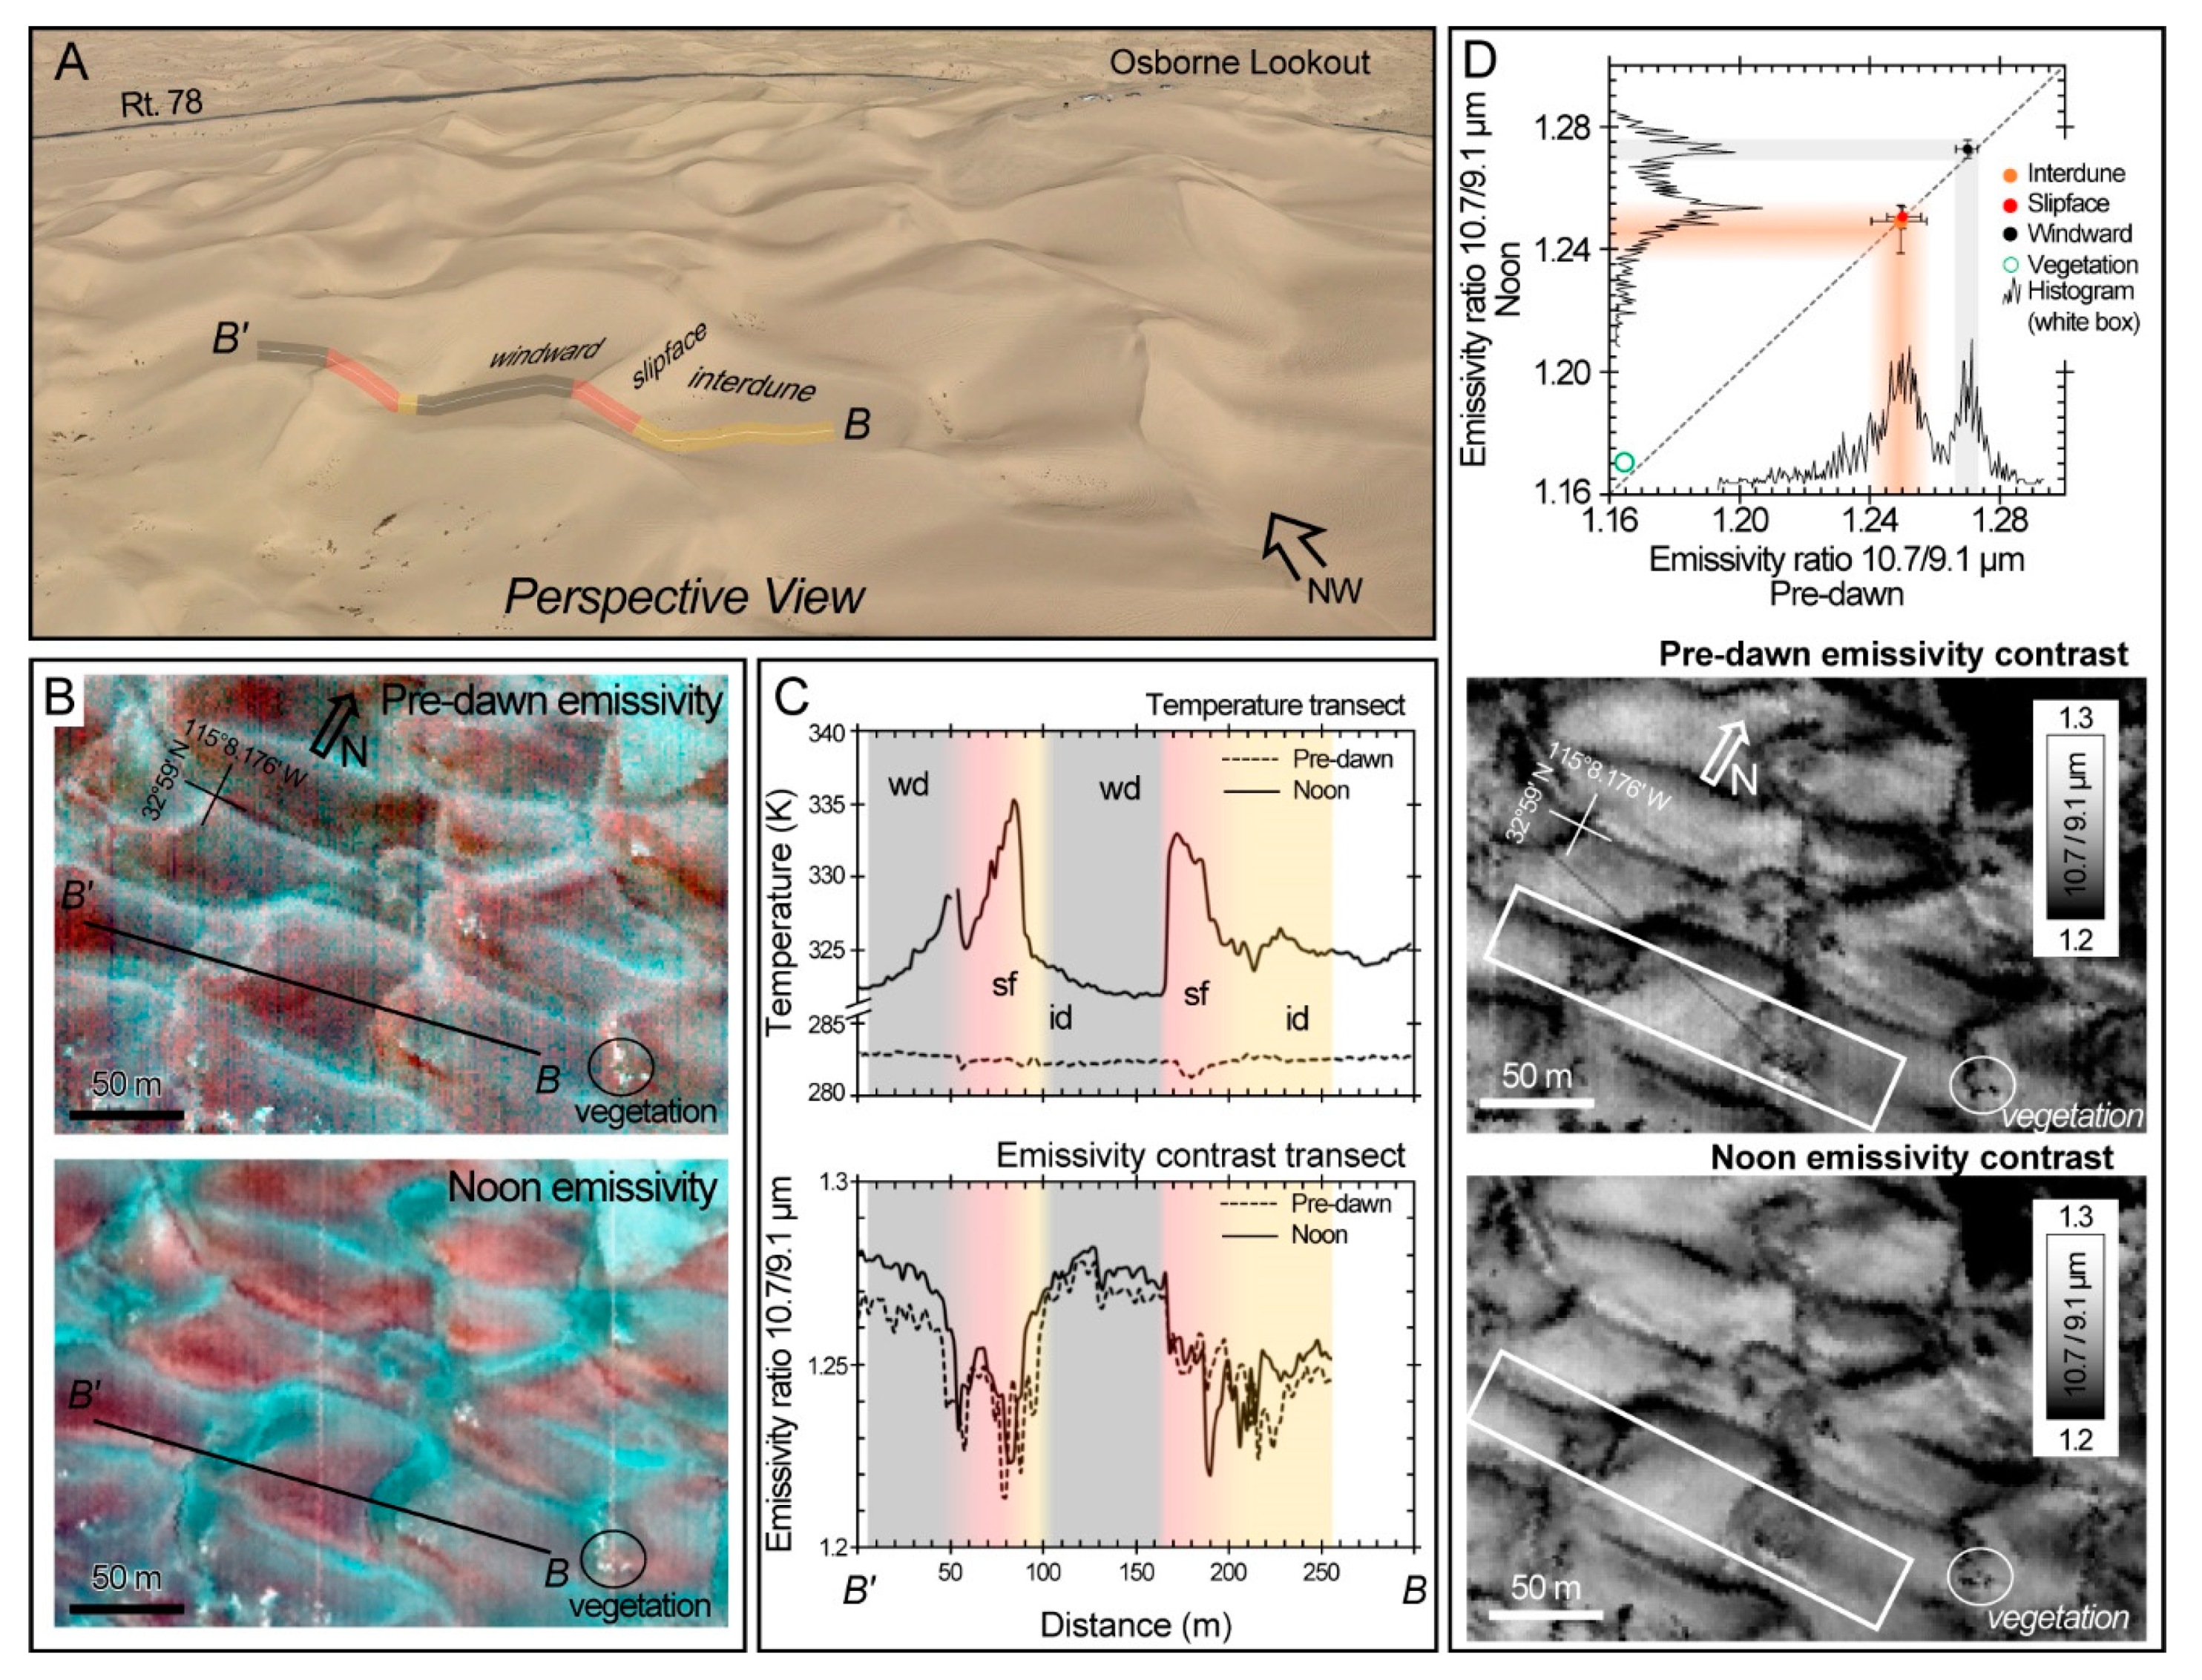
  • Predawn (0535) and noontime (1135) Mako overpasses conducted six hours apart revealed an effective ε increase of up to ~0.04 during the predawn acquisition (Figure 6), which is most likely associated with adsorption of atmospherically sourced soil moisture. Within ASTER’s TIR spectral channels, the increase in effective ε amounted to only ~0.01, which is, coincidentally, about the magnitude of the inaccuracy predicted for ASTER TES emissivity retrievals [5]. However, this soil-moisture effect did not seem to impact AST05 nighttime retrievals at Algodones. We suggest that this is because spectrally significant adsorption of atmospheric moisture at Algodones can happen later in the night after ASTER’s overpass time (~2230 local). The significance of soil moisture following rainfall events was previously recognized as an important factor to consider in TIR remote sensing (cf. [19,36]). Our results highlight the similar impact of atmospherically sourced adsorbed soil moisture on remote TIR measurements.
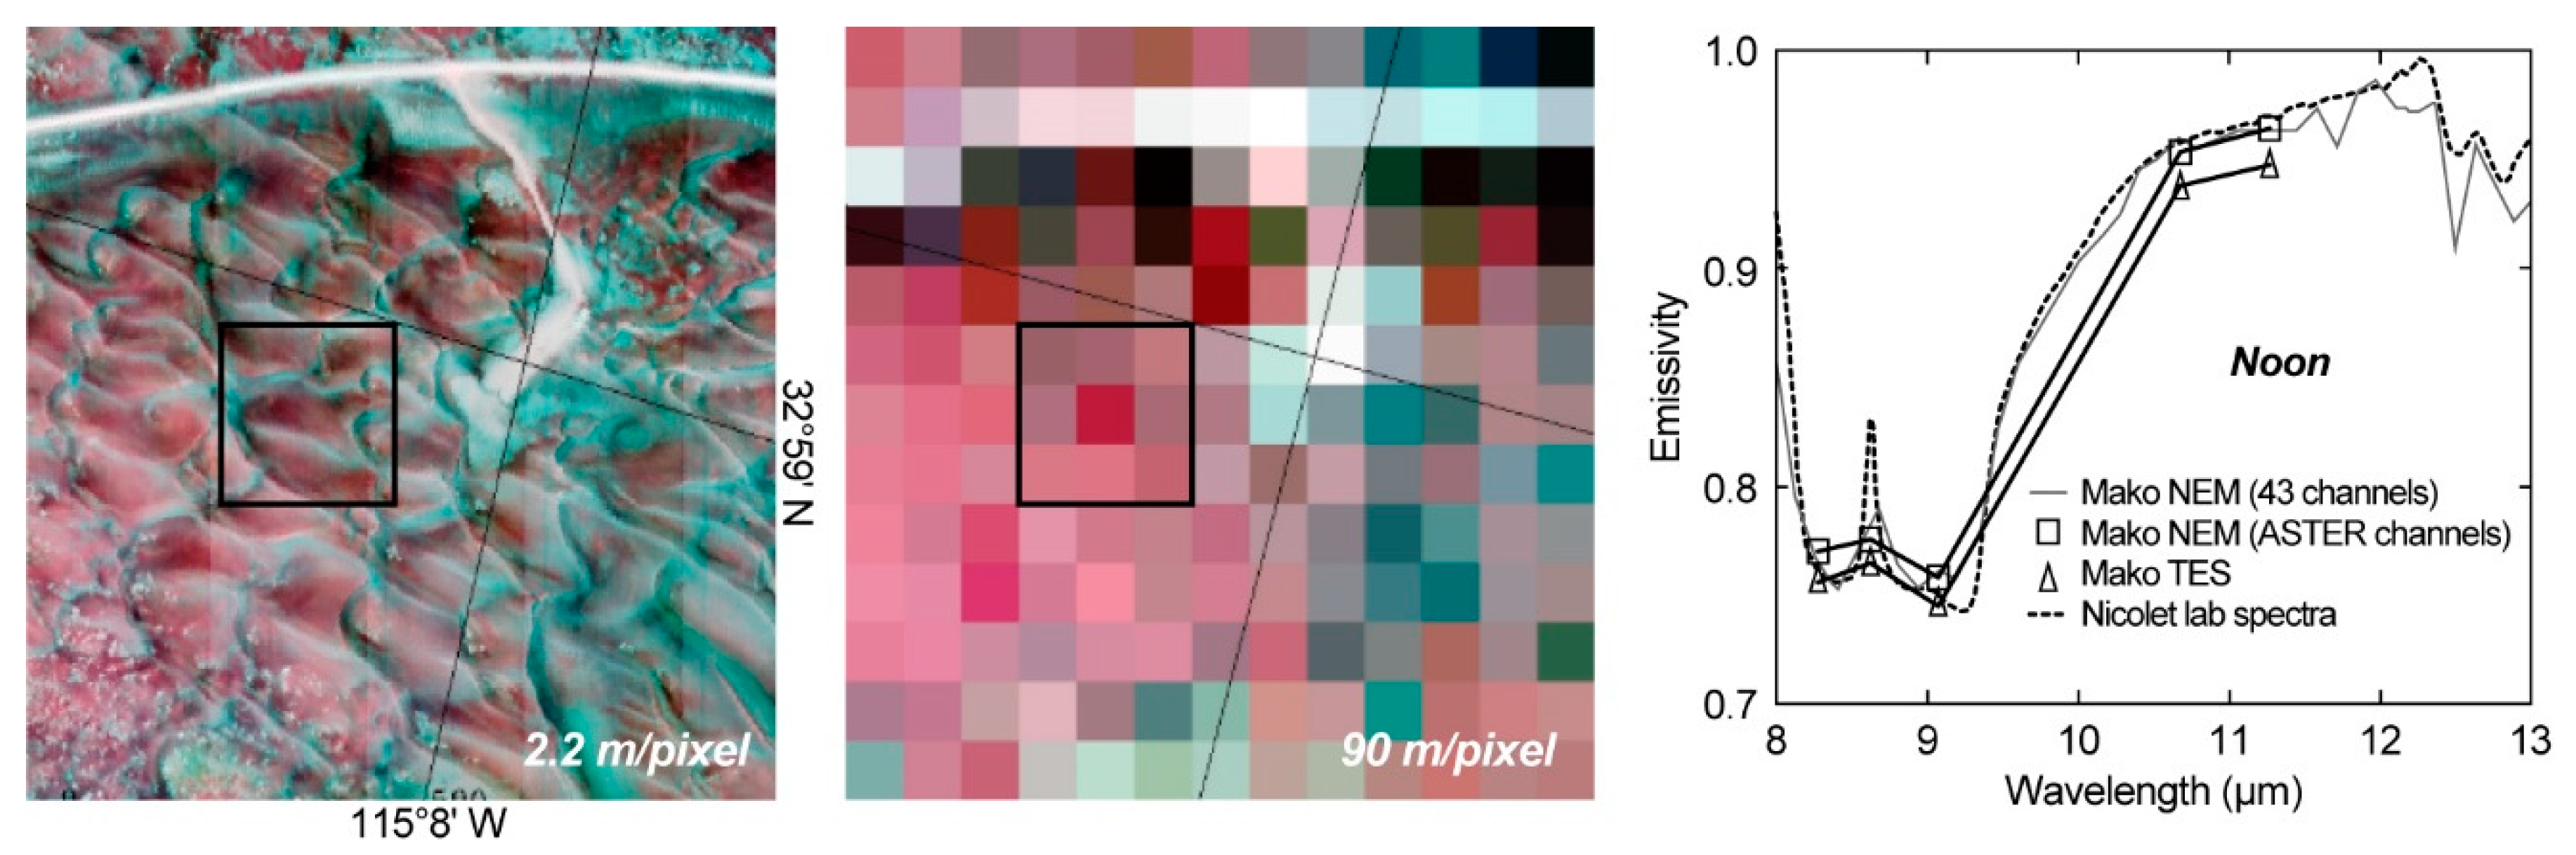
  • Spectral emissivity contrast measured with Mako for fully resolved landscape elements, such as dune slipface slopes and interdune flats, was 2% to 4% lower than the spectral emissivity contrast measured in the lab for sand samples from these landscape elements (Figure 6 and Figure 9). This magnitude of spectral differences is similar to the predicted magnitude of “cavity-radiation” effects on natural geologic surfaces [31,38]. Surface temperature heterogeneity did not impact emissivity retrievals at Algodones.
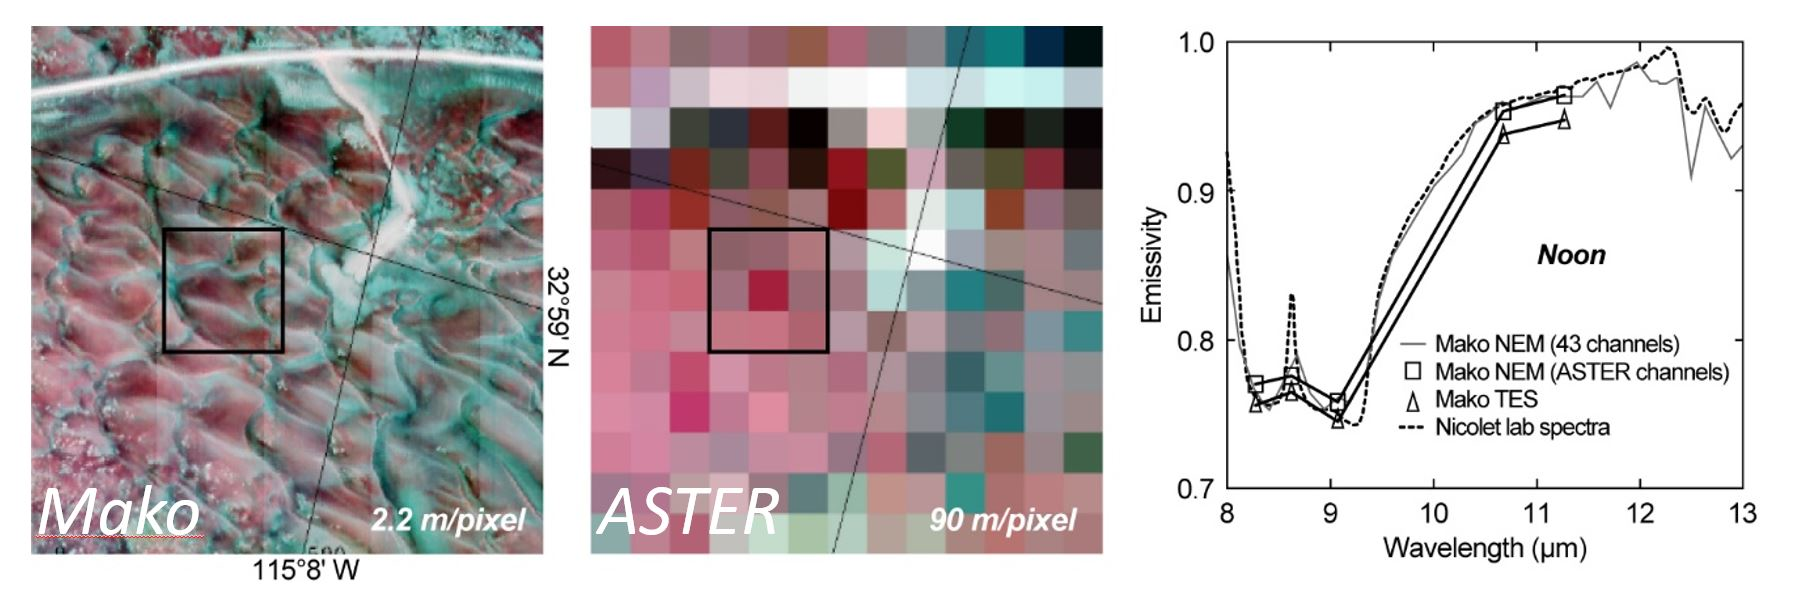
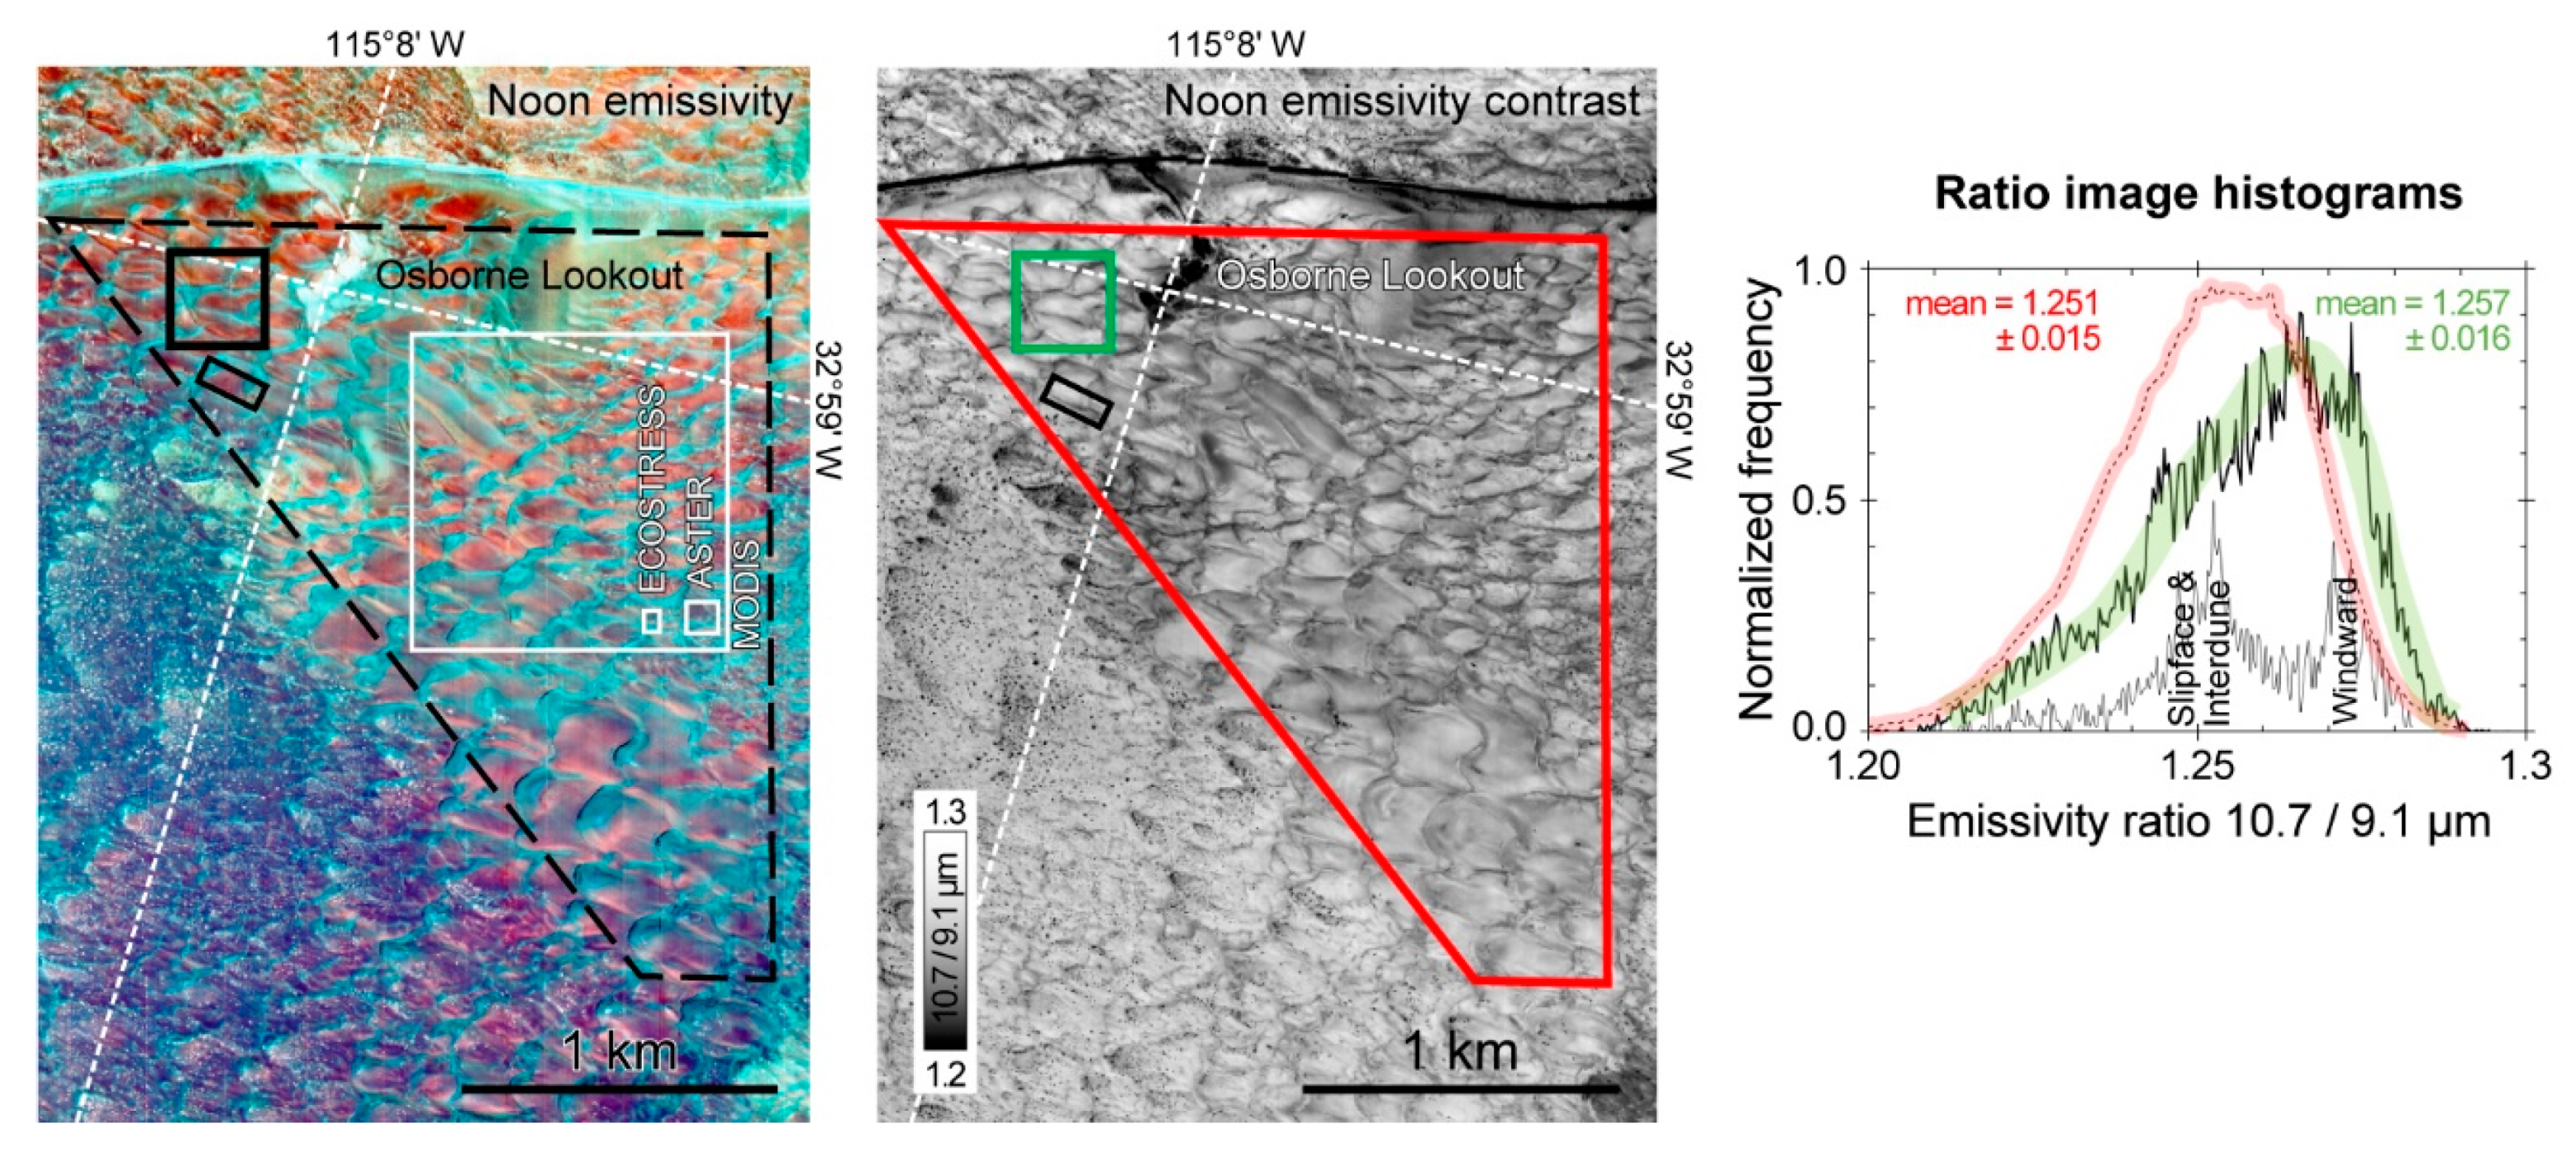
  • The Mako 2.2 m/pixel emissivity maps (Figure 10) reveal that spectral variability within the Algodones validation site when imaged at 90 m/pixel is below 1% because the dune surface at this scale is an effective mixture of the different dune elements. At Algodones, ε retrievals at 90 m/pixel can be directly compared with laboratory centimeter-scale spectra of sand collected in the field after Mako was used to confirm that spectral effects of surface heterogeneity in mineralogy, grain size, moisture, vegetation, and cavity radiation all together were below ~0.01. The Algodones site can also be used to validate other TIR sensors such as ECOSTRESS and MODIS.
  • The accuracy and precision of daytime AST05 emissivity retrievals using each of the three available atmospheric correction protocols, i.e., NCAR/NCEP, WVS, and MOD07, is better than 0.01 at Algodones (Figure 8), and therefore meets the target performance of the ASTER’s standard emissivity product. Nighttime AST05 emissivities in Channels 10 to 12 display lower precision (<0.03) likely due to residual atmospheric effects. WVS atmospheric correction was required to obtain accurate (<0.01) nighttime AST05 retrievals at Algodones.

Author Contributions

Conceptualization, A.M., A.R.G. and E.A.A.; Methods, all authors; validation, A.M., A.R.G., and E.A.A.; data analysis, A.M. and A.R.G.; field investigation, A.M., A.R.G., E.A.A., H.T.; writing-original draft preparation, A.M.; writing—review and editing, A.R.G., E.A.A., J.B., G.H., D.M.T. and K.M.B.; visualization, A.M., J.B. D.M.T. participated in airborne experiment design, planning, and execution; K.N.B. processed the airborne imagery and conducted a critical review of the data interpretation. All authors have read and agreed to the published version of the manuscript.

Funding

This research was partially funded from the Bear Fight Institute, NASA subcontract No. 1545008. The APC were funded from the Bear Fight Institute, NASA subcontract No. 1545008.

Acknowledgments

We thank Onn Crouvi and Navot Morag, both of the Geological Survey of Israel, for measuring the particle-size distributions and for the XRD analyses, respectively. The research described in this paper was carried out at the University of Washington (Seattle), The Bear Fight Institute (Winthrop, WA), and the Jet Propulsion Laboratory (California Institute of Technology, Pasadena), under contracts with JPL and the National Aeronautics and Space Administration (NASA). Mako airborne hyperspectral data were acquired under the auspices of The Aerospace Corporation’s Independent Research and Development program by Eric Keim. We appreciate the critical reading and formal evaluation by four reviewers that improved the manuscript.

Conflicts of Interest

The authors declare no conflict of interest.

References

  1. Abrams, M.J. The Advanced Spaceborne Thermal Emission and Reflection Radiometer (ASTER): Data products for the high spatial resolution imager on NASA’s Terra platform. Int. J. Remote Sens. 2000, 21, 847–859. [Google Scholar] [CrossRef]
  2. Kahle, A.B.; Palluconi, F.D.; Hook, S.J.; Realmuto, V.J.; Bothwell, G. The advanced spaceborne thermal emission and reflectance radiometer (ASTER). Int. J. Imaging Syst. Technol. 1991, 3, 144–156. [Google Scholar] [CrossRef]
  3. Yamaguchi, Y.; Tsu, H.; Fujisada, H. Scientific Basis of ASTER Instrument Design. In Proceedings of the SPIE 1939, Sensor Systems for the Early Earth Observing System Platforms, Orlando, FL, USA, 11–16 April 1993; pp. 150–160. [Google Scholar] [CrossRef]
  4. Yamaguchi, Y.; Kahle, A.; Tsu, H.; Kawakami, T.; Pniel, M. Overview of Advanced Spaceborne Thermal Emission and Reflection Radiometer (ASTER). IEEE Trans. Geosci. Remote Sens. 1998, 36, 1062–1071. [Google Scholar] [CrossRef] [Green Version]
  5. Gillespie, A.R.; Rokugawa, S.; Matsunaga, T.; Cothern, J.S.; Hook, S.J.; Kahle, A.B. Temperature and Emissivity Separation from Advanced Spaceborne Thermal Emission and Reflection Radiometer (ASTER) Images. IEEE Trans. Geosci. Remote 1998, 36, 1113–1126. [Google Scholar] [CrossRef]
  6. Baldridge, A.M.; Hook, S.J.; Grove, C.I.; Rivera, G. The ASTER spectral library version 2.0. Remote Sens. Environ. 2009, 113, 711–715. [Google Scholar] [CrossRef]
  7. Gustafson, W.T.; Gillespie, A.R.; Yamada, G. Revisions to the ASTER Temperature/Emissivity Separation Algorithm. In Second Recent Advances in Quantitative Remote Sensing; Sobrino, J.A., Ed.; Publicacions de la Universitat de València: Valencia, Spain, 2006; pp. 770–775. ISBN1 84-370-6533-X. ISBN2 978-84-370-6533-5. [Google Scholar]
  8. Gillespie, A.R.; Abbott, E.A.; Gilson, L.; Hulley, G.; Jiménez-Muñoz, J.-C.; Sobrino, J.A. Residual errors in ASTER temperature and emissivity standard products AST08 and AST05. Remote Sens. Environ. 2011, 115, 3681–3694. [Google Scholar] [CrossRef]
  9. Tonooka, H. Accurate atmospheric correction of ASTER thermal infrared imagery using the WVS method. IEEE Trans. Geosci. Remote Sens. 2005, 43, 2778–2792. [Google Scholar] [CrossRef]
  10. Hook, S.J.; Vaughan, R.G.; Tonooka, H.; Schladow, S.G. Absolute radiometric in-flight validation of mid infrared and thermal infrared data from ASTER and MODIS on the Terra spacecraft using the Lake Tahoe, CA/NV, USA. IEEE Trans. Geosci. Remote 2007, 45, 1798–1807. [Google Scholar] [CrossRef]
  11. Sobrino, J.A.; Jiménez-Muñoz, J.C.; Balick, L.; Gillespie, A.R.; Sabol, D.A.; Gustafson, W.T. Accuracy of ASTER Level-2 thermal-infrared Standard Products of an agricultural area in Spain. Remote Sens. Environ. 2007, 106, 146–153. [Google Scholar] [CrossRef]
  12. Coll, C.; Caselles, V.; Valor, E.; Niclòs, R.; Sánchez, J.M.; Galve, J.M.; Mira, M. Temperature and emissivity separation from ASTER data for low spectral contrast surfaces. Remote Sens. Environ. 2007, 110, 162–175. [Google Scholar] [CrossRef]
  13. Tonooka, H.; Palluconi, F.D. Validation of ASTER/TIR standard atmospheric correction using water surfaces. IEEE Trans. Geosci. Remote Sens. 2005, 43, 2769–2777. [Google Scholar] [CrossRef]
  14. Schmugge, T.; Ogawa, K.; Jacob, F.; French, A.; Hsu, A.; Ritchie, J.C. Validation of Emissivity Estimates from ASTER Data. In Proceedings of the International Geoscience and Remote Sensing Symposium, Toulouse, France, 21–25 July 2003; pp. 1873–1875. [Google Scholar] [CrossRef]
  15. Schmugge, T.; Ogawa, K. Validation of emissivity estimates from ASTER and MODIS data. In Proceedings of the 2006 IEEE International Symposium on Geoscience and Remote Sensing, Denver, CO, USA, 31 July–4 August 2006; pp. 260–262. [Google Scholar] [CrossRef]
  16. Hulley, G.C.; Hook, S.J.; Baldridge, A.M. Validation of the North American ASTER Land Surface Emissivity Database (NAALSED) Version 2.0. Remote Sens. Environ. 2009, 113, 2224–2233. [Google Scholar] [CrossRef]
  17. Hulley, G.C.; Hook, S.J. The North American ASTER Land Surface Emissivity Database (NAALSED) Version 2.0. Remote Sens. Environ. 2009, 113, 1967–1975. [Google Scholar] [CrossRef]
  18. Hulley, G.C.; Hook, S.J.; Abbott, E.; Malakar, N.; Islam, T.; Abrams, M. The ASTER Global Emissivity Dataset (ASTER GED): Mapping Earth’s emissivity at 100 m spatial scale. Geophys. Res. Lett. 2015, 42, 7966–7976. [Google Scholar] [CrossRef]
  19. Sabol, D.E., Jr.; Gillespie, A.R.; Abbott, E.A.; Yamada, G. Field Validation of the ASTER Temperature-Emissivity Separation Algorithm. Remote Sens. Environ. 2009, 113, 2328–2344. [Google Scholar] [CrossRef]
  20. Sirguey, P. Simple correction of multiple reflection effects in rugged terrain. Int. J. Remote Sens. 2009, 30, 1075–1081. [Google Scholar] [CrossRef]
  21. Hall, J.L.; Boucher, R.H.; Buckland, K.N.; Gutierrez, D.J.; Keim, E.R.; Tratt, D.M.; Warren, D.W. Mako airborne thermal infrared imaging spectrometer—Performance update. In Imaging Spectrometry XXI. Int. Soc. Opt. Photonics 2016, 9976, 997604. [Google Scholar] [CrossRef]
  22. Buckland, K.N.; Young, S.J.; Keim, E.R.; Johnson, B.R.; Johnson, P.D.; Tratt, D.M. Tracking and quantification of gaseous chemical plumes from anthropogenic emission sources within the Los Angeles Basin. Remote Sens. Environ. 2017, 201, 275–296. [Google Scholar] [CrossRef]
  23. Seemann, S.W.; Borbas, E.E.; Li, J.; Menzel, W.P.; Gumley, L.E. MODIS atmospheric profile retrieval algorithm theoretical basis document, version 6. Coop. Inst. Meteorol. Satell. Stud. 2006, 6, 37. [Google Scholar]
  24. Hulley, G. A Water Vapor Scaling (Wvs) Method for Improving Atmospheric Correction of Thermal Infrared (Tir) Data. In Thermal Infrared Remote Sensing: Sensors, Methods, Applications; Künzer, C., Dech, S., Eds.; Springer: Berlin/Heidelberg, Germany, 2013; Volume 17, pp. 253–265. [Google Scholar] [CrossRef]
  25. Palluconi, F.D.; Hoover, G.; Alley, R.; Jentoft-Nilsen, M.; Thompson, T. An atmospheric correction method for ASTER thermal radiometry over land. Algorithm Theor. Basis Doc. 1999. Available online: http://www.aster.jspacesystems.or.jp/t/jp/documnts/pdf/2b01t.pdf (accessed on 29 February 2020).
  26. Nicodemus, F.E. Directional reflectance and emissivity of an opaque surface. Appl. Opt. 1965, 4, 767–773. [Google Scholar] [CrossRef]
  27. Gillespie, A.R. Lithologic Mapping of Silicate Rocks Using TIMS. In Proceedings of the TIMS Data Users’ Workshop, NASA Stennis Space Center, MS, USA, 18–19 June 1985; JPL Publication 86-38. pp. 29–44. [Google Scholar]
  28. Realmuto, V.J. Separating the Effects of Temperature and Emissivity: Emissivity Spectrum Normalization. In Proceedings of the 2nd TIMS Workshop, Pasadena, CA, USA, 7–8 July 1990; JPL Publication 90-55. pp. 31–35. [Google Scholar]
  29. Adams, J.B.; Gillespie, A.R. Remote Sensing of Landscapes with Spectral Images; Cambridge University Press: Cambridge, UK, 2006. [Google Scholar]
  30. Danilina, I.; Gillespie, A.R.; Balick, L.K.; Mushkin, A.; O’Neal, M.A. Performance of a thermal-infrared radiosity and heat-diffusion model for estimating sub-pixel radiant temperatures over the course of a day. Remote Sens. Environ. 2012, 124, 492–501. [Google Scholar] [CrossRef]
  31. Danilina, I.; Gillespie, A.R.; Balick, L.K.; Mushkin, A.; Smith, M.R.; Blumberg, D. Compensation for sub-pixel roughness effects in thermal-infrared images. Special Issue: Third International Symposium on Recent Advances in Quantitative Remote Sensing. Int. J. Remote Sens. 2013, 34, 3425–3436. [Google Scholar] [CrossRef]
  32. Hulley, G.; Baldridge, A. Validation of Thermal Infrared (TIR) Emissivity Spectra Using Pseudo-Invariant Sand Dune Sites. In Thermal Infrared Remote Sensing: Sensors, Methods, Applications; Künzer, C., Dech, S., Eds.; Springer: Berlin/Heidelberg, Germany, 2013; Volume 17, pp. 515–527. [Google Scholar] [CrossRef]
  33. Crouvi, O.; Amit, R.; Enzel, Y.; Porat, N.; Sandler, A. Sand dunes as a major proximal dust source for late Pleistocene loess in the Negev Desert, Israel. Quat. Res. 2008, 70, 275–282. [Google Scholar] [CrossRef]
  34. Korb, A.R.; Salisbury, J.W.; D’Aria, D.M. Thermal-infrared remote sensing and Kirchhoff’s law: 2. Field measurements. J. Geophys. Res. Solid Earth 1999, 104, 15339–15350. [Google Scholar] [CrossRef]
  35. Gillespie, A.R. Spectral mixture analysis of multispectral thermal infrared images. Remote Sens. Environ. 1992, 42, 137–145. [Google Scholar] [CrossRef]
  36. Hulley, G.C.; Hook, S.J.; Baldridge, A.M. Investigating the effects of soil moisture on thermal infrared land surface temperature and emissivity using satellite retrievals and laboratory measurements. Remote Sens. Environ. 2010, 114, 1480–1493. [Google Scholar] [CrossRef]
  37. Masiello, G.; Serio, C.; Venafra, S.; DeFeis, I.; Borbas, E.E. Diurnal variation in Sahara desert sand emissivity during the dry season from IASI observations. J. Geophys. Res. Atmos. 2014, 119, 1626–1638. [Google Scholar] [CrossRef] [Green Version]
  38. Danilina, I.; Gillespie, A.; Balick, L.; Mushkin, A.; Smith, M.; O’Neal, M. Subpixel Roughness Effects in Spectral Thermal Infrared Emissivity Images. In Proceedings of the 2009 First Workshop on Hyperspectral Image and Signal Processing: Evolution in Remote Sensing, Grenoble, France, 26–28 August 2009. [Google Scholar]
  39. Hulley, G.C.; Hughes, C.G.; Hook, S.J. Quantifying uncertainties in land surface temperature and emissivity retrievals from ASTER and MODIS thermal infrared data. J. Geophys. Res. Atmos. 2012, 117, D23113. [Google Scholar] [CrossRef] [Green Version]
Figure 1. Study site. (A) Google Earth image showing the study site (black box) located approximately 50 km SE of the Salton Sea within the Algodones dune field; (B) The Algodones study site near the Osborne Lookout south of the Ben Hulse highway. Black star, location of photo in (C), elevation data from the USGS National Elevation Dataset (NED); (C) SW view onto the Algodones study site south of the Ben Hulse highway on the right.
Remotesensing 12 00815 g001
Figure 2. Laboratory characterization of the Algodones site. (A) Particle-size distribution (PSD) of the main scene elements. “d50” indicates the median value; (B) Nicolet emissivity spectra for the dune elements; (CF) Nicolet spectra for grain-size splits (in μm) of the same scene elements.
Remotesensing 12 00815 g002
Figure 3. Ground temperature measurements. (A) Perspective view to the SE of the test site and the locations where time-series surface temperature measurements were obtained (image, Google Earth); (B) surface temperature time-series color coded according to scene elements shown in (A). Windward slope 20° to NW, slipface 30° to east-southeast (ESE). Crest measurements were from the north-facing facet of the crest; (C) a westward looking FLIR image taken during the day overpass time overlain on a gray-level visible context image. The dune in the center is ~5 m high. A ~20 K range in surface T is observed at sub-ASTER pixel scales (<90 m) due to surface topography; (D) north-looking FLIR image taken during the day overpass overlain on a gray-level visible context image. Variability of ~2 K occurs at sub-Mako pixel scales (<2 m) due to small-scale ripples.
Remotesensing 12 00815 g003
Figure 4. Mako radiance spectra. Average radiance from the 270 × 270 m test area. Spectral binning was applied to reduce noise levels in the noon radiance data.
Remotesensing 12 00815 g004
Figure 5. (A) Atmospheric profiles measured using radiosonde launches during the Mako overpasses; (B,C) Mako NEM surface temperatures images. Bottom, temperature histograms for the 270 × 270 m box in each image (blue, predawn and red, noon). Shaded ranges mark the T range measured on the ground at time of overpasses (Figure 3). Temperature transect B-B’ is plotted in Figure 9.
Remotesensing 12 00815 g005
Figure 6. Mako NEM emissivity retrievals. Dashed box in A–C marks a 270 × 270 m test area equivalent to 9 ASTER pixels. (A) Google Earth image of the Algodones test site (top) and perspective view (bottom); Mako spectra (B,C) sample locations are color-coded accordingly; (B) Top, predawn 2.2 m/pixel Mako NEM emissivity image (R,G,B = 11.3, 9.1, 8.3 μm). White box marks the extent of enlarged area in the bottom right corner. Middle, Mako NEM emissivity retrievals for the primary dune element. Bottom, average Mako predawn spectra from area of the dashed box (~12,500 Mako pixels); (C) Top, Noon 2.2 m/pixel emissivity image (R,G,B = 11.3, 9.1, 8.3 μm). White box marks the extent of enlarged area in the bottom right corner. Middle, Mako NEM emissivity retrievals using binned radiance data (43 channels). Bottom, average Mako noon spectra from area of the dashed box (43 channels, ~12,500 Mako pixels). For B and C each “scene element” spectrum represents the mean of 32 Mako pixels. Standard deviation for all ”scene element” spectra falls close to the width of the plotted line; (D) Left, spectral response functions for ASTER’s TIR channels (black) and atmospheric transmissivity (t) for a “1976 US standard” MODTRAN atmosphere (grey). Middle and Right, Mako NEM emissivities from B and C spectrally resampled to ASTER’s five TIR channels. Data are slightly offset along the x-axis for clarity.
Remotesensing 12 00815 g006
Figure 7. Simulation of ASTER TES with Mako data. Left, Mako noon radiance image (R,G,B = 11.3, 9.1, 8.3 μm) at 2.2 m/pixel. Center, image on left resampled to 90 m/pixel. The area of the 9 ASTER-like pixels examined in the right graph is within the black box. Right, mean emissivity values retrieved using the ASTER TES algorithm and surface emitted Mako radiance convolved to ASTER TIR channels and at 90 m/pixel resolution (“Mako TES”). Standard deviations fall within the symbols. Mako NEM emissivity retrievals at full Mako resolution and spectrally resampled to ASTER are also plotted.
Remotesensing 12 00815 g007
Figure 8. ASTER AST05 emissivity retrievals at Algodones. Left, AST05 90 m/pixel daytime image (R,G,B = ASTER Channels 14, 12, and 10 acquired 5 October 2018). The 270 × 270 m test site marked by white box. Right, AST05 emissivity retrievals for day and night data (Table 1). AST05 standard, WVS, and MOD07 are slightly offset along the x-axis for clarity.
Remotesensing 12 00815 g008
Figure 9. Surface heterogeneity mapped with Mako. (A) Perspective view (Google Earth) to the NW onto the Algodones test site. Transect B-B’ is 300 m long and is color coded according to the three primary dune elements: interdune (id, orange), slipface (sf, red), and windward (wd, black); (B) predawn and daytime emissivity images (R,G,B = 11.3, 9.1, 8.3 μm) showing location of B-B’; (C) Top, temperature variability along the B-B’ transect during the predawn and noon overpasses with sectors of the transect color-shaded according to the dune elements. Bottom, Mako 10.7/9.1 emissivity ratio (predawn and noon) along the B-B’ transect with sectors of the transect color-shaded according to the scene elements; (D) emissivity ratio images between Mako 10.7 and 9.1 μm channels are used as a proxy for mapping the depth of the Reststrahlen band for the predawn and noon overpasses. Top, Noon vs. predawn average emissivity ratios for the scene elements (32 pixels per element). Min/max values plotted as error bars. Dashed line marks the 1:1 line. Histograms for the emissivity ratio values within the white box in the predawn and noon ratio images are plotted along their respective axes (~2500 pixels in each box). Scene elements are projected onto the histograms through their respective colors.
Remotesensing 12 00815 g009
Figure 10. Emissivity heterogeneity across the Algodones dune field near the Osborne Lookout. Left, Mako 2.2 m/pixel emissivity noon image (R,G,B = 11.3, 9.1, 8.3 μm). Black box, same as histogram area in Figure 8. Dashed box, area of dashed histogram on the right. Bold black box, 3 × 3 ASTER pixel area from where AST05 emissivities were extracted (Figure 7). Pixel sizes for single MODIS, ASTER, and ECOSTRESS thermal data are marked in white. Middle, Mako 2.2 m/pixel 10.7/9.1 μm emissivity ratio noon image. Right, histograms for noon emissivity ratio values from within the small, medium, and large areas outlined and color-coded accordingly in the emissivity contrast image. Small black box ~2500 Mako pixels, green box ~15,000 Mako pixels, and red polygon ~520,000 Mako pixels.
Remotesensing 12 00815 g010
Table 1. AST05 data used in the present study.
ASTER Channel1011121314
DateScene IDε8.3 µmε8.6 µmε9.1 µmε10.4 µmε11.1 µmRemarks
STDWVSMOD07STDWVSMOD07STDWVSMOD07STDWVSMOD07STDWVSMOD07
1/1/2016AST_05_00301012016182807_20191101102226_314210.7380.7480.7550.750.7640.7670.7280.7450.7460.9440.9490.9530.9610.9610.961
1/7/2001AST_05_00301012016182807_20191101103017_276010.7530.7550.7310.7670.7660.7540.7450.7420.7430.9540.9530.9540.9610.9610.963day
1/16/2004AST_05_00301162004182833_20191101103137_39580.7300.7320.7490.7530.7520.7670.7380.7390.7480.9530.9540.9480.9620.9620.961day
3/2/2003AST_05_00303022003182818_20191101103107_313120.7530.7550.7540.7640.7680.7700.7380.7490.7520.9550.9540.9540.9620.9610.961day
4/9/2011AST_05_00304092011182719_20191101102907_185050.7690.7550.7690.7750.7680.7750.7520.7490.7520.9560.9540.9560.960.9610.961day
5/13/2013AST_05_00305162013182737_20191101101558_221840.7560.7620.7620.760.7630.7660.7460.7470.7500.9530.9540.9540.960.9610.961day
6/17/2007AST_05_00306172007182740_20191101103307_169820.7410.7480.7470.750.7540.7530.730.7340.7320.9480.9480.9480.9610.9610.961day
7/14/2017AST_05_00307142017182754_20191101101518_152630.7380.7270.7300.7760.7700.7700.7520.7470.7450.9630.9650.9640.9470.9480.948day
8/10/2015AST_05_00308102015182850_20191101102747_72260.7430.7350.7360.7540.7480.7480.7350.7300.7270.960.9570.9580.9620.9620.962day
9/16/2017AST_05_00309162017182810_20191101102106_180410.7570.7680.7680.7810.7860.7860.7650.7690.7680.9610.9600.9600.9530.9530.954day
10/5/2018AST_05_00310052018182845_20191101102827_121740.7230.7560.7560.7440.7740.7740.7260.7570.7580.9530.9580.9580.9620.9610.961day
12/18/2016AST_05_00312182016182752_20191101102947_228700.7680.7630.7630.7780.7750.7760.7530.7500.7510.9540.9540.9530.9610.9610.961day
Mean0.7480.7500.7510.7630.7660.7670.7420.7460.7480.9550.9550.9550.9590.9590.960
Stadard deviation±0.015±0.013±0.013±0.013±0.011±0.011±0.012±0.010±0.011±0.005±0.005±0.005±0.005±0.004±0.004
2/15/2016AST_05_00302152016055344_20191101102747_72290.6910.784 0.7430.802 0.7460.797 0.7630.958 0.9720.965 night
3/25/2015AST_05_00303252015054743_20191101103107_313140.7380.766 0.7650.782 0.7370.747 0.9470.949 0.9620.962 night, clouds
4/10/2015AST_05_00304102015054741_20191101103558_56710.768 0.778 0.753 0.954 0.961 night
6/8/2019AST_05_00306082019054731_20191101102857_159750.780.768 0.7830.777 0.7560.755 0.9510.953 0.9610.961 night
7/3/2014AST_05_00307032014055347_20191101101929_154710.6670.772 0.7190.785 0.7030.767 0.9610.954 0.9740.960 night
9/27/2013AST_05_00309272013054723_20191101103147_40480.6860.752 0.7450.769 0.7390.744 0.9660.948 0.9740.961 night
10/15/2017AST_05_00310152017055339_20191101102046_171230.7360.677 0.760.736 0.740.733 0.9480.961 0.9620.975 night
11/30/2013AST_05_00311302013054719_20191101102827_121660.7360.777 0.7610.771 0.7470.746 0.9480.950 0.9630.961 night
12/13/2015AST_05_00312132015055351_20191101102316_58310.7280.731 0.7380.751 0.7210.727 0.9490.950 0.9620.963 night
Mean0.7280.753 0.7560.771 0.7390.752 0.9540.953 0.9650.959
Stadard deviation±0.034±0.035 ±0.019±0.020 ±0.017±0.020 ±0.007±0.005 ±0.006±0.004

