Post-Disaster Building Database Updating Using Automated Deep Learning: An Integration of Pre-Disaster OpenStreetMap and Multi-Temporal Satellite Data


Abstract
:
1. Introduction
- Multi-temporal RS and map data: In this approach, the multi-temporal RS data are classified using additional support from existing maps by providing guidance in training area selection [10] or excluding non-building pixels based on a probability analysis [11,12]. Then, the maps or the classified building images are compared to detect changes in buildings in an object-oriented manner [13,14].
- Monocular RS and old map data: In many cases, pre-disaster high-resolution RS data of the affected region do not exist, precluding method 1 from being used. However, the old geo-databases containing building information can be used to guide the method to find changes in the building stock [15,16,17]. This method is more complicated than the previous one because it contains a level of generalization and abstraction [18,19], and existing databases may not accurately reflect the immediate pre-disaster situation. However, the method can provide valuable information about relevant feature classes [20].
- Height-related data: Approaches that use height data such as Digital Surface Models (DSMs), including height information obtained through Light Detection And Ranging (LiDAR) and Unmanned Aerial Vehicle (UAV) data. Height-related data from DSMs and LiDAR data are generally utilized as changed or non-changed features to detect building changes [21,22,23,24,25].
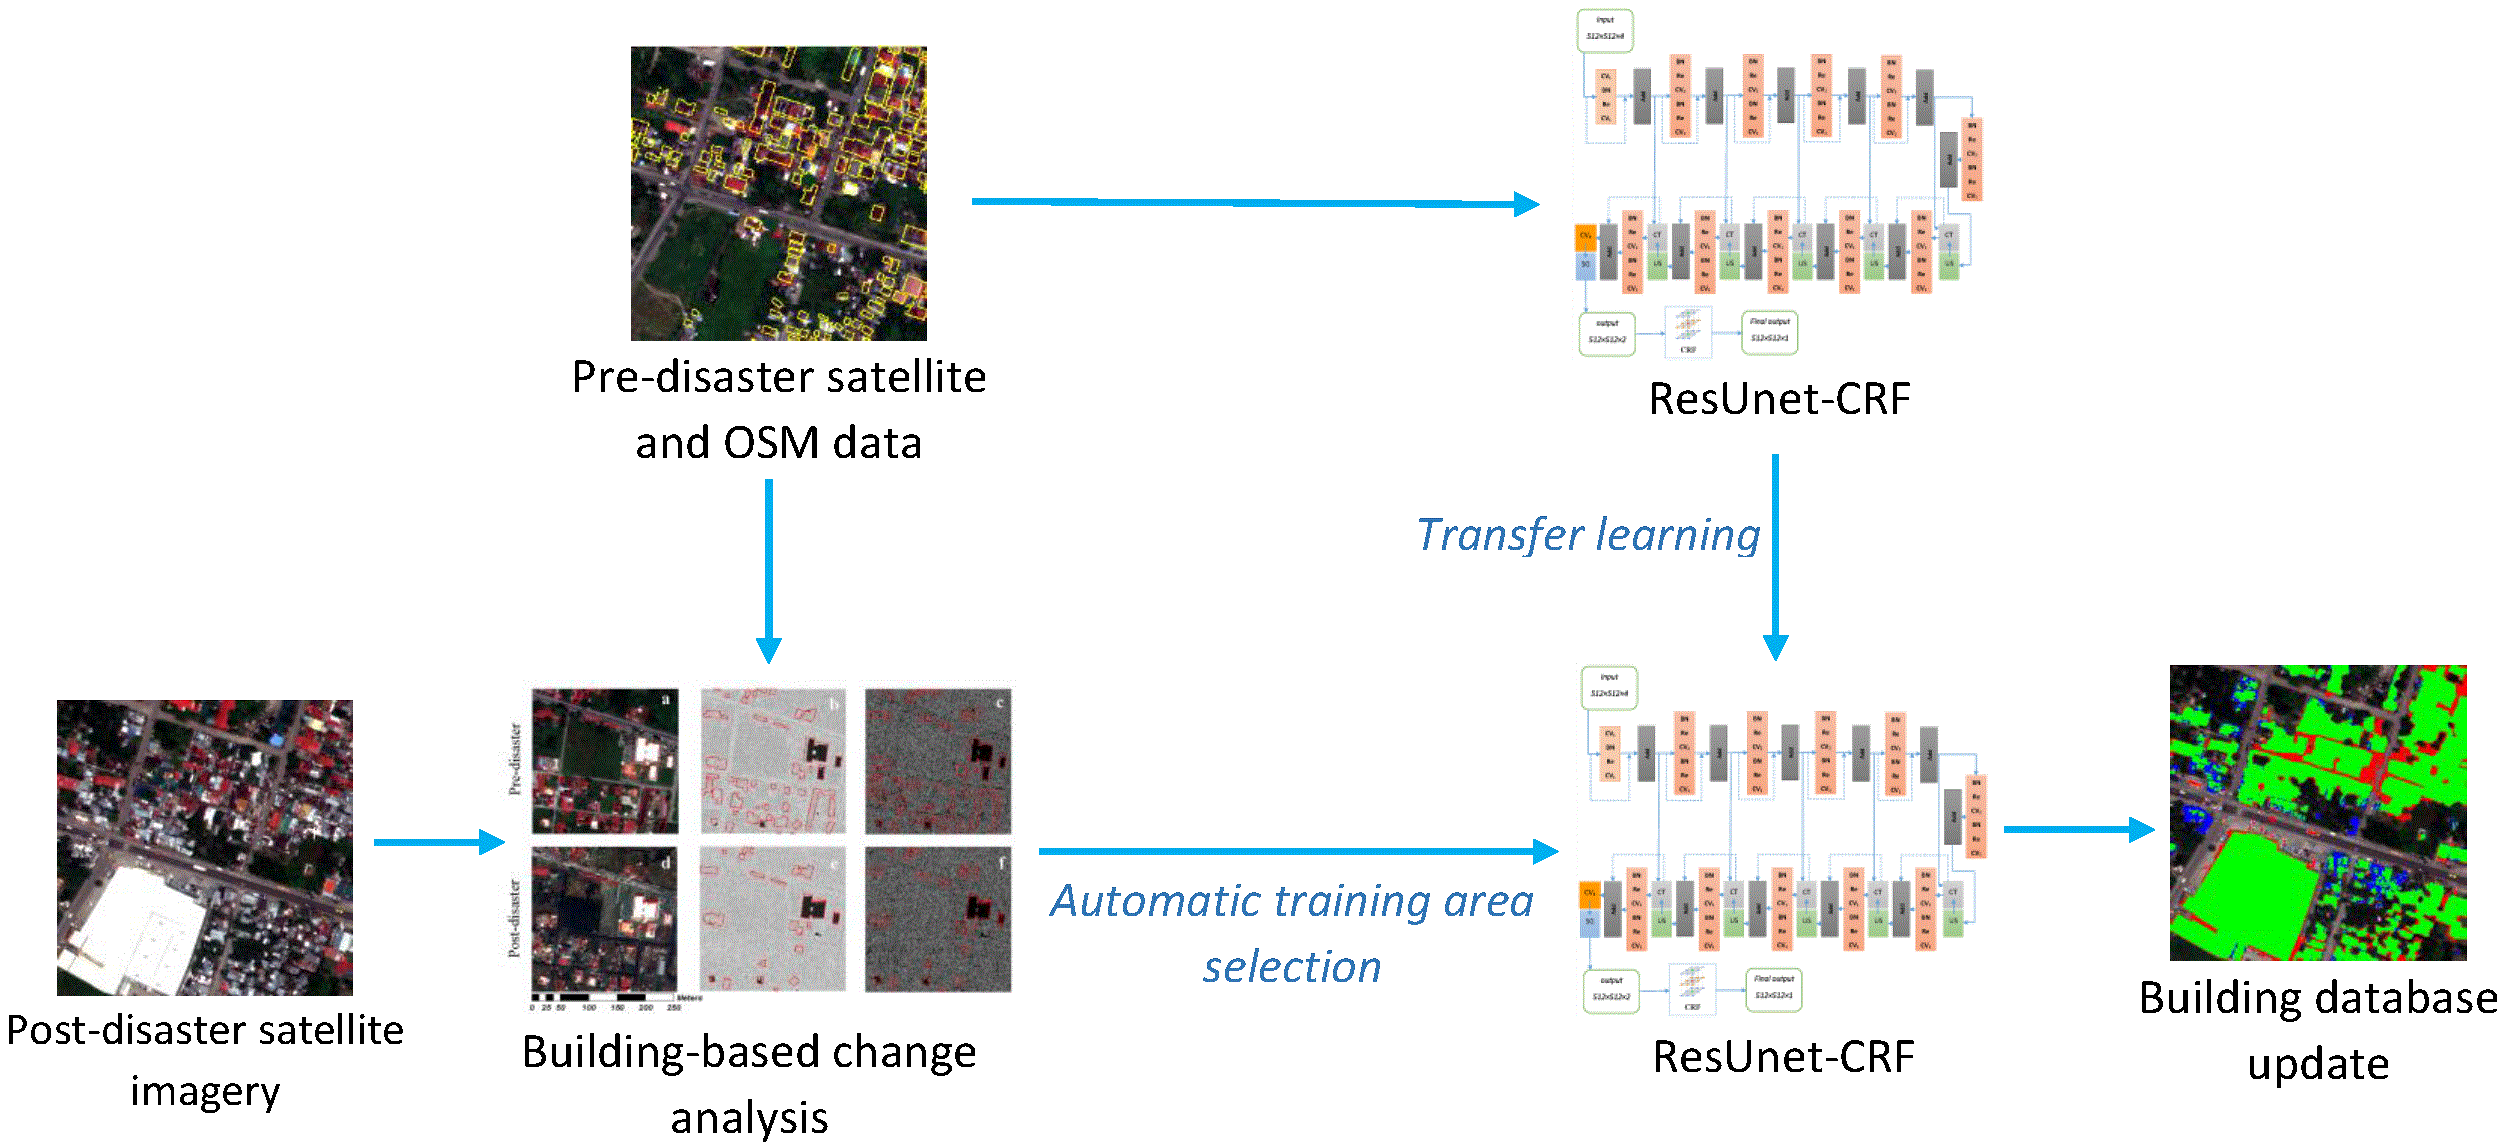
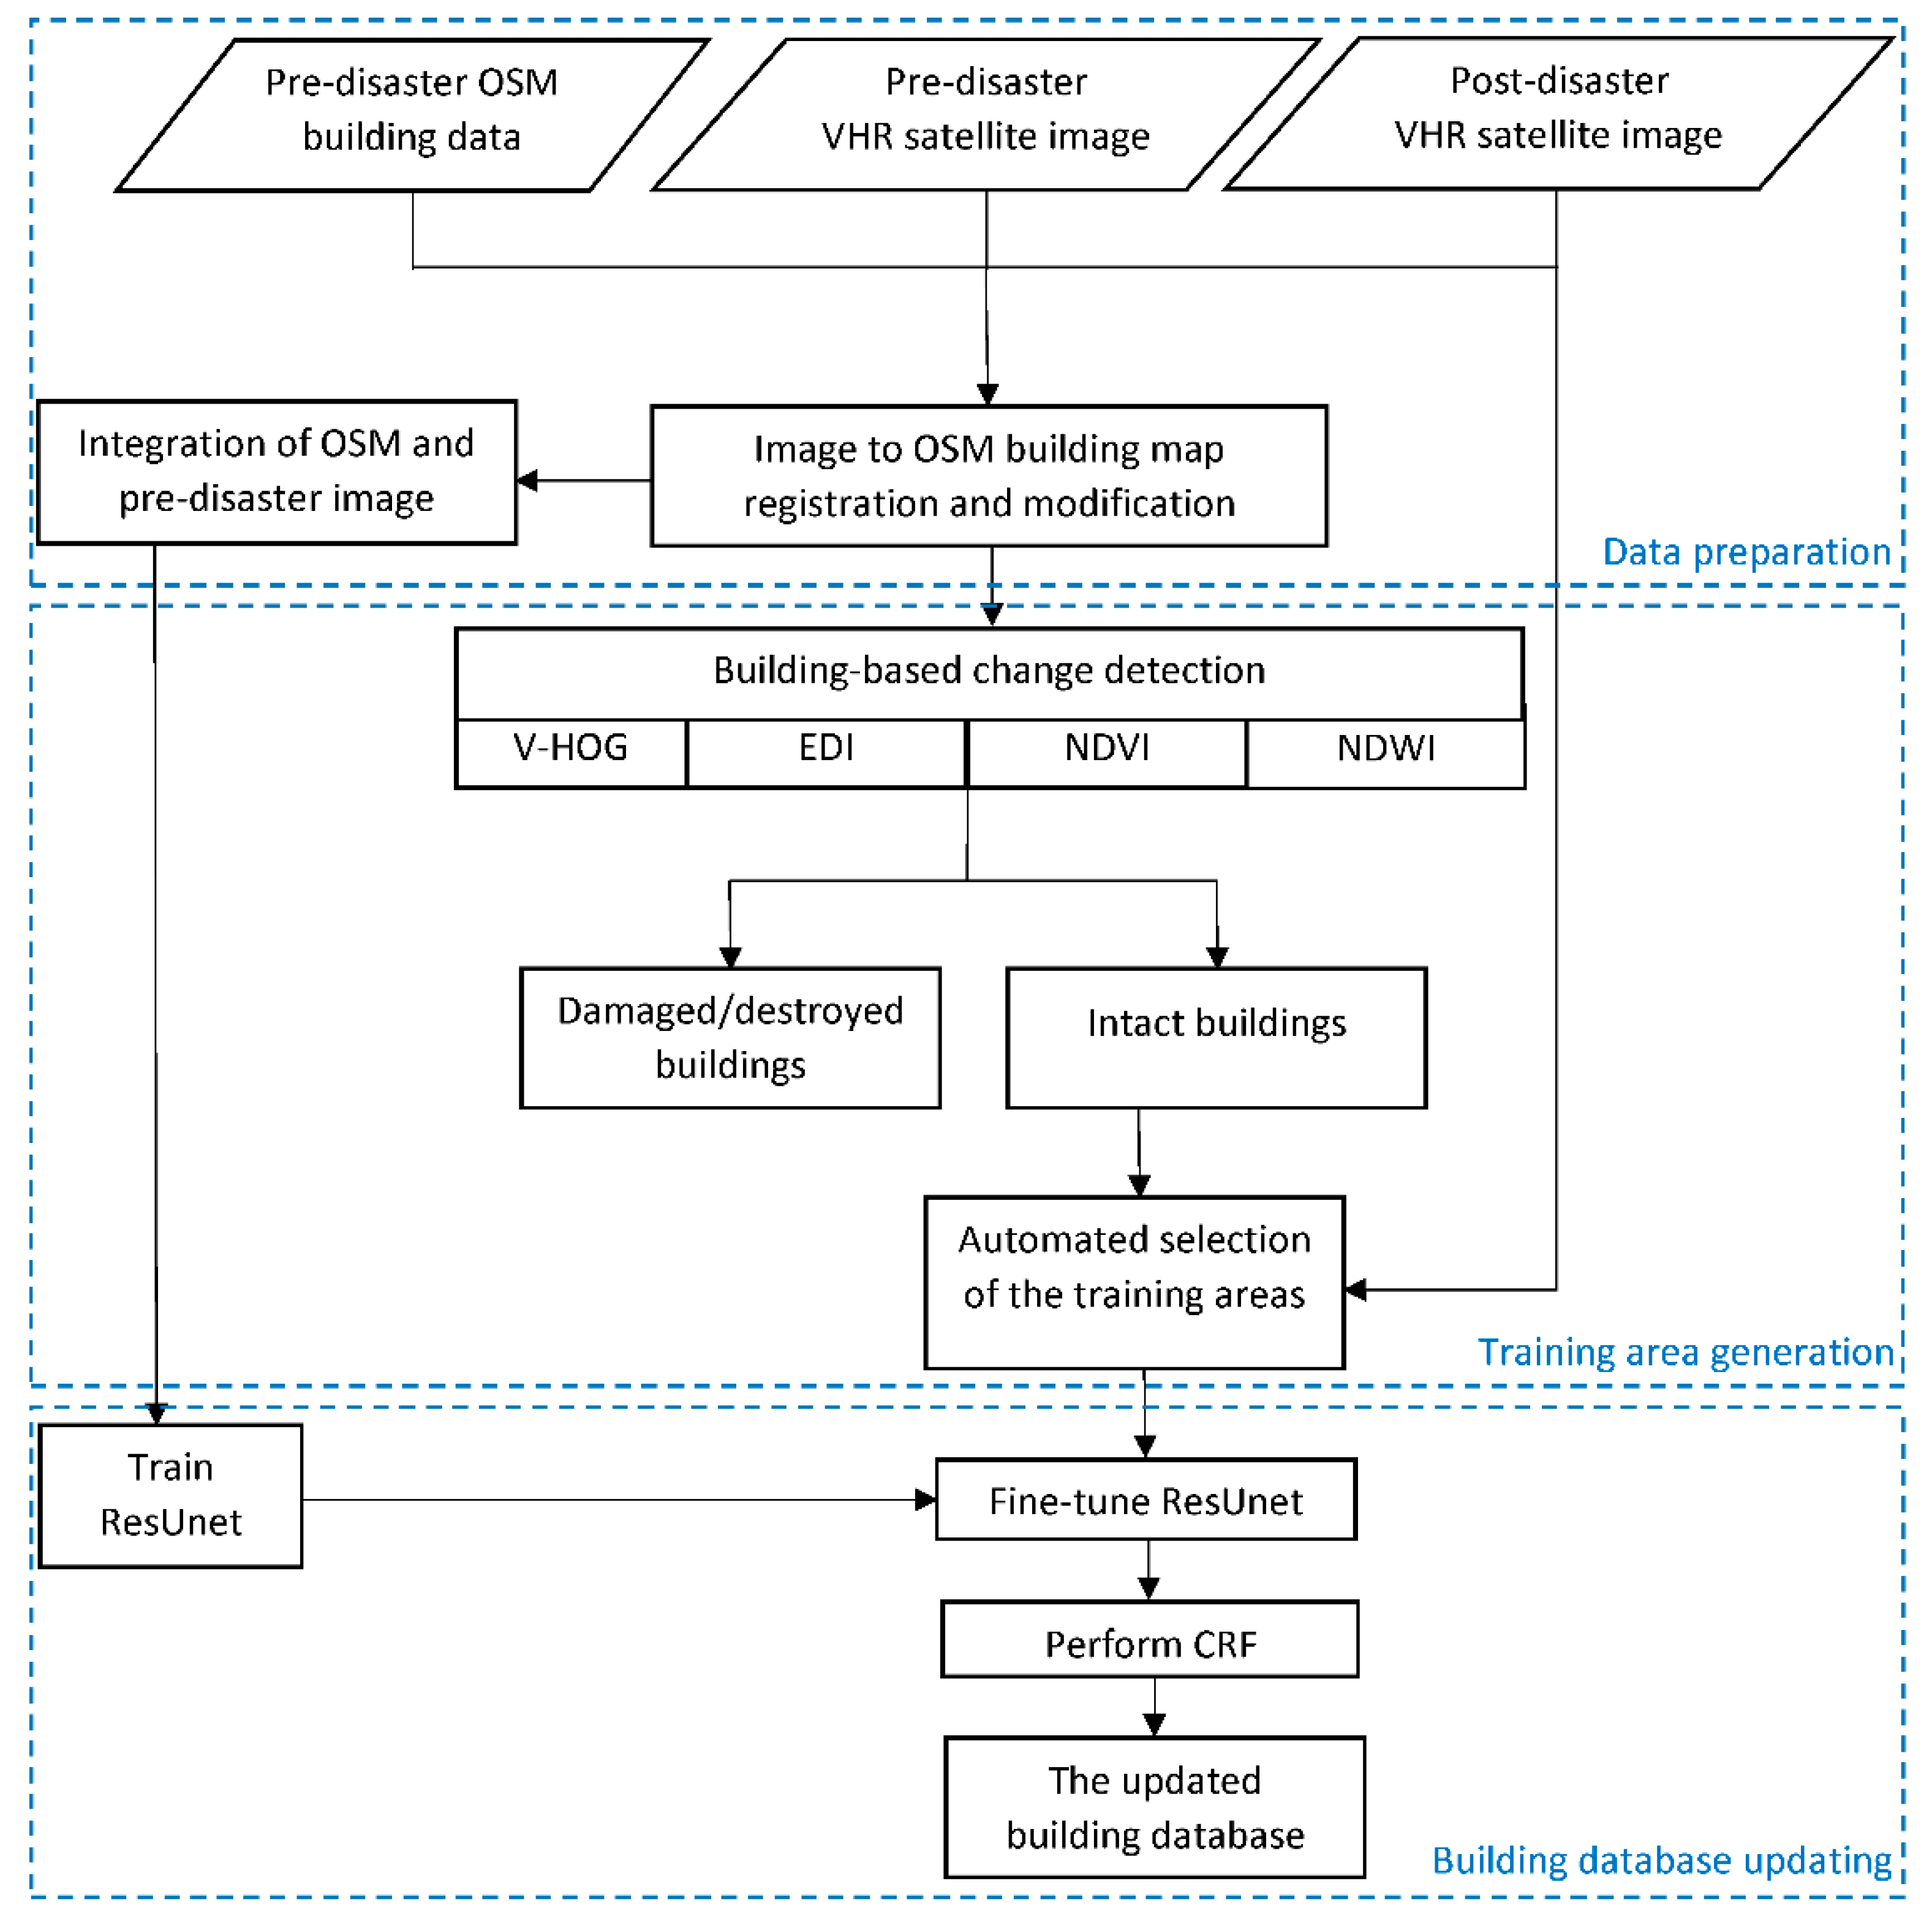
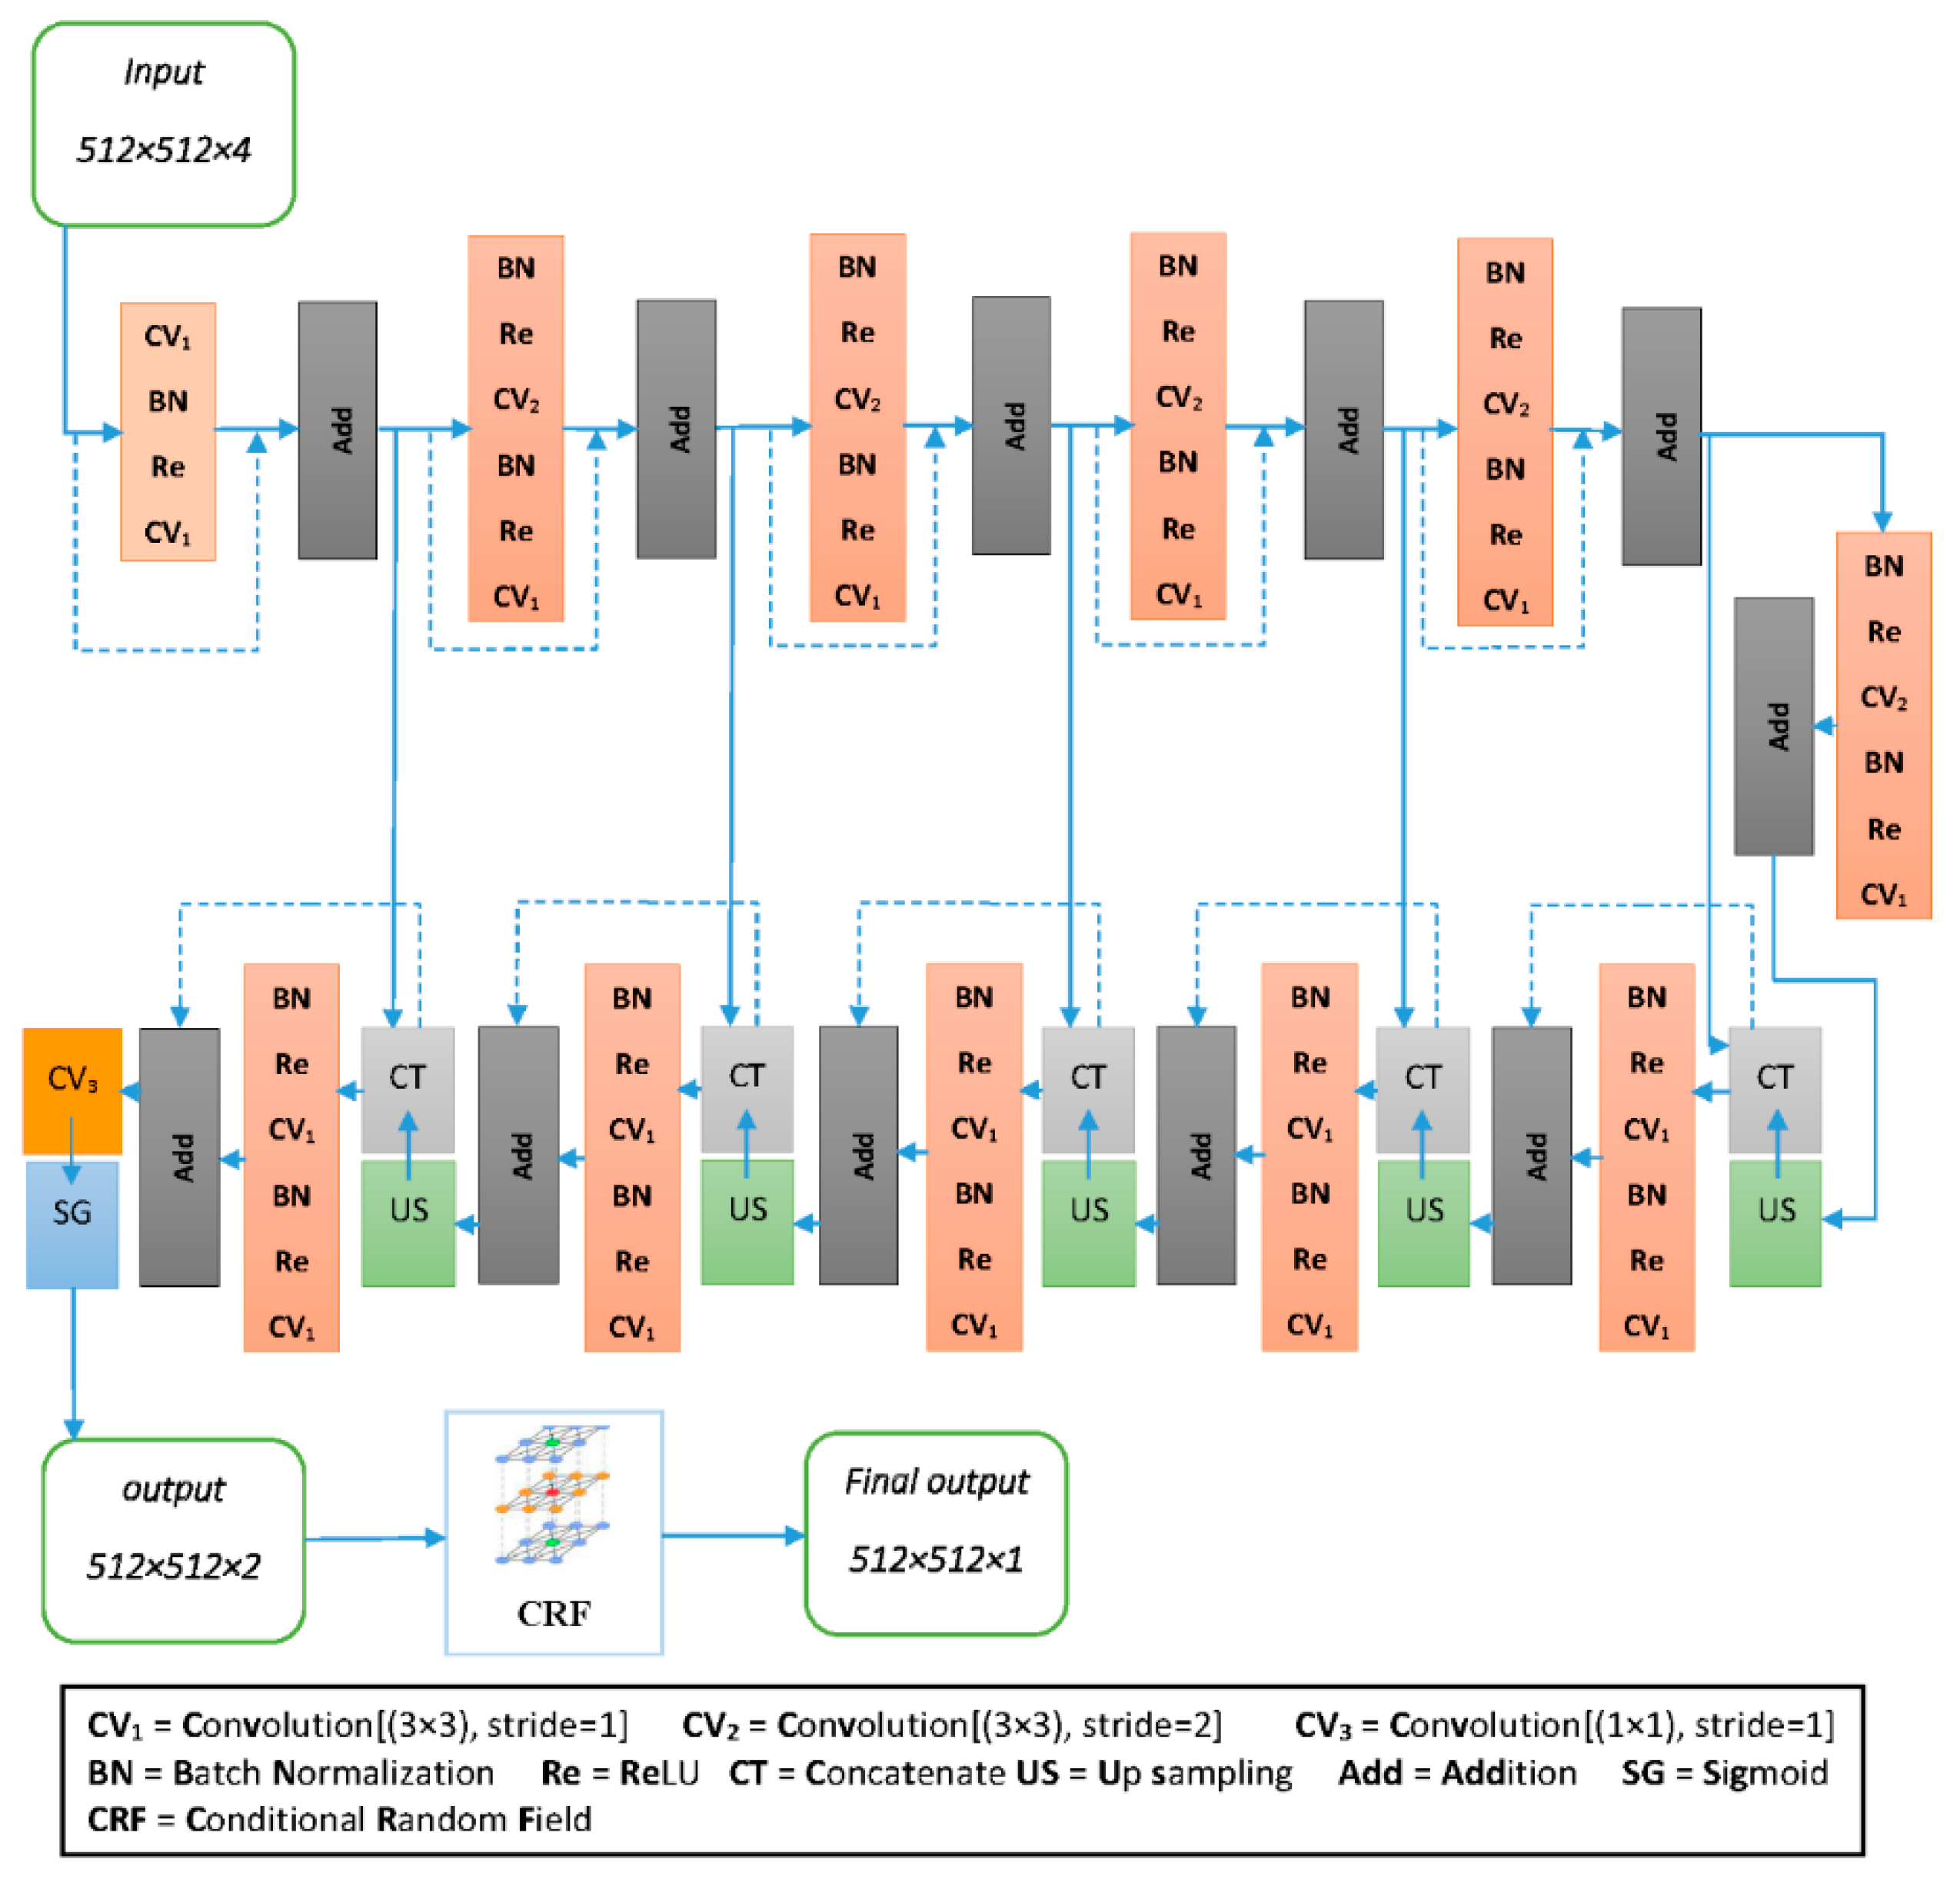
2. Materials and Methods
2.1. Step 1: Co-Registration of OSM Data and Satellite Images
2.2. Step 2: Training Patch Generation from the Pre-Disaster Image
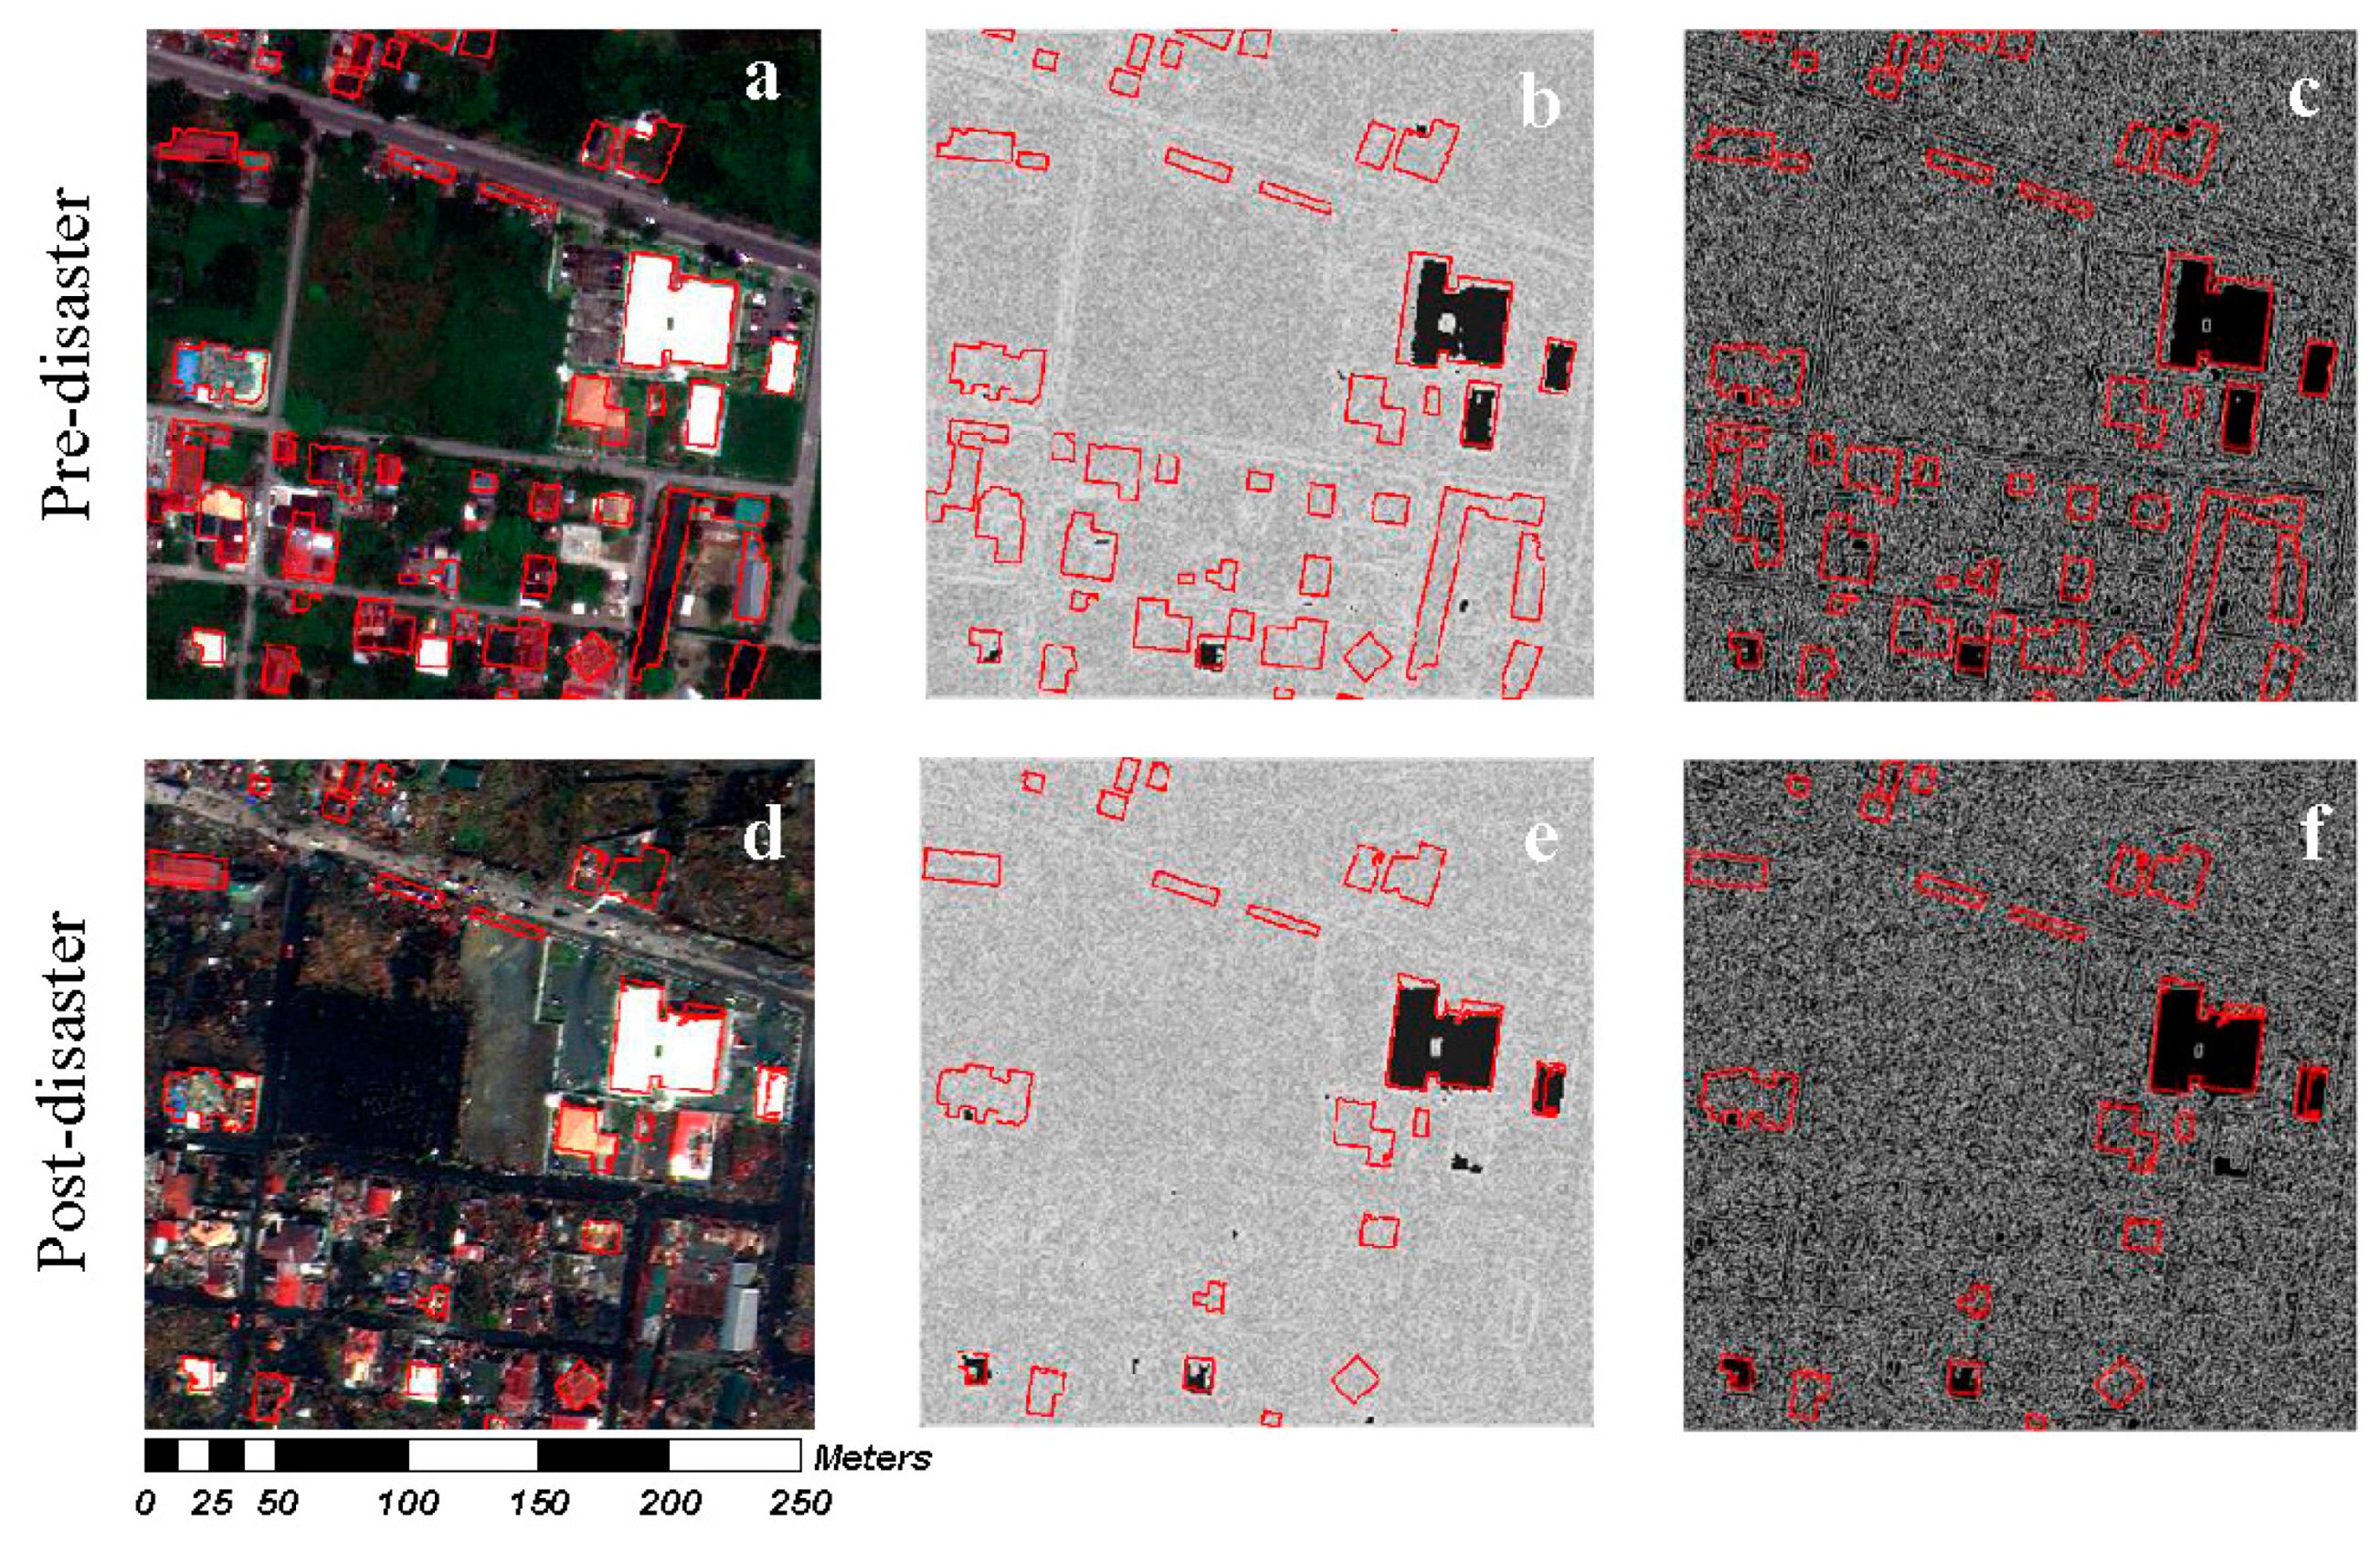
2.3. Step 3: Detecting Damaged and Demolished Buildings
2.3.1. Variation of HOG (V-HOG)
2.3.2. Edge Density Index (EDI)
2.4. Step 4: Updating the Building Database
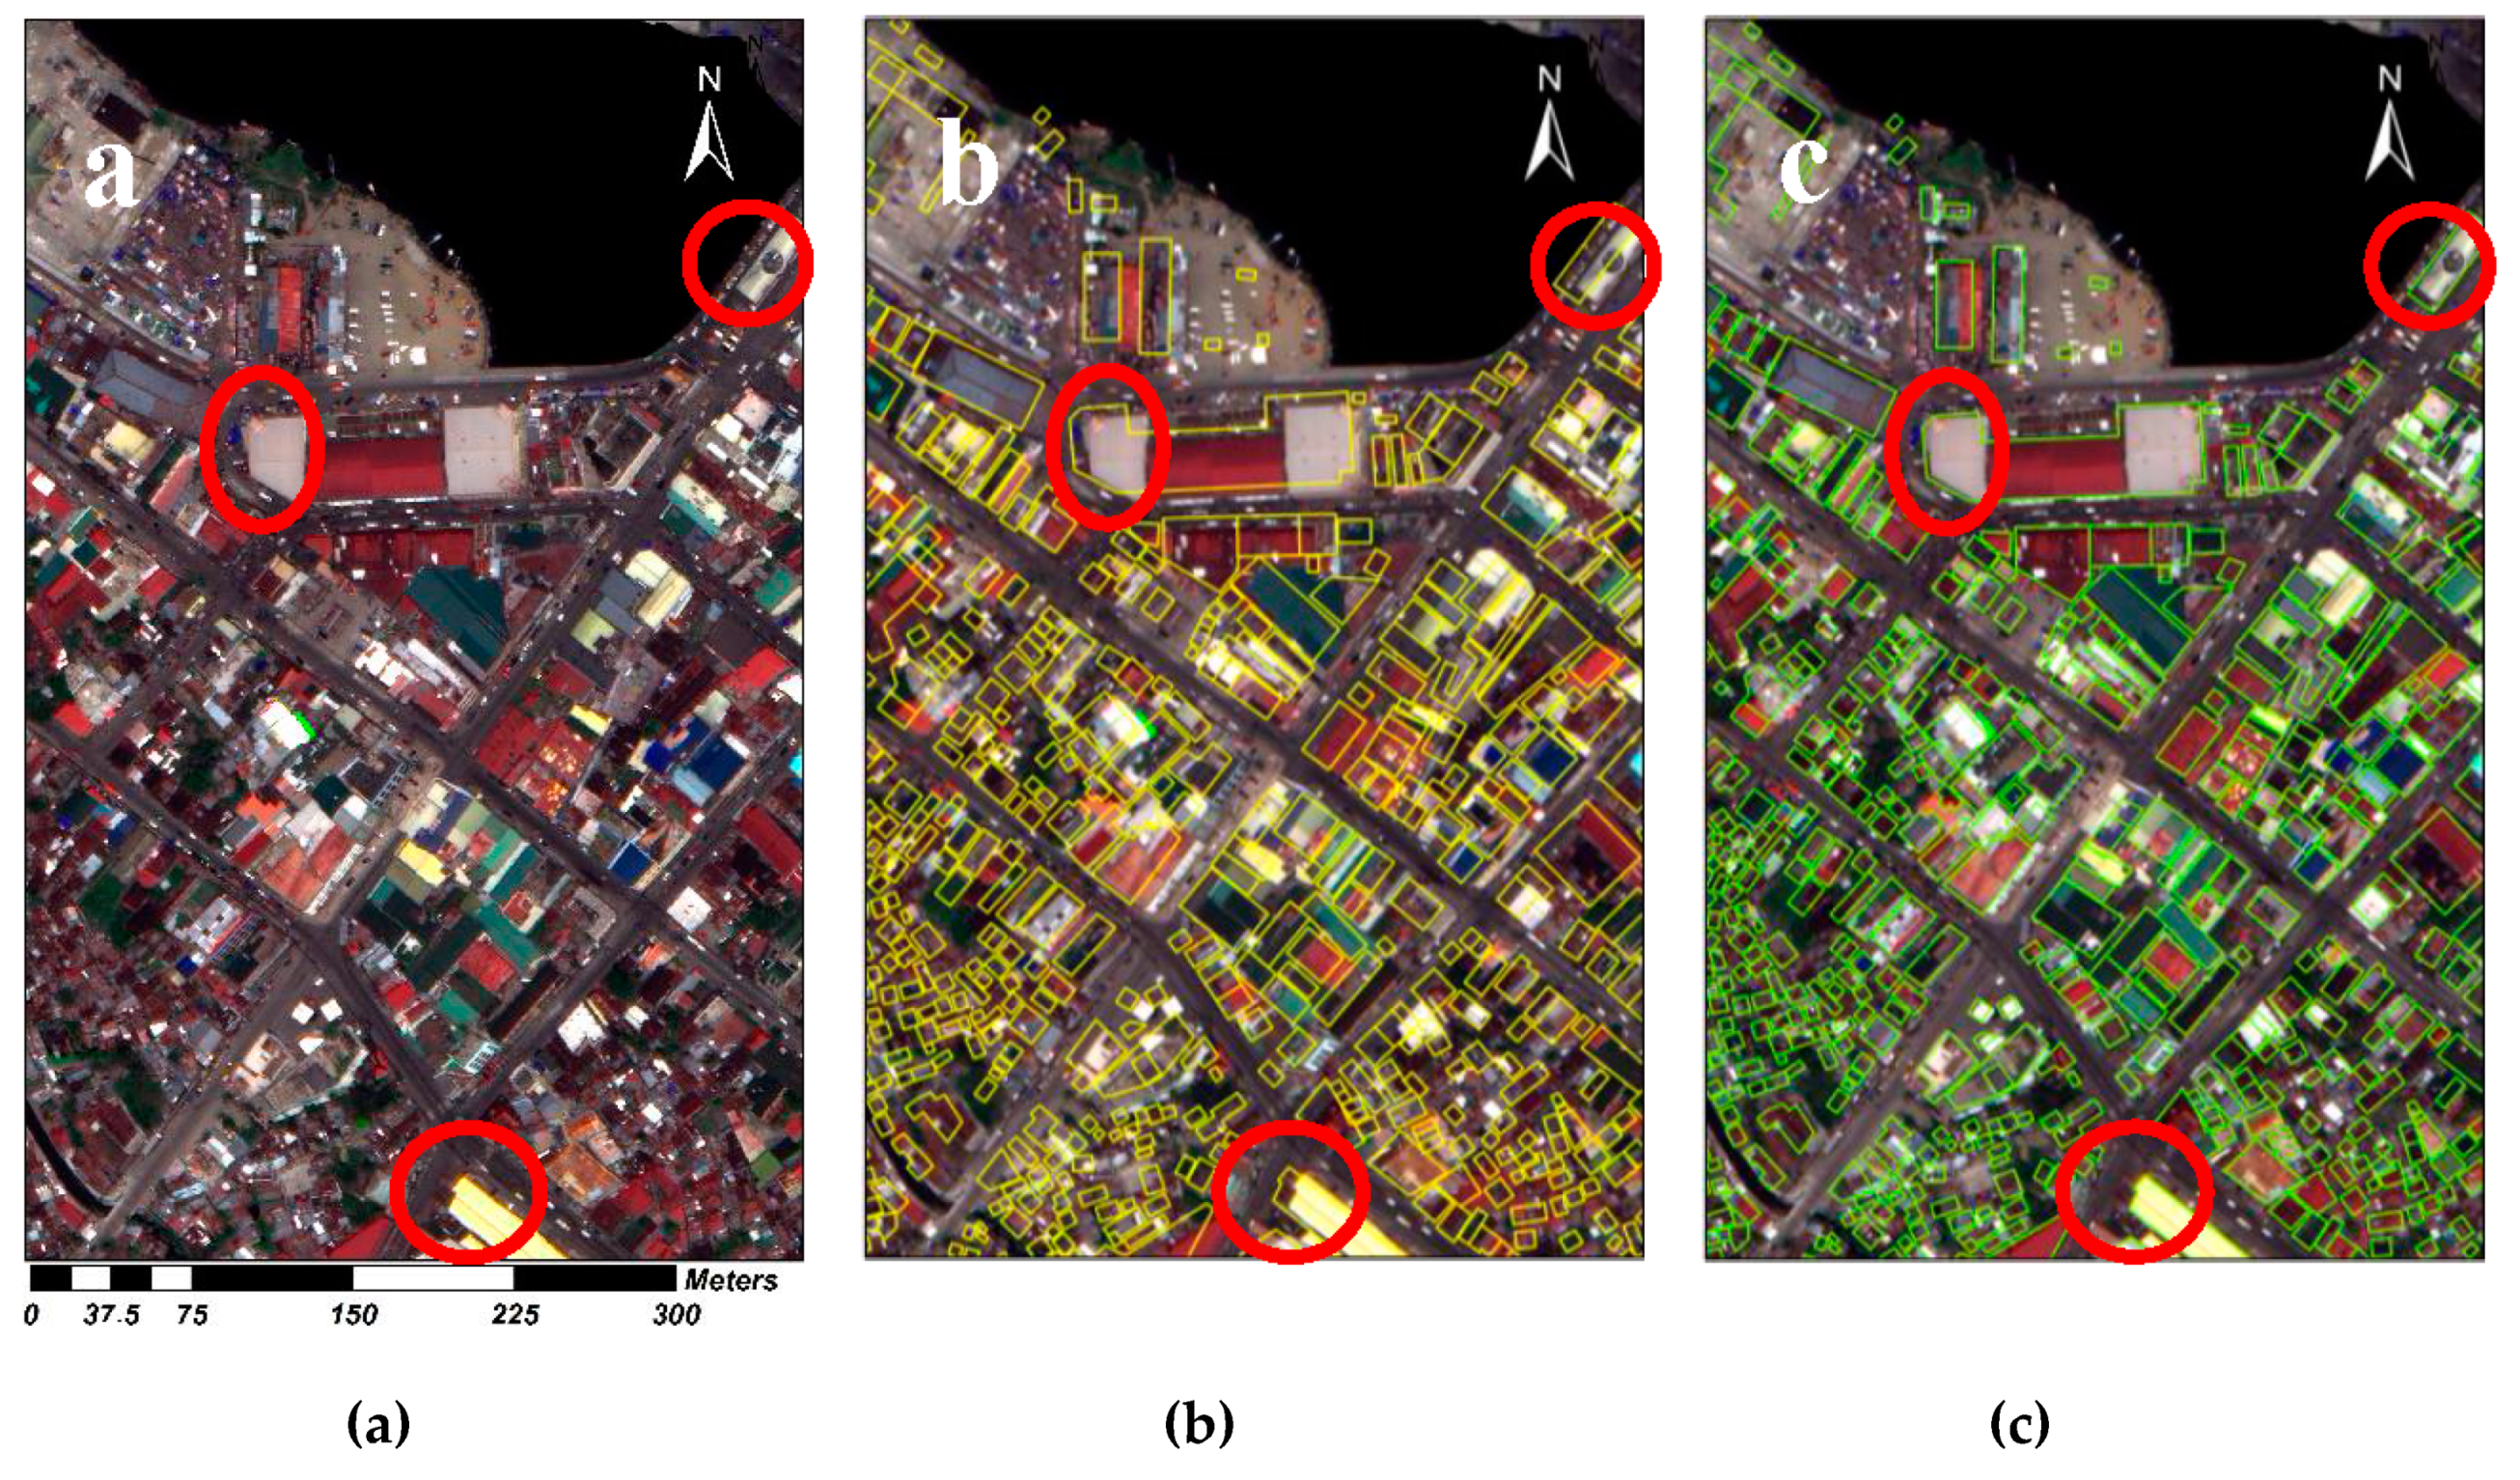
3. Experimental Results
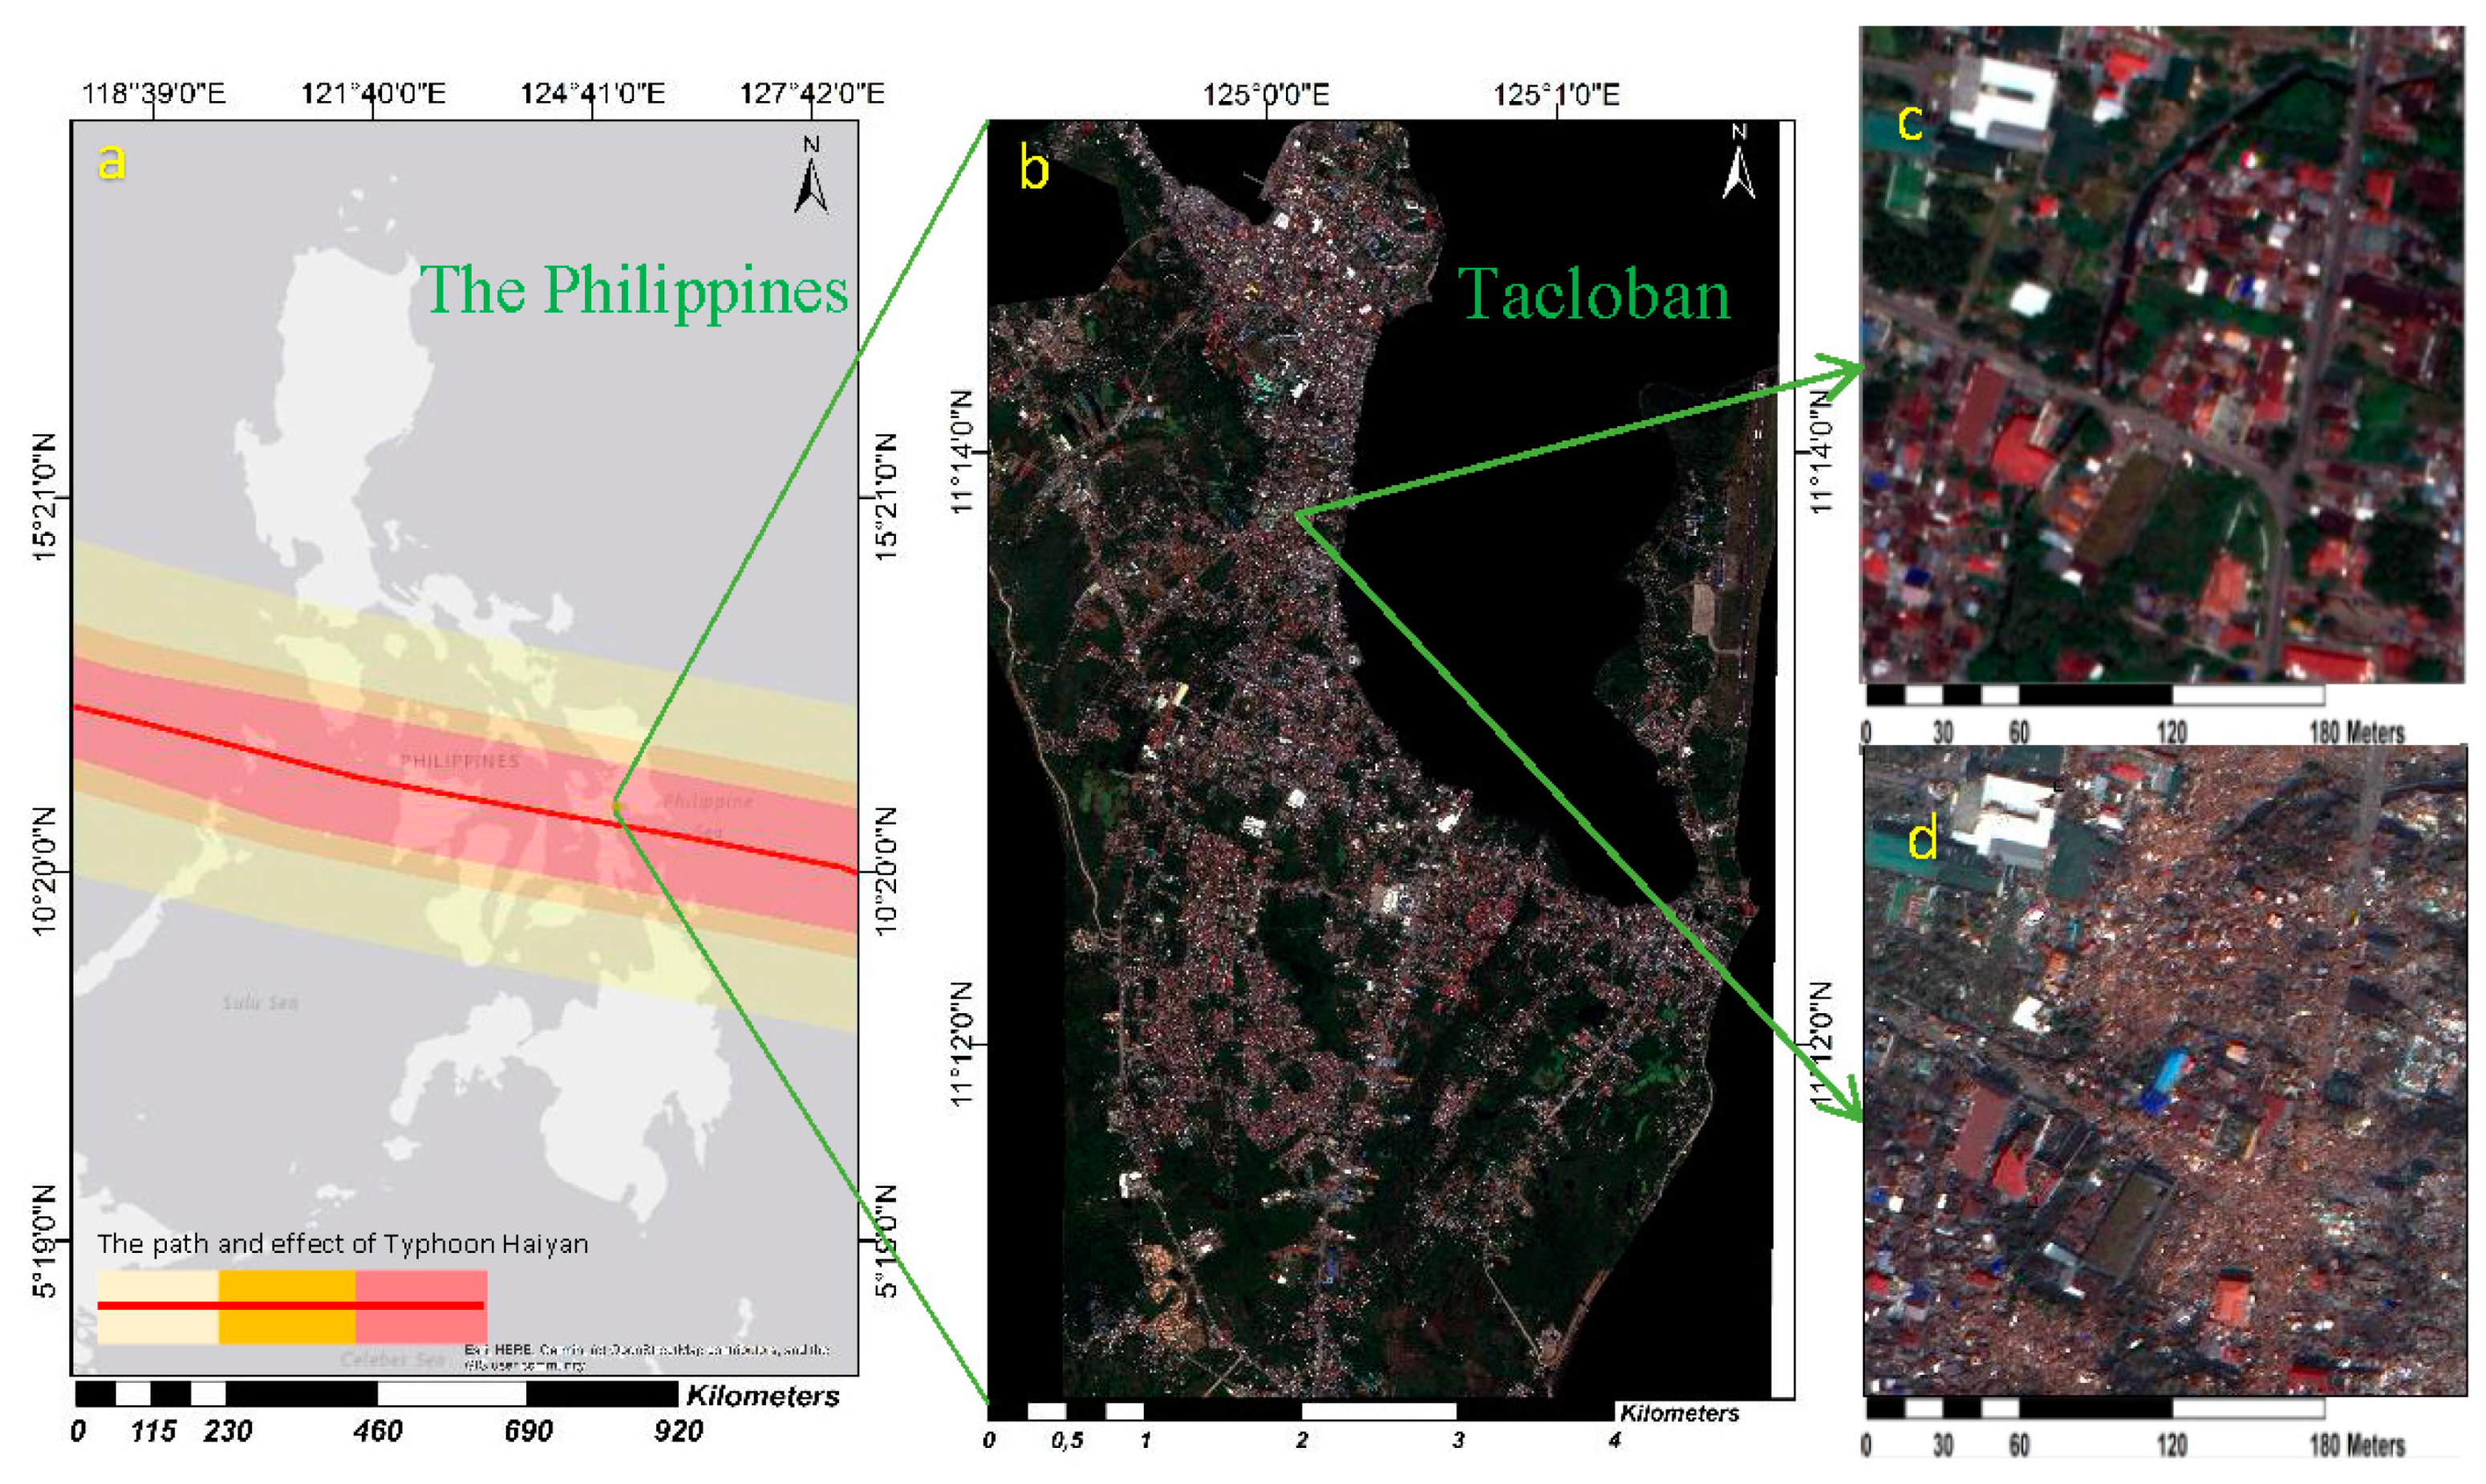
3.1. Datasets
3.2. Experimental Settings
3.3. Experimental Results and Discussion
4. Conclusions
Author Contributions
Funding
Acknowledgments
Conflicts of Interest
References
- UNISDR. In Sendai framework for disaster risk reduction 2015–2030. In Proceedings of the Third World Conference Disaster Risk Reduction, Sendai, Japan, 14–18 March 2015; pp. 1–25. [Google Scholar]
- Ghaffarian, S.; Kerle, N.; Filatova, T. Remote sensing-based proxies for urban disaster risk management and resilience: A review. Remote Sens. 2018, 10, 1760. [Google Scholar] [CrossRef]
- Ghaffarian, S.; Ghaffarian, S. Automatic building detection based on purposive fastica (PFICA) algorithm using monocular high resolution Google Earth images. ISPRS J. Photogramm. Remote Sens. 2014, 97, 152–159. [Google Scholar] [CrossRef]
- Ghaffarian, S. Automatic building detection based on supervised classification using high resolution Google Earth images. Int. Arch. Photogramm. Remote Sens. Spat. Inf. Sci. 2014, 40, 101. [Google Scholar] [CrossRef]
- Sofina, N.; Ehlers, M. Building change detection using high resolution remotely sensed data and gis. IEEE J. Sel. Top. Appl. Earth Observ. Remote Sens. 2016, 9, 3430–3438. [Google Scholar] [CrossRef]
- Ghanea, M.; Moallem, P.; Momeni, M. Building extraction from high-resolution satellite images in urban areas: Recent methods and strategies against significant challenges. Int. J. Remote Sens. 2016, 37, 5234–5248. [Google Scholar] [CrossRef]
- Feng, T.; Zhao, J. Review and comparison: Building extraction methods using high-resolution images. In Proceedings of the 2009 Second International Symposium on Information Science and Engineering, Shanghai, China, 26–28 December 2009; pp. 419–422. [Google Scholar]
- Singh, A. Review article digital change detection techniques using remotely-sensed data. Int. J. Remote Sens. 1989, 10, 989–1003. [Google Scholar] [CrossRef]
- Liu, H.; Yang, M.; Chen, J.; Hou, J.; Deng, M. Line-constrained shape feature for building change detection in VHR remote sensing imagery. ISPRS Int. J. Geo-Inf. 2018, 7, 410. [Google Scholar] [CrossRef]
- Knudsen, T.; Olsen, B.P. Automated change detection for updates of digital map databases. Photogramm. Eng. Remote Sens. 2003, 69, 1289–1296. [Google Scholar] [CrossRef]
- Holland, D.A.; Sanchez-Hernandez, C.; Gladstone, C. Detecting changes to topographic features using high resolution imagery. In Proceedings of the XXIst ISPRS Congress, Beijing, China, 3–11 July 2008; pp. 1153–1158. [Google Scholar]
- Rottensteiner, F. Building change detection from digital surface models and multi-spectral images. Int. Arch. Photogramm. Remote Sens. Spat. Inf. Sci. 2007, 36, 145–150. [Google Scholar]
- Walter, V. Comparison of the potential of different sensors for an automatic approach for change detection in GIS databases. In Digital Images and GIS. International Workshop ISD; Springer: Heidelberg, Germany, 1999; pp. 47–63. [Google Scholar]
- Armenakis, C.; Leduc, F.; Cyr, I.; Savopol, F.; Cavayas, F. A comparative analysis of scanned maps and imagery for mapping applications. ISPRS J. Photogramm. Remote Sens. 2003, 57, 304–314. [Google Scholar] [CrossRef]
- Bouziani, M.; Goïta, K.; He, D.C. Automatic change detection of buildings in urban environment from very high spatial resolution images using existing geodatabase and prior knowledge. ISPRS J. Photogramm. Remote Sens. 2010, 65, 143–153. [Google Scholar] [CrossRef]
- Le Bris, A.; Chehata, N. Change detection in a topographic building database using submetric satellite images. Int. Arch. Photogramm. Remote Sens. Spat. Inf. Sci. 2011, 38, 25–30. [Google Scholar] [CrossRef]
- Gharibi, M.; Arefi, H.; Rastiveis, H.; Hashemi, H. Automatic building map updating using Worldview-2 stereo images and existing outdated building map. Int. Arch. Photogramm. Remote Sens. Spat. Inf. Sci. 2014, XL-2/W3, 131–136. [Google Scholar] [CrossRef]
- Fiset, R.; Cavayas, F.; Mouchot, M.C.; Solaiman, B.; Desjardins, R. Map-image matching using a multi-layer perceptron: The case of the road network. ISPRS J. Photogramm. Remote Sens. 1998, 53, 76–84. [Google Scholar] [CrossRef]
- Bentabet, L.; Jodouin, S.; Ziou, D.; Vaillancourt, J. Road vectors update using SAR imagery: A snake-based method. IEEE Trans. Geosci. Remote Sens. 2003, 41, 1785–1803. [Google Scholar] [CrossRef]
- Baltsavias, E.P. Object extraction and revision by image analysis using existing geodata and knowledge: Current status and steps towards operational systems. ISPRS J. Photogramm. Remote Sens. 2004, 58, 129–151. [Google Scholar] [CrossRef]
- Kerle, N.; Hoffman, R.R. Collaborative damage mapping for emergency response: The role of cognitive systems engineering. Nat. Hazards Earth Syst. Sci. 2013, 13, 97–113. [Google Scholar] [CrossRef]
- Xu, S.; Vosselman, G.; Oude Elberink, S. Detection and classification of changes in buildings from airborne laser scanning data. Remote Sens. 2015, 7, 17051–17076. [Google Scholar] [CrossRef]
- Choi, K.; Lee, I.; Kim, S. A Feature Based Approach to Automatic Change Detection from Lidar Data in Urban Areas; ISPRS Workshop on Laser Scanning: Paris, France, 2009; pp. 259–264. [Google Scholar]
- Jung, F. Detecting building changes from multitemporal aerial stereopairs. ISPRS J. Photogramm. Remote Sens. 2004, 58, 187–201. [Google Scholar] [CrossRef]
- Tian, J.; Chaabouni-Chouayakh, H.P.R. 3D Building Change Detection from High Resolution Spaceborne Stereo Imagery; International Workshop M2RSM: Xiamen, China, 2011; pp. 1–7. [Google Scholar]
- Zielstra, D.; Zipf, A. A comparative study of proprietary geodata and volunteered geographic information for Germany. In Proceedings of the 13th AGILE International Conference on Geographic Information Science, Guimaraes, Portugal, 11–14 May 2010. [Google Scholar]
- Brovelli, M.; Zamboni, G. A new method for the assessment of spatial accuracy and completeness of OpenStreetMap building footprints. ISPRS Int. J. Geo-Inf. 2018, 7, 289. [Google Scholar] [CrossRef]
- Siebritz, L.A.; Sithole, G. Assessing the quality of OpenStreetMap data in South Africa in reference to national mapping standards. In Proceedings of the Second AfricaGEO Conference, Cape Town, South Africa, 1–3 July 2014. [Google Scholar]
- Jokar Arsanjani, J.; Mooney, P.; Zipf, A.; Schauss, A. Quality assessment of the contributed land use information from OpenStreetMap versus authoritative datasets. In OpenStreetMap in GIScience; Springer: Cham, Switzerland, 2015; pp. 37–58. [Google Scholar]
- Matikainen, L.; Hyyppä, J.; Ahokas, E.; Markelin, L.; Kaartinen, H. Automatic detection of buildings and changes in buildings for updating of maps. Remote Sens. 2010, 2, 1217–1248. [Google Scholar] [CrossRef]
- Malpica, J.A.; Alonso, M.C.; Papí, F.; Arozarena, A.; Martínez De Agirre, A. Change detection of buildings from satellite imagery and lidar data. Int. J. Remote Sens. 2012, 34, 1652–1675. [Google Scholar] [CrossRef] [Green Version]
- Zhao, B.; Zhong, Y.; Xia, G.; Zhang, L. Dirichlet-derived multiple topic scene classification model for high spatial resolution remote sensing imagery. IEEE Trans. Geosci. Remote Sens. 2016, 54, 2108–2123. [Google Scholar] [CrossRef]
- Yang, W.; Yin, X.; Xia, G. Learning high-level features for satellite image classification with limited labeled samples. IEEE Trans. Geosci. Remote Sens. 2015, 53, 4472–4482. [Google Scholar] [CrossRef]
- Li, W.; Wu, G.; Zhang, F.; Du, Q. Hyperspectral image classification using deep pixel-pair features. IEEE Trans. Geosci. Remote Sens. 2017, 55, 844–853. [Google Scholar] [CrossRef]
- Mou, L.; Ghamisi, P.; Zhu, X.X. Fully conv-deconv network for unsupervised spectral-spatial feature extraction of hyperspectral imagery via residual learning. In Proceedings of the 2017 IEEE International Geoscience and Remote Sensing Symposium (IGARSS), Fort Worth, TX, USA, 23–28 July 2017; pp. 5181–5184. [Google Scholar]
- Mou, L.; Ghamisi, P.; Zhu, X.X. Deep recurrent neural networks for hyperspectral image classification. IEEE Trans. Geosci. Remote Sens. 2017, 55, 3639–3655. [Google Scholar] [CrossRef]
- Jin, X.; Davis, C.H. Vehicle detection from high-resolution satellite imagery using morphological shared-weight neural networks. Image Vis. Comput. 2007, 25, 1422–1431. [Google Scholar] [CrossRef]
- Cheng, G.; Zhou, P.; Yao, X.; Yao, C.; Zhang, Y.; Han, J. Object detection in VHR optical remote sensing images via learning rotation-invariant hog feature. In Proceedings of the 2016 4th International Workshop on Earth Observation and Remote Sensing Applications (EORSA), Guangzhou, China, 4–6 July 2016; pp. 433–436. [Google Scholar]
- Jiang, T.; Xia, G.; Lu, Q. Sketch-based aerial image retrieval. In Proceedings of the 2017 IEEE International Conference on Image Processing (ICIP), Beijing, China, 17–20 September 2017; pp. 3690–3694. [Google Scholar]
- Loncan, L.; Almeida, L.B.D.; Bioucas-Dias, J.M.; Briottet, X.; Chanussot, J.; Dobigeon, N.; Fabre, S.; Liao, W.; Licciardi, G.A.; Simoes, M.; et al. Hyperspectral pansharpening: A review. IEEE Geosci. Remote Sens. Mag. 2015, 3, 27–46. [Google Scholar] [CrossRef]
- Duarte, D.; Nex, F.; Kerle, N.; Vosselman, G. Multi-resolution feature fusion for image classification of building damages with convolutional neural networks. Remote Sens. 2018, 10, 1636. [Google Scholar] [CrossRef]
- Lyu, H.; Lu, H.; Mou, L. Learning a transferable change rule from a recurrent neural network for land cover change detection. Remote Sens. 2016, 8, 506. [Google Scholar] [CrossRef]
- Li, W.; Wu, G.; Du, Q. Transferred deep learning for anomaly detection in hyperspectral imagery. IEEE Geosci. Remote Sens. Lett. 2017, 14, 597–601. [Google Scholar] [CrossRef]
- Zhang, Z.; Vosselman, G.; Gerke, M.; Tuia, D.; Yang, M.Y. Change Detection between Multimodal Remote Sensing Data Using SIAMESE CNN. arXiv 2018, arXiv:1807.09562. [Google Scholar]
- Duarte, D.; Nex, F.; Kerle, N.; Vosselman, G. Damage detection on building façades using multi-temporal aerial oblique imagery. ISPRS Ann. Photogramm. Remote Sens. Spat. Inf. Sci. 2019, IV-2/W5, 29–36. [Google Scholar] [CrossRef]
- Nex, F.; Duarte, D.; Steenbeek, A.; Kerle, N. Towards real-time building damage mapping with low-cost UAV solutions. Remote Sens. 2019, 11, 287. [Google Scholar] [CrossRef]
- Duarte, D.; Nex, F.; Kerle, N.; Vosselman, G. Satellite image classification of building damages using airborne and satellite image samples in a deep learning approach. ISPRS Ann. Photogramm. Remote Sens. Spat. Inf. Sci. 2018, 4, 89–96. [Google Scholar] [CrossRef]
- Vetrivel, A.; Gerke, M.; Kerle, N.; Nex, F.; Vosselman, G. Disaster damage detection through synergistic use of deep learning and 3D point cloud features derived from very high resolution oblique aerial images, and multiple-kernel-learning. ISPRS J. Photogramm. Remote Sens. 2018, 140, 45–59. [Google Scholar] [CrossRef]
- Saha, S.; Bovolo, F.; Bruzzone, L. Destroyed-buildings detection from VHR SAR images using deep features. In Image and Signal Processing for Remote Sensing XXIV; International Society for Optics and Photonics: Berlin, Germany, 2018. [Google Scholar]
- Xiao, L.; Zhang, Y.; Peng, G. Landslide susceptibility assessment using integrated deep learning algorithm along the China-Nepal highway. Sensors 2018, 18, 4436. [Google Scholar] [CrossRef]
- Chen, Z.; Zhang, Y.; Ouyang, C.; Zhang, F.; Ma, J. Automated landslides detection for mountain cities using multi-temporal remote sensing imagery. Sensors 2018, 18, 821. [Google Scholar] [CrossRef]
- Zhao, Y.; Ma, J.; Li, X.; Zhang, J. Saliency detection and deep learning-based wildfire identification in UAV imagery. Sensors 2018, 18, 712. [Google Scholar] [CrossRef]
- Ji, M.; Liu, L.; Du, R.; Buchroithner, M.F. A comparative study of texture and convolutional neural network features for detecting collapsed buildings after earthquakes using pre- and post-event satellite imagery. Remote Sens. 2019, 11, 1202. [Google Scholar] [CrossRef]
- Zhang, Z.; Liu, Q.; Wang, Y. Road extraction by deep residual U-net. IEEE Geosci. Remote Sens. Lett. 2018, 15, 749–753. [Google Scholar] [CrossRef]
- Alam, F.I.; Zhou, J.; Liew, A.W.; Jia, X.; Chanussot, J.; Gao, Y. Conditional random field and deep feature learning for hyperspectral image classification. IEEE Trans. Geosci. Remote Sens. 2018, 57, 1612–1628. [Google Scholar] [CrossRef]
- Pan, X.; Zhao, J. High-resolution remote sensing image classification method based on convolutional neural network and restricted conditional random field. Remote Sens. 2018, 10, 920. [Google Scholar] [CrossRef]
- Dalal, N.; Triggs, B. Histograms of oriented gradients for human detection. In Proceedings of the Computer Society Conference on Computer Vision and Pattern Recognition (CVPR), San Diego, CA, USA, 20–25 June 2005; pp. 886–893. [Google Scholar]
- Geronimo, D.; Lopez, A.M.; Sappa, A.D.; Graf, T. Survey of pedestrian detection for advanced driver assistance systems. IEEE Trans. Pattern Anal. Mach. Intell. 2010, 32, 1239–1258. [Google Scholar] [CrossRef]
- Torrione, P.A.; Morton, K.D.; Sakaguchi, R.; Collins, L.M. Histograms of oriented gradients for landmine detection in ground-penetrating radar data. IEEE Trans. Geosci. Remote Sens. 2014, 52, 1539–1550. [Google Scholar] [CrossRef]
- Patel, M.I.; Thakar, V.K.; Shah, S.K. Image registration of satellite images with varying illumination level using HOG descriptor based SURF. Procedia Comput. Sci. 2016, 93, 382–388. [Google Scholar] [CrossRef]
- Xu, Y.; Yu, G.; Wang, Y.; Wu, X.; Ma, Y. A hybrid vehicle detection method based on Viola-Jones and HOG + SVM from UAV images. Sensors 2016, 16, 1325. [Google Scholar] [CrossRef]
- Vetrivel, A.; Gerke, M.; Kerle, N.; Vosselman, G. Identification of structurally damaged areas in airborne oblique images using a visual-bag-of-words approach. Remote Sens. 2016, 8, 231. [Google Scholar] [CrossRef]
- Marmanis, D.; Schindler, K.; Wegner, J.D.; Galliani, S.; Datcu, M.; Stilla, U. Classification with an edge: Improving semantic image segmentation with boundary detection. ISPRS J. Photogramm. Remote Sens. 2018, 135, 158–172. [Google Scholar] [CrossRef] [Green Version]
- Ghaffarian, S.; Turker, M. An improved cluster-based snake model for automatic agricultural field boundary extraction from high spatial resolution imagery. Int. J. Remote Sens. 2019, 40, 1217–1247. [Google Scholar] [CrossRef]
- Canny, J. A computational approach to edge detection. IEEE Trans. Pattern Anal. Mach. Intell. 1986, PAMI-8, 679–698. [Google Scholar] [CrossRef]
- Celik, T. Unsupervised change detection in satellite images using principal component analysis and k-means clustering. IEEE Geosci. Remote Sens. Lett. 2009, 6, 772–776. [Google Scholar] [CrossRef]
- Lu, D.; Mausel, P.; Brondízio, E.; Moran, E. Change detection techniques. Int. J. Remote Sens. 2004, 25, 2365–2401. [Google Scholar] [CrossRef]
- Janalipour, M.; Mohammadzadeh, A. Building damage detection using object-based image analysis and anfis from high-resolution image (case study: Bam earthquake, Iran). IEEE J. Sel. Top. Appl. Earth Observ. Remote Sens. 2016, 9, 1937–1945. [Google Scholar] [CrossRef]
- Bai, Y.; Mas, E.; Koshimura, S. Towards operational satellite-based damage-mapping using U-net convolutional network: A case study of 2011 Tohoku earthquake-tsunami. Remote Sens. 2018, 10, 1626. [Google Scholar] [CrossRef]
- Yuan, M.; Liu, Z.; Wang, F. Using the wide-range attention U-Net for road segmentation. Remote Sens. Lett. 2019, 10, 506–515. [Google Scholar] [CrossRef]
- Zhu, X.X.; Tuia, D.; Mou, L.; Xia, G.; Zhang, L.; Xu, F.; Fraundorfer, F. Deep learning in remote sensing: A comprehensive review and list of resources. IEEE Geosci. Remote Sens. Mag. 2017, 5, 8–36. [Google Scholar] [CrossRef]
- Gopalakrishnan, K.; Khaitan, S.K.; Choudhary, A.; Agrawal, A. Deep convolutional neural networks with transfer learning for computer vision-based data-driven pavement distress detection. Constr. Build. Mater. 2017, 157, 322–330. [Google Scholar] [CrossRef]
- Shin, H.; Roth, H.R.; Gao, M.; Lu, L.; Xu, Z.; Nogues, I.; Yao, J.; Mollura, D.; Summers, R.M. Deep convolutional neural networks for computer-aided detection: CNN architectures, dataset characteristics and transfer learning. IEEE Trans. Med. Imaging 2016, 35, 1285–1298. [Google Scholar] [CrossRef]
- Ker, J.; Wang, L.; Rao, J.; Lim, T. Deep learning applications in medical image analysis. IEEE Access 2018, 6, 9375–9389. [Google Scholar] [CrossRef]
- Huang, Z.; Pan, Z.; Lei, B. Transfer learning with deep convolutional neural network for SAR target classification with limited labeled data. Remote Sens. 2017, 9, 907. [Google Scholar] [CrossRef]
- Li, X.; Zhang, L.; Du, B.; Zhang, L.; Shi, Q. Iterative reweighting heterogeneous transfer learning framework for supervised remote sensing image classification. IEEE J. Sel. Top. Appl. Earth Observ. Remote Sens. 2017, 10, 2022–2035. [Google Scholar] [CrossRef]
- Wang, Y.; Liang, B.; Ding, M.; Li, J. Dense semantic labeling with atrous spatial pyramid pooling and decoder for high-resolution remote sensing imagery. Remote Sens. 2018, 11, 20. [Google Scholar] [CrossRef]
- Liu, Y.; Piramanayagam, S.; Monteiro, S.T.; Saber, E. Semantic segmentation of multisensor remote sensing imagery with deep convnets and higher-order conditional random fields. J. Appl. Remote Sens. 2019, 13, 1. [Google Scholar] [CrossRef]
- Krähenbühl, P.; Koltun, V. Efficient inference in fully connected CRFs with gaussian edge potentials. In Proceedings of the Advances in Neural Information Processing Systems (NIPS), Granada, Spain, 12–17 December 2011; pp. 109–117. [Google Scholar]
- Potts, R.B. Some generalized order-disorder transformations. In Mathematical Proceedings of the Cambridge Philosophical Society; Cambridge University Press: Cambridge, UK, 1952; Volume 48, pp. 106–109. [Google Scholar]


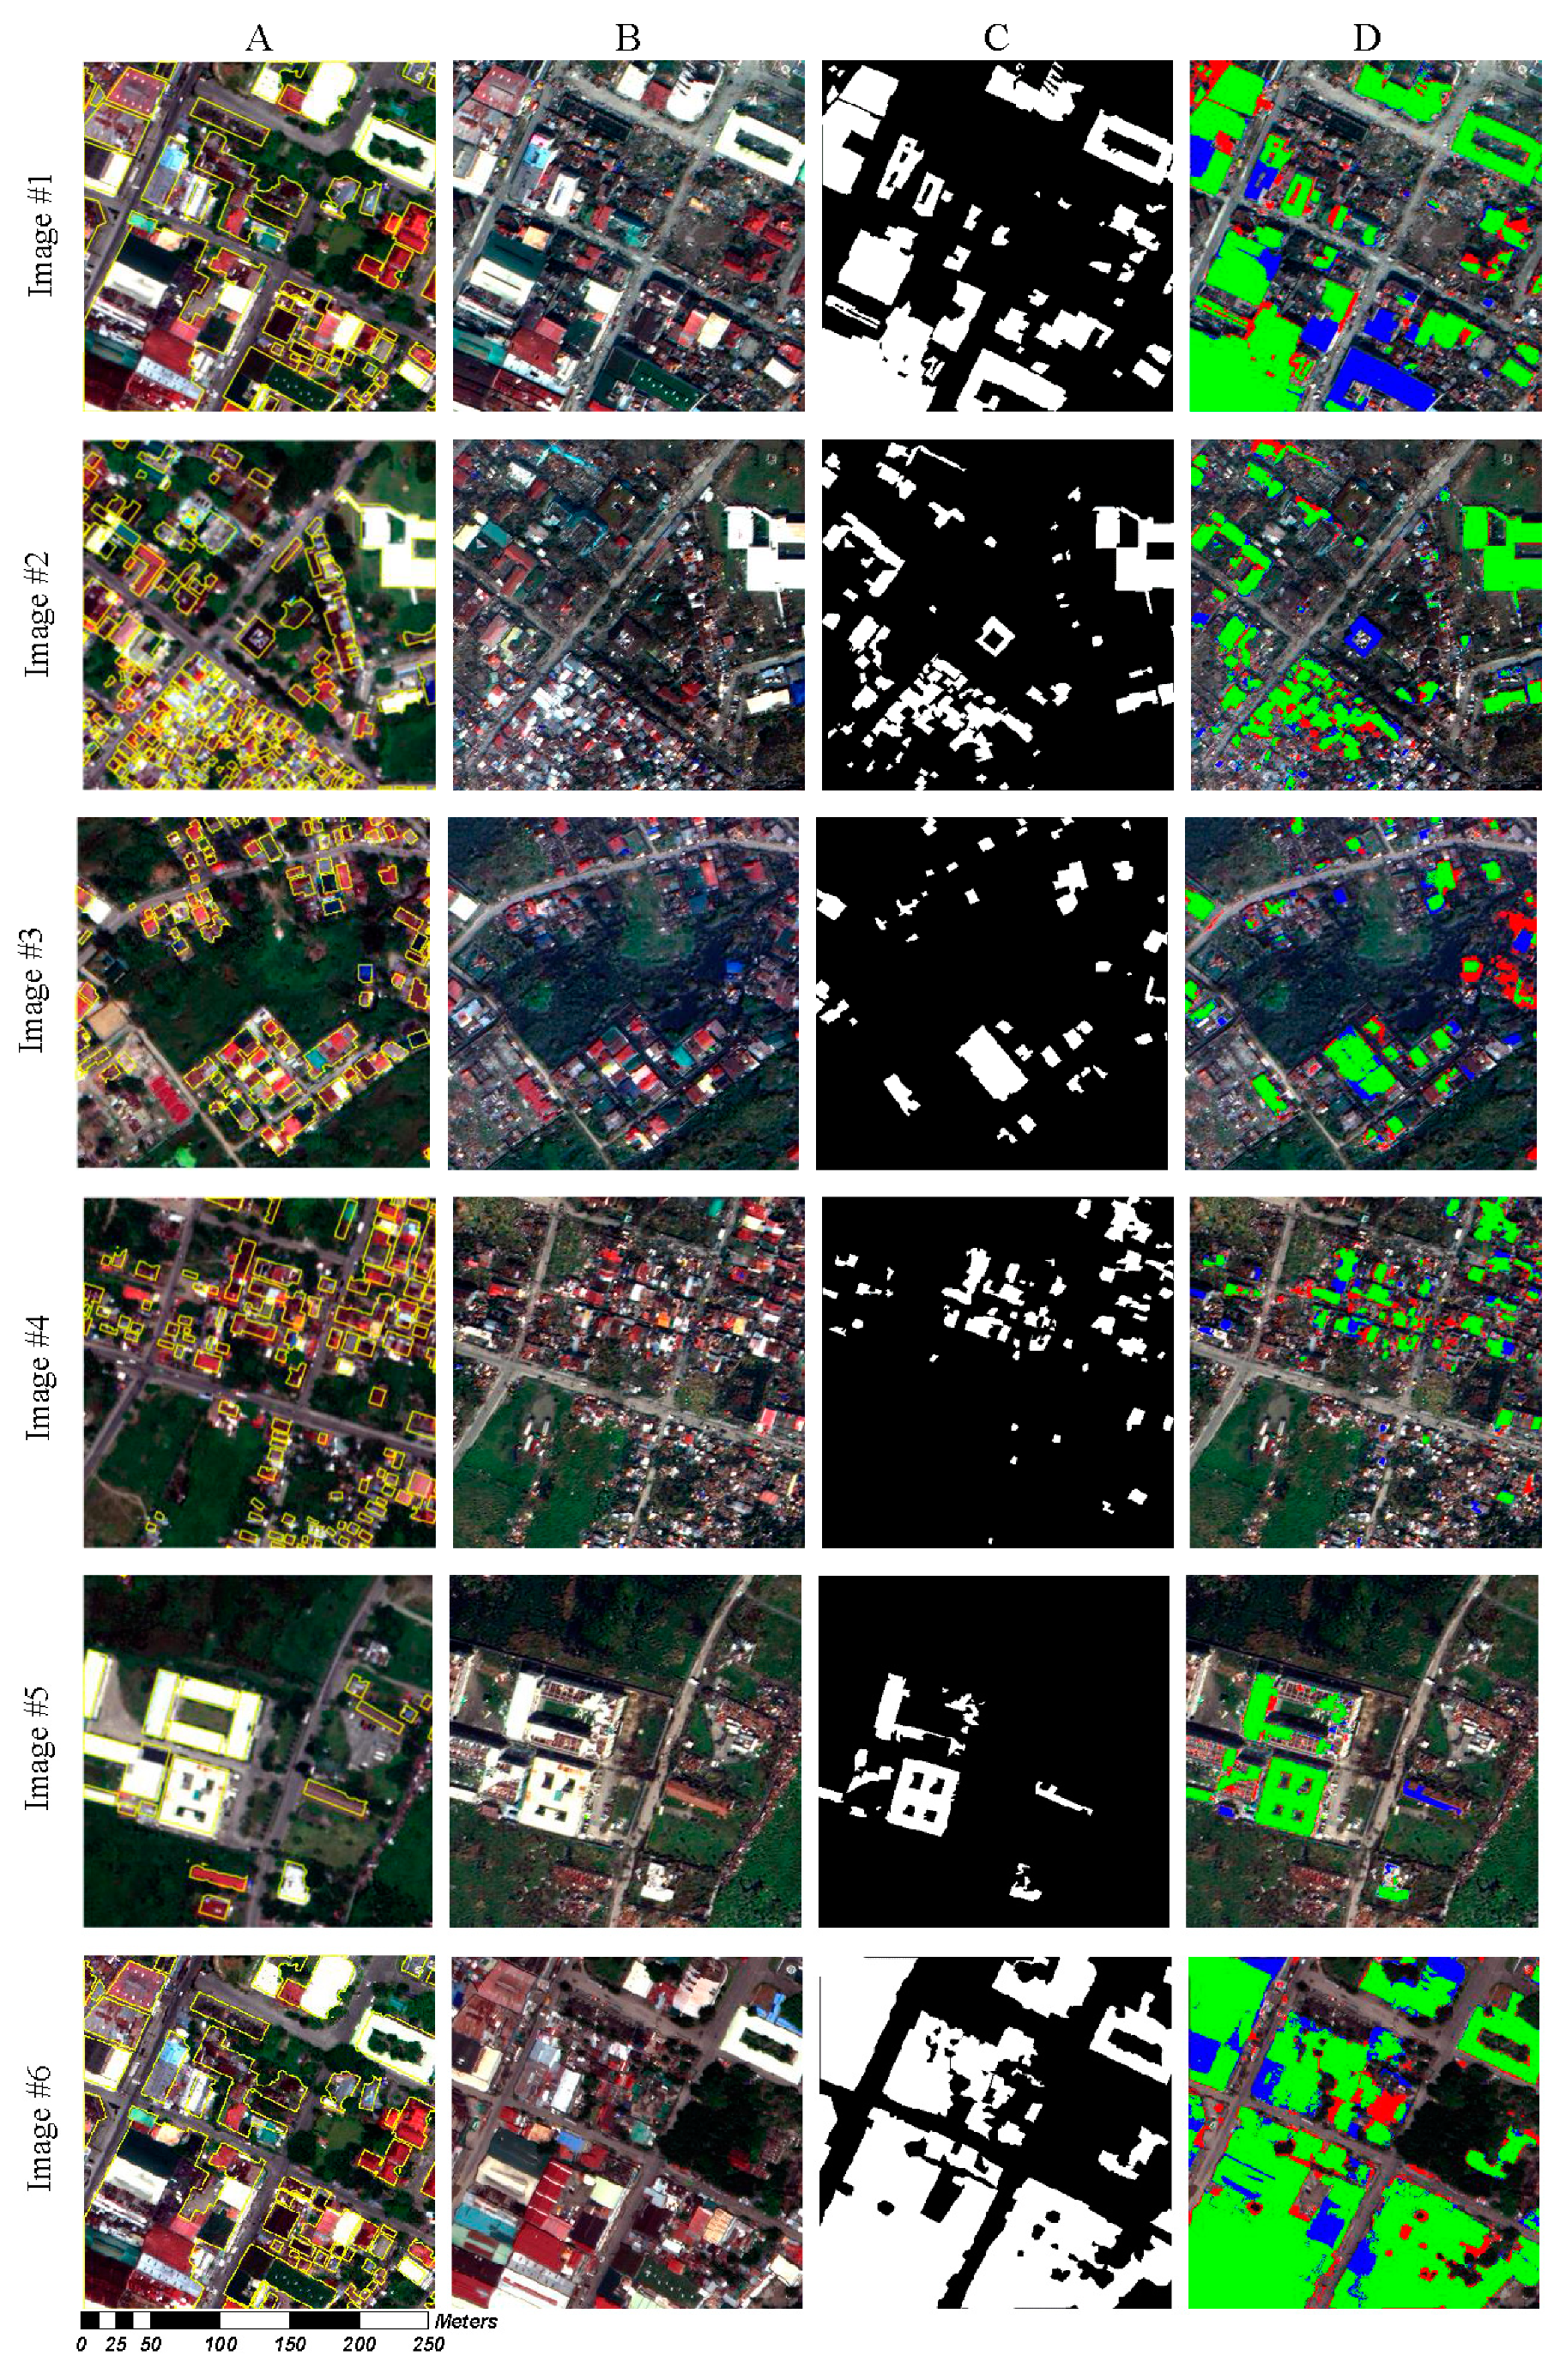
| Image | Targeted Post-Disaster Building Detection Scenarios |
|---|---|
| #1 | Buildings that survived the disaster |
| #2 | Partially destroyed slums and formal buildings |
| #3 | Buildings surrounded by flood water |
| #4 | Completely destroyed slums that produced an extensive amount of debris |
| #5 | Partially damaged factory buildings |
| #6 | Reconstructed and not-reconstructed (completely cleared/removed) buildings after 4 years |
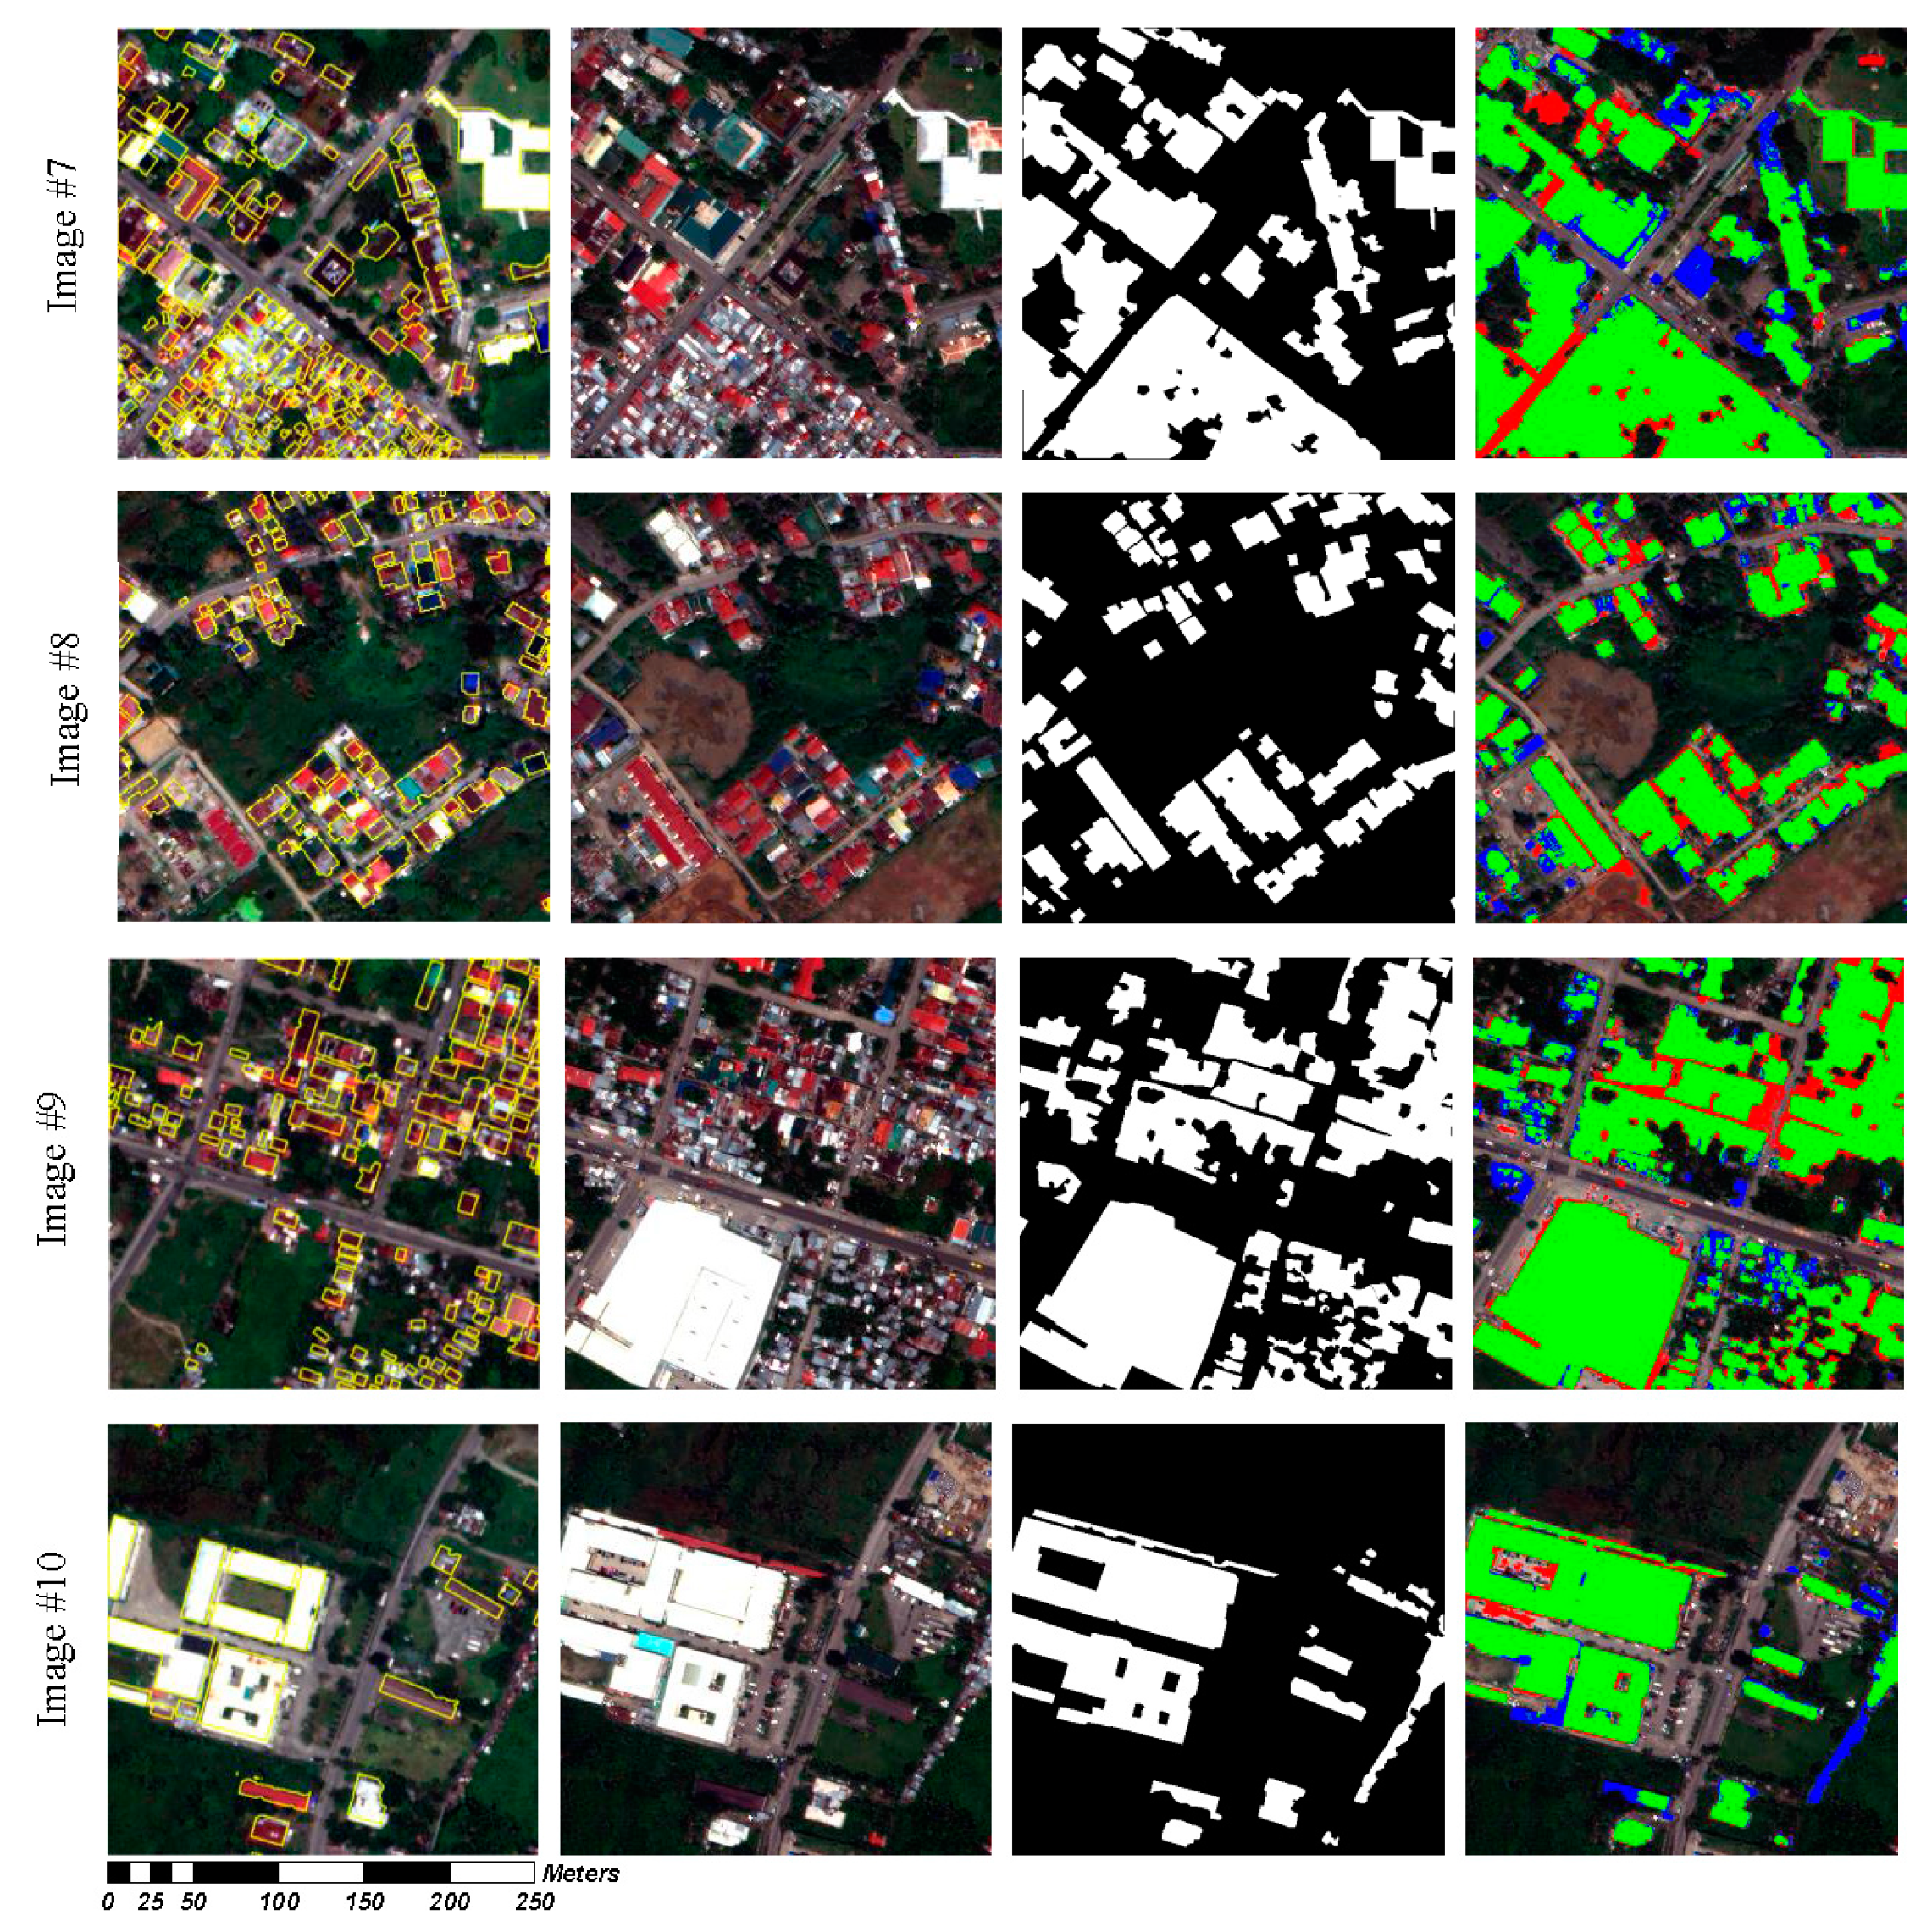
| #7 | Reconstruction of the buildings almost to the same amount, shape, and sizes |
| #8 | Construction of new buildings and changes in rooftop colors in the recovery phase |
| #9 | Clear expansion of the built-up area and construction of new buildings |
| #10 | Change in the size of the reconstructed factory building |
| Event Time Satellite Images | ||||
| Precision (%) | Recall (%) | F1 score (%) | IoU (%) | |
| #1 | 86.3 | 78.2 | 82.1 | 69.6 |
| #2 | 84.8 | 84.1 | 84.5 | 73.1 |
| #3 | 70.6 | 77.0 | 73.7 | 58.4 |
| #4 | 75.2 | 77.7 | 76.4 | 61.8 |
| #5 | 88.1 | 88.5 | 88.3 | 78.9 |
| Mean | 81.0 | 81.1 | 81.0 | 68.4 |
| Recovery Satellite Images | ||||
| Precision (%) | Recall (%) | F1 score (%) | IoU (%) | |
| #6 | 90.6 | 85.9 | 88.2 | 78.8 |
| #7 | 87.2 | 86.4 | 86.8 | 76.7 |
| #8 | 81.3 | 87.4 | 84.2 | 72.8 |
| #9 | 85.4 | 91.8 | 88.5 | 79.4 |
| #10 | 91.3 | 87.3 | 89.3 | 80.6 |
| Mean | 87.2 | 87.8 | 87.4 | 77.7 |
| Overall Accuracy | 84.1 | 84.4 | 84.2 | 73.1 |
| The Parameters | Values |
|---|---|
| ○ Edge Density Index (EDI): | |
| ○ Difference between EDIs for change detection | 0.03 |
| ○ Edge detection: Canny | |
| ○ Low threshold | 10 |
| ○ High threshold | 25 |
| ○ Variation-HOG (V-HOG): | |
| ○ Difference between the mean of V-HOGs for change detection | 0.008 |
| ○ HOG: | |
| ○ Cell size | 2 |
| ○ Block Size | 1 |
| ○ Number of bins | 9 |
| ○ Conditional Random Field (CRF): | |
| ○ | 35 |
| ○ | 8 |
| ○ | 5 |
© 2019 by the authors. Licensee MDPI, Basel, Switzerland. This article is an open access article distributed under the terms and conditions of the Creative Commons Attribution (CC BY) license (http://creativecommons.org/licenses/by/4.0/).
Share and Cite
Ghaffarian, S.; Kerle, N.; Pasolli, E.; Jokar Arsanjani, J. Post-Disaster Building Database Updating Using Automated Deep Learning: An Integration of Pre-Disaster OpenStreetMap and Multi-Temporal Satellite Data. Remote Sens. 2019, 11, 2427. https://doi.org/10.3390/rs11202427
Ghaffarian S, Kerle N, Pasolli E, Jokar Arsanjani J. Post-Disaster Building Database Updating Using Automated Deep Learning: An Integration of Pre-Disaster OpenStreetMap and Multi-Temporal Satellite Data. Remote Sensing. 2019; 11(20):2427. https://doi.org/10.3390/rs11202427
Chicago/Turabian StyleGhaffarian, Saman, Norman Kerle, Edoardo Pasolli, and Jamal Jokar Arsanjani. 2019. "Post-Disaster Building Database Updating Using Automated Deep Learning: An Integration of Pre-Disaster OpenStreetMap and Multi-Temporal Satellite Data" Remote Sensing 11, no. 20: 2427. https://doi.org/10.3390/rs11202427