A posteriori GPR Evaluation of Tree Stability: A Case Study in Rome (Italy)


1
Archaeology and Classics Program, American University of Rome, Via Pietro Roselli 4, 00153 Rome, Italy
2
CREA-Research Centre for Forestry and Wood, via Valle della Quistione 27, 00166 Rome, Italy
*
Author to whom correspondence should be addressed.
Remote Sens. 2019, 11(11), 1301; https://doi.org/10.3390/rs11111301
Submission received: 26 April 2019
/
Revised: 28 May 2019
/
Accepted: 29 May 2019
/
Published: 31 May 2019
(This article belongs to the Special Issue Recent Progress in Ground Penetrating Radar Remote Sensing)
Abstract
:Following the frequent and harmful collapses of trees that have plagued the municipal territory of Rome in recent years, a protocol of understanding was initiated between the Department of Environmental Protection of ROMA CAPITALE, the American University of Rome, the Research Centre for Forestry and Wood of the– Council for Agricultural Research and Economics (CREA)–, and Sensors and Software, Inc. This protocol aims to start an experimental project by conducting a series of non-destructive geophysical measurements using ground-penetrating radar (GPR) technology and assessing the effectiveness of this methodology to investigate the root system and tree trunks located along paved roads in two sample areas of the city. The test will use the GPR technique to confirm some hypothetical assumptions about tree stability based on a posteriori evaluations made by the Department of Environmental Protection of ROMA CAPITALE. All phases of this test showed the effectiveness of the method and the rapidity of the data acquisition.
1. Introduction
In numerous urban areas, trees are normally developed in cleared regions along avenues in disengagement from other green spaces, for example, parks and riparian passages [1]. Along streets, trees and different plants face significant challenges, as cleared surfaces (blacktop) lead to hot conditions with the absence of evaporative cooling, which brings about high-subsurface temperatures [2]. Subsequently, many difficulties faced by urban trees start due to the development procedures. Consequently, toward the start of street development, topsoil is commonly evacuated, following which, the subsoil is compacted and layers of pound and run stone are included before finally spreading and compacting blacktop or cement [3,4].
In accordance with the above, trees planted on close and cleared surfaces regularly endure root harm and soil volume limitations. The horizontal development of shallow tree attachments makes the asphalts break and hurl, resulting in “lips” or “stubbed-toe spots” due to the uneven dislodging of the abutting segments of cement [5,6,7,8,9,10,11]. Additionally, this “root-versus-asphalt” struggle stands out amongst the most inescapable issues in urban greening. The evacuation and substitution of trees and the fixing of cleared surfaces can be strenuous for already-constrained metropolitan assets. Moreover, city governments might be obligated to take action for the common or reformatory claims where wounds or deaths have occurred due to the presence of asphalt dangers [12].
To be specific, due to the thick soil and asphalt, roots alter courses, quit developing, or adjust by residuals strangely near the surface. Consequently, harm mainly occurs on roads with meager blacktop layers, particularly in the upper part of the asphalt structure. As a result, examinations of the developmental attributes have demonstrated that tree roots majorly infiltrate the street structure between the rock sub- and blacktop layers, as these layers do not permit entrance to the tree roots because of high compaction and entrance opposition [13,14]. In addition, attachments appear to be pulled in due to the consolidated water gathering on the underside of the blacktop layer. This shallow establishment makes urban trees increasingly defenseless against the dry season, thereby causing uncertainty and asphalt hurling. Nonetheless, if thick soil is waterlogged, tree roots can get spoiled due to the absence of oxygen [15,16].
To preserve tree stability, it is crucial to evaluate root systems and trunk defects without compromising their environment with destructive and laborious methods. Therefore, the ground penetrating radar (GPR) technology used in urban forestry studies is key to active remote sensing technology based on the use of electromagnetic waves, providing unique and non-invasive resources to assess the strength of trees in an urban context [17,18,19]. Furthermore, trees along paved roads in cities often increase asphalt elevation and trunk collapses. Thus, evaluating tree root systems in a non-destructive way, without compromising the environment, is important for protecting plant resources [20]. Consequently, buried roots, root size, and internal defects of trunks can be detected well in urban areas of various types of soft and hard soil stratigraphy, such as asphalt concrete or partially water-permeable soil [21,22,23,24,25]. The application of GPR in the evaluation of tree trunks primarily helps in detecting the presence of defects inside the trunk. An example of such internal defects is wood decay, a biological process in which cellulose and lignin (two organic compounds) are converted to carbon dioxide, water, and energy. Although a natural process of nutrient circulation, corruption of wood can reduce the strength of wood and pose a threat to people and properties in surrounding urban environments [26,27].
This technical note is a short study that provides a brief description of a specific procedure, which has practical value and contributes to the diagnosis or management of a urgent need to monitor urban tree stability within the city of Rome. Furthermore, it is a convention among different entities in Rome (the Department of Environmental Protection of ROMA CAPITALE, the American University of Rome, the CREA–Italian Council for Agricultural Research and Economics–Research Centre for Forestry and Wood, and Sensors and Software, Inc.) to start an experimental project by conducting a series of non-destructive geophysical measurements using GPR equipment. In this study, the GPR technique was used to assess the stability of two different types of trees—an ash (Fraxinus angustifolia) and domestic pine (Pinus Pinea)—in three different areas. It is worth noticing how experts at the Department of Environmental Protection of ROMA CAPITALE have already hypothetically assessed the presence of some defects in the subsurface root architecture (such as the inclination of some trees) due to the presence of some works related to modern subservices. Hence, the aim of this test was to confirm this assessment with a posteriori GPR evaluation of the thicker roots (0.1 m approximately), normally perpendicular to the GPR direction.
2. Materials and Methods
The GPR technique uses radio waves to create an electromagnetic (em) image of features buried in the ground. A GPR transmitting antenna emits a short electromagnetic impulse (typically a 1–10 ns wavelet) that can be scattered by an em discontinuity in the ground and gathered by the receiving antenna [19,28]. Additionally, GPR measures a time range (two-way travel time, TWT) between the antennas, an em discontinuity, and the signal amplitude and phase that result in an em image [29].
There are different ways to acquire the GPR data. In the reflection mode (the one used in this paper), antennas are in a fixed configuration (constant separation) and moved over the ground, providing a section that shows TWT time to the GPR reflectors on the vertical axis versus the antennas’ position along the horizontal axis; in this representation, each trace corresponds to a specific antennas’ position on the surface [28,29,30,31].
Various factors affect the radio wave signal propagating in a layer, such as the energy loss in correspondence with each boundary between two strata due to the reflection process, the scattering phenomena, and the attenuation and dispersion caused by the electromagnetic properties of the medium in which the radio waves propagate [28,29,30,31].
The survey modality, i.e., the spatial distribution of the acquired data, defines the possibility to obtain a 2D or a pseudo-3D image of the subsurface targets. A 2D GPR section is acquired if a single profile is conducted along a specific direction, with the TWT time plotted on the y-axis and the position of the antennas shown on the x-axis. On the other hand, if an area is investigated after acquiring a series of parallel profiles (frequently called a grid survey), the data can be interpolated to create plan-view maps of the subsurface at different time depths (or time slices). Alternatively, the interpolated data can be represented in a pseudo-3D mode using a commercial 3D rendering software [19,28,29,31].
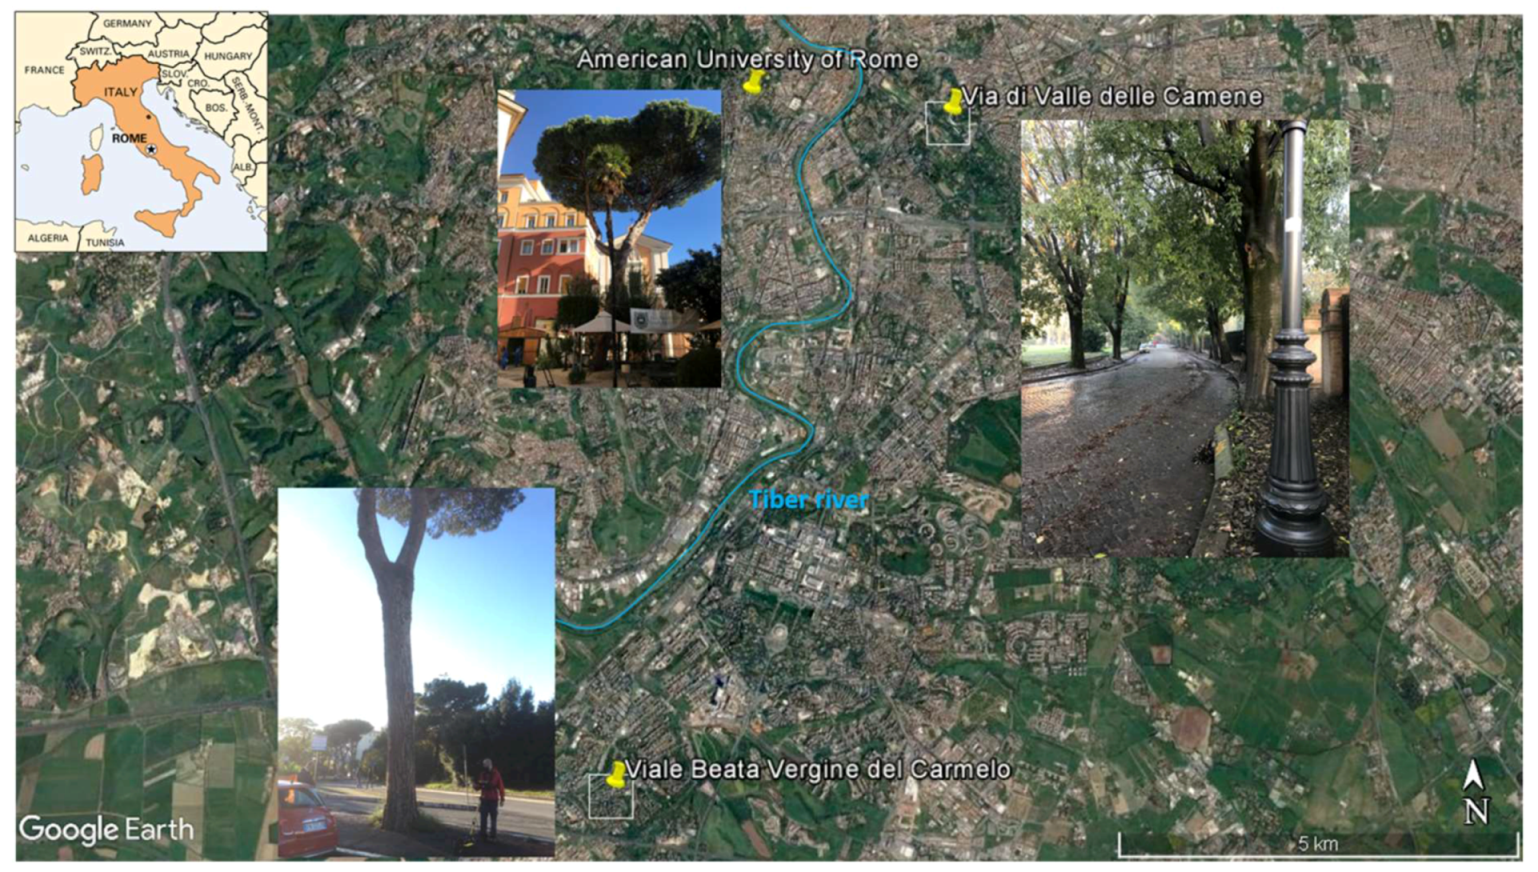
In Rome, the three sample areas chosen within this project were: (1) Via di Valle delle Camene, (2) Piazza Beata Vergine del Carmelo, and (3) the garden of the American University of Rome (AUR) (Figure 1). The GPR system used was bistatic, which was equipped with 500 MHz (the FINDAR) and 1 GHz antennas (the NOGGIN). During these investigations, a total of 650 m2 was covered.
For the NOGGIN system, a time window of 22 ns was used during all the data acquisitions, and a 1-cm step-size and a trace stacking of 4 was used in all profiles. The collected data were generally of good quality and did not require any particular processing; additionally, only some gain functions were used to increase the signal (i.e., dewow and SEC2 gain—Attenuation: 0.5; Start Gain: 1.50; Maximum Gain: 500). For the FINDAR system, the time window was 45 ns, the step-size was 2.5 cm, and a trace stacking of 4 was used in all profiles. Even here, the data were of good quality, and they required just the dewow and the automatic gain (Gain: 4). Migrated data were not used due to both the presence of multiple subservices at different depths and the clear stratigraphy. Finally, note that even if they were manufactured by the same company (Sensors and Software, Inc.), the two GPR systems used differed in hardware, software, and output format.
In all the surveyed areas, a test scan of the subsurface under investigation was initially acquired through a single radar profile or radargram. Consequently, owing to the possibility of having the results of this scan in real time on the screen of the instrument, it was possible to notice a series of important information for the geophysical investigation: (1) the signal velocity (between 0.08 and 0.10 m/ns) was calculated using the hyperbola calibration technique [28], and (2) the stratigraphy was relevant to the presence of natural and anthropogenic anomalies.
Subsequently, in the same areas, a series of one-directional (Y) grids of various sizes was acquired with parallel radar profiles interspaced at about 0.1 m. This further investigation allowed to produce a series of maps of the areas at different depths starting from the surface up to the maximum depth investigated. The maps were elaborated every 0.1 m of depth. Note that the NOGGIN system was involved in every measurement while the FINDAR system was used in some to double-check possible deeper anomalies due to the presence of modern subservices.
3. Results and Discussion
3.1. Area 1: via di Valle Delle Camene
Along this road, there were ash trees planted on the sidewalks. The Department of Environmental Protection of ROMA CAPITALE noticed some inclinations of these trees toward the road, and it was hypothesized that the recent subservices works compromised the tree stability. Thus, a first acquisition was collected with the NOGGIN system in an area of 8 × 70 m with a distance of 0.13 m between the profiles.
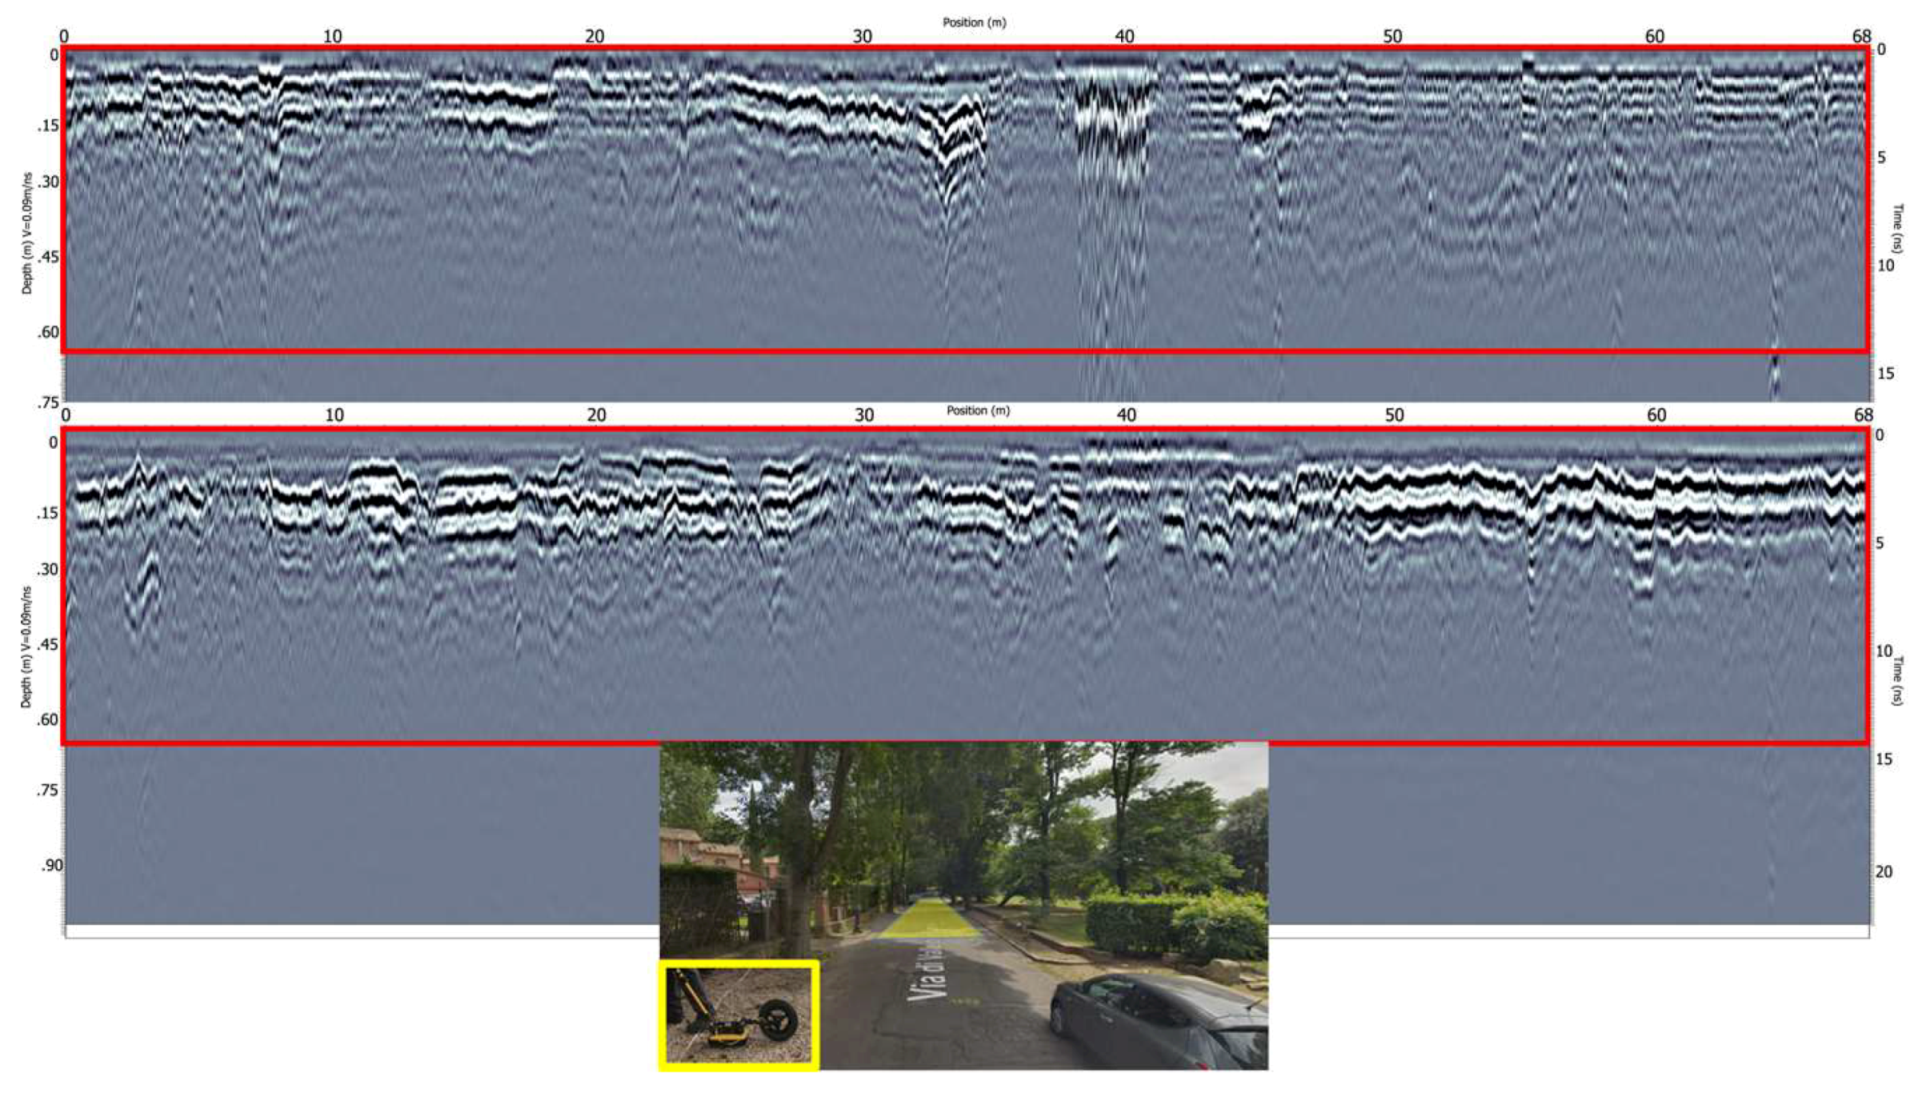
Note that, generally, tree roots are concentrated close to the trunk base and they are included into the canopy projection on the ground, although, in some situations, they reach a greater extension [18,32]. According to an initial analysis of the radargrams (Figure 2), it is possible to see how much, for the entire width of the road, the works related to modern subservices at various depths (between 0.1 m and 0.6 m, approximately) have intruded upon the likely area of the roots. These works are oriented parallel to the GPR direction of acquisition, and, in the radargrams, they look mostly like elongated reflectors.
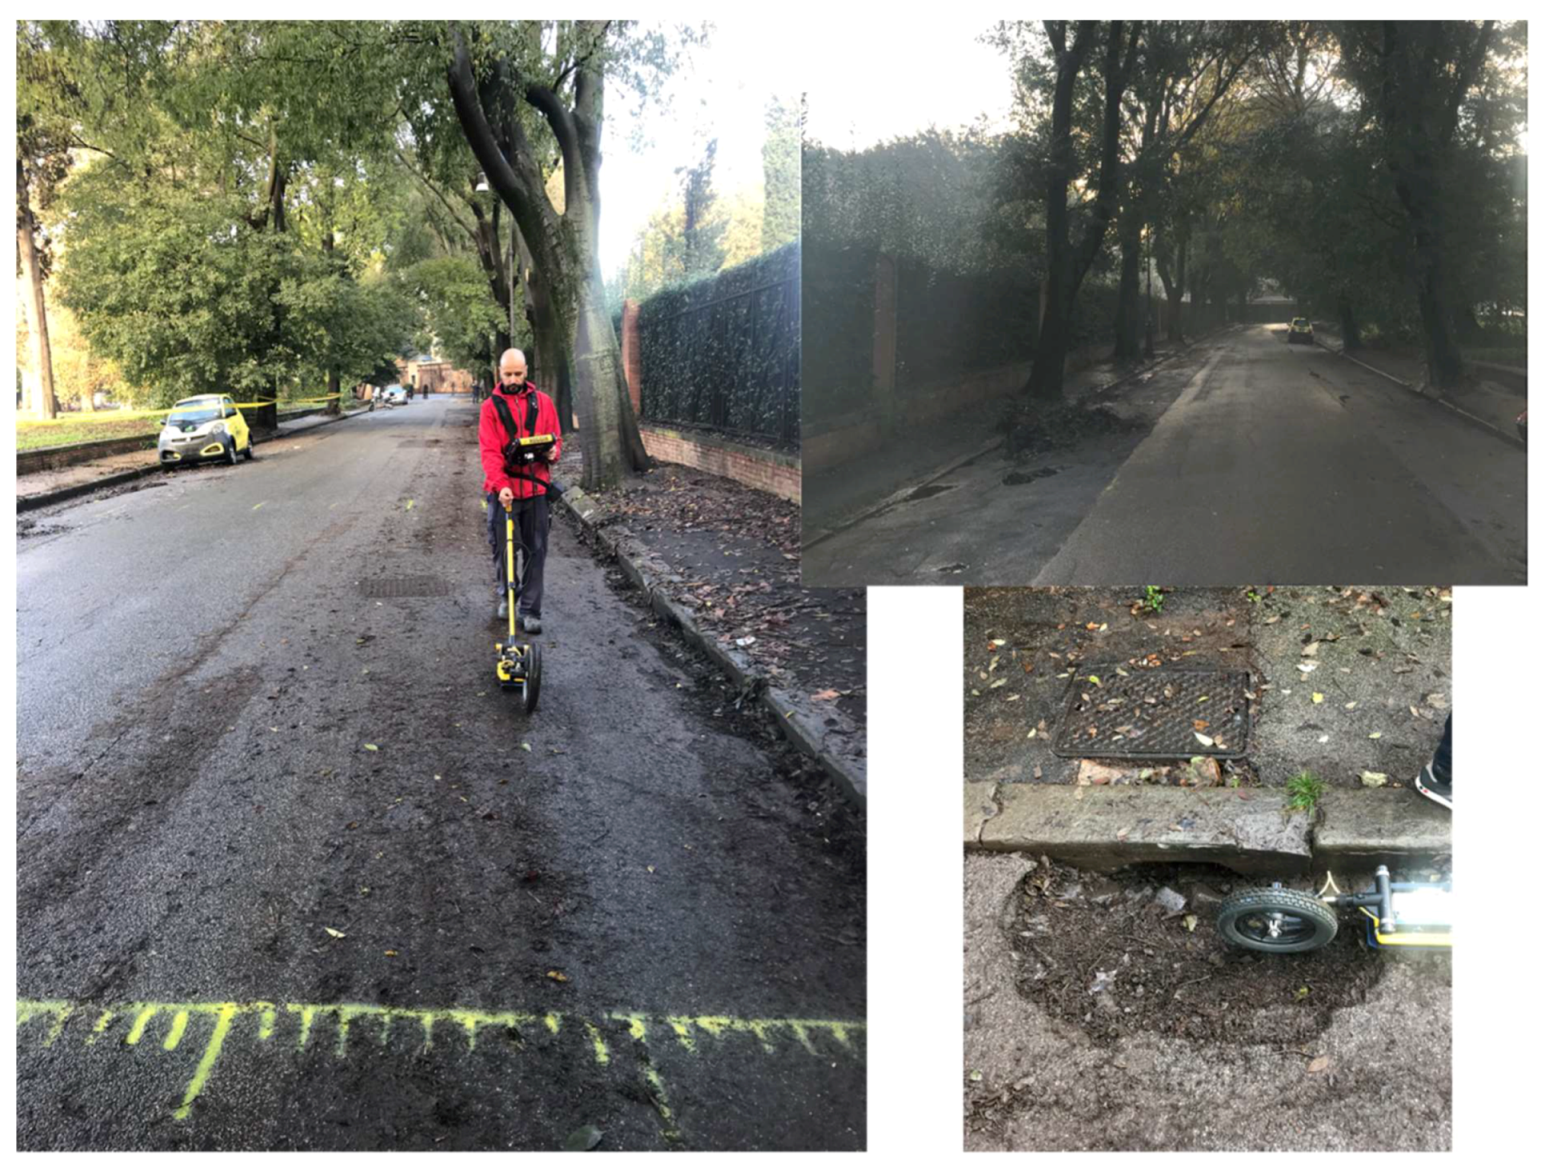
Furthermore, these works can be noted because of the different types of asphalt used to cover the road, especially through the presence of several manholes for telecommunications, electricity, and water (Figure 3).
In the depth slices of the area investigated by the GPR at different depths (from about 0.07 m to 0.40 m), it is possible to see the subservices that probably cut the roots in depth (Figure 4). These works were a continuation of the following, which were identified in the adjacent area along the same road.
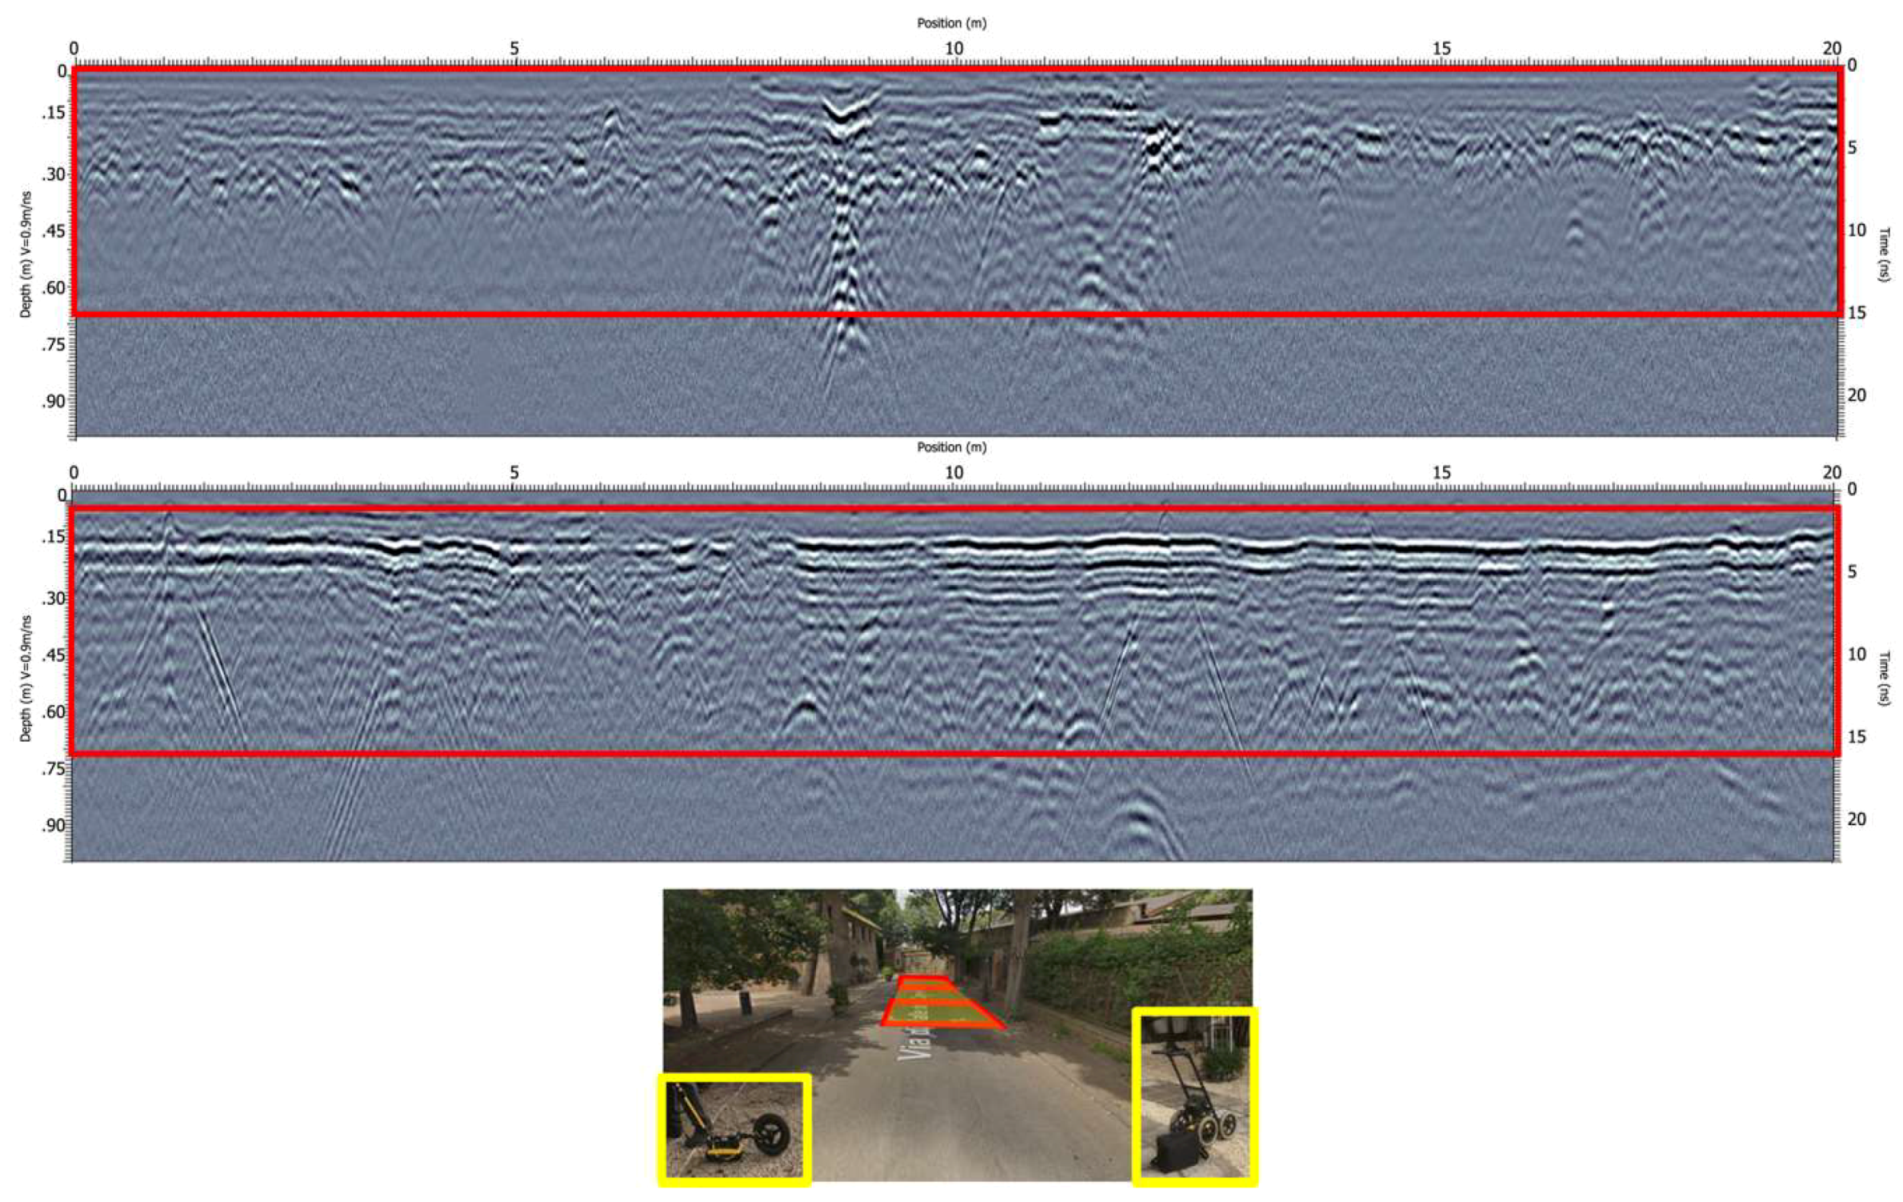
Thereafter, in this adjacent area along the same route, we proceeded to acquire data with both the NOGGIN and FINDAR systems, acquiring 50 parallel profiles equally spaced every 0.1 m in an area of about 5 × 20 m with the first system and 50 parallel profiles equally spaced every 0.1 m in two almost contiguous areas of about 5 × 5 m with the second system. According to an initial analysis of the NOGGIN radargrams (Figure 5), it is possible to see how much, for the entire width of the road, the works related to modern subservices at various depths (between 0.1 m and 0.7 m, approximately) have intruded upon the likely area of the roots. Even here, these works look mostly like elongated reflectors due their orientation parallel to the GPR direction of acquisition.
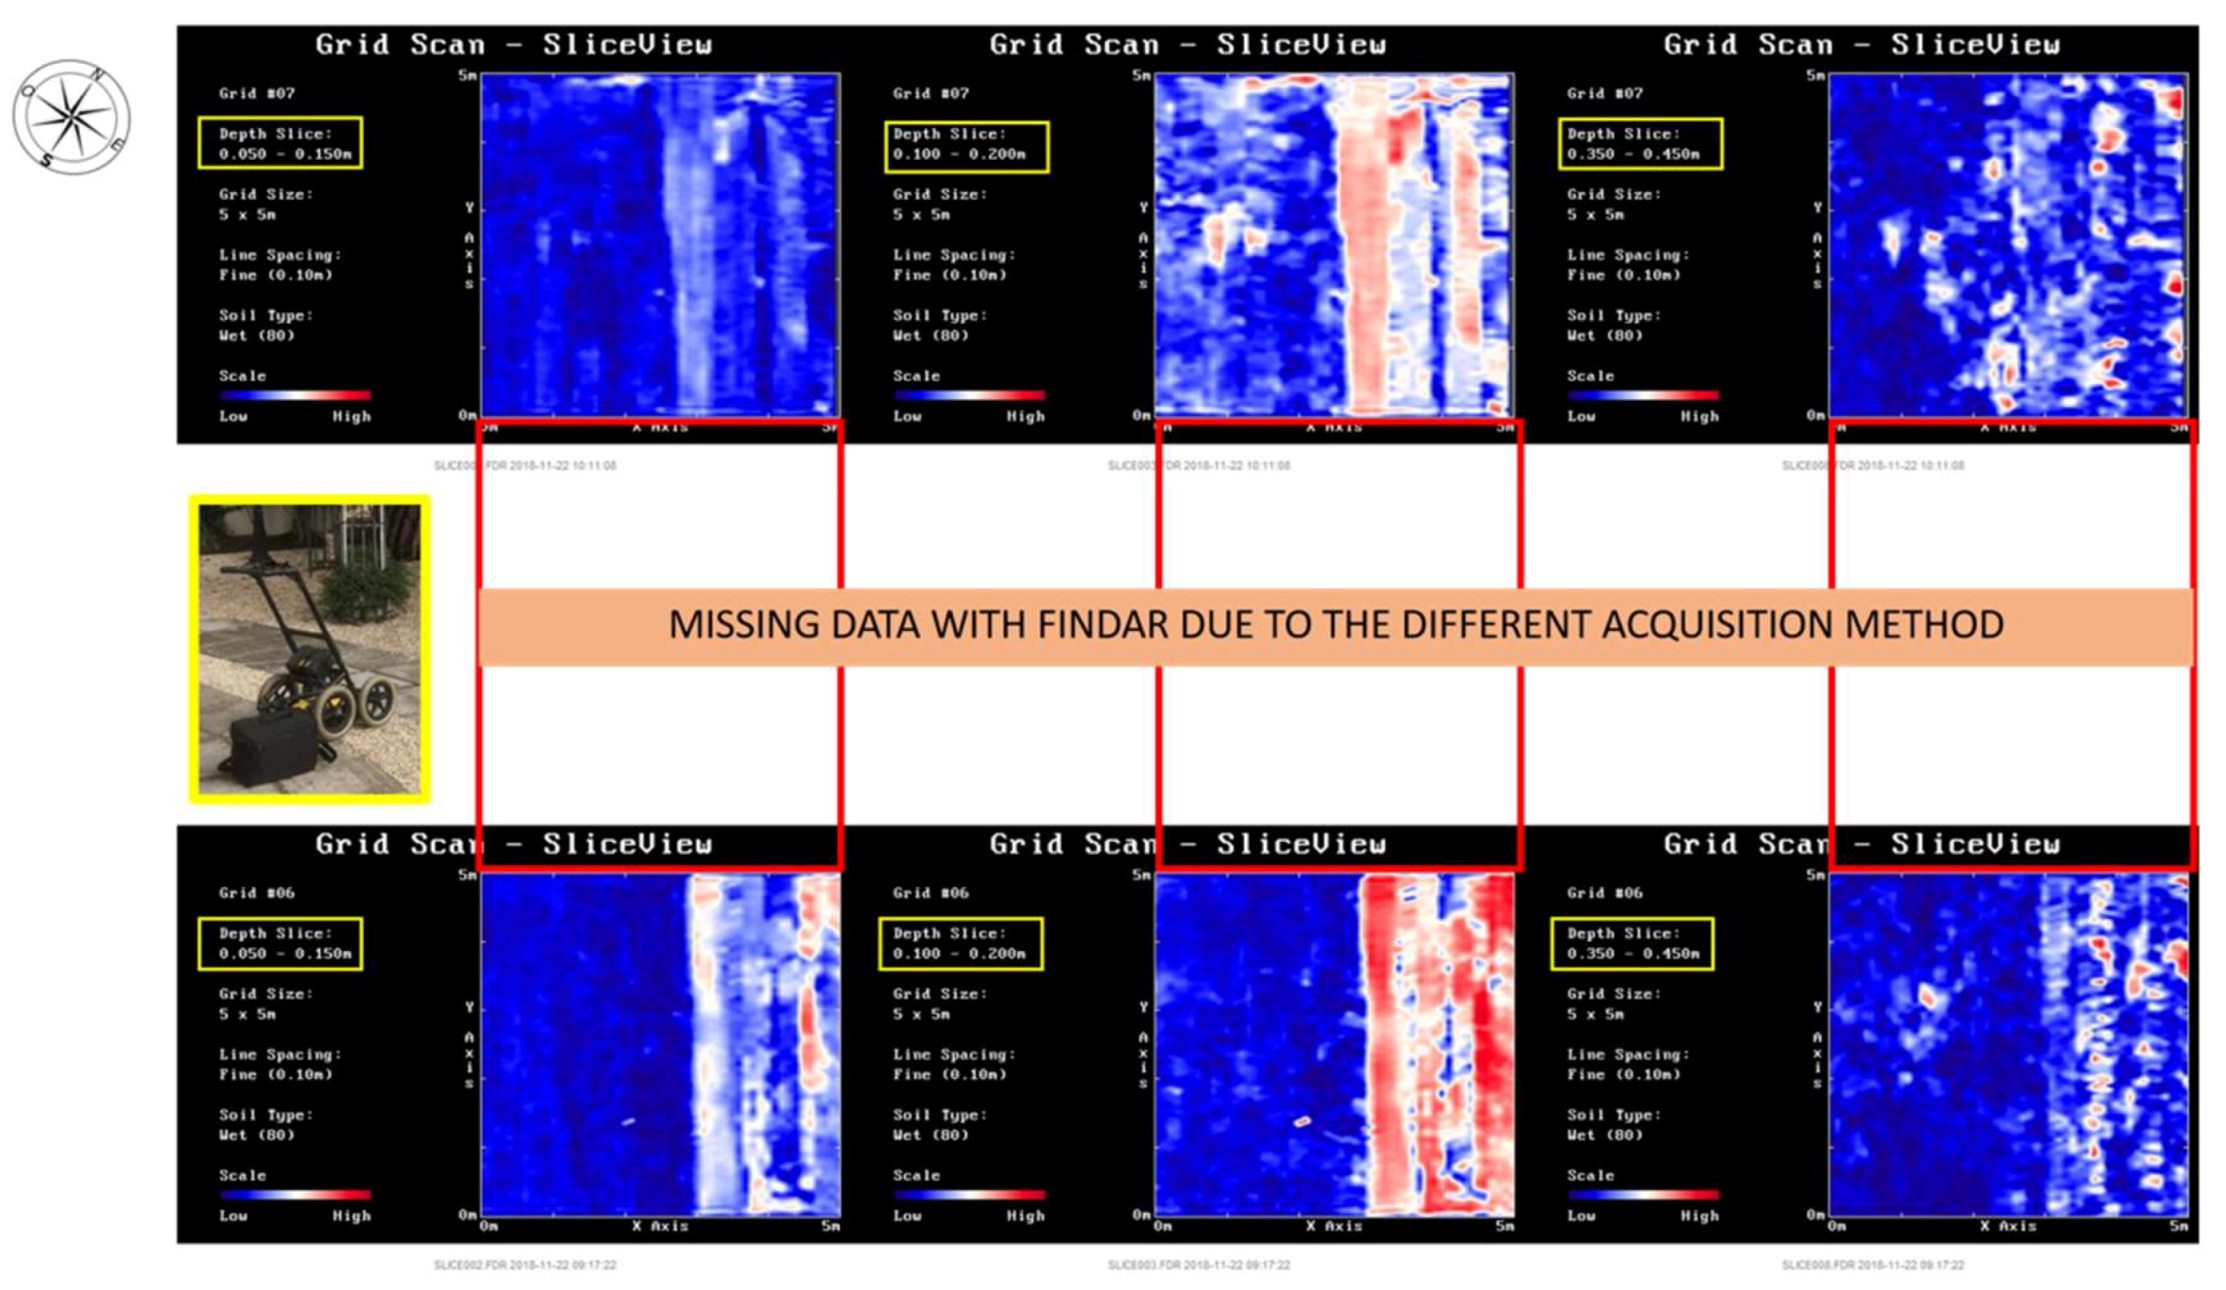
Furthermore, the points noticed in the data acquired by the NOGGIN system can be deduced from the data acquired by the FINDAR system. In Figure 6, the detail of the first meter (better defined in the NOGGIN) has a lower resolution, but it is always possible to identify a series of anomalies not related as much to the roots as the subservices. Moreover, unlike the NOGGIN, two 5 × 5 m areas were acquired almost contiguously and the central part (visible in the NOGGIN acquisition) was missing.
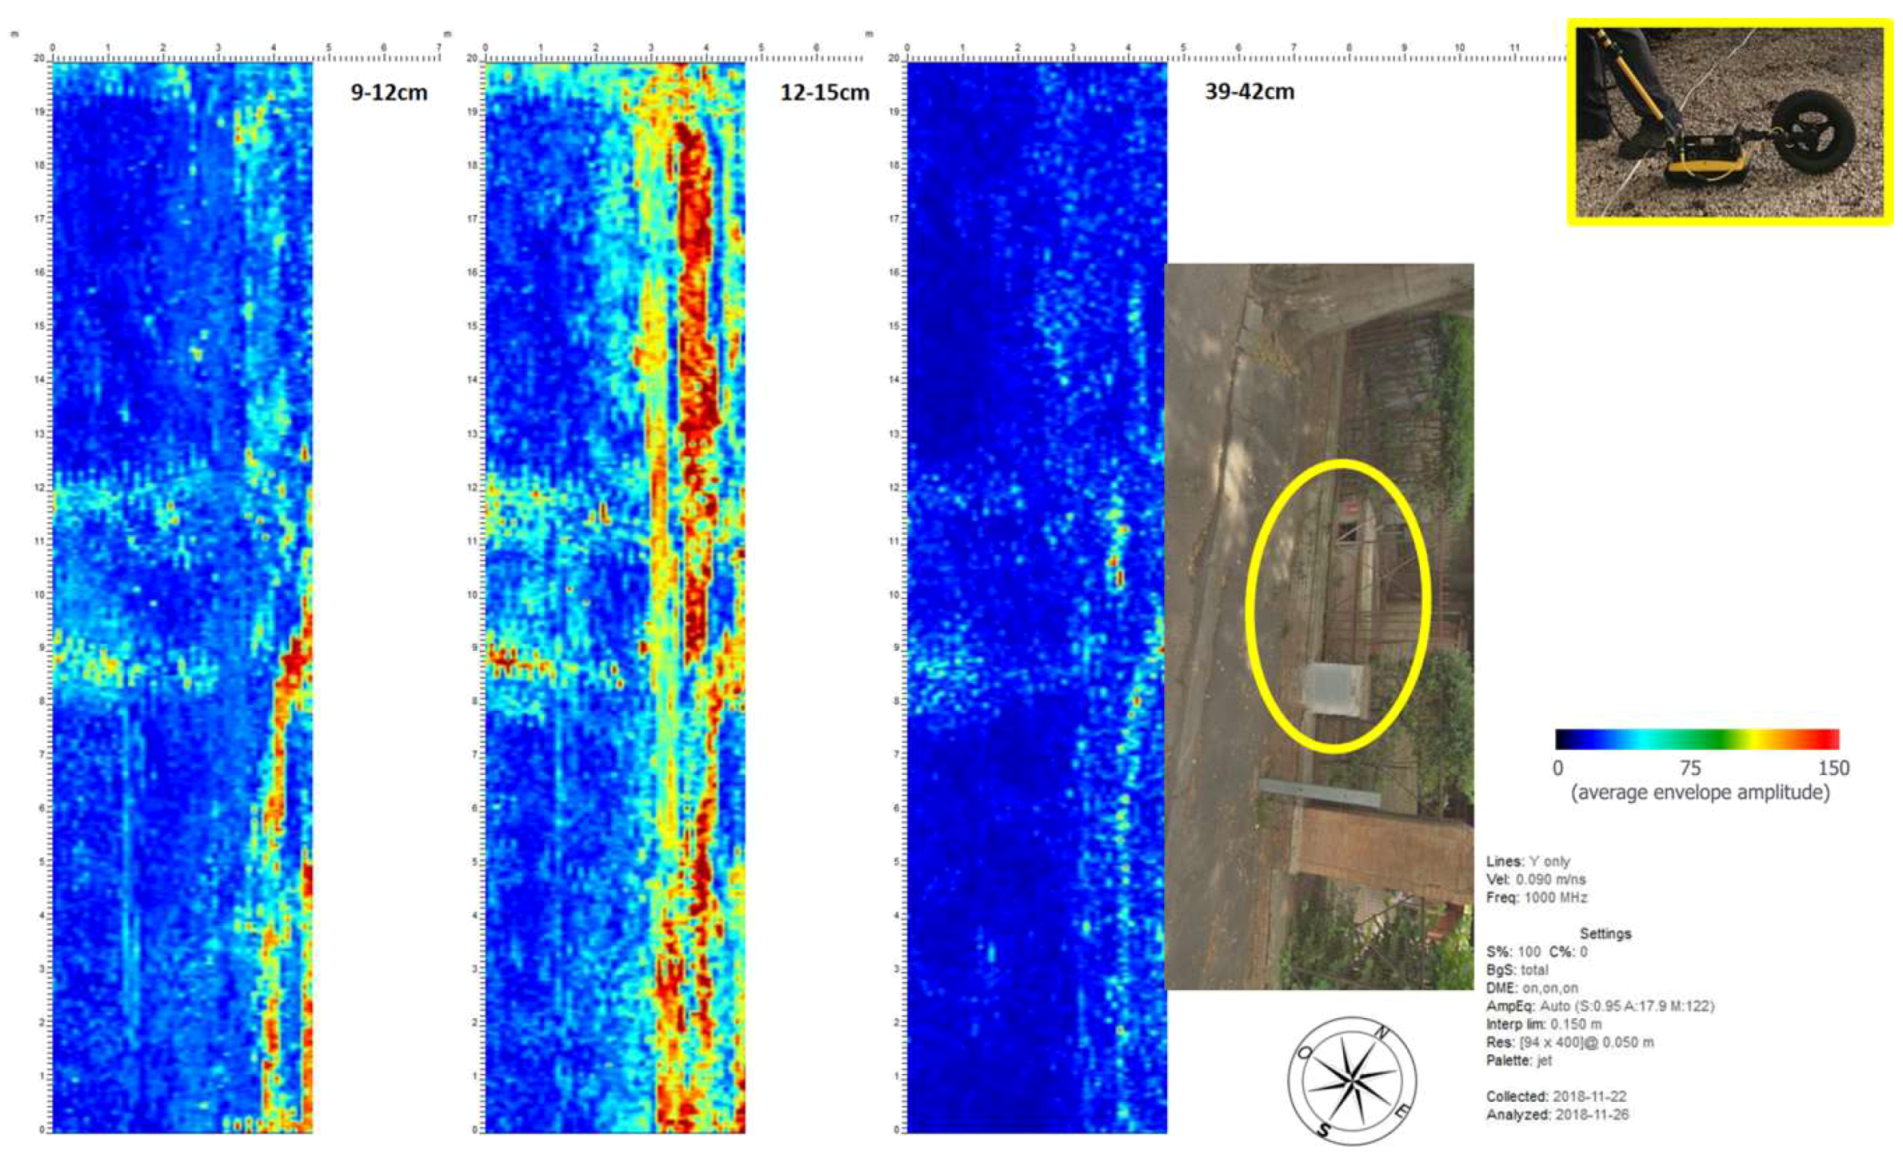
In the depth slices of the area investigated by the NOGGIN (from about 0.09 m to 0.45 m), it is possible to further notice the subservices that were probably cutting the roots in depth (Figure 7). These works were a continuation of the aforementioned. In the depth slices of the area investigated by the FINDAR at the same depths reported above, it is possible to notice the same anomalies due to the subservices (Figure 8).
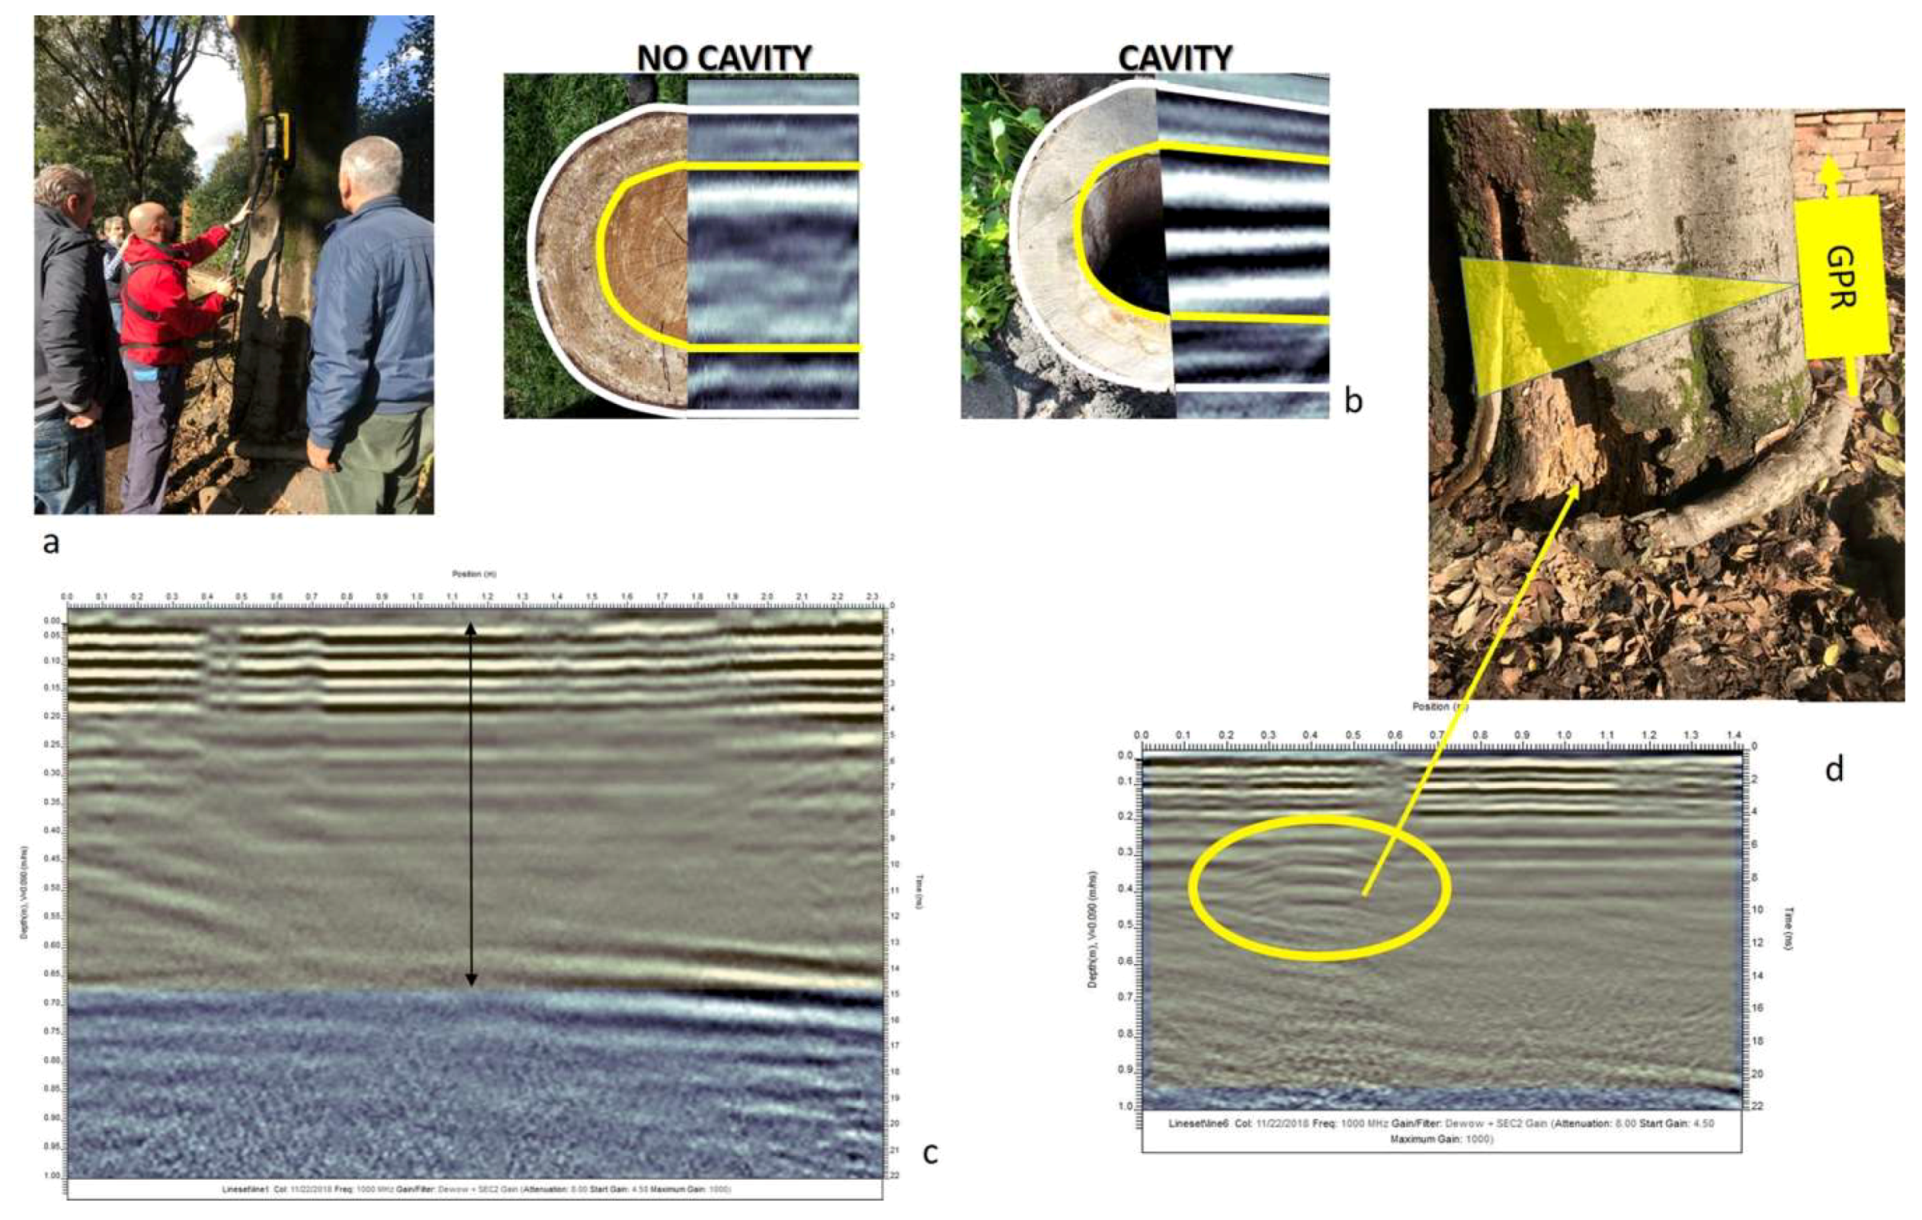
Finally, consistently along the same road, six vertical profiles with the NOGGIN system were collected on four trees that were visibly damaged at the base (Figure 9a). In addition, the NOGGIN system was used to investigate the presence or absence of cavities or the discontinuities inside the trunk that could preclude stability.
As mentioned above in the introduction, an air-filled tree trunk (with a decayed hole) or a partially air-filled early-stage decay zone inside a tree are excellent reflectors for GPR detection. Furthermore, different qualitative and quantitative methods have been used to interpret internal anomalies (see References [33,34,35,36], and literature therein). The main principle to understand the presence or absence of a cavity inside the trunk is knowing how to interpret the inhomogeneity of the radargram [33] (Figure 9b). On this technical note, the qualitative method to determine the presence or absence of an abnormality will be evaluated.
Consequently, the investigation showed good homogeneity on the inside of the trunk with no cavities and clearly visible thickness (about 0.7 m) (Figure 9c). In Figure 9d, the trunk thickness was 0.9 m, and it is possible to notice an anomaly related to a cavity inside the trunk. This happened because the GPR acquired very close to the cavity at the base of the tree was visible from the outside, and its conical radiation pattern intercepted it.
3.2. Area 2: Piazza Beata Vergine Del Carmelo
The second area was a square a few kilometers away from the previous one. Here, the NOGGIN system acquired 70 parallel profiles equally spaced every 0.1 m in an area of about 7 × 3 m around a pine tree.
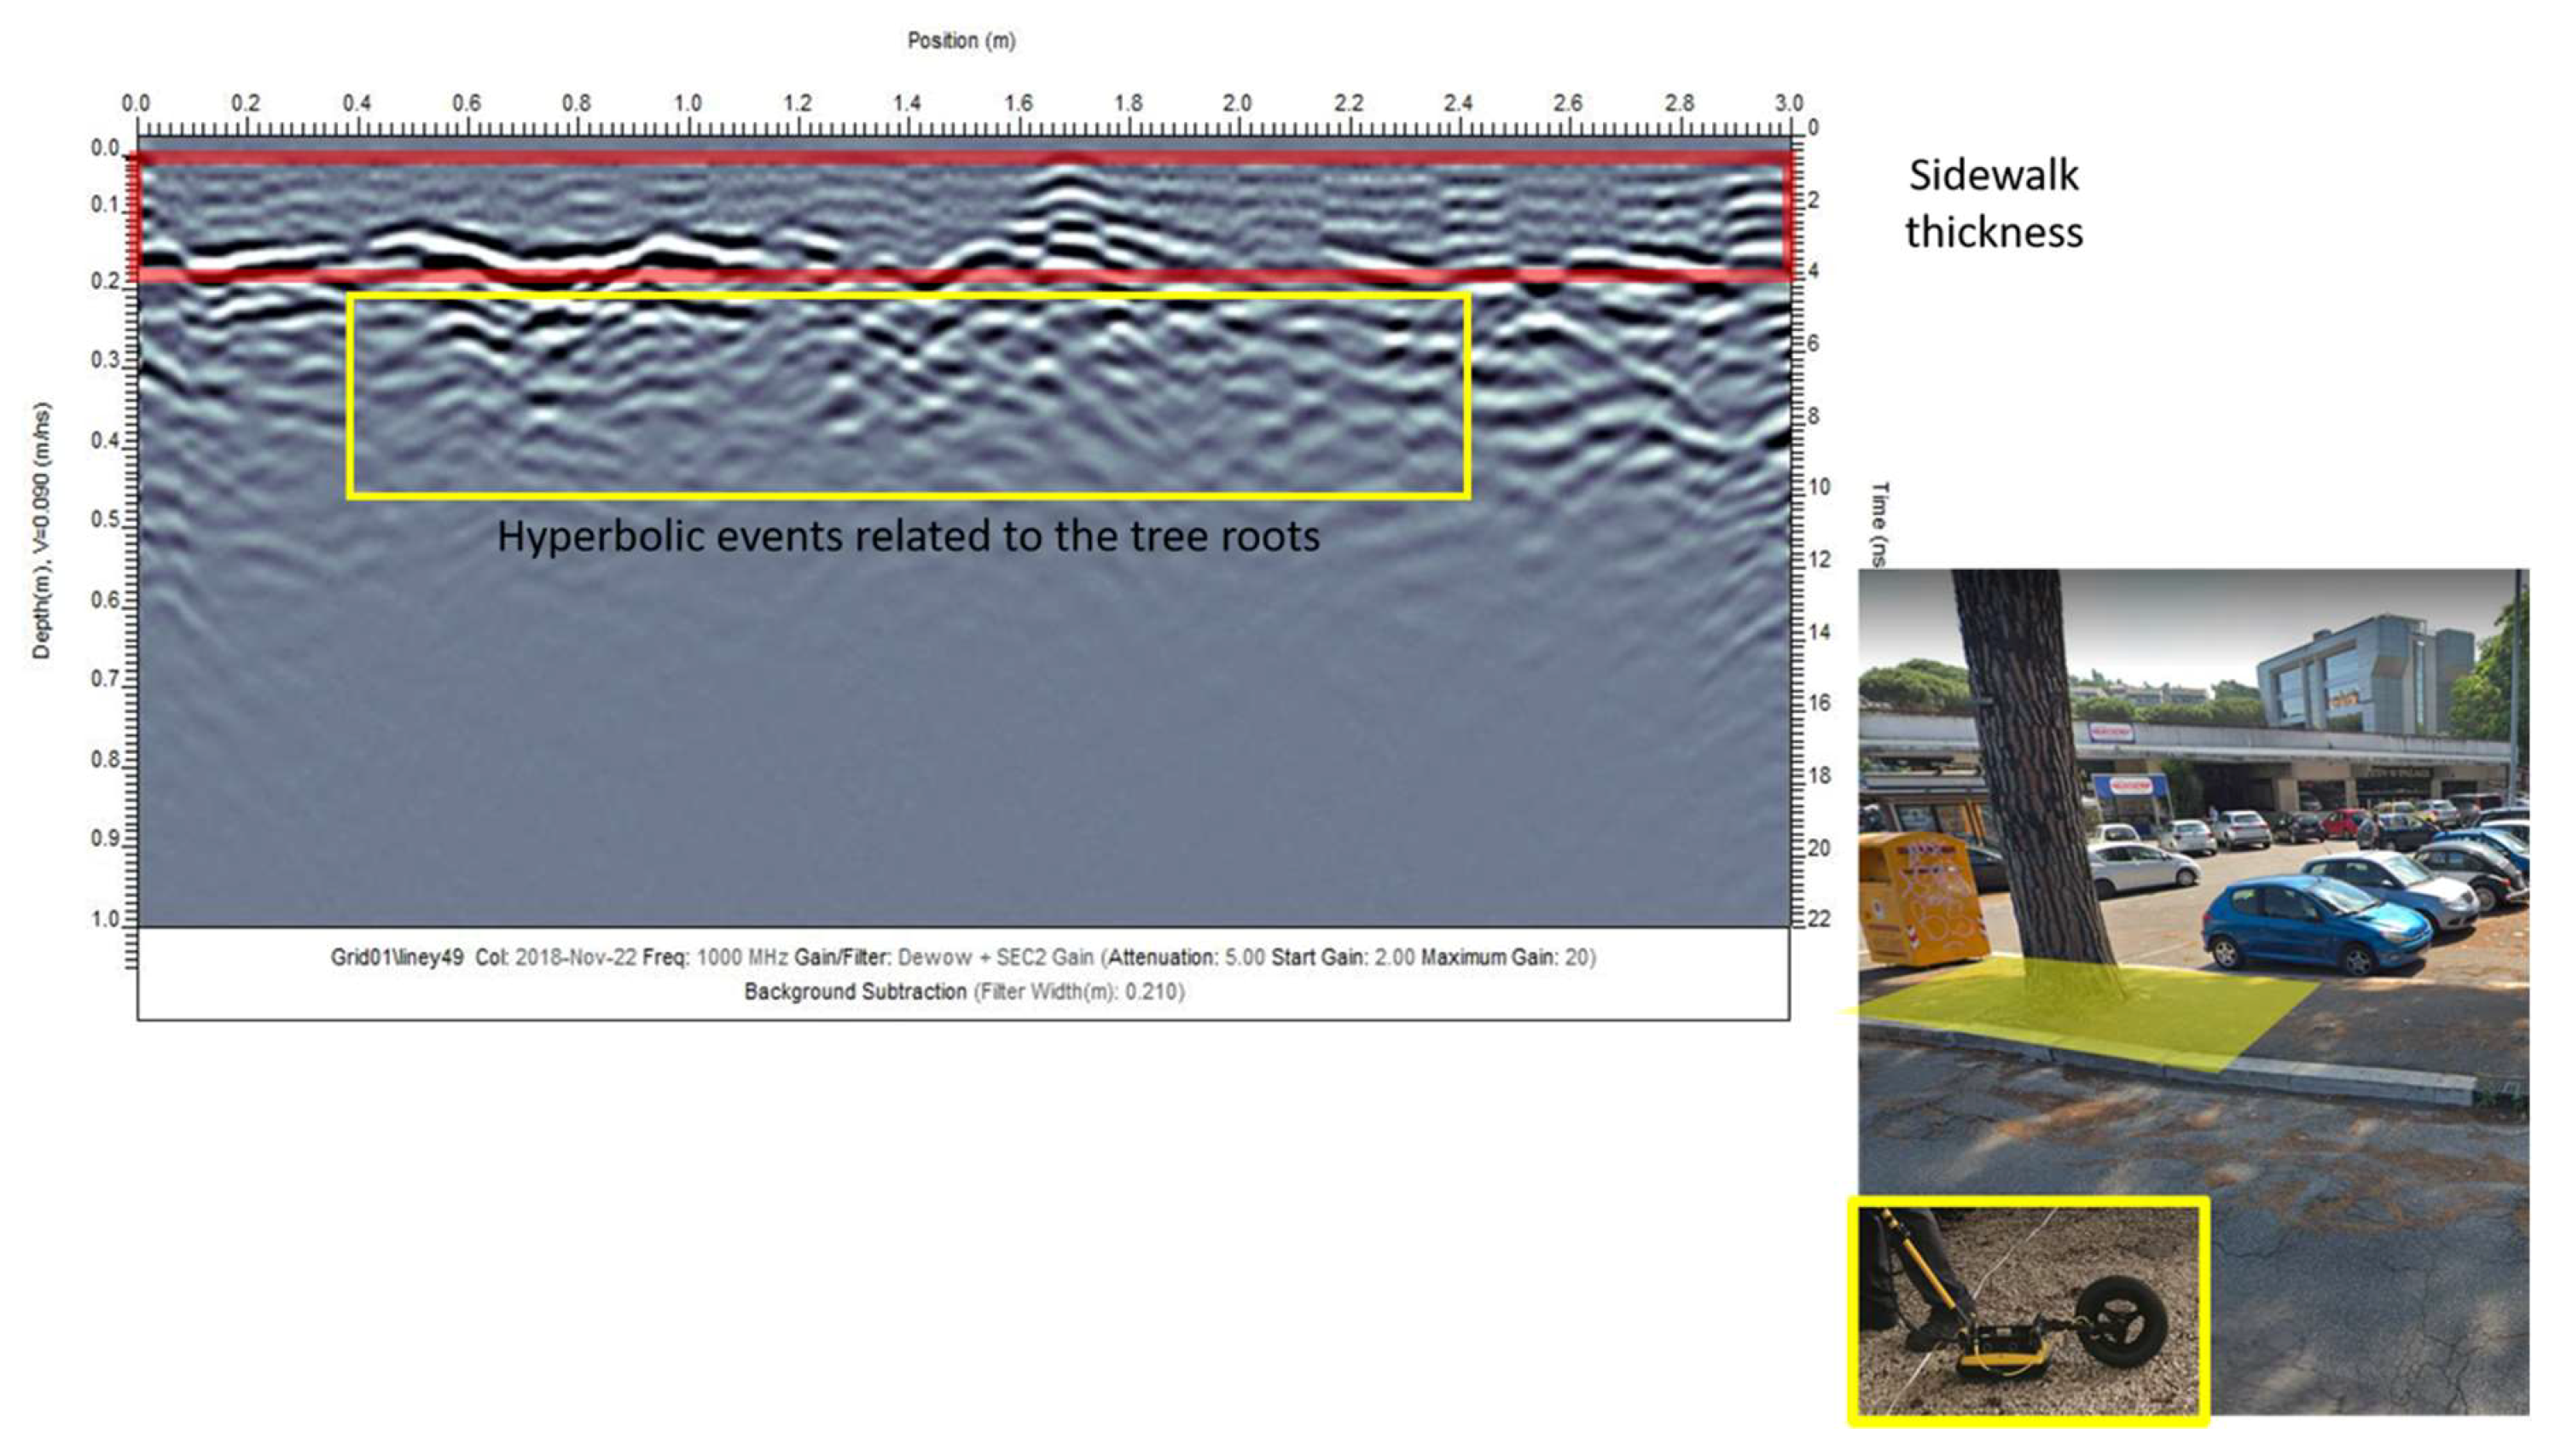
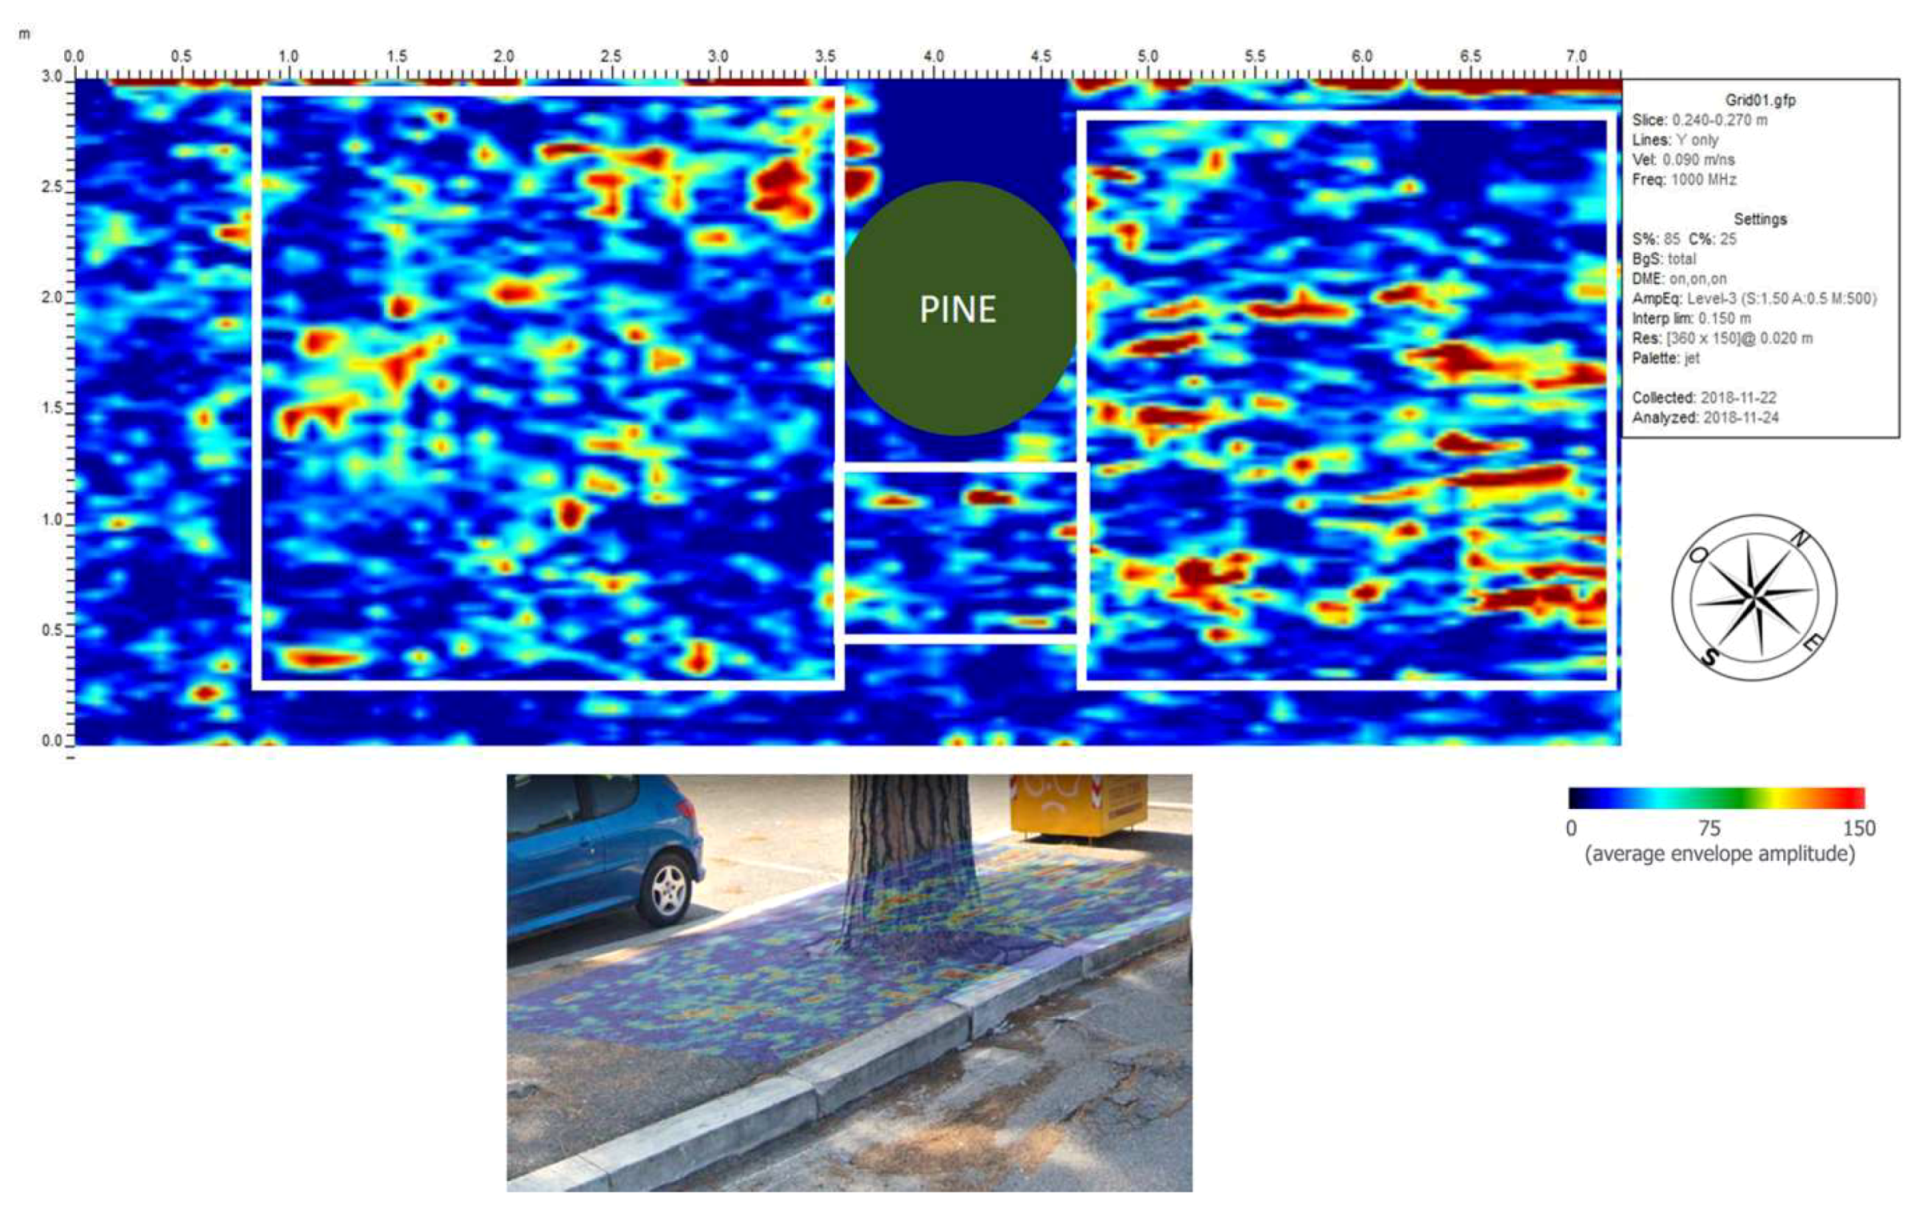
According to an initial analysis of the radargrams (Figure 10), it is possible to note that the possible root system depth was below 0.2 m (thickness of the sidewalk) with clear hyperbolic events. In the depth slices, these roots were visible at a depth of about 0.2 m, confirming what was noted in the radargrams. Furthermore, it is possible to see in the depth slices how the south-western zone of the pine had less evident elongated anomalies than the south-eastern and north-eastern zones (Figure 11). This is due to the fact that, probably, the GPR detected finer and thicker roots in the respective zones. On account of this acquisition, it is possible to have a pseudo-3D reconstruction of the subsoil. Moreover, in-depth reconstruction of the roots’ geometry was possible by navigating inside it (Figure 12).
3.3. Area 3: the AUR Garden
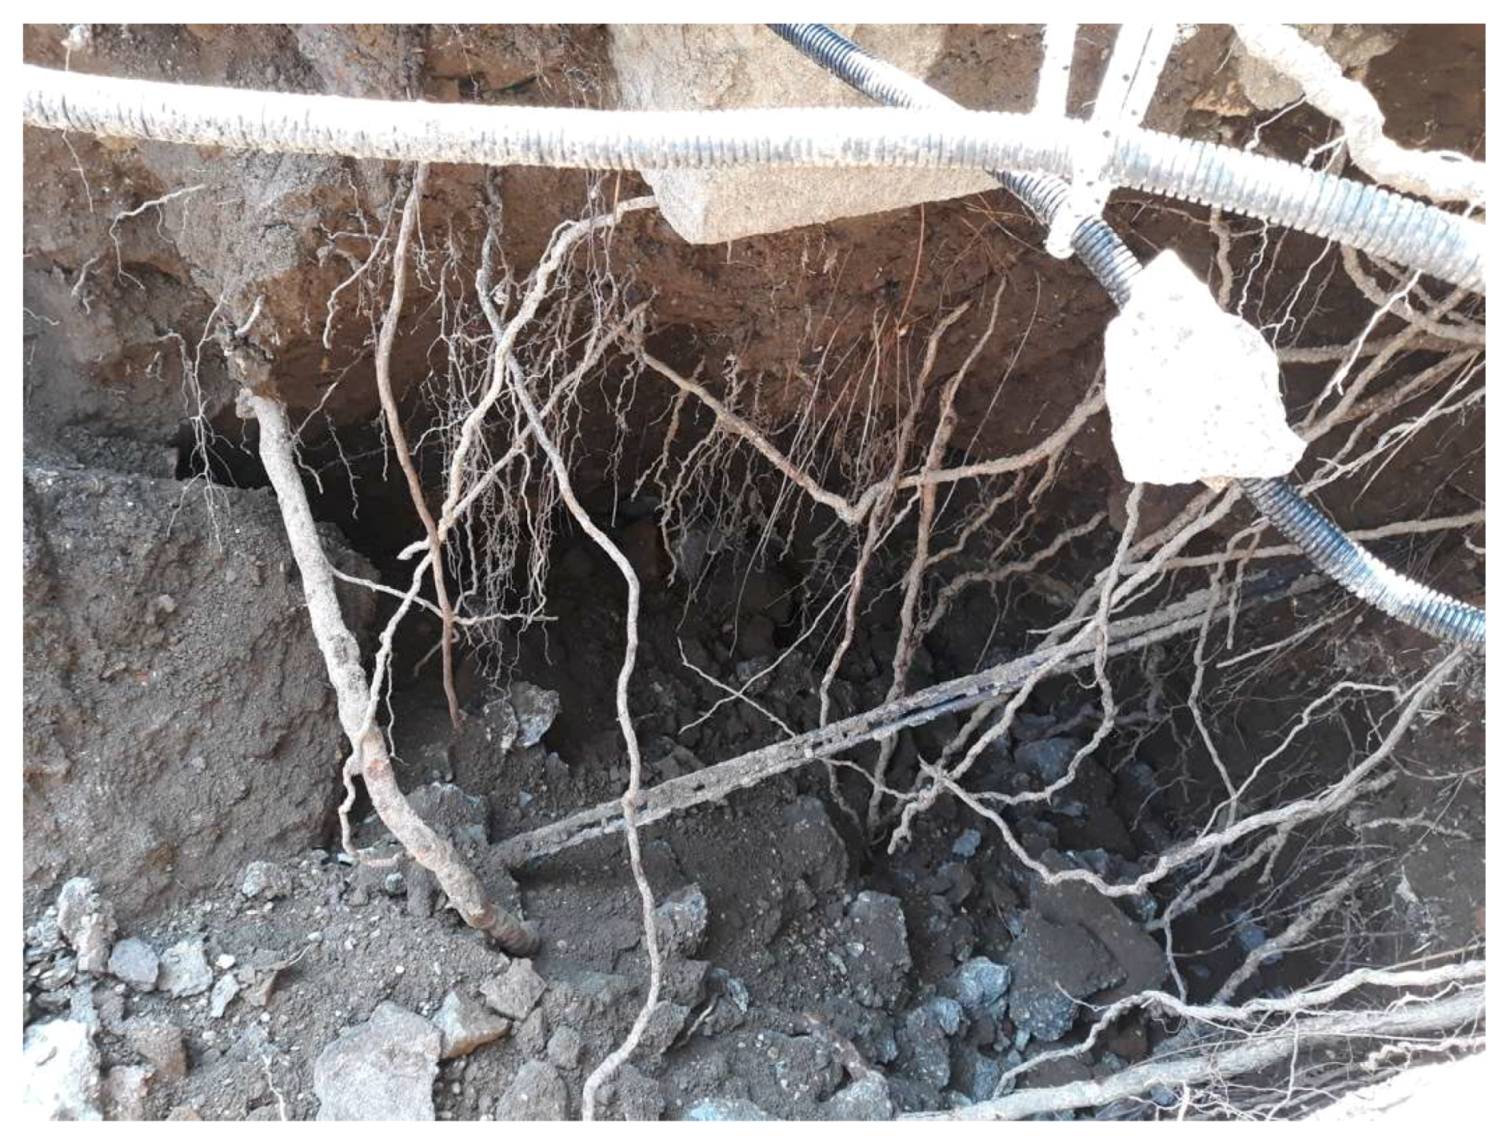
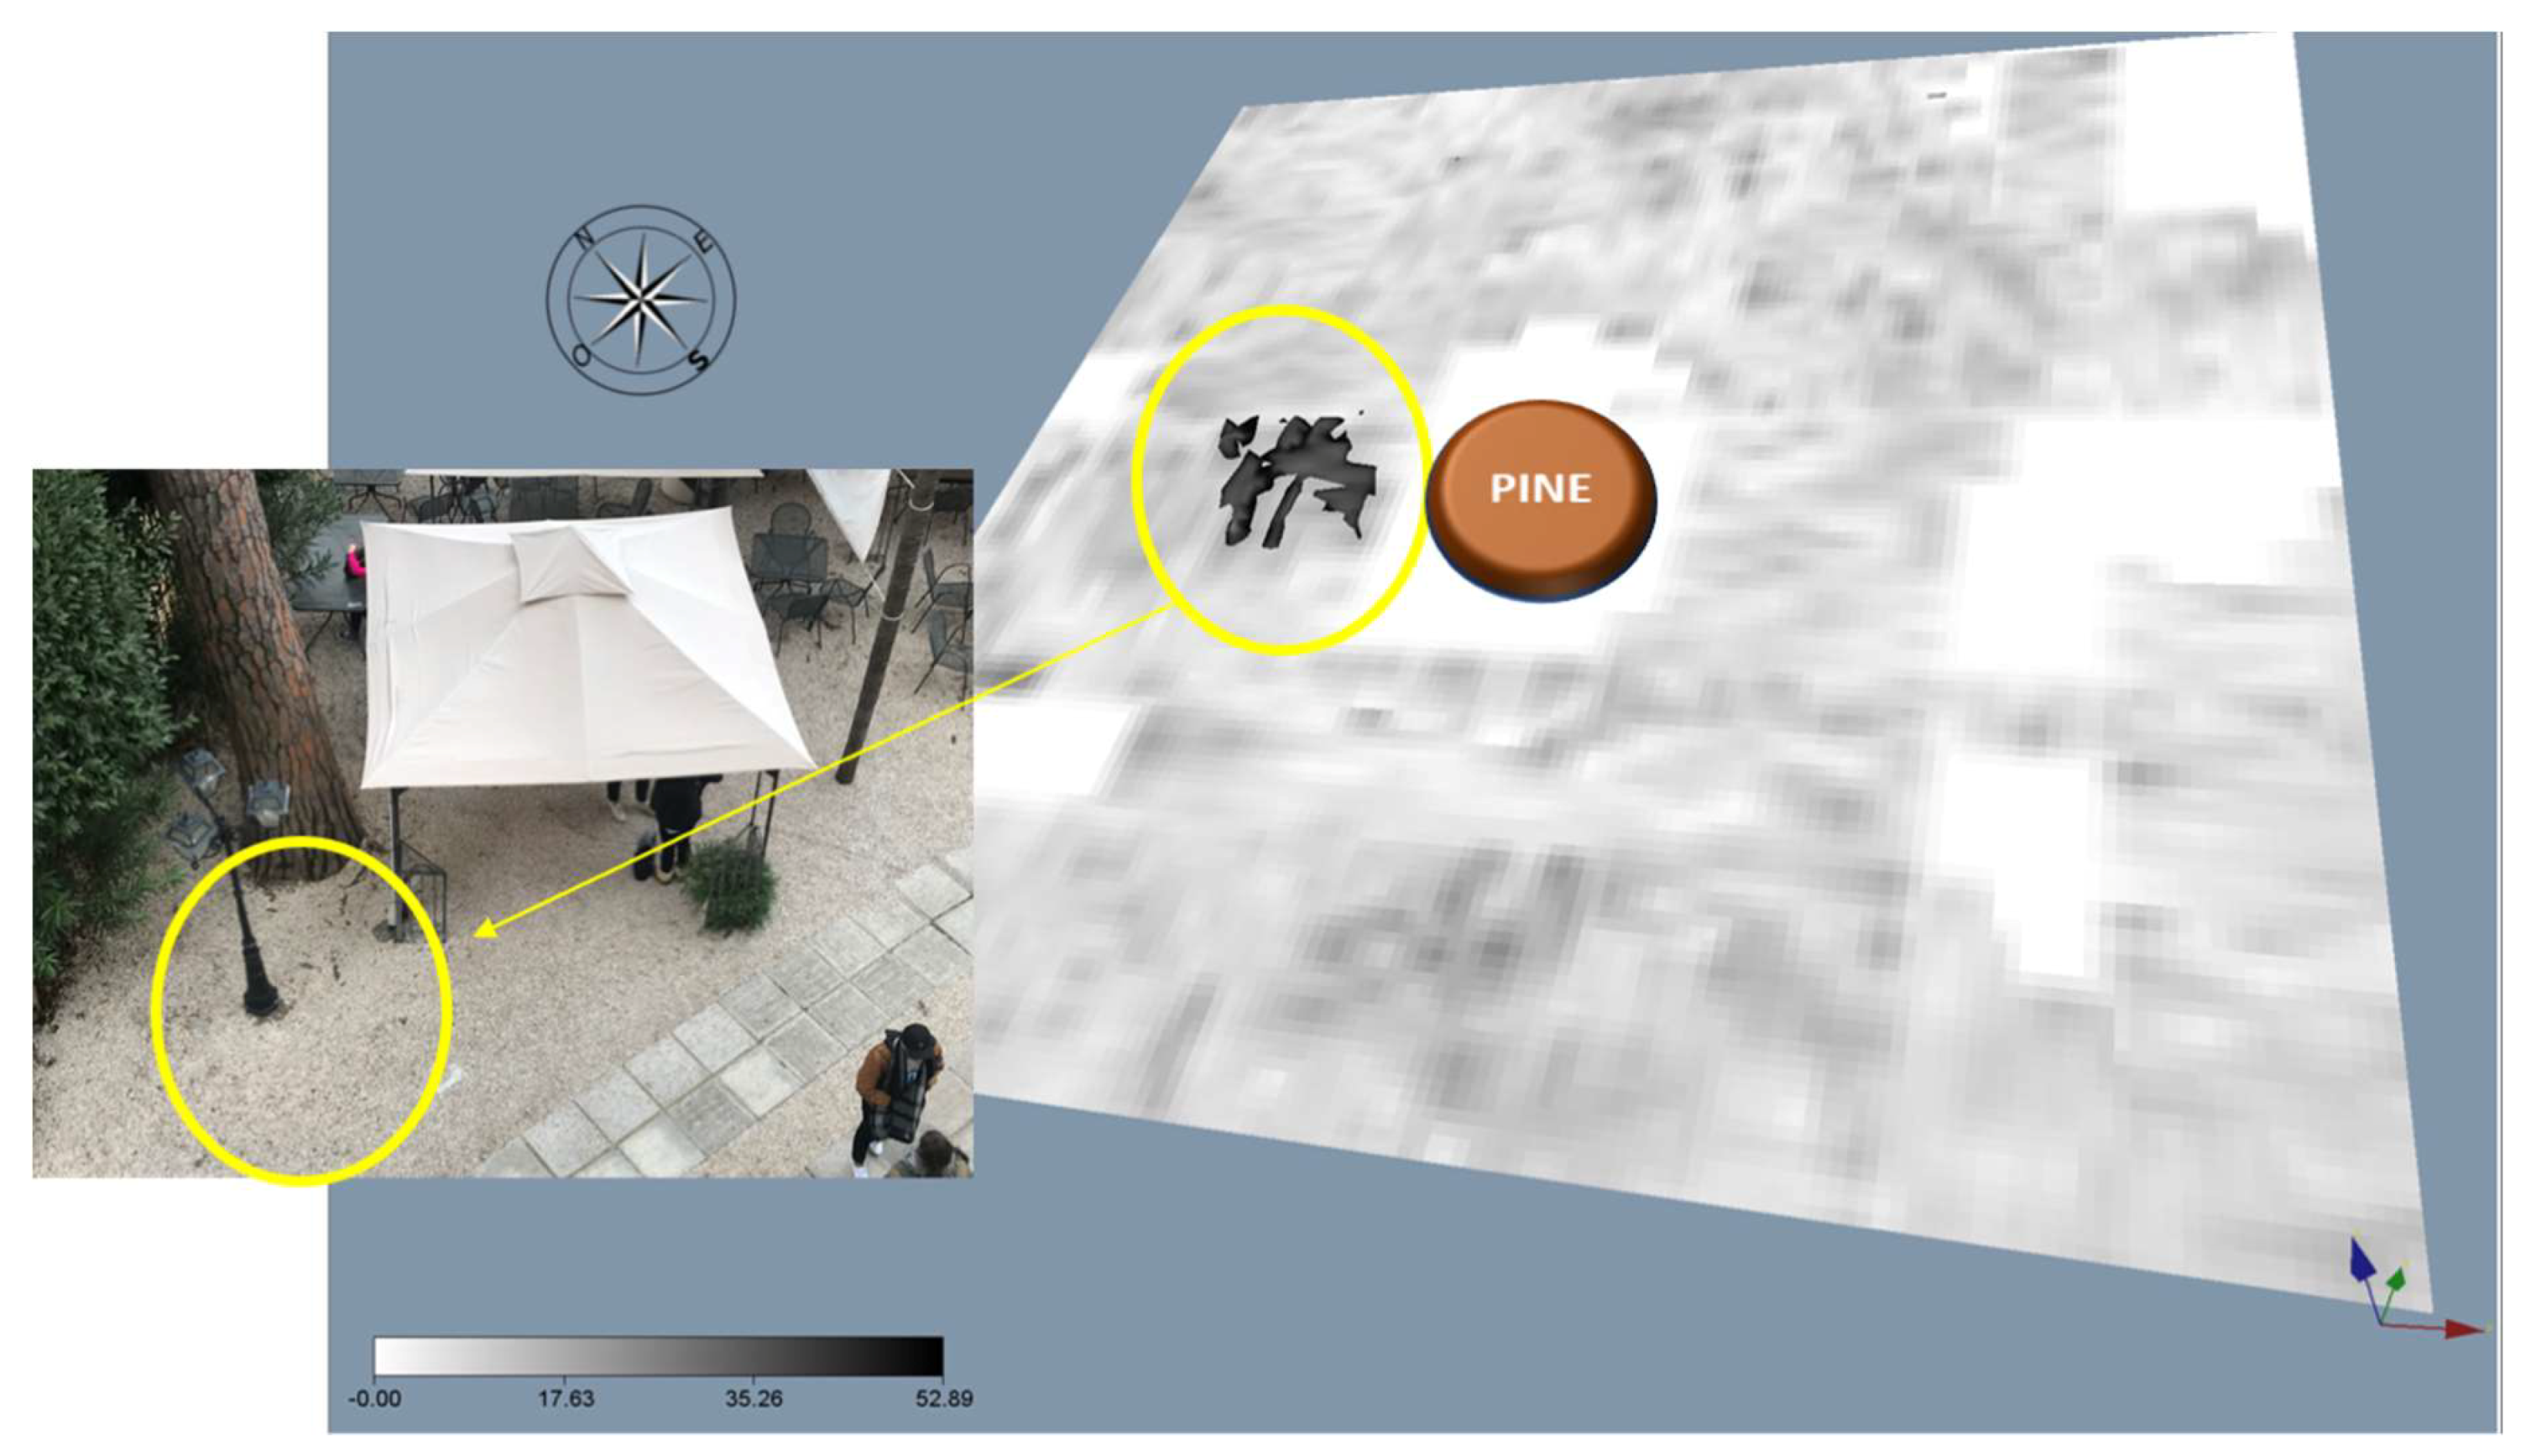
The third area was the AUR garden consisting of a leaning pine tree. The root architecture beneath this tree was already investigated using the FINDAR system a year prior to this project. Therefore, both GPR systems were involved here. Furthermore, the GPR investigation was focused on confirming, a posteriori, not only the initial hypothesis of a constant inclination of the tree during the last year with a consequent and probable uplifting of the north-western side of the pine but also the main orientation of the thicker roots (NW-SE). As the visible inclination of the trunk and the high risk for the safety of the everyday students, it was highly recommended to uproot it in a short time given the recurrent adverse weather events. As a result of this intervention, it was possible to notice, a posteriori, the presence, orientation, and geometry of the subsurface root system as well as the correct depths identified by the non-destructive GPR investigations (Figure 13).
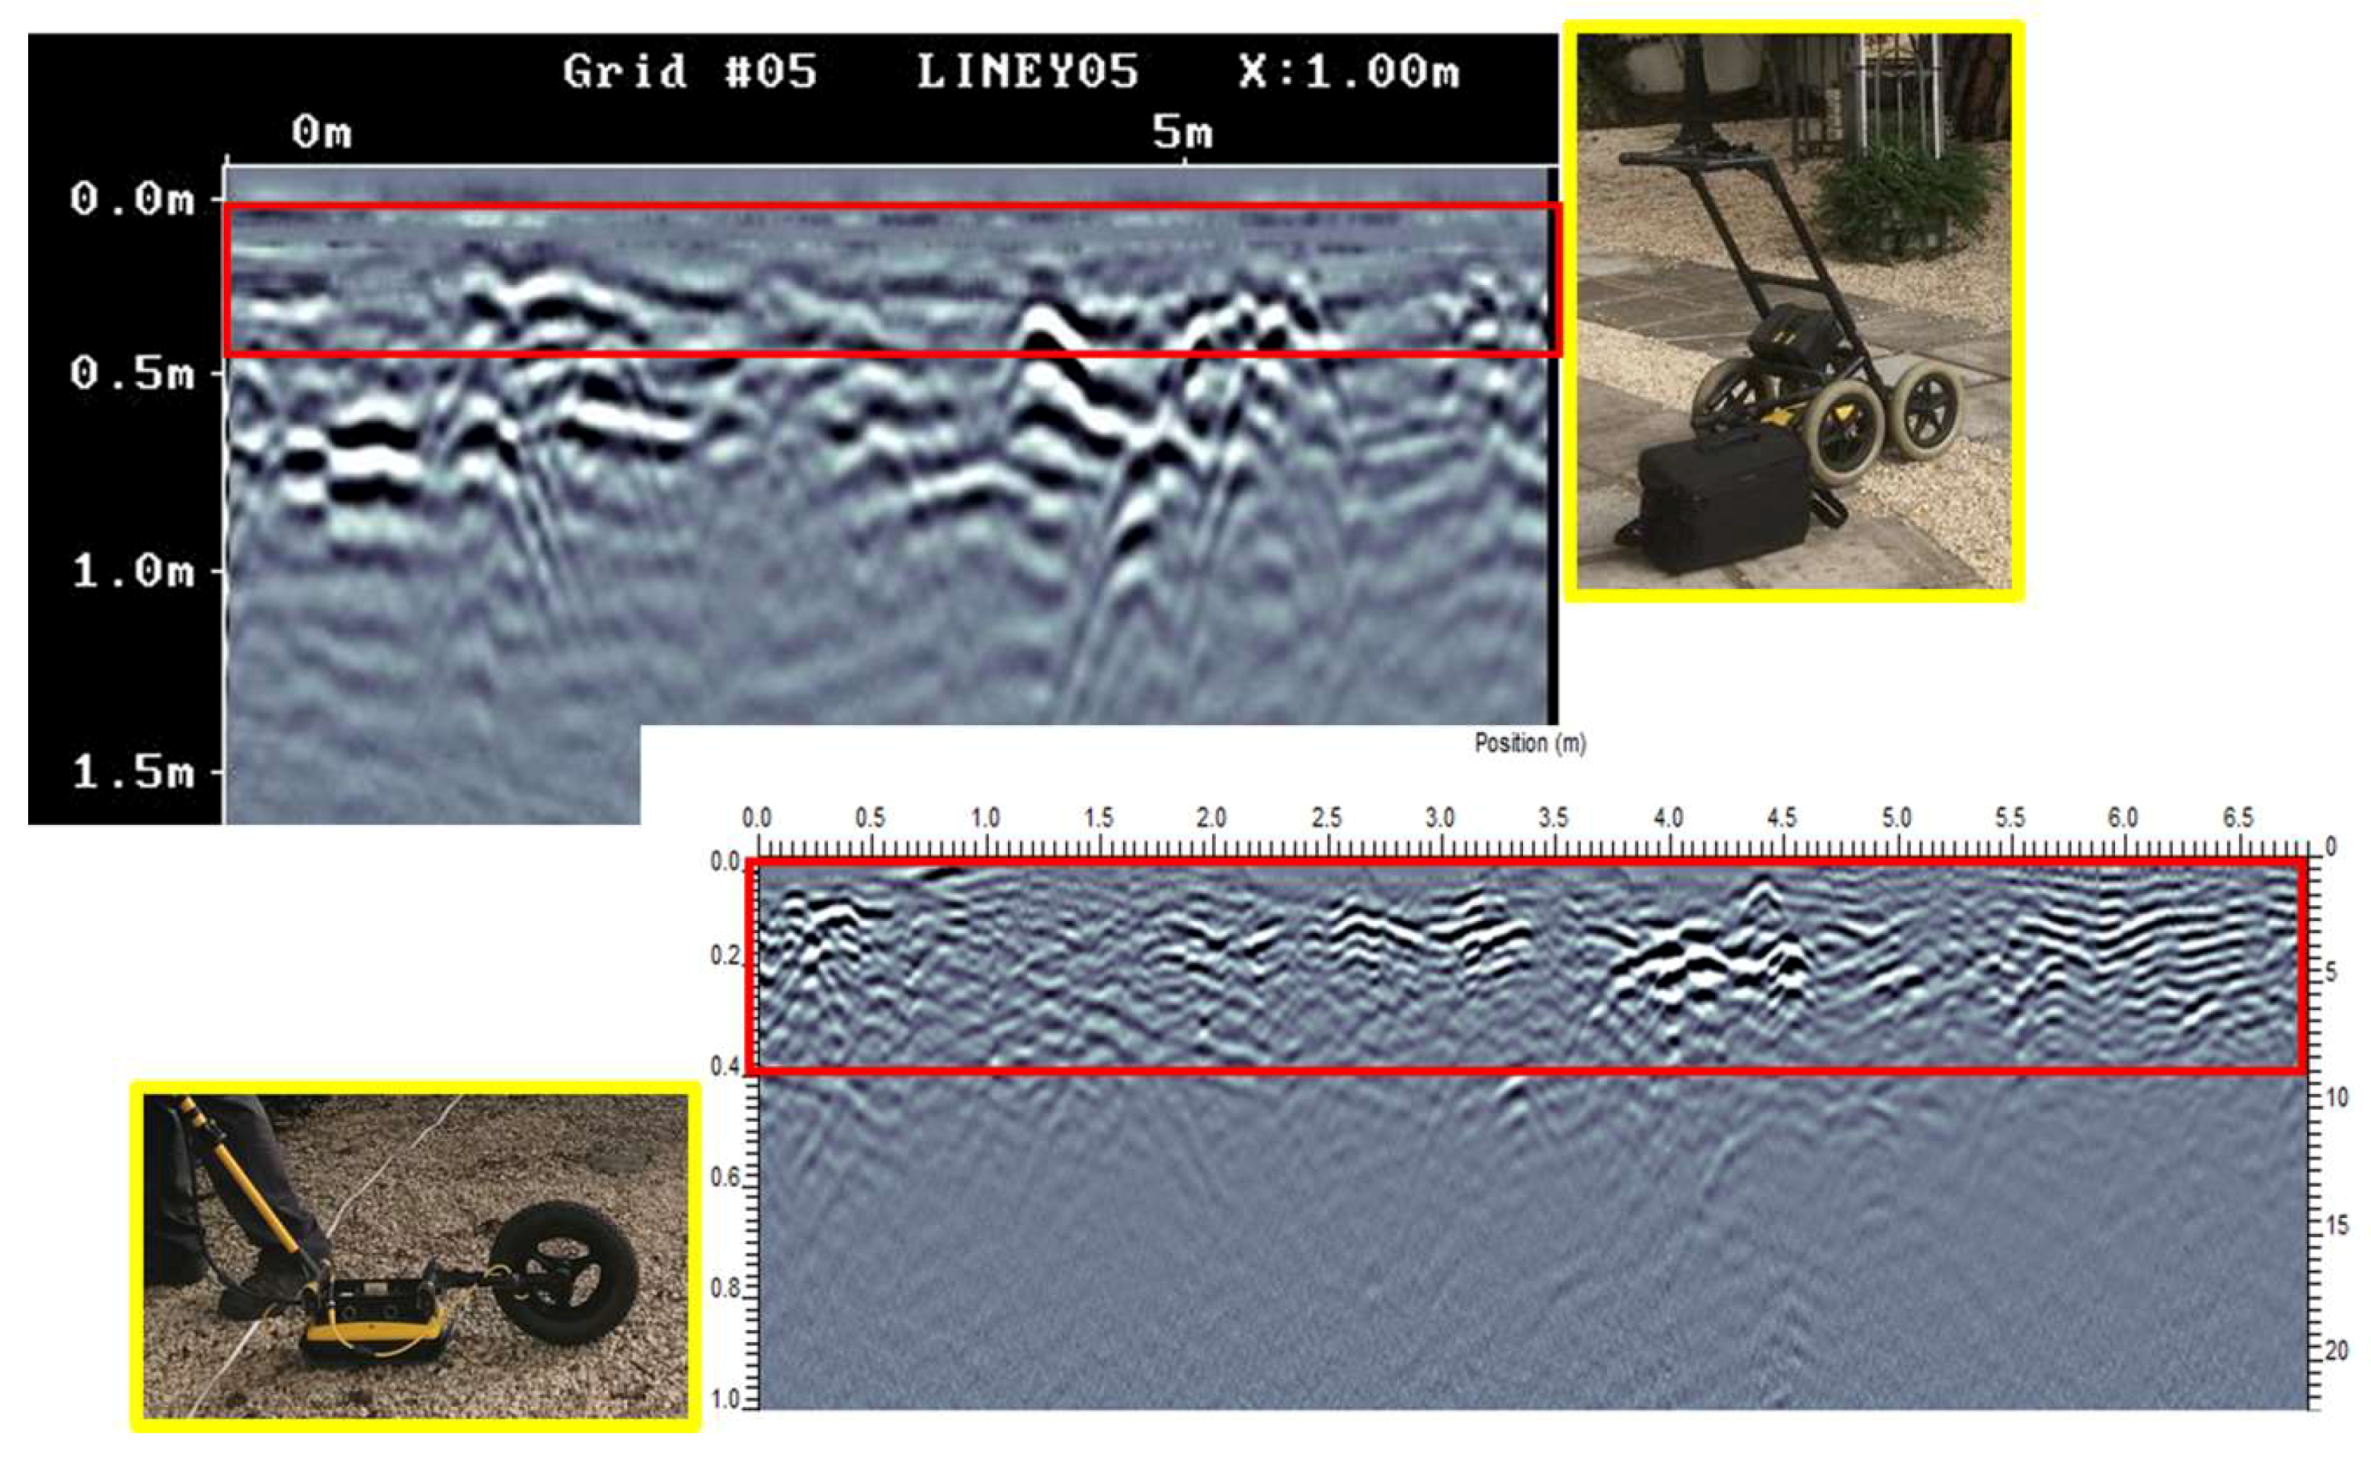
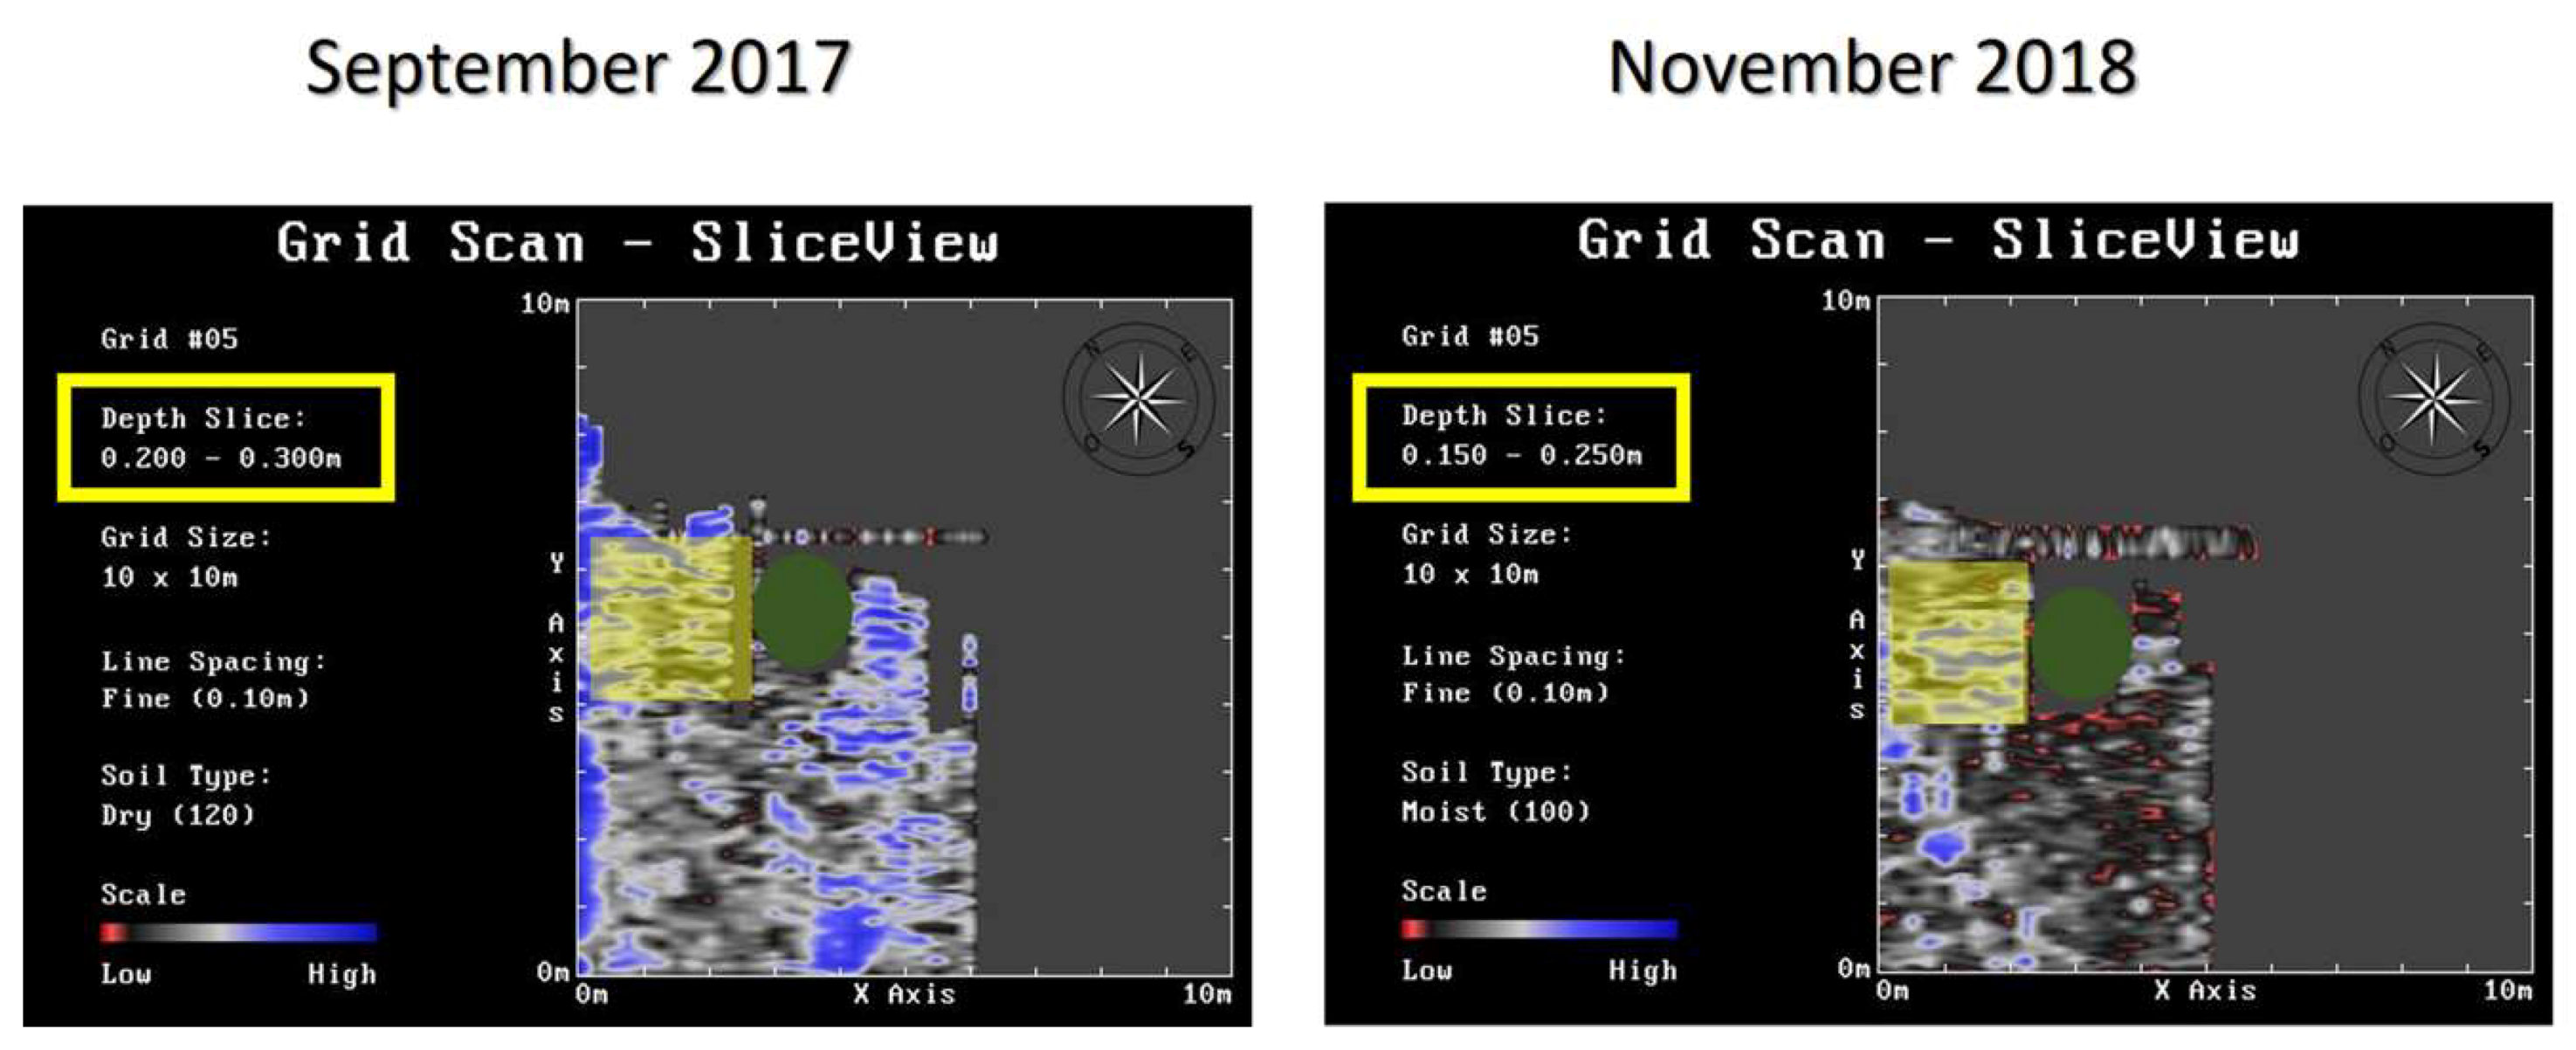
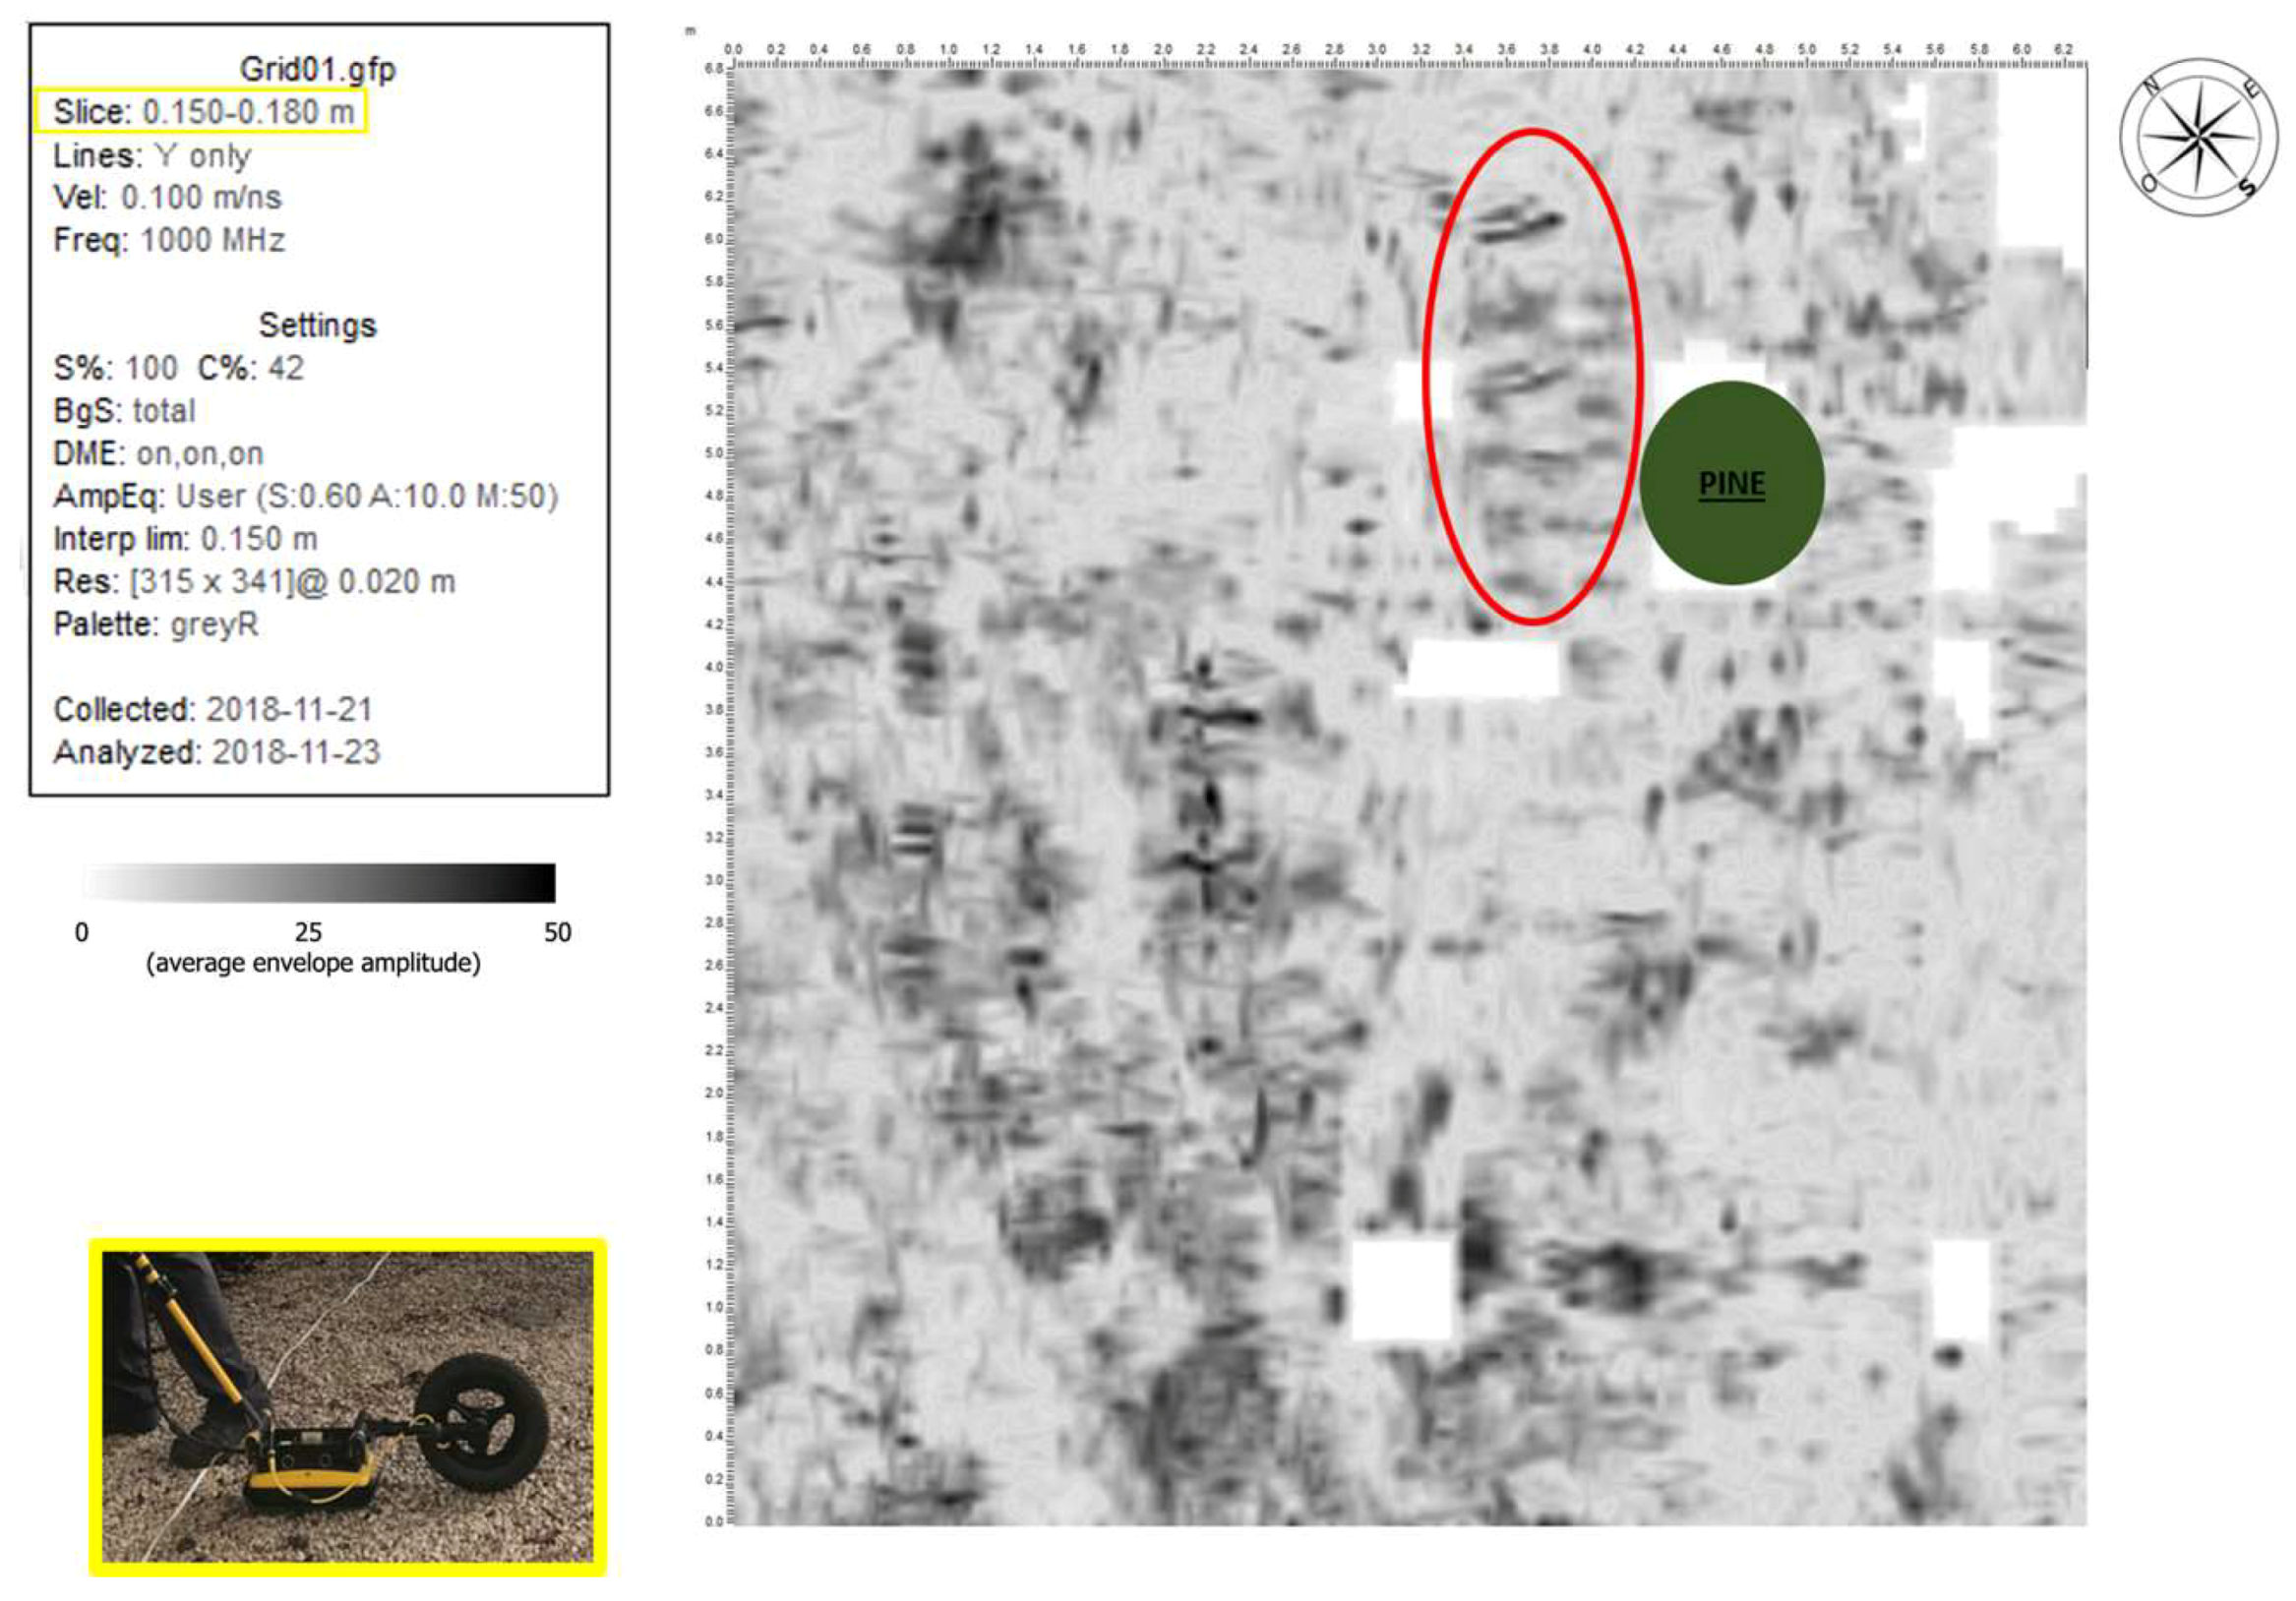
According to an initial analysis of the radargrams (Figure 14), it is possible to understand that the architecture of the thicker roots did not penetrate more than 0.30–0.40 m deep into the subsoil. Furthermore, other deeper anomalies were related to various cables and subservices present on the site. Thus, by comparing the current measurements with those of the previous year through the same instrument (i.e., FINDAR), it is possible to note how the roots became visible around 0.25 m deep in the previous year, while the current roots placed in the north-western side of the pine were only about 0.15 m deep (Figure 15). Even if the resolution of the FINDAR acquisition cannot be so precise, the north-western side have highlighted a different depth slice with the same conditions of acquisition in both 2017 and 2018. Hence, the north-western roots alone had risen by about 0.05/0.1 m merely a year later, confirming, a posteriori, the initial hypothesis. In addition, this evaluation is visible in the corresponding map acquired this year with a better resolution through the NOGGIN system (Figure 16) and the relative pseudo-3D reconstruction (Figure 17).
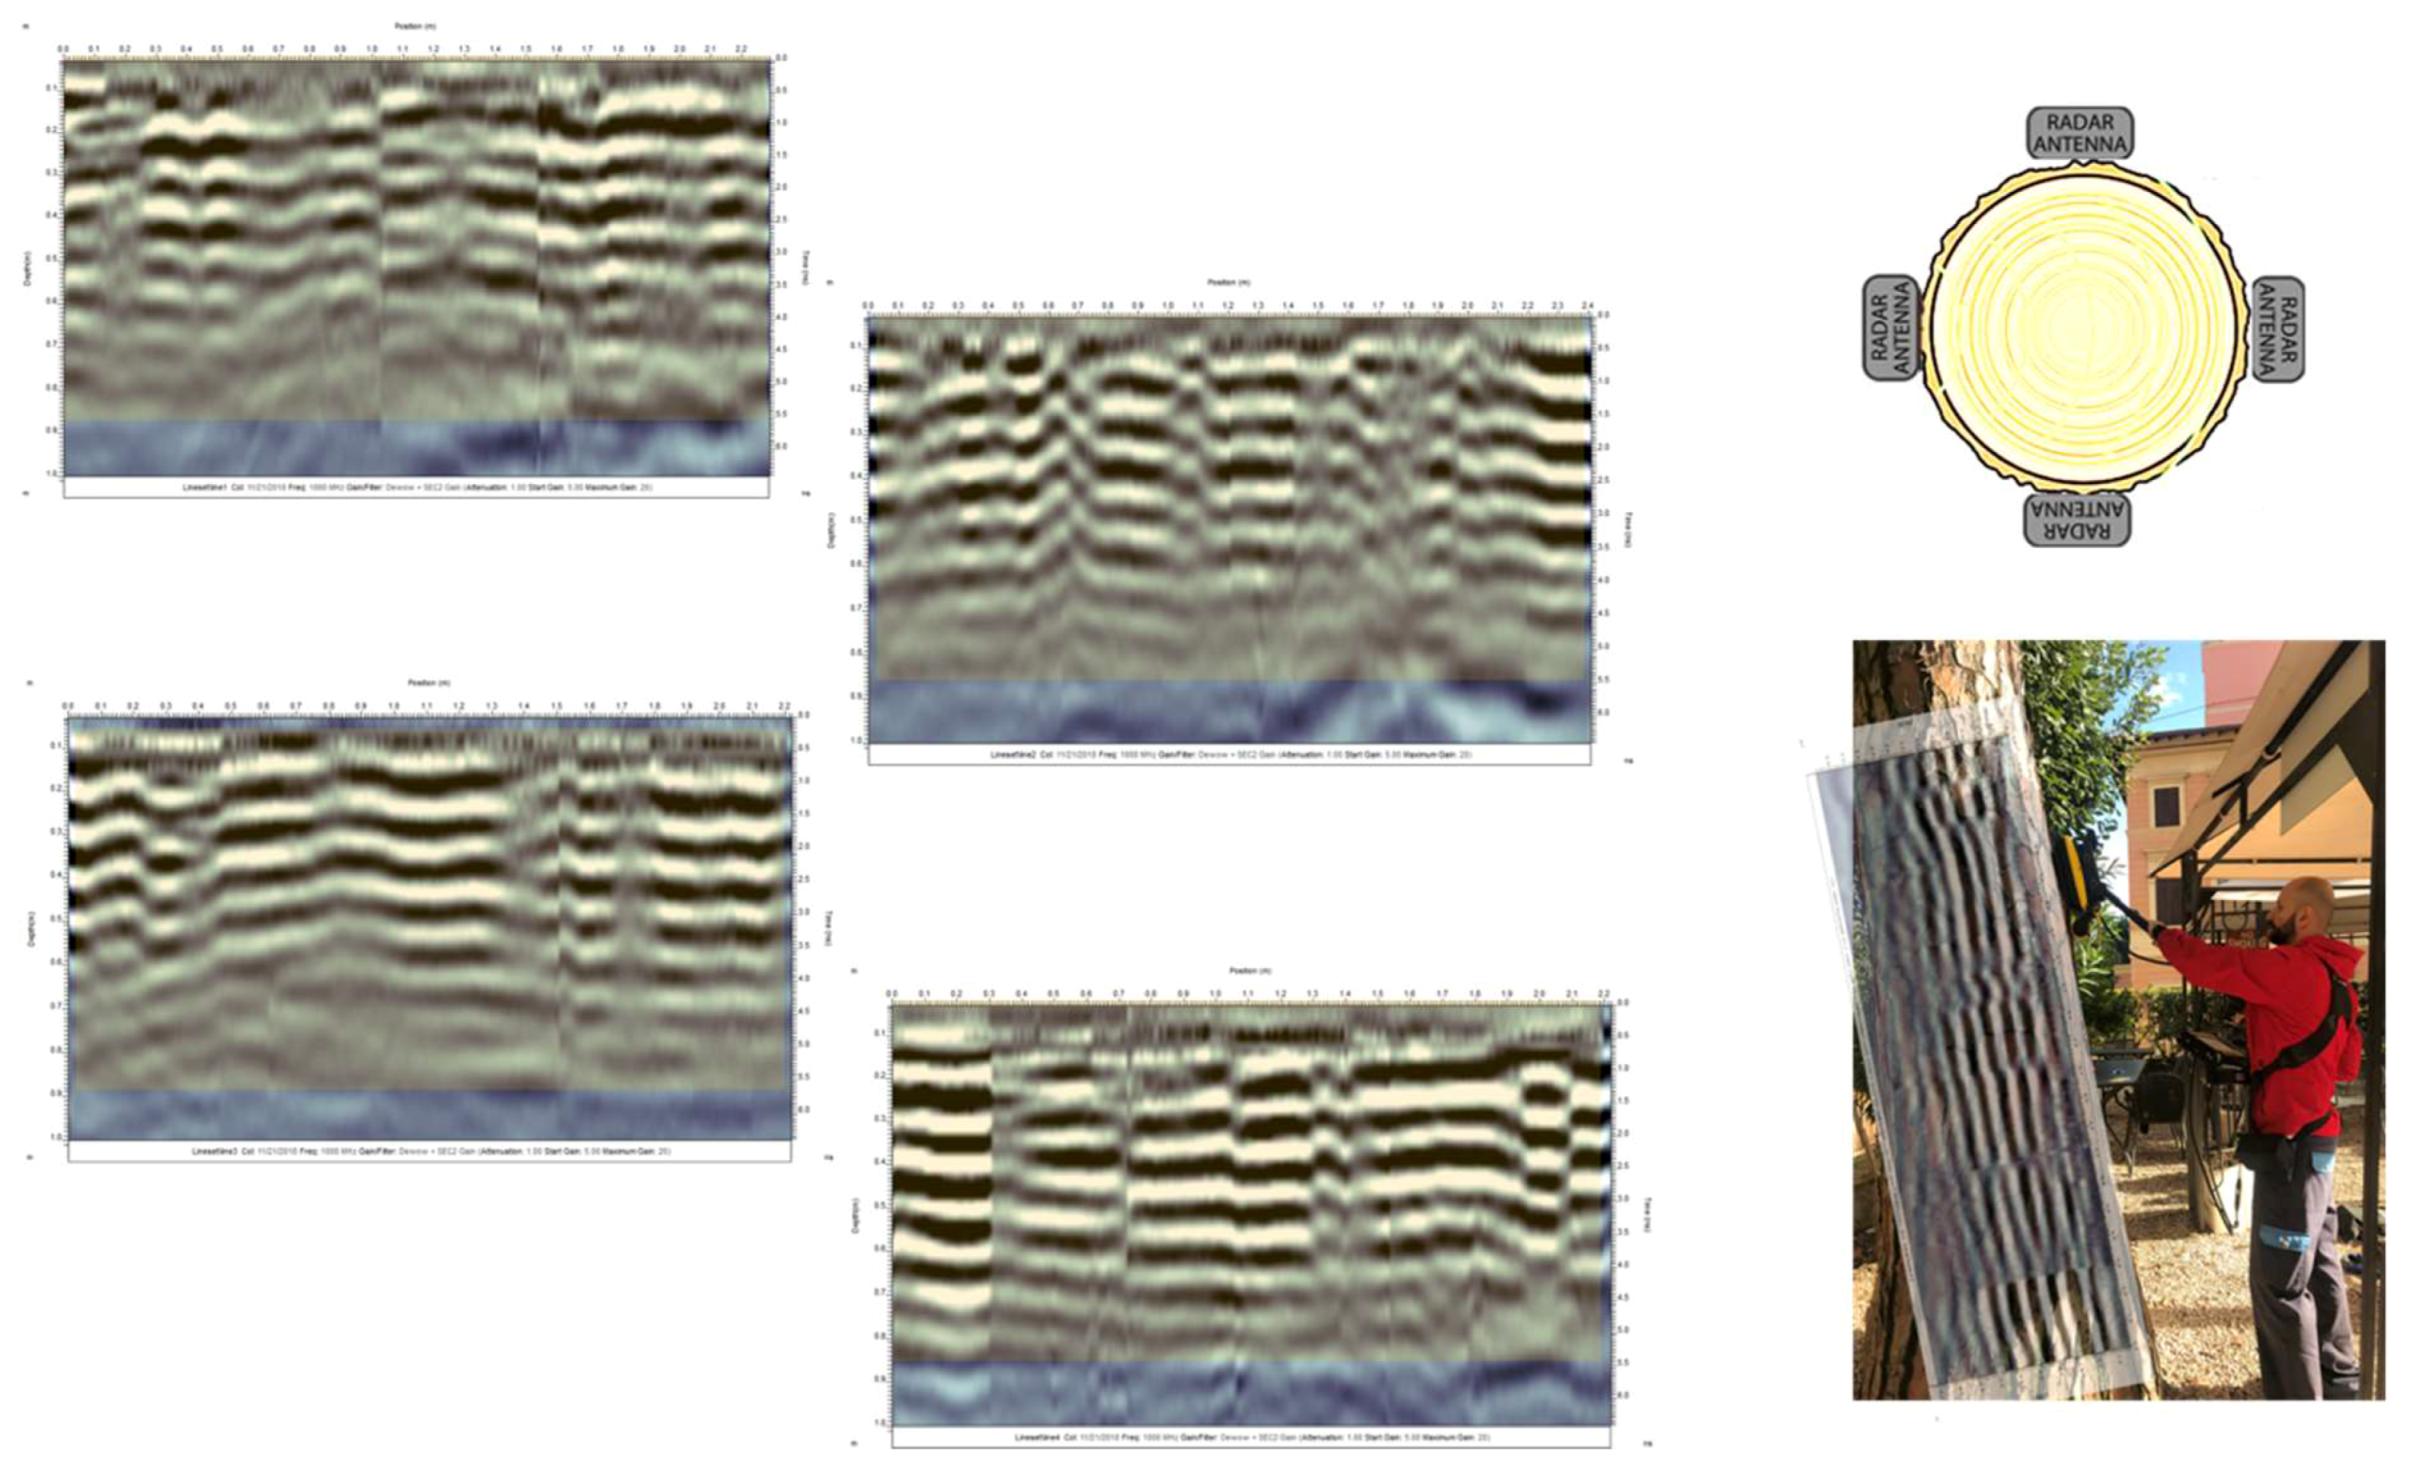
Moreover, the NOGGIN system was used to investigate the presence or absence of cavities or discontinuities inside the trunk that could preclude the pine tree stability. Accordingly, four profiles were performed every 90°. The investigation showed the homogeneity on the inside of the trunk with no cavities and confirmed the estimation of the diameter at about 0.85 m (Figure 18).
3.4. The SWOT Analysis
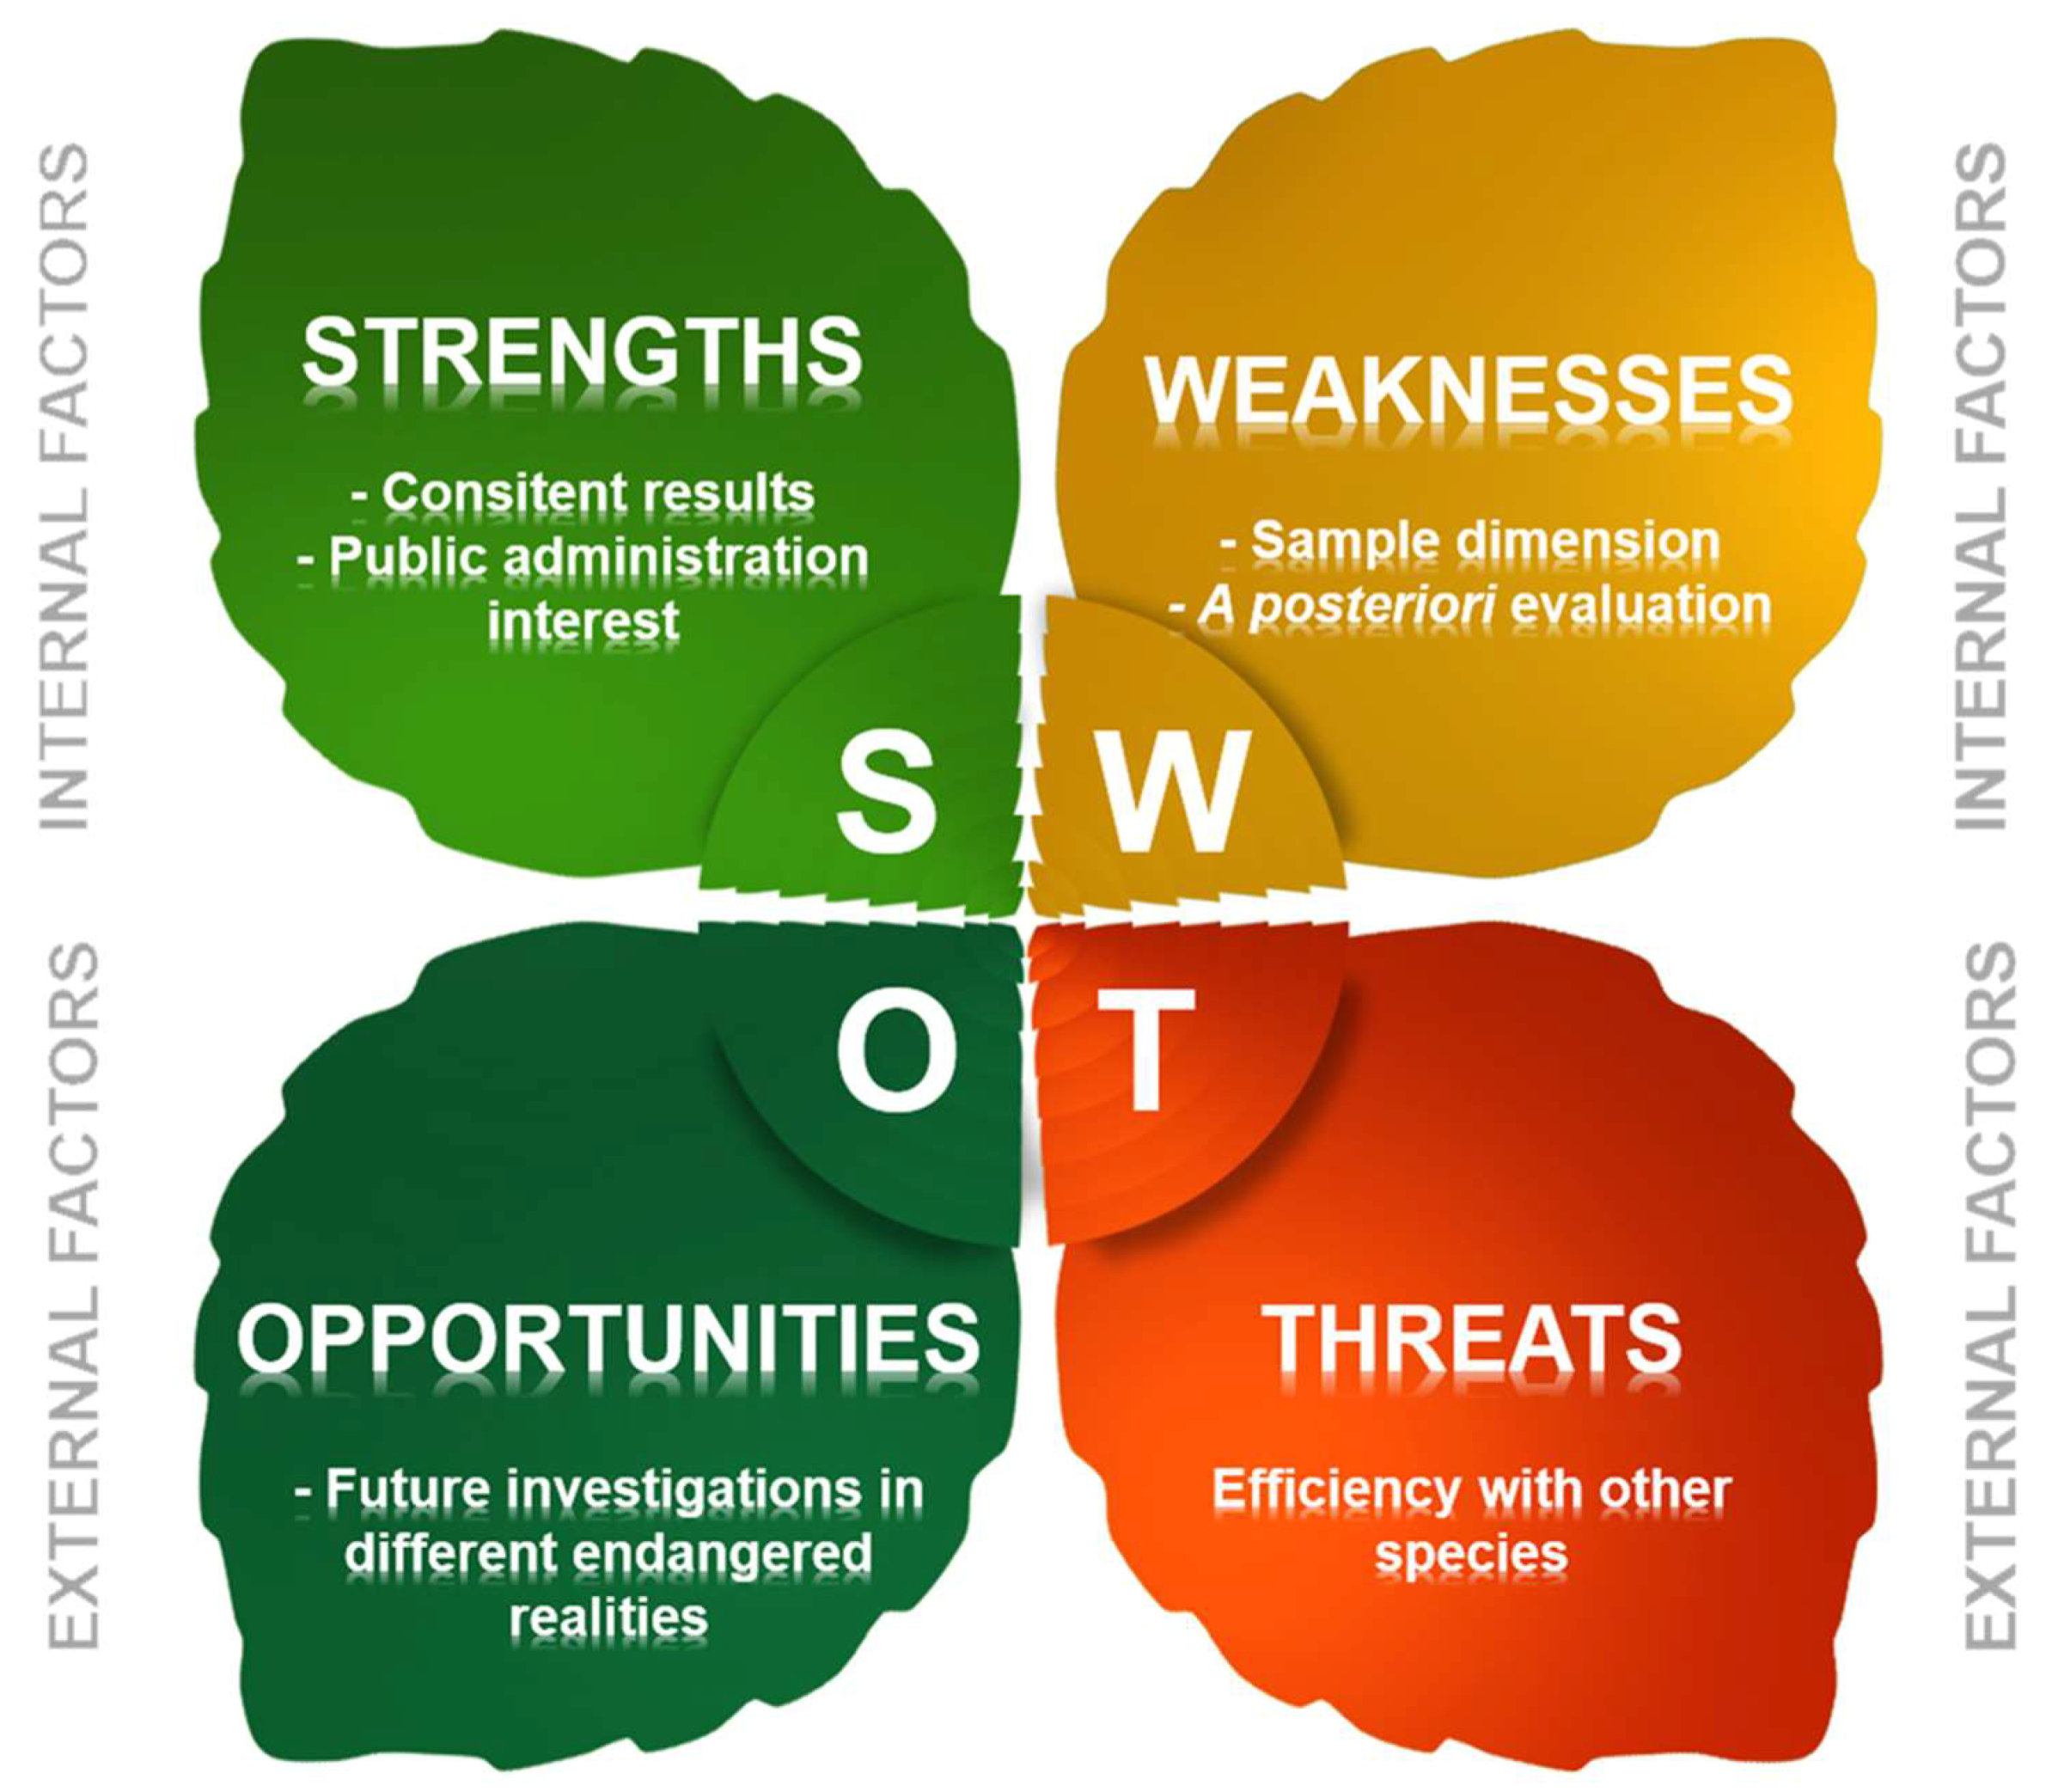
Based on these results, a SWOT analysis [37] was created to evaluate the whole research project and better understand it through its internal strengths and weaknesses, and external opportunities and threats [38].
On the one hand, among the internal strengths of this project, are mainly two things. First are the GPR characteristics which provided consistent results on internal structures (i.e., pavements and trunks). Then, there was the interest of the Italian public administration, for the first time, in such a technology. A large city like Rome with more than 310,000 trees [39] desperately needs to use fast, real-time, and non-destructive techniques such as GPR to constantly monitor tree and root status. However, the main limitations of this research could be the sample dimension and the a posteriori evaluation. This sample is perfect for a small test, but to plan meticulous monitoring of the urban greening of Rome, it is necessary to consider a larger number of species. Moreover, an effort to increase the level of knowledge with an a priori assessment should be done in the future.
On the other hand, this research provides a great opportunity to employ this geophysical approach again for future investigations of tree roots and trunks not only in a large city like Rome but also in other smaller realities, such as public parks or open-air archaeological sites, in which the risk of tree collapse could be substantial. Nevertheless, this methodological procedure is also characterized by a potential threat. This approach, indeed, does seem to work for some tree species in Rome. However, due to the nature of the arboreal heritage, will the same method work with different species as well (Figure 19)?
4. Conclusions
The main purpose of this technical note was to create a short paper that provided a brief description of a specific procedure, which had a practical value and contributed to the diagnosis or management of an urgent need in Rome, catalyzing the attention on a possible non-destructive solution, such as GPR. The test involved the GPR technique to confirm what the experts of the Department of Environmental Protection of ROMA CAPITALE had already assessed hypothetically: the presence of some defects in the subsurface root architecture (such as the inclination of some trees) due to the presence of works related to modern subservices. Therefore, the aim of this test was to confirm this assessment with a posteriori GPR evaluations of the thicker roots, normally perpendicular to the GPR direction. All phases of this test showed the effectiveness of the method and the rapidity of the data acquisition, and mainly, the results were achieved with a prompt, precise, accurate, and relatively low-cost activity for assessing tree stability.
Consequently, it was found that the root depth measurements were accurate in one surveyed area of this project owing to the ground truth (i.e., the AUR pine tree). Based on these measurements, there was negligible difference between the depth of the root of the GPR calculation and the actual observed depth. Therefore, a posteriori verification of the ability to locate roots in the urban environment of the GPR determined in this study confirmed that this technology is suitable for this purpose. Moreover, the ability of the GPR to accurately identify the positions of multiple thicker roots and reconstruct the geometry of a singular thicker root in a three-dimensional environment is a relevant tool for any city government involved in preventing possible disasters on account of falling trees. Finally, the possibility of reconstructing the internal geometry of a trunk, such as in this work, can easily and rapidly help in planning correct urban greening management as much as possible.
As a result, preventing fatal incidents around trees depends on the ability and promptness in determining the circumstances linked to subsurface conditions in a fast and non-destructive way.
Author Contributions
Conceptualization, P.M.B. and C.F.; methodology, P.M.B., and C.F.; software, P.M.B.; validation, P.M.B. and C.F.; formal analysis, P.M.B. and C.F.; investigation, P.M.B. and C.F.; resources, P.M.B. and C.F.; data curation, P.M.B. and C.F.; writing—original draft preparation, P.M.B.; writing—review and editing, P.M.B. and C.F.; visualization, P.M.B. and C.F.; supervision, P.M.B.; project administration, P.M.B.; funding acquisition, P.M.B. and C.F..
Funding
This research received no external funding.
Acknowledgments
The authors would like to thank Rosalba Matassa, Antonio Lumicisi, Francesco Messina, Paolo Paiella, and Maria Giovanna Laurenzana of the Department of Environmental Protection of ROMA CAPITALE for their immense help and support. They would also like to show their immense gratitude to Dieter Grieß and Fernando Constantino from Sensors and Software Europe GmbH for their kind availability, assistance with GPR acquisition and processing, and for sharing SSI experience with them during the course of this research. Finally, the authors would thank the editors of the Special Issue, Dr. Fernand Teixeira and Dr. Raffaele Persico, and the anonymous reviewers for their great support and assistance.
Conflicts of Interest
The authors declare no conflict of interest.
References
- Singh, V.S.; Pandey, D.N.; Chaudhry, P. Urban Forests and Open Green Spaces: Lessons for Jaipur, Rajasthan, India; Paper No. 1/2010; RSPCB Occasional: Jaipur, Rajasthan, 2010. [Google Scholar]
- Trowbridge, P.; Bassuk, N.L. Trees in the Urban Landscape: Site Assessment, Design and Installation; Wiley and Sons, Inc.: Hoboken, NJ, USA, 2004. [Google Scholar]
- Costello, L.R.; Elmore, C.L.; Steinmaus, S. Tree root response to circling root barriers. J. Arboric. 1997, 23, 211–218. [Google Scholar]
- Gilman, E.F. Root barriers affect root distribution. J. Arboric. 1996, 22, 151–154. [Google Scholar]
- Wagar, J.A.; Barker, P.A. Tree root damage to sidewalks and curbs. J. Arboric. 1983, 9, 177–181. [Google Scholar]
- Wagar, J.A. Reducing surface rooting of trees with control planters and wells. J. Arboric. 1985, 11, 165–171. [Google Scholar]
- Barker, P.A.; Peper, P. Strategies to prevent damage to sidewalks by tree roots. J. Arboric. 1995, 19, 295–309. [Google Scholar] [CrossRef]
- Grabosky, J.; Bassuk, N. Testing of structural urban tree soil materials for use under pavement to increase street tree rooting volumes. J. Arboric. 1996, 21, 197–201. [Google Scholar]
- McPherson, E.G.; Muchnick, J. Effects of street tree shade on asphalt concrete pavement performance. J. Arboric. 2005, 31, 303–310. [Google Scholar]
- Appleton, B.; Horsley, J.; Harris, V.; Eaton, G.; Fox, L.; Orband, J.; Hoysa, C. Trees for Parking Lots and Paved Areas. In Virginia Cooperative Extension; Publication 430-028; Virginia Polytechnic Institute and State University: Blacksburg, VA, USA, 2009. [Google Scholar]
- D’Amato, N.E.; Sydnor, T.D.; Knee, M.; Hunt, R.; Bishop, B. Which comes first, the root or the crack? J. Arboric. 2002, 28, 277–289. [Google Scholar]
- McPherson, E.G. Expenditures associated with conflicts between street trees root growth and hardscape in California. J. Arboric. 2000, 26, 289–297. [Google Scholar]
- Costello, L.R.; Jones, K.S. Reducing Infrastructure Damage by Tree Roots: A Compendium of Strategies; International Society of Arboriculture: Cohasset, CA, USA, 2003. [Google Scholar]
- McPherson, E.G.; Peper, P. Infrastructure repair costs associated with street trees in 15 cities. In Proceedings of an International Workshop on Trees and Buildings; Watson, G.W., Neely, D., Eds.; International Society of Arboriculture: Champaign, IL, USA, 1995. [Google Scholar]
- Smiley, E.T.; Calfee, L.; Fraedrich, B.R.; Smiley, E.J. Comparison of structural and noncompacted soils for trees surrounded by pavement. Arboric. Urban For. 2006, 32, 164–169. [Google Scholar]
- Roberts, J.; Jacksn, N.; Smith, M. Tree Roots in the Built Environment; Centre for Ecology and Hydrology (CEH): Crown, UK, 2006. [Google Scholar]
- Ferrara, C.; Barone, P.M.; Pettinelli, E.; Salvati, L. Ground Penetrating Radar as a remote-sensing approach to investigate the root system architecture beneath the soil. Appl. Ecol. Environ. Res. 2014, 12, 695–702. [Google Scholar] [CrossRef]
- Ferrara, C.; Salvati, L.; Barone, P.M. Tree root system imaging using Ground Penetrating Radar. Ann. Silvic. Res. 2017, 41, 80–83. [Google Scholar] [CrossRef]
- Barone, P.M. Understanding Buried Anomalies: A Practical Guide to GPR; LAP Lambert Academic Publishers: Saarbrücken, Germany, 2016. [Google Scholar]
- Barone, P.M.; Ferrara, C.; Di Maggio, R.; Salvati, L. When the Crime Scene Is the Road: Forensic Geoscience Indicators Applied to Road Infrastructure and Urban Greening. Geosciences 2016, 6, 50. [Google Scholar] [CrossRef]
- Haala, N.; Brenner, C. Extraction of buildings and trees in urban environments. ISPRS J. Photogramm. Remote Sens. 1999, 54, 130–137. [Google Scholar] [CrossRef]
- Wu, Y.; Guo, L.; Cui, X.; Chen, J.; Cao, X.; Lin, H. Ground Penetrating Radar-based automatic reconstruction of three-dimensional coarse root system architecture. Plant Soil 2014, 383, 155–172. [Google Scholar] [CrossRef]
- Butnor, J.R.; Stover, D.B.; Roth, B.E.; Johnsen, K.H.; Day, F.P.; McInnis, D. Using Ground-Penetrating Radar to Estimate Tree Root Mass: Comparing Results from Two Florida Surveys. In Handbook of Agricultural Geophysics; Allred, B.J., Daniels, J.J., Ehsani, M.R., Eds.; CRC Press: Taylor & Francis Group: Boca Raton, FL, USA, 2008. [Google Scholar]
- Ferrara, C.; Barone, P.M.; Steelman, C.; Pettinelli, E.; Endres, A.L. Monitoring shallow soil water content under natural field conditions using the early-time GPR signal technique. Vadose Zone J. 2013, 12. [Google Scholar] [CrossRef]
- Stover, D.; Day, F.P.; Butnor, J.R.; Drake, B.G. Effect of elevated CO2 on coarse-root biomass in Florida scrub detected by ground-penetrating radar. Ecology 2007, 88, 1328–1334. [Google Scholar] [CrossRef]
- Hruška, J.; Cermák, J.; Sustek, S. Mapping tree root system with ground-penetrating radar. Tree Physiol. 1999, 19, 125–130. [Google Scholar] [CrossRef] [PubMed]
- Cermák, J.; Hruška, J.; Martinková, M.; Prax, A. Urban tree root systems and their survival near houses analyzed using ground penetrating radar and sap flow techniques. Plant Soil 2000, 219, 103–116. [Google Scholar] [CrossRef]
- Annan, A.P. Ground Penetrating Radar: Principles, Procedures & Applications; Technical paper; Sensors & Software, Inc.: Mississauga, ON, Canada, 2004. [Google Scholar]
- Jol, H.M. Ground Penetrating Radar: Theory and Applications; Elsevier Science: Amsterdam, The Netherlands; Oxford, UK, 2009. [Google Scholar]
- Persico, R. Introduction to Ground Penetrating Radar: Inverse Scattering and Data Processing; Wiley-IEEE Press: Hoboken, NJ, USA, 2014; ISBN 978-1118305003. [Google Scholar]
- Pettinelli, E.; Barone, P.M.; Mattei, E.; Lauro, S.E. Radio wave techniques for non-destructive archaeological investigations. Contemp. Phys. 2009, 52, 121–130. [Google Scholar] [CrossRef]
- Malinovski, R.A.; Nutto, L.; Wiese, W.S.; Brunsmeier, M. Non-destructive analysis of the root system and tree growth parameters. Revista Árvore 2016, 40, 289–295. [Google Scholar] [CrossRef]
- Li, W.; Wen, J.; Xiao, Z.; Xu, S. Application of Ground-Penetrating Radar for Detecting Internal Anomalies in Tree Trunks with Irregular Contours. Sensors 2018, 18, 649. [Google Scholar] [CrossRef]
- Xiao, X.; Wen, J.; Xiao, Z.; Li, W. Detecting and Measuring Internal Anomalies in Tree Trunks Using Radar Data for Layer Identification. J. Sens. 2018, 2, 1–11. [Google Scholar] [CrossRef]
- Ježová, J.; Mertens, L.; Lambot, S. Ground-penetrating radar for observing tree trunks and other cylindrical objects. Constr. Build. Mater. 2016, 123, 214–225. [Google Scholar] [CrossRef]
- Takahashi, K.; Aoike, K. Estimation of average electromagnetic wave velocity in tree trunks for the reflection imaging by GPR. In Proceedings of the EAGE-HAGI 1st Asia Pacific Meeting on Near Surface Geoscience and Engineering, Yogyakarta, Indonesia, 9–13 April 2018. [Google Scholar] [CrossRef]
- Leigh, D. SWOT Analysis. In Handbook of Improving Performance in the Workplace; Silber, K.H., Foshay, W.R., Watkins, R., Leigh, D., Moseley, J.L., Dessinger, J.C., Eds.; Wiley and Sons, Inc.: Hoboken, NJ, USA, 2009. [Google Scholar]
- Zheng, Y.; Jiang, F. SWOT Analysis of Urban Greening Maintenance and Management in the Central Pearl River Delta. USA-China Sci. Cult. Media Corp. 2013, 5, 1–3. [Google Scholar]
- Roma Capitale, Bilancio Arboreo, Dipartimento Tutela Ambientale. Available online: https://www.comune.roma.it/web/it/scheda-servizi.page?contentId=INF70550&stem=verde_urbano (accessed on 25 May 2019).
Figure 1.
In this figure, it is possible to localize three areas of the GPR investigations.

Figure 2.
This figure shows two illustrative radargrams within the investigated area (below), in which it is possible to see how much, for the entire width of the road, the works related to modern subservices at various depths (between 0.1 m and 0.6 m, approximately) have intruded upon the likely area of the roots.

Figure 3.
The subservice works can be noted due to the different asphalts used to cover the road, especially through the presence of several manholes.
Figure 3.
The subservice works can be noted due to the different asphalts used to cover the road, especially through the presence of several manholes.

Figure 4.
Map distribution of the area investigated by the NOGGIN at different depths (from about 7 cm to 40 cm); note the high level of amplitude due the subservices that probably cut the roots in depth.
Figure 4.
Map distribution of the area investigated by the NOGGIN at different depths (from about 7 cm to 40 cm); note the high level of amplitude due the subservices that probably cut the roots in depth.

Figure 5.
Similar to Figure 2, it is possible to see how much, with respect to the entire width of the road, the works related to modern subservices at various depths (between 0.1 m and 0.7 m, approximately) intruded upon the likely area of the roots. Note that the central part of these radargrams will be missed in the FINDAR (see Figure 6) because it collected only two almost contiguous areas (the two red squares in the picture below).

Figure 6.
Furthermore, the points noticed in the data acquired by the NOGGIN system can be deduced from the data acquired by the FINDAR system. Here, the detail of the first 0.70 m (well defined in the NOGGIN) has a lower resolution. However, a series of anomalies not related as much to the roots as to the work of the subservices can be identified. Note that unlike the NOGGIN, two 5 × 5 areas were acquired and the central part (visible in the NOGGIN acquisition) was missing.

Figure 7.
Map distribution of the area investigated by the NOGGIN at different depths (from about 0.09 m to 0.45 m); note the subservices that probably cut the roots in depth at the side of the street.
Figure 7.
Map distribution of the area investigated by the NOGGIN at different depths (from about 0.09 m to 0.45 m); note the subservices that probably cut the roots in depth at the side of the street.

Figure 8.
Map distribution of the area investigated by the FINDAR at different depths (from about 0.09 m to 0.45 m); note the missing data that is also indicated in Figure 6.
Figure 8.
Map distribution of the area investigated by the FINDAR at different depths (from about 0.09 m to 0.45 m); note the missing data that is also indicated in Figure 6.

Figure 9.
(a) A moment of the vertical acquisition with the NOGGIN system; (b) schematic reconstruction to understand the presence or absence of a cavity inside a trunk; (c) the investigation showing good homogeneity on the inside of the trunk with no cavities and clearly visible thickness (about 0.70 m in this case); and (d) the 0.90 m thickness of the trunk and an anomaly of around 0.40 m (yellow circle). In this case, the GPR acquired data very close to the cavity, which was visible from the outside, and the cone of radiation intercepted it.

Figure 10.
According to an initial analysis of the radargrams, it is possible to notice how the root system was below by about 0.20 m (thickness of the sidewalk) with evident hyperbolas.
Figure 10.
According to an initial analysis of the radargrams, it is possible to notice how the root system was below by about 0.20 m (thickness of the sidewalk) with evident hyperbolas.

Figure 11.
Map distribution of the roots (white rectangles) at a depth of about 0.25 m. At the same depth, in the south-western zone, the GPR detected less evident elongated anomalies (possible finer roots) than in both the south-eastern and north-eastern zones (possible thicker roots). Note that the lower image merely illustrates the investigated area linked to the GPR results.

Figure 12.
This figure illustrates a pseudo-3D reconstruction of the subsoil and the tree root architecture. By navigating above and below, in-depth reconstruction of the roots’ geometry was possible.
Figure 12.
This figure illustrates a pseudo-3D reconstruction of the subsoil and the tree root architecture. By navigating above and below, in-depth reconstruction of the roots’ geometry was possible.

Figure 13.
After uprooting the pine, it was possible to notice, a posteriori, the presence and the geometry of the subsurface root system as well as the correct depths identified by the non-destructive GPR investigations.
Figure 13.
After uprooting the pine, it was possible to notice, a posteriori, the presence and the geometry of the subsurface root system as well as the correct depths identified by the non-destructive GPR investigations.

Figure 14.
The comparison of the radargrams collected with both the FINDAR and NOGGIN systems shows that the main root system did not penetrate more than 0.30–0.40 m deep into the subsoil. Moreover, the other deeper anomalies were related to various cables and subservices present on the site.
Figure 14.
The comparison of the radargrams collected with both the FINDAR and NOGGIN systems shows that the main root system did not penetrate more than 0.30–0.40 m deep into the subsoil. Moreover, the other deeper anomalies were related to various cables and subservices present on the site.

Figure 15.
On comparing the measurements made with the same instrument (FINDAR) in 2017 and 2018, it is possible to note that, in the first case, the north-western roots were visible in the subsoil at about 0.25 m, and in the second case, the same roots were visible at about a depth of 0.15 m. Note that the dark-grey areas are the ones in which the GPR has collected no data.

Figure 16.
Even the NOGGIN measurements at the same area confirmed the presence of the north-western roots, around the pine, at a depth of about 0.15 m. Note that: i) the visible anomalies on the western side of the GPR map are due to the various and superficial cables and services, and ii) the white areas are the ones in which the GPR has collected no data.

Figure 17.
The partial pseudo-3D reconstruction confirmed the results of the GPR investigations.

Figure 18.
Four profiles were vertically performed every 90° (top right). Additionally, the investigation showed the homogeneity of the inside of the trunk with no cavities and confirmed the estimation of the diameter at about 0.85 m.
Figure 18.
Four profiles were vertically performed every 90° (top right). Additionally, the investigation showed the homogeneity of the inside of the trunk with no cavities and confirmed the estimation of the diameter at about 0.85 m.

Figure 19.
To better evaluate and discuss the whole research project, a SWOT analysis was created highlighting internal strengths and weaknesses, and external opportunities and threats.
Figure 19.
To better evaluate and discuss the whole research project, a SWOT analysis was created highlighting internal strengths and weaknesses, and external opportunities and threats.

© 2019 by the authors. Licensee MDPI, Basel, Switzerland. This article is an open access article distributed under the terms and conditions of the Creative Commons Attribution (CC BY) license (http://creativecommons.org/licenses/by/4.0/).
Share and Cite
MDPI and ACS Style
Barone, P.M.; Ferrara, C. A posteriori GPR Evaluation of Tree Stability: A Case Study in Rome (Italy). Remote Sens. 2019, 11, 1301. https://doi.org/10.3390/rs11111301
AMA Style
Barone PM, Ferrara C. A posteriori GPR Evaluation of Tree Stability: A Case Study in Rome (Italy). Remote Sensing. 2019; 11(11):1301. https://doi.org/10.3390/rs11111301
Chicago/Turabian StyleBarone, Pier Matteo, and Carlotta Ferrara. 2019. "A posteriori GPR Evaluation of Tree Stability: A Case Study in Rome (Italy)" Remote Sensing 11, no. 11: 1301. https://doi.org/10.3390/rs11111301
Note that from the first issue of 2016, this journal uses article numbers instead of page numbers. See further details here.