Spatiotemporal Patterns of Urban Land Use Change in Typical Cities in the Greater Mekong Subregion (GMS)


1
Key Laboratory of Watershed Geographic Sciences, Nanjing Institute of Geography and Limnology, Chinese Academy of Sciences, Nanjing 210008, China
2
International Ecosystem Management Partnership, United Nations Environment, Beijing 100101, China
3
United Nations Environment, United Nations Avenue, Gigiri, PO Box 30552, Nairobi 00100, Kenya
4
Institute of Remote Sensing and Digital Earth, Chinese Academy of Sciences, Beijing 100094, China
5
Technology and Engineering Center for Space Utilization, Chinese Academy of Sciences, Beijing 100094, China
*
Author to whom correspondence should be addressed.
Remote Sens. 2019, 11(7), 801; https://doi.org/10.3390/rs11070801
Submission received: 30 January 2019
/
Revised: 20 March 2019
/
Accepted: 30 March 2019
/
Published: 3 April 2019
Abstract
:The Greater Mekong Subregion (GMS) has experienced rapid economic growth and urbanization. However, few studies have paid attention to urban land use dynamics, especially spatiotemporal patterns of urban expansion and land use change, in this region. This research aimed to conduct a comprehensive study of urban land use change in Xishuangbanna, Yangon, Vientiane, Phnom Penh, Bangkok, and Ho Chi Minh City, from 1990 to 2015. The analysis was based on land use maps derived from Landsat satellite products and employed urban expansion intensity, sector analysis, gradient-direction analysis, and landscape metrics. The results show Xishuangbanna, Yangon, Vientiane, Phnom Penh, Bangkok, and Ho Chi Minh City all experienced dramatic urban expansion and land use change since 1990, with urban expansion intensities of 15.01, 5.26, 9.15, 1.56, 11.88 and 11.91, respectively. The landscape metrics analysis indicated that urban areas were always aggregated and self-connected, while other land use types showed trends of disaggregation and fragmentation. In the process of urban expansion, paddy and natural land use types were commonly transformed to built up area. The results further reveal several common issues in urban land use, e.g., land fragmentation and loss of natural land use types. Finally, the discussion on the relationship between government policy and land use change for these cities shows land reform and attitude toward foreign direct investments played important roles in urban land use change in GMS.
1. Introduction
Under the increasing trend of globalization, over half of the world’s population (54%) lives in urban areas and most urbanized regions are distributed in Northern America, Latin America, the Caribbean, and Europe. In contrast, Africa and Asia remain mostly rural, with only 40% and 48% of their respective populations living in urban areas. According to the prediction of the United Nations, the world is expected to urbanize further in the coming decades. Africa and Asia are going to experience faster urbanization in the near future [1].
The Greater Mekong Subregion (GMS), which includes Cambodia, China (Yunnan Province and Guangxi Zhuang Autonomous Region), Lao PDR, Myanmar, Thailand, and Vietnam, covers 2.6 million square kilometers and has a combined population of around 326 million. In 1992, with assistance from the Asian Development Bank (ADB), the six countries entered into a program of sub-regional economic cooperation, designed to enhance economic relations among the countries [2]. Since the 1990s, GMS has experienced rapid economic growth, which has led to significant urban development and land use change.
With the development of Earth observation techniques, land use and land cover (LULC) change is playing an important role in global change, Earth systems, and sustainable development [3,4,5]. The research on urban land use change has not only revealed spatial and temporal characteristics of urban expansion or land use dynamics, but has also provided support and evidence to address serious environmental issues threatening urban sustainable development [6,7,8,9,10]. Using land use maps, urban planners and policy makers could avoid negative impacts associated with urban expansion. Although GMS covers a large extent, various climate zones and eco-regions, and offers an extremely interesting area from all imaginable application fields related to Earth observation, not many LULC studies have been published [11]. Among the few studies of LULC in the GMS, most are undertaken at the sub-regional, national, sub-national, or basin level [12,13,14,15,16,17,18,19]. For example, the Mekong River Commission (MRC) developed a land cover map of the Lower Mekong Basin for 2010, considering the importance of land cover maps for sustaining human-dependent livelihood and maintaining ecological integrity [20]. Studies at such levels always focus on single land use types, e.g., agriculture, forest, or economic plantation [21,22,23,24].
Most countries in the GMS share a historical and colonial legacy followed by decades of war and periods of economic stagnation and transition. As a result of historical trajectories and policy orientation, economic development and population concentration in GMS have mostly occurred in large cities [25]. For example, Phnom Penh, the capital of Cambodia, accounted for more than half of the urban population of the whole country in 2015 [26]. Given the significant role of large cities in GMS countries, researchers have started to pay attention to urban land use and related issues, such as congestion, environmental pollution, and ecosystem deterioration [27,28,29,30,31]. Wang et al. characterized patterns of land use change in Yangon in 1987, 2000, and 2015, using Landsat images, and examined the impacts of land use change on land surface temperature [32]. Ali et al. investigated carbon sources and carbon sink, based on land use maps of Bangkok in 1987, 1995, 2005, and 2015, and they also addressed the significance of urban planning [33]. By integrating public optical and radar images, Goldblatt et al. acquired built up maps of Ho Chi Minh City and explored the relationship between built up patches and the distribution of population [34]. These studies provide explicit analyses on urban land use issues of individual cities. However, to achieve sustainable development, large cities in the GMS will need to play not only individual but collective roles to generate local growth, contribute to national welfare, and promote regional development [25]. Thus, comprehensive studies, addressing both individual and common features of land use change in the large cities, should be highlighted in the next step.
Our previous study has provide a specific analysis on urban expansion and land use dynamics in Xishuangbanna, using multiple analytical tools such as sector analysis, landscape metrics, and gradient-direction analysis [35]. On this basis, the objective of this paper is to exhibit land use change in the typical cities in the GMS, and more importantly, to further explore common land use issues and policy implications among these cities. The typical cities in this study are either the primary city in each country or a unique city that plays a significant role with respect to geographical location, political importance, or economy. Overall, we attempted: (1) to characterize land use change of typical cities in the GMS, including Xishuangbanna, Yangon, Vientiane, Phnom Penh, Bangkok, and Ho Chi Minh City; (2) to depict spatiotemporal characteristics of urban expansion in these cities; (3) to analyze landscape pattern change of these cities; (4) to reveal the impact of urban expansion on other land use types; and (5) to discuss common land use issues that should be addressed in the process of urban development in the GMS, and policy implications on urban land use change.
2. Materials and Methods
2.1. Study Area
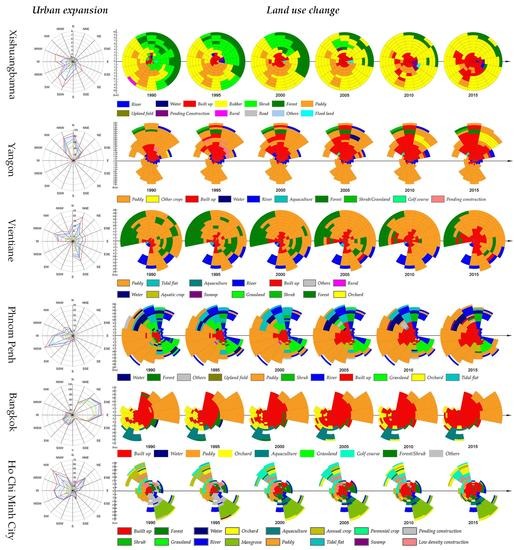
We selected six cities (one city from each country) as the study area in the GMS: Xishuangbanna Dai Autonomous Prefecture in Yunnan Province, China; Yangon, Myanmar; Vientiane, Lao PDR; Phnom Penh, Cambodia; Bangkok, Thailand; and Ho Chi Minh City, Vietnam (Figure 1). Among these cities, Vientiane, Yangon, Bangkok, Phnom Penh, and Ho Chi Minh City are all primary cities in their countries, whereas Xishuangbanna is a key corridor located along the Lancang-Mekong River, connecting China and the Lower Mekong countries.
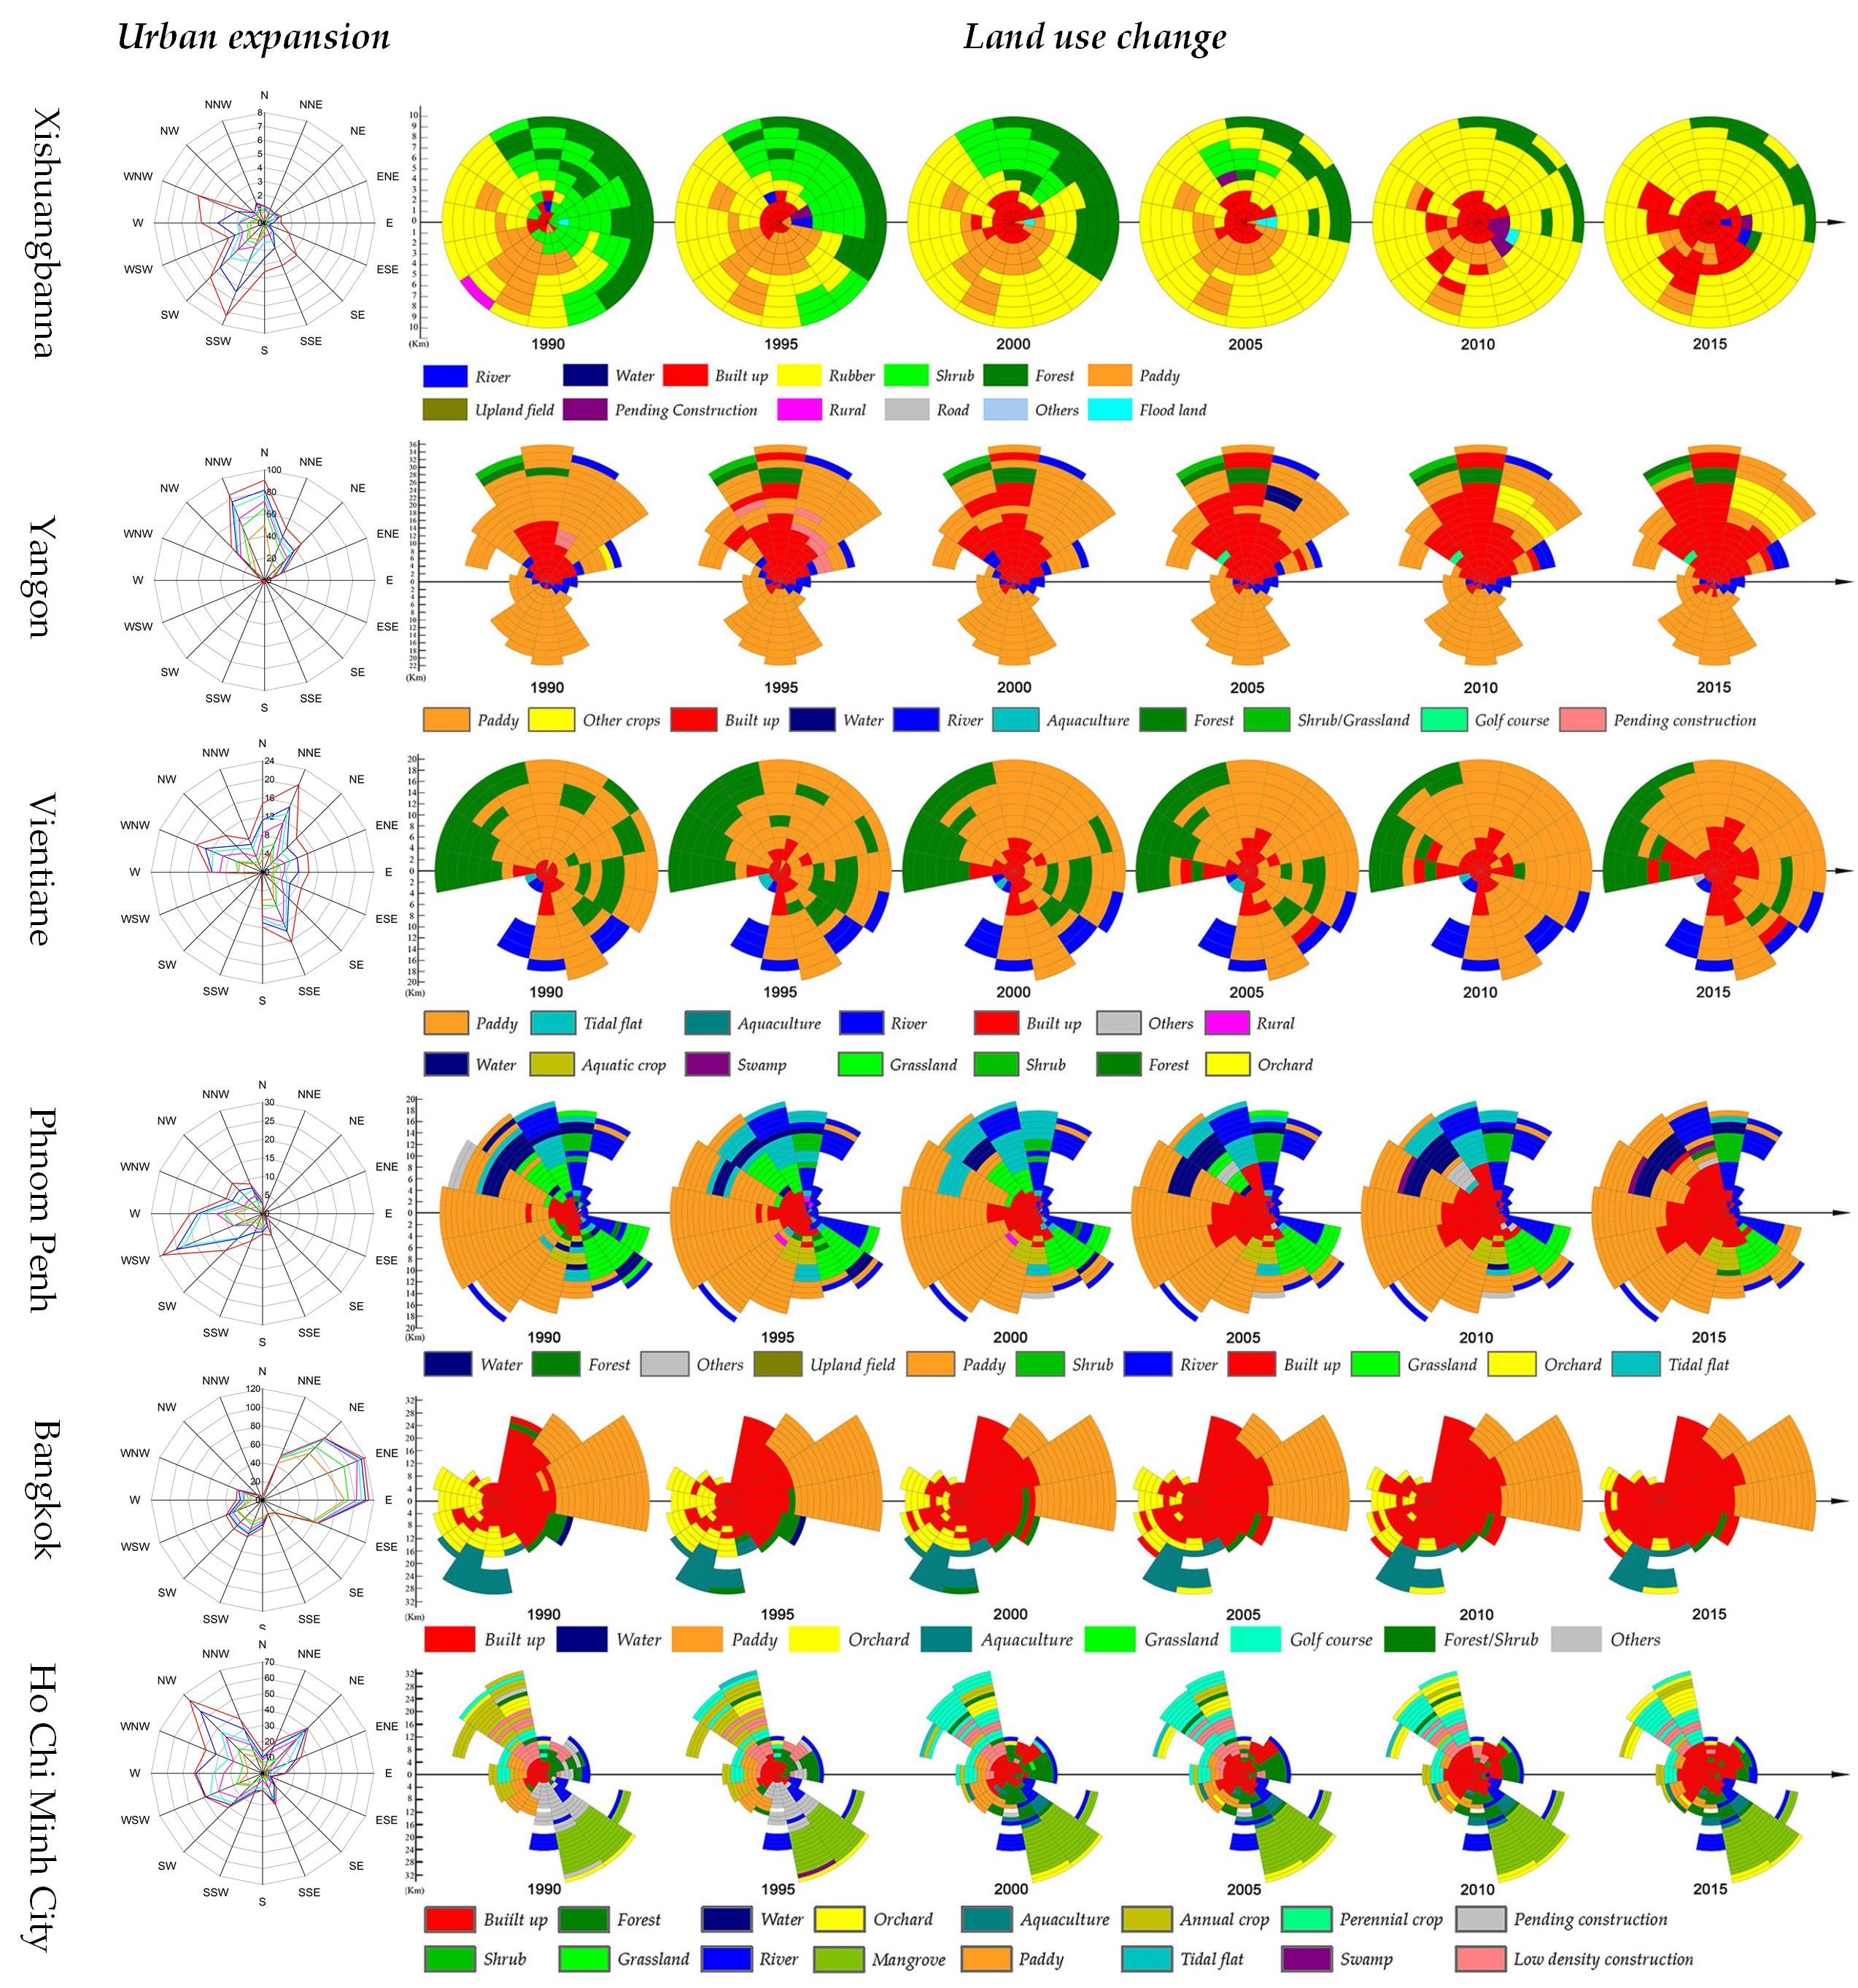
Xishuangbanna is located between latitudes 21°10′ and 22°40′N, and longitudes 99°55′ and 101°50′E, and includes one city (Jinghong) and two counties (Menghai and Mengla). It covers about 19120 km2, with attitude varying from 475 m to 2430 m above sea level [35]. Yangon lies at east of the Ayeyarwaddy River delta in Myanmar, and covers 2934.58 km2. The average annual temperature is 27.4 °C, and April is the warmest month of the year, with an average temperature of 30.7 °C [32]. Vientiane is the capital of Lao PDR and covers approximately 3583 km2. It is located on the left bank of the Mekong River, and borders to Nong Khai Province of Thailand on the south. The annual average rainfall of Vientiane is 1660.5 mm [36]. Phnom Penh is situated on the banks of the Mekong River, Tonle Sap River, and Bassac River, and surrounded by the typical Cambodian flood plain. As the capital of Cambodia, Phnom Penh is also the center of economy, culture, politics and transport [37]. Bangkok Metropolitan Area (hereinafter referred to as Bangkok) is the capital of Thailand, and covers almost 1500 km2. It is also the largest hub of transportation, commercialization, services and tourism in Thailand. The average maximum and minimum temperatures are 34 °C and 25.25 °C, respectively [33]. Ho Chi Minh City, once known as Saigon, is located in the southern part of Vietnam and covers about 2094 km2. It is the financial capital and the prime economic hub of Vietnam with more than eight million inhabitants [38]. These six cities have all experienced rapid urbanization and population growth (Figure 2), and showed significant importance in their countries in the past decades.
2.2. Data Processing
In this study, six periods (1990, 1995, 2000, 2005, 2010, and 2015) of land use maps were produced based on Landsat TM/ETM+/OLI imagery (http://glovis.usgs.gov). To improve classification accuracy, images of both dry season and wet season at each year for most typical cities were acquired.
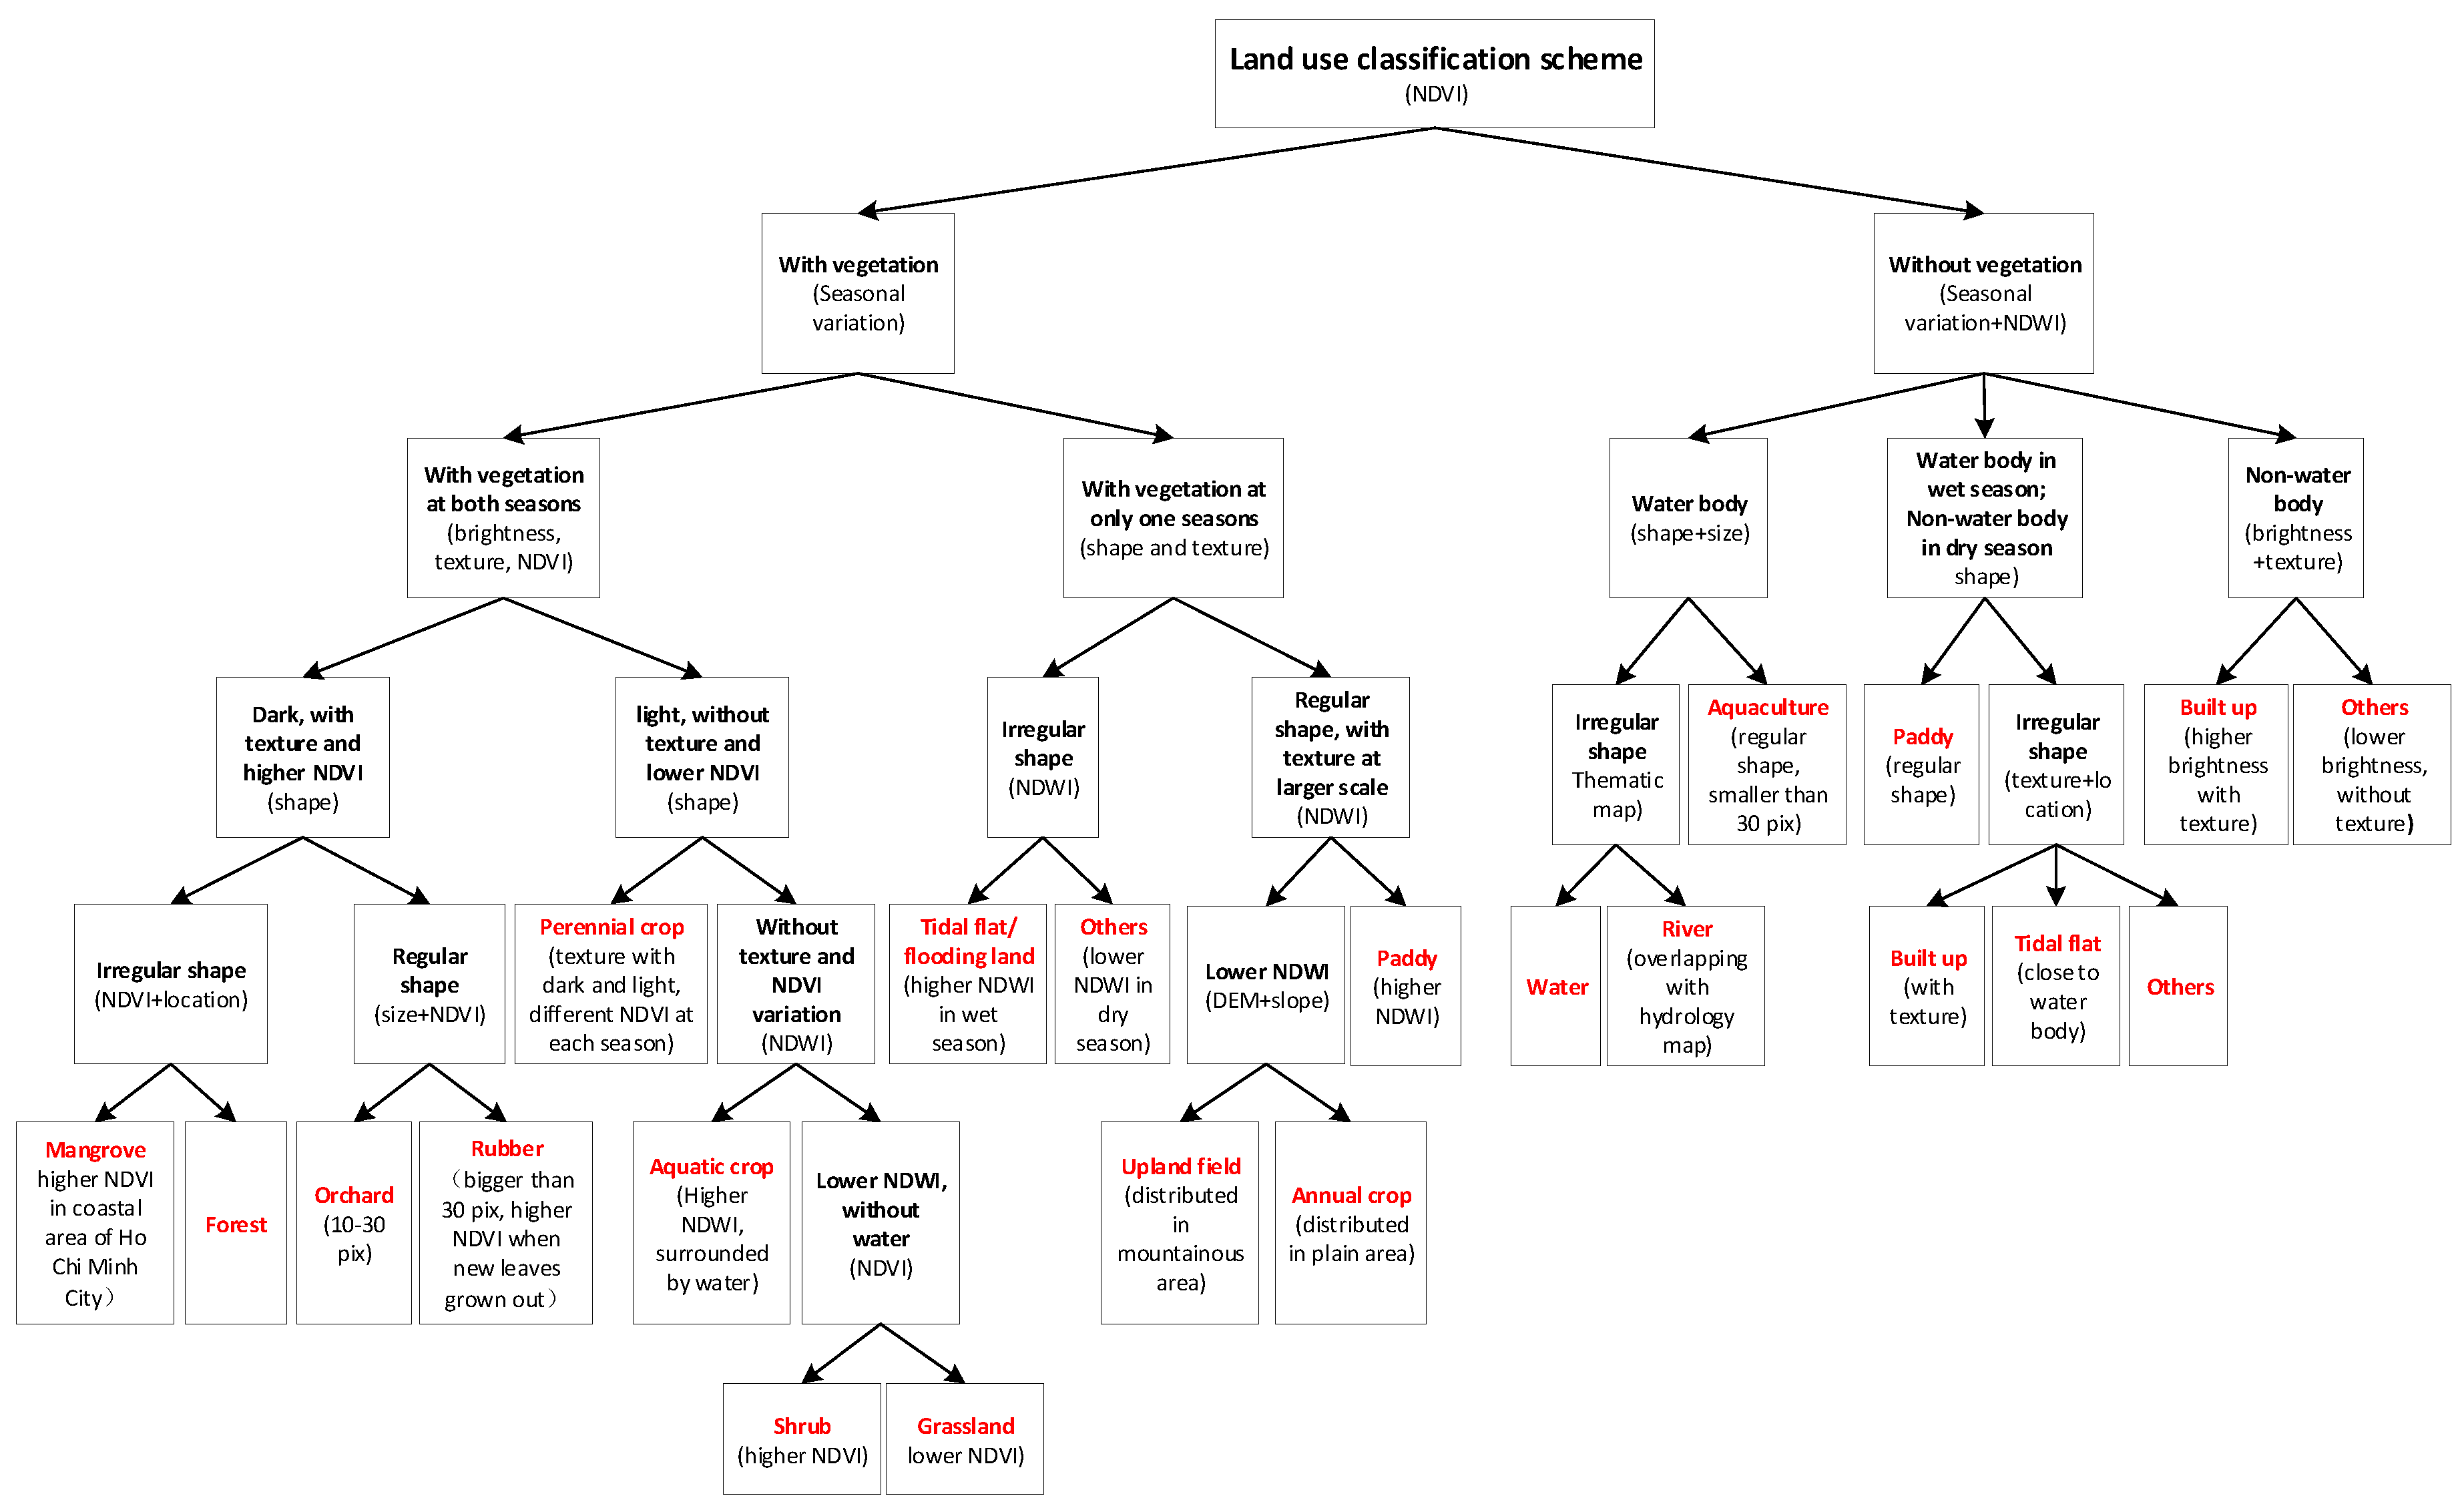
Totally, more than 150 Landsat images (see Table A1 in Appendix A), mostly L1T level with systematical, radiometrical, geometrical, and topographical correction, were downloaded for the cities. Non-L1T images were ortho-rectified using Digital Elevation Model (DEM, https://earthexplorer.usgs.gov/) and the existing L1T images. The images of the typical cities for each period were then acquired using the approaches of band composition, image mosaicking, and clipping. Before band composition, the thermal infrared band and panchromatic band were excluded to obtain the uniform resolution (30 m). Land use types were mainly defined under the FAO Land Cover Classification System [42]. Given the variation in geographical context, land use types for typical cities were not exactly same as one another, but they usually had common land use types, such as built up area, forest, paddy, etc. Image interpretation followed the land use classification scheme in Figure 3 and was carried out using the object-based classification software eCognition Developer 8.7 [43]. The object-based classification in eCognition Developer consists of two steps (see an example of land use classification approaches in Appendix B). The first step is the production of segments, which serve as the basic units for further analysis. Segmentation performance was evaluated in Table A2 in Appendix B. The next step is to categorize these objects according to their attributes, such as shape, texture, color, and relative position to other objects. Visual modification was employed to improve classification results. Finally, accuracy assessment was implemented based on sample points from field survey and Google Earth. We adopted the stratified sampling method and ensured each land use type would include at least 10 sample points. The overall accuracy and kappa values are listed in Table 1.
2.3. Methodology
2.3.1. Urban Expansion Intensity
The urban expansion intensity (UEI) is an important indicator that reflects the urban expansion rate or speed at different periods [44,45,46]. UEI is the ratio of built up area change per unit time:
where UEIt~t+n is the urban expansion intensity from time t to time t + n and ULAt and ULAt+n represent built up area at time t and time t + n, respectively.
2.3.2. Sector Analysis
The sector analysis is effective for characterizing spatial distributions in various land use types in terms of orientation relative to a pre-defined urban center [47,48,49]. In this study, sector analysis was used to analyze spatial variation in urban expansion for the cities. Firstly, we defined the central point for each typical city (government building of Xishuangbanna Dai Autonomous Prefecture for Xishuangbanna, Independence Monument for Yangon, Patuxai for Vientiane, Grand Palace for Bangkok, Royal Palace for Phnom Penh, and Independence Palace for Ho Chi Minh City), and 16 fans were drawn by extending the rays from each center with intervals of 22.5°. Sector analysis was then be implemented by summarizing the built up area in each fan [50].
2.3.3. Landscape Metrics
Landscape metrics analysis has been widely used to describe land use change that cannot be observed visually. The spatial-temporal change in land use patterns can be detected and characterized using landscape metrics based on the shape, size, number, and other parameters of land use patches derived from remote sensing data [51,52,53,54].
In this study (Table 2), four landscape metrics, namely Landscape Division Index (DIVISION), Patch Cohesion Index (COHESION), Aggregation Index (AI), and Contagion Index (CONTAG), were used to investigate the composition and configuration of major land use types [35]. DIVISION and COHESION quantify the connectivity of the landscape habitat, AI provides a measure of class-specific aggregation, and CONTAG measures both patch interspersion and dispersion at landscape level. High values of COHESION and AI mean the land use type are self-connected and aggregated geographically, whereas a high value of DIVISION means land use patches are dis-connected with each other and vice versa. Generally, a high value of CONTAG indicates that the dominant land use patches are well connected in a landscape, whereas a low value usually means the landscape is more fragmented. All these quantitative analyses were implemented using the landscape pattern analysis software FRAGSTATS (version 4.2) [55].
2.3.4. Gradient-Direction Analysis
Gradient-direction analysis is an upscaling process for summarizing the trend of the spatial-temporal variation of the land use pattern [35]. This method firstly draws several concentric rings over urban areas with a certain interval. The scope of the largest concentric ring should cover the complete urban area, and reach to land use types with less of human activity effect (forest, water body, etc.). Secondly, 16 fans are drawn by extending the rays from urban center with an interval of 22.5°. The concentric rings intersect with those fans and generate a series of segment zones. Finally, each segment zone is represented by the land use type with largest proportion.
3. Results
3.1. Urban Land Use Change
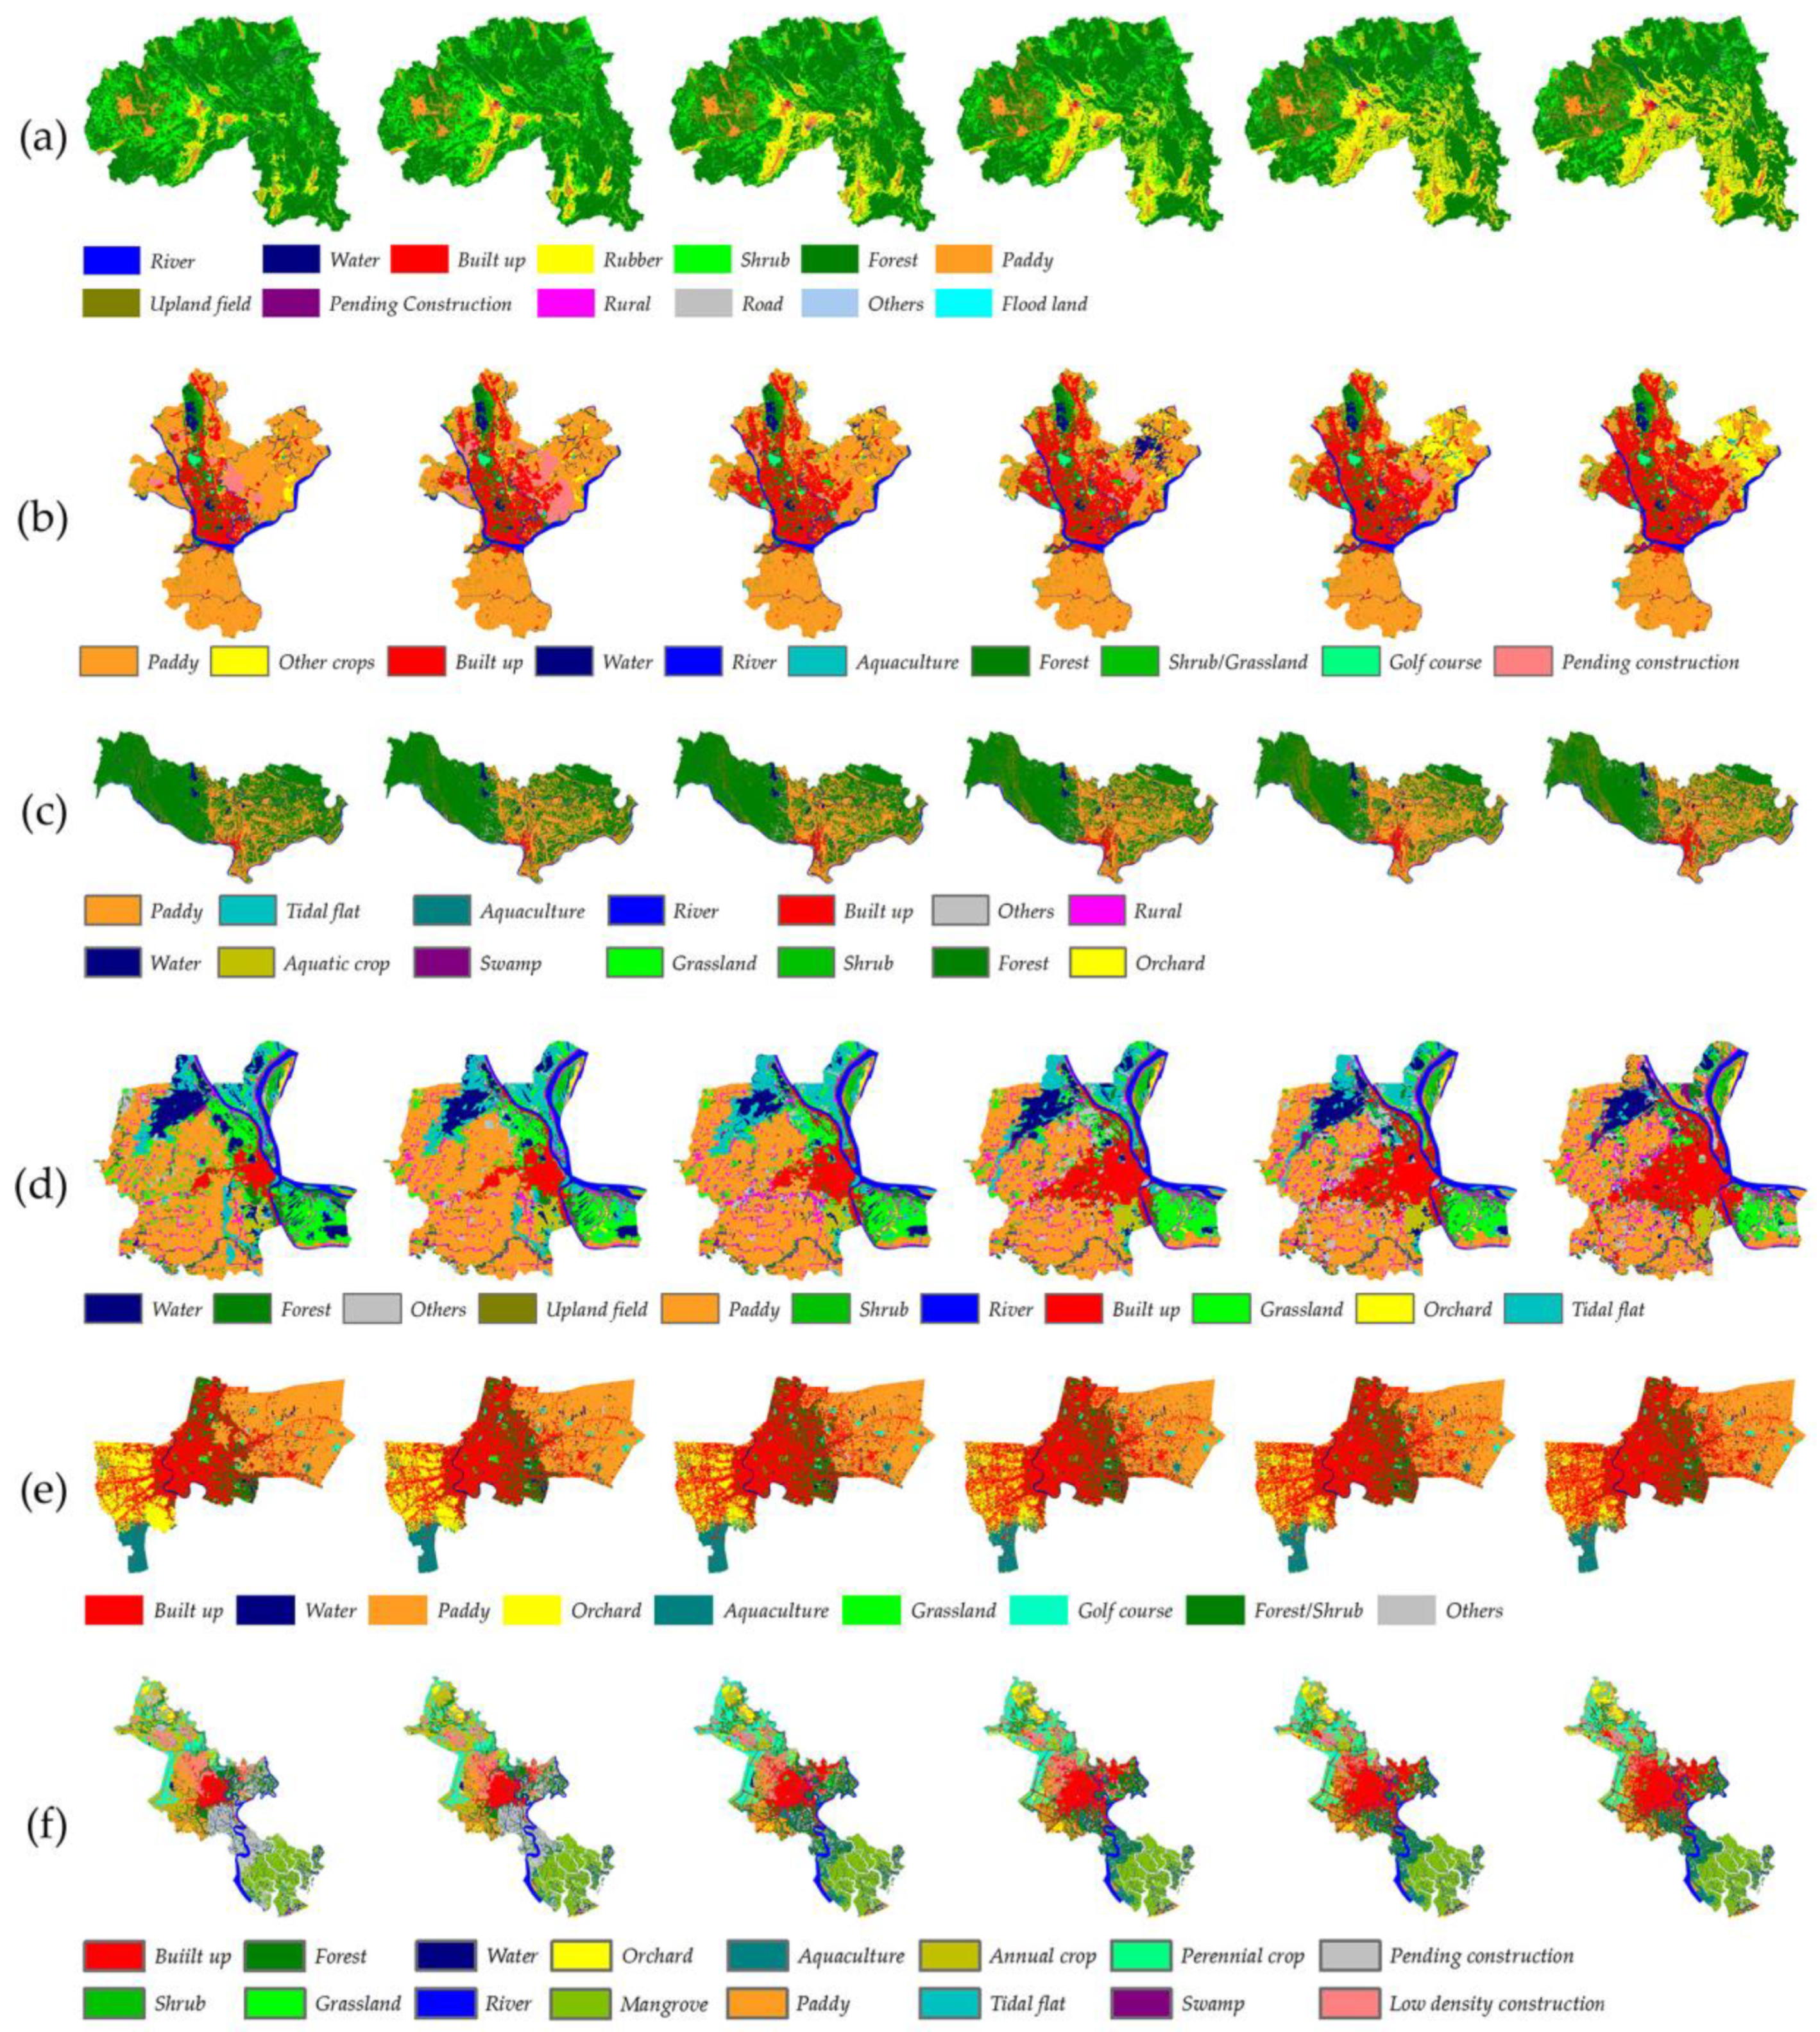
Figure 4 shows the land use maps of the six cities in 1990, 1995, 2000, 2005, 2010, and 2015. These cities all experienced dramatic urban expansion and land use change.
Xishuangbanna is a mountainous city, and has the largest area (approximately 19,120 km2) in this region, which is even larger than the total area of the other five cities. In Xishuangbanna, 13 land use types were classified, including built up (including city proper and towns), river, water (including lake, reservoir, and ponds), pending construction land, rural, road, flood land, rubber, forest, shrub, paddy, upland field, and others (grassland, bare land, and vacant land). As observed in Table 3, forest, rubber, and shrub are the major land use types, which covered more than three-quarters of the whole Xishuangbanna. Forest and shrub area decreased by about 1900 km2 and 2200 km2, respectively, whereas rubber expanded more than 3200 km2, from 1990 to 2015. Paddy remained relatively stable, ranging from 816 km2 to 840 km2 since 1990. Upland field, which was mainly distributed in central Menghai town in the west of Xishuangbanna, increased from 290.44 km2 in 1990 to 777.19 km2 in 2015. Although built up area (40.74 km2) and rural area (10.12 km2) were small compared to the other land use types mentioned above, they increased approximately 4 and 10 times by 2015, respectively. The changes in built up area and rural area indicate that Xishuangbanna has experienced even faster urban expansion, especially since 2005.
The land use types in Yangon were classified as built up, paddy, other crops, water, river, aquaculture, forest, shrub/grassland, golf course, and pending construction (Table 4). Built up and paddy were the major land use types in Yangon. Generally, Yangon was built up along Yangon River, surrounded by a large area of paddy. In 1990, paddy was the dominant land use type, which accounted for approximately 60% of the total area of Yangon, while it decreased to 354 km2 by 2015. Besides paddy, other crops increased quickly after 2005. Built up area expanded more than 200 km2 from 155.42 km2 in 1990 to 359.77 km2 in 2015. The most of the newly increased built up area was paddy. Forest was mainly distributed in Hlawga National Park, and remained stable since 1990. Although aquaculture accounted for a small area of the whole Yangon, it developed significantly from 0.55 km2 to 9.29 km2 by 2015.
In this study, the land use types were classified as built up, water, forest, others (bare land, vacant land, etc.), upland field, paddy, shrub, river, grassland, orchard, and tidal flat. Forest and paddy were the major land use types in Vientiane (Table 5). Since 1990, forest was mainly distributed in mountainous area and decreased from more than 2400 km2 to less than 1800 km2, while paddy spread over the plains areas and increased from about 800 km2 to more than 1000 km2. Vientiane also experienced significant urban expansion, and the built up area increased more than two times from 61.91 km2 in 1990 to 204.4 km2 in 2015. Upland field, distributed among mountainous areas in the west of Vientiane, also increased from 52.07 km2 to nearly 200 km2 in the past years.
Phnom Penh had the smallest area among the cities in this study. In Phnom Penh, 14 land use types were categorized, including built up, paddy, tidal flat, aquaculture, river, others, water, aquatic crop, swamp, grassland, shrub, forest, orchard and rural (Table 6). Paddy was the dominant land use types and it remained stable relatively in the study period. The built up area was only about 30 km2 in 1990. However, it expanded approximately three times by 2015. Tidal flat and grassland were also important land use types in Phnom Penh. However, they decreased from 62.29 km2 and 104.77 km2 to 14.28 km2 and 45.48 km2, respectively, in the past years.
The land use characteristics in Bangkok were relatively simple, with only nine land use types classified: built up, water, paddy, orchard, aquaculture, grassland, golf course, forest/shrub, and others (Table 7). Generally, built up, paddy, orchard, forest/shrub, and aquaculture were the major land use types in Bangkok. As shown in Figure 4e, these major land use types were easily identified geographically: orchard distributed in the west; paddy distributed in the east; forest/shrub mainly remained within the built up area, which was developed in the middle of Bangkok along Chao Phraya River; and aquaculture distributed in the coastal area in the south of Bangkok. As the most developed city in the GMS, Bangkok had the largest built up area. Although the built up area in 1990 already exceeded 500 km2, it expanded about 200 km2 by 2015. Paddy and orchard decreased by about 110 km2 and 90 km2, respectively, from 1990 to 2015, while aquaculture and forest/shrub remained stable.
Ho Chi Minh City had the most complicated landscape characteristics, with 16 land use types classified as: built up, forest, water, orchard, aquaculture, annual crop, perennial crop, mangrove, shrub, grassland, river, land to be used, paddy, tidal flat, swamp, and low density built up (Table 8). Of these land cover types, low density built up reflected a common phenomenon of urban development in Southeast Asia, known as “Desakota” [64]. Ho Chi Minh City has experienced fast urban development, and the built up area increased from 109.09 km2 in 1990 to 433.85 km2 in 2015. Aquaculture also increased significantly, especially since 1995. Annual crop and paddy decreased from 216.38 km2 and 160.63 km2 in 1990 to 92.25 km2 and 80.21 km2 in 2015, respectively, while perennial crop slightly increased and orchard increased from 32.74 km2 to 77.82 km2. Grassland increased gradually from less than 5 km2 in 1990 to more than 45 km2 by 2015. In 1990, there were large areas of land to be used, while the unused land decreased dramatically since 1995. Low density built up area also decreased by about 65 km2 by 2015. Mangrove, the unique land use type distributed in the coastal area in south of Ho Chi Minh City, remained stable in the past 25 years.
3.2. Urban Expansion Dynamics
Table 9 shows the urban expansion intensity (UEI) of the six cities in different years from 1990 to 2015. Generally, Xishuangbanna experienced fastest urban expansion, and the overall UEI exceeded 15. Ho Chi Min City and Phnom Penh shared second place, and their UEIs were close to 12. Since the urbanization level of Bangkok was already high in 1990, the UEI of Bangkok was the smallest among the cities. Ho Chi Minh City had the largest UEI (13.66) from 1995 to 2000, followed by Phnom Penh (11.30) from 2000 to 2005, and Vientiane (11.29) from 1995 to 2000.
As shown in Figure 5a, Xishuangbanna mainly expanded toward the west of northwest and southwest. Since the construction of Xishuangbanna International Airport at the end of 1990, the built up area started to increase in the southwest direction along the Airport Highway. Urban expansion was extremely high from 2005 especially in the two main directions. In 2008, the upgrading of Xishuangbanna International Airport led to further urban expansion toward the southwest. As an important project to attract investments, Jinghong Industry Park was built by the end of 2006. The development of Jinghong Industry Park then accelerated urban expansion in the west-northwest [35].
Considering the geographical context of Yangon, the built up area mainly increased in the northwest and northeast directions. There are two processes of urban expansion: urban sprawl toward the north and north-northwest along the 3rdRoad, Yangon-Mandalay Highway, and Lower Mingalardon Road; and the construction of some satellite projects and industry park in northwest, northeast, and north-northeast.
The urban area of Vientiane was mainly distributed along the Mekong River. Besides the directions of the Mekong River, Vientiane has also expanded toward the north-northwest along national roads over the past 25 years. From 1995 to 2000, Vientiane experienced the fastest urban expansion, and the newly grown built up areas exceeded 34 km2, of which over 15% occurred in the north-northeast direction. Since 1990, urban expansion exceeded 15 km2 in the north-northeast direction.
Phnom Penh mainly developed along the airport and the 4th Road toward the west-southwest. Light industry was one of the pillar industries in Phnom Penh. Since 2000, many light industries moved out from urban area [65] and concentrated toward the southwest and west-southwest in order to save rental costs. Furthermore, their products could be directly transported to Sihanoukville (the important port in Cambodia) using the 4th Road. With environmental deterioration and congestion of the urban core area, the middle class in Phnom Penh tended to move to the peri-urban area. Thus, several satellite projects, which could provide better infrastructure, facilities, and cleaner surroundings, were built to the southwest and northwest of the urban core.
In the study period, Bangkok mainly expanded through converting orchard in the west and paddy in the east. From 1995 to 2000, Bangkok experienced most significant urban expansion, and the newly grown built up areas reached approximately 70 km2. The fastest urban expansion appeared in the northeast and east from 1990 to 2000. Since 2000, the overall expansion slowed down gradually.
The urban area mainly increased in multiple directions in Ho Chi Minh City over the past decades, of which the northwest showed the most significant expanding trend, accounting for nearly 15% of the new built up area. The built up area also increased more than 10% toward the northeast. Ho Chi Minh City significantly expanded outward in the west-northwest and southwest directions. More than 18 km2 of built up area increased in the south-southeast direction.
3.3. Landscape Metrics Analysis
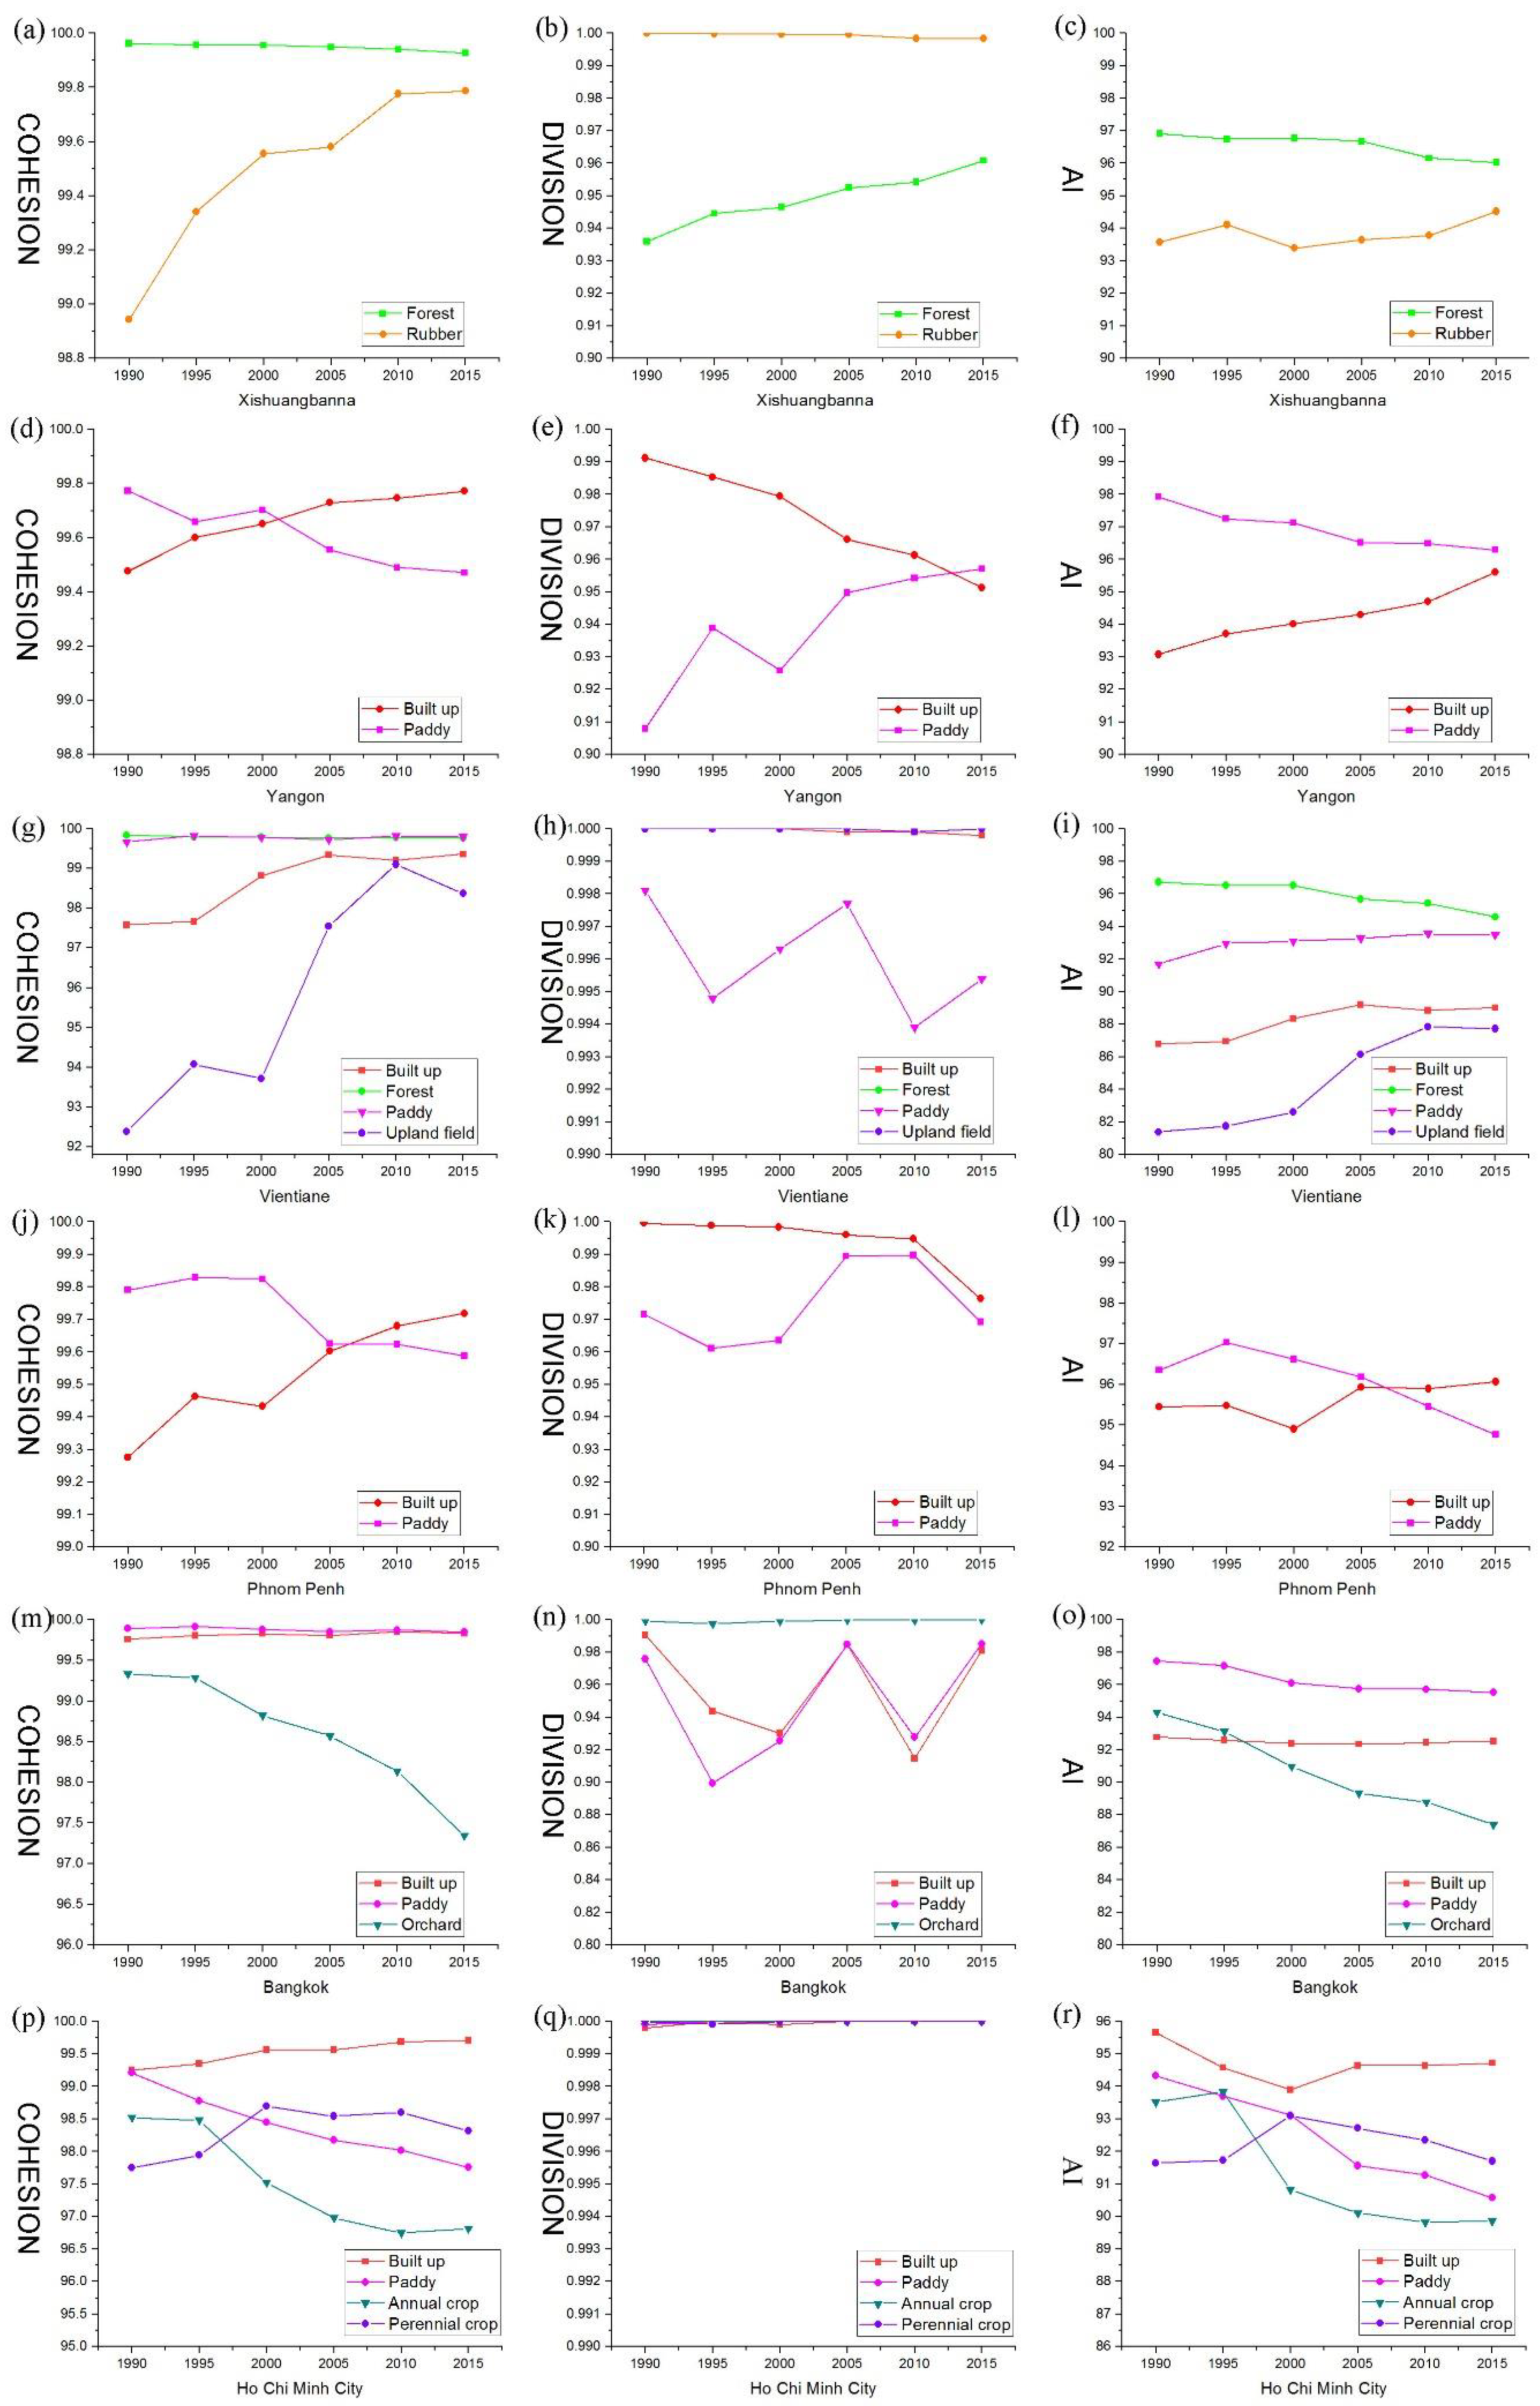
Three landscape metrics, COHESION, DIVISION, and AI, are used to analyze landscape configuration and land use change of major land use types in typical cities in the GMS (Figure 6).
Forest and rubber were the major land use types in Xishuangbanna, and the variation in these two land use types were also closely related to eco-environmental issues, such as land degradation, biodiversity, and wildlife migration. In Xishuangbanna, COHESION and AI of forest decreased from 99.9621 and 96.9081 in 1990 to 99.927 and 96.0264 in 2015, respectively, which means forest had become dis-aggregated. The increasing trend in DIVISION of forest since 1990 indicates that the self-connectivity inside the forest was decreasing. Compared with forest, rubber showed an opposite trend, which means rubber plantations gradually expanded outward from 1990 to 2015.
Paddy and built up area were the major land use types in Yangon, accounting for approximately two-thirds of the whole city. The DIVISION of paddy increased from 0.908 in 1990 to 0.9571 in 2015, while AI continually decreased from 97.9219 to 96.2938. Except for 2000, paddy COHESION also slightly decreased. In the process of urban expansion, COHESION and AI of built up area continually increased, while DIVISION of built declined from 0.9912 in 1990 to 0.9513 in 2015.
In Vientiane, built up, forest, paddy, and upland field were analyzed to explore the landscape configuration. For these land use types, there was no obvious change in DIVISION. The AI of paddy rose from 91.687 in 1990 to 93.5517 in 2010, and then slightly reduced by 2015. Both COHESION and AI of the built up area increased since 1990, indicating that urban patches were self-connected in the process of urban expansion. The COHESION of upland field also increased in the past years except for 2000, and AI of the upland field continually increased, especially after 2000. Forest were dis-aggregated, since the AI of forest decreased.
In Phnom Penh, paddy and built up area experienced the most significant land use change. Generally, landscape metrics of paddy fluctuated from 1990 to 2015, of which COHESION and AI of paddy first increased from 1990 to 1995, and then decreased after 1995. COHESION and AI of built up area also fluctuated, while DIVISION decreased from 1990 to 2015.
Since 1990, urban area mainly expanded toward the east and west in Bangkok, through the transformation of paddy and orchard fields into built up area. For the major land use types (built up, paddy, and orchard), the COHESION of built up and paddy areas fluctuated slightly in the past years, while COHESION of orchard decreased from 99.3332 in 1990 to 97.3439 in 2015. The DIVISION of all three major land use types fluctuated since 1990. The AI of the built up area firstly decreased from 1990 to 2005, and then increased after 2005. Both paddy and orchard were dis-aggregated, since the AI of paddy and orchard continually decreased.
In Ho Chi Minh City, four major land use types, including built up, paddy, annual crop, and perennial crop, were analyzed using landscape metrics. For these land use types, variation in DIVISION was not significant in the study period. For built up area, COHESION showed a slightly increasing trend from 1990 to 2015. The decreasing trend in both COHESION and AI of paddy indicated that paddy became dis-aggregated. COHESION and AI of annual crop showed a similar trend to paddy, while the AI of perennial crops increased from 1990 to 2000, and then decreased since then.
The results of landscape metrics (COHESION, DIVISION, and AI) for the major land use types in the selected cities revealed the variation in self-connectivity and aggregation. Generally, in the process of urban expansion, self-connectivity of built up areas usually increased, and built up patches in some cities also aggregated. Land use types outside the built up areas (such as paddy, forest, orchard, etc.) always showed trends of disaggregation and fragmentation.
3.4. Urban Expansion Impacts on Other Land Use Types
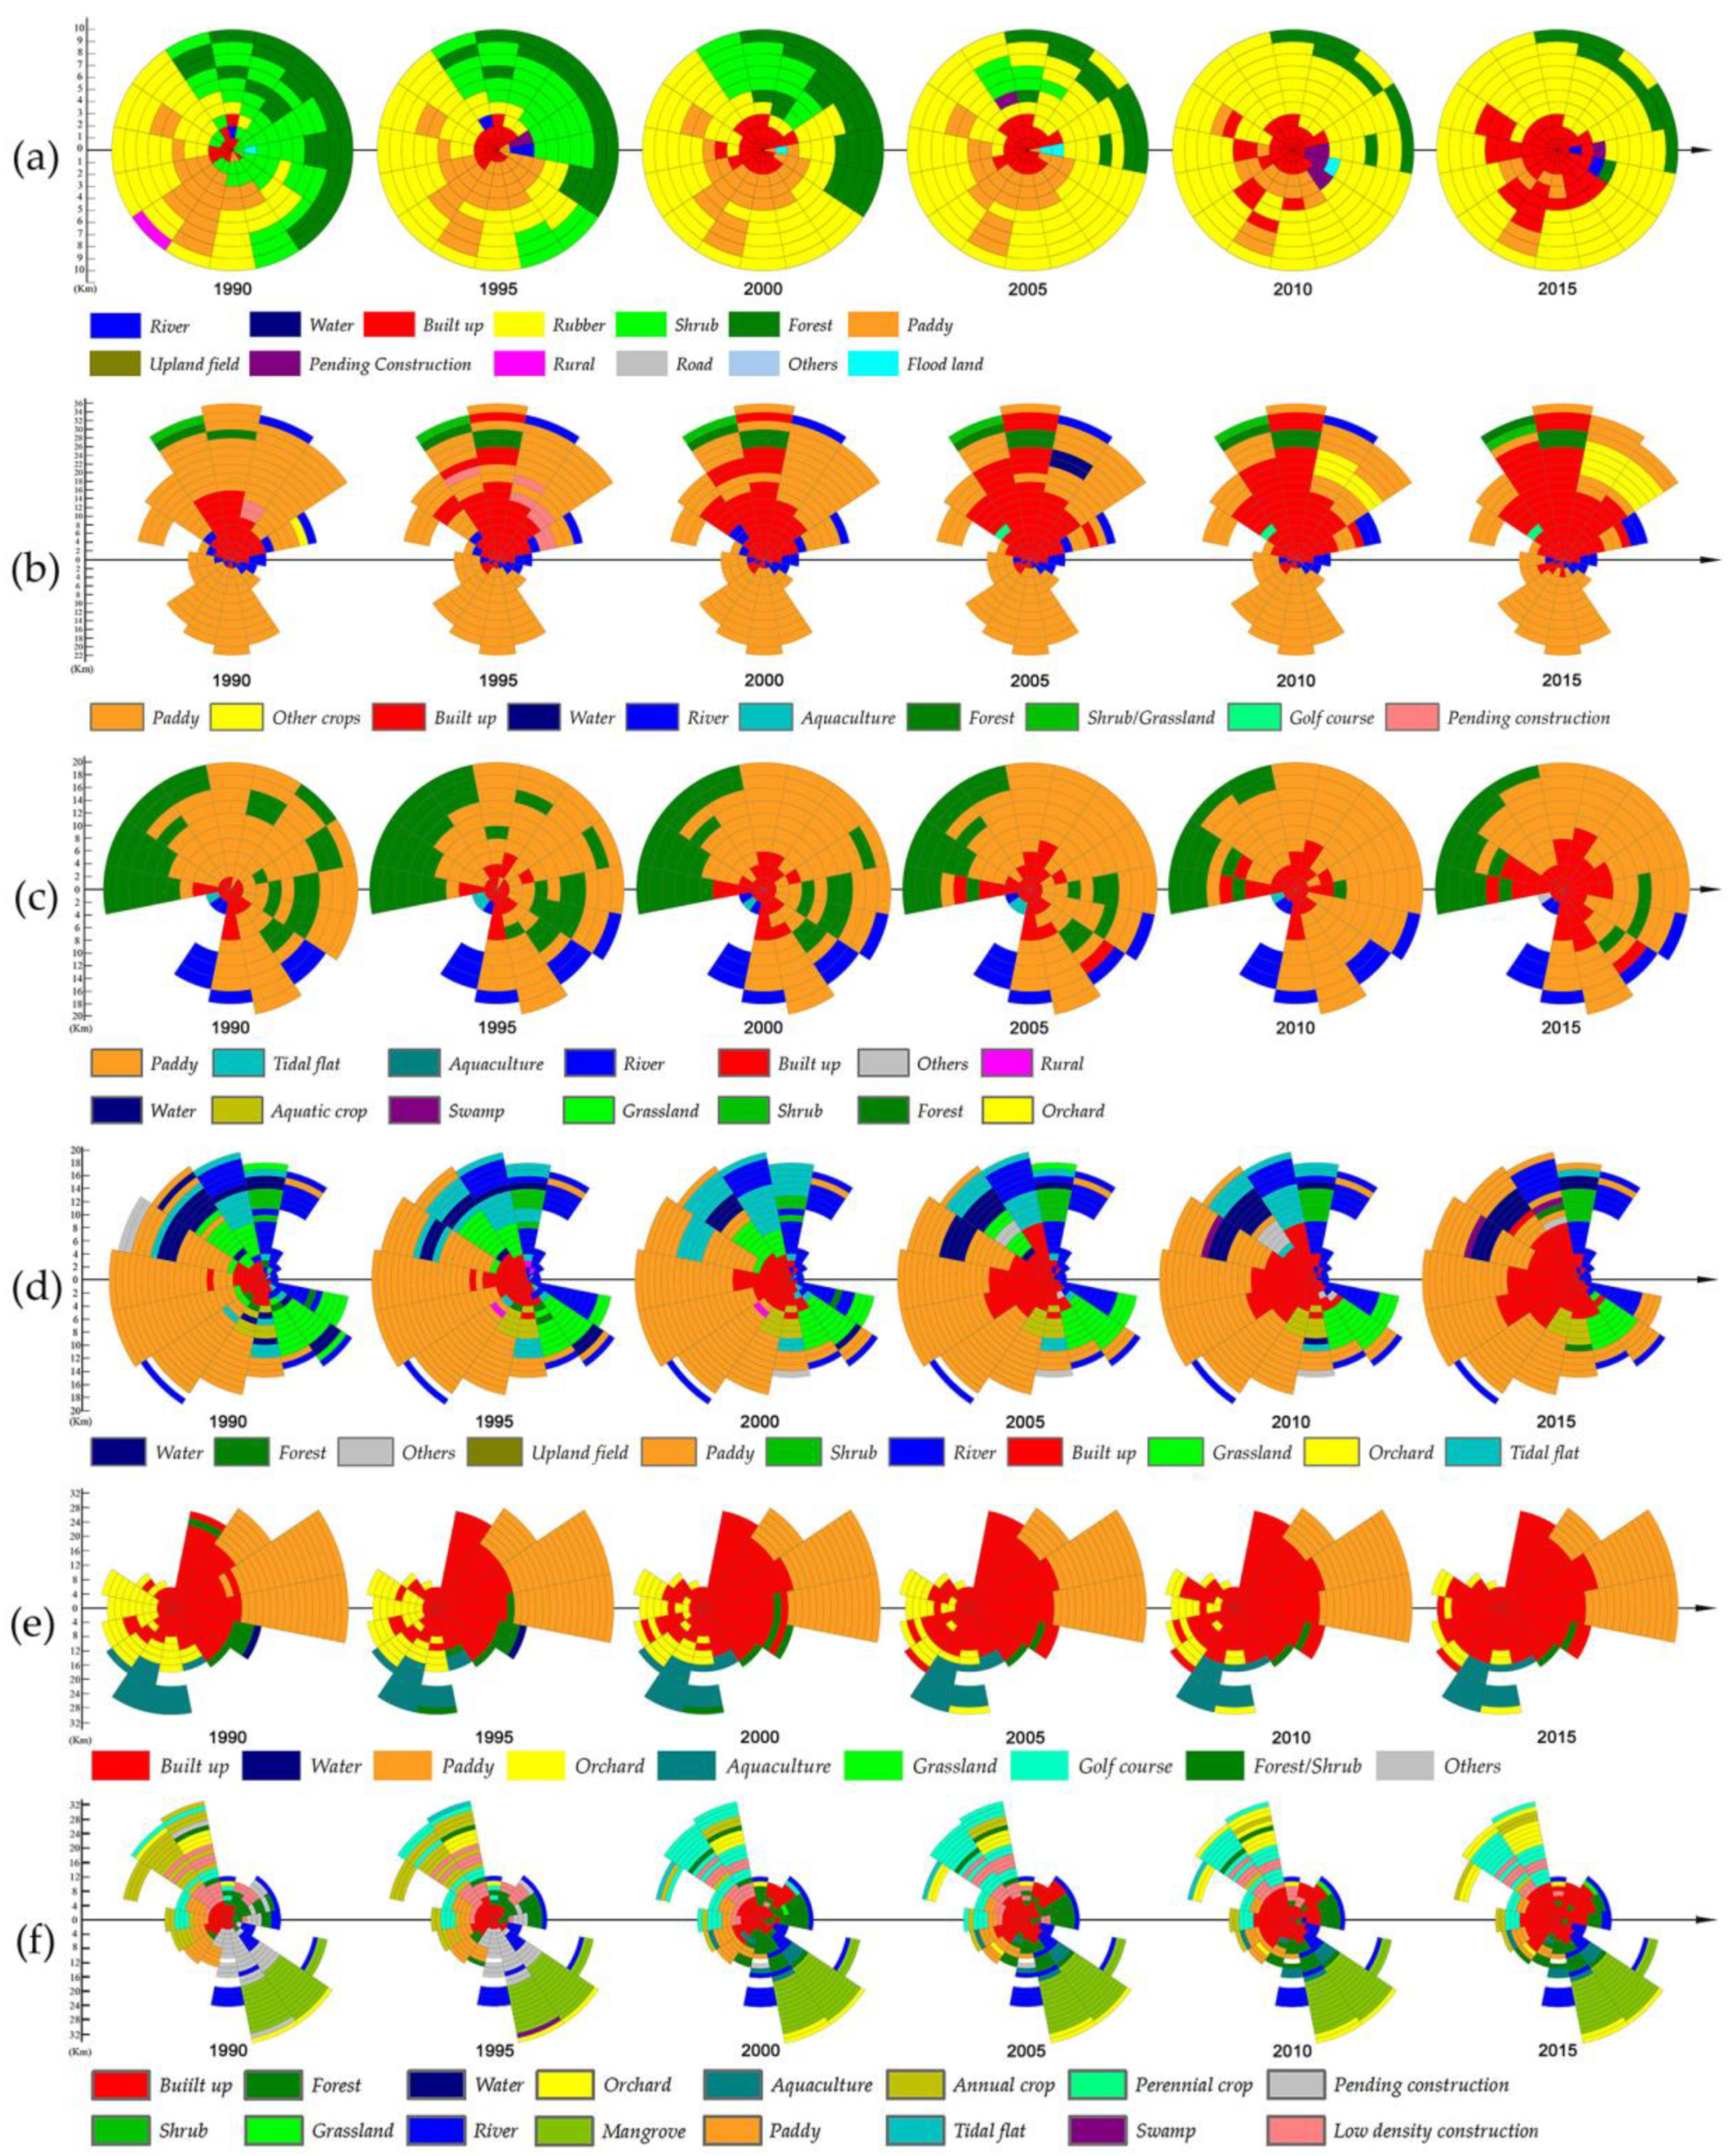
The gradient-direction analysis could help to visualize and understand how land use types changed in response to urban expansion in Xishuangbanna, Yangon, Vientiane, Phnom Penh, Bangkok, and Ho Chi Minh City (Figure 7).
In 1990, land use types outside the urban area of Xishuangbanna were mainly paddy, rubber, shrub and forest. The urban boundary was only within 3 km from the urban center. Since then, with accelerating urban expansion, rubber has been expanding dramatically, while shrub and forest kept decreasing. By 2010, shrub almost disappeared, and large area of paddy was transformed into built up area. By 2015, the region outside urban center was dominated by rubber, with barely any shrub, 5% of paddy and 12% of forest.
Yangon’s urban area was distributed along the north bank of Yangon River and surrounded by paddy mostly. In 1990, most of the urban area was within 8 km from the urban center, while the urban boundary reached to even 26–28 km from the urban center by 2015. Over the past 25 years, large area of paddy was transformed into built up area. Paddy had the largest area and covered over 60% of the whole Yangon in 1990, however, built up area had exceeded paddy in 2015. In the process of urbanization, the government planned lots of satellite cities and industrial parks, which were classified as pending construction area in this study. Most of them have now become the urban area, while some were abandoned and reclaimed as paddy.
In 1990, Vientiane’s urban area was mainly distributed within 4 km alongside the north bank of Mekong River. It was surrounded mostly by paddy mixed with natural forest. By 2015, the urban boundary has extended to 20 km from the urban center, and most of the newly grown built up areas were transformed from paddy and forest. Interestingly, although paddy was a major contributor of urban expansion, the area of paddy did not decrease in the last years. The explanation of this finding is that people outside urban area would be more likely to move to sub-urban area in consideration of living cost, and most of them were still engaged in agricultural activities. As a result, more forest was converted into paddy.
The urban area of Phnom Penh was mainly distributed in the west bank of Mekong River and Donle Sap River, within 6 km from urban center in 1990. Newly grown built up areas were transformed mostly from paddy, grassland, forest, rural area, and other land use type. By 2015, urban area has reached to 13 km from urban center. It should be noted that some natural land use types such as tidal flat and grassland were converted into paddy in the process of urban expansion. For example, the tidal flat in the northwest of Phnom Penh in 2010, 17 km away from urban center, was turned to be paddy by 2015.
Bangkok has a clear land use pattern, with urban area in the middle, paddy in the west, orchard in the east, and aquaculture in the south. Over the past decades, more than 75% of the newly grown built up areas were transformed from paddy and orchard. Urban expansion in the east mostly occurred before 2000, through converting paddy around urban area. Unlike the east, urban expansion in the west was mainly along the transportation infrastructures, and over 80 km2 of orchard was converted as built up area in the last 25 years.
Ho Chi Minh City has the most complicated land use pattern in this study. In 1990, the urban area of Ho Chi Minh City was mainly within 8 km from urban center. It was surrounded by low density built up area, paddy, forest, and large area of ponds in the south. In the last decades, low density built up area, also known as “Desakota”, was the major contributor to urban expansion, followed by paddy, forest, and grassland. Desakota area refers to regions with an intense mixture of agricultural and non-agricultural activities, and in Ho Chi Minh City, low density built up area consisted of large area of paddy. Therefore, the newly grown built up areas were actually mostly transformed from paddy.
4. Discussion
4.1. Addressing Land Use Issues of Typical Cities in the GMS
Natural land use types are essential for eco-environment restoration, such as air purification and water resource conservation. In the process of urban expansion, large area of natural land use types (forest, shrub, grassland, water, swamp, etc.) were transformed into built up areas. Previous studies in Bangkok indicated that urban expansion increased carbon emissions, while the loss of green spaces led to the decline of carbon sinks [33]. Urban heat island phenomenon was another problem in response to rapid urban expansion [32,66,67]. Besides, natural land use types were replaced by paddy or cash crop due to the economic benefits. For example, driven by state policy and economic benefits [68,69], over 3000 km2 of forest and shrub in Xishuangbanna were converted into rubber crops from 1990 to 2015. The loss of natural land use types, accompanied with the intensification of cash crops or urban expansion, led to numerous negative environmental consequences [22,32,70,71]. In the GMS, most cities have been developed on flood plains with abundant water resources, so they also face flood risk due to dramatic urban expansion [72,73]. The loss of natural land use types, especially water, swamp, and grassland, reduced the capacity of flood storage. Many newly expanded urban areas were also built on flood areas. In Yangon, the government launched the urban “squatter” resettlement program for the urban poor, and many new settlements were developed on land that used to be paddy fields subject to flooding [74]. In Ho Chi Minh City, foreign investors were inferior to domestic investors in terms of business information, social networks, and political connections, so they tended to locate their real estate projects in flooding areas in the south and have advertised their properties as waterfront properties [75]. Although Vu et al. argued that most of the newly developed projects were located on higher land and experienced no flood, they addressed that more built up patches indeed increased flood frequency on the nearby low land areas [31].
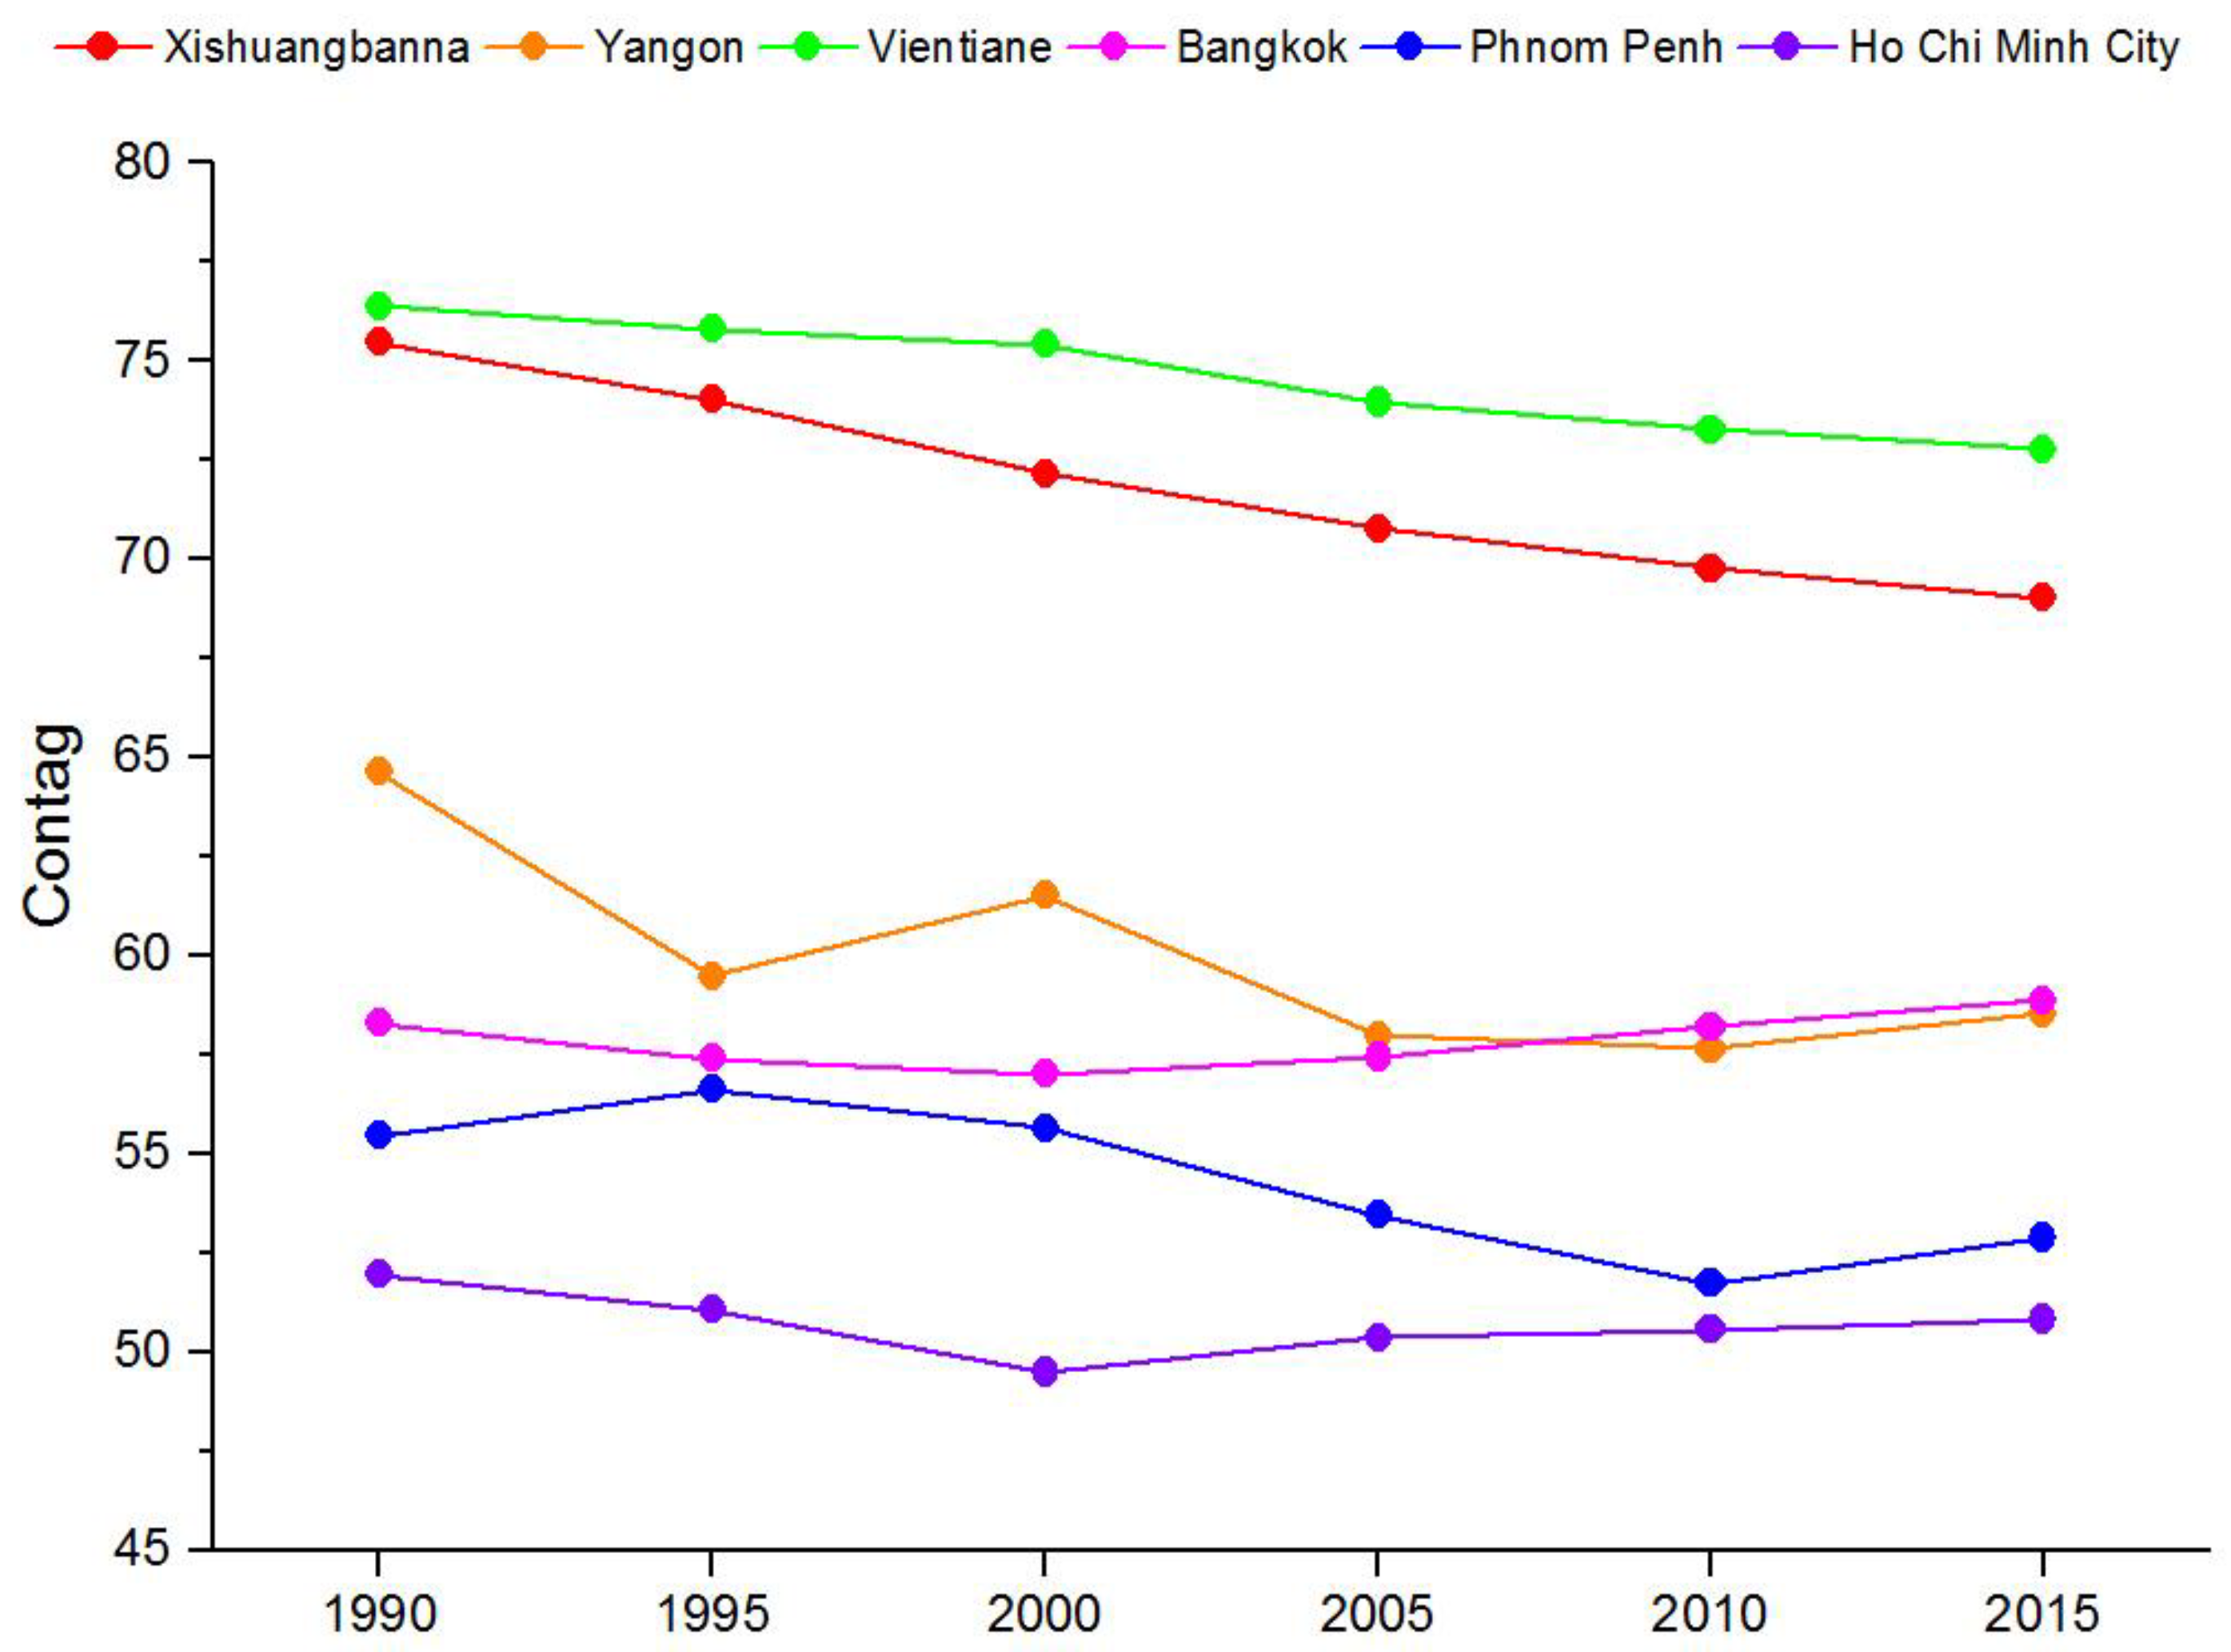
Land fragmentation is another problem in response to rapid urbanization [55,76,77]. Based on the results of landscape metrics analysis using COHESION, DIVISION, and AI, land use types within urban rural gradient gradually became more disaggregated and fragmented. As shown in Figure 8, the CONTAG index revealed the land fragmentation of each city at the landscape level. A high value of CONTAG means the dominant land use patches are well connected within a landscape, whereas a low value indicates that the landscape is more fragmented. The CONTAG values of both Xishuangbanna and Vientiane were higher than the other cities because forest was always dominant land use type since 1990. Although paddy was the dominant land use type in Yangon in 1990, the CONTAG of Yangon was lower because paddy was spatially separated by the Yangon River and the Bago River. Since there was no dominant land use type in Bangkok, Phnom Penh, or Ho Chi Minh City, the CONTAG was usually below 60, meaning the landscape is more fragmented. With most complicated land use types, the landscape in Ho Chi Minh City was most fragmented. From 1990 to 2015, there was an increasing trend in land fragmentation in Xishuangbanna and Vientiane, since CONTAG continually decreased in these two cities. The CONTAG of Yangon and Phnom Penh fluctuated and declined in general, whereas the CONTAG of Bangkok and Ho Chi Minh City remained stable.
Land fragmentation increased land management challenge. For agricultural land, such as paddies and orchards, land fragmentation will result in low production and economic benefits, as well as land degradation [78]. Previous studies also showed that the natural forest in Xishuangbanna were not only dramatically decreased, but being more fragmented, due to rubber plantation and urban development [69,79]. The fragmentation of green spaces could also endanger biodiversity since the ecological corridors for wildlife were destroyed. Stewart et al. addressed the importance of maintaining large green areas in Bangkok, since small and fragmented green areas supported few pollinators, even when floral resources were abundant [80]. Chaiyarat et al. also indicated that small and fragmented urban green areas led to the decline of birds diversity [81].
4.2. Policy Implications on Urban Expansion and Land Use Change
There is a complicated policy context in the GMS. China, Lao PDR, and Vietnam are socialist countries; Thailand and Cambodia are constitutional monarchy countries; while Myanmar was ruled by a military government before 2010. Since the 1970s, most GMS countries started a series of policy reforms to attract investments and develop their economies.
Rubber was introduced into Xishuangbanna in the 1950s. With the government incentive policy and the rising prices of natural rubber, rubber plantations expanded dramatically, especially since the land tenure reform in the 1980s [82]. From 1990 to 2015, the area of rubber increased over five times, and rubber covered more than one-quarter of all of Xishuangbanna by 2015. Rapid rubber plantation expansion placed huge pressure on forests. Since 1990, more than 1800 km2 forest was converted into rubber. To protect forest from deforestation and degradation, the Regulations on the Protection of Forest Resources in Xishuangbanna and the National Natural Forest Protection Program were introduced in 1992 and 1998, respectively. These actions might explain why the forest area slightly increased from 1995 to 2000. Due to the great depression of rubber prices at the end of 2008 and policy orientation on forest protection, the increasing trend in rubber plantations slowed after 2008, and rubber only expanded by about 350 km2 from 2010 to 2015 (Table 3).
In 1988, the military government took over Myanmar and started to implement a market-oriented economy. In 1990, the Yangon City Development Committee was empowered by the State Law and Order Restoration Council (SLORC) to develop Yangon into an international city [83]. Yangon’s urbanization entered a new period since then. During 1989–1990, the SLORC launched an urban squatter resettlement program, moving millions of urban poor from the inner city to satellite townships built on paddy fields [84]. Consequently, the satellite townships contributed to most of the newly expanded built up areas from 1990 to 1995. Meanwhile, small private industries were also resettled into special areas, which are now called industry parks. Besides the squatter program, government employees with tenure of 15 years or more were allocated land as a reward to compensate low salaries and to control corruption. However, most of them did not move to the new townships due to poor infrastructure and costly commute [85]. Thus, the construction of townships partially stagnated, and some pending construction land even reverted to paddy fields after 1995. With stable economic development, Yangon witnessed fast urbanization during the first 10 years of military government. However, the Asian financial crisis in 1997 struck Myanmar, and severely impacted the economy and urbanization for the next 10 years. After the capital of Myanmar was moved from Yangon to Naypyidaw in 2005, Yangon experienced the slowest five years of urban expansion (Table 4). In 2010, the military government was replaced by a democratic government, and the new government accelerated the pace of opening up by enacting a new Foreign Investment Law. These actions re-boosted economic growth and urban development. From 2010 to 2015, the built up area in Yangon expanded by more than double compared to the previous five years.
Lao PDR also started an economic transition, the “New Economic Mechanism” (NEM), in 1986 [86]. To attract foreign investments, a series of foreign direct investments (FDI) laws were enacted from 1988 to 2009. As the capital of Lao PDR, Vientiane quickly became a paradise for foreign investors. The built up area expanded rapid, especially since 1995. However, foreign investments also led to severe urban sprawl in Vientiane. Due to the FDI promotion policy, the urban master plan was unable to efficiently control and regulate foreigners’ investments. Many private communities, entertainment projects, and industry parks, were built around the peri-urban area. For example, the That-Luang marsh area, which played important role in regulating hydrological functions and providing a habit for various species, was developed with services, residential and entertainment facilities in the last decades [36,87]. Consequently, the Vientiane population tended to concentrate in the business zones, or scatter along transportation corridors at the urban fringe. Thus, the built up area mainly expanded either along the Mekong River or along the national roads toward the north. Urban sprawl and population migration led to more fragmented land use patterns in Vientiane.
Phnom Penh suffered long-term depression since the Khmer Rouge occurred in the 1970s. Although several economic reform policies were implemented to attract foreign investments in the 1990s, the unstable political situation hindered the economic growth and urbanization of Phnom Penh. The built up area expanded at the rate of 2.6 km2 per year before 2000. Only after 2000 did Phnom Penh begin to develop rapidly as political stability led to an increase in both domestic and foreign investments. In 2001, the new Land Law was passed meaning land could be owned privately. Since then, land that was previously used for rice farming was bought for the development of urban forms [65]. Thus, from 2000 to 2005, the built up area increased dramatically by more than 30 km2 (Table 6). At that time, many industries moved from the inner city to the urban fringe along roads between the urban core and airport and the 4th Road. Consequently, these industries not only decreased rental costs, but could also directly transport their products to Sihanoukville through the 4th Road.
There is a huge disparity in resources allocation in Bangkok. The largest landowner possesses about 24 km2 of the land, and the top 50 owners account for 10% of all of Bangkok. The inner city of Bangkok has long suffered traffic congestion and pollution due to economic inequalities and lack of urban planning. Since 1990, urban expansion in Bangkok has been concentrated along the urban fringe due to two different factors. Rural migrants moved to urban fringes as the first step of the rural-to-urban migration process. Meanwhile, low-middle and middle income urban dwellers moved out to the urban fringe due to lower land rent and larger houses [88,89,90].
Vietnam started the transition to a market-oriented economy through the implementation of the “Doi Moi Policy”. The Land Law was enacted in 1987 to return land usufruct rights to individual farmers, and land was allocated to farmers with for 5 or 30 years for annual crop and perennial crop, respectively [91]. Table 8 shows that both annual crops and perennial crops increased slightly from 1990 to 1995. In 1993, the Second Land Law was issued, and the duration of land tenure for annual crop and perennial crop were extended to 20 and 50 years, respectively. Consequently, farmers preferred to plant perennial crop, since they felt more secure about their land with 50-year tenure. From 1995 to 2000, annual crops decreased dramatically, while perennial crops increased to near 60 km2. The Second Land Law also initially constituted the real estate market. Although there were many constraints on the real estate market, the signal to liberate urban land accelerated urban expansion after 1995 [92]. In 2003, the Third Land Law further established a real estate market in Vietnam, and foreign investors were granted more rights in the housing business. However, it is still difficult for foreign investors to compete with their domestic counterparts in terms of land acquisition, as well as business information, social networks, and political connections. Therefore, foreign investors were more likely to invest peri-urban areas, which have more growth potential. With this strategy, some flooding regions in the southeast of Ho Chi Minh City (Figure 4f), were gradually developed into built up areas by foreign investors. Even though most of these newly grown built up areas were set on higher land, they were still facing flood risk due to the decline of natural land use types, sea level rise, or land subsidence [93,94,95].
5. Conclusions
Since 1990, all cities in this study have experienced dramatic land use change. The forest area decreased obviously in Xishuangbanna and Vientiane. Orchard in Bangkok and annual crops in Ho Chi Minh City also showed a decreasing trend, whereas rubber plantations in Xishuangbanna expanded more than 3200 km2. Except for Xishuangbanna, the paddy fields area in the other cities decreased. These cities also witnessed rapid urban expansion. Xishuangbanna had the highest urban expansion intensity, followed by Ho Chi Minh City and Phnom Penh. As an international metropolis, Bangkok had lower urban expansion intensity compared to other cities. However, the urban area in Bangkok increased approximately 200 km2 from 1990 to 2015. Most cities showed clear spatial orientations in the process of urban expansion. The self-connectivity of the built up areas was usually enhanced, and land use types outside the built up area (such as paddy, forest, and orchard) always showed trends of disaggregation and fragmentation. Over the past decades, the newly grown built up areas were mostly transformed from paddy and natural land use types, and large area of natural land use types were also replaced by paddy and cash crops.
The loss of natural land use types could lead to deforestation, soil erosion, and environmental deterioration in the GMS. These typical cities became more vulnerable to flood risk, due not only to the loss of natural land use types with flood storage capacity, but urban expansion on the flood plains. Land fragmentation is also a common issue among the typical cities, especially in Xishuangbanna and Vientiane. The fragmented land might lead to inefficient land management and endanger biodiversity.
To develop the economy, almost all countries in the GMS introduced a series of policy reforms since the 1970s. Generally, land reform and attitude toward foreign direct investments (FDI) were two key policy factors affecting land use change of typical cities in the GMS. The land policy reform improved farmers’ enthusiasm for agricultural production, while accelerating land use transformation from natural land use types to agricultural land. The real estate markets, which were established through reform of land law, contributed to dramatic urban expansion. Furthermore, foreign investment laws were enacted by most countries in the GMS to attract FDI. This policy stimulated economic development, and led to uncontrolled urban growth and population migration at the same time. The misuse of urban planning and urban sprawl finally resulted in land fragmentation and consequent eco-environmental issues. Thus, our future studies will focus on analyzing specific eco-environmental consequences caused by land use change in these typical cities, and providing policy recommendations in support of urban planning and regional development.
Author Contributions
Conceptualization, H.C. and J.L.; Data curation, H.C., J.C., G.W. and W.Z.; Formal analysis, J.C., G.W. and W.Z.; Methodology, H.C. and J.L.; and Writing—original draft, H.C. and J.G.
Funding
This research was supported by the UNEP Project through China Fund, National Natural Science Foundation of China (Grant No. 41561144012), Open Research Fund of Key Laboratory of Digital Earth Science, Institute of Remote Sensing and Digital Earth, Chinese Academy of Sciences (Grant No. 2016LDE006), STS project of Chinese Academy of Sciences (Grant No. KFZD-SW-316), CAS Key Laboratory of Lunar and Deep Space Exploration (Grant No. 16120452), and the National Natural Science Foundation of China (Grant No. 41701468).
Conflicts of Interest
The authors declare no conflict of interest.
Appendix A

Table A1.
List of Landsat Images used in the study.
| City | Year | Path/Row | Date | Sensor | Resolution (m) |
|---|---|---|---|---|---|
| Xishuangbanna | 2015 | 129/45 | 9 March 2015 | OLI | 30 |
| 130/44 | 16 March 2015 | OLI | 30 | ||
| 130/45 | 16 March 2015 | OLI | 30 | ||
| 131/45 | 7 March 2015 | OLI | 30 | ||
| 2010 | 129/45 | 7 February 2010 | TM | 30 | |
| 130/44 | 14 February 2010 | TM | 30 | ||
| 130/45 | 14 February 2010 | TM | 30 | ||
| 131/45 | 5 February 2010 | TM | 30 | ||
| 2005 | 129/45 | 23 February 2004 | TM | 30 | |
| 130/44 | 1 March 2004 | TM | 30 | ||
| 130/45 | 1 March 2004 | TM | 30 | ||
| 131/45 | 21 February 2004 | TM | 30 | ||
| 2000 | 129/45 | 6 February 2001 | ETM+ | 30 | |
| 130/44 | 21 February 2001 | ETM+ | 30 | ||
| 130/45 | 21 February 2001 | ETM+ | 30 | ||
| 131/45 | 4 February 2001 | ETM+ | 30 | ||
| 1995 | 129/45 | 16 March 1995 | TM | 30 | |
| 130/44 | 25 March 1995 | TM | 30 | ||
| 130/45 | 25 March 1995 | TM | 30 | ||
| 131/45 | 19 April 1995 | TM | 30 | ||
| 1990 | 129/45 | 20 January 1989 | TM | 30 | |
| 130/44 | 27 January 1989 | TM | 30 | ||
| 130/45 | 27 January 1989 | TM | 30 | ||
| 131/45 | 11 February 1989 | TM | 30 | ||
| Yangon | 2015 Dry Season | 132/48 | 30 March 2015 | OLI | 30 |
| 2015 Wet Season | 132/48 | 9 November 2015 | OLI | 30 | |
| 2010 Dry Season | 132/48 | 12 February 2010 | TM | 30 | |
| 132/49 | 12 February 2010 | TM | 30 | ||
| 2010 Wet Season | 132/48 | 8 November 2009 | TM | 30 | |
| 132/49 | 8 November 2009 | TM | 30 | ||
| 2005 Dry Season | 132/48 | 14 February 2005 | TM | 30 | |
| 132/49 | 14 February 2005 | TM | 30 | ||
| 2005 Wet Season | 132/48 | 25 October 2004 | TM | 30 | |
| 132/49 | 25 October 2004 | TM | 30 | ||
| 2000 Dry Season | 132/48 | 4 March 2000 | TM | 30 | |
| 132/49 | 4 March 2000 | TM | 30 | ||
| 2000 Wet Season | 132/48 | 7 November 2000 | ETM | 30 | |
| 132/49 | 7 November 2000 | ETM | 30 | ||
| 1995 Dry Season | 132/48 | 7 March 1995 | TM | 30 | |
| 132/49 | 7 March 1995 | TM | 30 | ||
| 1995 Wet Season | 132/48 | 30 October 1994 | TM | 30 | |
| 132/49 | 30 October 1994 | TM | 30 | ||
| 1990 Dry Season | 132/48 | 5 February 1990 | TM | 30 | |
| 132/49 | 5 February 1990 | TM | 30 | ||
| 1990 Wet Season | 132/48 | 17 November 1989 | TM | 30 | |
| 132/49 | 17 November 1989 | TM | 30 | ||
| Vientiane | 2015 Dry Season | 128/47 | 13 January 2015 | OLI | 30 |
| 128/48 | 13 January 2015 | OLI | 30 | ||
| 129/47 | 4 January 2015 | OLI | 30 | ||
| 2015 Wet Season | 128/47 | 28 October 2015 | OLI | 30 | |
| 128/48 | 28 October 2015 | OLI | 30 | ||
| 129/47 | 4 November 2015 | OLI | 30 | ||
| 2010 Dry Season | 128/47 | 31 January 2010 | TM | 30 | |
| 128/48 | 31 January 2010 | TM | 30 | ||
| 129/47 | 23 February 2010 | TM | 30 | ||
| 2010 Wet Season | 128/47 | 9 September 2009 | TM | 30 | |
| 128/48 | 9 September 2009 | TM | 30 | ||
| 129/47 | 5 December 2009 | TM | 30 | ||
| 2005 Dry Season | 128/47 | 18 February 2005 | TM | 30 | |
| 128/48 | 18 February 2005 | TM | 30 | ||
| 129/47 | 23 December 2004 | TM | 30 | ||
| 2005 Wet Season | 128/47 | 27 September 2004 | TM | 30 | |
| 128/48 | 27 September 2004 | TM | 30 | ||
| 129/47 | 23 October 2005 | TM | 30 | ||
| 2000 Dry Season | 128/47 | 4 January 2000 | TM | 30 | |
| 128/48 | 4 January 2000 | TM | 30 | ||
| 129/47 | 11 January 2000 | TM | 30 | ||
| 2000 Wet Season | 128/47 | 16 September 2000 | TM | 30 | |
| 128/48 | 16 September 2000 | TM | 30 | ||
| 129/47 | 9 October 2000 | TM | 30 | ||
| 1995 Dry Season | 128/47 | 7 February 1995 | TM | 30 | |
| 128/48 | 7 February 1995 | TM | 30 | ||
| 129/47 | 14 February 1995 | TM | 30 | ||
| 1995 Wet Season | 128/47 | 18 October 1994 | TM | 30 | |
| 128/48 | 18 October 1994 | TM | 30 | ||
| 129/47 | 25 October 1994 | TM | 30 | ||
| 1990 Dry Season | 128/47 | 29 March 1990 | TM | 30 | |
| 128/48 | 29 March 1990 | TM | 30 | ||
| 129/47 | 31 January 1990 | TM | 30 | ||
| 1990 Wet Season | 128/47 | 17 August 1989 | TM | 30 | |
| 128/48 | 17 August 1989 | TM | 30 | ||
| 129/47 | 21 June 1989 | TM | 30 | ||
| Phnom Penh | 2015 Dry Season | 126/52 | 31 January 2015 | OLI | 30 |
| 2015 Wet Season | 126/52 | 30 October 2015 | OLI | 30 | |
| 2010 Dry Season | 126/52 | 15 February 2009 | TM | 30 | |
| 2010 Wet Season | 126/52 | 29 October 2009 | TM | 30 | |
| 2005 Dry Season | 126/52 | 19 January 2005 | TM | 30 | |
| 2005 Wet Season | 126/52 | 15 October 2004 | TM | 30 | |
| 2000 Dry Season | 126/52 | 26 March 2000 | TM | 30 | |
| 2000 Wet Season | 126/52 | 5 November 2000 | TM | 30 | |
| 1995 Dry Season | 126/52 | 9 February 1995 | TM | 30 | |
| 1995 Wet Season | 126/52 | 23 October 1995 | TM | 30 | |
| 1990 Dry Season | 126/52 | 10 January 1990 | TM | 30 | |
| 1990 Wet Season | 126/52 | 7 November 1989 | TM | 30 | |
| Bangkok | 2015 Dry Season | 129/50 | 4 January 2015 | OLI | 30 |
| 129/51 | 4 January 2015 | OLI | 30 | ||
| 2015 Wet Season | 129/50 | 6 December 2015 | OLI | 30 | |
| 129/51 | 6 December 2015 | OLI | 30 | ||
| 2010 Dry Season | 129/50 | 19 January 2009 | TM | 30 | |
| 129/51 | 19 January 2009 | TM | 30 | ||
| 2010 Wet Season | 129/50 | 19 November 2009 | TM | 30 | |
| 129/51 | 19 November 2009 | TM | 30 | ||
| 2005 Dry Season | 129/50 | 13 March 2005 | TM | 30 | |
| 129/51 | 13 March 2005 | TM | 30 | ||
| 2005 Wet Season | 129/50 | 5 November 2004 | TM | 30 | |
| 129/51 | 5 November 2004 | TM | 30 | ||
| 2000 Dry Season | 129/50 | 28 February 2000 | TM | 30 | |
| 129/51 | 28 February 2000 | TM | 30 | ||
| 2000 Wet Season | 129/50 | 10 November 2000 | TM | 30 | |
| 129/51 | 10 November 2000 | TM | 30 | ||
| 1995 Dry Season | 129/50 | 26 January 1994 | TM | 30 | |
| 129/51 | 26 January 1994 | TM | 30 | ||
| 1995 Wet Season | 129/50 | 25 October 1994 | TM | 30 | |
| 129/51 | 25 October 1994 | TM | 30 | ||
| 1990 Dry Season | 129/50 | 3 February 1991 | TM | 30 | |
| 129/51 | 3 February 1991 | TM | 30 | ||
| 1990 Wet Season | 129/50 | 14 October 1990 | TM | 30 | |
| 129/51 | 14 October 1990 | TM | 30 | ||
| Ho Chi Minh City | 2015 Dry Season | 125/52 | 24 January 2015 | OLI | 30 |
| 125/53 | 24 January 2015 | OLI | 30 | ||
| 124/53 | 17 January 2015 | OLI | 30 | ||
| 2015 Wet Season | 125/52 | 18 September 2014 | OLI | 30 | |
| 125/53 | 18 September 2014 | OLI | 30 | ||
| 124/53 | 10 August 2014 | OLI | 30 | ||
| 2010 Dry Season | 125/52 | 11 February 2010 | TM | 30 | |
| 125/53 | 11 February 2010 | TM | 30 | ||
| 124/53 | 4 February 2010 | TM | 30 | ||
| 2010 Wet Season | 125/52 | 28 October 2011 | TM | 30 | |
| 125/53 | 28 October 2011 | TM | 30 | ||
| 124/53 | 21 October 2011 | TM | 30 | ||
| 2005 Dry Season | 125/52 | 13 February 2005 | TM | 30 | |
| 125/53 | 13 February 2005 | TM | 30 | ||
| 124/53 | 22 February 2005 | TM | 30 | ||
| 2005 Wet Season | 125/52 | 24 October 2004 | TM | 30 | |
| 125/53 | 24 October 2004 | TM | 30 | ||
| 124/53 | 18 November 2004 | TM | 30 | ||
| 2000 Dry Season | 125/52 | 16 February 2000 | TM | 30 | |
| 125/53 | 3 March 2000 | TM | 30 | ||
| 124/53 | 9 February 2000 | TM | 30 | ||
| 2000 Wet Season | 125/52 | 27 September 2000 | TM | 30 | |
| 125/53 | 27 September 2000 | TM | 30 | ||
| 124/53 | 20 September 2000 | TM | 30 | ||
| 1995 Dry Season | 125/52 | 2 February 1995 | TM | 30 | |
| 125/53 | 2 February 1995 | TM | 30 | ||
| 124/53 | 11 February 1995 | TM | 30 | ||
| 1995 Wet Season | 125/52 | 14 November 1994 | TM | 30 | |
| 125/53 | 14 November 1994 | TM | 30 | ||
| 124/53 | 23 November 1994 | TM | 30 | ||
| 1990 Dry Season | 125/52 | 27 January 1990 | TM | 30 | |
| 125/53 | 27 January 1990 | TM | 30 | ||
| 124/53 | 13 February 1990 | TM | 30 | ||
| 1990 Wet Season | 125/52 | 18 December 1989 | TM | 30 | |
| 125/53 | 18 December 1989 | TM | 30 | ||
| 124/53 | 9 November 1989 | TM | 30 |
Note: the cloud coverage of each image is under 10%.
Appendix B
Below is an example of land use classification approaches for Xishuangbanna.
1. Image segmentation
eCognition Developer provides a Multiresolution Segmentation algorithm that can minimize the average heterogeneity of image objects for a given resolution. In this study, we firstly segmented the image of Xishuangbanna in 2015 into two levels. The analysis layers of Xishuangbanna in 2015 consist of 10 image layers (DEM, Slope, and OLI bands without panchromatic band and thermal infrared bands) and 2 thematic layers (hydrological map including Riverline and Riverpolygon). All these layers were incorporated into segmentation process. To obtain the optimal parameter values for each level, we firstly visually identified three sets of parameter combination, and then adopted a discrepancy measure (ED2) to evaluation the segmentation performances [96,97].
Table A2.
Segmentation evaluation using a discrepancy index (ED2).
| Segmentation Evaluation | Level 1 | Level 2 | ||||
|---|---|---|---|---|---|---|
| Trial 1 | Trial 2 | Trial 3 | Trial 1 | Trial 2 | Trial 3 | |
| Scale | 6 | 8 | 10 | 3 | 4 | 5 |
| Shape | 0.1 | 0.1 | 0.1 | 0.1 | 0.1 | 0.1 |
| Compactness | 0.5 | 0.5 | 0.5 | 0.3 | 0.3 | 0.3 |
| ED2 | 0.8109 | 0.7796 | 0.8824 | 0.5031 | 0.4832 | 0.5575 |
Notes: the number of reference polygons is 40 for each trail.
A large ED2 value indicates a significant discrepancy. Thus, the optimal segmentation parameters are listed as below.
Level 1: scale 8, shape 0.1, and compactness 0.5;
Level 2: scale 4, shape 0.1, and compactness 0.3.
Level 1 was used to recognize land use types with texture characteristics, such as rural patches and urban patches. Level 2 was created from Level 1, as a set of sub objects. In Level 2, image objects were mainly categorized based on their spectral attributes.
2. Classification Algorithm
The classification algorithm follows the land use classification scheme in Figure 3. In Xishuangbanna, 13 land use types were defined, including built up (including city proper and towns), river, water (including lake, reservoir, and ponds), pending construction land, rural, road, flood land, rubber, forest, shrub, paddy, upland field, and others (grassland, bare land, and vacant land). The descriptive steps of classification are listed as follows:
- (1)
- In Level 1, If NDVI >= 0.2, assign objects as Vegetation1; else assign objects as Non-vegetation1
- (2)
- In Level 2, If NDVI >= 0.2, assign objects as Vegetation2; else assign objects as Non-vegetation2
- (3)
- In Level 2, for Vegetation2, if NDVI >= 0.4
- If layer 5 (OLI band 5) > 78 and object size >30 pix, assign objects as Rubber;
- Else assign objects as Forest
- (4)
- In Level 2, for Vegetation2, if NDVI < 0.4
- If layer 1 >= 39 and layer 3 >= 36
- If NDWI > 0 or (DEM < 1000 m and Slope <= 6°), assign objects as Paddy;
- Else if DEM >= 1000 m and Slope <= 6°, assign objects as Upland field;
- Else assign objects as Shrub
- (5)
- In Level 2, for Non-vegetation2, if NDWI > 0
- If objects overlap with thematic layers or objects’ length/width > 6, assigned as River;
- Else assigned as Water
- (6)
- In Level 1, for Non-vegetation1,
- if BBI > 0 [98], assign objects as Impervious land;
- Else if objects are border to River, assigned as Flood land1;
- (7)
- In Level 1, for Impervious landFor standard deviation of layer 7 (OLI band 7) > 5
- If objects’ area <= 200 pix, assigned as Rural1;
- Else assigned as Built up1
For standard deviation of layer 7 (OLI band 7) <=5- If objects are not border to River and objects’ length/width > 6, assigned as Road1;
- If objects are border to Built up1, assigned as Pending construction1
- (8)
- In Level 2
- If objects overlap with Rural1, assigned as Rural;
- Else if objects overlap with Built up1, assigned as Built up;
- Else if objects overlap with Flood land 1, assigned as Flood land;
- Else if objects overlap with Road1, assigned as Road;
- Else if objects overlap with Pending construction1, assigned as Pending construction
- (9)
- In Level 2, visually modify the classified objects using Manual Editing toolbar, and assign the unclassified objects as Others
- (10)
- Output land use types of Level 2 as the classification result.
3. Land use classification for other time periods
Repeat step 1 and step 2, and implement land use classification for other time periods.
References
- United Nations. World Urbanization Prospects: The 2018 Revision, Online Edition; United Nations: New York, USA, 2018. [Google Scholar]
- ADB. The Greater Mekong Subregion at 20: Progress and Prospects; ADB: Mandaluyong City, Philippines, 2012. [Google Scholar]
- Lambin, E.F.; Geist, H.J. Land-Use and Land-Cover Change. Local Processes and Global Impacts; Springer: Berlin/Heidelberg, Germany, 2006. [Google Scholar]
- Lambin, E.F.; Turner, B.L.; Geist, H.J.; Agbola, S.B.; Angelsen, A.; Bruce, J.W.; Coomes, O.T.; Dirzo, R.; Fischer, G.; Folke, C.; et al. The causes of land-use and land-cover change: Moving beyond the myths. Glob. Environ. Chang. 2001, 11, 261–269. [Google Scholar] [CrossRef]
- Veldkamp, A.; Lambin, E.F. Predicting land-use change. Agric. Ecosyst. Environ. 2001, 85, 1–6. [Google Scholar] [CrossRef]
- Su, S.; Xiao, R.; Jiang, Z.; Zhang, Y. Characterizing landscape pattern and ecosystem service value changes for urbanization impacts at an eco-regional scale. Appl. Geogr. 2012, 34, 295–305. [Google Scholar] [CrossRef]
- Jiang, L.; Deng, X.; Seto, K.C. The impact of urban expansion on agricultural land use intensity in China. Land Use Policy 2013, 35, 33–39. [Google Scholar] [CrossRef]
- Dupras, J.; Marull, J.; Parcerisas, L.; Coll, F.; Gonzalez, A.; Girard, M.; Tello, E. The impacts of urban sprawl on ecological connectivity in the Montreal Metropolitan Region. Environ. Sci. Policy 2016, 58, 61–73. [Google Scholar] [CrossRef]
- Whitford, V.; Ennos, A.R.; Handley, J.F. “City form and natural process”—Indicators for the ecological performance of urban areas and their application to Merseyside, UK. Landsc. Urban Plan. 2001, 57, 91–103. [Google Scholar] [CrossRef]
- Weng, Y.-C. Spatiotemporal changes of landscape pattern in response to urbanization. Landsc. Urban Plan. 2007, 81, 341–353. [Google Scholar] [CrossRef]
- Kuenzer, C. Remote sensing the Mekong. Int. J. Remote Sens. 2014, 35, 2747–2751. [Google Scholar] [CrossRef]
- Kuenzer, C.; Knauer, K. Remote sensing of rice crop areas. Int. J. Remote Sens. 2013, 34, 2101–2139. [Google Scholar] [CrossRef]
- Rerkasem, K.; Yimyam, N.; Rerkasem, B. Land use transformation in the mountainous mainland Southeast Asia region and the role of indigenous knowledge and skills in forest management. For. Ecol. Manag. 2009, 257, 2035–2043. [Google Scholar] [CrossRef]
- Huang, X.-H.; Yuan, H.; Yu, F.-K.; Li, X.-Y.; Liang, Q.-B.; Yao, P.; Shao, H.-B. Spatial–temporal succession of the vegetation in Xishuangbanna, China during 1976–2010: A case study based on RS technology and implications for eco-restoration. Ecol. Eng. 2014, 70, 255–262. [Google Scholar] [CrossRef]
- Wang, C.; Myint, S. Environmental Concerns of Deforestation in Myanmar 2001–2010. Remote Sens. 2016, 8, 728. [Google Scholar] [CrossRef]
- Tran, H.; Tran, T.; Kervyn, M. Dynamics of Land Cover/Land Use Changes in the Mekong Delta, 1973–2011: A Remote Sensing Analysis of the Tran Van Thoi District, Ca Mau Province, Vietnam. Remote Sens. 2015, 7, 2899–2925. [Google Scholar] [CrossRef]
- Muttitanon, W.; Tripathi, N. Land use/land cover changes in the coastal zone of Ban Don Bay, Thailand using Landsat 5 TM data. Int. J. Remote Sens. 2005, 26, 2311–2323. [Google Scholar] [CrossRef]
- Langner, A.; Hirata, Y.; Saito, H.; Sokh, H.; Leng, C.; Pak, C.; Raši, R. Spectral normalization of SPOT 4 data to adjust for changing leaf phenology within seasonal forests in Cambodia. Remote Sens. Environ. 2014, 143, 122–130. [Google Scholar] [CrossRef]
- Inoue, Y.; Kiyono, Y.; Asai, H.; Ochiai, Y.; Qi, J.; Olioso, A.; Shiraiwa, T.; Horie, T.; Saito, K.; Dounagsavanh, L. Assessing land-use and carbon stock in slash-and-burn ecosystems in tropical mountain of Laos based on time-series satellite images. Int. J. Appl. Earth Obs. Geoinf. 2010, 12, 287–297. [Google Scholar] [CrossRef]
- Kityuttachai, K.; Heng, S.; Sou, V. Land Cover Map of the Lower Mekong Basin, MRC Technical Paper No. 59, Information and Knowledge Management Programme; MRC: Phnom Penh, Cambodia, 2016. [Google Scholar]
- Hurni, K.; Hett, C.; Heinimann, A.; Messerli, P.; Wiesmann, U. Dynamics of Shifting Cultivation Landscapes in Northern Lao PDR Between 2000 and 2009 Based on an Analysis of MODIS Time Series and Landsat Images. Hum. Ecol. 2012, 41, 21–36. [Google Scholar] [CrossRef]
- Ziegler, A.D.; Fox, J.M.; Xu, J. The rubber juggernaut. Science 2009, 324, 1024–1025. [Google Scholar] [CrossRef]
- Rigg, J. Forests and farmers, land and livelihoods, changing resource realities in Thailand. Glob. Ecol. Biogeogr. Lett. 1993, 3, 277–289. [Google Scholar] [CrossRef]
- Phuc, T.X.; Nghi, T.H. Rubber Expansion and Forest Protection in Vietnam; Tropenbos International Viet Nam: Hue city, Viet Nam, 2014. [Google Scholar]
- Florian, S.; Januar, H. Urban Development and Urbanization in the Greater Mekong Subregion; ADB: Mandaluyong City, Philippines, 2016. [Google Scholar]
- World Bank. World Bank Database. Available online: http://data.worldbank.org (accessed on 7 December 2018).
- Thanh Hoan, N.; Liou, Y.-A.; Nguyen, K.-A.; Sharma, R.; Tran, D.-P.; Liou, C.-L.; Cham, D. Assessing the Effects of Land-Use Types in Surface Urban Heat Islands for Developing Comfortable Living in Hanoi City. Remote Sens. 2018, 10, 1965. [Google Scholar] [CrossRef]
- Nguyen, T.A.; Le, P.M.T.; Pham, T.M.; Hoang, H.T.T.; Nguyen, M.Q.; Ta, H.Q.; Phung, H.T.M.; Le, H.T.T.; Hens, L. Toward a sustainable city of tomorrow: A hybrid Markov–Cellular Automata modeling for urban landscape evolution in the Hanoi city (Vietnam) during 1990–2030. Environ. Dev. Sustain. 2017, 21, 429–446. [Google Scholar] [CrossRef]
- Sritarapipat, T.; Takeuchi, W. Building classification in Yangon City, Myanmar using Stereo GeoEye images, Landsat image and night-time light data. Remote Sens. Appl. Soc. Environ. 2017, 6, 46–51. [Google Scholar] [CrossRef]
- Son, N.T.; Chen, C.F.; Chang, L.Y.; Chen, C.R.; Thanh, B.X. Urban growth mapping from Landsat data using linear mixture model in Ho Chi Minh City, Vietnam. J. Appl. Remote Sens. 2012, 6, 100–106. [Google Scholar]
- Vu, T.-T.; Thy, P.T.M.; Nguyen, L.Đ. Multiscale remote sensing of urbanization in Ho Chi Minh city, Vietnam—A focused study of the south. Appl. Geogr. 2018, 92, 168–181. [Google Scholar] [CrossRef]
- Wang, Y.C.; Hu, B.K.H.; Myint, S.W.; Feng, C.C.; Chow, W.T.L.; Passy, P.F. Patterns of land change and their potential impacts on land surface temperature change in Yangon, Myanmar. Sci. Total Environ. 2018, 643, 738–750. [Google Scholar] [CrossRef]
- Ali, G.; Pumijumnong, N.; Cui, S. Valuation and validation of carbon sources and sinks through land cover/use change analysis: The case of Bangkok metropolitan area. Land Use Policy 2018, 70, 471–478. [Google Scholar] [CrossRef]
- Goldblatt, R.; Deininger, K.; Hanson, G. Utilizing publicly available satellite data for urban research: Mapping built-up land cover and land use in Ho Chi Minh City, Vietnam. Dev. Eng. 2018, 3, 83–99. [Google Scholar] [CrossRef]
- Cao, H.; Liu, J.; Fu, C.; Zhang, W.; Wang, G.; Yang, G.; Luo, L. Urban Expansion and Its Impact on the Land Use Pattern in Xishuangbanna since the Reform and Opening up of China. Remote Sens. 2017, 9, 137. [Google Scholar] [CrossRef]
- Sharifi, A.; Chiba, Y.; Okamoto, K.; Yokoyama, S.; Murayama, A. Can master planning control and regulate urban growth in Vientiane, Laos? Landsc. Urban Plan. 2014, 131, 1–13. [Google Scholar] [CrossRef]
- San, V.; Spoann, V.; Schmidt, J. Industrial pollution load assessment in Phnom Penh, Cambodia using an industrial pollution projection system. Sci. Total Environ. 2018, 615, 990–999. [Google Scholar] [CrossRef]
- Nguyen, T.B.; Samsura, D.A.A.; van der Krabben, E.; Le, A.-D. Saigon-Ho Chi Minh City. Cities 2016, 50, 16–27. [Google Scholar] [CrossRef]
- Li, X.; Zhou, Y.; Zhu, Z.; Liang, L.; Yu, B.; Cao, W. Mapping annual urban dynamics (1985–2015) using time series of Landsat data. Remote Sens. Environ. 2018, 216, 674–683. [Google Scholar] [CrossRef]
- Cao, R.; Chen, Y.; Shen, M.; Chen, J.; Zhou, J.; Wang, C.; Yang, W. A simple method to improve the quality of NDVI time-series data by integrating spatiotemporal information with the Savitzky-Golay filter. Remote Sens. Environ. 2018, 217, 244–257. [Google Scholar] [CrossRef]
- Gao, B.-C. NDWI—A normalized difference water index for remote sensing of vegetation liquid water from space. Remote Sens. Environ. 1996, 58, 257–266. [Google Scholar] [CrossRef]
- Di Gregorio, A.; Jansen, L.J.M. Land Cover Classification System (LCCS): Classification Concepts and User Manual; FAO: Rome, Italy, 2000. [Google Scholar]
- Trimble. eCognition Developer 8.7 User Guide; Trimble Germany GmbH: München, Germany, 2011. [Google Scholar]
- Fang, G.; Yang, J.; Li, Q. SuZhou Urban Expansion and its Fractal Characteristic Analysis. In Sustainable Cities Development and Environment, Pts 1-3; Yang, W.J., Ed.; Trans Tech Publications: Zürich, Switzerland, 2012; Volume 209–211, pp. 499–502. [Google Scholar]
- Liu, F.; Zhang, Z.; Wang, X. Forms of Urban Expansion of Chinese Municipalities and Provincial Capitals, 1970s–2013. Remote Sens. 2016, 8, 930. [Google Scholar] [CrossRef]
- Liu, F.; Zhang, Z.; Shi, L.; Zhao, X.; Xu, J.; Yi, L.; Liu, B.; Wen, Q.; Hu, S.; Wang, X.; et al. Urban expansion in China and its spatial-temporal differences over the past four decades. J. Geogr. Sci. 2016, 26, 1477–1496. [Google Scholar] [CrossRef]
- Xu, J.; Liao, B.; Shen, Q.; Zhang, F.; Mei, A. Urban spatial restructuring in transitional economy—Changing land use pattern in Shanghai. Chin. Geogr. Sci. 2007, 17, 19–27. [Google Scholar] [CrossRef]
- Yin, J.; Yin, Z.; Zhong, H.; Xu, S.; Hu, X.; Wang, J.; Wu, J. Monitoring urban expansion and land use/land cover changes of Shanghai metropolitan area during the transitional economy (1979–2009) in China. Environ. Monit. Assess. 2011, 177, 609–621. [Google Scholar] [CrossRef]
- Peng, W.; Wang, G.; Zhou, J.; Zhao, J.; Yang, C. Studies on the temporal and spatial variations of urban expansion in Chengdu, western China, from 1978 to 2010. Sustain. Cities Soc. 2015, 17, 141–150. [Google Scholar] [CrossRef]
- Chen, J.; Gao, J.; Chen, W. Urban land expansion and the transitional mechanisms in Nanjing, China. Habit. Int. 2016, 53, 274–283. [Google Scholar] [CrossRef]
- Ji, W.; Ma, J.; Twibell, R.W.; Underhill, K. Characterizing urban sprawl using multi-stage remote sensing images and landscape metrics. Comput. Environ. Urban Syst. 2006, 30, 861–879. [Google Scholar] [CrossRef]
- Sun, Y.; Zhao, S.Q.; Qu, W.Y. Quantifying spatiotemporal patterns of urban expansion in three capital cities in Northeast China over the past three decades using satellite data sets. Environ. Earth Sci. 2015, 73, 7221–7235. [Google Scholar] [CrossRef]
- Liu, H.; Weng, Q. Landscape metrics for analysing urbanization-induced land use and land cover changes. Geocarto Int. 2013, 28, 582–593. [Google Scholar] [CrossRef]
- Seto, K.C.; Fragkias, M. Quantifying Spatiotemporal Patterns of Urban Land-use Change in Four Cities of China with Time Series Landscape Metrics. Landsc. Ecol. 2005, 20, 871–888. [Google Scholar] [CrossRef]
- McGarigal, K.; Cushman, S.; Ene, E. FRAGSTATS v4: Spatial Pattern Analysis Program for Categorical and Continuous Maps. Computer Software Program Produced by the Authors at the University of Massachusetts, Amherst. Available online: http://www.umass.edu/landeco/research/fragstats/fragstats.html (accessed on 14 March 2015).
- Qi, Z.-F.; Ye, X.-Y.; Zhang, H.; Yu, Z.-L. Land fragmentation and variation of ecosystem services in the context of rapid urbanization: The case of Taizhou city, China. Stoch. Environ. Res. Risk Assess. 2013, 28, 843–855. [Google Scholar] [CrossRef]
- Ramachandra, T.V.; Aithal, B.H.; Sanna, D.D. Insights to urban dynamics through landscape spatial pattern analysis. Int. J. Appl. Earth Obs. Geoinf. 2012, 18, 329–343. [Google Scholar]
- Thapa, R.B.; Murayama, Y. Examining Spatiotemporal Urbanization Patterns in Kathmandu Valley, Nepal: Remote Sensing and Spatial Metrics Approaches. Remote Sens. 2009, 1, 534–556. [Google Scholar] [CrossRef]
- Su, S.; Jiang, Z.; Zhang, Q.; Zhang, Y. Transformation of agricultural landscapes under rapid urbanization: A threat to sustainability in Hang-Jia-Hu region, China. Appl. Geogr. 2011, 31, 439–449. [Google Scholar] [CrossRef]
- Tian, G.; Wu, J. Comparing urbanization patterns in Guangzhou of China and Phoenix of the USA: The influences of roads and rivers. Ecol. Ind. 2015, 52, 23–30. [Google Scholar] [CrossRef]
- He, X.; Gao, Y.; Niu, J.; Zhao, Y. Landscape Pattern Changes under the Impacts of Urbanization in the Yellow River Wetland––King Zhengzhou as an example. Procedia Environ. Sci. 2011, 10, 2165–2169. [Google Scholar] [CrossRef]
- Herold, M.; Scepan, J.; Clarke, K.C. The use of remote sensing and landscape metrics to describe structures and changes in urban land uses. Environ. Plan. 2002, 34, 1443–1458. [Google Scholar] [CrossRef]
- Buyantuyev, A.; Wu, J.; Gries, C. Multiscale analysis of the urbanization pattern of the Phoenix metropolitan landscape of USA: Time, space and thematic resolution. Landsc. Urban Plan. 2010, 94, 206–217. [Google Scholar] [CrossRef]
- McGee, T.G. Urbanisasi Or Kotadesasi? The Emergence of New Regions of Economic Interaction in Asia; East-West Environment and Policy Institute: Honolulu, HI, USA, 1987. [Google Scholar]
- Percival, T. Articulating Intra-Asian Urbanism: The Production of Satellite City Megaprojects in Phnom Penh; University of Leeds: Leeds, UK, 2012. [Google Scholar]
- Arifwidodo, S.D.; Tanaka, T. The Characteristics of Urban Heat Island in Bangkok, Thailand. Procedia Soc. Behav. Sci. 2015, 195, 423–428. [Google Scholar] [CrossRef]
- Pakarnseree, R.; Chunkao, K.; Bualert, S. Physical characteristics of Bangkok and its urban heat island phenomenon. Build. Environ. 2018, 143, 561–569. [Google Scholar] [CrossRef]
- Fu, Y.; Brookfield, H.; Guo, H.; Chen, J.; Chen, A.; Cui, J. Smallholder rubber plantation expansion and its impact on local livelihoods, land use and agrobiodiversity, a case study from Daka, Xishuangbanna, southwestern China. Int. J. Sustain. Dev. World Ecol. 2009, 16, 22–29. [Google Scholar] [CrossRef]
- Xu, J.; Grumbine, R.E.; Beckschäfer, P. Landscape transformation through the use of ecological and socioeconomic indicators in Xishuangbanna, Southwest China, Mekong Region. Ecol. Ind. 2014, 36, 749–756. [Google Scholar] [CrossRef]
- Fu, Y.; Chen, J.; Guo, H.; Hu, H.; Chen, A.; Cui, J. Agrobiodiversity loss and livelihood vulnerability as a consequence of converting from subsistence farming systems to commercial plantation-dominated systems in Xishuangbanna, Yunnan, China: A household level analysis. Land Degrad. Dev. 2010, 21, 274–284. [Google Scholar] [CrossRef]
- Wang, C.; Myint, S.W.; Fan, P.; Stuhlmacher, M.; Yang, J. The impact of urban expansion on the regional environment in Myanmar: A case study of two capital cities. Landsc. Ecol. 2018, 33, 765–782. [Google Scholar] [CrossRef]
- Dang, A.T.N.; Kumar, L. Application of remote sensing and GIS-based hydrological modelling for flood risk analysis: A case study of District 8, Ho Chi Minh city, Vietnam. Geomat. Nat. Hazards Risk 2017, 8, 1792–1811. [Google Scholar] [CrossRef]
- Singkran, N.; Kandasamy, J. Developing a strategic flood risk management framework for Bangkok, Thailand. Nat. Hazards 2016, 84, 933–957. [Google Scholar] [CrossRef]
- Bosson, A. Forced Migration/Internal Displacement in Burma (with an Emphasis on Government-Controlled Areas); Internal Displacement Monitoring Centre: Geneva, Switzerland, 2007. [Google Scholar]
- Jung, S.; Huynh, D.; Rowe, P.G. The pattern of foreign property investment in Vietnam: The apartment market in Ho Chi Minh City. Habitat Int. 2013, 39, 105–113. [Google Scholar] [CrossRef]
- Shrestha, M.K.; York, A.M.; Boone, C.G.; Zhang, S. Land fragmentation due to rapid urbanization in the Phoenix Metropolitan Area: Analyzing the spatiotemporal patterns and drivers. Appl. Geogr. 2012, 32, 522–531. [Google Scholar] [CrossRef]
- Munroe, D.K.; Croissant, C.; York, A.M. Land use policy and landscape fragmentation in an urbanizing region: Assessing the impact of zoning. Appl. Geogr. 2005, 25, 121–141. [Google Scholar] [CrossRef]
- Niroula, G.S.; Thapa, G.B. Impacts and causes of land fragmentation, and lessons learned from land consolidation in South Asia. Land Use Policy 2005, 22, 358–372. [Google Scholar] [CrossRef]
- Li, H.; Ma, Y.; Liu, W.; Liu, W. Clearance and fragmentation of tropical rain forest in Xishuangbanna, SW, China. Biodivers. Conserv. 2009, 18, 3421–3440. [Google Scholar] [CrossRef]
- Stewart, A.B.; Sritongchuay, T.; Teartisup, P.; Kaewsomboon, S.; Bumrungsri, S. Habitat and landscape factors influence pollinators in a tropical megacity, Bangkok, Thailand. Peer J. 2018, 6, e5335. [Google Scholar] [CrossRef]
- Chaiyarat, R.; Wutthithai, O.; Punwong, P.; Taksintam, W. Relationships between urban parks and bird diversity in the Bangkok metropolitan area, Thailand. Urban Ecosyst. 2018, 22, 201–212. [Google Scholar] [CrossRef]
- Zhang, X.Q. Urban land reform in China. Land Use Policy 1997, 14, 187–199. [Google Scholar] [CrossRef]
- Khaing, T.T. Urbanization: The Structures of Sustainable Urban Landscape of Myanmar. In Proceedings of the International Conference on Burma/Myanmar Studies, Chiang Mai, Thailand, 24–25 July 2015. [Google Scholar]
- Boutry, M.; Sone, K.P.; Par, S.C.; Win, T.M. Land Dynamics and Livelihoods in Peri-Urban Yangon; Livelihoods and Food Security Trust Fund: Yangon, Myanmar, 2015. [Google Scholar]
- Nwe, T.T. Yangon: The Emergence of a New Spatial Order in Myanmar’s Capital City. Sojourn J. Soc. Issues Southeast Asia 1998, 13, 86–113. [Google Scholar] [CrossRef]
- Rafiqui, P.S.; Gentile, M. Vientiane. Cities 2009, 26, 38–48. [Google Scholar] [CrossRef]
- Vongpraseuth, T.; Choi, C.G. Globalization, foreign direct investment, and urban growth management: Policies and conflicts in Vientiane, Laos. Land Use Policy 2015, 42, 790–799. [Google Scholar] [CrossRef]
- Murakami, A.; Medrial Zain, A.; Takeuchi, K.; Tsunekawa, A.; Yokota, S. Trends in urbanization and patterns of land use in the Asian mega cities Jakarta, Bangkok, and Metro Manila. Landsc. Urban Plan. 2005, 70, 251–259. [Google Scholar] [CrossRef]
- Hara, Y.; Takeuchi, K.; Okubo, S. Urbanization linked with past agricultural landuse patterns in the urban fringe of a deltaic Asian mega-city: A case study in Bangkok. Landsc. Urban Plan. 2005, 73, 16–28. [Google Scholar] [CrossRef]
- Browder, J.O.; Bohland, J.R.; Scarpaci, J.L. Patterns of development on the metropolitan fringe: Urban fringe expansion in Bangkok, Jakarta, and Santiago. J. Am. Plan. Assoc. 1995, 61, 310–327. [Google Scholar] [CrossRef]
- Thien Thu, T.; Perera, R. Intermediate levels of property rights and the emerging housing market in Ho Chi Minh City, Vietnam. Land Use Policy 2011, 28, 124–138. [Google Scholar] [CrossRef]
- Thien Thu, T.; Perera, R. Consequences of the two-price system for land in the land and housing market in Ho Chi Minh City, Vietnam. Habitat Int. 2011, 35, 30–39. [Google Scholar] [CrossRef]
- Nguyen, Q.T. The Main Causes of Land Subsidence in Ho Chi Minh City. Procedia Eng. 2016, 142, 334–341. [Google Scholar] [CrossRef]
- Storch, H.; Downes, N.K. A scenario-based approach to assess Ho Chi Minh City’s urban development strategies against the impact of climate change. Cities 2011, 28, 517–526. [Google Scholar] [CrossRef]
- Storch, H.; Downes, N.; Katzschner, L.; Thinh, N.X. Building resilience to climate change through adaptive land use planning in Ho Chi Minh City, Vietnam. In Resilient Cities; Springer: Dordrecht, Netherlands, 2011; pp. 349–363. [Google Scholar]
- Novelli, A.; Aguilar, M.; Aguilar, F.; Nemmaoui, A.; Tarantino, E. AssesSeg—A Command Line Tool to Quantify Image Segmentation Quality: A Test Carried Out in Southern Spain from Satellite Imagery. Remote Sens. 2017, 9, 40. [Google Scholar] [CrossRef]
- Liu, Y.; Bian, L.; Meng, Y.; Wang, H.; Zhang, S.; Yang, Y.; Shao, X.; Wang, B. Discrepancy measures for selecting optimal combination of parameter values in object-based image analysis. ISPRS 2012, 68, 144–156. [Google Scholar] [CrossRef]
- Zhou, Y.; Yang, G.; Wang, S.; Wang, L.; Wang, F.; Liu, X. A new index for mapping built-up and bare land areas from Landsat-8 OLI data. Remote Sens. Lett. 2014, 5, 862–871. [Google Scholar] [CrossRef]
Figure 1.
Locations of six typical cities in the Greater Mekong Subregion (GMS).

Figure 2.
Population growth of the typical cities from 1990 to 2015.

Figure 3.
Land use classification scheme for major cities in the GMS. Words in parentheses are classification criteria, words in bold fonts are classification results using criteria above them. NDVI, Normalized Difference Vegetation Index [39,40]; NDWI, Normalized Difference Water Index [41]. Land use types are highlighted in red color.

Figure 4.
Land use maps of typical cities in the GMS in 1990, 1995, 2000, 2005, 2010, 2015, respectively (from left to right): (a) Xishuangbanna; (b) Yangon; (c) Vientiane; (d) Phnom Penh; (e) Bangkok; and (f) Ho Chi Minh City.
Figure 4.
Land use maps of typical cities in the GMS in 1990, 1995, 2000, 2005, 2010, 2015, respectively (from left to right): (a) Xishuangbanna; (b) Yangon; (c) Vientiane; (d) Phnom Penh; (e) Bangkok; and (f) Ho Chi Minh City.

Figure 5.
Spatial orientation of urban expansion in typical cities from 1990 to 2015: (a) Xishuangbanna; (b) Yangon; (c) Vientiane; (d) Phnom Penh; (e) Bangkok; and (f) Ho Chi Minh City.
Figure 5.
Spatial orientation of urban expansion in typical cities from 1990 to 2015: (a) Xishuangbanna; (b) Yangon; (c) Vientiane; (d) Phnom Penh; (e) Bangkok; and (f) Ho Chi Minh City.

Figure 6.
Landscape metrics (COHESION, DIVISION and AI) for six major cities in GMS. (a) represents COHESION of Xishuangbanna, (b) represents DIVISION of Xishuangbanna, (c) represents AI of Xishuangbanna, (d) represents COHESION of Yangon, (e) represents DIVISION of Yangon, (f) represents AI of Yangon, (g) represents COHESION of Vientiane, (h) represents DIVISION of Vientiane, (i) represents AI of Vientiane, (j) represents COHESION of Phnom Penh, (k) represents DIVISION of Phnom Penh, (l) represents AI of Phnom Penh, (m) represents COHESION of Bangkok, (n) represents DIVISION of Bangkok, (o) represents AI of Bangkok, (p) represents COHESION of Ho Chi Minh City, (q) represents DIVISION of Ho Chi Minh City, (r) represents AI of Ho Chi Minh City.

Figure 7.
Gradient-direction maps of typical cities in the GMS in 1990, 1995, 2000, 2005, 2010, 2015, respectively (from left to right): (a) Xishuangbanna; (b) Yangon; (c) Vientiane; (d) Phnom Penh; (e) Bangkok; and (f) Ho Chi Minh City.
Figure 7.
Gradient-direction maps of typical cities in the GMS in 1990, 1995, 2000, 2005, 2010, 2015, respectively (from left to right): (a) Xishuangbanna; (b) Yangon; (c) Vientiane; (d) Phnom Penh; (e) Bangkok; and (f) Ho Chi Minh City.

Figure 8.
Variation of the CONTAG index in typical cities.

Table 1.
Classification accuracy of the typical cities in the Greater Mekong Subregion (GMS).
| City | Accuracy | 1990 | 1995 | 2000 | 2005 | 2010 | 2015 |
|---|---|---|---|---|---|---|---|
| Xishuangbanna | Overall Accuracy | 92.12% | 92.50% | 93.85% | 94.42% | 91.73% | 94.23% |
| Kappa Value | 0.8681 | 0.8816 | 0.9026 | 0.9158 | 0.8781 | 0.9161 | |
| Yangon | Overall Accuracy | 81.73% | 86.73% | 83.65% | 92.50% | 91.54% | 96.92% |
| Kappa Value | 0.7543 | 0.8298 | 0.7972 | 0.9058 | 0.8975 | 0.963 | |
| Vientiane | Overall Accuracy | 91.36% | 93.18% | 91.82% | 90.23% | 86.14% | 87.27% |
| Kappa Value | 0.879 | 0.9037 | 0.8852 | 0.8647 | 0.817 | 0.8302 | |
| Phnom Penh | Overall Accuracy | 83.93% | 89.82% | 88.21% | 89.82% | 90.00% | 95.18% |
| Kappa Value | 0.8116 | 0.8795 | 0.8605 | 0.8807 | 0.8847 | 0.9434 | |
| Bangkok | Overall Accuracy | 89.33% | 94.22% | 91.33% | 94.67% | 91.56% | 89.33% |
| Kappa Value | 0.8637 | 0.9262 | 0.8886 | 0.9311 | 0.8894 | 0.8598 | |
| Ho Chi Minh City | Overall Accuracy | 85.94% | 91.62% | 87.50% | 83.53% | 91.91% | 91.41% |
| Kappa Value | 0.8453 | 0.9079 | 0.862 | 0.8174 | 0.9101 | 0.9035 |
Table 2.
Landscape metrics used in this study.
| Definition | Description | Reference |
|---|---|---|
| aij = area (m2) of patch ij. A = total landscape area (m2). | [52,56,57] | |
| pij* = perimeter of patch ij in terms of number of cell surfaces. aij* = area of patch ij in terms of number of cells. Z = total number of cells in the landscape. | [53,58] | |
| gii = number of like adjacencies (joins) between pixels of patch type (class) i based on the single-count method. max→gii = maximum number of like adjacencies (joins) between pixels of patch type (class) i based on the single-count method. | [53,59,60] | |
| Pi = proportion of the landscape occupied by patch type (class) i. gik = number of adjacencies (joins) between pixels of patch types (classes) i and k based on the double-count method. m = number of patch types (classes) present in the landscape, including the landscape border if present. | [52,58,61,62,63] |
Table 3.
Area of land use types in Xishuangbanna from 1990 to 2015.
| Land Use Types | Area (km2) | |||||
|---|---|---|---|---|---|---|
| 1990 | 1995 | 2000 | 2005 | 2010 | 2015 | |
| Built up | 40.74 | 60.12 | 80.53 | 97.98 | 129.03 | 193.61 |
| Rubber | 801.82 | 1036.88 | 2002.65 | 2456.00 | 3728.47 | 4077.05 |
| Shrub | 3968.51 | 4323.63 | 2945.92 | 2993.34 | 1736.86 | 1781.44 |
| Forest | 12,901.05 | 12,241.98 | 12,326.49 | 11,740.89 | 11,478.11 | 11,039.05 |
| Paddy | 772.58 | 816.77 | 838.94 | 791.35 | 818.70 | 788.54 |
| Upland field | 266.64 | 290.44 | 577.69 | 688.19 | 785.36 | 777.19 |
| Pending construction | 0.97 | 3.30 | 0.75 | 5.86 | 12.45 | 33.47 |
| Rural | 10.12 | 21.85 | 25.65 | 38.90 | 85.98 | 114.95 |
| Road | 4.30 | 4.26 | 9.14 | 13.59 | 21.01 | 20.96 |
| Water | 28.71 | 39.27 | 41.40 | 43.68 | 52.24 | 56.01 |
| Flood land | 9.20 | 4.73 | 5.54 | 6.10 | 4.03 | 0.25 |
| River | 122.18 | 124.39 | 117.54 | 114.75 | 118.32 | 122.46 |
| Others | 130.77 | 87.56 | 82.52 | 66.03 | 85.38 | 50.20 |
Table 4.
Area of land use types in Yangon from 1990 to 2015.
| Land Use Types | Area (km2) | |||||
|---|---|---|---|---|---|---|
| 1990 | 1995 | 2000 | 2005 | 2010 | 2015 | |
| Built up | 155.42 | 223.76 | 259.30 | 294.04 | 314.21 | 359.77 |
| Paddy | 605.19 | 483.35 | 507.22 | 429.87 | 395.57 | 354.02 |
| Other crops | 25.13 | 26.74 | 30.74 | 37.64 | 79.75 | 94.95 |
| Water | 23.30 | 25.08 | 26.46 | 43.72 | 20.54 | 19.40 |
| River | 51.80 | 51.77 | 50.73 | 49.76 | 49.69 | 48.58 |
| Aquaculture | 0.55 | 1.31 | 3.76 | 4.36 | 7.60 | 9.29 |
| Forest | 65.41 | 69.39 | 67.85 | 70.47 | 68.62 | 64.07 |
| Shrub/Grassland | 23.94 | 27.36 | 31.97 | 36.33 | 33.66 | 32.55 |
| Golf course | 5.37 | 5.46 | 7.66 | 8.13 | 9.40 | 9.35 |
| Pending construction | 42.67 | 84.54 | 13.07 | 24.46 | 19.73 | 6.78 |
Table 5.
Area of land use types in Vientiane from 1990 to 2015.
| Land Use Types | Area (km2) | |||||
|---|---|---|---|---|---|---|
| 1990 | 1995 | 2000 | 2005 | 2010 | 2015 | |
| Built up | 61.91 | 75.51 | 125.93 | 150.31 | 160.09 | 204.40 |
| Water | 102.58 | 89.68 | 95.67 | 90.85 | 99.26 | 91.15 |
| Forest | 2415.76 | 2249.02 | 2213.62 | 2004.04 | 1808.64 | 1781.98 |
| Others | 26.80 | 56.66 | 44.06 | 62.36 | 81.29 | 120.46 |
| Upland field | 52.07 | 54.47 | 52.31 | 119.32 | 165.70 | 197.93 |
| Paddy | 804.72 | 938.07 | 928.59 | 1018.10 | 1136.06 | 1047.89 |
| Shrub | 2.76 | 2.76 | 2.00 | 3.37 | 4.70 | 5.33 |
| River | 73.79 | 68.54 | 75.97 | 73.72 | 77.10 | 81.92 |
| Grassland | 4.89 | 5.51 | 5.06 | 22.59 | 14.85 | 26.25 |
| Orchard | 1.79 | 1.78 | 1.78 | 2.73 | 1.80 | 3.17 |
| Tidal flat | 18.93 | 23.72 | 21.48 | 18.29 | 16.82 | 5.02 |
Table 6.
Area of land use types in Phnom Penh from 1990 to 2015.
| Land Use Types | Area (km2) | |||||
|---|---|---|---|---|---|---|
| 1990 | 1995 | 2000 | 2005 | 2010 | 2015 | |
| Built up | 30.39 | 43.22 | 56.27 | 88.07 | 96.56 | 120.67 |
| Paddy | 260.57 | 281.83 | 274.39 | 245.67 | 229.17 | 247.53 |
| Tidal flat | 62.29 | 75.04 | 78.11 | 52.19 | 50.44 | 14.28 |
| Aquaculture | 2.52 | 2.49 | 3.35 | 4.02 | 5.10 | 4.79 |
| River | 37.30 | 37.77 | 37.85 | 37.77 | 37.64 | 37.58 |
| Others | 17.72 | 13.90 | 16.17 | 28.55 | 40.71 | 35.25 |
| Water | 69.59 | 46.72 | 32.47 | 46.12 | 43.45 | 42.45 |
| Aquatic crop | 8.27 | 11.80 | 11.76 | 13.00 | 12.99 | 11.61 |
| Swamp | 3.25 | 1.32 | 1.75 | 3.70 | 7.78 | 11.68 |
| Grassland | 104.77 | 82.26 | 77.60 | 72.19 | 59.81 | 45.48 |
| Shrub | 8.24 | 8.84 | 9.03 | 9.58 | 10.67 | 11.21 |
| Forest | 34.44 | 24.35 | 26.64 | 26.38 | 29.59 | 35.99 |
| Orchard | 2.48 | 4.54 | 4.54 | 4.47 | 4.85 | 5.39 |
| Rural | 36.02 | 43.76 | 47.91 | 46.14 | 49.08 | 53.90 |
Table 7.
Area of land use types in Bangkok from 1990 to 2015.
| Land Use Types | Area (km2) | |||||
|---|---|---|---|---|---|---|
| 1990 | 1995 | 2000 | 2005 | 2010 | 2015 | |
| Built up | 513.98 | 569.79 | 637.65 | 661.82 | 685.50 | 714.22 |
| Water | 44.42 | 46.67 | 50.94 | 50.02 | 45.14 | 42.20 |
| Paddy | 565.50 | 510.03 | 463.11 | 460.33 | 459.40 | 454.47 |
| Orchard | 220.33 | 202.69 | 171.17 | 158.11 | 148.40 | 130.02 |
| Aquaculture | 73.24 | 72.75 | 77.60 | 75.97 | 71.86 | 70.16 |
| Grassland | 11.41 | 13.32 | 12.80 | 12.80 | 12.83 | 12.61 |
| Golf course | 12.36 | 13.68 | 15.39 | 15.39 | 15.39 | 15.39 |
| Forest/Shrub | 125.05 | 136.20 | 138.32 | 134.56 | 131.60 | 131.33 |
| Others | 4.47 | 5.63 | 3.75 | 1.76 | 0.64 | 0.35 |
Table 8.
Area of land use types in Ho Chi Minh City from 1990 to 2015.
| Land Use Types | Area (km2) | |||||
|---|---|---|---|---|---|---|
| 1990 | 1995 | 2000 | 2005 | 2010 | 2015 | |
| Built up | 109.09 | 146.32 | 246.22 | 312.76 | 386.83 | 433.85 |
| Forest | 222.89 | 234.66 | 301.63 | 295.19 | 253.39 | 242.66 |
| Water | 11.74 | 8.52 | 8.31 | 6.85 | 7.93 | 6.91 |
| Orchard | 32.74 | 37.31 | 58.66 | 79.04 | 79.46 | 77.82 |
| Aquaculture | 10.06 | 26.98 | 114.30 | 111.04 | 112.78 | 114.23 |
| Annual crop | 216.38 | 219.06 | 82.67 | 74.11 | 92.64 | 92.25 |
| Perennial crop | 152.28 | 164.18 | 223.79 | 202.10 | 191.41 | 181.11 |
| Mangrove | 322.76 | 334.41 | 332.58 | 330.78 | 330.91 | 331.15 |
| Shrub | 0.23 | 0.36 | 0.50 | 0.88 | 0.88 | 0.81 |
| Grassland | 4.59 | 7.67 | 25.14 | 28.04 | 39.13 | 46.31 |
| River | 156.62 | 159.04 | 158.58 | 157.47 | 156.55 | 158.20 |
| Land to be used | 326.30 | 241.54 | 67.24 | 42.91 | 23.13 | 30.79 |
| Paddy | 160.63 | 146.67 | 114.61 | 94.51 | 87.70 | 80.21 |
| Tidal flat | 4.47 | 1.47 | 11.68 | 2.74 | 3.14 | 0.18 |
| Swamp | 3.08 | 4.33 | 3.91 | 3.91 | 4.10 | 4.11 |
| Low density built up | 214.07 | 216.58 | 199.31 | 206.79 | 179.13 | 148.52 |
Table 9.
Urban expansion intensity (UEI) of typical cities in the GMS.
| City | 1990–1995 | 1995–2000 | 2000–2005 | 2005–2010 | 2010–2015 | 1990–2015 |
|---|---|---|---|---|---|---|
| Xishuangbanna | 9.51 | 6.79 | 4.33 | 6.34 | 10.01 | 15.01 |
| Yangon | 8.79 | 3.18 | 2.68 | 1.37 | 2.90 | 5.26 |
| Vientiane | 4.96 | 11.29 | 4.04 | 2.48 | 4.93 | 9.15 |
| Phnom Penh | 8.45 | 6.04 | 11.30 | 1.93 | 4.99 | 11.88 |
| Bangkok | 2.17 | 2.38 | 0.76 | 0.72 | 0.84 | 1.56 |
| Ho Chi Minh City | 6.83 | 13.66 | 5.40 | 4.74 | 2.43 | 11.91 |
© 2019 by the authors. Licensee MDPI, Basel, Switzerland. This article is an open access article distributed under the terms and conditions of the Creative Commons Attribution (CC BY) license (http://creativecommons.org/licenses/by/4.0/).
Share and Cite
MDPI and ACS Style
Cao, H.; Liu, J.; Chen, J.; Gao, J.; Wang, G.; Zhang, W. Spatiotemporal Patterns of Urban Land Use Change in Typical Cities in the Greater Mekong Subregion (GMS). Remote Sens. 2019, 11, 801. https://doi.org/10.3390/rs11070801
AMA Style
Cao H, Liu J, Chen J, Gao J, Wang G, Zhang W. Spatiotemporal Patterns of Urban Land Use Change in Typical Cities in the Greater Mekong Subregion (GMS). Remote Sensing. 2019; 11(7):801. https://doi.org/10.3390/rs11070801
Chicago/Turabian StyleCao, Hui, Jian Liu, Jianglong Chen, Jinlong Gao, Guizhou Wang, and Wanfeng Zhang. 2019. "Spatiotemporal Patterns of Urban Land Use Change in Typical Cities in the Greater Mekong Subregion (GMS)" Remote Sensing 11, no. 7: 801. https://doi.org/10.3390/rs11070801
Note that from the first issue of 2016, this journal uses article numbers instead of page numbers. See further details here.