Mapping Climatological Bare Soil Albedos over the Contiguous United States Using MODIS Data


1
School of Remote Sensing and Information Engineering, Wuhan University, Wuhan 430079, China
2
State Key Laboratory of Information Engineering in Surveying, Mapping and Remote Sensing, Wuhan University, Wuhan 430079, China
3
USDA-ARS Hydrology and Remote Sensing Laboratory, Beltsville, MD 20705, USA
4
Department of Geographical Sciences, University of Maryland, College Park, MD 20742, USA
*
Author to whom correspondence should be addressed.
Remote Sens. 2019, 11(6), 666; https://doi.org/10.3390/rs11060666
Submission received: 30 January 2019
/
Revised: 14 March 2019
/
Accepted: 16 March 2019
/
Published: 19 March 2019
(This article belongs to the Special Issue Remotely Sensed Albedo)
Abstract
:Surface bare soil albedo is an important variable in climate modeling studies and satellite-based retrievals of land-surface properties. In this study, we used multiyear 500 m albedo products from the Moderate Resolution Imaging Spectroradiometer (MODIS) to derive the bare soil albedo for seven spectral bands and three broadbands over the contiguous United States (CONUS). The soil line based on red and green spectral signatures derived from MODIS data was used as the basis to detect and extract bare soil albedo. A comparison against bare soil albedo derived from 30 m Landsat data has been made, showing that the MODIS bare soil albedo had a bias of 0.003 and a root-mean-square-error (RMSE) of 0.036. We found that the bare soil albedo was negatively correlated with soil moisture from the Advanced Microwave Scanning Radiometer-Earth Observing System (AMSR-E), with a relatively stable exponential relationship reflecting the darkening effect that moisture has on most soils. However, quantification of the relationship between bare soil albedo and soil moisture still needs to be improved through simultaneous and instantaneous measurements at a finer spatial resolution. Statistics of the multiyear climatological bare soil albedos calculated using soil types and the International Geosphere-Biosphere Programme (IGBP) land cover types suggest that: Land cover type is a better indicator for determining the magnitude of bare soil albedos for the vegetated areas, as the vegetation density is correlated with soil moisture; and soil type is a better indicator for determining the slope of soil lines over sparsely vegetated areas, as it contains information of the soil texture, roughness, and composition. The generated bare soil albedo can be applied to improve the parameterization of surface energy budget in climate and remote sensing models as well as the retrieval accuracy of some satellite products.
1. Introduction
Bare soil albedo has been widely used in climate models and remote sensing estimates of surface energy balance as one key component of the surface albedo by determining the amount of solar radiation reflected and absorbed at the Earth’s surface [1,2]. Bare soil albedo has also been widely used in ecological research as a controlling factor in algorithms for deriving leaf area index (LAI) and fraction of Photosynthesis Active Radiation (fPAR) from satellite observations, which requires fine resolution data for satellite applications, e.g., [3,4]. A limited number of prescribed bare soil albedo values are assigned based on global soil color maps [5,6,7]. However, soil reflectivity varies both temporally and spatially. Besides soil color, bare soil albedo is also a function of moisture content [8,9], organic matter [10], texture/roughness [11], and other surface characteristics. Oversimplified soil albedo parameterization has been reported to introduce uncertainties both in climate modeling [12,13] and satellite LAI/fPAR products [14,15,16,17]. Significant differences in soil albedo were found in comparisons of land surface models and satellite products [12], which lead to substantially different estimations of surface energy balance and hydrologic budget partitioning [18].
Efforts have been made towards generating global or regional soil albedo datasets that are independent of coarse resolution soil color maps. Zhou et al. [19] analyzed the Moderate Resolution Imaging Spectroradiometer (MODIS) 1 km albedo products over desert areas using principle component analysis and found the extracted spatial pattern could improve the soil albedo parameterization in climate models. In a recent study, a method has been proposed to estimate soil albedo by removing impacts of solar zenith angle and soil moisture empirically from MODIS albedo products [20]. In their method, coarse resolution (~15–100 km) soil moisture data from the North American and Global Land Data Assimilation System (LDAS) were used.
To develop a bare soil albedo dataset over densely vegetated area and without the support of reanalysis data, a method has been developed based on an empirical relationship between broadband albedos and the Normalized Difference Vegetation Index (NDVI) [21]. In their method, broadband albedo of bare soil over densely vegetated area was predicted through extrapolation of linear logarithmic relationship between albedo and NDVI. It was proposed that bare soil albedos were estimated at NDVI = 0.09 globally, based on the empirical relationship. However, we found that this empirical relationship could generate larger values for visible albedo than near infrared albedo due to lack of training data for extrapolation purposes. In addition, previous studies have proved that NDVI may not be a good quantitative indicator of surfaces with sparse vegetation coverage because of mutual shadow effects on surface anisotropy [22,23].
Pisek and Chen [16] proposed a method using multi-angular satellite observations to map background spectral reflectance in forested pixels and found significant variations between coniferous and deciduous forests, particularly in the near infrared wavelengths.
In some recent studies, MODIS LAI and fPAR products were introduced to calculate vegetation fraction used in a linear regression to estimate soil albedo and the difference of vegetation and soil albedos based on the assumption that these two variables were invariant within a certain period [24,25]. This was later improved by using a Kalman filter to generate dynamic albedo on a daily basis [26]. However, MODIS LAI/fPAR products were derived assuming a prescribed bare soil albedo based on a soil type map, and these products were believed to have lower reliability during the vegetation growing season [14,15].
Existing bare soil albedo datasets are subject to several limitations. First, most suffer from uncertainties in ancillary input products used in the albedo retrieval algorithm due to, for example residual cloud contamination, inaccurate soil maps, or scale differences between model inputs and the retrieval scale. Second, most of the existing global bare soil albedo datasets are only available at a spatial resolution coarser than 5 km, which cannot satisfy the increasing demand for high resolution soil parameterizations, especially in agricultural and ecological applications, e.g., [27]. Third, validation of these datasets has been generally limited to inter-comparison against model-simulated results.
In addition to mapping the broadband albedo for bare soil, there is also a need to generate spatially dynamic background spectral reflectance/albedo to improve the LAI/fPAR estimates from remote sensing data [16]. Thus, it is important to develop an approach that can generate both spectral and broadband albedos at a fine spatial resolution (e.g., 30–500 m) to satisfy the needs of climate modeling and ecosystem monitoring purposes. Significant impacts of soil moisture content on soil reflectivity have been reported based on laboratory measurements [28,29], ground measurements [8,9,30], and satellite products [31,32,33]. However, few studies have demonstrated the relationship over a large spatial domain, which is critical for land surface energy balance and hydrological modeling purposes.
The concept of a “soil line”, a linear relationship between red and near infrared (NIR) reflectances typically observed over bare soils, has been widely used to discriminate vegetation from soil using spectral information [34,35,36,37,38,39]. The soil line has been commonly used to develop the vegetation indices, such as the simple ratio (SR), NDVI, Enhanced Vegetation Index (EVI), and Soil-Adjusted Vegetation Index (SAVI), to identify dense vegetation. However, this concept had mostly been applied to extracting information about the vegetation canopy rather than the understory and soil.
The purpose of this study is to build a 500 m bare soil albedo dataset over the contiguous United States (CONUS) on a pixel-basis from multi-year MODIS data based on the soil line feature and to explore the relationship between bare soil albedo and other surface properties such as soil moisture, soil type, and vegetation type. A description of the data and methodology is given in Section 2. Comparison results against Landsat data are presented in Section 3 and are followed by the evaluation of soil albedo with regards to soil moisture content, soil type, and land cover type.
2. Materials and Methods
2.1. MODIS Albedo Anisotropy Products
The MODIS albedo and bidirectional reflectance distribution function (BRDF) products (MCD43A) [40] are available at a 500 m resolution globally using a 16-day temporal acquisition window. Of the available albedo anisotropy products, this study primarily used three datasets: Spectral/broadband albedos, nadir view corrected surface spectral reflectance, and quality control (QC) flags (overall accuracy and snow flag). Two types of albedos were included in the MODIS products: Black-sky albedo (BSA), also called directional-hemispherical albedo, and white-sky albedo (WSA), also called bi-hemispherical albedo. Datasets covering CONUS were chosen for the 13-year period from 2000 to 2012. Information of the datasets used in this study is summarized in Table 1.
To assist in the removal of possible vegetation, water, snow, and residual cloud shadow contaminated albedo values, the NDVI and normalized difference water index (NDWI) [41] were used, calculated from nadir BRDF-adjusted reflectances (NBAR) for the spectral bands (Equations (1) and (2)).
where , , and are the spectral reflectances for MODIS band 1 (620–670 nm), band 2 (841–876 nm), and band 5 (1230–1250 nm), respectively.
2.2. Soil Type Map
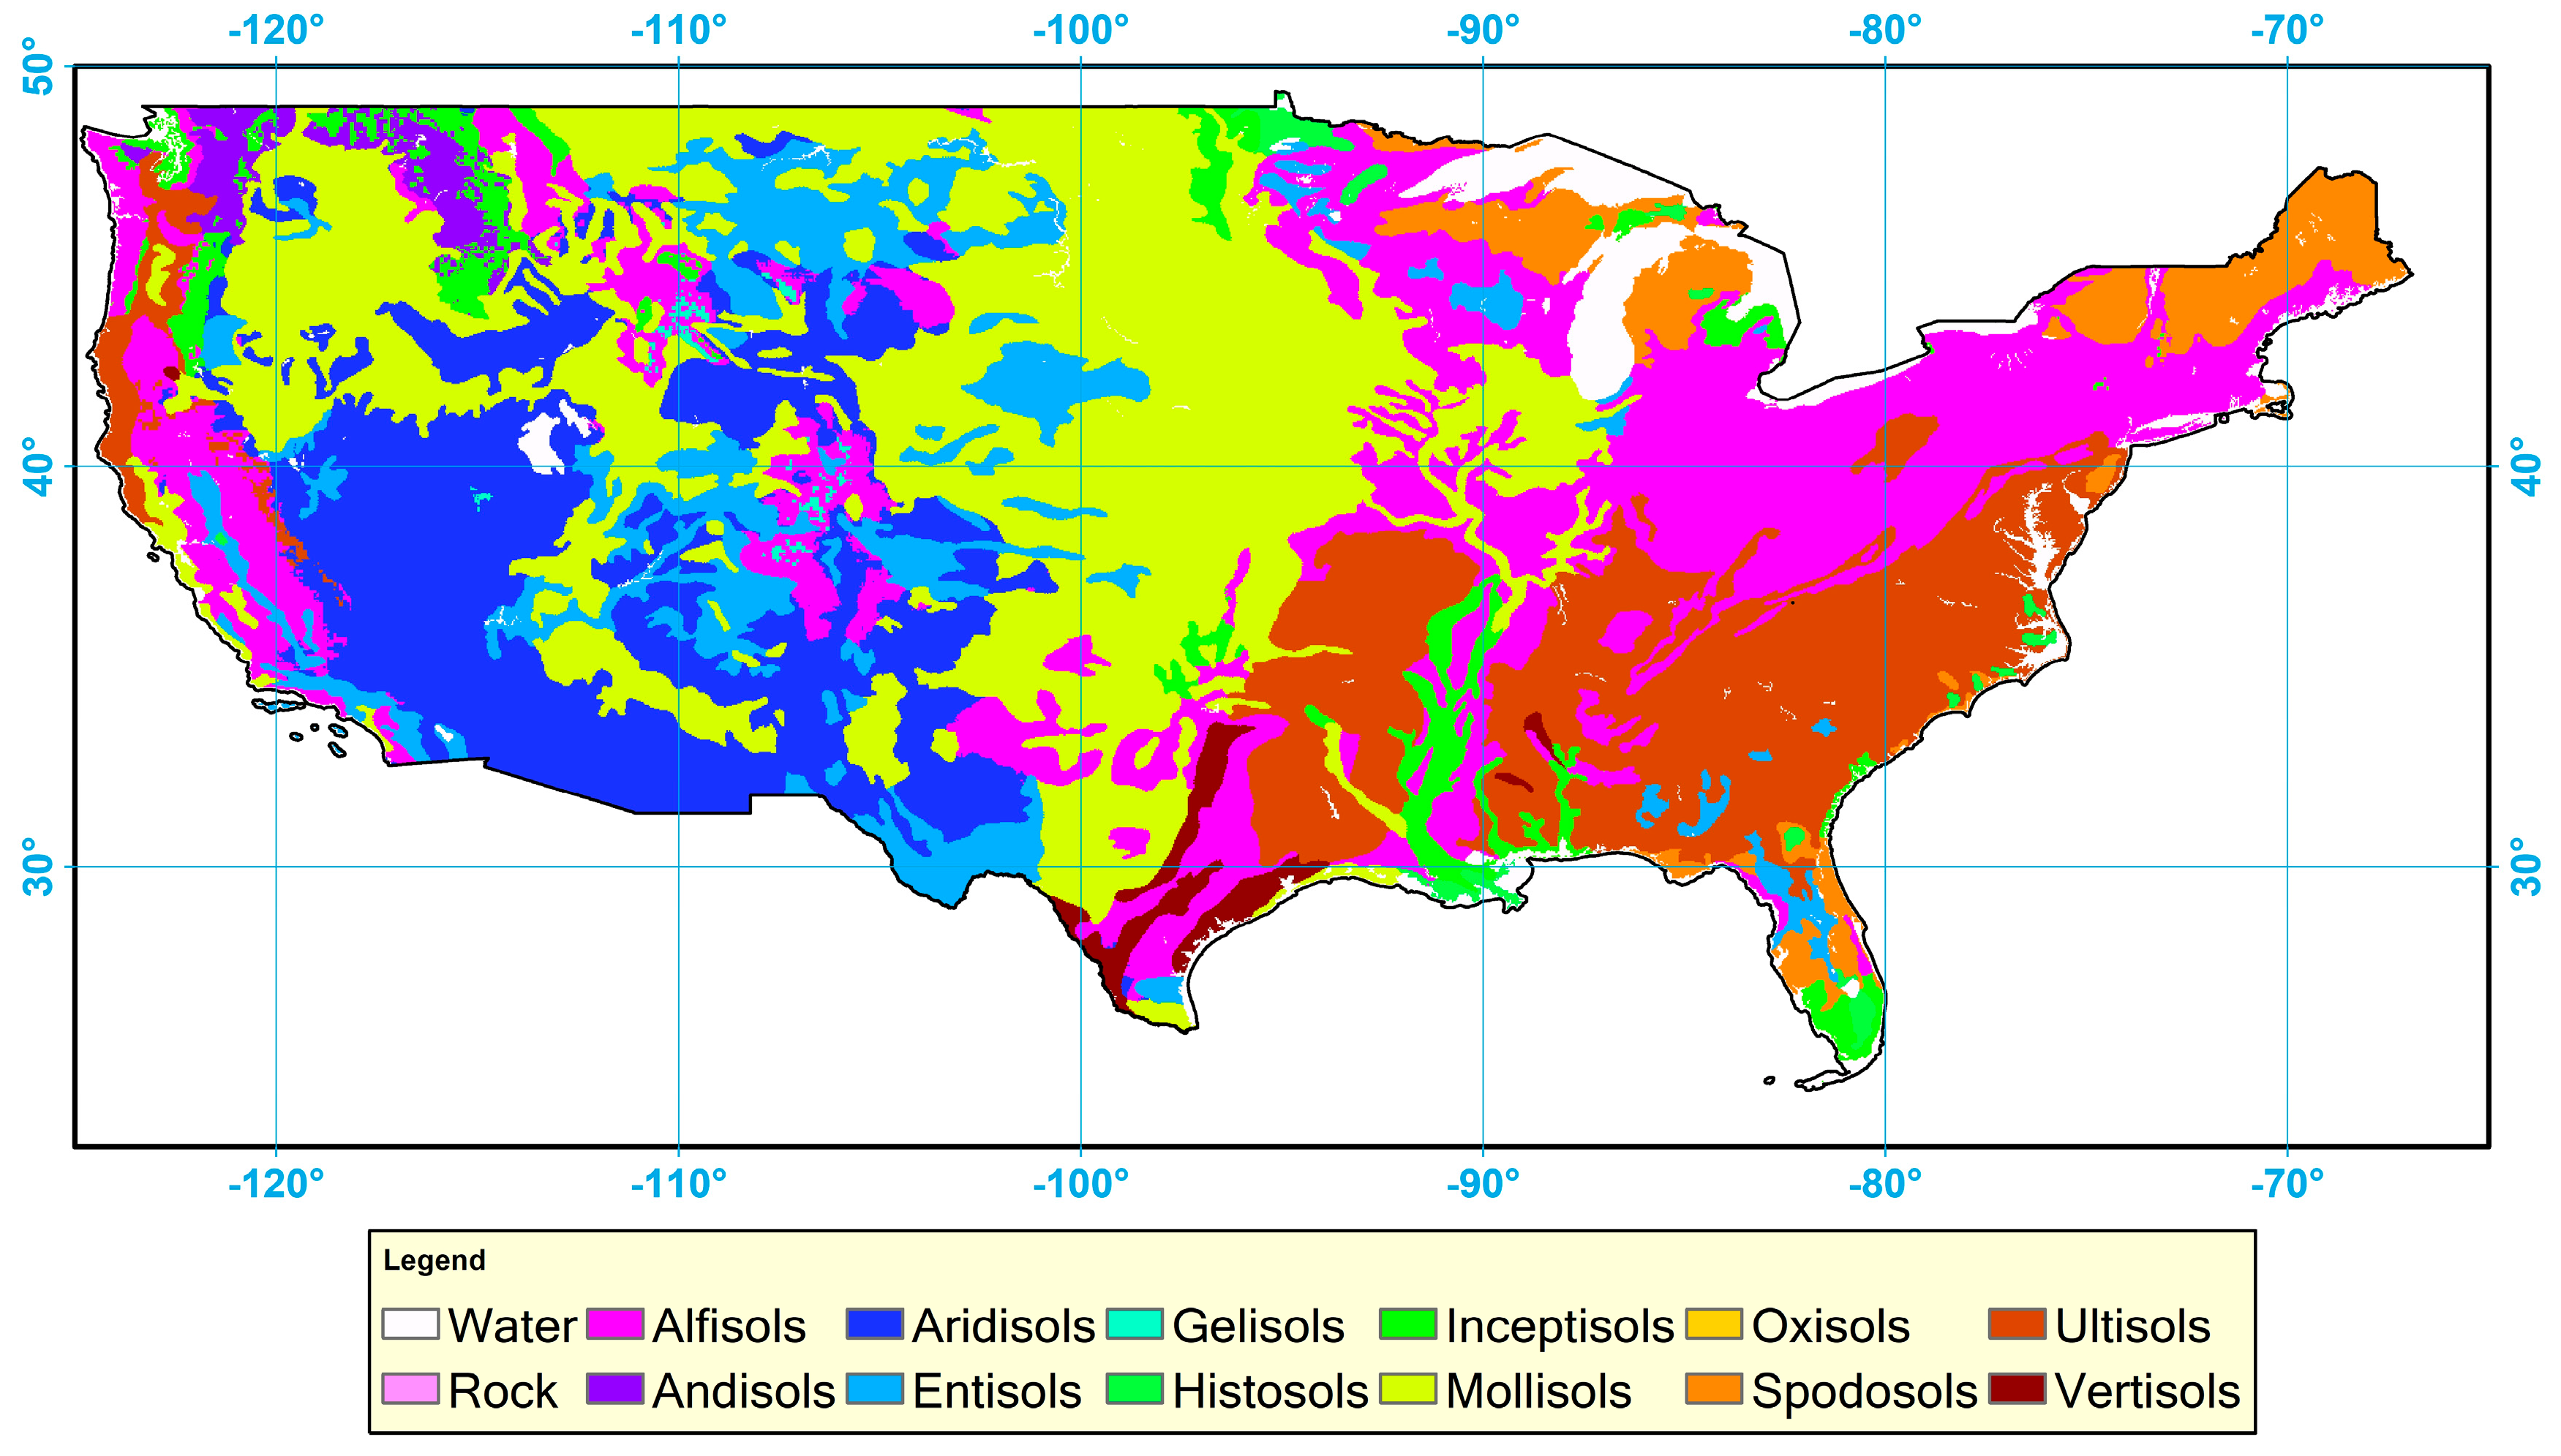
Current climate and ecological modeling applications generally use maps of soil type to assign albedo values to certain locations [42] because soil type is believed to be the dominant factor controlling soil reflectivity. The Natural Resources Conservation Service (NRCS) in the U.S. Department of Agriculture (USDA) provides a general soil taxonomy map for the CONUS (Figure 1). In the soil taxonomy map, a dominant soil type is given for each pixel at 2 arcmin resolution (~4 km) from the 12 soil types, including: Alfisols, Andisols, Aridisols, Entisols, Gelisols, Histosols, Inceptisols, Mollisols, Oxisols, Spodosols, Ultisols, and Vertisols [43]. This soil type map was used in the soil albedo derivation methodology described in the following sections.
2.3. Using the Soil Line to Detect Bare Soil
In the solar shortwave range, bare soil surfaces normally have small reflectivity in shorter wavelength, with reflectance gradually increasing with wavelength [44,45]. In contrast, a vegetation canopy has very strong absorption in the visible spectrum and back scattering in the near infrared spectrum. The soil line is one of the key and stable spectral signatures of soil and has been examined in many experiments [34,35,36]. The soil line describes the linear feature (the “envelope”) of surface reflectivity in multi-band space over a landscape of a given soil type. For example, the soil line is the lower envelope in the red-NIR space and has been commonly used to identify areas with dense vegetation. However, in practice, the red-NIR soil line can exhibit significant variation because both residual vegetation (leaf litter) and soil moisture may affect the NIR reflectivity greatly. This can cause problems for deriving a universal threshold to separate soil from vegetation, especially when sparse vegetation cover is not available for certain surfaces. In contrast, the green-red based soil line is very stable [35,46]. To verify the green-red soil line feature, surface spectra from Advanced Spaceborne Thermal Emission and Reflection Radiometer (ASTER) and US Geological Survey (USGS) spectral libraries [44,45] were collected and used to identify soil line features with different combinations of spectral albedo and vegetation/soil related indices including NDVI, EVI, SR, NDWI, and Visible Atmospherically Resistant Index (VARI). Of all combinations tested, the green-red band combination could detect soil line with the highest R2 of 0.92, while the others ranged from 0.6 to 0.8.
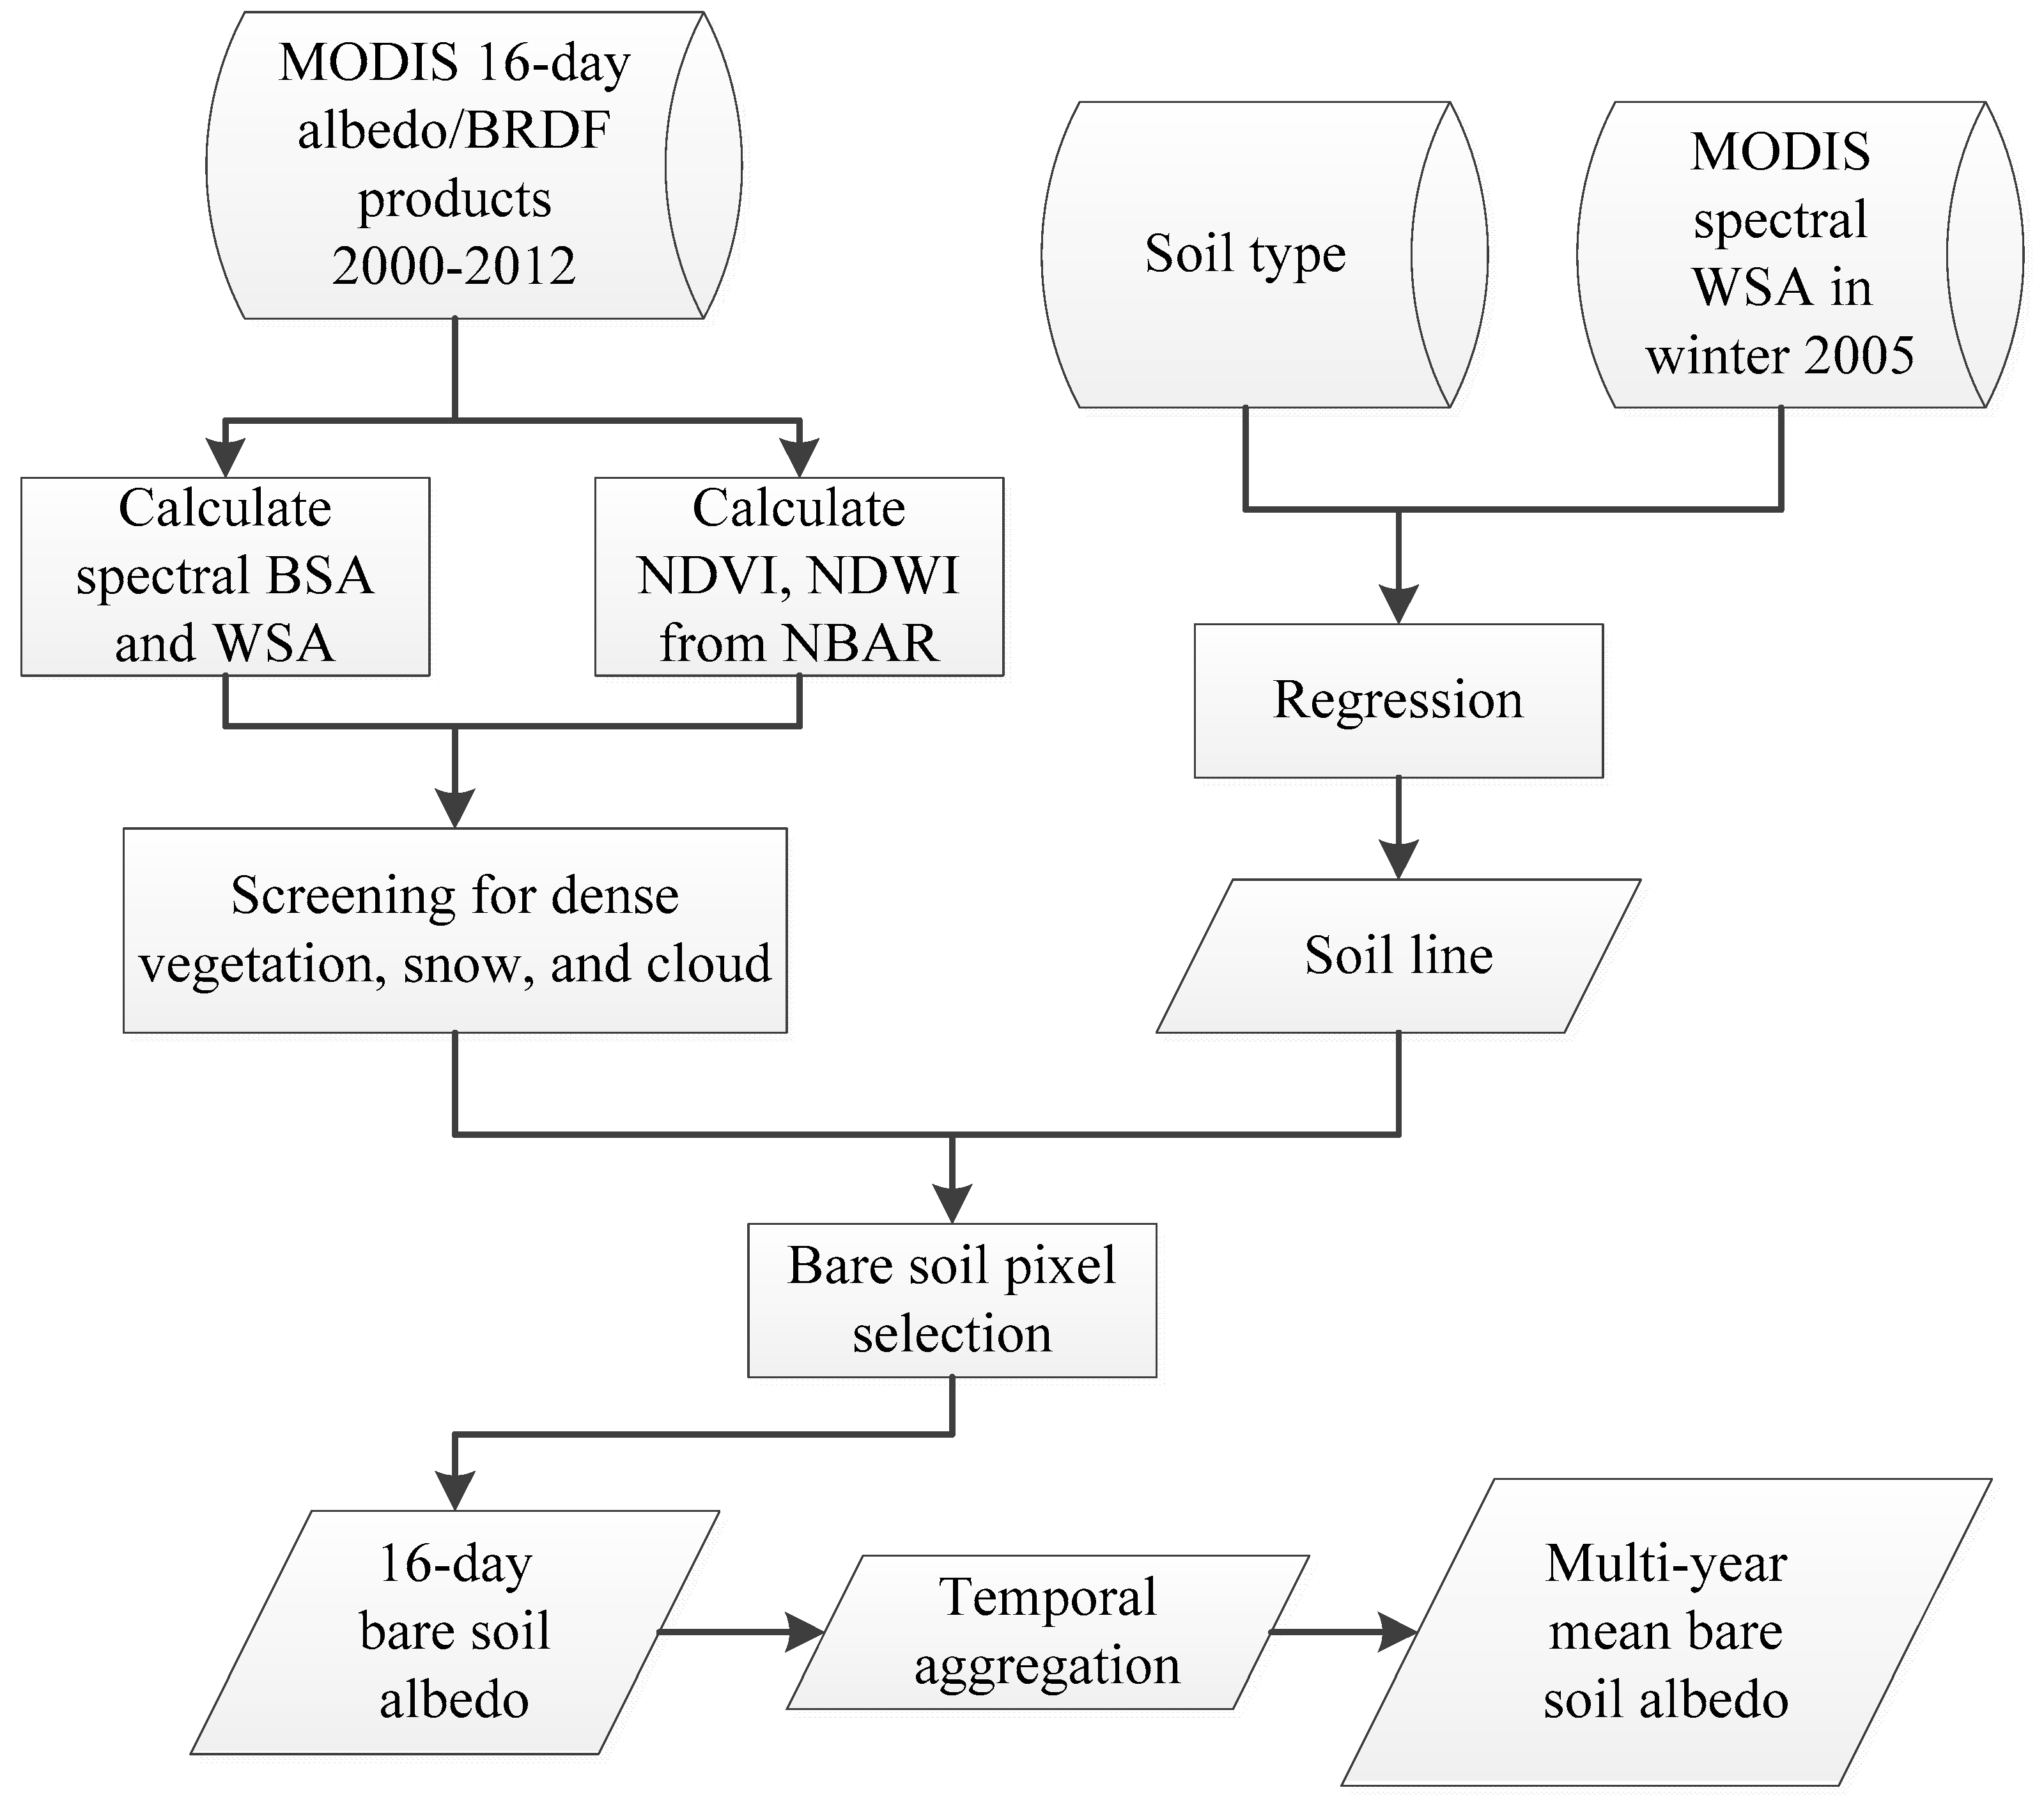
In this study, thirteen years of MODIS albedo/BRDF data (2000–2012) were used to identify bare soil albedo characteristics over the CONUS using the following procedure. First, the soil line was generated for each of the 12 major soil types in the NRCS classification using MODIS data in 2005. To reduce uncertainties and minimize effects of vegetation and snow, only high quality snow-free albedo values (based on the QC flag in MODIS albedo product) collected between November and March were used in the soil line generation. MODIS NDVI and NDWI products were used to further exclude possible vegetation, snow/ice, water, and residual cloud/shadow pixels. Once the soil line was detected, the second step was to calculate statistics describing the distance of the bare soil albedo from the soil line for each pixel over the whole period 2000–2012. Considering the accuracy of the estimated soil line and the uncertainty in MODIS data products, the soil albedos were considered as candidates if their distance to the soil line was smaller than 20% of the magnitude of their albedo values. Our sensitivity test showed that the 20% threshold did not introduce any significant difference in the soil albedo climatology results, and, at the same time, it significantly increased the number of samples that were used in the calculation. The bare soil albedos (both spectral and broadband) were generated at a 16-day interval. The third step was to calculate the mean and standard deviation (SDEV) of the 16-day bare soil albedos over the entire thirteen years for each location. Figure 2 illustrates the procedure used to generate the multiyear mean bare soil albedos from the MODIS datasets. In the final bare soil albedo map, the soil albedo represents the average state of the soil condition, regardless of the differences in moisture content and organic matter. The SDEV maps contain information regarding impacts of variation in soil moisture, organic matter, and residual vegetation on the apparent soil reflectivity.
3. Results and Discussion
3.1. Charateristics of Soil Lines Derived from MODIS Albedo
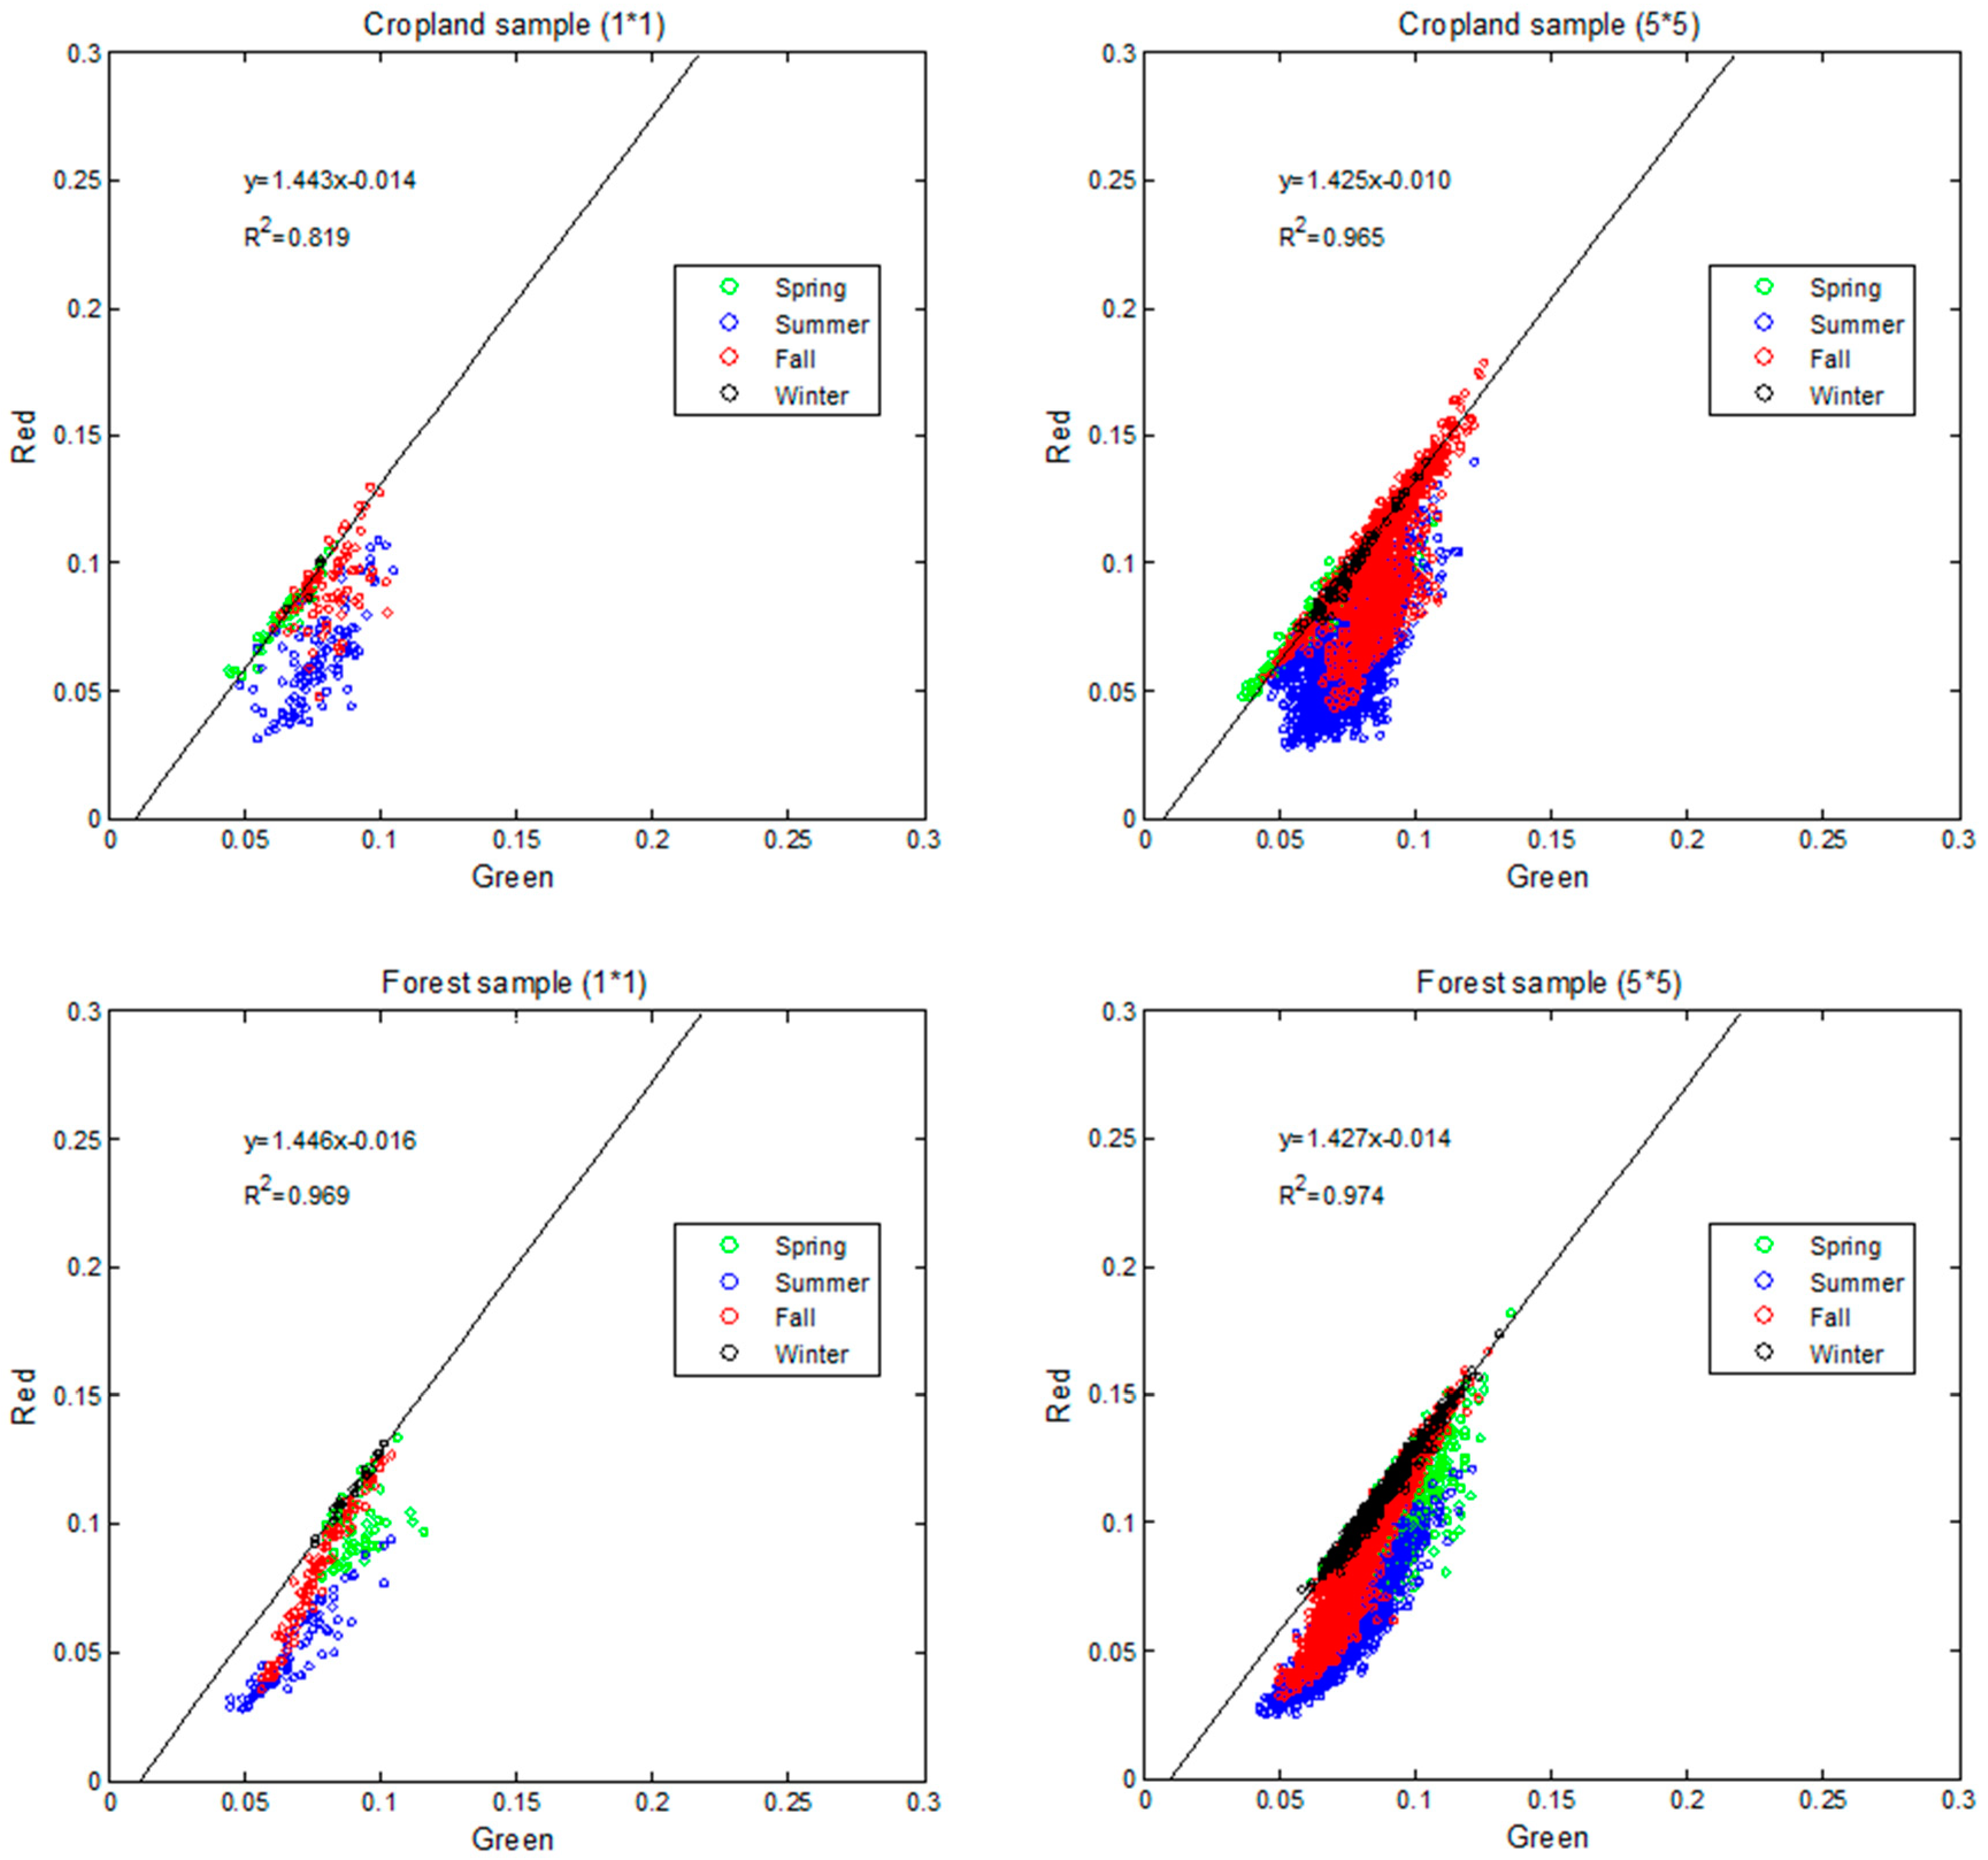
It has been demonstrated that the visible spectral space is useful in estimating vegetation fraction and indicating crop development stages tested at multiple crop sites with various soil backgrounds [35,46]. Based on field data, the green-red soil line feature has been proven to be a robust method for separating bare soil and vegetated surface conditions [35]. However, this feature has not yet been well documented using long-term satellite data. Figure 3 shows the soil line feature in green-red space from MODIS albedo samples over different land cover types based on MODIS land cover product during 2000–2012 using red and green bands.
In both crop and forest MODIS-derived samples, there was an obvious linear-line feature with relatively high green and red reflectance values in the spectral space (black line shown in Figure 3), which was in accordance with in-situ observations [46]. Based on the observations, this line was occupied mostly by samples in winter when vegetation had not sprouted. Such samples tend to be bare soil samples with low NDVI and positive NDWI. The variations in surface reflectivity at this stage were likely due to changes of soil moisture [28].
There are several reasons why data obtained in winter are preferable for deriving the soil line, as demonstrated in Figure 3. First, the effect of vegetation is minimized during the fall and winter dormant months. As vegetation grows such as in spring, surface albedos for green and red bands rapidly decrease due to the strong absorption by chlorophyll pigment in leaves, while the red band has a larger decrease rate because chlorophyll absorbance coefficient is much higher in red than in green [47]. Samples were moving downwards in spring when vegetation began to grow and ended up by a short “vegetation line” with red reflectance almost invariant occupied mostly by samples in summer when vegetation density was quite high. During the fall at the onset of vegetation senescence, green and red reflectance increased due to less absorption by the degraded chlorophyll pigments. As such, the samples at this stage were moving upwards from “vegetation line” back to “soil line” (red points in Figure 3). Thus, we can see from Figure 3 that albedos in winter are on the soil line and those in summer are on the vegetation line. For spring and fall, the albedo values lie between these extremes due to partial (sub-pixel) vegetation cover.
Second, soil albedo varies with soil moisture. During drier seasons (fall and winter) soil albedo tends to have a higher value, while during wetter seasons (spring and summer), it decreases as soil moisture increases. As soil moisture is usually small in winter (excluding the snow albedo), a small increase/decrease in moisture can cause large decrease/increase in albedo. Thus, a large range of soil albedo would produce robust soil line estimation.
Therefore, the soil line features were estimated by fitting the albedo values obtained in winter after excluding the data with large NDVI (>0.3) and/or negative NDWI to reduce the impacts of dense vegetation, clouds, and snow/ice.
The scatter plots in the left panel in Figure 3 are based on data at a single 500 m pixel; the plots in the right panel include data from the 5-by-5 surrounding pixels with the same land cover type. Because soil albedo varies both seasonally and inter-annually as the averaging area increases, including more surrounding pixels of the same land cover type as shown in the right panel, the slope of the soil line does not change much, but the R2 increases. This procedure was tested over other locations with different land cover types, yielding results similar to those presented in Figure 3.
Soil line characteristics estimated from MODIS data from 2005 are listed in Table 2. The variability in these soil lines indicates that a global unified soil line may not be good enough to extract bare soil albedo. Most of the soil line estimations have an R2 greater than 0.9 except for Alfisols, which demonstrates that the soil type information can support soil line estimations and other soil properties (e.g., soil moisture, organic matter, and surface texture/roughness) may have a secondary impact to the soil line [34].
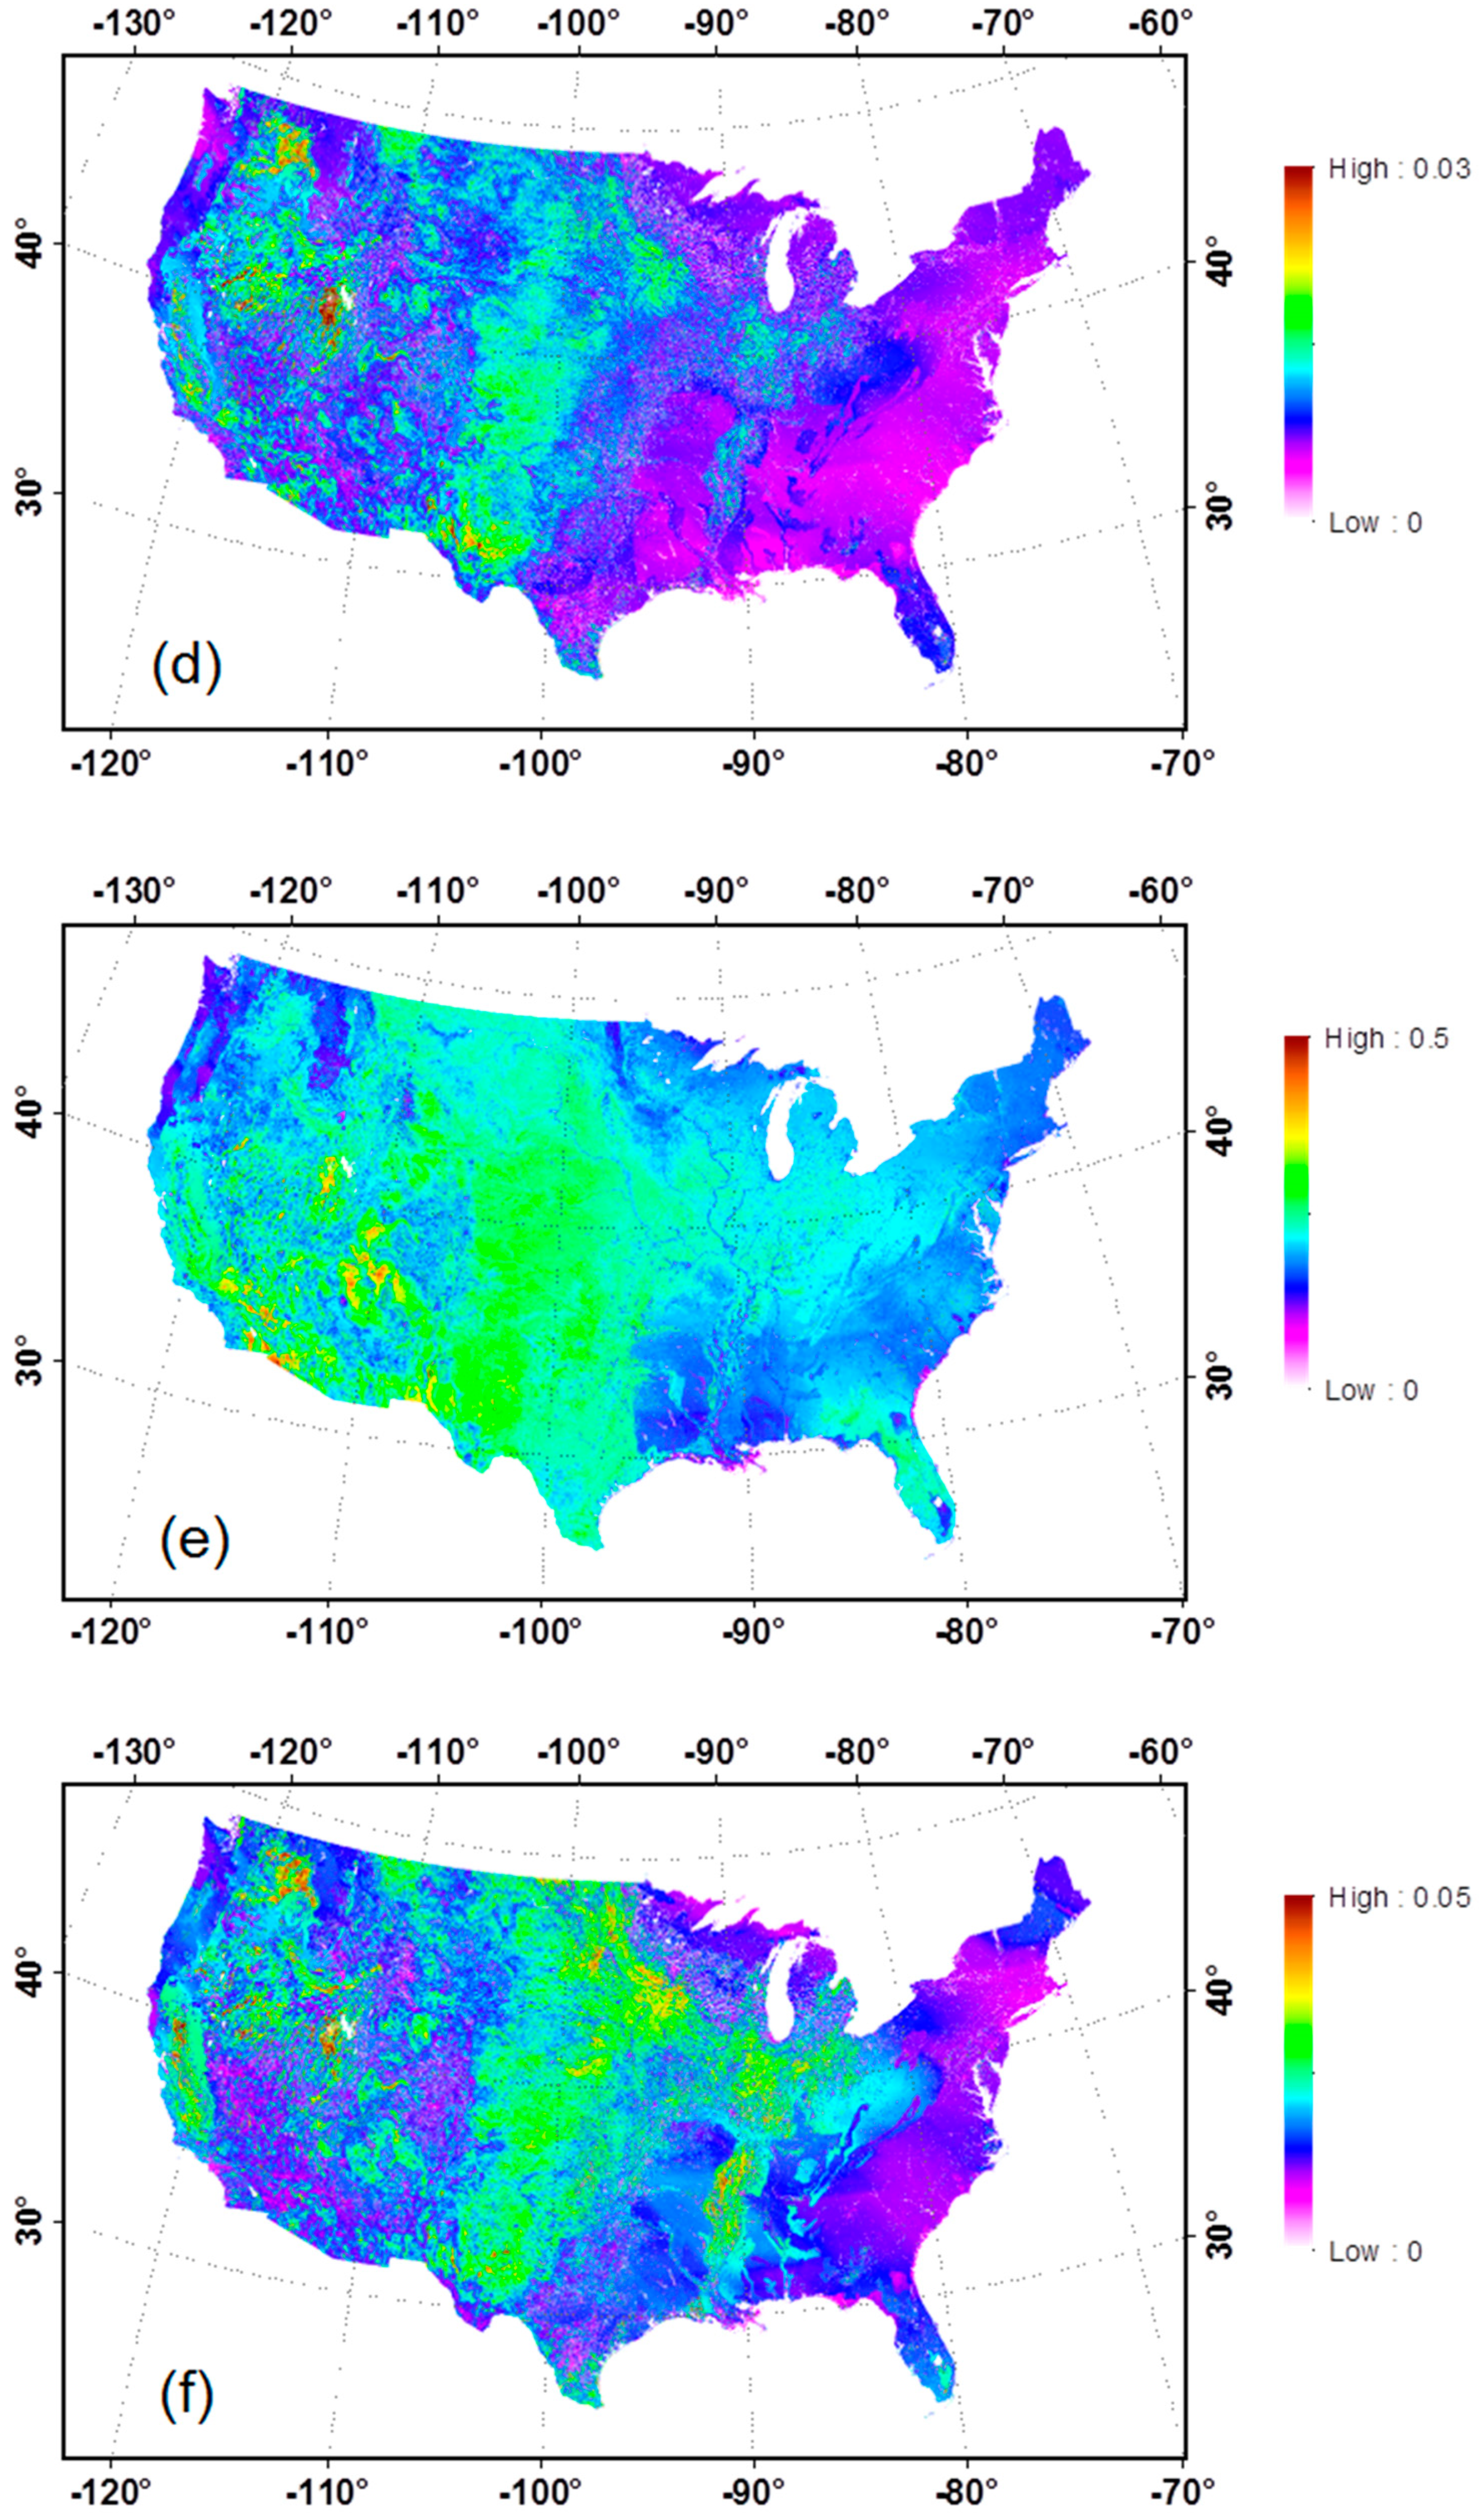
Following the procedure described in Figure 2, bare soil albedo over the CONUS was first generated on a 16-day interval including black-sky (direct) and white-sky (diffuse) albedos for the seven spectral bands and three broadbands, and then aggregated temporally to generate the climatological mean and SDEV for each of the bands. Statistics for broadband white-sky albedos are presented in Figure 4. Based on visual comparison, a general agreement can be reached in terms of magnitude and spatial pattern between the bare soil shortwave albedo map generated in this study and the data aggregated from MODIS data during 2001–2010 in a recent study [26]. The shortwave albedo for soil is lower in the East and Northwest CONUS (around 0.15~0.18) where dense vegetation is located with a wetter climate and higher in the central and Southwest CONUS from 0.20 to more than 0.40 where much of the land is covered with crops, grass, and bare soil with a drier climate. A more detailed spatial pattern in the soil albedo over the CONUS is provided in this study.
3.2. Validation of MODIS Bare Soil Albedo
As bare soil albedo ground measurements are not widely available, validation of the bare soil albedo extracted from MODIS data at 500 m resolution is difficult. In previous studies, bare soil albedo was either directly compared with model inputs or indirectly validated against MODIS albedo products using pure vegetation albedo and vegetation fraction as inputs to calculate soil/vegetation mosaic albedos. In this study, we proposed an approach using finer resolution satellite data to help verify the 500 m MODIS-based bare soil albedo estimations.
Landsat data are available from the USGS at 16-day intervals and at a spatial resolution of 30 m. Though it is usually difficult to find pure bare soil pixels at the MODIS resolution, they are considerably easier to identify at the Landsat resolution. The finer resolution offers a unique capability to observe the bare soil directly, which is otherwise mixed with vegetation at MODIS resolution. In this study, it was assumed that if the Landsat pixels that belong to a MODIS pixel with a 500m-by-500m nominal spatial coverage can be identified as bare soil, the averaged soil albedo value of the Landsat pixels will represent the bare soil albedo for the MODIS pixel. The Landsat shortwave broadband albedo was estimated following the procedure described by He et al. [48] for the atmospheric correction and narrow-to-broadband conversion. Clouds in Landsat data were screened using the Landsat Ecosystem Disturbance Adaptive Processing System (LEDAPS) tool [49].
Potential soil pixels were extracted from the Landsat datasets based on land cover class designated in the National Land Cover Database 2006 (NLCD2006). Only pixels classified as sparse vegetation–including developed, barren, and shrubland–were used [50]. Both NDVI and NDWI were calculated for each Landsat scene to exclude cloud/shadow, water, snow, and vegetation pixels, similar to the MODIS data processing discussed in previous sections. In this study, we used the Landsat scenes (path 042, row 034) centered at 119.0°W, 37.5°N for validation, which have a variety of land cover types, including forest, grassland, and cropland. There are four major soil types in this region, including Alfisols, Aridisols, Entisols, and Ultisols. All the available Landsat 5 TM scenes for the period 2005–2007 with nominal cloud coverage less than 30% were used. As the NLCD class and vegetation indices thresholds (NDVI<0.3 same as in Section 3.1) were applied to the Landsat data, it was assumed that the generated Landsat soil albedo can represent the bare soil surfaces with/without vegetation cover in a larger area, e.g., a MODIS pixel. As demonstrated in Figure 5, a general agreement can be found for bare soil shortwave black-sky albedos derived from MODIS and Landsat data with a bias of 0.003, a root-mean-square-error (RMSE) of 0.036, and an R2 of 0.316. There are several possible reasons for the differences between these two datasets found in the comparison: Landsat albedo estimations are instantaneous and thus more sensitive to soil moisture changes; Landsat and MODIS surface reflectance may not fit to 1-to-1 line exactly due to the differences in sensor characteristics and data processing; and Landsat pixels may not match MODIS pixels exactly due to the different registration accuracy and adjacency effects in the coarser resolution data.
3.3. Impacts of Soil Moisture Content on Soil Albedo
The water content in the top layer of soil is believed to have great impacts on the soil albedo. Previous studies have tried to establish the relationship between soil moisture content and soil reflectivity based on various datasets. Some studies reported that the relationship was linear, while others found an exponential equation provided a better fit (Equation (3)):
where is soil albedo and is soil moisture. , , and are regression coefficients.
Gascoin et al. [9] found that the best fit coefficients (A= 0.31, B =12.7 and C =0.15) with an RMSE of 0.030 using various soil samples from field measurements, and Wang et al. [30] reported a lower value for the B coefficient (B = 3.52, clay soil type). Gascoin et al. [9] also pointed it out that the parameters must be carefully examined before application to other regions.
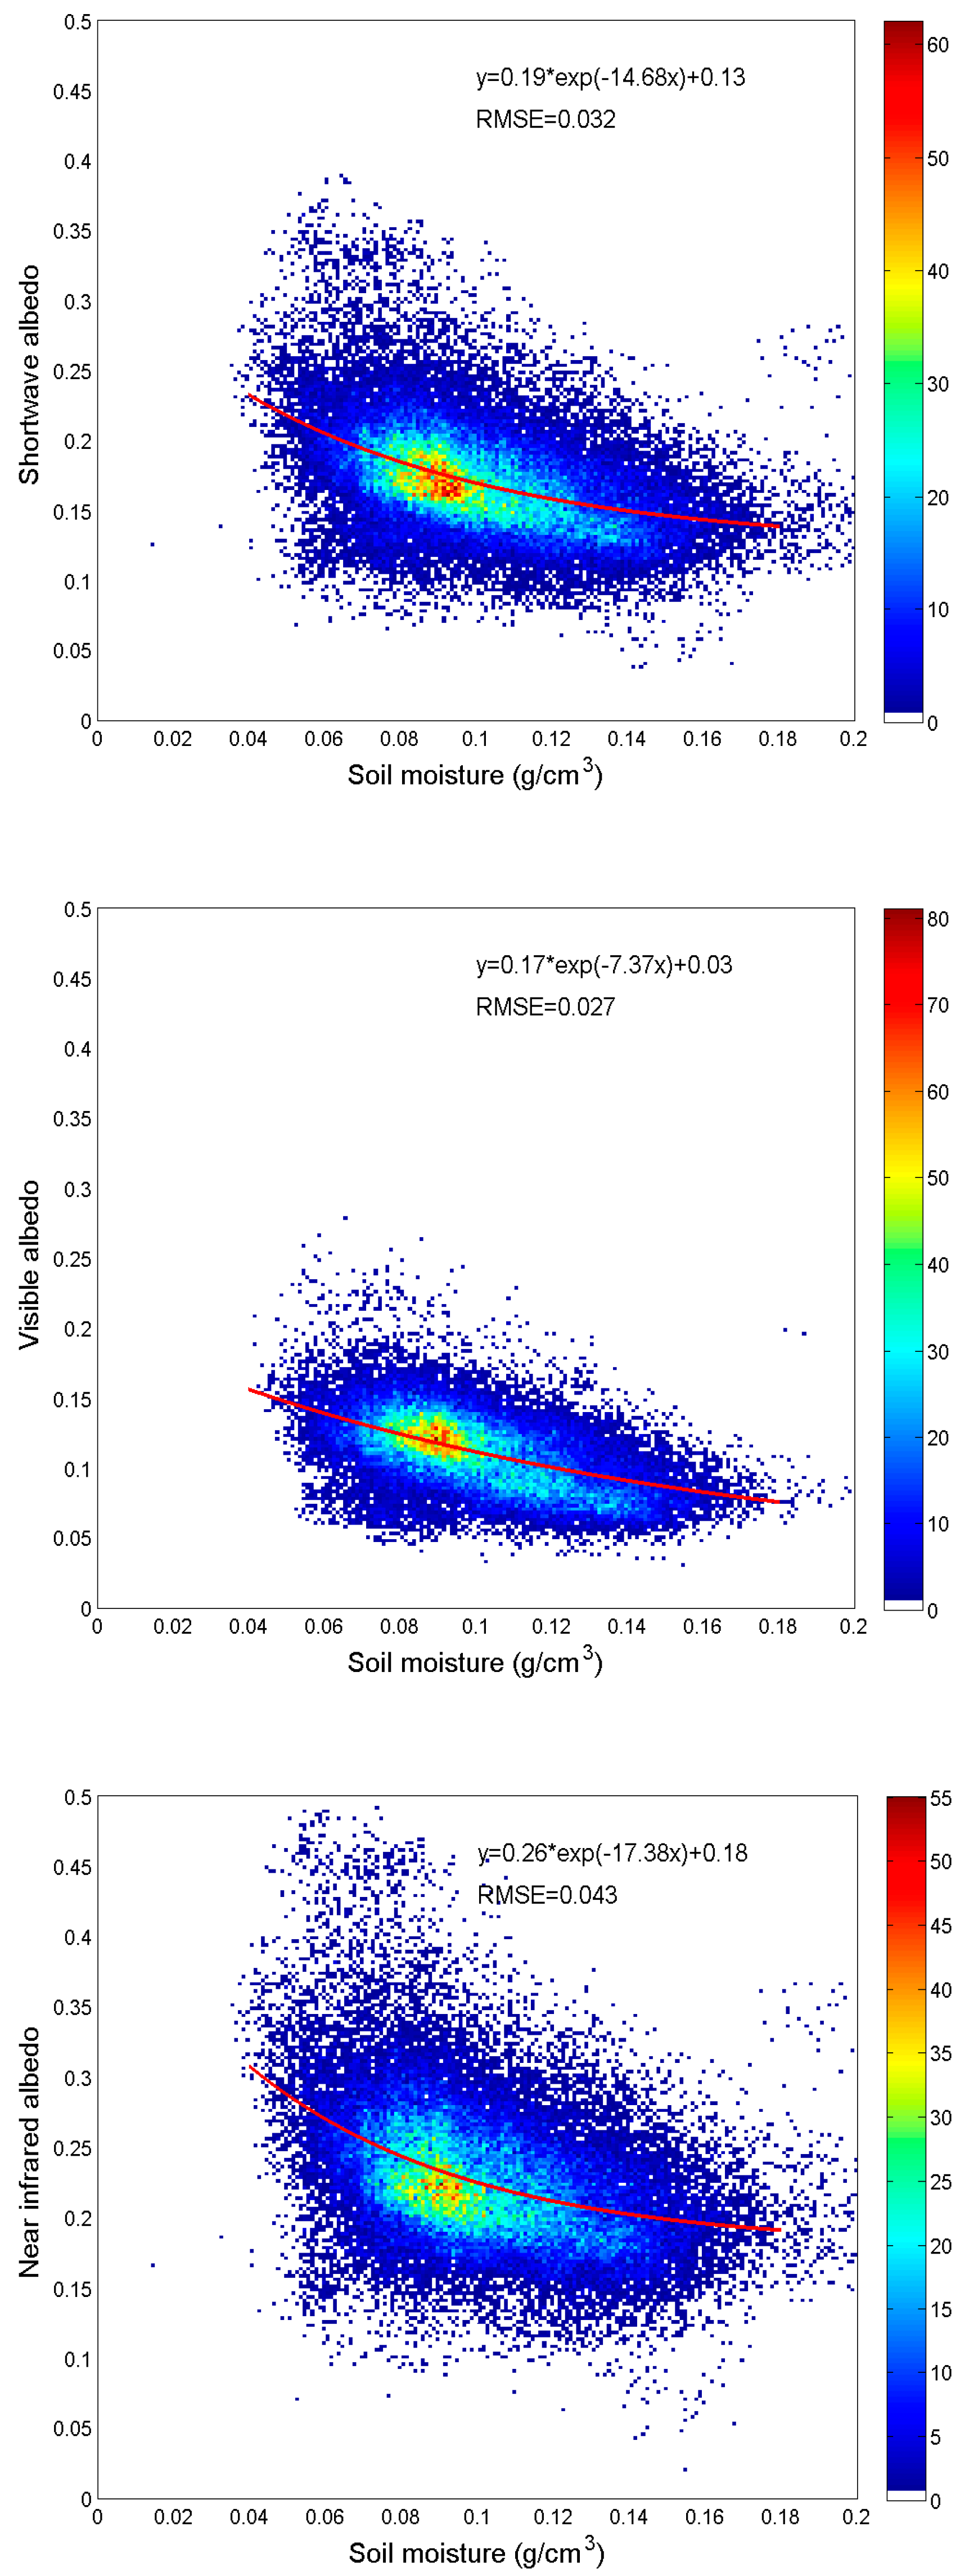
In this study, a relationship between bare soil albedo and soil moisture was derived using remote sensing data over a large spatial domain. White-sky albedo was used exclusively to minimize the solar zenith impacts on albedo data. In addition, the Advanced Microwave Scanning Radiometer-Earth Observing System (AMSR-E) Level 3 daily soil moisture products were used as estimates of soil moisture in the top ~1 cm of soil averaged over the retrieval footprint [51,52]. The 16-day averaged soil moisture values were generated from the daily AMSR-E products to match the temporal resolution of MODIS albedo during 2002–2011 (due to demise of AMSR-E in 2011) over the CONUS. The MODIS soil albedo data were rescaled to 25 km to match AMSR-E soil moisture products. Comparisons between the soil moisture and broadband white-sky albedos for bare soil in the Southwest U.S. (MODIS tile h08v05) indicate that soil albedo generally decreases with an increase in soil moisture (Figure 6). The rate of decrease for all three broadband albedos are very similar, which suggests that the change of soil moisture is likely the major factor of albedo change and that the soil line approach is resistant to soil moisture changes. Variation in NIR broadband albedo is larger than that in visible and total shortwave albedos, which is likely due to the fact that: (1) NIR albedo is larger than visible, and thus the absolute values are more variant; and (2) soil moisture may cause a larger variation in the longer wavelength part of the NIR spectral domain [34].
The relationship between bare soil albedo and soil moisture on a 16-day interval was found to be relatively stable across different seasons and locations over the CONUS (0.18 < A < 0.24; 9.86 < B < 21.33; 0.12 < C < 0.14; 0.031 < RMSE < 0.037). However, as the range of the 16-day averaged soil moisture variation is relatively small (most soil moisture values are between 0.08 and 0.12 g/cm3), the exponential relationship between these two variables cannot be verified without simultaneous instantaneous small soil moisture values (<0.05 g/cm3) and large bare soil albedos (>0.3). Nevertheless, the relationship found in this study is very close to the results presented in Gascoin et al. [9], considering that their soil moisture samples were taken at a ~5 cm depth from the surface.
Soil moisture is among the most important factors that can affect soil reflectivity, which should be considered in bare soil albedo estimations. However, soil moisture varies both spatially and temporally. Thus, it is difficult to remove the impacts of soil moisture in the final 500 m bare soil albedo map without the support of soil moisture products available at a similar resolution.
3.4. Relationship of Bare Soil Albedo with Major Soil Types and Land Cover Types
Traditional methods directly relate soil albedo with soil types, which are currently used by many land surface models to simplify the parameterization of soil albedo besides correcting the illumination angle effects [20].
The climatological bare soil white-sky albedos for different soil types derived for the period 2000–2012 (Table 3) were compared between each other. The Aridisols were found to have the largest soil albedo values because they tend to be the driest among the 12 major soil types—too dry for mesophytic plants to grow. Entisols, many of which are found in steep and rocky settings, have the second largest albedo values. Since the soil reflectivity is very sensitive to moisture changes under dry conditions, albedos of both Aridisols and Entisols have the largest variations. Among three broadband albedos, the near infrared albedos have the highest mean and SDEV values, and the visible albedos have the lowest mean and SDEV values for each soil type.
Histosols have the lowest reflectivity, probably because of their high organic matter content. Oxisols and Spodosols also have low albedo values. Possible reasons are that the Oxisols are mainly distributed in tropical and subtropical areas where precipitation increases soil moisture, and the Spodosols are acid soils mainly under forest.
The two tailed t-test results shown in Table 4 suggest that differences between soil albedo values are statistically significant for most soil types. However, there are several exceptions. Oxisols are quite inseparable from all the other types. It is also difficult to separate the albedos of Gelisols from those of Alfisols and Entisols. Their small sample size (Oxisols have less than 0.004% of the total samples; Gelisols have 0.147% of the total samples) is likely to have resulted in the difficulty in the separation of their soil albedos because a 4 km soil map grid may contain multiple soil types.
Bare soil albedo can also be linked with the type of vegetation above the ground because that the soil moisture–precipitation feedback [53] and vegetation–soil moisture feedback [54] will determine the relationship between vegetation type and magnitude of soil albedo (because of soil moisture). Table 5 lists the climatological values of bare soil albedo for each of the International Geosphere-Biosphere Programme (IGBP) land cover types from MODIS land cover data. In this study, it was found that bare soil albedo decreases as the vegetation density increases from open shrubland to evergreen needle leaf forest.
Compared with the statistics of albedo–soil types in Table 2 and Table 3, bare soil albedos have smaller within-class SDEVs for the albedo–land cover types, except for open shrublands and barren surface. This suggests that land cover type might be a better indicator to quantify the magnitude of bare soil albedo than soil type for the vegetated areas. For sparsely vegetated areas, the soil type map provides spatial variation that is necessary to characterize the relationship between bare soil albedo and soil type.
4. Conclusions
Bare soil albedo is an important ancillary dataset used in both climate and energy balance models and satellite LAI/fPAR retrieval procedures, but is usually prescribed based on soil type maps at very coarse spatial resolution. This fixed classification is unable to account for variability observed in soil albedo due to soil moisture and other soil properties particularly in the spatial domain. Long-term satellite observations provide a great opportunity to extract the bare soil albedo information at a much finer resolution. Methods that rely mostly on a single vegetation index (NDVI, LAI, fPAR, etc.) have been widely practiced in producing the existing soil albedo datasets from satellite data, the results of which, however, may suffer from the uncertainties in the upstream vegetation index product. To overcome this problem, a novel method was proposed in this study for the detection and extraction of bare soil albedo from thirteen years of MODIS albedo product and USDA soil type over the CONUS based on the soil line concept, NDVI, and NDWI derived from the MODIS spectral bands. The soil line concept turned out to be very effective in extracting the bare soil information with minimized impact from vegetation.
The validation of the bare soil albedo is quite challenging over a large spatial domain as ground measurements are not widely available. In this study, bare soil pixels were extracted from Landsat data using the classification map from NLCD. Good agreement has been found between bare soil albedo from Landsat and our estimations from MODIS data. Further work is expected to make comparisons using more Landsat and MODIS data over different regions and soil types.
In most cases, the proposed soil line method in mapping the bare soil albedo is very efficient and effective. However, it is not always effective, especially when the soil is covered by dense evergreen vegetation canopy. Though the NDVI and NDWI thresholds can help exclude the observations with dense vegetation canopy coverage, it is very possible that the regressed soil line detects the observation with least green canopy coverage rather than pure bare soil background. In other words, the derived climatological bare soil albedo in the evergreen vegetation covered area is not as reliable as those over land surface with sparser vegetation. Such an issue also exists in other current bare soil albedo products, which draws attention in applying them over areas covered by evergreen vegetation. Compared with the existing datasets, the maps generated in this study have reduced uncertainty because more background soil can be observed with the finer spatial resolution input data.
A decrease in soil albedo with an increase in soil moisture from AMSR-E data has been demonstrated over a large area. The exponential relationship has been found to be relatively stable for different time and locations. However, more efforts are still needed to improve the quantification of this relationship by using instantaneous (or at least daily) albedo and soil moisture in the future.
Statistics of bare soil broadband albedos were calculated based on soil types and land cover types. The within-class SDEV statistics suggest that: Though both classification schemes could be used as prescribing indicators for soil albedo, land cover type would be a better choice to determine the albedo magnitude for vegetated areas, while soil type is better at characterizing the soil line feature for sparely vegetated areas.
The bare soil broadband albedo could be very useful as one of the key ancillary data for climate models. On the other hand, our proposed method can also generate the bare soil albedo for the spectral bands. The derived bare soil albedo dataset has been demonstrated quite effective in improving the accuracy of satellite LAI and fPAR estimations under low vegetation density conditions [55].
Author Contributions
T.H. and F.G. conceived and designed the experiments; T.H. performed the experiments; S.L., and Y.P. contributed to the data analysis and provided comments and suggestions for the manuscript; T.H. wrote the paper.
Acknowledgments
This work was supported by the National Natural Science Foundation of China grant (41771379), the Key Laboratory of National Geographic State Monitoring of National Administration of Surveying, Mapping and Geoinformation grant (2017NGCMZD02), the USDA project (No. 12451361002825) from the NASA ROSES grant (NNH09ZDA001N) to the University of Maryland. We appreciate the comments from Crystal Schaaf at University of Massachusetts Boston, Martha Anderson at USDA-ARS and the anonymous reviewers to our manuscript. We thank the MODIS albedo team and AMSR-E soil moisture team. Both satellite products were distributed by the NASA Earth Observing System Data and Information System (EOSDIS) and available at http://reverb.echo.nasa.gov. We also thank the USDA NRCS and the Multi-Resolution Land Characteristics Consortium (MRLC) for maintaining and distributing the soil type map and NLCD2006 data used in this study. USDA is an equal opportunity provider and employer.
Conflicts of Interest
The authors declare no conflict of interest. The founding sponsors had no role in the design of the study; in the collection, analyses, or interpretation of data; in the writing of the manuscript, and in the decision to publish the results.
References
- Liang, S.L.; Wang, K.C.; Zhang, X.T.; Wild, M. Review on estimation of land surface radiation and energy budgets from ground measurement, remote sensing and model simulations. IEEE J. Sel. Top. Appl. Earth Obs. Remote Sens. 2010, 3, 225–240. [Google Scholar] [CrossRef]
- Liang, S.L.; Zhang, X.T.; He, T.; Cheng, J.; Wang, D. Remote sensing of the land surface radiation budget. In Remote Sensing of Energy Fluxes and Soil Moisture Content; CRC Press: Boca Raton, FL, USA, 2013; pp. 121–162. [Google Scholar] [CrossRef]
- Ganguly, S.; Nemani, R.R.; Zhang, G.; Hashimoto, H.; Milesi, C.; Michaelis, A.; Wang, W.L.; Votava, P.; Samanta, A.; Melton, F.; et al. Generating global Leaf Area Index from Landsat: Algorithm formulation and demonstration. Remote Sens. Environ. 2012, 122, 185–202. [Google Scholar] [CrossRef]
- Myneni, R.B.; Hoffman, S.; Knyazikhin, Y.; Privette, J.L.; Glassy, J.; Tian, Y.; Wang, Y.; Song, X.; Zhang, Y.; Smith, G.R.; et al. Global products of vegetation leaf area and fraction absorbed PAR from year one of MODIS data. Remote Sens. Environ. 2002, 83, 214–231. [Google Scholar] [CrossRef] [Green Version]
- Dickinson, R.E.; Henderson-Sellers, A.; Kennedy, P.J. Biosphere-Atmosphere Transfer Scheme (BATS) version 1e as coupled to the NCAR Community Climate Model. NCAR Technical Note NCAR/TN-387+STR; National Center for Atmospheric Research: Boulder, CO, USA, 1993. [Google Scholar]
- Bonan, G.B. A Land Surface Model (LSM Version 1.0) for Ecological, Hydrological, and Atmospheric Studies: Technical Description and User’s Guide. NCAR Technical Note NCAR/TN-417+STR; National Center for Atmospheric Research: Boulder, CO, USA, 1996. [Google Scholar]
- Post, D.F.; Fimbres, A.; Matthias, A.D.; Sano, E.E.; Accioly, L.; Batchily, A.K.; Ferreira, L.G. Predicting soil albedo from soil color and spectral reflectance data. Soil Sci. Soc. Am. J. 2000, 64, 1027–1034. [Google Scholar] [CrossRef]
- Liu, H.Z.; Wang, B.M.; Fu, C.B. Relationships between surface albedo, soil thermal parameters and soil moisture in the semi-arid area of Tongyu, Northeastern China. Adv. Atmos. Sci. 2008, 25, 757–764. [Google Scholar] [CrossRef]
- Gascoin, S.; Ducharne, A.; Ribstein, P.; Perroy, E.; Wagnon, P. Sensitivity of bare soil albedo to surface soil moisture on the moraine of the Zongo glacier (Bolivia). Geophys. Res. Lett. 2009, 36, L02405. [Google Scholar] [CrossRef]
- Irons, J.R.; Ranson, K.J.; Daughtry, C.S.T. Estimating big bluestem albedo from directional reflectance measurements. Remote Sens. Environ. 1988, 25, 185–199. [Google Scholar] [CrossRef]
- Matthias, A.D.; Fimbres, A.; Sano, E.E.; Post, D.F.; Accioly, L.; Batchily, A.K.; Ferreira, L.G. Surface roughness effects on soil albedo. Soil Sci. Soc. Am. J. 2000, 64, 1035–1041. [Google Scholar] [CrossRef]
- Zhou, L.; Dickinson, R.E.; Tian, Y.; Zeng, X.; Dai, Y.; Yang, Z.L.; Schaaf, C.B.; Gao, F.; Jin, Y.; Strahler, A.; et al. Comparison of seasonal and spatial variations of albedos from Moderate-Resolution Imaging Spectroradiometer (MODIS) and Common Land Model. J. Geophys. Res.-Atmos. 2003, 108. [Google Scholar] [CrossRef] [Green Version]
- Kala, J.; Evans, J.P.; Pitman, A.J.; Schaaf, C.B.; Decker, M.; Carouge, C.; Mocko, D.; Sun, Q. Implementation of a soil albedo scheme in the CABLEv1.4b land surface model and evaluation against MODIS estimates over Australia. Geosci. Model Dev. 2014, 7, 2121–2140. [Google Scholar] [CrossRef] [Green Version]
- Fensholt, R.; Sandholt, I.; Rasmussen, M.S. Evaluation of MODIS LAI, fAPAR and the relation between fAPAR and NDVI in a semi-arid environment using in situ measurements. Remote Sens. Environ. 2004, 91, 490–507. [Google Scholar] [CrossRef]
- Weiss, M.; Baret, F.; Garrigues, S.; Lacaze, R. LAI and fAPAR CYCLOPES global products derived from VEGETATION. Part 2: validation and comparison with MODIS collection 4 products. Remote Sens. Environ. 2007, 110, 317–331. [Google Scholar] [CrossRef]
- Pisek, J.; Chen, J.M. Mapping forest background reflectivity over North America with Multi-angle Imaging SpectroRadiometer (MISR) data. Remote Sens. Environ. 2009, 113, 2412–2423. [Google Scholar] [CrossRef]
- Pinty, B.; Clerici, M.; Andredakis, I.; Kaminski, T.; Taberner, M.; Verstraete, M.M.; Gobron, N.; Plummer, S.; Widlowski, J.L. Exploiting the MODIS albedos with the Two-stream Inversion Package (JRC-TIP): 2. Fractions of transmitted and absorbed fluxes in the vegetation and soil layers. J. Geophys. Res.-Atmos. 2011, 116. [Google Scholar] [CrossRef] [Green Version]
- Gascoin, S.; Ducharne, A.; Ribstein, P.; Lejeune, Y.; Wagnon, P. Dependence of bare soil albedo on soil moisture on the moraine of the Zongo glacier (Bolivia): Implications for land surface modeling. J. Geophys. Res.-Atmos. 2009, 114. [Google Scholar] [CrossRef] [Green Version]
- Zhou, L.M.; Dickinson, R.E.; Tian, Y.H. Derivation of a soil albedo dataset from MODIS using principal component analysis: Northern Africa and the Arabian Peninsula. Geophys. Res. Lett. 2005, 32. [Google Scholar] [CrossRef]
- Liang, X.Z.; Xu, M.; Gao, W.; Kunkel, K.; Slusser, J.; Dai, Y.J.; Min, Q.L.; Houser, P.R.; Rodell, M.; Schaaf, C.B.; et al. Development of land surface albedo parameterization based on Moderate Resolution Imaging Spectroradiometer (MODIS) data. J. Geophys. Res.-Atmos. 2005, 110. [Google Scholar] [CrossRef] [Green Version]
- Houldcroft, C.J.; Grey, W.M.F.; Barnsley, M.; Taylor, C.M.; Los, S.O.; North, P.R.J. New vegetation albedo parameters and global fields of soil background albedo derived from MODIS for use in a climate model. J. Hydrometeorol. 2009, 10, 183–198. [Google Scholar] [CrossRef]
- Jasinski, M.F. Sensitivity of the normalized difference vegetation index to subpixel canopy cover, soil albedo, and pixel scale. Remote Sens. Environ. 1990, 32, 169–187. [Google Scholar] [CrossRef]
- Pettorelli, N.; Vik, J.O.; Mysterud, A.; Gaillard, J.M.; Tucker, C.J.; Stenseth, N.C. Using the satellite-derived NDVI to assess ecological responses to environmental change. Trends Ecol. Evol. 2005, 20, 503–510. [Google Scholar] [CrossRef]
- Kaptue, T.A.T.; Roujean, J.L.; Faroux, S. ECOCLIMAP-II: An ecosystem classification and land surface parameters database of Western Africa at 1 km resolution for the African Monsoon Multidisciplinary Analysis (AMMA) project. Remote Sens. Environ. 2010, 114, 961–976. [Google Scholar] [CrossRef]
- Rechid, D.; Raddatz, T.; Jacob, D. Parameterization of snow-free land surface albedo as a function of vegetation phenology based on MODIS data and applied in climate modelling. Theor. Appl. Climatol. 2009, 95, 245–255. [Google Scholar] [CrossRef]
- Carrer, D.; Meurey, C.; Ceamanos, X.; Roujean, J.-L.; Calvet, J.-C.; Liu, S. Dynamic mapping of snow-free vegetation and bare soil albedos at global 1 km scale from 10-year analysis of MODIS satellite products. Remote Sens. Environ. 2014, 140, 420–432. [Google Scholar] [CrossRef]
- Anderson, M.C.; Kustas, W.P.; Alfieri, J.G.; Gao, F.; Hain, C.; Prueger, J.H.; Evett, S.; Colaizzi, P.; Howell, T.; Chavez, J.L. Mapping daily evapotranspiration at Landsat spatial scales during the BEAREX’08 field campaign. Adv. Water Resour. 2012, 50, 162–177. [Google Scholar] [CrossRef]
- Lobell, D.B.; Asner, G.P. Moisture effects on soil reflectance. Soil Sci. Soc. Am. J. 2002, 66, 722–727. [Google Scholar] [CrossRef]
- Liu, W.D.; Baret, F.; Gu, X.F.; Tong, Q.X.; Zheng, L.F.; Zhang, B. Relating soil surface moisture to reflectance. Remote Sens. Environ. 2002, 81, 238–246. [Google Scholar]
- Wang, K.C.; Wang, P.C.; Liu, J.M.; Sparrow, M.; Haginoya, S.; Zhou, X.J. Variation of surface albedo and soil thermal parameters with soil moisture content at a semi-desert site on the western Tibetan Plateau. Bound.-Layer Meteorol. 2005, 116, 117–129. [Google Scholar] [CrossRef]
- Guan, X.D.; Huang, J.P.; Guo, N.; Bi, J.R.; Wang, G.Y. Variability of soil moisture and its relationship with surface albedo and soil thermal parameters over the Loess Plateau. Adv. Atmos. Sci. 2009, 26, 692–700. [Google Scholar] [CrossRef] [Green Version]
- Liu, S.; Roujean, J.-L.; Kaptue Tchuente, A.T.; Ceamanos, X.; Calvet, J.-C. A parameterization of SEVIRI and MODIS daily surface albedo with soil moisture: Calibration and validation over southwestern France. Remote Sens. Environ. 2014, 144, 137–151. [Google Scholar] [CrossRef]
- Guerschman, J.P.; Scarth, P.F.; McVicar, T.R.; Renzullo, L.J.; Malthus, T.J.; Stewart, J.B.; Rickards, J.E.; Trevithick, R. Assessing the effects of site heterogeneity and soil properties when unmixing photosynthetic vegetation, non-photosynthetic vegetation and bare soil fractions from Landsat and MODIS data. Remote Sens. Environ. 2015, 161, 12–26. [Google Scholar] [CrossRef]
- Baret, F.; Jacquemoud, S.; Hanocq, J.F. About the soil line concept in remote sensing. Adv. Space Res. 1993, 13, 281–284. [Google Scholar] [CrossRef]
- Gitelson, A.A.; Stark, R.; Grits, U.; Rundquist, D.; Kaufman, Y.; Derry, D. Vegetation and soil lines in visible spectral space: a concept and technique for remote estimation of vegetation fraction. Int. J. Remote Sens. 2002, 23, 2537–2562. [Google Scholar] [CrossRef]
- Huete, A.R. A Soil-Adjusted Vegetation Index (SAVI). Remote Sens. Environ. 1988, 25, 295–309. [Google Scholar] [CrossRef]
- Pickup, G.; Chewings, V.H.; Nelson, D.J. Estimating changes in vegetation cover over time in arid rangelands using Landsat MSS data. Remote Sens. Environ. 1993, 43, 243–263. [Google Scholar] [CrossRef]
- Cui, S.; Rajan, N.; Maas, S.J.; Youn, E. An automated soil line identification method using relevance vector machine. Remote Sens. Lett. 2014, 5, 175–184. [Google Scholar] [CrossRef]
- Fox, G.A.; Sabbagh, G.J.; Searcy, S.W.; Yang, C. An automated soil line identification routine for remotely sensed images. Soil Sci. Soc. Am. J. 2004, 68, 1326–1331. [Google Scholar] [CrossRef]
- Schaaf, C.; Wang, Z. MCD43A1 MODIS/Terra+Aqua BRDF/Albedo Model Parameters Daily L3 Global-500m V006; NASA EOSDIS Land Processes DAAC: Sioux Falls, SD, USA, 2015. [CrossRef]
- Gao, B.C. NDWI - A normalized difference water index for remote sensing of vegetation liquid water from space. Remote Sens. Environ. 1996, 58, 257–266. [Google Scholar] [CrossRef]
- Lawrence, P.J.; Chase, T.N. Representing a new MODIS consistent land surface in the Community Land Model (CLM 3.0). J. Geophys. Res.-Biogeosci. 2007, 112. [Google Scholar] [CrossRef] [Green Version]
- USDA. Soil Taxonomy: A Basic System of Soil Classification for Making and Interpreting Soil Survey, 2nd ed.; U.S. Department of Agriculture Handbook 436; Soil Survey Staff, Ed.; Natural Resources Conservation Service: Washington, DC, USA, 1999.
- Baldridge, A.M.; Hook, S.J.; Grove, C.I.; Rivera, G. The ASTER spectral library version 2.0. Remote Sens. Environ. 2009, 113, 711–715. [Google Scholar] [CrossRef]
- Clark, R.N.; Swayze, G.A.; Wise, R.; Livo, E.; Hoefen, T.; Kokaly, R.; Sutley, S.J. USGS digital spectral library splib06a. U.S. Geol. Surv. Digit. Data Ser. 231 2007. [Google Scholar]
- Nguy-Robertson, A.; Gitelson, A.; Peng, Y.; Walter-Shea, E.; Leavitt, B.; Arkebauer, T. Continuous monitoring of crop reflectance, vegetation fraction, and identification of developmental stages using a four band radiometer. Agron. J. 2013, 105, 1769–1779. [Google Scholar] [CrossRef]
- Gitelson, A.A.; Gritz, Y.; Merzlyak, M.N. Relationships between leaf chlorophyll content and spectral reflectance and algorithms for non-destructive chlorophyll assessment in higher plant leaves. J. Plant Physiol. 2003, 160, 271–282. [Google Scholar] [CrossRef]
- He, T.; Liang, S.L.; Wang, D.; Shuai, Y.; Yu, Y. Fusion of satellite land surface albedo products across scales using a multiresolution tree method in the north central United States. IEEE Trans. Geosci. Remote Sens. 2014, 52, 3428–3439. [Google Scholar] [CrossRef]
- Masek, J.G.; Vermote, E.F.; Saleous, N.E.; Wolfe, R.; Hall, F.G.; Huemmrich, K.F.; Gao, F.; Kutler, J.; Lim, T.K. A Landsat surface reflectance dataset for North America, 1990–2000. IEEE Geosci. Remote Sens. Lett. 2006, 3, 68–72. [Google Scholar] [CrossRef]
- Fry, J.A.; Xian, G.; Jin, S.M.; Dewitz, J.A.; Homer, C.G.; Yang, L.M.; Barnes, C.A.; Herold, N.D.; Wickham, J.D. Completion of the 2006 National Land Cover Database for the Conterminous United States. Photogramm. Eng. Remote Sens. 2011, 77, 858–864. [Google Scholar]
- Njoku, E.G.; Jackson, T.J.; Lakshmi, V.; Chan, T.K.; Nghiem, S.V. Soil moisture retrieval from AMSR-E. IEEE Trans. Geosci. Remote Sens. 2003, 41, 215–229. [Google Scholar] [CrossRef]
- Njoku, E.G.; Chan, S.K. Vegetation and surface roughness effects on AMSR-E land observations. Remote Sens. Environ. 2006, 100, 190–199. [Google Scholar] [CrossRef]
- Eltahir, E.A.B. A soil moisture rainfall feedback mechanism 1. Theory and observations. Water Resour. Res. 1998, 34, 765–776. [Google Scholar] [CrossRef]
- Liu, Z.; Notaro, M.; Gallimore, R. Indirect vegetation-soil moisture feedback with application to Holocene North Africa climate. Glob. Chang. Biol. 2010, 16, 1733–1743. [Google Scholar] [CrossRef]
- Tao, X.; Liang, S.L.; He, T.; Jin, H.R. Estimation of fraction of absorbed photosynthetically active radiation from multiple satellite data: Model development and validation. Remote Sens. Environ. 2016, 184, 539–557. [Google Scholar] [CrossRef]
Figure 1.
Dominant soil type map over the contiguous United States (CONUS) extracted from U.S. Department of Agriculture (USDA) soil survey data.
Figure 1.
Dominant soil type map over the contiguous United States (CONUS) extracted from U.S. Department of Agriculture (USDA) soil survey data.

Figure 2.
Flowchart for mapping bare soil albedo from multiyear Moderate Resolution Imaging Spectroradiometer (MODIS) data based on soil line.
Figure 2.
Flowchart for mapping bare soil albedo from multiyear Moderate Resolution Imaging Spectroradiometer (MODIS) data based on soil line.

Figure 3.
MODIS white-sky albedo (or diffuse reflectance) for the red and green bands over crop and forest samples in MODIS tile h11v04 during 2000–2012. The left panel shows the albedo values for one pixel for the time period; the right panel shows albedo values for the pixels in the 5-by-5 surrounding spatial window with the same land cover type to that in the left panel.

Figure 4.
Bare soil albedo over the CONUS: Total shortwave (0.3–5.0 µm) mean value (a) and standard deviation (SDEV) (b); visible (0.3–0.7 µm) mean value (c) and SDEV (d); and near infrared (NIR) (0.7–5.0 µm) mean value (e) and SDEV (f).
Figure 4.
Bare soil albedo over the CONUS: Total shortwave (0.3–5.0 µm) mean value (a) and standard deviation (SDEV) (b); visible (0.3–0.7 µm) mean value (c) and SDEV (d); and near infrared (NIR) (0.7–5.0 µm) mean value (e) and SDEV (f).


Figure 5.
Comparison of 16-day bare soil shortwave albedos derived from MODIS data with estimates from Landsat data.
Figure 5.
Comparison of 16-day bare soil shortwave albedos derived from MODIS data with estimates from Landsat data.

Figure 6.
Relationship between bare soil broadband white-sky albedos and soil skin moisture over MODIS tile h08v05 for January 2002–2011. Red line is the best fit curve; its regression coefficients and RMSEs are shown above.
Figure 6.
Relationship between bare soil broadband white-sky albedos and soil skin moisture over MODIS tile h08v05 for January 2002–2011. Red line is the best fit curve; its regression coefficients and RMSEs are shown above.


Table 1.
Information of the datasets used in this study.
| Variable | Dataset | Temporal Coverage | Spatial Resolution |
|---|---|---|---|
| Surface albedo | MCD43A | 2001–2012 | 500 m |
| Soil type | Natural Resources Conservation Service (NRCS) soil suborder map | N/A | 4000 m |
| Land cover | MCD12Q | 2006 | 500 m |
| Land cover | National Land Cover Dataset (NLCD) | 2006 | 30 m |
| Soil moisture | AMSR-E L3 | 2002–2011 | 25 km |
Table 2.
Parameters of soil lines estimated for the major soil types over the CONUS
| Soil Type | Soil Line: | ||||
|---|---|---|---|---|---|
| a | b | R2 | RMSE | N of Pixels | |
| Alfisols | 1.4830 ± 0.0057 | −0.0142 ± 0.0006 | 0.8407 | 0.0114 | 190525 |
| Andisols | 1.3557 ± 0.0075 | −0.0053 ± 0.0008 | 0.9393 | 0.0063 | 16682 |
| Aridisols | 1.3394 ± 0.0014 | −0.0028 ± 0.0002 | 0.9047 | 0.0132 | 134894 |
| Entisols | 1.3195 ± 0.0016 | −0.0027 ± 0.0002 | 0.9223 | 0.0112 | 99206 |
| Gelisols | 1.3058 ± 0.0599 | −0.0053 ± 0.0053 | 0.9888 | 0.0024 | 1472 |
| Histosols | 1.2052 ± 0.0204 | −0.0062 ± 0.0014 | 0.9400 | 0.0070 | 8340 |
| Inceptisols | 1.3661 ± 0.0089 | −0.0116 ± 0.0016 | 0.9145 | 0.0084 | 43997 |
| Mollisols | 1.3242 ± 0.0014 | −0.0017 ± 0.0002 | 0.9209 | 0.0077 | 262389 |
| Oxisols | 1.0827 ± 0.1283 | 0.0139 ± 0.0107 | 0.9394 | 0.0056 | 457 |
| Spodosols | 1.2062 ± 0.0265 | −0.0101 ± 0.0019 | 0.9559 | 0.0086 | 120682 |
| Ultisols | 1.4115 ± 0.0088 | −0.0177 ± 0.0007 | 0.9449 | 0.0079 | 105382 |
| Vertisols | 1.2849 ± 0.0082 | −0.0030 ± 0.0008 | 0.9017 | 0.0067 | 15343 |
* Statistics are based on 95% confidence level.
Table 3.
Statistics of broadband soil albedo distribution for each of the major soil types.
| Soil Type | Visible | Near Infrared | Shortwave | |||
|---|---|---|---|---|---|---|
| Mean | SDEV | Mean | SDEV | Mean | SDEV | |
| Alfisols | 0.0796 | 0.0152 | 0.2060 | 0.0375 | 0.1479 | 0.0251 |
| Andisols | 0.0738 | 0.0190 | 0.1914 | 0.0457 | 0.1382 | 0.0314 |
| Aridisols | 0.1196 | 0.0376 | 0.2493 | 0.0553 | 0.1858 | 0.0433 |
| Entisols | 0.1013 | 0.0295 | 0.2330 | 0.0449 | 0.1695 | 0.0345 |
| Gelisols | 0.0801 | 0.0159 | 0.1804 | 0.0322 | 0.1357 | 0.0227 |
| Histosols | 0.0619 | 0.0158 | 0.1604 | 0.0465 | 0.1174 | 0.0299 |
| Inceptisols | 0.0704 | 0.0170 | 0.1820 | 0.0449 | 0.1310 | 0.0296 |
| Mollisols | 0.0915 | 0.0160 | 0.2258 | 0.0327 | 0.1623 | 0.0230 |
| Oxisols | 0.0674 | 0.0157 | 0.2138 | 0.0427 | 0.1460 | 0.0258 |
| Spodosols | 0.0691 | 0.0183 | 0.1702 | 0.0462 | 0.1257 | 0.0304 |
| Ultisols | 0.0739 | 0.0179 | 0.2004 | 0.0486 | 0.1429 | 0.0320 |
| Vertisols | 0.0800 | 0.0112 | 0.2248 | 0.0261 | 0.1550 | 0.0167 |
Table 4.
p-value of two tailed t-test on the soil albedos among different soil types.
| Soil Type | Andisols | Aridisols | Entisols | Gelisols | Histosols | Inceptisols | Mollisols | Oxisols | Spodosols | Ultisols | Vertisols |
|---|---|---|---|---|---|---|---|---|---|---|---|
| Alfisols | *** | *** | *** | 0.78 | *** | *** | *** | 0.39 | *** | *** | *** |
| Andisols | *** | *** | *** | *** | *** | *** | 0.55 | ** | *** | *** | |
| Aridisols | *** | *** | *** | *** | *** | 0.36 | *** | *** | 0.40 | ||
| Entisols | 0.66 | *** | *** | *** | 0.40 | *** | *** | *** | |||
| Gelisols | *** | *** | 0.31 | 0.34 | *** | *** | *** | ||||
| Histosols | 0.28 | *** | 0.49 | *** | *** | *** | |||||
| Inceptisols | *** | 0.49 | *** | *** | *** | ||||||
| Mollisols | 0.39 | *** | *** | *** | |||||||
| Oxisols | 0.52 | 0.38 | 0.35 | ||||||||
| Spodosols | *** | *** | |||||||||
| Ultisols | * |
*: p < 0.05; **: p < 0.01; ***: p < 0.001.
Table 5.
Statistics of broadband soil albedo distribution for each of the land cover classes.
| IGBP Land Cover | Visible | Near Infrared | Shortwave | |||
|---|---|---|---|---|---|---|
| Mean | SDEV | Mean | SDEV | Mean | SDEV | |
| ENF | 0.0458 | 0.0147 | 0.1122 | 0.0296 | 0.0847 | 0.0210 |
| EBF | 0.0526 | 0.0193 | 0.1237 | 0.0460 | 0.0938 | 0.0304 |
| DNF | 0.0593 | 0.0139 | 0.1308 | 0.0272 | 0.1006 | 0.0191 |
| DBF | 0.0633 | 0.0124 | 0.1627 | 0.0265 | 0.1192 | 0.0184 |
| MIX | 0.0541 | 0.0134 | 0.1354 | 0.0330 | 0.1009 | 0.0222 |
| CSH | 0.0664 | 0.0161 | 0.1692 | 0.0334 | 0.1217 | 0.0234 |
| OSH | 0.1096 | 0.0315 | 0.2386 | 0.0512 | 0.1764 | 0.0393 |
| WSV | 0.0669 | 0.0142 | 0.1780 | 0.0338 | 0.1283 | 0.0234 |
| SAV | 0.0723 | 0.0144 | 0.1911 | 0.0368 | 0.1366 | 0.0252 |
| GRA | 0.0987 | 0.0192 | 0.2318 | 0.0341 | 0.1682 | 0.0245 |
| WET | 0.0489 | 0.0135 | 0.1081 | 0.0301 | 0.0847 | 0.0204 |
| CRO | 0.0893 | 0.0136 | 0.2255 | 0.0311 | 0.1610 | 0.0218 |
| URB | 0.0868 | 0.0191 | 0.1937 | 0.0324 | 0.1428 | 0.0238 |
| CRC | 0.0814 | 0.0127 | 0.2090 | 0.0291 | 0.1504 | 0.0200 |
| GLA | 0.0925 | 0.0519 | 0.1590 | 0.0663 | 0.1290 | 0.0548 |
| BRN | 0.1939 | 0.0551 | 0.3267 | 0.0813 | 0.2561 | 0.0627 |
ENF: Evergreen needleleaf forest; EBF: Evergreen broadleaf forest; DNF: Deciduous needleleaf forest; DBF: Deciduous broadleaf forest; MIX: Mixed forest; CSH: Closed shrubland; OSH: Open shrublands; WSV: Woody savannas; SAV: Savannas; GRA: Grasslands; WET: Permanent wetlands; CRO: Croplands; URB: Urban and built-up; CRC: Cropland/natural vegetation mosaic; GLA: Snow and ice; BRN: Barren or sparsely vegetated.
© 2019 by the authors. Licensee MDPI, Basel, Switzerland. This article is an open access article distributed under the terms and conditions of the Creative Commons Attribution (CC BY) license (http://creativecommons.org/licenses/by/4.0/).
Share and Cite
MDPI and ACS Style
He, T.; Gao, F.; Liang, S.; Peng, Y. Mapping Climatological Bare Soil Albedos over the Contiguous United States Using MODIS Data. Remote Sens. 2019, 11, 666. https://doi.org/10.3390/rs11060666
AMA Style
He T, Gao F, Liang S, Peng Y. Mapping Climatological Bare Soil Albedos over the Contiguous United States Using MODIS Data. Remote Sensing. 2019; 11(6):666. https://doi.org/10.3390/rs11060666
Chicago/Turabian StyleHe, Tao, Feng Gao, Shunlin Liang, and Yi Peng. 2019. "Mapping Climatological Bare Soil Albedos over the Contiguous United States Using MODIS Data" Remote Sensing 11, no. 6: 666. https://doi.org/10.3390/rs11060666
Note that from the first issue of 2016, this journal uses article numbers instead of page numbers. See further details here.