Improved Hydrological Decision Support System for the Lower Mekong River Basin Using Satellite-Based Earth Observations


Abstract
:1. Introduction
2. Materials and Methods
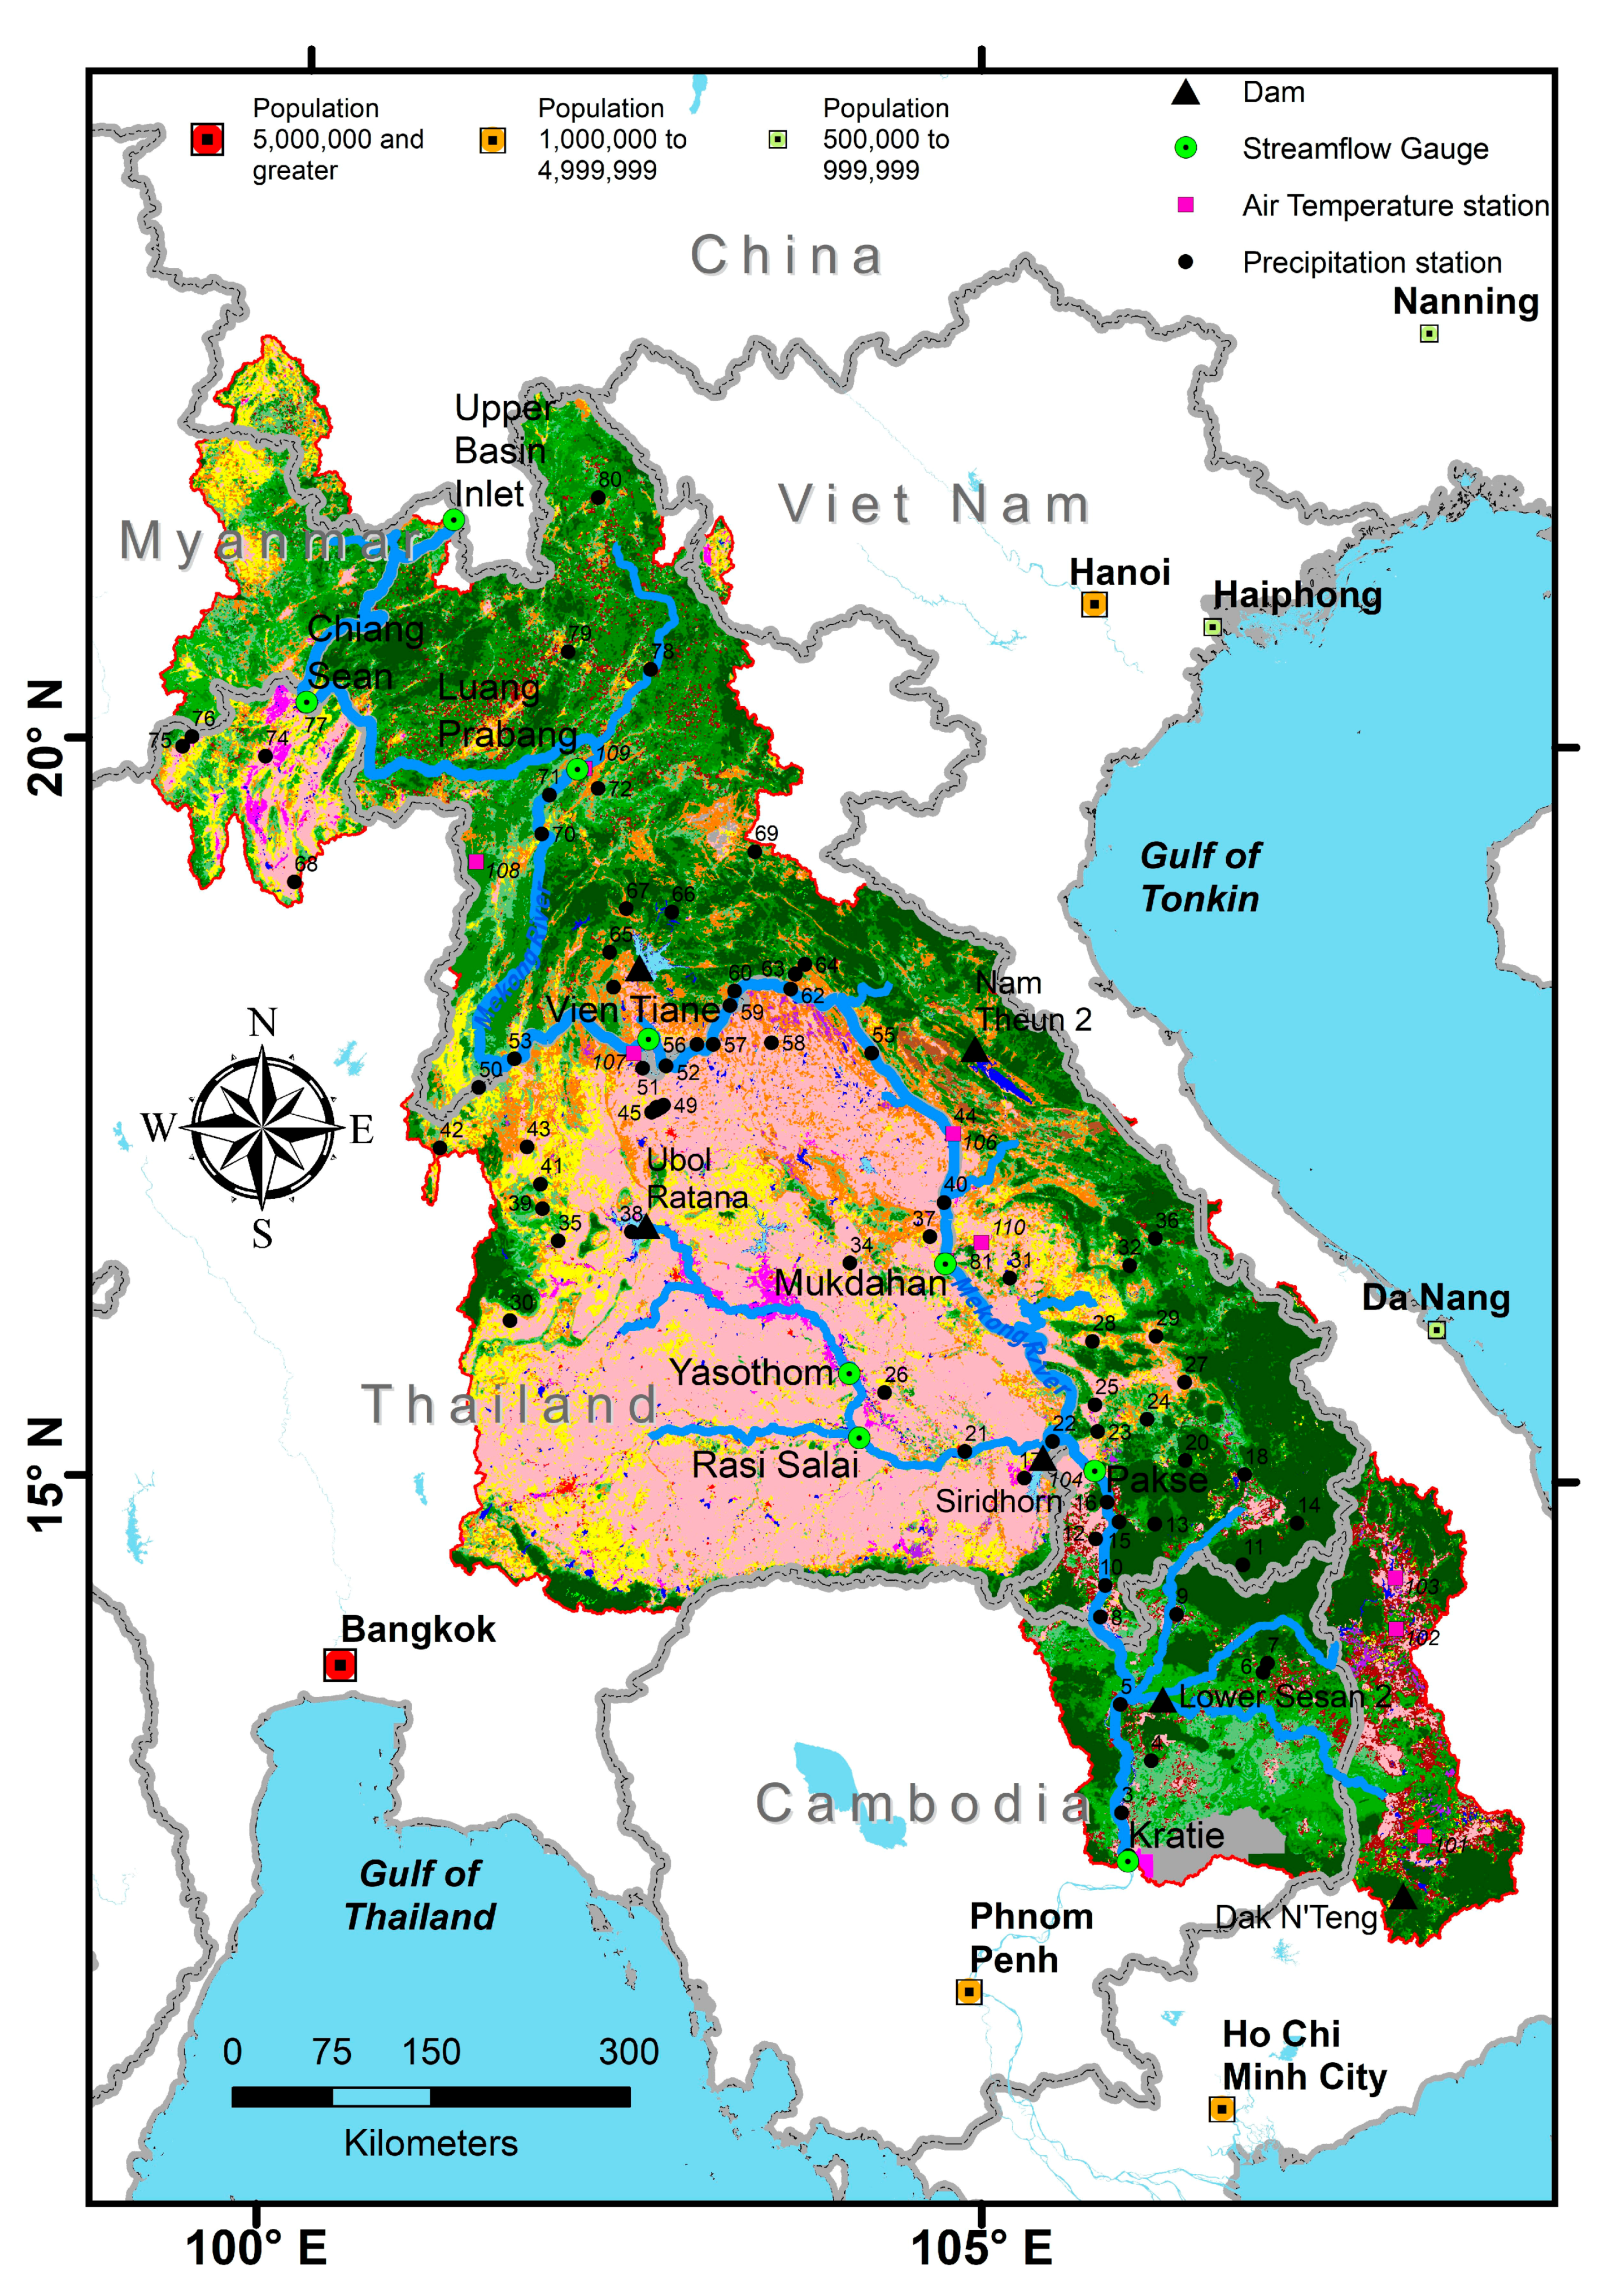
2.1. Study Area
2.2. Spatial Data
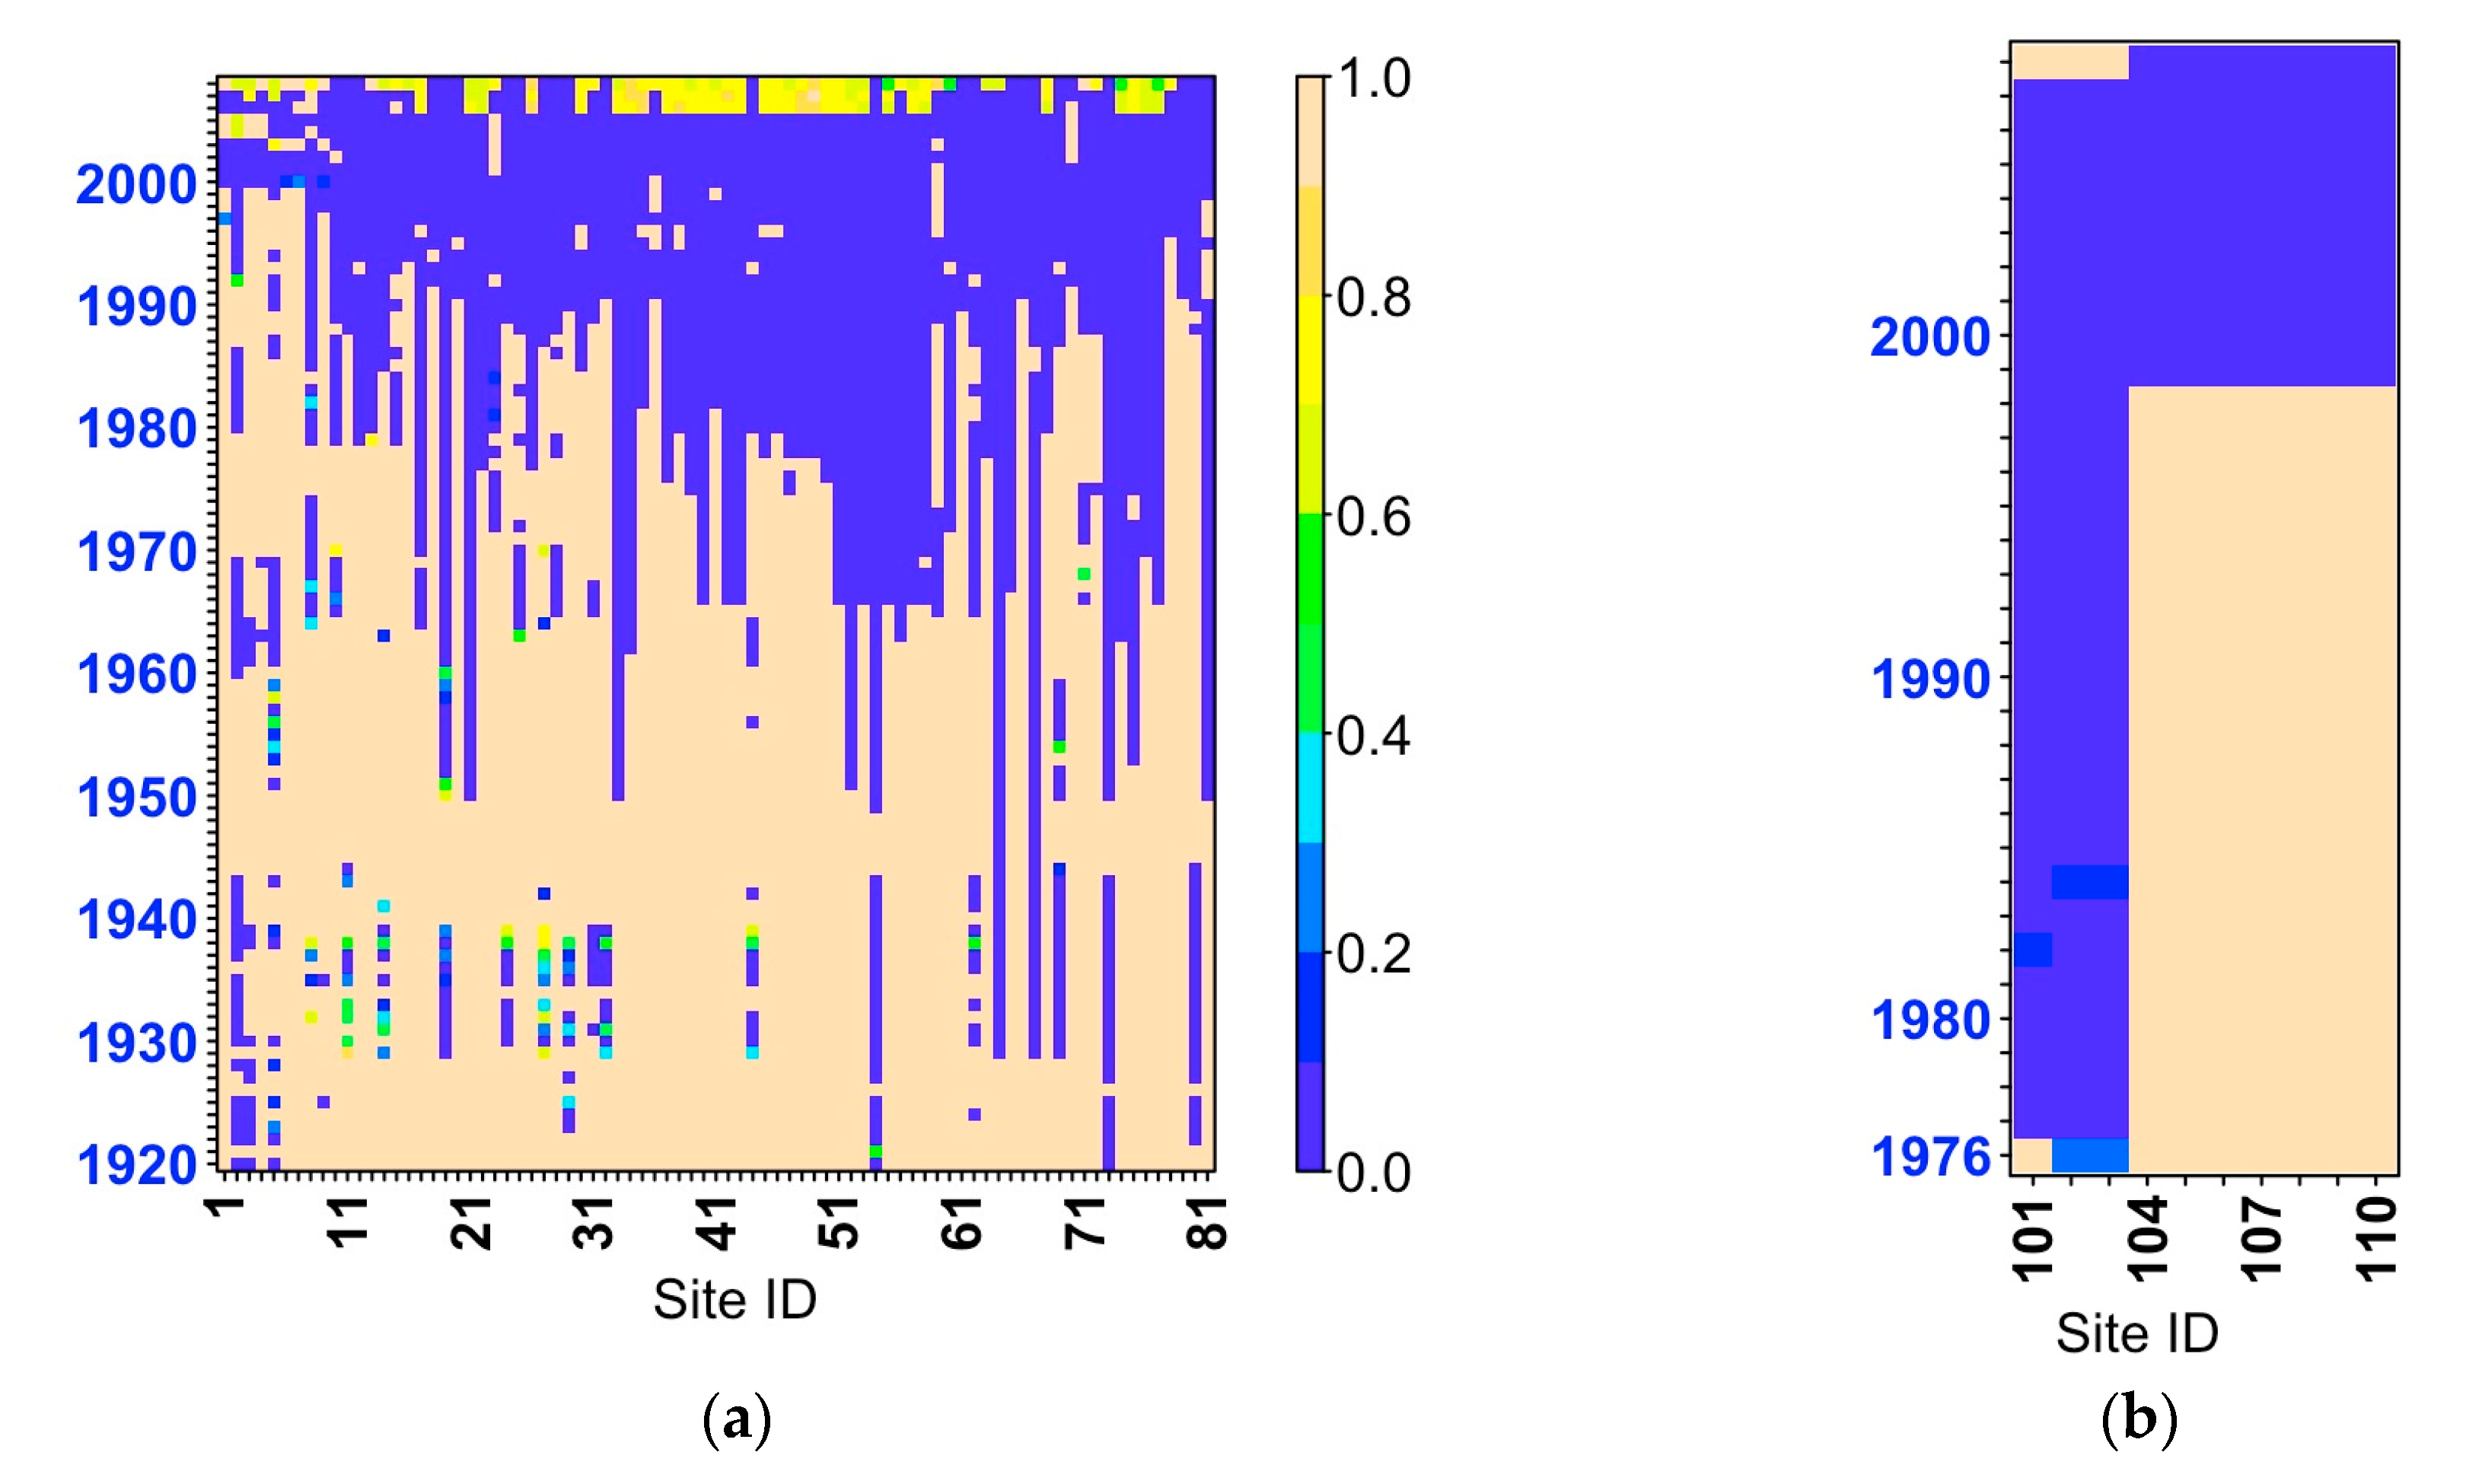
2.3. In-Situ Data
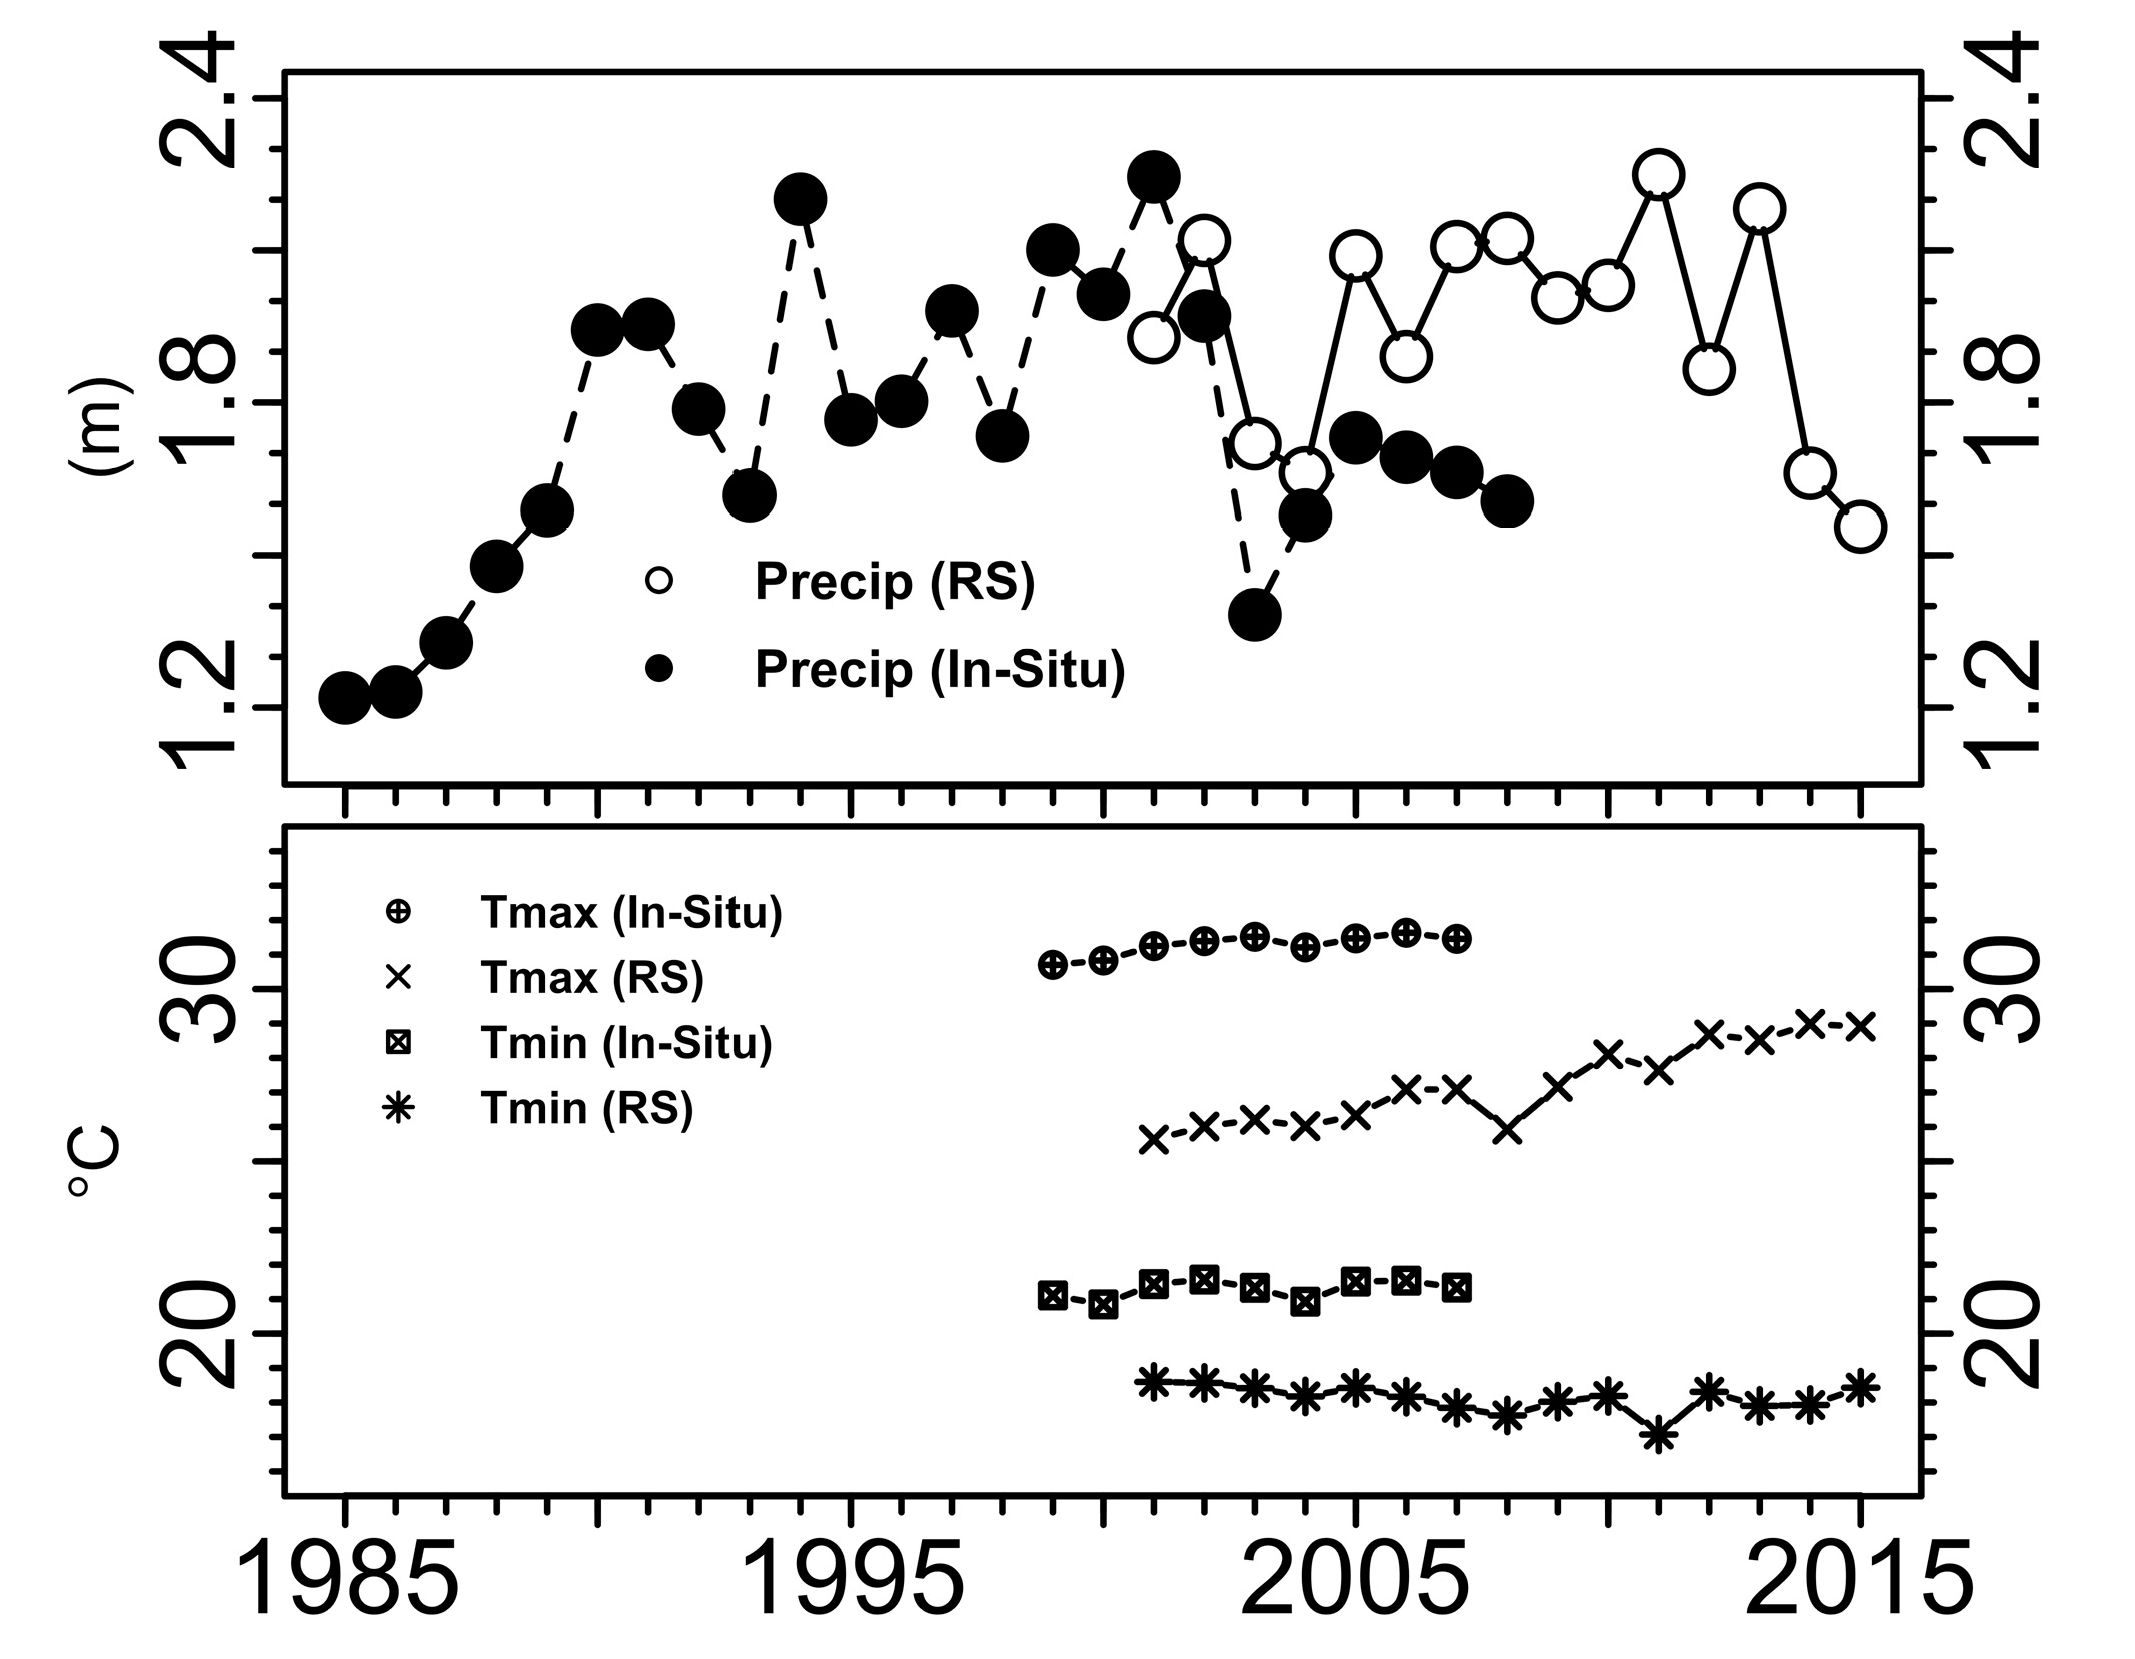
2.4. Meteorological Data
2.5. Hydrological Model—SWAT
3. Results and Discussion
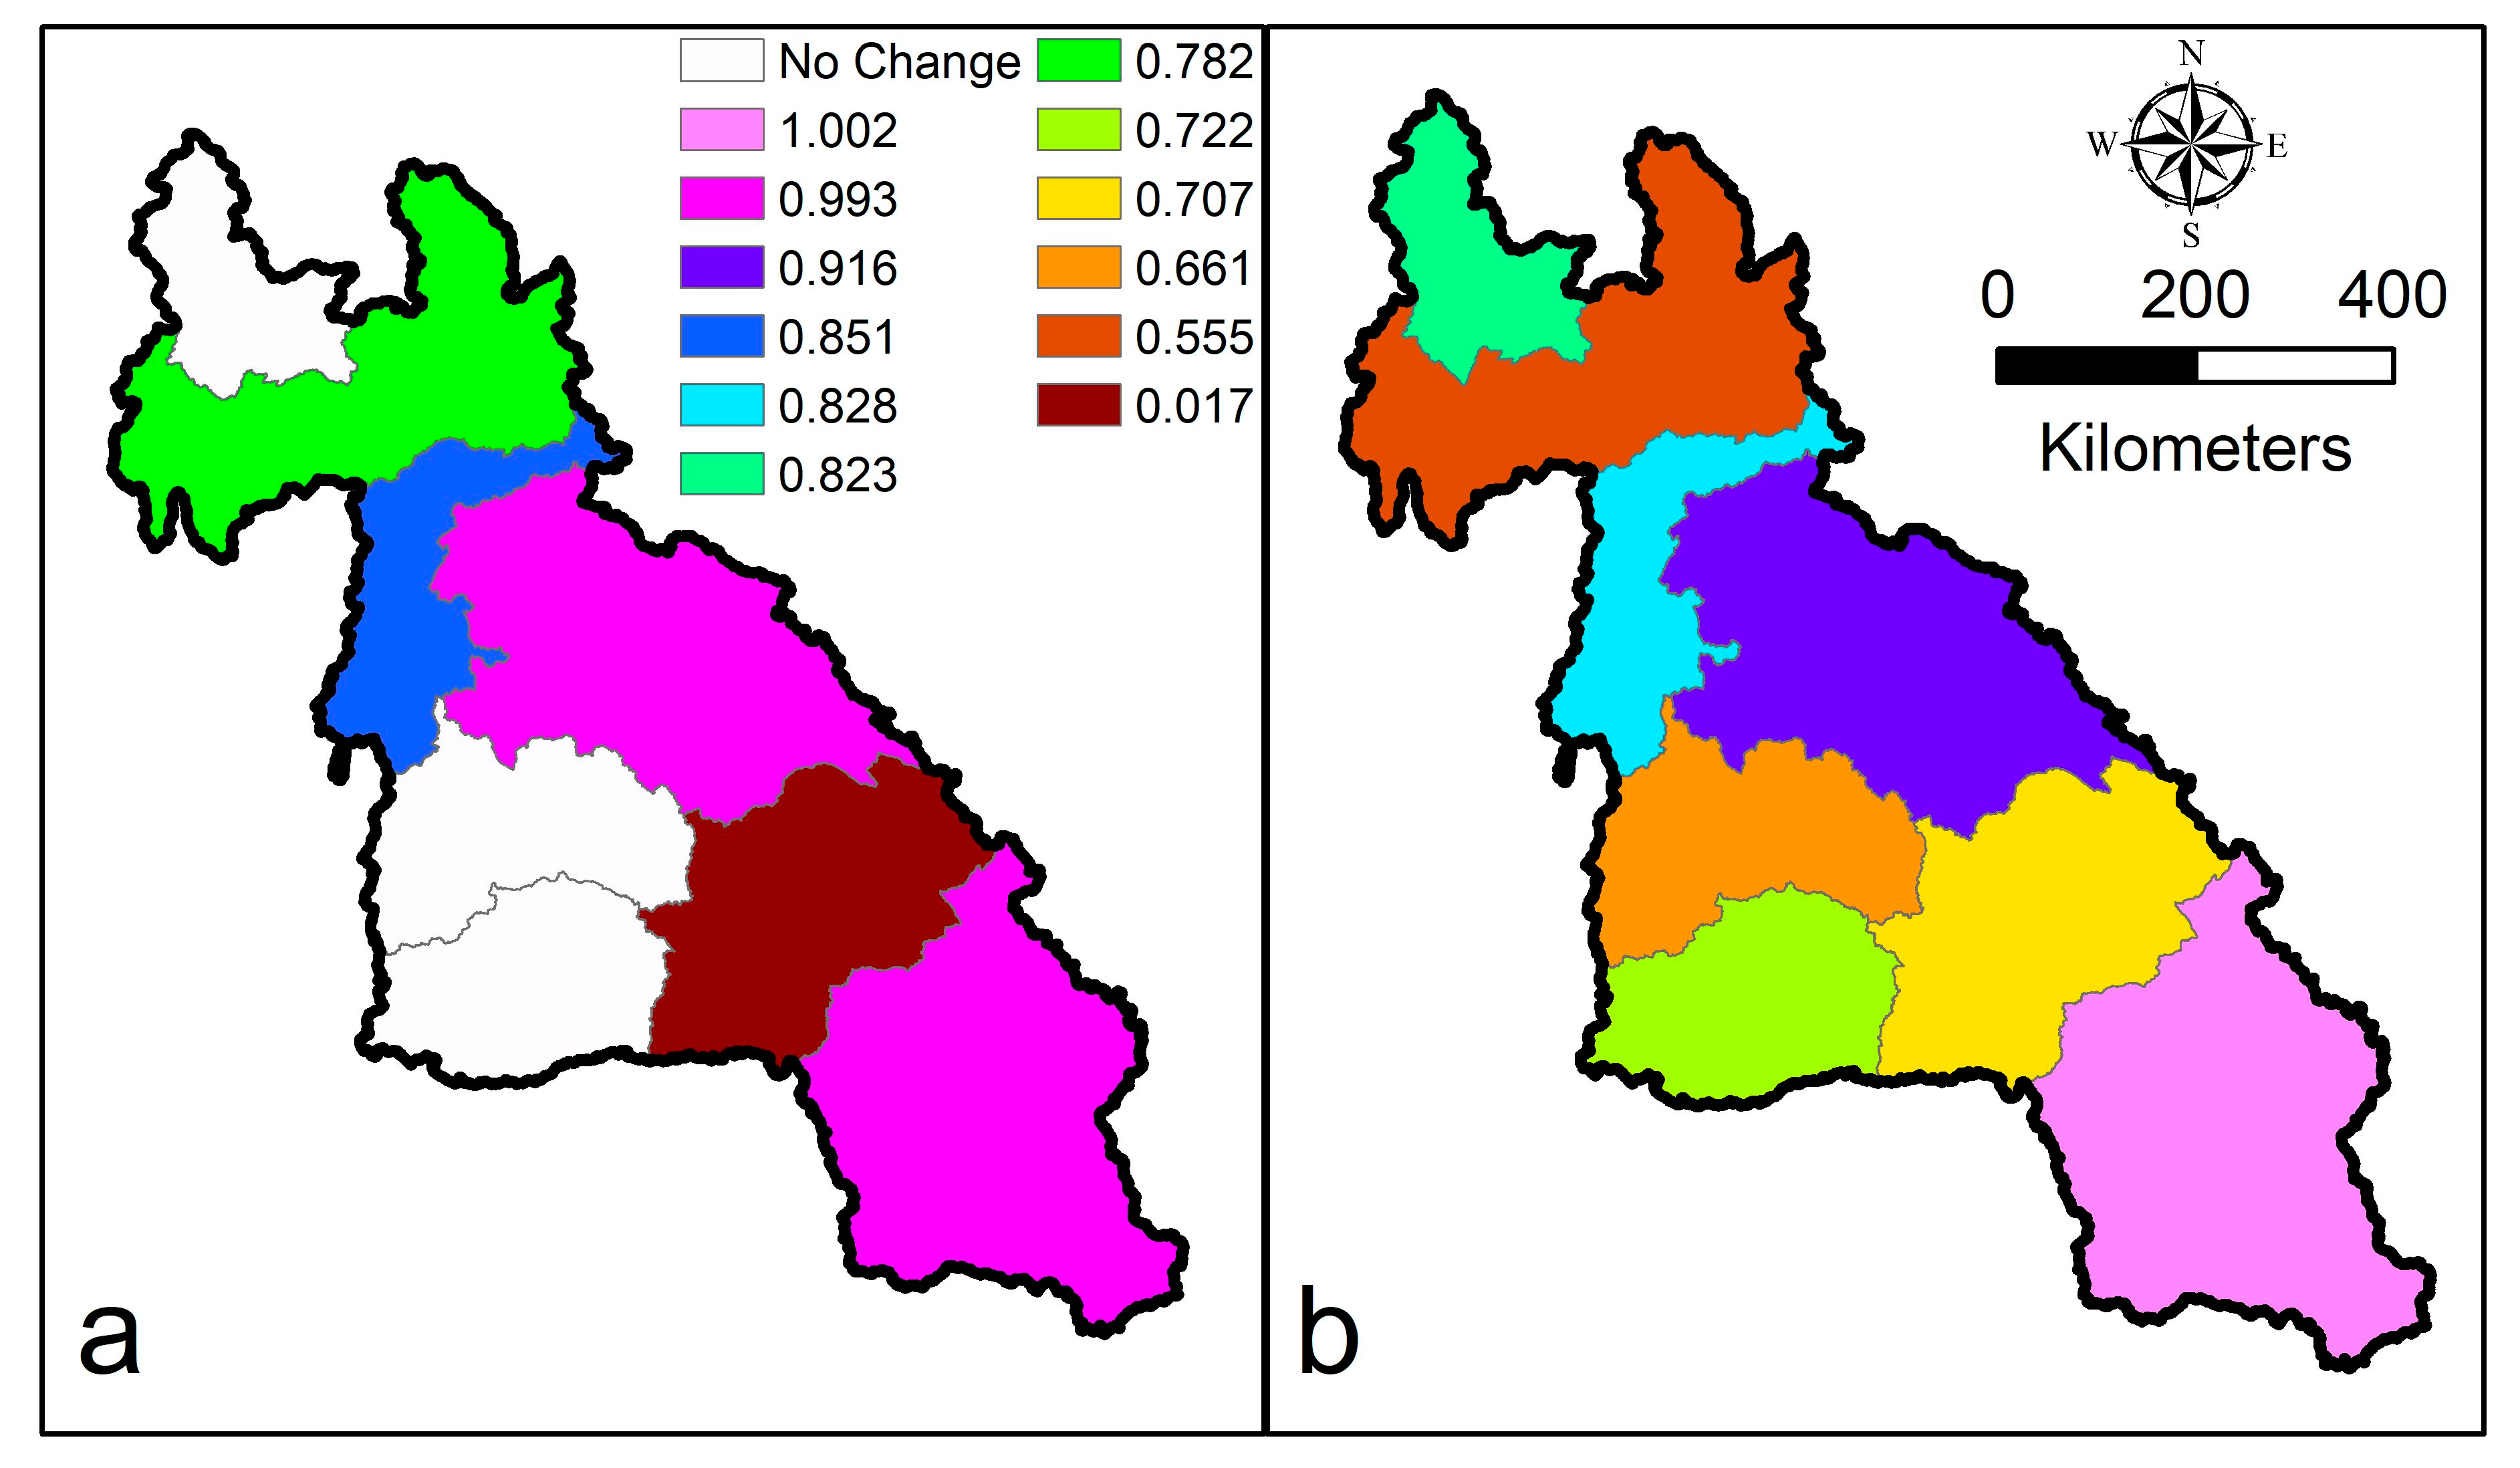
3.1. LMRB Water Balance
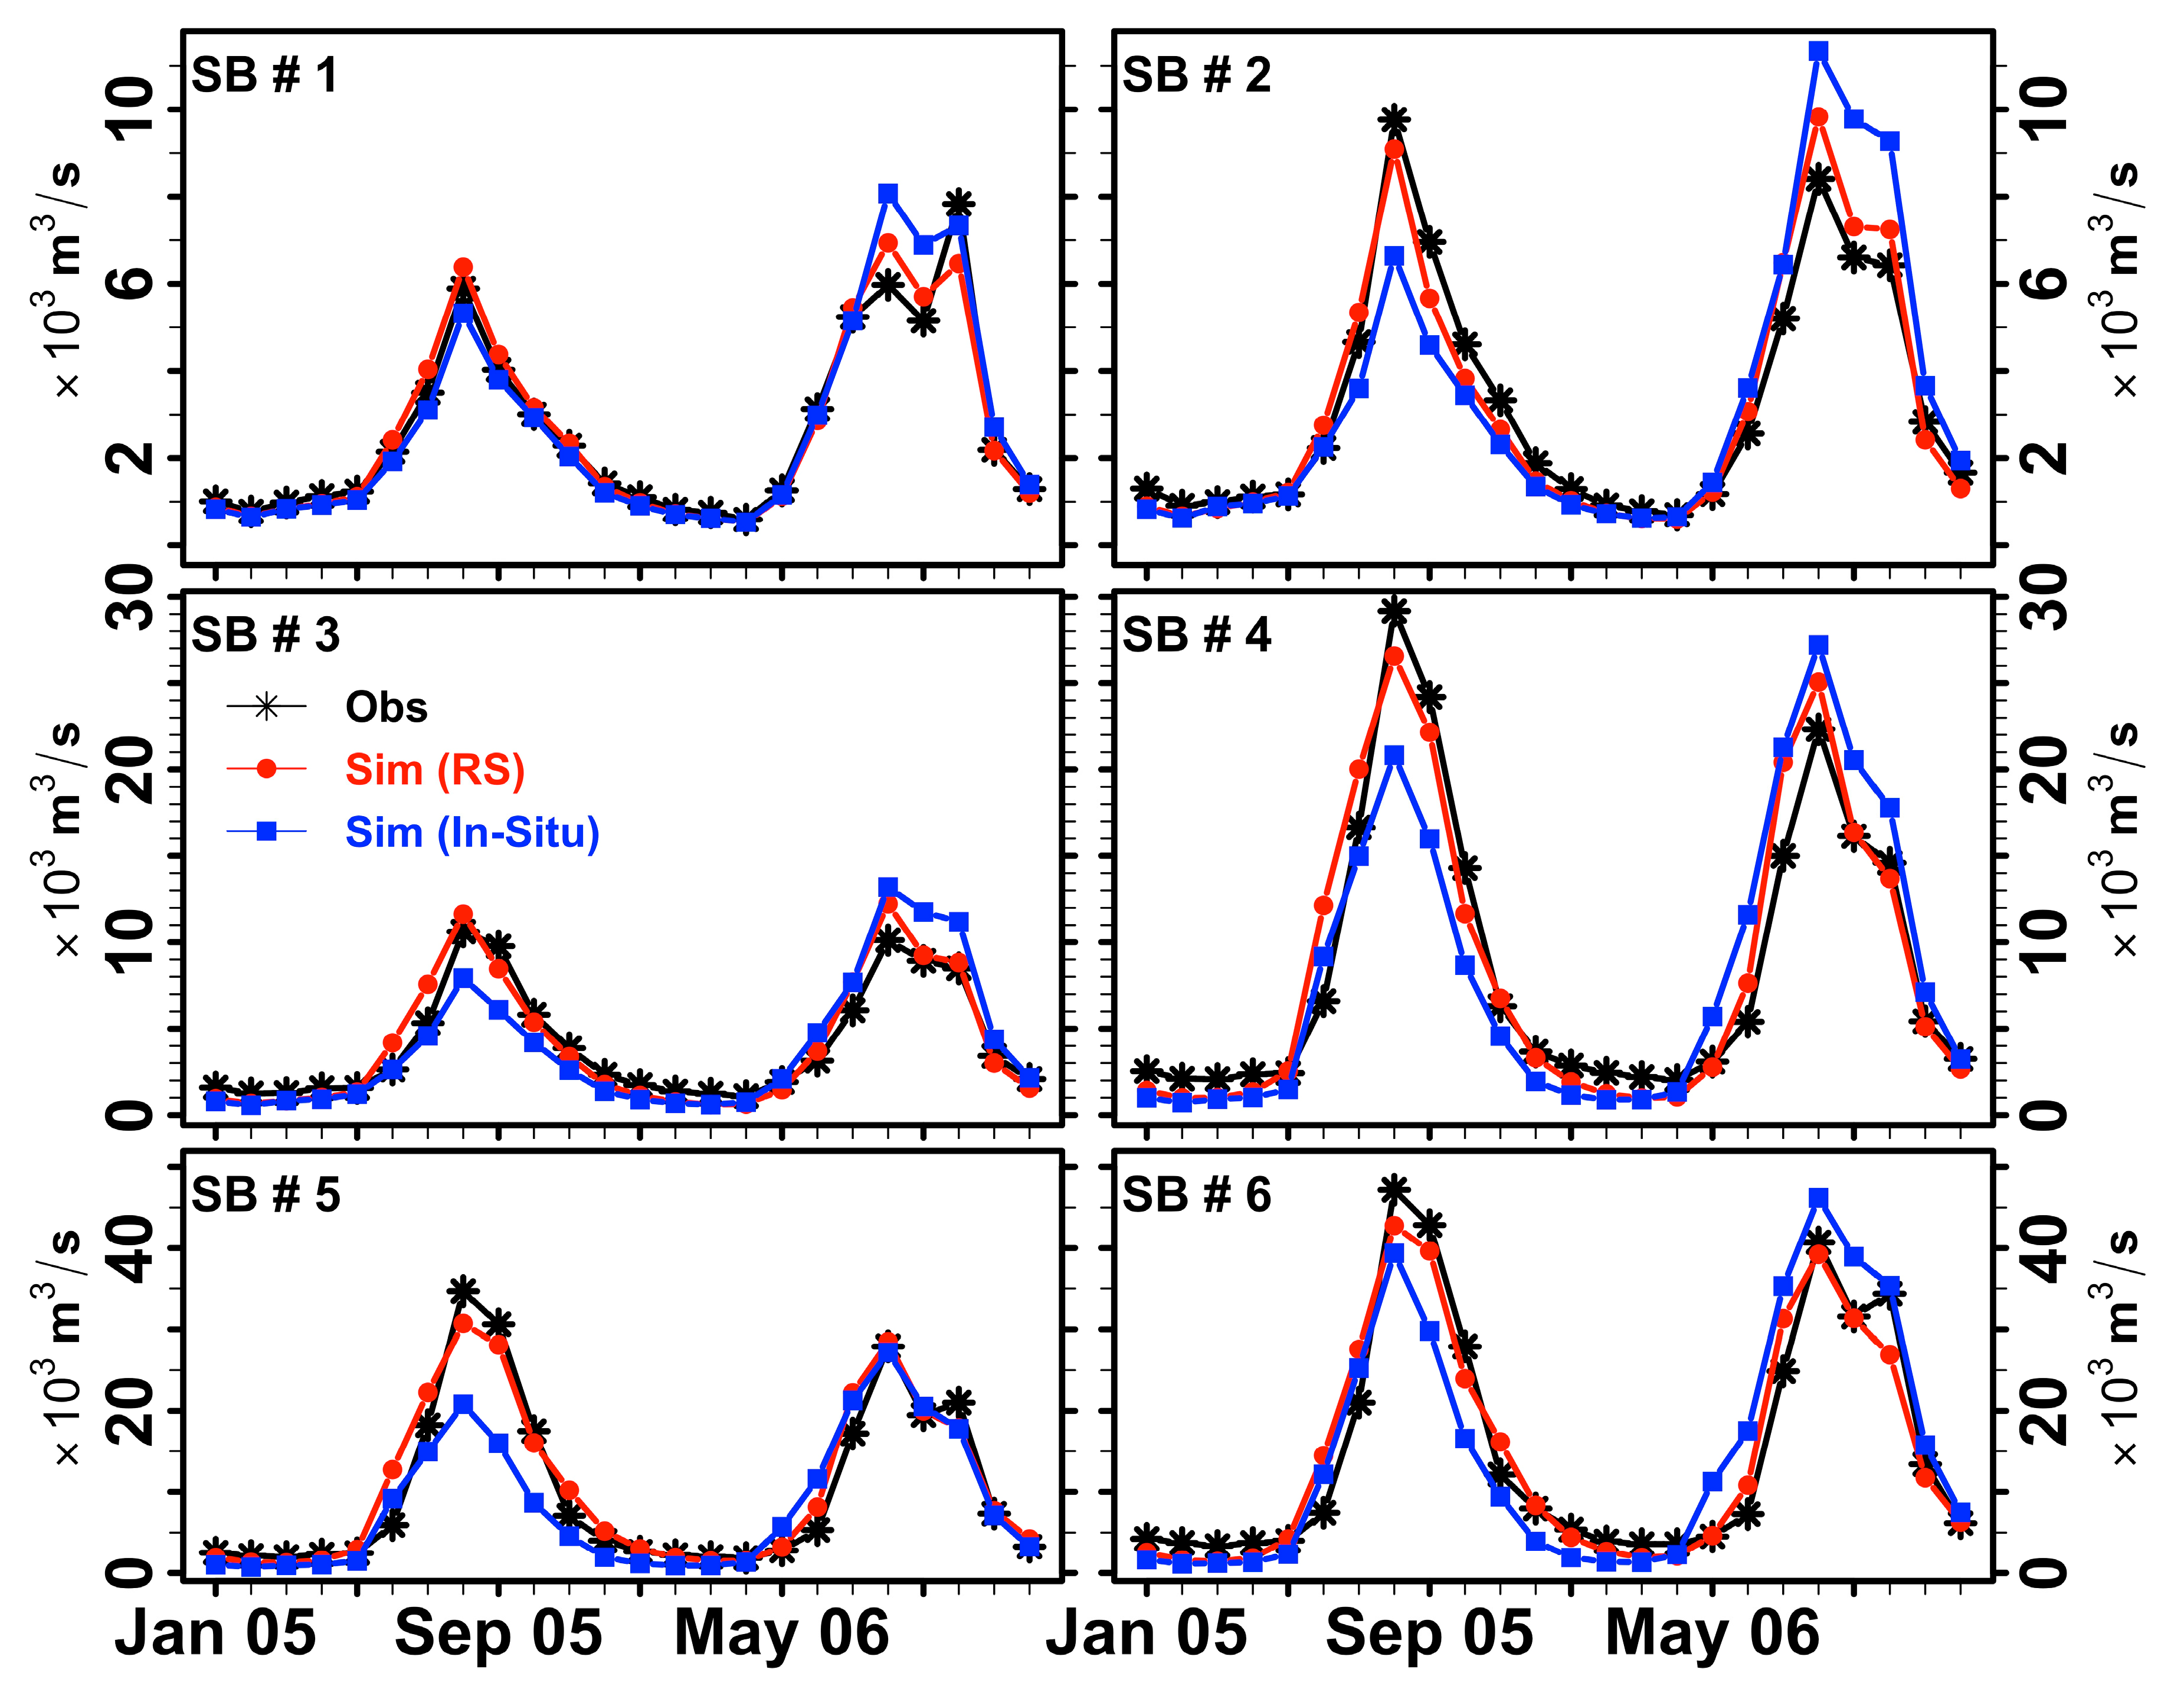
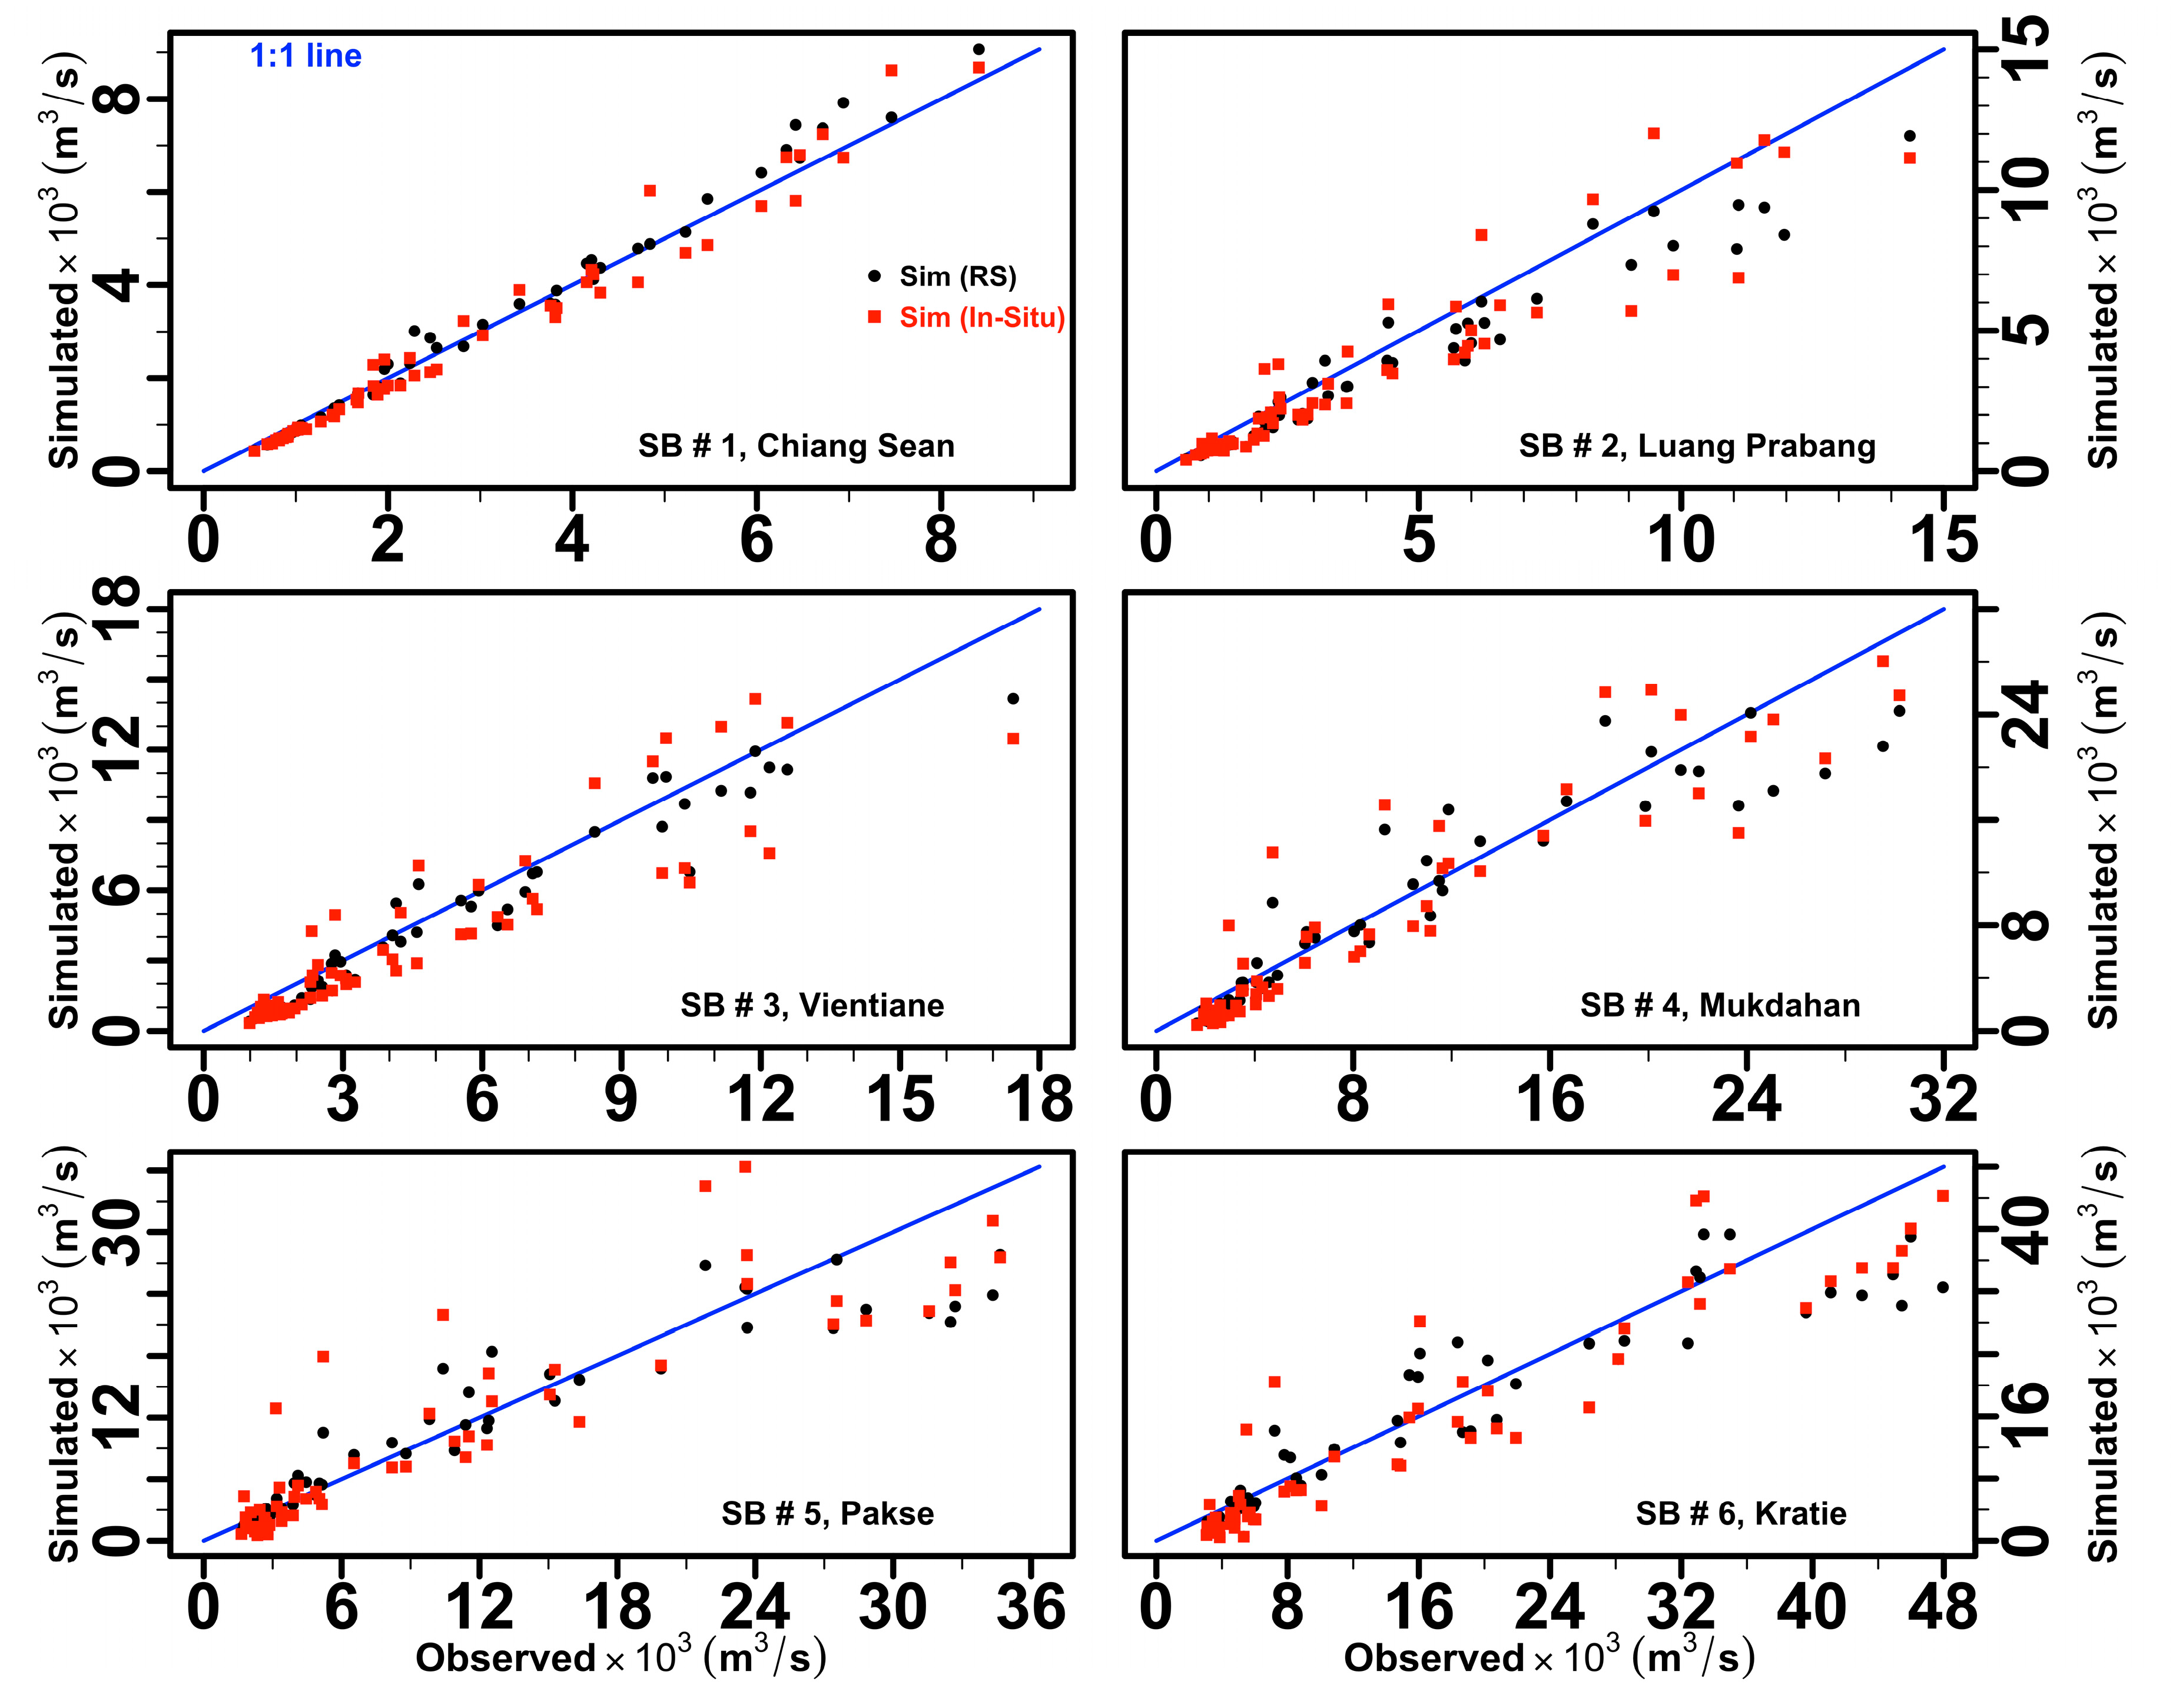
3.2. Calibration and Verification of the LMRB Model Using TRMM
3.3. Verification of the LMRB Model Using GPM
3.4. Nasaaccess Tool
- (i)
- Access the NASA Goddard Space Flight Center (GSFC) servers to download earth observation data,
- (ii)
- Clip needed grids based on a user study watershed input shapefile,
- (iii)
- Handle temporal and spatial issues (e.g., the GLDAS product has 3-h temporal resolution),
- (iv)
- Generate daily climate gridded data files and definition files compatible with SWAT/other models.
4. Conclusions and Recommendations
Supplementary Materials
Author Contributions
Funding
Acknowledgments
Conflicts of Interest
References
- Vörösmarty, C.J.; McIntyre, P.B.; Gessner, M.O.; Dudgeon, D.; Prusevich, A.; Green, P.; Glidden, S.; Bunn, S.E.; Sullivan, C.A.; Liermann, C.R.; et al. Global threats to human water security and river biodiversity. Nature 2010, 467, 555–561. [Google Scholar] [CrossRef] [PubMed] [Green Version]
- Ziv, G.; Baran, E.; Nam, S.; Rodríguez-Iturbe, I.; Levin, S.A. Trading-off fish biodiversity, food security, and hydropower in the Mekong River Basin. Proc. Natl. Acad. Sci. USA 2012, 109, 5609–5614. [Google Scholar] [CrossRef] [PubMed] [Green Version]
- Zhang, B.; Zhang, L.; Guo, H.; Leinenkugel, P.; Zhou, Y.; Li, L.; Shen, Q. Drought impact on vegetation productivity in the Lower Mekong Basin. Int. J. Remote Sens. 2014, 35, 2835–2856. [Google Scholar] [CrossRef]
- Veilleux, J.C.; Anderson, E.P. 2015 Snapshot of water security in the Nile, Mekong, and Amazon River Basins. Limnol. Oceanogr.-Bull. 2016, 25, 8–14. [Google Scholar] [CrossRef]
- Winemiller, K.O.; McIntyre, P.B.; Castello, L.; Fluet-Chouinard, E.; Giarrizzo, T.; Nam, S.; Baird, I.G.; Darwall, W.; Lujan, N.K.; Harrison, I.; et al. Balancing hydropower and biodiversity in the Amazon, Congo, and Mekong. Science 2016, 351, 128–129. [Google Scholar] [CrossRef] [PubMed] [Green Version]
- Mekong River Commission. Transboundary Water Resources Management Issues in the Mekong Delta of Cambodia and Vietnam; Mekong River Commission Secretariat: Vientiane, Laos, 2017; p. 22. [Google Scholar]
- Sivapalan, M.; Blöschl, G. The Growth of Hydrological Understanding: Technologies, Ideas, and Societal Needs Shape the Field. Water Resour. Res. 2017, 53, 8137–8146. [Google Scholar] [CrossRef] [Green Version]
- Piman, T.; Lennaerts, T.; Southalack, P. Assessment of hydrological changes in the Lower Mekong Basin from Basin-Wide development scenarios. Hydrol. Process. 2013, 27, 2115–2125. [Google Scholar] [CrossRef]
- Piman, T.; Cochrane, T.A.; Arias, M.E. Effect of Proposed Large Dams on Water Flows and Hydropower Production in the Sekong, Sesan and Srepok Rivers of the Mekong Basin. River Res. Appl. 2016, 32, 2095–2108. [Google Scholar] [CrossRef]
- Lyon, S.W.; King, K.; Polpanich, O.-U.; Lacombe, G. Assessing hydrologic changes across the Lower Mekong Basin. J. Hydrol. Reg. Stud. 2017, 12, 303–314. [Google Scholar] [CrossRef]
- Li, D.; Long, D.; Zhao, J.; Lu, H.; Hong, Y. Observed changes in flow regimes in the Mekong River Basin. J. Hydrol. 2017, 551, 217–232. [Google Scholar] [CrossRef]
- Poff, N.L.; Olden, J.D. Can dams be designed for sustainability? Science 2017, 358, 1252–1253. [Google Scholar] [CrossRef] [PubMed]
- Sabo, J.L.; Ruhi, A.; Holtgrieve, G.W.; Elliott, V.; Arias, M.E.; Ngor, P.B.; Räsänen, T.A.; Nam, S. Designing river flows to improve food security futures in the Lower Mekong Basin. Science 2017, 358. [Google Scholar] [CrossRef] [PubMed]
- Rossi, C.G.; Srinivasan, R.; Jirayoot, K.; Duc, T.L.; Souvannabouth, P.; Binh, N.; Gassman, P.W. Hydrologic evaluation of the Lower Mekong River Basin with the soil and water assessment tool model. Int. Agric. Eng. J. 2009, 18, 1–13. [Google Scholar]
- FAO; IIASA; ISRIC; ISSCAS; JRC. Harmonized World Soil Database, HWSD (Version 1.21); FAO: Rome, Italy, 2012. [Google Scholar]
- Spruce, J.; Bolten, J.D.; Srinivasan, R. Developing land use land cover maps for the Lower Mekong Basin to aid SWAT hydrologic modeling. In Proceedings of the AGU 2017 Fall Meeting, New Orleans, LA, USA, 11–15 December 2017; Abstract H104-298677. AGU: New Orleans, LA, USA, 2017. [Google Scholar]
- WLE. Dataset on the Dams of the Irrawaddy, Mekong, Red and Salween River Basins; WLE: Vientiane, Laos, 2017. [Google Scholar]
- Rodell, M.; Houser, P.R.; Jambor, U.; Gottschalck, J.; Mitchell, K.; Meng, C.-J.; Arsenault, K.; Cosgrove, B.; Radakovich, J.; Bosilovich, M.; et al. The global land data assimilation system. Bull. Am. Meteorol. Soc. 2004, 85, 381–394. [Google Scholar] [CrossRef]
- Arnold, J.G.; Srinivasan, R.; Muttiah, R.S.; Williams, J.R. Large area hydrologic modeling and assessment part I: Model development. J. Am. Water Resour. Assoc. 1998, 34, 73–89. [Google Scholar] [CrossRef]
- Srinivasan, R.; Ramanarayanan, T.S.; Arnold, J.G.; Bednarz, S.T. Large area hydrologic modeling and assessment part II: Model application. J. Am. Water Resour. Assoc. 1998, 34, 91–101. [Google Scholar] [CrossRef]
- Arnold, J.G.; Fohrer, N. SWAT2000: Current capabilities and research opportunities in applied watershed modelling. Hydrol. Process. 2005, 19, 563–572. [Google Scholar] [CrossRef]
- Gassman, P.W.; Reyes, M.R.; Green, C.H.; Arnold, J.G. The soil and water assessment tool: Historical development, applications, and future research directions. Trans. ASABE 2007, 50, 1211–1250. [Google Scholar] [CrossRef]
- Douglas-Mankin, K.R.; Srinivasan, R.; Arnold, J.G. Soil and Water Assessment Tool (SWAT) model: Current developments and applications. Trans. ASABE 2010, 53, 1423–1431. [Google Scholar] [CrossRef]
- Arnold, J.G.; Moriasi, D.N.; Gassman, P.W.; Abbaspour, K.C.; White, M.J.; Srinivasan, R.; Santhi, C.; Harmel, R.D.; Griensven, A.V.; Liew, M.W.V.; et al. SWAT: Model use, calibration, and validation. Trans. ASABE 2012, 55, 1491–1508. [Google Scholar] [CrossRef]
- Daggupati, P.; Yen, H.; White, M.J.; Srinivasan, R.; Arnold, J.G.; Keitzer, C.S.; Sowa, S.P. Impact of model development, calibration and validation decisions on hydrological simulations in West Lake Erie Basin. Hydrol. Process. 2015, 29, 5307–5320. [Google Scholar] [CrossRef]
- Srinivasan, R.; Arnold, J.G.; Jones, C.A. Hydrologic modelling of the United States with the soil and water assessment tool. Int. J. Water Resour. Dev. 1998, 14, 315–325. [Google Scholar] [CrossRef]
- Abbaspour, K.C.; Rouholahnejad, E.; Vaghefi, S.; Srinivasan, R.; Yang, H.; Kløve, B. A continental-scale hydrology and water quality model for Europe: Calibration and uncertainty of a high-resolution large-scale SWAT model. J. Hydrol. 2015, 524, 733–752. [Google Scholar] [CrossRef]
- Arnold, J.G.; Kiniry, J.R.; Srinivasan, R.; Williams, J.R.; Haney, E.B.; Neitsch, S.L. SWAT 2012 Input/Output Documentation; TR-439; Texas Water Resources Institute: College Station, TX, USA, 2013; p. 654. [Google Scholar]
- Abbaspour, K.C.; Yang, J.; Maximov, I.; Siber, R.; Bogner, K.; Mieleitner, J.; Zobrist, J.; Srinivasan, R. Modelling hydrology and water quality in the pre-alpine/alpine Thur watershed using SWAT. J. Hydrol. 2007, 333, 413–430. [Google Scholar] [CrossRef]
- Hurst, H.E. Long-term storage capacity of reservoirs. Trans. Am. Soc. Civ. Eng. 1951, 116, 770–808. [Google Scholar]
- Weron, R. Estimating long-range dependence: Finite sample properties and confidence intervals. Physica A 2002, 312, 285–299. [Google Scholar] [CrossRef]
- Lacombe, G.; Douangsavanh, S.; Vogel, R.M.; McCartney, M.; Chemin, Y.; Rebelo, L.-M.; Sotoukee, T. Multivariate power-law models for streamflow prediction in the Mekong Basin. J. Hydrol. Reg. Stud. 2014, 2, 35–48. [Google Scholar] [CrossRef]
- Neitsch, S.L.; Arnold, J.G.; Kiniry, J.R.; Williams, J.R.; King, K.W. Soil and Water Assessment Tool Theoretical Documentation Version 2000; TR-191; Texas Water Resources Institute: College Station, TX, USA, 2002; p. 458. [Google Scholar]
- R Development Core Team. R: A Language and Environment for Statistical Computing, 3.4.4; R Foundation for Statistical Computing: Vienna, Austria, 2018. [Google Scholar]


| Station Name | Code | Country | LMRB | Start Date | End Date | A | Qmin | Q1 | Q2 | Q3 | Qmax | μ | σ | CV | 𝛾 | H |
|---|---|---|---|---|---|---|---|---|---|---|---|---|---|---|---|---|
| Chinese border | 010000 | CN | Upper basin inlet | 1-Jan-1985 | 31-Dec-2007 | — | 1619 | 2010 | 2157 | 2459 | 2763 | 2221 | 303 | 0.14 | 0.03 | 0.35 |
| Chiang Sean | 010501 | TH | Sub-basin 1 outlet | 1-Jan-1960 | 31-Dec-2016 | 191,055 | 1871 | 2304 | 2564 | 2929 | 4027 | 2618 | 427 | 0.16 | 0.60 | 0.72 |
| Luang Prabang | 011201 | LA | Sub-basin 2 outlet | 1-Jan-1939 | 31-Dec-2016 | 273,838 | 1852 | 3410 | 3754 | 4177 | 5488 | 3777 | 707 | 0.19 | −0.12 | 0.70 |
| Vientiane | 011901 | LA | Sub-basin 3 outlet | 1-Jan-1913 | 31-Dec-2016 | 303,528 | 2677 | 3975 | 4455 | 4900 | 6111 | 4476 | 710 | 0.16 | 0.10 | 0.67 |
| Mukdahan | 013402 | TH | Sub-basin 4 outlet | 1-Jan-1923 | 31-Dec-2016 | 394,134 | 5256 | 7246 | 8031 | 9012 | 10,496 | 8071 | 1168 | 0.14 | −0.02 | 0.89 |
| Pakse | 013901 | LA | Sub-basin 5 outlet | 1-Jan-1923 | 31-Dec-2016 | 550,955 | 6835 | 9095 | 10,050 | 11,165 | 12,918 | 10,066 | 1434 | 0.14 | −0.08 | 0.68 |
| Kratie | 014901 | KH | Sub-basin 6 outlet | 1-Jan-1924 | 31-Dec-2016 | 656,518 | 6599 | 11,891 | 13,527 | 15,077 | 19,562 | 13,411 | 2591 | 0.19 | −0.41 | 0.77 |
| Yasothom | 370104 | TH | Sub-basin 7 outlet | 1-Jan-1952 | 31-Dec-2003 | 46,805 | 77 | 171 | 240 | 287 | 602 | 242 | 102 | 0.42 | 1.21 | 0.60 |
| Rasi Salai | 380134 | TH | Sub-basin 8 outlet | 1-Jan-1979 | 31-Dec-2003 | 43,878 | 5 | 95 | 154 | 223 | 447 | 177 | 107 | 0.60 | 0.79 | 0.94 |
| Parameter | Description | Range | Identifier Code | Calibrated Value | Calibrated Value | |
|---|---|---|---|---|---|---|
| Remote Sensing Data | In-Situ Data | |||||
| Precipitation | ||||||
| PRECIPITATION | Correction factor to grid precipitation record | −1, +0.01 | R | −0.445 to +0.002 | −0.983 to −0.007 | |
| High Flow | ||||||
| CN2 | Initial SCS runoff curve number to moisture condition II | −0.1, +0.1 | R | −0.07 | −0.0315 | |
| AWC | Available water capacity of the soil layer | −0.1, +0.1 | R | +0.07 | +0.0525 | |
| ESCO | Soil evaporation compensation factor | +0.5, +0.9 | V | +0.6 | +0.75 | |
| Base Flow | ||||||
| GWHT | Initial groundwater height | 0, +1.0 | V | +0.075 | +0.425 | |
| GW_DELAY | Groundwater delay time | −30, +60 | A | −14.25 | −14.25 | |
| GWQMN | Threshold depth of water in the shallow aquifer | −1000, +1000 | A | −450 | −250 | |
| REVAPMN | Percolation to the deep aquifer to occur | −750, +750 | A | +262.5 | +337.5 | |
| GW_REVAP | Groundwater “revap” coefficient | +0.02, +0.10 | V | +0.042 | +0.098 | |
| RCHRG_DP | Deep aquifer percolation fraction | −0.05, +0.05 | A | +0.0375 | −0.0225 |
| SUB-BASIN | Qerr (%) | NSE | ||
|---|---|---|---|---|
| RS | In-Situ | RS | In-Situ | |
| SB1 | 0.81 | 0.53 | 0.96 | 0.91 |
| SB2 | −0.29 | 2.02 | 0.94 | 0.70 |
| SB3 | 0.88 | −3.31 | 0.91 | 0.75 |
| SB4 | 0.79 | −3.41 | 0.93 | 0.78 |
| SB5 | 4.76 | 5.74 | 0.94 | 0.68 |
| SB6 | −1.90 | −1.64 | 0.94 | 0.83 |
| Sub-Basin | NSE | |
|---|---|---|
| RS | In-Situ | |
| SB1 | 0.98 | 0.97 |
| SB2 | 0.91 | 0.83 |
| SB3 | 0.94 | 0.79 |
| SB4 | 0.90 | 0.83 |
| SB5 | 0.89 | 0.75 |
| SB6 | 0.88 | 0.84 |
© 2018 by the authors. Licensee MDPI, Basel, Switzerland. This article is an open access article distributed under the terms and conditions of the Creative Commons Attribution (CC BY) license (http://creativecommons.org/licenses/by/4.0/).
Share and Cite
Mohammed, I.N.; Bolten, J.D.; Srinivasan, R.; Lakshmi, V. Improved Hydrological Decision Support System for the Lower Mekong River Basin Using Satellite-Based Earth Observations. Remote Sens. 2018, 10, 885. https://doi.org/10.3390/rs10060885
Mohammed IN, Bolten JD, Srinivasan R, Lakshmi V. Improved Hydrological Decision Support System for the Lower Mekong River Basin Using Satellite-Based Earth Observations. Remote Sensing. 2018; 10(6):885. https://doi.org/10.3390/rs10060885
Chicago/Turabian StyleMohammed, Ibrahim Nourein, John D. Bolten, Raghavan Srinivasan, and Venkat Lakshmi. 2018. "Improved Hydrological Decision Support System for the Lower Mekong River Basin Using Satellite-Based Earth Observations" Remote Sensing 10, no. 6: 885. https://doi.org/10.3390/rs10060885